smash repair submission - productivity commission · the objective of the project was to move the...
TRANSCRIPT

��������� � � ������ �������������������
The UK smash repair industry -structures, relationships and implications
January 2005

��������� � � ������ �������������������
Contents
• Introduction• Structures• Economics• Relationships• Conclusions and implications

��������� � � ������ �������������������
The objective of the project was to move the UK smash repair industry from adversarial to win-win
• The UK body repair sector displays many of the problems evident in Australia:
– Conflictual relations between repairers and insurers– Price pressure put on repairers by insurers– Inadequate returns
• We were trying to establish– The causes– The possible cures– Who should effect them
• Our aim was to produce gains for all involved
Introduction ...

��������� � � ������ �������������������
Structures
• Repair volumes• Smash repairers• Insurers• Parts• Paint

��������� � � ������ �������������������
Repair volumes are growing only very slowly. 1.3% p.a. projected for 2001-2006
Industry structure ... repair volumes
Repair incidence, 1990-2006
0
1,000
2,000
3,000
4,000
5,000
6,000
7,000
1990
1992
1994
1996
1998
2000
2002
2004
2006
0%
5%
10%
15%
20%
25%
30%
Repair Rate Parc '0000 No. of Repairs '000
Source: mfbi

��������� � � ������ �������������������
There has been a dramatic shift in the structure of the smash repair sector
• In four years the total repairer population dropped by 27% with small repairers declining by 40%
• The number of large repairers has increased as the economics of being a medium sized player have become increasingly less viable
• This could ultimately lead to a polarisation of the market between small and very large
Change in Bodyshop Population by Size 1997 -2000
-40.7%
-15.6%
-0.9%
64.0%
-27.1%
0 - 4 4-8 8-12 12+ Total
Number of Productives
%
Bodyshop population by number of productives 1997 -2000
0
2000
4000
6000
8000
10000
12000
14000
2000 1999 1998 1997
nu
mb
er
0 - 4 4-8 8-12 12+
Industry structure ... smash repairers

��������� � � ������ �������������������
The repairer population is projected to continue falling ...
Number of bodyshops, 1990-2006
0
500
1,000
1,500
2,000
2,500
3,000
3,500
4,000
4,500
5,000
1990 1991 1992 1993 1994 1995 1996 1997 1998 1999 2000 2001 2002 2003 2004 2005 2006
Small Medium Large
Data source: mfbi
Industry structure ... smash repairers
��������� � � ������ �������������������
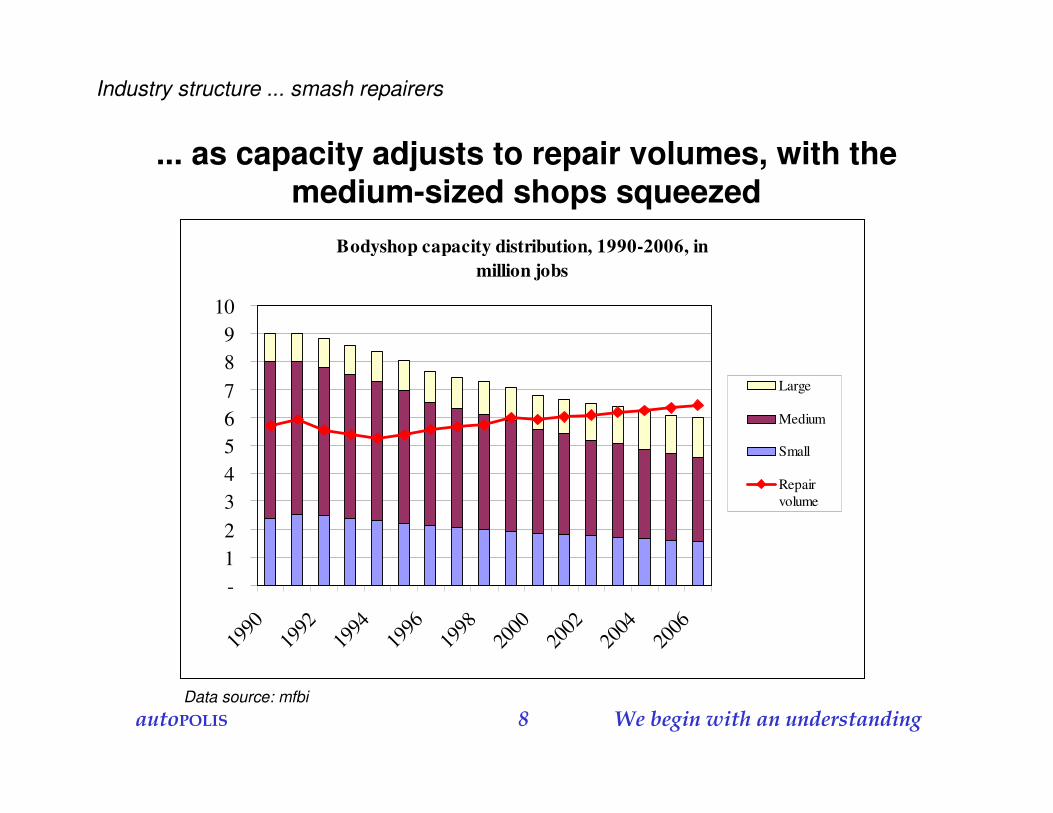
... as capacity adjusts to repair volumes, with the medium-sized shops squeezed
Bodyshop capacity distribution, 1990-2006, in million jobs
-123456789
10
1990
1992
1994
1996
1998
2000
2002
2004
2006
Large
Medium
Small
Repairvolume
Data source: mfbi
Industry structure ... smash repairers
��������� � � ������ �������������������
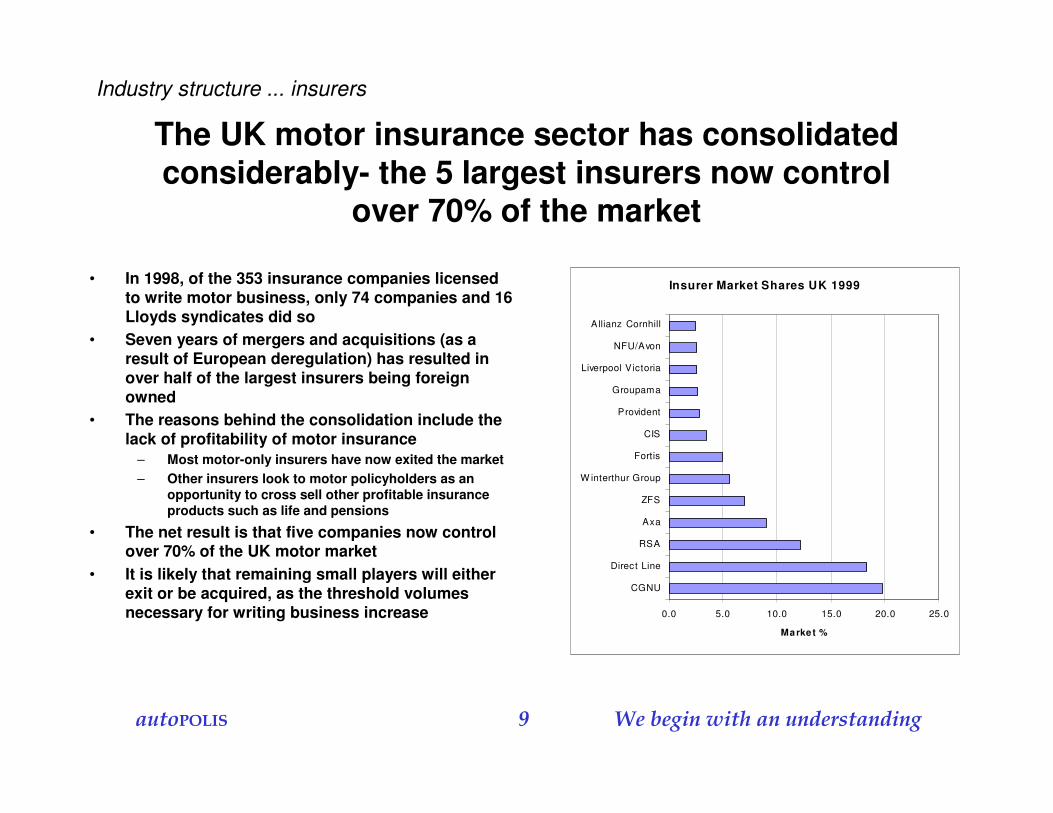
The UK motor insurance sector has consolidated considerably- the 5 largest insurers now control
over 70% of the market
• In 1998, of the 353 insurance companies licensed to write motor business, only 74 companies and 16 Lloyds syndicates did so
• Seven years of mergers and acquisitions (as a result of European deregulation) has resulted in over half of the largest insurers being foreign owned
• The reasons behind the consolidation include the lack of profitability of motor insurance
– Most motor-only insurers have now exited the market– Other insurers look to motor policyholders as an
opportunity to cross sell other profitable insurance products such as life and pensions
• The net result is that five companies now control over 70% of the UK motor market
• It is likely that remaining small players will either exit or be acquired, as the threshold volumes necessary for writing business increase
Insurer Market Shares UK 1999
0.0 5.0 10.0 15.0 20.0 25.0
CGNU
Direct Line
RSA
Axa
ZFS
W interthur Group
Fortis
CIS
Provident
Groupama
Liverpool Victoria
NFU/Avon
Allianz Cornhill
Marke t %
Industry structure ... insurers

��������� �� � ������ �������������������
Franchised dealers capture almost 80% of the headlamp aftermarket and 60% of the independent
bodyshop aftermarket in the UKAM 2.7 million units
VM stores
Dealerstores
National, regionaland local factors
OES IAM
Carrossiers concessAteliers
concess + agents
Dealer bodyshopsDealer andsub-dealerworkshops
Independentbodyshops IRGs Others
2.1 0.678% 22%
0.311% 0.2
7%
0.14%
1.141%
1.037%
1.348%
0.27%
0.14%
1.141% 1,6
59%
Industry structure ... parts

��������� �� � ������ �������������������
Paint Brand Usage by Bodyshops 1997 to 2000
0%
10%
20%
30%
40%
50%
60%
70%
80%
90%
100%
2000 1999 1998 1997
% U
sing
Other paint companiestotalStandox
Spies Hecker
RM
PPG
ICI Autocolor
Glasurit
Dupont
Akzo Nobel
Automotive refinish paint is a concentrated industry
Implied Market Shares of Paint Companies
0%
5%
10%
15%
20%
25%
30%
2000 1999 1998 1997
Akzo Nobel
Dupont
Glasurit
ICI Autocolor
PPG
RM
Spies Hecker
Standox
Other paintcompanies total
Industry structure ... paint
Source:Bodyshop 2001 Industry Survey
��������� �� � ������ �������������������
Economics
• Smash repairers• Insurers• Parts• Paint

��������� �� � ������ �������������������
There has been a steady cost-price squeeze on repairer labour in recent years
• In constant £, the total pay of productives has grown on trend
– By 1.9% per year within the M25
– With a sharp acceleration in the last 5 years
– By 1.4% per year nationally
• Repair shop managers’salaries rose by 0.2% per year
• Labour recovery rates fell by 0.7% per year
Source: Bodyshop Management Briefing No. 24
Industry economics ... smash repairers
Pay and recovery rates in £ (constant year 2000)
£5
£7
£9
£11
£13
£15
£17
£19
£21
£23
£25
19901991199219931994199519961997199819992000
Productives ' pay(£/hour) - national
Productives ' pay(£/hour) - M25
Managers' salaries(£000/year)
Labour recovery(£/hour)

��������� �� � ������ �������������������
The quality of service has improved considerably –at the expense of repairers
• Policyholders receive generally very good service: rapid response after accidents, vehicles collected and returned, quick estimates and agreements, courtesy cars, quality repairs
• Repairers have borne much of the financial burden
Industry economics ... smash repairers
Time Comparison (at 2000 prices)
1990% of net sales 2000
% of net sales
Margin Loss
Repairs 966 966Added Services 0 292Retail Value 966 1258Non- billed services 0 -292Discounts 0 -100Net sales 966 100% 866 100%Cost of goods sold (repairs) 596 596Gross Margin on Repair 370 38.1% 270 31.1% -7.1%Cost of added services 0 -214 24.7% -24.7%Operating profit (before Admin & O'heads) 370 38.1% 56 6.5%O'heads @ 14% of net sales -135 14% -121 12.5% -1.5%PBIT 177 18% -65 -8% 26.0%
Source: Body Magazine, Chris Oakham, autopolis calculations

��������� �� � ������ �������������������
In real terms, the total cost of labour has risen by 8.6% in 10 years, that of parts has fallen by 8%, and
that of paint and materials has risen by 63.5%
Cost elements in body repair
0
500
1,000
1,500
2,000
2,500
3,000
1990 1991 1992 1993 1994 1995 1996 1997 1998 1999 2000
Con
stan
t 200
0 £
mill
ion
LabourPartsPaint & materials
Industry economics ... smash repairers

��������� �� � ������ �������������������
A layered contribution analysis suggests the real profit shortfall is on parts - which are the
bodyshop’s largest cost elementSales Cost of sales Gross profit GP/Sales % Adjusted gross AGP/Sales % Overheads Net profit NP/Sales %
profit (prop to sales)
Labour 282201 99637 182564 64.7% 81367 28.8% 51582 29785 10.6%Parts 256621 208726 47895 18.7% 47895 18.7% 46906 989 0.4%Paint/materials 68903 49538 19365 28.1% 19365 28.1% 12594 6771 9.8%Sublet/sundry 23952 20455 3497 14.6% 3497 14.6% 4378 -881 -3.7%
Total 631677 378356 253321 40.1% 152124 24.1% 115460 36664 5.8%
• This analysis was for an “average bodyshop” in 1998, is of £631,677 total sales - 70% insurers, 13% accident managers, 4% fleets, 13% retail
• A conventional presentation is used to reach Net Profit: add up the 4 items of Gross Profit; subtract the Other Labour Expenses; then subtract the Direct Expenses/Overheads
• We reach Net Profit through a layered contribution analysis: putting Other Labour Expenses back with the Cost of Labour to reach an Adjusted Gross Profit; then allocating the Direct Expenses/Overheads proportionally to Sales
Source: Bodyshop Management Briefings No. 24
Industry economics ... smash repairers

��������� �� � ������ �������������������
There is evidence that small shops and the upper echelon of shops do better financially than the
industry average
Variations in financial performance, Q1, 2001
-10.0%
0.0%
10.0%
20.0%
30.0%
40.0%
50.0%
60.0%
70.0%
80.0%
Indep
ende
ntFran
chise
d
SmallM
edium
Large
MVRA
MVRA to
p 25%
Indus
try
Labour gross profit %
Labour net contribution/laboursalesParts gross profit %
Paint-mats gross profit %
Operating profit/total sales
Net operating profit
• The Top 25% do significantly better than all others on
– Labour gross profits, – Paints/materials
• The Top 25% and the small shops are both above average on
– Labour net contribution– Parts gross profits– Operating profits/sales– Net profits/sales (taking
out 8% for discounts)
• A very small group of bodyshops appears to be very healthily profitable
Source: MVRA survey of members
Industry economics ... smash repairers

��������� �� � ������ �������������������
There appears to be widespread resort to fraud, in order to sustain profits
• Financial modelling suggests that properly resourced repair shops of adequate size can make an adequate return – but only if they are not much dependent on PSRs and insurers’imposed labour rages
• Actual returns vary inexplicably
• The conclusion is that many achieve profitability only through fraud
PBIT/sales vs Size
-4%-2%0%2%4%6%8%
10%12%14%16%18%
0 1 2 3 4 5
Turnover £ m
PBIT
/Sal
es %
Source: company accounts
Industry economics ... smash repairers

��������� �� � ������ �������������������
Motor insurance is not a very attractive market for insurers, in its own right
• There is little customer loyalty to insurers– Motor insurance is a ‘negative’ and obligatory purchase– Only 16% -18% of customers annually experience the ‘benefit’ of having
insurance– Over 80% of customers (thankfully) do not ‘experience’ the service– They can only judge the experience at the front end - 50% of which is through
brokers rather than with the insurer directly– The customer churn rate for most insurers apparently exceeds 40% annually
• There is a permanent price/cost squeeze– Acquisition costs are high, and customers are apparently only profitable after
three to four years– The market is primarily price-driven, with pricing wars occurring on a five year
cycle– Insurers have markedly contained the costs of repair which are relatively stable,
whilst the costs for bodily injury claims are rising at 20% per annum, with fraud on whiplash injuries estimated at £200m p.a alone
Industry economics ... insurers
��������� �� � ������ �������������������
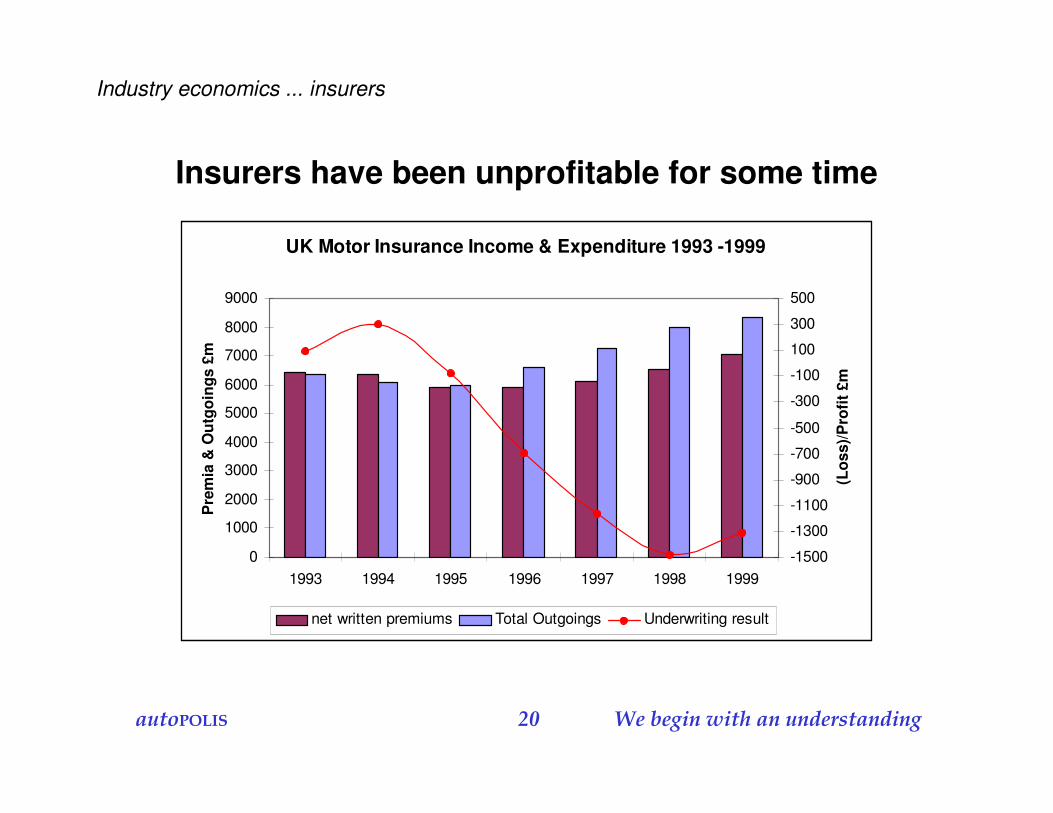
Insurers have been unprofitable for some time
UK Motor Insurance Income & Expenditure 1993 -1999
0
1000
2000
3000
4000
5000
6000
7000
8000
9000
1993 1994 1995 1996 1997 1998 1999
Pre
mia
& O
utgo
ings
£m
-1500
-1300
-1100
-900
-700
-500
-300
-100
100
300
500
(Los
s)/P
rofit
£m
net written premiums Total Outgoings Underwriting result
Industry economics ... insurers

��������� �� � ������ �������������������
The UK motor insurance sector shows signs of suicidal pricing
• The number of repairs has gradually risen – and claims incurred (in constant £) have about tracked this rise
• Commission and expenses have remained virtually flat – the insurance industry has contained these costs
• Premium income dropped heavily from 1994 to 1996, recovering a little since
• This has severely affected RBP (results before provisions)
• The stocking up of provisions was depressed during 1994-1997
UK Domestic Motor Insurance
-2,000
-1,000
0
1,000
2,000
3,000
4,000
5,000
6,000
7,000
1993 1994 1995 1996 1997 1998 1999
£mill
iion
(200
0 pr
ices
)
Number of repairs (thousand) Real premiums
Real Claims Incurred Real Commission & Expenses
Real RBP Real change in provisions
Industry economics ... insurers
Sources: mfbi, abi

��������� �� � ������ �������������������
It looks as though insurers have not adjusted premiums sufficiently to deal with the explosion in
personal injury claims• A closer look at premium income
and claims incurred shows the price/cost squeeze more clearly
• We have tried to decompose the claims costs for domestic motor business
– Estimated the rising proportion of PI (personal injury) claims
– Taken these and theft claims out of the total
• The residuals are consistent with body repair sector experience:
– Without PI, claims are fairly stable, in constant money
– Theft claims have declined, thanks to better precautions
– The “crash only” residual increased about 10% from 1995 to 1999
Sources: mfbi, abi, autoPOLIS estimates
Decomposition of Motor Claims
-
1,000
2,000
3,000
4,000
5,000
6,000
1993 1994 1995 1996 1997 1998 1999
£ m
illio
n (2
000
pric
es)
Premiums Claims incurred PI claims
Claims less PI Theft Crash only
Industry economics ... insurers

��������� �� � ������ �������������������
The opportunity to cut marketing, selling and acquisition costs by direct selling seems to have
been exploited – with the possible exception of the Internet
• Brokers and other agencies now take about 59% of the market
• Direct sales forces and tied agents have 6%
• Direct selling occupies 35% of the market
• The consensus seems to be that direct selling in its current form will not progress much further
• It is likely to be partly superseded by Internet selling
Insurance by Distribution Channel 1994-1998
0%10%20%30%40%50%60%70%80%90%
100%
1994 1995 1996 1997 1998
Other
Direct Selling
Tied Agents
Direct Sales Force
-Other IndependentAgencies-Brokers
Industry economics ... insurers
Source: ABI Industry Yearbook 1999
��������� �� � ������ �������������������
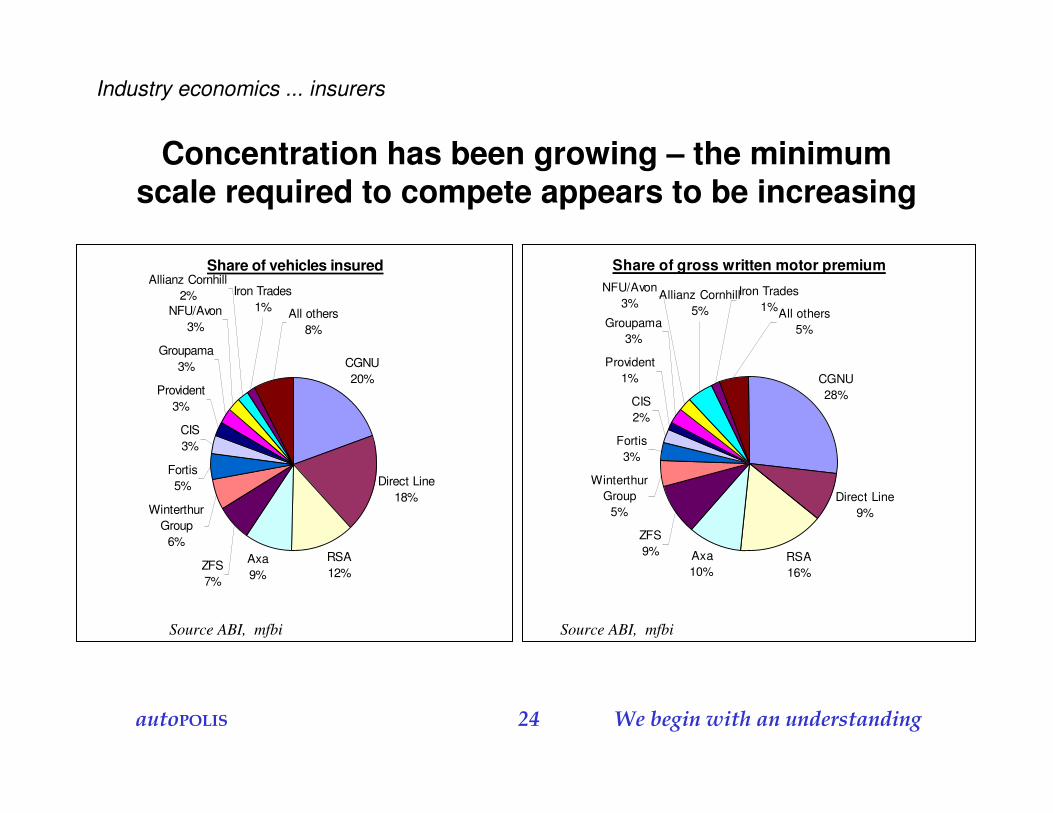
Concentration has been growing – the minimum scale required to compete appears to be increasing
Share of vehicles insured
CGNU20%
Direct Line18%
RSA12%
Axa9%
ZFS7%
Winterthur Group
6%
Fortis5%
CIS3%
Provident3%
Groupama3%
NFU/Avon3%
Allianz Cornhill2% Iron Trades
1% All others8%
Share of gross written motor premium
CGNU28%
Direct Line9%
RSA16%
Axa10%
ZFS9%
Winterthur Group
5%
Fortis3%
CIS2%
Provident1%
Groupama3%
NFU/Avon3%
Allianz Cornhill5%
Iron Trades1%All others
5%
Industry economics ... insurers
Source ABI, mfbi Source ABI, mfbi

��������� �� � ������ �������������������
Insurers with a book of under 400,000 vehicles look at risk -almost half of these are ‘major’ insurers
Com pany
No. of Vehicles
('000)
Gross w ritten m otor
prem ium £mAve prem ium £
CGNU 3751 2093 558Norwich Union
CGU InternationalCGU Underwriting
London &EdinburghRSA 2297 1210 527Axa 1709 757 443
Axa GroupAxa UK
ZFS 1328 734 553Eagle S tarZurich UK
Direct Line 3474 699 201Direct Line
PrivilegeAllianz Cornhill 456 365 800Winterthur Group 1058 382 361
ChurchillNIG skandia
Winterthur InternationalNFU/Avon 481 230 478
NFUAvon
Com pa ny
No. of Ve hicle s
('000)
Gross w ritte n m otor
pre m ium £mAve pre m ium £
Fortis 934 265 284Fortis
Northern S tarGroupa m a 499 202 405
GANGroupama General
CIS 655 192 293Iron Tra de s 274 115 420Provide nt 526 115 219
Live rpool V ictoria 486 91 187MM A 306 68 222Chyoda Fire a nd M a rine 82 52 634
Prudential Corp 191 43 225Trafalgar Insurance 70 31 443Pearl Assurance 77 28 364Legal & General 120 27 225Independent Insurance 43 26 605Ecclesiastical Insurance 62 26 419Berkshire Hathaway International 43 14 326USAA 13 13 1000Total 18,935 7,778 411Lloyds Syndicates 1998 n/k 946
Industry economics ... insurers
Source ABI, mfbi, autopolis calculations

��������� �� � ������ �������������������
Who might be the less-pressured survivors ?
• There seems to be an emerging segmentation of the insurance market, based on concentration on market segments:
– Standard products, simplified service, direct sales, low-cost –exemplified by Direct Line
– Broad coverage, scale-driven, multiple channels – CGNU typical
– Upmarket, high service – Allianz-Cornhill
• Those on the wrong side of the “frontier line” may not be competitive in the long-term
• If a shake-out takes place, the market could become more orderly, particularly in its pricing
Motor insurance industry segmentation
0%
5%
10%
15%
20%
25%
30%
35%
0 200 400 600 800 1000 1200
Average premium (£)
Exp
ense
s-to
-pre
miu
m r
atio
Source: abi, autoPOLIS estimates
Allianz Cornhill
USAA
Chiyoda
Direct Line
ProvidentFortis NFU/Avon
TrafalgarCGNU
ZFS
High-serviceScale-driven
Low-cost
Uncompetitive ?
Industry economics ... insurers

��������� �� � ������ �������������������
The lion’s share of profits on body repair parts accrues to the vehicle manufacturers
Figure 5Spare parts margin build-up by channel
(indexed to factory cost)
0 100 200 300 400 500 600 700
Product A - OE
Product A - OES
Product A - IAM
Product B - OE
Product B - OES
Product B - IAM
Factory cost
Factory margin
Aftermarket division margin
Dealer/distributor margin
Workshop margin
• The slide shows margin accumulations for
– OE parts– OES parts distributed through
franchised dealers– IAM parts
• Vehicle manufacturers typically take 60-65% gross margins on parts made by independent suppliers - and more on captive parts
• They are heavily - and increasingly -dependent on spare parts profits
• This is one of the reasons for their strong defence of Block Exemption
• Most OE body repair parts are sourced by repairers from franchised dealers
Industry economics ... parts
Source: component supplier
��������� �� � ������ �������������������
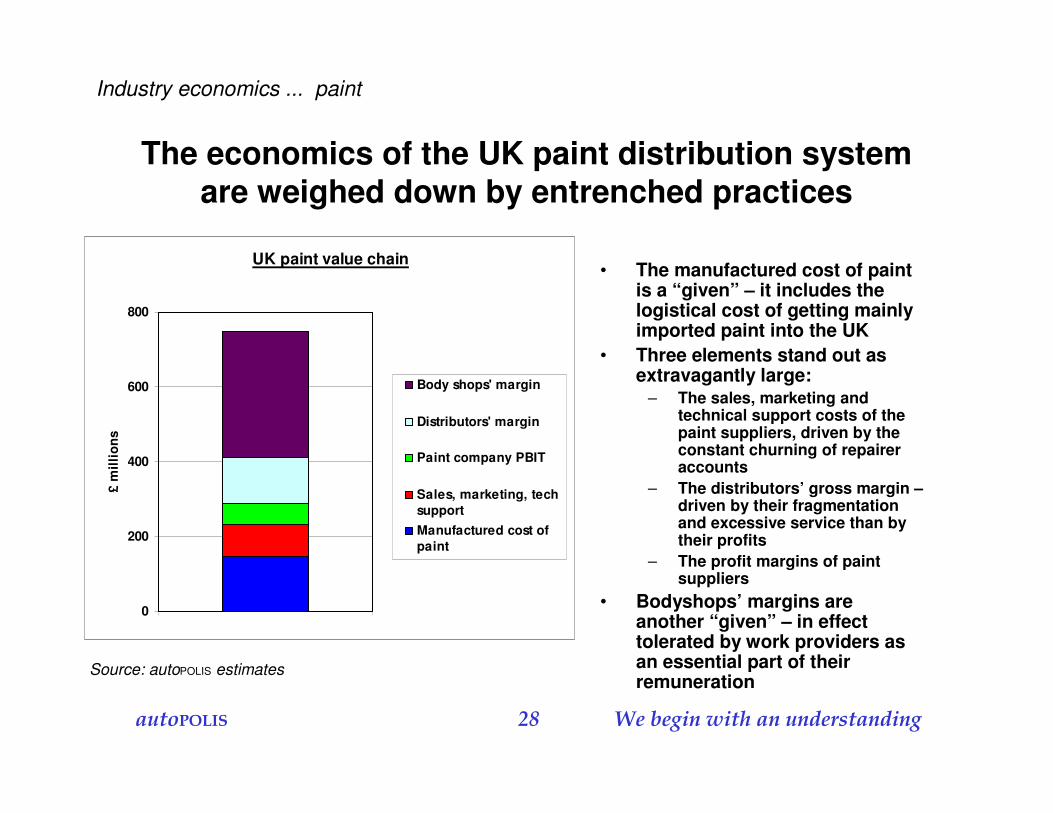
The economics of the UK paint distribution system are weighed down by entrenched practices
• The manufactured cost of paint is a “given” – it includes the logistical cost of getting mainly imported paint into the UK
• Three elements stand out as extravagantly large:
– The sales, marketing and technical support costs of the paint suppliers, driven by the constant churning of repairer accounts
– The distributors’ gross margin –driven by their fragmentation and excessive service than by their profits
– The profit margins of paint suppliers
• Bodyshops’ margins are another “given” – in effect tolerated by work providers as an essential part of their remuneration
UK paint value chain
0
200
400
600
800
£ m
illio
ns
Body shops' margin
Distributors' margin
Paint company PBIT
Sales, marketing, techsupportManufactured cost ofpaint
Source: autoPOLIS estimates
Industry economics ... paint
��������� �� � ������ �������������������
Industry relationships
• Network construction• Repair estimates• Day-to-day• Overall

��������� �� � ������ �������������������
For all but the smallest bodyshops, the insurers are their dominant source of business
• A Bodyshop Magazine Survey suggested that 69% of all repair work by value comes directly via insurers, with an additional 15% being directed by accident managers
– Fleet work - 10%– Retail and Trade - 12%
• Larger shops are clearly more reliant on approvals for the sources of their work, whereas small bodyshops have a more balanced distribution of work providers
• In the same survey 41% of respondents had over 50% of their work from approved sources
• 16% relied on over 75% of their work coming through approved insurers
Turnover by Work Provider - Survey 2001
0%
10%
20%
30%
40%
50%
60%
70%
80%
90%
100%
Under 4 5-8 9-12 Over 12
Number of Operatives
Approved Insurer Other insurer Accident Manager Fleet
Retail Trade Car Manufacturer Other
Source: Bodyshop Magazine Industry Survey 2001
Industry relationships ... network construction

��������� �� � ������ �������������������
Although there are some major bodyshop groups in operation in the franchised and independent
sectors, this has not changed the balance of power
• In spite of the size of these groups, the approvals are often on a shop-by-shop basis
– This leaves the groups as exposed as the independents in terms of continuity of work
– It discourages the effective utilisation of considerable resources by these groups
– This therefore adds cost• Ford was the first vehicle manufacturer to
enter the independent bodyshop market, with the purchase of the Howard Basfordchain
– Which it intends to expand nation-wide– Although it is unlikely to allow its shops to
have less than an equal partnership with work providers
• Insurers who have invested in their own capacity in major conurbations include:
– Churchill - 5– Direct Line - 4– RSA - 4
Industry relationships ... network construction
66
31
24
23
21
18
17
16
15
13
13
8
4
4
3
30
0 10 20 30 40 50 60 70
N at io nw id e
A rno ld C lar k
Jar d ine M at heso n
Sand er so n B ramall
Pend rag o n
Quicks ( inc l QB S)
A r r iva p lc
Lo o kers p lc
B r is t o l St reet
R o b ins & D ay
R eg V ard y/ B o d ycar e
D ixo ns
C hurchi ll
D irec t
R SA
N o rw ich
num ber o f o ut le t s
Source: Castrol Trend Tracker 2002

��������� �� � ������ �������������������
Insurers do not seem to construct their network so as to achieve a reasonable balance of supply and
demand, region by region
• Insurers could construct their networks so as to ensure the viability of their approved repairers
– The approvals regime requires heavy commitment from bodyshops both financially and in service provision
– Estimating and management systems required by insurers are quitesophisticated and capture detailed information
– Which could be analysed as part of “footprinting” to set out network requirements
• There is evidence that some insurers do co-ordinate and manage their repairer networks according to their claims expectations - however, it seems that these are the exception
• Instead, many work providers, fearful of lack of capacity at peak times, ‘over-approve’ their networks and hence disappoint in the volume and flow of work, against the expectations they raised
• This in itself has made a major contribution to network inefficiency - by stopping the natural shake-out of bodyshops
Industry relationships ... network construction

��������� �� � ������ �������������������
Contracts or Service Agreements are totally one-sided affairs
• There is little difference between insurers in their contractual terms of business with repairers - they are based on major commitments from repairers and virtually no commitments from the work providers
• Through these contracts the insurers exert a massive amount of control of these supposedly independent businesses, determining:
– Estimating and imaging system usage– Equipment levels– Paint brand usage– Labour rates– Discounts on replacement parts and overall invoices– Response times for free collection of AD vehicle– Provision of courtesy vehicle free to insurer and customer– Parts sourcing and whether OE or non-OE– Payment terms
• Although the agreements allow for termination periods to allow bodyshops to find alternative work providers, in reality insurers can, and allegedly do, ‘turn off the tap’instantaneously- without penalty
Industry relationships ... network construction

��������� �� � ������ �������������������
The issue of labour rates is the most contentious of all, as they are unrelated to the true costs of labour
• Nationally and regionally, wages have increased at a much faster rate than the labour recovery rate
• Inside the M25, the pressure on wages relative to recovery rate has been even more severe
• Part of the problem is the misallocation of overheads which masks the real costs to bodyshops of labour
• “Labour rates are far too low. Insurance companies accept £45 per hour labour rate from our mechanical workshop, but not for bodywork” Repairer response to Sewells/Audatex survey 2001
100
120
140
160
180
200
220
1990 1992 1994 1996 1998 2000
Year
Inde
x (1
990
natio
nal =
100)
National average productives' total pay
M25 average productives' total pay
National labour recovery rate
M25 labour recovery rate
Source: Sewells/Audatex BS Opinion Survey 2001
Trend in total wages/insurance labour rates nationally and within the M25
Industry relationships ... network construction

��������� �� � ������ �������������������
Labour charge-out rates also vary widely between insurers
19.50
20.00
20.50
21.00
21.50
22.00
22.50
23.00
23.50
Al l ianzCornhi l l
Royal SunAl l iance
G roupama ZFS Priv i lege Fortis CG N U N IGSkandia
D irect Line CIS N FU /Avon Axa Churchil l Lloyds
Labo
ur c
harg
e-ou
t rat
e (£
/hr)
N ational average £21.99
Weighted labour charge-out rates by insurance company – rank order (Regional effect also taken into account)
Industry relationships ... network construction

��������� �� � ������ �������������������
The rationale behind the use of estimating systems is totally reasonable
• A thorough and accurate estimate of the extent of the damage, including the methodology of repair, and the parts and the materials to be used in returning the vehicle to pre-accident condition, is pivotal to the cost-effective repair of an accident damaged vehicle
• Traditionally, all estimates were manually done, with the estimator’s opinion of the time required forming the basis of the calculation and negotiation with the insurer’s engineer
• The rules of the game were that estimators would over-estimate, and insurance engineers would negotiate the timings back to something which was acceptable to both
• With the increase in the volume and complexity of repairs, this approach became unsustainable
• The development of standard repair times was therefore a very logical and necessary step, in order to ensure common standards for all of the parties concerned
Industry relationships ... repair estimates

��������� �� � ������ �������������������
Estimating systems have neither penetrated the market nor been rationalised fully
• Computerised estimating systems have been a contentious area because of different insurers imposing different systems on their approved networks - a situation made even more difficult by the mergers of different insurance companies with conflicting requirements
• A lack of standardisation between insurers has led to– Increased costs of multiple estimating systems– Inefficiencies because of the different skills required to operate the
different systems• According to a recent Sewells survey of the 5,675 primary bodyshops: 28%
have no computer (mostly those with 3-4 productives), 47% have one, 18% have two, and 7% have 3+ ... this is probably an underestimation of the use of multiple systems
• The two computerised estimating systems that are most used are Audatex and Glassmatix, with Audatex by far the market leader
Industry relationships ... repair estimates

��������� �� � ������ �������������������
There are suspicions about a near-monopoly in estimating services
• Audatex operates through local licencees in many European countries, e.g. Sidexa in France, Informex in Belgium
• It has 90% market shares in Germany, France, the Netherlands and Belgium - with the UK, this means 80% of the European parc of light vehicles (passenger cars + light commercials)
• It appears able to raise prices with impunity and to earn very high returns
• There is no Thatcham-type counterweight outside the UK
• It does not have to ‘sell’ its products to repairers in the UK - it only has to ensure it is specified as the system required by insurers
• “In Audatex’s view, it has only 6 or so customers in the UK - the insurance companies” – ex-Audatex employee
Industry economics ... repair estimates
Company GWP Market Share (%)
Audatex 5,108 65
Glassmatix 2,106 27
Autoclaims 680 9
ARCS 516 7
Motex 448 6
Inter-Est 402 5
Quoits 134 1
Source: BRIC. Figures do not add up to 100% as sometimes more than one estimating company is specified
��������� �� � ������ �������������������
There is dissatisfaction with the basis for some estimating systems - but there are also problems at
the bodyshop level• Repairers express concerns about the Audatex system and its base data
– “Stop manufacturers from supplying poor data in relation to repair times. Warranty times do not reflect the true time it takes to complete a task, as the times are reduced due to a higher labour rate”. Body repairer in Sewells/Audatex survey
• But it is important to remember that the system is a tool - the first requirement is the skill of the estimator in estimating
• Many problems can arise through lack of experience with the estimating system itself leading to:
– Under allocation of labour hours– Wrong or incomplete parts selection– Wrong paint selection
• The requirement for multiple systems can only exacerbate the opportunity for mistakes through lack of training and understanding of the functionality of each system
• There are allegations that the systems are being manipulated by work providers in collusion with systems providers
Industry relationships ... repair estimates

��������� �� � ������ �������������������
Industry relationships ... repair estimates
The use of imaging systems is also increasing
• Imaging systems, which allow the transmission of images of the crash damaged vehicle in real-time to a central assessor, are a major opportunity for speedy agreement of the accident damage and the approval of the estimate
• In the Sewells bodyshop survey, 51% of respondents had an imaging system
– 41% had one, 8% had two and 2% had three– This suggests that there are now 3,000 imaging systems in use
• Possibly a 200% increase year-on-year• Following an estimated 300% growth between 1998 and 1999.
• Bodyshops tend to use the imaging system compatible with their estimating and management systems e.g.:
– Audatex and AudaImage– Glassmatix and GlassImage

��������� �� � ������ �������������������
Many repairers think the insurers are not managing the relationship with themselves well
• “They are cutting each other’s throats for market share, at the expense of the bodyshops and the policyholders. They treat life like a game of Monopoly, buying and selling, without a thought of the consequences to others”.
• “Generally, insurance companies are much too influential within the bodyshop business. Their reluctance to discuss hourly rates, until a uniform basis for estimating repairs was established, has forced bodyshops to adopt multi-systems at high cost.”
• “Efficiencies were realised many years ago with investment in workflow, equipment and training. Times have been standardised and now it is time the rates increased as originally discussed.”
• “Insurance companies repair contracts are becoming increasingly more unrealistic and it is alarming to think how much damage they are going to inflict on the industry, before a sensible approach prevails”.
• “Must realise that the industry they are strangling is the industry that looks after and leaves a lasting impression on their clients. Our time will come when we can hopefully obtain a rate, which enables us to make a living and employ a stable staff of craftsmen again”.
• “Relationships are becoming more adversarial as engineers, who no longer visit repair shops, are losing touch with reality. Also engineers are expected to continually reduce physical repair costs, when vehicle construction is becoming more complex”
• “The labour rates demanded are insufficient to support investment in equipment and training..”• “There is too much concern regarding potential consolidation. All senior staff are too frightened of
trying new ways of working, for fear of failure. There is a real need to focus on the total claims process, not just repair. There is also a need for authorisation process improvements, as the ‘taxi meter’ runs at the repairer’s cost. There is no incentive to speed up the process.”
• “There is too much focus on labour rate and opinion times, which are forcing repairers to supply and fit a high proportion of new parts, which is inflating repair costs and this is exactly against what insurers are trying to achieve. Engineers’ technical skills are being forgotten or are deemed not required, as they become auditors. Again, in my opinion, this is working against the insurers’objectives and is not in the repairers’ interests either”.
Industry relationships ... overall
��������� �� � ������ �������������������
The relationship with policyholders seems to be neglected as an opportunity for differentiation
• Insurers need to be proactive at the two ends of the relationship -customer acquisition and claims handling
• Yet most customers receive basically the same service for their premium -from the repairers - whether they paid £200 or £2000 in premium
– The increasing use of call centres allows insurers to interact with the customer, but is used primarily as a method of directing customers into the insurers chosen repairer
• Allegedly 20% of customers would prefer to choose their own repairer (source: insurance broker)
– The facility of Accident Managers further severs the link between customer and insurer
– Only a few insurers do not require the bodyshop to provide a free-to-the-customer courtesy car
• One of the few possibilities for non-price differentiation and customer retention is therefore through the quality of the repairer network - but repairers only interact with the customer at a time of distress
Industry relationships ... overall

��������� �� � ������ �������������������
Body repairers are at the centre of a network of relationships that goes far beyond the insurers and
repairers alone
Insurers Brokers
Accident Managers
Fleet RetailWork Providers
Direct Suppliers
Body Repairers
(Independent, Franchised, Groups, Insurer-owned)
Systems Suppliers
Factors -Mechanical
Parts
Franchise Dealers -Parts
Factors - Paint Factors -Body Parts
Indirect Suppliers
Vehicle ManufacturersComponent ManufacturersPaint Manufacturers
Industry relationships ... overall
Customers

��������� �� � ������ �������������������
Conclusions and implications
• Conclusions for the UK• Possible implications for Australia

��������� �� � ������ �������������������
UK conclusions
• Consolidation of repairers continues but there are no effective large, well-managed and branded smash repair networks. The management of PSR networks by most insurers does not lead to stable relationships, based on trust and conducive to investment and honesty. Some insurers do not accept the responsibilities that accompany market power
• Repairers, for historical reasons, share some of the responsibility for this current situation. The smash repair sector has over-capacity, is inefficient, unlicensed and allows non-compliant companies to continue operating. The repairers have not been well served by having three weak trade associations, more interested in membership dues than in standards – there is a flagrant contrast in this respect with the Netherlands, with its single powerful trade association, which imposes standards and stands up to insurers
• There are substantial divergences in economic and financial performance between repairers. It is not possible to conclude that everyone is being starved to death by the pressures on labour rates and repair times and fraud appears to play a significant role
• The primary relationship is conventionally seen as being between insurers (work providers) and repairers (work executors), whereas it in fact should also involve three other very large sectors: vehicle manufacturers and their franchised distribution networks; component suppliers and their independent parts distributors; and paint suppliers and their distributors
• The transfer price mechanism is set up between the first two sectors and thus is too narrowly based (primarily on the labour content of repair jobs) and therefore does not adequately manage the total cost of repairs by managing the cost of bought-in parts and paint. Thus the insurance/repair sectors fail to exercise their combined purchasing power. There is a serious lack of transparency of cost structures and pricing mechanisms throughout the insurance/repair industry

��������� �� � ������ �������������������
UK conclusions (continued)
• Much reliance is placed on the estimating/approval process to price individual repair jobs, thereby delegating responsibility to “mechanical” time-calculation systems and often insufficiently experienced estimators in repair shops. Repair times themselves are sometimes based on unrealistic repair conditions and exposed to manipulation. There is insufficient discrimination between types of repair and locations in setting charge-out rates
• The too often conflictual nature of the insurer/repairer relationship has discouraged thoughtful analysis and investment in real economic gains through new technologies in the repair sector. It has also distracted insurers from the need for better product design, optional levels of service, clarity of pricing, transparency and adaptation to customer needs, which could lead to better customer retention and lower overall costs
• The motor insurance market has been a financial roller-coaster, with too much attention paid to short-term gains in market share and too little to long-term stability and profitability, in what is fundamentally a very stable and predictable market. The wisdom and ethics of cross-subsidising motor insurance from other business by insurers appear questionable

��������� �� � ������ �������������������
Possible implications for Australia
• Further consolidation of smash repair shops is clearly needed, in order to continue raising standards of repair and service to customers. But it is not a cure-all
• Insurers cannot manage everything. PSRs alone are not a sufficient mechanism, nor will codes of conduct suffice. The smash repair industry needs to organise and restructure itself, whether through managed networks or a single strong trade association (state-wide or national)
• We disagree with the rejection of standard times. Properly used through estimating systems, they enable considerable savings in time, cost and contention. But they need to be independently generated by methods representative of actual repair conditions. They may need to be “held in trust”, separate from the commercialisation of estimating systems that make use of them
• Conversely, more flexible negotation of hourly rates is appropriate. Differences between types of job and localities is needed. There could be an argument for “streaming” jobs into specialised shops for instant, medium and heavy repairs
• A more balanced approach to cost reduction may be needed. There needs to be more emphasis on productivity and cost, and less on price. Insurers might put less pressure on repairers and their labour rates, and pay more attention to prices and margins in parts and paint
• More information and analysis seem to be needed on the economics of the sector