sme telecoms summary report - home | federation of ... · sme telecoms summary report ... service...
TRANSCRIPT

SME Telecoms Summary Report
Sofia Savage
Research Executive
020 7012 6217
London October 2010

Contents
• Sampling Slides 4-5
• Key Findings Slides 6-8
• Results
• Services & importance Slides 10-15
Contents
3
• Satisfaction & recommendation Slides 16-20
• Fibre networks, traditional voice & VoIP services Slides 21-25
• Moving to another service provider Slides 26-28

Sampling
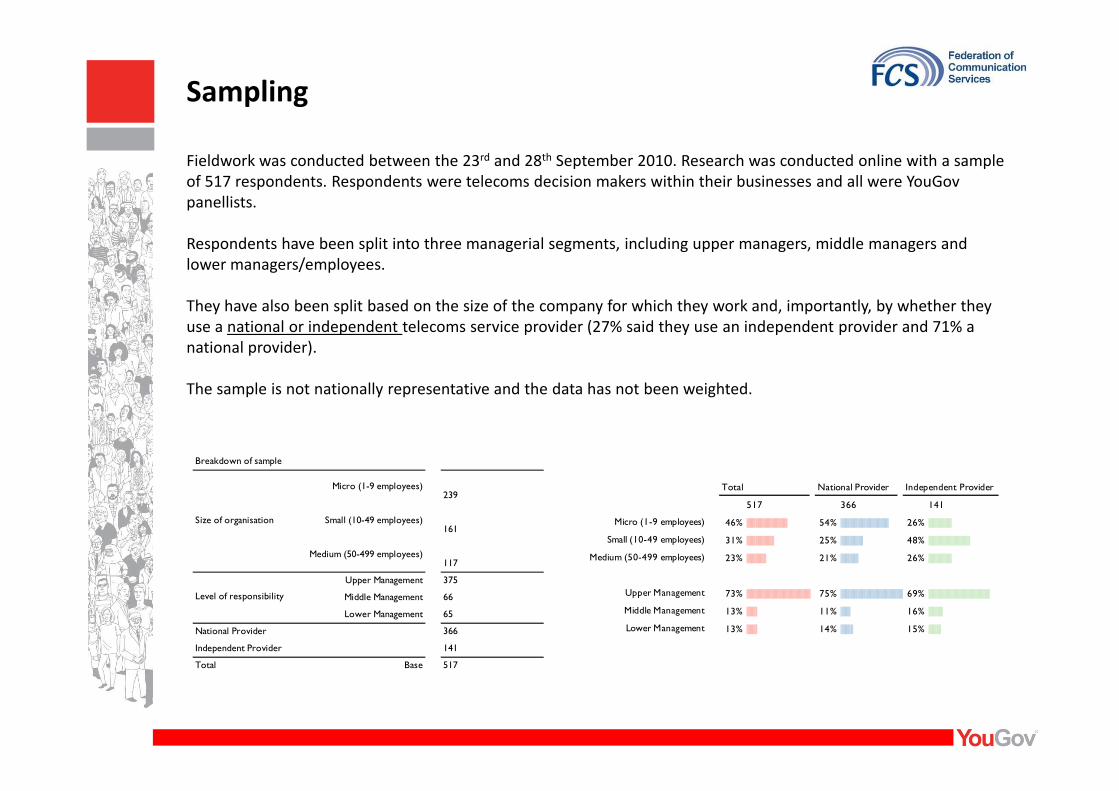
Fieldwork was conducted between the 23rd and 28th September 2010. Research was conducted online with a sample
of 517 respondents. Respondents were telecoms decision makers within their businesses and all were YouGov
panellists.
Respondents have been split into three managerial segments, including upper managers, middle managers and
lower managers/employees.
They have also been split based on the size of the company for which they work and, importantly, by whether they
use a national or independent telecoms service provider (27% said they use an independent provider and 71% a
national provider).
The sample is not nationally representative and the data has not been weighted.
Sampling
The sample is not nationally representative and the data has not been weighted.
Breakdown of sample
Micro (1-9 employees)239
Small (10-49 employees)161
Medium (50-499 employees)117
Upper Management 375
Middle Management 66
Lower Management 65
National Provider 366
Independent Provider 141
Total Base 517
Size of organisation
Level of responsibility
Total National Provider Independent Provider
517 366 141
Micro (1-9 employees) 46% |||||||||||||||||||||||||||||||||||||||||||||| 54% |||||||||||||||||||||||||||||||||||||||||||||||||||||| 26% ||||||||||||||||||||||||||
Small (10-49 employees) 31% ||||||||||||||||||||||||||||||| 25% ||||||||||||||||||||||||| 48% |||||||||||||||||||||||||||||||||||||||||||||||
Medium (50-499 employees) 23% |||||||||||||||||||||| 21% |||||||||||||||||||| 26% ||||||||||||||||||||||||||
Upper Management 73% |||||||||||||||||||||||||||||||||||||||||||||||||||||||||||||||||||||||| 75% ||||||||||||||||||||||||||||||||||||||||||||||||||||||||||||||||||||||||||69% |||||||||||||||||||||||||||||||||||||||||||||||||||||||||||||||||||||
Middle Management 13% |||||||||||| 11% ||||||||||| 16% ||||||||||||||||
Lower Management 13% |||||||||||| 14% |||||||||||||| 15% ||||||||||||||

Key Findings
Key Findings (1)
• The two most common services purchased amongst users of both national and independent providers
were landlines and broadband.
• Landlines and broadband were significantly more likely to be purchased from national
providers.
• Inbound numbers and voice-over Internet Protocol were significantly more likely to be
supplied by independent providers.
• Reasons for choosing telecoms providers tended to centre around cheaper tariffs and receiving a more
reliable service. A significantly greater number of decision makers using independent providers said
‘cheaper tariffs’ (68% vs. national providers at 28%) was a reason for choosing their supplier.
• Better customer service and account management were also more likely to be cited by
users of independent service provider. users of independent service provider.
• Those using national providers were significantly more likely to select reliability, better
connections and quicker speeds as reasons.
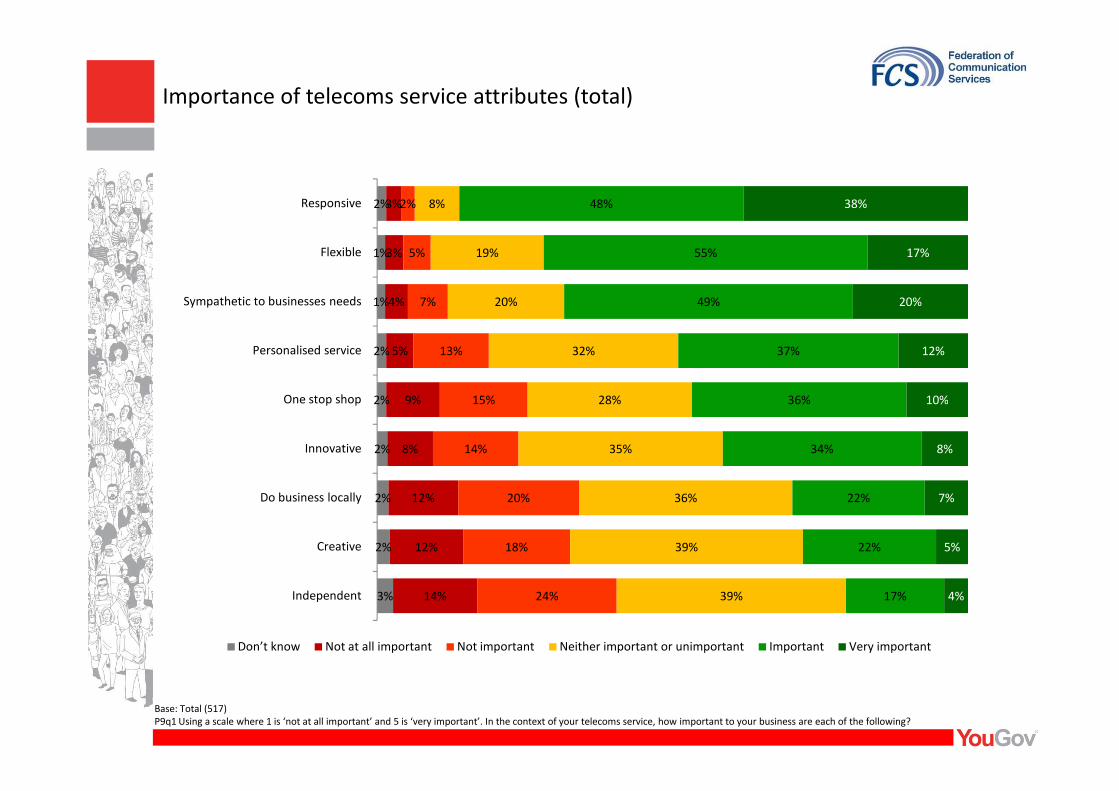
• Being responsive, sympathetic/ tuned in to the needs of small business and flexible were the three
attributes believed to be most important amongst users of both national and independent service
providers.
• Topping this list of attributes was being responsive, which also came out as the national
service provider characteristic that respondents were most satisfied with, followed by
‘one stop shop’ and being flexible.
• For users of independent service providers, being responsive was also the feature
respondents were most satisfied with, this time followed by providing a ‘personalised
service’ and being flexible.
Key Findings (2)
• Those decision makers using independent service providers were more satisfied with them than those
using national providers.
• NPS was significantly higher for users of independent service providers at -13% compared
with national service providers at -35%.
• 77% of both national and independent service provider users were aware of the rollout of fibre
networks. When asked about what this rollout can offer their business, ‘increased bandwidth and
capacity’, ‘high data carrying capacity’ and ‘higher speed broadband conferencing’ emerged as the top
responses amongst users of both types of provider.
• 66% of ‘national provider’ respondents and 60% of ‘independent provider’ respondents
claimed that the opportunities arising from fibre networks were important to their claimed that the opportunities arising from fibre networks were important to their
business.
• Access to traditional services was considered important to 88% of national and 83% of independent
provider users. Responses for the importance of VoIP services were 35% and 34% respectively.
• A third of national provider users have attempted to switch providers, with 62% achieving this.
• When it comes to independent users, 40% have attempted to switch in the past and 61%
have actually done so.
• The main reason for not moving amongst those who have not done so (at the total level)
included ‘too much hassle’, ‘my current provider offered me a better deal’ and the
inability of the new provider to offer an acceptable deal.

Findings
Services & Importance
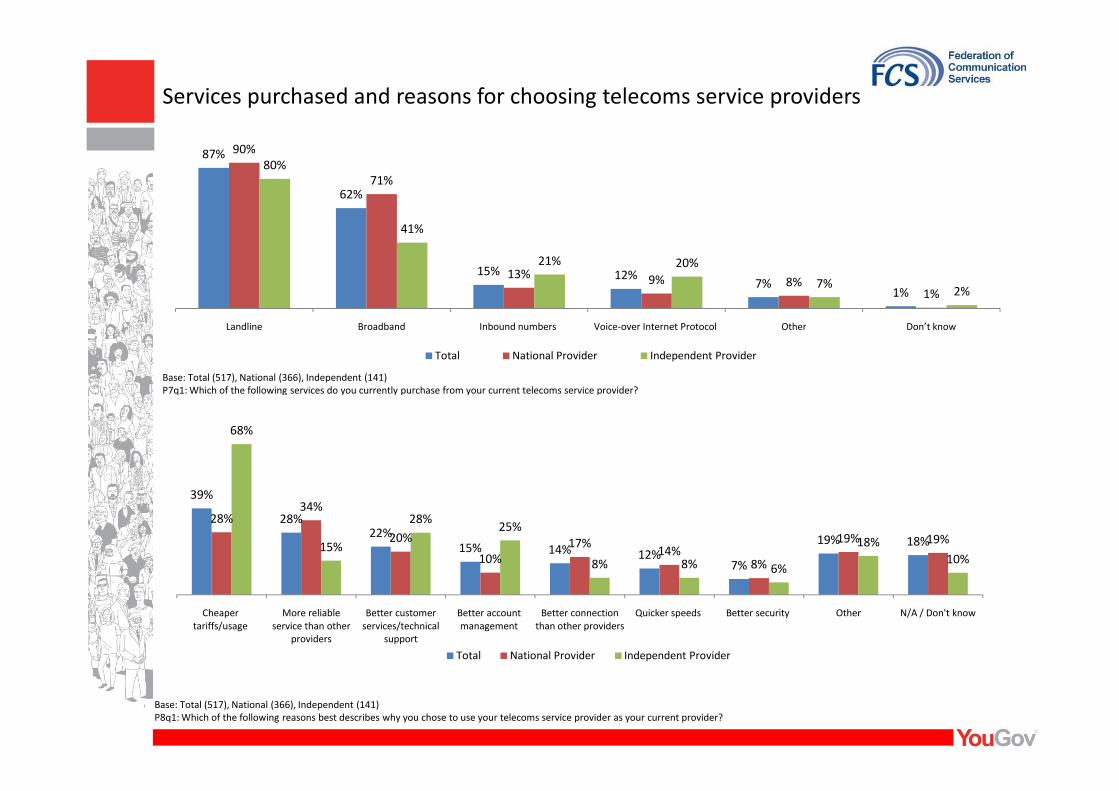
Base: Total (517), National (366), Independent (141)
P7q1: Which of the following services do you currently purchase from your current telecoms service provider?
87%
62%
15% 12%7%
1%
90%
71%
13% 9% 8%1%
80%
41%
21% 20%
7%2%
Landline Broadband Inbound numbers Voice-over Internet Protocol Other Don’t know
Total National Provider Independent Provider
Services purchased and reasons for choosing telecoms service providers
Base: Total (517), National (366), Independent (141)
P8q1: Which of the following reasons best describes why you chose to use your telecoms service provider as your current provider?
39%
28%22%
15% 14% 12%7%
19% 18%
28%34%
20%
10%
17%14%
8%
19% 19%
68%
15%
28%25%
8% 8% 6%
18%
10%
Cheaper
tariffs/usage
More reliable
service than other
providers
Better customer
services/technical
support
Better account
management
Better connection
than other providers
Quicker speeds Better security Other N/A / Don't know
Total National Provider Independent Provider
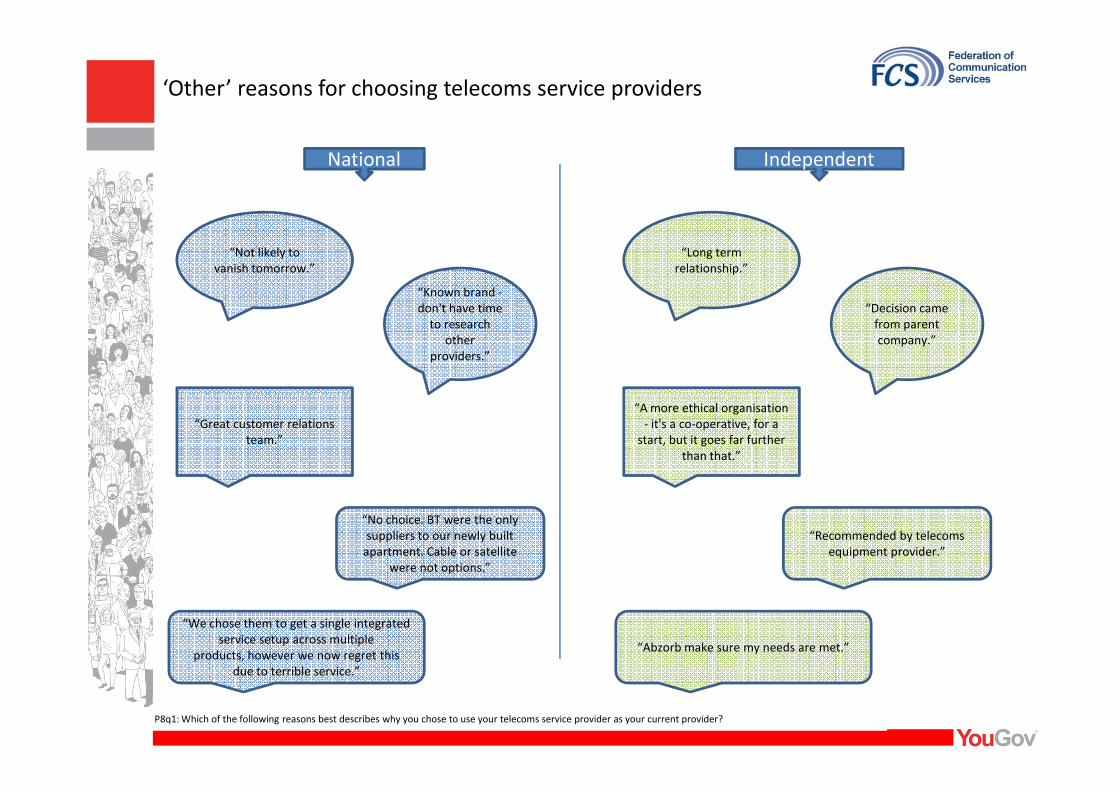
‘Other’ reasons for choosing telecoms service providers
National Independent
“Not likely to
vanish tomorrow.”
“Known brand -
don't have time
to research
other
providers.”
“Long term
relationship.”
“Decision came
from parent
company.”
P8q1: Which of the following reasons best describes why you chose to use your telecoms service provider as your current provider?
“Great customer relations
team.”
“No choice. BT were the only
suppliers to our newly built
apartment. Cable or satellite
were not options.”
“We chose them to get a single integrated
service setup across multiple
products, however we now regret this
due to terrible service.”
“A more ethical organisation
- it's a co-operative, for a
start, but it goes far further
than that.”
“Recommended by telecoms
equipment provider.”
“Abzorb make sure my needs are met.”
2%
1%
1%
2%
2%
3%
3%
4%
5%
9%
2%
5%
7%
13%
15%
8%
19%
20%
32%
28%
48%
55%
49%
37%
36%
38%
17%
20%
12%
10%
Responsive
Flexible
Sympathetic to businesses needs
Personalised service
One stop shop
Importance of telecoms service attributes (total)
Base: Total (517)
P9q1 Using a scale where 1 is ‘not at all important’ and 5 is ‘very important’. In the context of your telecoms service, how important to your business are each of the following?
2%
2%
2%
2%
3%
9%
8%
12%
12%
14%
15%
14%
20%
18%
24%
28%
35%
36%
39%
39%
36%
34%
22%
22%
17%
10%
8%
7%
5%
4%
One stop shop
Innovative
Do business locally
Creative
Independent
Don’t know Not at all important Not important Neither important or unimportant Important Very important

1%
1%
1%
1%
3%
4%
5%
9%
3%
5%
7%
14%
7%
18%
21%
28%
47%
54%
45%
37%
38%
17%
20%
11%
Responsive
Flexible
Businesses needs
One stop shop
1%
1%
1%
1%
1%
1%
2%
2%
0%
6%
3%
13%
9%
16%
20%
26%
50%
59%
59%
48%
39%
17%
16%
10%
Responsive
Businesses needs
Flexible
Personalised service
National Independent
Importance of telecoms service attributes (national & independent)
Base: National (366), Independent (141)
P9q1 Using a scale where 1 is ‘not at all important’ and 5 is ‘very important’. In the context of your telecoms service, how important to your business are each of the following?
1%
2%
1%
2%
3%
5%
7%
13%
13%
16%
13%
13%
20%
17%
24%
35%
36%
36%
40%
39%
33%
33%
22%
21%
14%
12%
10%
8%
7%
4%
Personalised service
Innovative
Do business locally
Creative
Independent
1%
1%
2%
1%
1%
9%
9%
11%
11%
10%
18%
17%
22%
23%
23%
28%
33%
35%
39%
38%
33%
37%
23%
22%
25%
9%
3%
6%
4%
3%
One stop shop
Innovative
Do business locally
Independent
Creative

Top 3 most important benefits for businesses
61%
27%
12%
Responsive
Ranked first
Ranked
second
Ranked third
29%34%
Sympathetic to business needs
Ranked first
62%
27%
12%
Responsive
Ranked first
Ranked
second
Ranked third
27%
Sympathetic to business needs
Ranked first
Total
58%27%
14%
Responsive
Ranked first
Ranked
second
Ranked third
32%34%
Sympathetic to business needs
Ranked first
National Independent
P10q1 lease now rank the following benefits in order of importance to your business. The number of slots available for ranking will depend upon the answers you gave to the previous
question. Please put the most important factor in the first slot and work your way down.
29%
37%
34%
Ranked
second
Ranked third
14%
47%
39%
Flexible
Ranked first
Ranked
second
Ranked third
27%
38%
34%
Ranked
second
Ranked third
13%
48%
39%
Flexible
Ranked first
Ranked
second
Ranked third
32%
34%
34%
Ranked
second
Ranked third
19%
44%
37%
Flexible
Ranked first
Ranked
second
Ranked third

Satisfaction & Recommendation

3%
7%
5%
4%
5%
8%
4%
7%
8%
9%
11%
6%
11%
10%
12%
25%
39%
38%
40%
39%
44%
37%
32%
31%
30%
9%
8%
7%
7%
6%
Responsive
One stop shop
Flexible
Sympathetic to businesses needs
Personalised service
Satisfaction with current telecoms provider (total)
Base: Total (517)
P11q1 Using a slightly different scale where 1 is ‘not at all satisfied’ and 5 is ‘very satisfied’, how satisfied are you with your current telecoms provider when thinking about the following?
5%
7%
8%
8%
9%
9%
4%
5%
6%
5%
12%
7%
7%
7%
7%
39%
50%
52%
50%
53%
30%
26%
23%
24%
22%
6%
6%
6%
5%
4%
Personalised service
Innovative
Independent
Do business locally
Creative
Don’t know Not at all satisfied Not satisfied Neither satisfied or unsatisfied Satisfied Very satisfied

4%
7%
5%
4%
9%
4%
8%
10%
12%
7%
14%
12%
25%
38%
39%
42%
42%
37%
29%
29%
7%
6%
5%
4%
Responsive
One stop shop
Flexible
Businesses needs
2%
2%
3%
6%
4%
5%
5%
3%
8%
5%
6%
1%
25%
29%
35%
40%
47%
45%
39%
39%
14%
13%
13%
11%
Responsive
Personalised service
Flexible
Independent
National Independent
Satisfaction with current telecoms provider (national & independent)
Base: National (366), Independent (141)
P9q1 Using a scale where 1 is ‘not at all important’ and 5 is ‘very important’. In the context of your telecoms service, how important to your business are each of the following?
7%
5%
8%
9%
8%
4%
10%
7%
5%
5%
9%
15%
8%
8%
9%
51%
43%
51%
54%
56%
25%
23%
21%
20%
17%
4%
4%
3%
4%
3%
Innovative
Personalised service
Do business locally
Creative
Independent
4%
6%
5%
6%
7%
5%
4%
5%
3%
5%
5%
4%
3%
2%
4%
35%
40%
48%
49%
52%
35%
35%
30%
29%
26%
15%
11%
9%
11%
6%
Businesses needs
One stop shop
Innovative
Do business locally
Creative

17%
17%
18%
16%
9%7%
14%
10% 8%13%
10 =Extremely likely
9
8
7
6
Total National Independent
43%33%36%
Likelihood to recommend telecoms service provider
2% 1% 3%
8% 8%7%
2% 2% 2%4% 5% 1%
5% 7%
1%
4%3%
7%
12%14%
7%
12%11%
15%
16%17%
13%
6
5
4
3
2
1
0 = Not at all likely
Don't know
Base: Total (517), National (366), Independent (141)
P17Q1 And now using a scale of 0 to 10, where 0 is not at all likely and 10 is extremely likely, how likely or unlikely is it that you would recommend your telecoms provider to a friend or colleague?
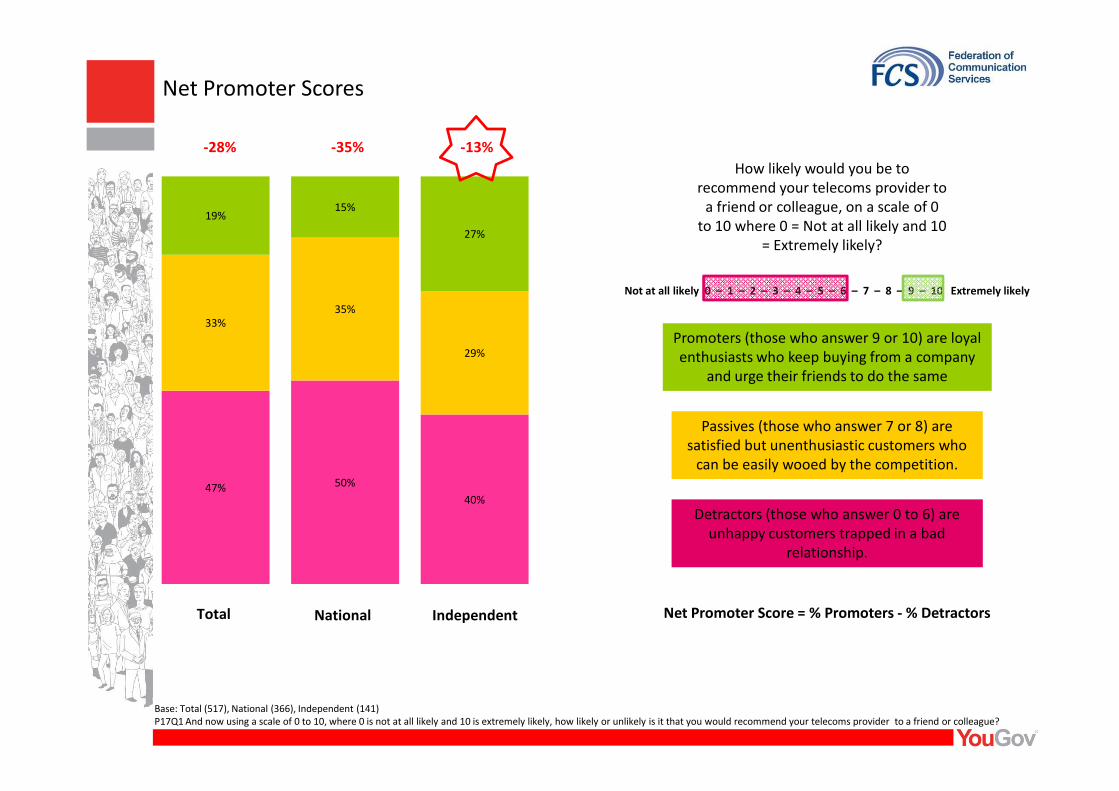
33%
35%
29%
19%15%
27%
-28% -35% -13%
How likely would you be to
recommend your telecoms provider to
a friend or colleague, on a scale of 0
to 10 where 0 = Not at all likely and 10
= Extremely likely?
Not at all likely 0 – 1 – 2 – 3 – 4 – 5 – 6 – 7 – 8 – 9 – 10 Extremely likely
Promoters (those who answer 9 or 10) are loyal
enthusiasts who keep buying from a company
and urge their friends to do the same
Net Promoter Scores
47% 50%
40%
Total National Independent
Base: Total (517), National (366), Independent (141)
P17Q1 And now using a scale of 0 to 10, where 0 is not at all likely and 10 is extremely likely, how likely or unlikely is it that you would recommend your telecoms provider to a friend or colleague?
Net Promoter Score = % Promoters - % Detractors
Detractors (those who answer 0 to 6) are
unhappy customers trapped in a bad
relationship.
Passives (those who answer 7 or 8) are
satisfied but unenthusiastic customers who
can be easily wooed by the competition.
Fibre networks, traditional voice & VoIP services

Base: Total (517), National (366), Independent (141)
P12q1 Are you aware of the rollout of fibre networks?
76%
22%
1%
Aware
Not Aware
Don’t know
77%
22%
1%
Aware
Not Aware
Don’t know
77%
21%
2%
Aware
Not Aware
Don’t know
Total National Independent
Awareness and definitions of fibre networks
Base: Total (395), National (281), Independent (109)
P13q1 You said that you were aware of the rollout of fibre networks. What do you think this rollout can offer? Please tick all that apply.
92%88%
77%
51%
34% 33%
9%2% 2%
91%88%
78%
51%
35% 34%
9%1% 2%
95%90%
77%
51%
35%31%
8%2% 2%
Increased
bandwidth and
capacity
High data-
carrying
capacity
Higher speed
broadband
conferencing
Low signal loss Services for
remote workers
Immunity to
electrical noise
Fibre networks
are inexpensive
Other Don’t know
Total National Provider Independent Provider
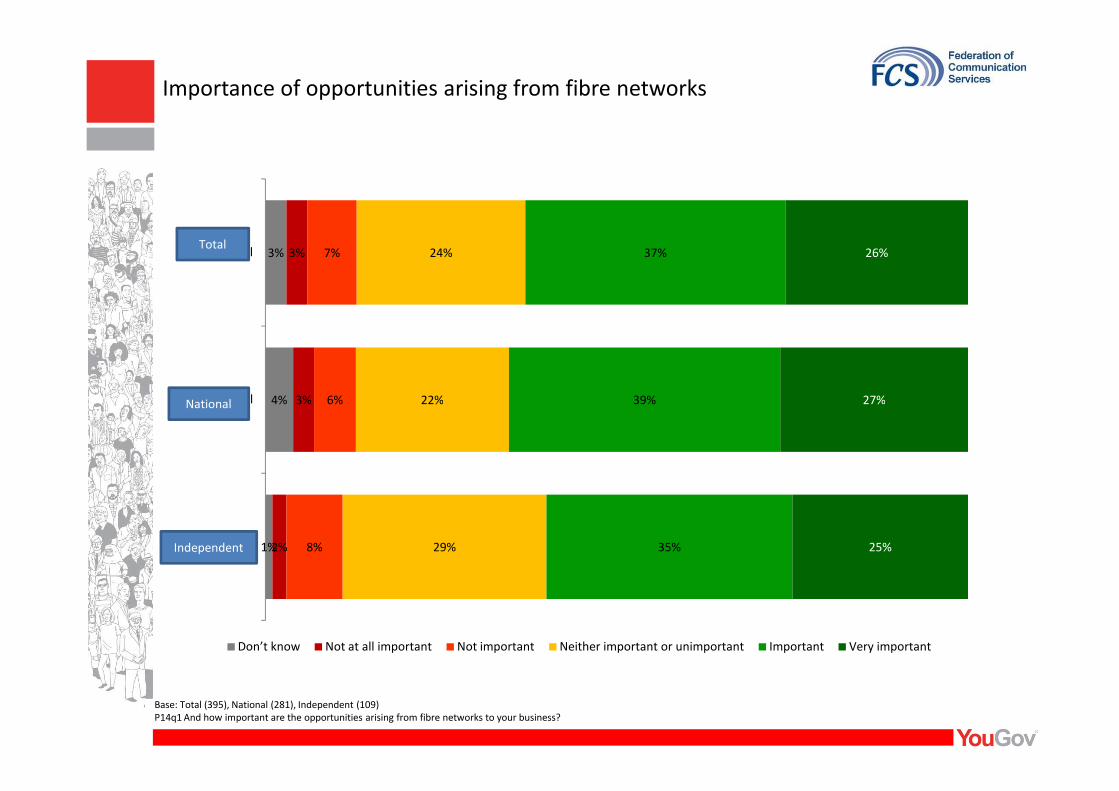
3%
4%
3%
3%
7%
6%
24%
22%
37%
39%
26%
27%
Total
National
Total
National
Importance of opportunities arising from fibre networks
Base: Total (395), National (281), Independent (109)
P14q1 And how important are the opportunities arising from fibre networks to your business?
4%
1%
3%
2%
6%
8%
22%
29%
39%
35%
27%
25%
National
Independent
Don’t know Not at all important Not important Neither important or unimportant Important Very important
National
Independent

2%
6%
34%
3%
12%
4%
4%
18%
7%
5%
30%
31%
28%
22%
11%
59%
12%
13%
Traditional voice services
Voice-over Internet Protocol (VoIP)
Other
2%3%3% 5% 31% 57%Traditional voice services
Total
Importance of access to certain types of services
Base: Total (517), National (366), Independent (141)
P15Q1 How important is it that you have access to the following services for your business ?
7%
34%
12%
4%
16%
8%
30%
30%
24%
11%
11%
14%
Voice-over Internet Protocol (VoIP)
Other
1%
5%
33%
2%
12%
6%
6%
19%
5%
6%
30%
33%
21%
17%
12%
62%
17%
11%
Traditional voice services
Voice-over Internet Protocol (VoIP)
Other
Don’t know Not at all important Not important Neither important or unimportant Important Very important
National
Independent

6%
5%
10%
10%
3%
3%
8%
7%
16%
16%
35%
35%
21%
23%
Total
National
Total
National
Willingness to use internet based or VoIP services
Base: Total (517), National (366), Independent (141)
P16Q1 And how willing would you be to use an internet based or VoIP service?
5%
6%
10%
10%
3%
4%
7%
10%
16%
16%
35%
36%
23%
18%
National
Independent
N/A We already do Don’t know Very unwilling Unwilling Neither willing or unwilling Willing Very willing
National
Independent

Moving to another service provider

Base: Total (517), National (366), Independent (141)
P18q1 Have you ever attempted to move to another provider?
35%
63%
2%
Yes, I have
No, I haven’t
Don’t know
33%
65%
2%
Yes, I have
No, I haven’t
Don’t know
40%
58%
1%
Yes, I have
No, I haven’t
Don’t know
Total National Independent
Moving to another service provider
Base: Total (179), National (121), Independent (56)
P19q1 And have you ever actually moved to another provider?
62%
37%
1%
Yes, I have
No, I haven’t
Don’t know 62%
36%
2%
Yes, I have
No, I haven’t
Don’t know 61%
39%
0%
Yes, I have
No, I haven’t
Don’t know
Total National Independent
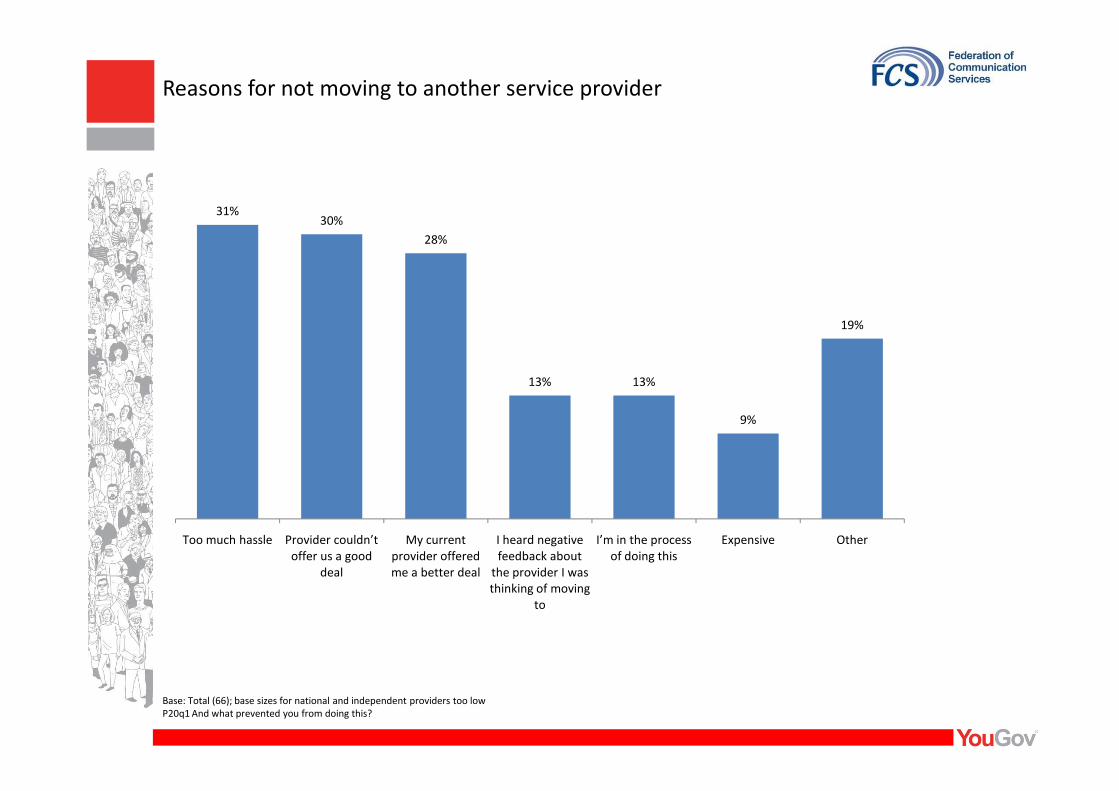
31%30%
28%
13% 13%
19%
Reasons for not moving to another service provider
Base: Total (66); base sizes for national and independent providers too low
P20q1 And what prevented you from doing this?
9%
Too much hassle Provider couldn’t
offer us a good
deal
My current
provider offered
me a better deal
I heard negative
feedback about
the provider I was
thinking of moving
to
I’m in the process
of doing this
Expensive Other