smif semi annual report june 2015
DESCRIPTION
This report gives the performance of the analysts in a single academic year.TRANSCRIPT

University of South FloridaMuma College of Business
Semi-Annual Report2015

University of South FloridaMuma College of Business
1
PROSPECTUS
The Student Managed Investment Fund is a sub-portfolio of the overall portfolio of assets managed by the University of South Florida (USF) Foundation. The Fund is expected to perform in a manner consistent with the performance of a focused equities fund with a time horizon of 3-5 years. Diversification across all equity markets and/or asset classes is not an objective.
INVESTMENT STRATEGY AND GUIDELINES
The Fund will invest exclusively in US equities, ADRs, and near cash assets such as money market funds or securities.
Investments in US equities and ADRs should be consistent with an expected holding period of 3-5 years at the time an investment is made.
This is not to imply that any stocks purchased must be held for the complete term.
The Fund may invest in large-cap stocks ($10 billion + market cap), mid-cap stocks ($2-10 billion market cap), small cap stocks ($300 million to $2 billion market cap) and micro cap stocks ($100 million - $300 million).
Stocks may or may not pay dividends. Stocks may be in any industry group as defined in the Industry Classification Benchmark (ICB) system. Short-selling is prohibited. Leverage will not be used to magnify returns. Derivatives will not be used.
The Fund’s assets may be invested in individual securities as defined above or in the Dreyfus S&P 500 Index Fund. Any cash that is not in the S&P 500 Index fund or invested in the stocks will be swept into the Foundation’s cash sweep vehicle, the Dreyfus Government Cash Management Fund.
The maximum investment in the equity of a single issuer is 10% of fund assets at the time of the investment. Shares held in the fund’s core equity index fund are not counted against this limit.
The maximum investment in the stocks of a single industry (one of the 10 defined in the Industry Classification Benchmark (ICB) System) is 25% of fund assets. This constraint is binding on individual stock purchases that would otherwise exceed the allowable maximum. Shares held in the fund’s core equity index fund are not counted against this limit.
Students present their best stock investment ideas to members of the Student Managed Investment Fund Advisory Board/Outside Advisors Group and selected faculty. Following the presentation, the floor is open for questions that the students are expected to answer in an accurate, thorough manner. Once the discussion is over, a vote determines whether the recommended stock will be purchased.
The decision to sell a holding is handled in a similar manner.
SMIF Holdings (Active)
Vasco Data Security 9.37%
CSX Corp. 9.31%
Omega Protein Corp. 9.23%
Under Armour 8.93%
Packaging Corp of America 8.82%
Comerica 8.64%
EMC 8.60%
Bank of New York Mellon 6.80%
Precision Castparts Corp 5.10%
Vulcan Materials Co. 4.45%
ARMH 4.39%
Independence Realty Trust 4.07%
Restoration Hardware 4.02%
The Hershey Co. 4.00%
Inventure Foods Inc. 3.88%
Fund Characteristics(As of May 2015)
2015 Annual Return (Entire Portfolio)
1.80%
2015 Annual Return(Active Portfolio)
6.53%
2015 Benchmark Return 3.3%
Value as of 4/30/2015 $404,670
Sharpe Ratio Performance
SMIF Portfolio .93
Benchmark .67
Out performance 37%

2University of South FloridaMuma College of Business
SMIF HISTORICAL PERFORMANCE
A new addition to this report is the SMIF’s historical performance versus the benchmark (S&P 500). Since the fund has started it has outperformed the benchmark on a dollar-weighted basis in all years except for its first year of existence in 2012. This displays the analysts abilities to find undervalued securities using sound fundamental analysis along with detailed market, industry and economic research to fuel their valuation models.
SMIF PERFORMANCE (YTD)
The students analysts have outperformed the benchmark in 2015, based on multiple metrics. The SMIF has a better Sharpe ratio than the S&P, which measures the risk adjusted return of the portfolio. It has outperformed the benchmark by 32% year to date. In the first 5 months of 2015 the SMIF also has a positive alpha. The alpha is a two levered calculation that factors in the excess return versus the market and the amount of volatility the securities within the SMIF have seen.
These measures are indicative of the analysts keen sense on portfolio management and sell discipline. Selling the winners high and letting go of the losers before the stock plummets further.
Looking out into the second half of 2015 we expect the fund to continue to outperform the benchmark on a risk adjusted basis because of the sound securities we have selected.

University of South FloridaMuma College of Business
3
SECTOR AND INDUSTRY EXPOSURE
Sector Breakdown
As of May 1st, 2015 the fund has lowered its exposure to well covered stocks that have been inflated from over bullish street expectations. The fund is 10% weighted in industrials, 7% in financials, 8% in technology, 9% in consumer goods and 1% in consumer services. These sectors were defined by the Industry Classification Benchmark (ICB) System, as it is the system used to ensure the fund is within its mandate. The fund has taken a larger position in the S&P 500 (63%) as many large cap securities have grown overvalued and the analyst don’t think they will outperform the benchmark in 2015.
Industry Breakdown
The SMIF analysts continue to focus on diversity when finding new securities to invest in. The largest portion of our active portfolio stems from food products (6.4% of entire portfolio). This is made up of Omega Protein (OME), Hershey (HSY) and Inventure Foods (SNAK). HSY is only a $6,000 position and is mainly in the portfolio to hedge against a market correction as it is unlikely to lose value. OME is a small-cap and the largest position in the portfolio; with a market value of $14,800. SNAK sells frozen products and healthy snack alternatives. These stocks are generally less risky than the broader market because of the predictability of their business. Other risk averse investments by the student analysts include a Multi-Family REIT; Independence Realty Trust (1.5%), the bank Comerica (3%) and Asset management firm Bank of New York Melon (2.4%). A position above 3% of the portfolio represents the security was a full buy ($12,000) whereas a half buy ($6,000) is represented by 1.5-2.5%. This is based on the analysts ability to sell the idea as well as how risky the board perceived the investment to be.
4University of South FloridaMuma College of Business
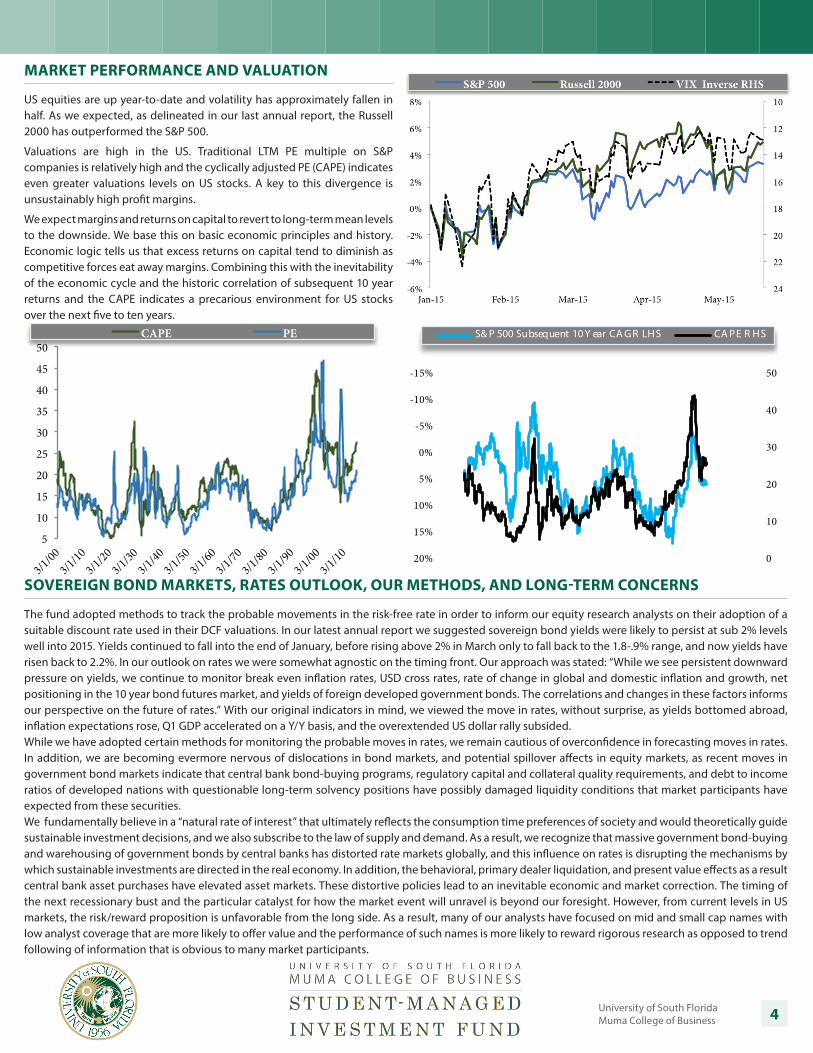
MARKET PERFORMANCE AND VALUATION
US equities are up year-to-date and volatility has approximately fallen in half. As we expected, as delineated in our last annual report, the Russell 2000 has outperformed the S&P 500.
Valuations are high in the US. Traditional LTM PE multiple on S&P companies is relatively high and the cyclically adjusted PE (CAPE) indicates even greater valuations levels on US stocks. A key to this divergence is unsustainably high profit margins.
We expect margins and returns on capital to revert to long-term mean levels to the downside. We base this on basic economic principles and history. Economic logic tells us that excess returns on capital tend to diminish as competitive forces eat away margins. Combining this with the inevitability of the economic cycle and the historic correlation of subsequent 10 year returns and the CAPE indicates a precarious environment for US stocks over the next five to ten years.
SOVEREIGN BOND MARKETS, RATES OUTLOOK, OUR METHODS, AND LONG-TERM CONCERNS
The fund adopted methods to track the probable movements in the risk-free rate in order to inform our equity research analysts on their adoption of a suitable discount rate used in their DCF valuations. In our latest annual report we suggested sovereign bond yields were likely to persist at sub 2% levels well into 2015. Yields continued to fall into the end of January, before rising above 2% in March only to fall back to the 1.8-.9% range, and now yields have risen back to 2.2%. In our outlook on rates we were somewhat agnostic on the timing front. Our approach was stated: “While we see persistent downward pressure on yields, we continue to monitor break even inflation rates, USD cross rates, rate of change in global and domestic inflation and growth, net positioning in the 10 year bond futures market, and yields of foreign developed government bonds. The correlations and changes in these factors informs our perspective on the future of rates.” With our original indicators in mind, we viewed the move in rates, without surprise, as yields bottomed abroad, inflation expectations rose, Q1 GDP accelerated on a Y/Y basis, and the overextended US dollar rally subsided. While we have adopted certain methods for monitoring the probable moves in rates, we remain cautious of overconfidence in forecasting moves in rates. In addition, we are becoming evermore nervous of dislocations in bond markets, and potential spillover affects in equity markets, as recent moves in government bond markets indicate that central bank bond-buying programs, regulatory capital and collateral quality requirements, and debt to income ratios of developed nations with questionable long-term solvency positions have possibly damaged liquidity conditions that market participants have expected from these securities. We fundamentally believe in a “natural rate of interest” that ultimately reflects the consumption time preferences of society and would theoretically guide sustainable investment decisions, and we also subscribe to the law of supply and demand. As a result, we recognize that massive government bond-buying and warehousing of government bonds by central banks has distorted rate markets globally, and this influence on rates is disrupting the mechanisms by which sustainable investments are directed in the real economy. In addition, the behavioral, primary dealer liquidation, and present value effects as a result central bank asset purchases have elevated asset markets. These distortive policies lead to an inevitable economic and market correction. The timing of the next recessionary bust and the particular catalyst for how the market event will unravel is beyond our foresight. However, from current levels in US markets, the risk/reward proposition is unfavorable from the long side. As a result, many of our analysts have focused on mid and small cap names with low analyst coverage that are more likely to offer value and the performance of such names is more likely to reward rigorous research as opposed to trend following of information that is obvious to many market participants.
5
10
15
20
25
30
35
40
45
50
3/1/00
3/1/10
3/1/20
3/1/30
3/1/40
3/1/50
3/1/60
3/1/70
3/1/80
3/1/90
3/1/00
3/1/10
CAPE PE
0
10
20
30
40
50-15%
-10%
-5%
0%
5%
10%
15%
20%
S& P 500 Subsequent 10 Y ear CA GR LHS CA PE R HS

University of South FloridaMuma College of Business
5
DOLLAR AND ECONOMYAfter a build-up in expectations for a rate hike from the Fed, the promise of a hike continues to be pushed further out. The main reasons are low inflation and low earnings growth. The strength of the US dollar and other weakening economic data further complicate the Fed’s decision to raise the policy rate. Recently, YoY export growth has gone negative for the first time since the last recession. Our analysis of historic growth and inflation data show that these indicators have never been this low during a Fed tightening cycle. Retail sales, merchant sales, and earnings growth have all decelerated significantly. The slowdown in these economic indicators transpired while commodity prices including gasoline prices have fallen significantly over the past six to nine months. This drop was expected to boost consumption. If these lower prices boosted consumption, we think these numbers could have slowed even more in the absence of said price declines. We are currently far into an economic up-cycle, by historical standards, jobless claims data is at historically low levels, the stock market is at an all time high with high valuations and high margins, and key data are slowing. Meanwhile the policy rate is still at 0-.25% and government debt to GDP is roughly 100%.
A confluence of our models indicate that the probability of economic and market risks are much higher than what is currently priced into the market. We proceed with caution.
Stock markets move with central bank asset purchases and with expectations of said purchases.
0.00
0.10
0.20
0.30
0.40
0.50
0.60
0.70
0.80
0.90
-3%
2%
7%
12%
17%
22%
27%
32%
37%
May
-10
Aug-
10
Nov
-10
Feb-
11
May
-11
Aug-
11
Nov
-11
Feb-
12
May
-12
Aug-
12
Nov
-12
Feb-
13
May
-13
Aug-
13
Nov
-13
Feb-
14
May
-14
Aug-
14
Nov
-14
Feb-
15
May
-15
Fed Balance Sheet LHS S&P 500 YoY LHS YoY S&P 500 6M0 Average LHS Correlation to Present RHS
7%
12%
17%
22%
27%
32%
0%
10%
20%
30%
40%
50%
Feb-
13
Apr-
13
Jun-
13
Aug-
13
Oct
-13
Dec
-13
Feb-
14
Apr-
14
Jun-
14
Aug-
14
Oct
-14
Dec
-14
Feb-
15
Apr-
15
Fed Balance Sheet YoY LHS YoY S&P 500 6 MO Average RHS YoY S&P 500 RHS
65
75
85
95
105
115
125 -22%
-12%
-2%
8%
18%
1993 1995 1998 2001 2004 2007 2010 2012
Export YoY Growth lhs US Dollar Index: Major Currencies rhs
1958-1959 6.1% 4.9% 1.1% 1.3% -18 109 27 -221961-1966 5.5% 5.9% 1.8% 1.7% -15 7 1 101967-1969 4.1% 4.1% 5.0% 4.6% -12 3 23 391972-1974 2.9% 4.0% 8.1% 7.0% -110 -41 101 841977-1980 4.0% 4.3% 10.0% 9.3% -28 -15 70 681980-1981 4.3% 1.6% 10.2% 10.9% -77 155 60 -1021983-1984 7.4% 6.7% 4.4% 3.8% -22 89 37 121987-1989 4.1% 4.0% 4.5% 4.3% 4 12 13 261994-1995 3.2% 3.7% 2.7% 2.8% -66 -3 -7 41999-2000 4.1% 4.6% 3.5% 3.0% -45 -12 38 292004-2007 2.7% 2.8% 3.1% 3.1% 1 -21 0 -4
Average For All 4.4% 4.2% 5.0% 4.7% -35 26 33 131958-1959 8.3% 5.6% 1.4% 1.3% 120 159 13 11961-1966 5.2% 6.0% 1.7% 1.3% 58 0 13 01967-1969 3.1% 4.2% 5.1% 4.6% -67 -12 -6 261972-1974 3.7% 5.0% 8.8% 6.7% -142 -59 81 1131977-1980 2.1% 4.7% 9.7% 8.7% -3 -21 89 811980-1981 7.4% 1.7% 10.2% 10.6% 86 156 -161 -911983-1984 7.9% 7.4% 4.0% 4.0% -61 124 35 121987-1989 4.0% 4.2% 4.6% 4.3% -86 -10 -7 231994-1995 3.1% 3.8% 2.6% 2.7% -69 -5 12 21999-2000 4.2% 4.6% 3.1% 3.1% 92 -10 93 142004-2007 3.1% 3.1% 3.1% 3.0% 26 -22 -80 -1
Median For All 4.0% 4.6% 4.0% 4.0% -3 -10 13 12
Current 2.2% 2.4% -2.3% 0.7% -268 -32 -215 -94
Tigh
teni
ng C
ycle
s A
vera
ges
Tigh
teni
ng C
ycle
s M
edia
ns
CPI
Q/Q ∆ bps Y/Y ∆ bps Q/Q ∆ bps Y/Y ∆ bpsQ/Q % ∆ Y/Y % ∆
GDP CPI GDP
Q/Q % ∆ Y/Y % ∆
-5%
0%
5%
10%
15%
Apr-10
Nov-10
Jun-11
Jan-12
Aug-12
Mar-13
Oct-13
May-14
Dec-14
Merchant Wholesalers Sales, YoY, SA
0%
2%
4%
6%
8%
10%
1.0%
1.5%
2.0%
2.5%
3.0%
Apr-10
Dec-10
Aug-11
Apr-12
Dec-12
Aug-13
Apr-14
Dec-14
Earnings Production & Nonsupervisory, YoY, SA LHS Retail Sales Ex. Autos. YoY, SA RHS

6University of South FloridaMuma College of Business
EMPLOYMENT INDICATORS
The net of initial jobless claims to job openings is at its lowest level in the last 15 years, showing signs of an improving economy and a greater probability of a top in the strength of the job market.
Real gross domestic product (GDP) is officially reported as nominal GDP minus the “deflator.” The deflator is a statistical index of prices developed to represent an aggregate of prices across the economy. Modern day economists refer to positive changes in this index as inflation and negative changes as deflation. However, following the sound doctrines of monetary theorists such as Ludwig von Mises, and taking the Webster’s dictionary definition of inflation circa pre-1980s, we account for inflation or deflation by measuring the change in the money supply. Therefore, GDP growth is the growth in NGDP minus the change in the M1 money supply. By substituting changes in M1 for changes in an aggregated measure of prices, our adjusted calculation captures the ultimate origination of inflation, changes in the money supply, and adjusts NGDP accordingly. We apply this method of measuring growth in the economy and observe our adjusted measure of GDP has registered a negative 5 year CAGR for over half a decade.
From a long-term perspective, we notice a sustained downtrend in earnings growth, NGDP growth, and the Fed Funds rate. The US economy, has undergone a structural shift to lower growth. Meanwhile, the long-term trend in debt has gone the opposite direction, creating a compounding issue of higher debt burdens relative to income growth and the necessity for lower interest rates to service the debt load.
These output related factors suggest that labor markets have put the Federal Reserve in a box. A headline unemployment figure reaching 5% pressures a public relations equivalent of a rate hike from the Fed, while the economic fundamentals suggest that the economy is vulnerable to a cyclical downturn within a structural slowing of income growth. As a result, even if the housing market performs well and the global economy improves from its current state, we do not expect the fed to raise the policy rate aggresively or in a manner such as the mid 2000s Greenspan hikes of consistent 25 basis point raises. Monetary policy may take a form similar to the 1960-70s push-pull policies that ultimately accomodated the inflationary wishes of political influencers and resulted in a precious metals bubble and the threat of a collapse of confidence in the US currency. From a “policy normalization” perspective, the consensus normalization view is flawed, as the structural capability of the US economy to sustain greater than 4% NGDP growth is highly questionable, while debts are too high for the economy to digest higher interest rates without such growth.
The velocity of money, which multipled by the money supply and relative to the amount of goods in the economy indicates the overal level of prices, along with earnings growth levels support our view of subdued hawkishness out of the Fed.

University of South FloridaMuma College of Business
7
0%
2%
4%
6%
8%
10%
12%
14%
16%
18%
0%
2%
4%
6%
8%
10%
1980
1981
1983
1985
1987
1989
1991
1993
1995
1997
1999
2001
2003
2004
2006
2008
2010
2012
2014
Average Hourly Earnings of Production and Nonsuper.10-Year T
4.0%
5.0%
6.0%
0%
5%
10%
15%
20%
1980
1982
1983
1985
1986
1988
1990
1991
1993
1994
1996
1997
1999
2001
2002
2004
2005
2007
2009
2010
2012
2013
3-Month Treasury BillPersonal saving as a percentage of disposable personal incomeConsumer Debt Service Payments as a Percent of Disposable Personal Income
48
50
52
54
56
58
60
1.0
1.5
2.0
2.5
3.0
3.5
4.0
Jan-
10
May
-10
Sep-
10
Jan-
11
May
-11
Sep-
11
Jan-
12
May
-12
Sep-
12
Jan-
13
May
-13
Sep-
13
Jan-
14
May
-14
Sep-
14
Jan-
15
10 Year Yield lhsISM Manufacturing: PMI Composite Index rhs
EMPLOYMENT INDICATORS
Arguably the yield on the 10-year treasury has been signaling our forecast about the Fed, as it has moved along with economic data such as PMIs over the short-term and earnings growth over the long-term.
The graph in the top right corner supports our view on the severity of the debt load relative to income growth and the reliance on low interest rates. With zero interest rate policy intact, consumer debt service payments as a percent of disposable income has bottomed and started to turn upwards. This poses another risk to sustained Fed tightening beyond approximately 100 bps.
15,000
20,000
25,000
30,000
35,000
40,000
0
1
2
3
4
5
6
1919
1920
1921
1922
1923
1924
1925
1926
1927
1928
1929
1930
1932
1933
1934
1935
1936
1937
1938
1939
Money Supply, Total, Million Dollars rhsLong-term U.S.G overnment Bonds, Percent Per Annum lhsShort-term U.S.Securities, Percent Per Annum lhs
0
5
10
15
20
25
1929193019311932193319341935193619371938193919401941
Nati onalSavingRate(NI PA )_Net_Ce126_Percent
HISTORICAL COMPARISON
The two charts on the bottom right provide a history lesson and a comparison of today’s economic recovery and stock market rally to the rally after the 1929 stock market crash and the onset of “The Great Depression.” Then the stock market bottomed in 1932 and topped out by 1937 before declining once more. The S&P 500 did not reclaim its 1937 peak until the late 1940s. Generally, the US was in better shape on a couple of fronts. It had a much higher savings rate, was an exporting powerhouse, and had a relatively smaller government as a percent of the productive parts of he economy. In 1933, the Fed loosened policy (see money supply and short-term rates), and the stock market rallied along with a relatively recovering economy. However, by 1940 the unemployment rate was still in the mid to high teens. While the money supply continued expanding and short-rates stayed at zero the stock market was still unable to sustain its rally off the 1933 lows.
While the comparison is not perfect and the variables are vast and complex, today the market has rallied even past the prior 2008 peak in a similar time frame to the 1930s rally, while the underemployment rate is still above 12%, short-rates remain at zero, and the Fed has paused its money printing campaign of long-duration asset purchases.
The main conclusion we take from the 1937 top is that low rates and money printing do not necessarily save a stock market, especially when economic fundamentals remain quite weak.

University of South FloridaMuma College of Business
8
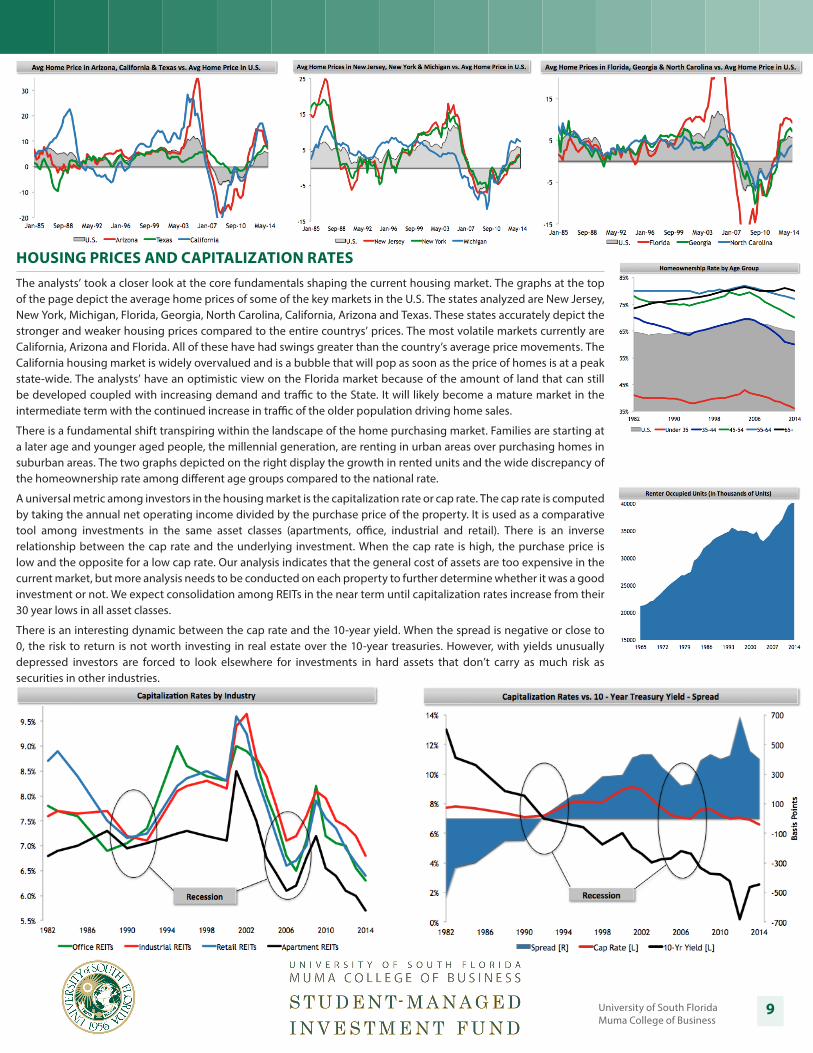
The data depicted on the graphs to the right and left indicate that the housing industry has recovered to a point and we expect slower steady growth going forward.
HOUSING MARKET LANDSCAPE
A major indicator of the overall health and sustainability of the domestic economy is the housing industry. The house market is highly cyclical and there are many data points that the analysts have identified to track the success of the industry. Economists, builders, developers and Wall Street analysts remain bullish on the housing market and believe it has not fully recovered from the recession. We believe in a more slow and steady recovery due to external economic problems and an environment with interest rates increasing at a slow-nominal pace. There are a few factors that we would like to see more improvement from before we become more bullish and optimistic on the housing recovery.
Real median household income has not seen an improvement above 1% from the previous year since pre-recsession. This is related to wage growth, which has remained stagnate despite an improving unemployment rate. Builders and analysts continue to point to pent-up demand for new homes, however new home starts and new homes sold have already seen robust growth from 2010-2013 and we remain skeptical this high growth can continue. We believe the housing industry will perform well in the next 1-2 years and then steady off as it will reach a mature point. The analysts’ are more optimistic on the housing market in secondary markets as they are more undeveloped and under appreciated by the market than primary markets.
Mortgage payments as a % of disposable income is at its lowest level since before 1984. This speaks to the tight policies financial institutions have adopted since the mortgage crisis in 2004-2006.
University of South FloridaMuma College of Business
9
HOUSING PRICES AND CAPITALIZATION RATESThe analysts’ took a closer look at the core fundamentals shaping the current housing market. The graphs at the top of the page depict the average home prices of some of the key markets in the U.S. The states analyzed are New Jersey, New York, Michigan, Florida, Georgia, North Carolina, California, Arizona and Texas. These states accurately depict the stronger and weaker housing prices compared to the entire countrys’ prices. The most volatile markets currently are California, Arizona and Florida. All of these have had swings greater than the country’s average price movements. The California housing market is widely overvalued and is a bubble that will pop as soon as the price of homes is at a peak state-wide. The analysts’ have an optimistic view on the Florida market because of the amount of land that can still be developed coupled with increasing demand and traffic to the State. It will likely become a mature market in the intermediate term with the continued increase in traffic of the older population driving home sales.
There is a fundamental shift transpiring within the landscape of the home purchasing market. Families are starting at a later age and younger aged people, the millennial generation, are renting in urban areas over purchasing homes in suburban areas. The two graphs depicted on the right display the growth in rented units and the wide discrepancy of the homeownership rate among different age groups compared to the national rate.
A universal metric among investors in the housing market is the capitalization rate or cap rate. The cap rate is computed by taking the annual net operating income divided by the purchase price of the property. It is used as a comparative tool among investments in the same asset classes (apartments, office, industrial and retail). There is an inverse relationship between the cap rate and the underlying investment. When the cap rate is high, the purchase price is low and the opposite for a low cap rate. Our analysis indicates that the general cost of assets are too expensive in the current market, but more analysis needs to be conducted on each property to further determine whether it was a good investment or not. We expect consolidation among REITs in the near term until capitalization rates increase from their 30 year lows in all asset classes.
There is an interesting dynamic between the cap rate and the 10-year yield. When the spread is negative or close to 0, the risk to return is not worth investing in real estate over the 10-year treasuries. However, with yields unusually depressed investors are forced to look elsewhere for investments in hard assets that don’t carry as much risk as securities in other industries.

10University of South FloridaMuma College of Business
NEW POSITIONS
CompanyDate
BoughtPrice
BoughtPrice
(As of 5/1/15)Yield
Gain/Loss
CapitalGain
Total Return
Under Armour (UA) 2/10/2015 $73.34 $77.96 - $4.03 $645 6.2%
Omega Protein Corp (OME) 3/1/2015 $10.91 $12.78 - $.83 $907 17.1%
Restoration Hardware (RH) 3/1/2015 $90.64 $88.72 - ($1.92) ($154) (2.4%)
Arm Holdings (ARMH) 4/1/2015 $48.33 $52.32 - $3.39 $459 7.9%
Vasco Data Security (VDSI) 4/1/2015 $21.87 $25.76 - $3.89 $2,232 18.5%
Independence Realty Trust (IRT) 5/1/2015 $9.12 - 7.70% - - -
Inventure Foods Inc. (SNAK) 5/1/2015 $9.77 - - - - -
Vulcan Materials (VMC) 5/1/2015 $86.11 - - - - -
Vasco Data Security (VDSI) 5/1/2015 $25.36 - - - - -
NEW POSITIONSThe spring 2015 analysts had eight securities purchased. These stocks were not held to any specific investment thesis, but instead the analysts’ were encouraged to develop their own philosophies. The most common philosophy has been to invest in small and mid-cap securities that are under covered by the street. The lack of information available to the market create a mispriced and misunderstood security with a greater margin of safety and likelihood of outperforming the benchmark in our investment horizon. Securities that fit this philosophy are OME, VDSI, SNAK and IRT. This year marked the first time the fund purchased an additional $6,000 in a security after the analysts’ updated guidance after an earnings report (VDSI).
Under Armour (UA) - Under Armour was purchased because of its ability to see robust growth in international markets coupled with its ability to gain market share in the footwear industry. UA will continue to outperform the benchmark as it transitions into a global lifestyle brand; it is the Nike of the future.
Omega Protein Corp (OME) - Omega Protein is a pure play on consumers living healthier lifestyles. It produces fish oil used in aquaculture by catching menhaden and has an 85% share of the menhaden catch market providing it with a wide moat. Sales from its nutritional supplements segment will counter seasonality in its animal segment. The combined portfolio will allow vertical integration, improve margins and drive the security to outperform the benchmark over its investment horizon.
Restoration Hardware (RH) - Restoration Hardware is on the forefront of revolutionizing the retail experience, with its mega-sized galleries elegantly displaying an interior-design quality assortment. RH is the best growth opportunity in home furnishing retail as our analysts expect earnings to double in the investment horizon.
Arm Holdings (ARMH) - ARM Holdings is the leading designer of processor chip technology for mobile devices. It will continue to benefit from the adoption of mobile devices globally as it has a dominant footprint in the market as well as a war-chest of intellectual property. ARMH gives the fund exposure to the proliferation of micro-processors as innovations such as The Internet of Things begin to accelerate.
Vasco Data Security (VDSI) - Vasco Data Security is a pure play on cyber security. The number of annual data breaches have doubled since 2013; VDSI provides user two-step authentication systems via cloud, mobile and hardware based solutions. It provides solutions to 50 of the top 100 global financial firms and governments from all over. VDSI will leverage its expertise in security for financial firms into providing healthcare and enterprise firms the same high quality systems.
Independence Realty Trust (IRT) - Independence Realty Trust is a Multi-Family Real Estate Investment Trust (REIT). There is a fundamental shift within the industry as millennials are starting families later in life, seeking properties in secondary markets and lacking the funds, credit and desire to purchase new home. All of these factors will directly benefit IRT and lead to its out performance of the benchmark in its investment horizon.
Inventure Foods Inc (SNAK) - Inventure Foods will benefit from the increasing demand for healthier snacks. Their large distribution network and strong portfolio of brand names will drive the out performance of the security versus the benchmark.
Vulcan Materials (VMC) - Vulcan Materials provides cement and asphalt materials to commercial construction. The increasing infrastructure spending and the need for road improvements will drive VMC’s stock.

University of South FloridaMuma College of Business
11
DENIED POSITIONS
The denied positions are stocks that have been rejected by the advisory board. Keeping track of the denied positions is essential to making sure the correct decision was made and the SMIF did not miss out on positive alpha positions. The denied positions are stocks pitched by two different analyst groups.
During the fall of 2014 there were five positions out of the six pitched that were denied. Of the companies that the student analysts pitched in the spring of 2015, the advisory board voted a buy on 8 out of the 12 stocks pitched.
Many factors influenced the rejections, including the inability to portray the investment thesis, mitigation of risks associated with the company, and lack of conviction in presenting the stocks.
BIGGEST MOVERS OF 2015
To analyze the stocks that had the best performance for the fund this year we looked only back to the beginning of 2015. Four our of the five top performers were added to the fund after January 1 of 2015. Vasco Data Security was initially purchased a month ago and has an 18.5% return for the fund. Omega Protein was purchased March 1st and has had a 17% return since its inception. Two other out performers that were purchased this year were ARM Holdings (7.2% return) and Under Armour (6.2% return). The other top performer was Bank of New York Melon, which has a 7.5% return year-to-date. In comparison the S&P 500 has a year-to-date return of 3.3%.
TOP PERFORMERS (YTD)
CompanyYTD
Return
Vasco Data Security (VDSI) 18.5%
Omega Protein Corp (OME) 17.1%
Bank of New York Melon (BK) 7.5%
ARM Holdings (ARMH) 7.2%
Under Armour (UA) 6.2%
DENIED POSITIONS (2014 - 2015)
Company Date Pitched PricePrice
(5/1/15)Yield
Gain/Loss
TotalReturn
Lifepoint (LPNT) 10/7/14 $69.83 $71.91 - $2.08 2.98%
Kaiser (KALU) 10/7/14 $73.38 $71.02 2% $2.36 3.22%
Tangoe (TNGO) 10/7/14 $13.78 $13.03 - $.75 5.44%
Core Laboratories (CLB) 11/6/14 $136.44 $119.70 2% $16.01 11.8%
NCR (NCR) 11/6/14 $28.12 $29.14 - $1.02 3.63%
Brookdale (BKD) 1/29/15 $33.92 $36.00 - $2.08 6.13%
Michael Kors (KORS) 1/29/15 $72.47 $61.80 - $10.67 14.72%
Headwaters (HW) 2/26/15 $16.42 $19.48 - $3.63 18.6%
Scripps Network (SNI) 3/17/15 $71.74 $66.14 1.4% $5.60 7.81%

12University of South FloridaMuma College of Business
SOLD POSITIONS
The Fund has put a bigger emphasis of selling our winning stocks or ones that the students do not believe will outperform the market in the next 3 - 5 years. Below is a brief description on why the above stocks were sold.
Synaptics (SYNA) - The fund exited half of its position in Synaptics over the summer. This was because the stock saw a significant run up. On a relative valuation analysis the stock was overvalued at a price of $83. Therefore, the fund exited half of its position to gain a significant alpha and a return of 35%.
Hi - Crush LP (HCLP) - The SMIF received its highest return from HCLP. This was a pure play on the fracking process. High - Crush makes the highest quality sand needed in the complex process. In 4 months the stock had a 93% return, the analysts saw this as a sell opportunity.
Conversant (CNVR) - Another big winner for the fund was CNVR. Conversant (formerly Value Click) provides online advertising campaigns and programs for advertisers trying to reach consumers globally. The firm was bought out on 9/12/14 and the company paid a premium for the public advertising firm. This resulted in the SMIF receiving a 65% return over the investment period.
L. Brands (LB) - L. Brands operates as a specialty retailer of women’s lingerie and other apparel, personal care and beauty products. Its stores include Victoria’s Secret, Bath & Body Works and PINK. LB is one of the best companies in women’s apparel. The fund exited its position in LB after the stock saw a significant run up. On a P/E and EV/EBITDA Multiple valuation the stock was overvalued and would see a multiple contraction. Therefore, the fund sold its position in LB and saw a 31% return from the stock.
Las Vegas Sands (LVS) - LVS has been one of the longest held stocks by the SMIF. Purchased in 2012 as a pure play on gambling / casinos in China. With increased regulation and low GDP growth Sand’s high double digit growth was in jeopardy of falling. Furthermore, the stock was overvalued if it could not see 20% revenue growth year-over-year. This analysis led the fund to exit its position for a total return of 46% over the 2 year span.
Visa (V) - Visa is a payments technology company operates as a retail electronic payments network worldwide. The company facilitates commerce through the transfer of value and information among financial institutions, merchants, consumers, businesses and government entities. After the firm released earnings for the 3rd quarter the stock saw a significant run up. The student analysts saw this as an opportunity to seek a high alpha and reached the conclusion that at the current price Visa will not outperform the benchmark. The SMIF earned a total return of 52%.
SOLD POSITIONS in FALL 2014
CompanyDate Sold
Price Sold
DatePurchased
Price Bought
Dividend Gain/Loss
TotalReturn
Synaptics (SYNA) 6/18/14 $83.76 4/28/14 $61.83 n/a $2,163 35%
Hi-Crush LP (HCLP) 7/25/14 $68.29 2/5/14 $34.80 n/a $5,591 93%
Conversant (CNVR) 9/12/14 $34.80 4/9/14 $20.99 n/a $7,920 65%
L. Brands (LB) 10/28/14 $69.87 4/17/14 $54.27 2.7% $1,856 31%
Las Vegas Sands (LVS) 10/28/14 $60.10 2/9/12 $47.78 2% $2,866 46%
Visa Inc. (V) 11/17/14 $249.94 4/9/13 $165.62 .6% $6.081 52%
University of South FloridaMuma College of Business
13
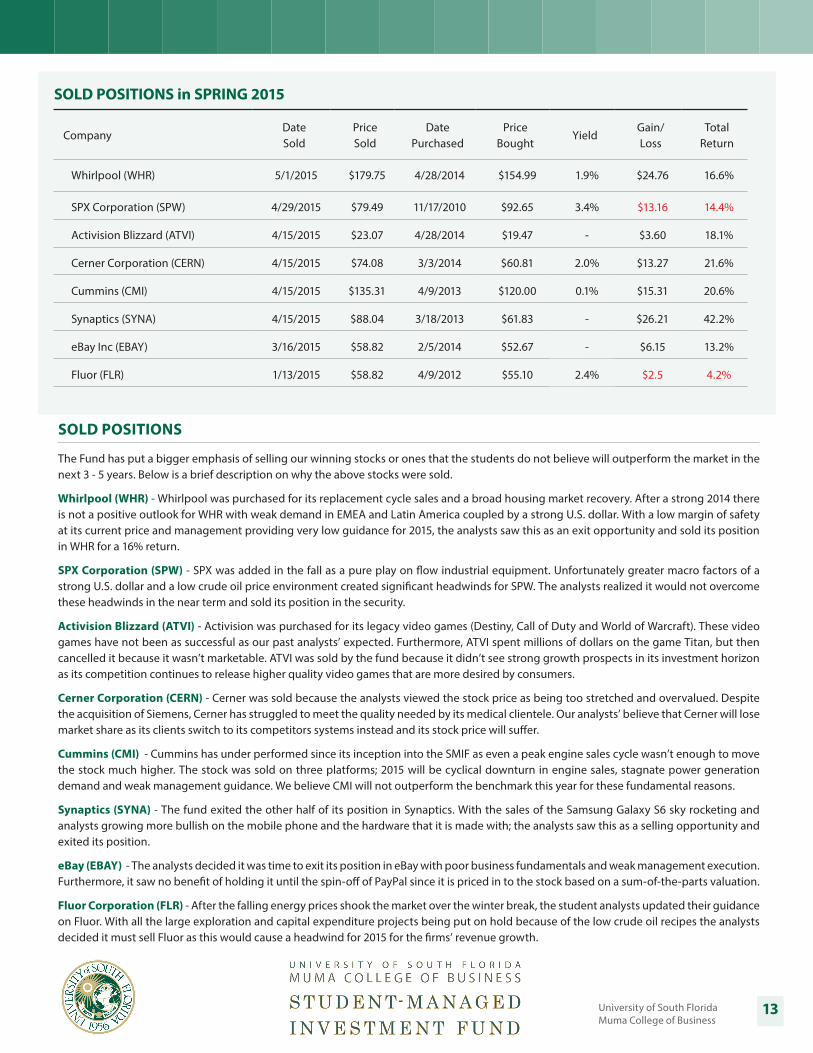
SOLD POSITIONS in SPRING 2015
CompanyDate Sold
Price Sold
DatePurchased
Price Bought
YieldGain/Loss
TotalReturn
Whirlpool (WHR) 5/1/2015 $179.75 4/28/2014 $154.99 1.9% $24.76 16.6%
SPX Corporation (SPW) 4/29/2015 $79.49 11/17/2010 $92.65 3.4% $13.16 14.4%
Activision Blizzard (ATVI) 4/15/2015 $23.07 4/28/2014 $19.47 - $3.60 18.1%
Cerner Corporation (CERN) 4/15/2015 $74.08 3/3/2014 $60.81 2.0% $13.27 21.6%
Cummins (CMI) 4/15/2015 $135.31 4/9/2013 $120.00 0.1% $15.31 20.6%
Synaptics (SYNA) 4/15/2015 $88.04 3/18/2013 $61.83 - $26.21 42.2%
eBay Inc (EBAY) 3/16/2015 $58.82 2/5/2014 $52.67 - $6.15 13.2%
Fluor (FLR) 1/13/2015 $58.82 4/9/2012 $55.10 2.4% $2.5 4.2%
SOLD POSITIONS
The Fund has put a bigger emphasis of selling our winning stocks or ones that the students do not believe will outperform the market in the next 3 - 5 years. Below is a brief description on why the above stocks were sold.
Whirlpool (WHR) - Whirlpool was purchased for its replacement cycle sales and a broad housing market recovery. After a strong 2014 there is not a positive outlook for WHR with weak demand in EMEA and Latin America coupled by a strong U.S. dollar. With a low margin of safety at its current price and management providing very low guidance for 2015, the analysts saw this as an exit opportunity and sold its position in WHR for a 16% return.
SPX Corporation (SPW) - SPX was added in the fall as a pure play on flow industrial equipment. Unfortunately greater macro factors of a strong U.S. dollar and a low crude oil price environment created significant headwinds for SPW. The analysts realized it would not overcome these headwinds in the near term and sold its position in the security.
Activision Blizzard (ATVI) - Activision was purchased for its legacy video games (Destiny, Call of Duty and World of Warcraft). These video games have not been as successful as our past analysts’ expected. Furthermore, ATVI spent millions of dollars on the game Titan, but then cancelled it because it wasn’t marketable. ATVI was sold by the fund because it didn’t see strong growth prospects in its investment horizon as its competition continues to release higher quality video games that are more desired by consumers.
Cerner Corporation (CERN) - Cerner was sold because the analysts viewed the stock price as being too stretched and overvalued. Despite the acquisition of Siemens, Cerner has struggled to meet the quality needed by its medical clientele. Our analysts’ believe that Cerner will lose market share as its clients switch to its competitors systems instead and its stock price will suffer.
Cummins (CMI) - Cummins has under performed since its inception into the SMIF as even a peak engine sales cycle wasn’t enough to move the stock much higher. The stock was sold on three platforms; 2015 will be cyclical downturn in engine sales, stagnate power generation demand and weak management guidance. We believe CMI will not outperform the benchmark this year for these fundamental reasons.
Synaptics (SYNA) - The fund exited the other half of its position in Synaptics. With the sales of the Samsung Galaxy S6 sky rocketing and analysts growing more bullish on the mobile phone and the hardware that it is made with; the analysts saw this as a selling opportunity and exited its position.
eBay (EBAY) - The analysts decided it was time to exit its position in eBay with poor business fundamentals and weak management execution. Furthermore, it saw no benefit of holding it until the spin-off of PayPal since it is priced in to the stock based on a sum-of-the-parts valuation.
Fluor Corporation (FLR) - After the falling energy prices shook the market over the winter break, the student analysts updated their guidance on Fluor. With all the large exploration and capital expenditure projects being put on hold because of the low crude oil recipes the analysts decided it must sell Fluor as this would cause a headwind for 2015 for the firms’ revenue growth.

14University of South FloridaMuma College of Business
Analyst Class Spring 2015
Giovanni Burbano is a senior majoring in finance with a minor in economics. Burbano is a member of the Student Finance Association and is working on a leadership certification through the Certified Student Leadership program. Burbano is a first-generation college student with a passion for security analysis who is pursuing the CFA designation. Burbano grew up in Cali, Colombia, and speaks both English and Spanish.
Haomin Chen is a finance major at the USF. She is also pursuing a minor in accounting. A native of Yantai, China, Chen speaks three languages fluently – Chinese, English, and German. She is also learning French and Spanish. Before coming to the United States two years ago for college, Chen spent a year in Germany studying the German language and literature. Chen was a pianist in the University Orchestra at Beijing International Studies University, where she earned a bachelor’s degree in German language and literature.
Jonnathan De Jesus is a senior majoring in finance with a minor in entrepreneurship. A native of Bayamon, Puerto Rico, he is fluent in English and Spanish. De Jesus, who plays the French horn, enjoys learning how to play a variety of brass instruments. De Jesus placed second in the Investors and Traders Society’s 2013 competition. He aspires to work as a portfolio manager and eventually would like start his own fund.
A native of Denver, Colo., Daniel Dorman spent most of his childhood in Bradenton, Fla. Now a resident of St. Petersburg, Dorman is a senior at USF majoring in finance and management. Dorman is passionate about equity investment and has maintained a paper portfolio for more than two years. Prior to entering the Applied Securities Analysis program, Dorman spent a year as a department manager for Barnes & Noble College, the book retailer’s collegiate division.
Matt Errico has a tremendous work ethic and is a determined and dedicated individual. While attending community college in New Jersey, he worked over 40 hours a week as a construction supervisor to pay for his education. After transferring to USF, he had to quickly adjust to a large university and to living in a new environment. In addition to being a very detail-oriented person, Errico has strong fundamental analysis, financial modeling, and leadership skills. These experiences have not only helped him learn and grow, but also enabled him to function in high stress and fast-paced environments.

University of South FloridaMuma College of Business
15
Analyst Class Spring 2015 Continued
Julio Escalona is a finance major who is in his senior year at USF. Escalona is a native of Cuba, and lived there until his late 20s. Escalona lived in Spain for one year before relocating to the Tampa Bay area. Even though there are not financial markets in Cuba, Escalona has always been fascinated with the world of investments. Now a United States citizen and the first person in his family to attend college, Escalona will graduate in 2015. He plans to continue his education by pursuing a master’s degree and CFA certification. He hopes his educational pursuits might inspire his young daughter.
Aaron Mederos’ fascination with financial markets developed after he experienced the consequences of a reflexive credit and asset bubble cycle in 2008-09. Curiosity about the cause of such events inspired his intellectual development. Mederos started following markets after high school and opened a personal account in 2014. He views acceptance of uncertainty and the development of a continually adapting, unbiased process as keys to successful participation in capital markets. He is optimistic that a Darwinian process will lead to greater accountability and incentive shifts on Wall Street, create a healthier economy, and grow investors’ wealth. He is a finance major who aspires to be at the forefront of that evolutionary process of better investment management and greater accountability to the average investor. He expects to graduate by Fall 2015.
Originally from Jacksonville, Fla., Jason Reyes is a senior at USF. He is pursuing a bachelor’s degree in finance. Reyes served as an intern for two years at Scottrade. He is the president of Pi Delta Psi Fraternity and aspires to work as an equity research analyst after graduation in May 2015.
Bianca Rodriguez is passionate about the global financial markets. This passion led her to pursue a degree in finance. As a full-time student with a full-time job, Rodriguez has maintained a 4.0 GPA in her major while managing a dental practice that brings in more than $1 million each year. When Rodriguez isn’t analyzing the markets, she enjoys watching sports and traveling. As a native New Yorker, she aspires to earn the CFA designation and pursue a career in equity research for a firm on Wall Street.

16University of South FloridaMuma College of Business
STUDENTS’ TAKEAWAYS
The Applied Securities & Analysis course is regarded as one of the toughest courses at the University. We all fill the role of a professional financial analyst and the quality of our work is expected to be nothing less than that of a professional Wall Street analyst. With many of us taking several additional courses, working a job or internship and participating in extracurricular activities, the intensity of the workload may become almost overwhelming. However, the offering of this course at the undergraduate level is a once in a lifetime opportunity that allows us to gain hands-on experience in the investment industry. It changes the way we look at the markets and the economy and transforms our minds from thinking like students into thinking like analysts.
A great investment idea is nothing if we cannot sell it and that is where our presentation skills come into play. Being able to present our idea effectively as well as answer difficult questions during the Q&A session only happens when we have done one thing: prepare. This course, more than any other course, has taught us about the importance of preparation. Being the most knowledgeable person about our investment idea is crucial. Being a part of the Student Managed Investment Fund has given us the necessary skills to succeed in the investment industry with a head start on the rest of the competition.
The following are some memorable statements made by this school year’s student analysts:
“The Applied Securities Analysis program is the most distinguished experience finance students can get among undergraduate classes.”-- Haomin Chen
“This program has taught me more about myself and this world than I could ever imagine.”-- Jonathan De Jesus
“This program teaches students how to sell stocks as well as how to walk, talk and act like a finance professional.”-- Matt Errico
“The program enables students to gain first hand knowledge on the process of accepting a stock into a portfolio and all the responsibilities that following a stock entails.”-- Julio Escalona
“Through ASA, we gain invaluable hands-on experience, not available through typical courses. This experiential learning gives us a substantial advantage over other finance grads and puts us in the running for jobs once reserved for Ivy graduates.”-- Daniel Dorman

University of South FloridaMuma College of Business
17
Key Statistics(As of May 2015)
P/E (TTM) 58
Fwd P/E 32
P/S 19.3
P/B 9.6
Dividend Yield 0.64%
Market Cap 24.53 B
Beta 1.56
Performance Since Purchase (4/1/2015 – 5/1/2015)
Arm Holdings (ARMH) 12.7%
S&P 500 2.4%
2015 Current PerformanceArm Holdings (ARMH) 18.8%
ORIGINAL THESIS
Increasing smartphone shipments and increasing smartphone share within all phones shipped will drive royalty growth
Increasingly complex chips within each device increases royalties per device
Increasing penetration of newest technology within all segments raises royalties per device
Increasing market share within enterprise and embedded computing increases licensing and royalty revenue
Total addressable market growth, through the Internet of Things, will increase both licensing and royalty revenue
ARM HOLDINGS (ARMH)
CATALYSTS
Increasing royalties and operational leverage
More chips in more advanced phones
Royalty growth
Growing market share
Increases in addressable market
Margin Expansion
International wealth increasing
Since Purchase
-‐5%
0%
5%
10%
15%
Apr-‐15 Apr-‐15 Apr-‐15 Apr-‐15
ARMH S&P 500
ARM designs and licenses low-power microprocessors predominately for use in mobile devices such as phones. ARM does not manufacture its chip technology but merely develops and licenses it. The Company has been able to build significant market share, with around 95% of mobile phones currently using ARM cores. A total of 12 billion ARM processor-based devices were shipped in 2014.

18University of South FloridaMuma College of Business
Key Statistics(As of May 2015)
P/E (TTM) 19
Fwd P/E 13.6
P/S 3.1
P/B 1.3
Dividend Yield 1.59%
Market Cap 48.75 B
Beta 1.43
Performance Since Purchase (2/21/2013 – 5/1/2015)
Bank of N.Y. Mellon (BK) 55.3%
S&P 500 39.1%
2015 Current PerformanceBank of N.Y. Mellon (BK) 5.6%
S&P 500 2.5%
ORIGINAL THESIS
BK’s stock has experienced difficulties. Weakness can be traced back to 2008 and 2009 when losses plagued their investment portfolio and provisions for loan losses rose. Revenues fell as lower market volatility reduced securities lending and Foreign Exchange revenues. The anticipation of persistent low-interest rates, concerns in Europe, and litigation have compounded the negativity reflected in the current stock price. Although we realize these are serious and legitimate concerns in the near-term, we feel that the market is overly pessimistic on BK’s medium to long-term potential. We think that the stock is undervalued today and that BK possesses important drivers of growth that should eventually peer through, via favorable market sentiment. Given our long-term outlook, we believe BK provides reasonable growth at a depressed price.
BANK OF NEW YORK MELLON CORP (BK)
The Bank of New York Mellon Corporation is a global financial services company that provides various financial products and services worldwide. It operates through Investment Management, Investment Services, and Other segments.
RISK
Risks to our thesis include economic conditions leading to a continued low interest rate environment, slower fee growth, depressed equity values and transaction volumes, a lack of volatility in foreign exchange, higher than expected expenses, harsh regulatory environments, litigation, as well as credit deterioration.
Since Purchase

University of South FloridaMuma College of Business
19
Key Statistics(As of May 2015)
P/E (TTM) 15
Fwd P/E 13.9
P/S 3.4
P/B 1.1
Dividend Yield 1.69%
Market Cap 8.66 B
Beta 1.27
Performance Since Purchase (3/3/2014 – 5/1/2015)
Comerica (CMA) -0.4%
S&P 500 (Benchmark) 12.3%
2015 Current PerformanceComerica (CMA) 2.3%
S&P 500 (Benchmark) 2.5%
ORIGINAL THESIS
COMERICA, INC. (CMA)
Comerica Incorporated, through its subsidiaries, provides financial, products and services primarily in three major US markets. The company operates in three major US markets. The company operates in three segments: Business Bank, Retail Bank, and Wealth Management.
Since Purchase
RISKS
Rates continue to stay low for a longer period of time from an stagnant economy thus keeping CMA’s net interest margin lower than peers
Exposure to the automotive and energy industry in an economic downturn could affect CMA’s credit quality
CMA’s loan structure, 85% floating, allows them to take advantage of rising short-term rates, which the Fed could begin in 2015, as stated in the December FOMC minutes
CMA loan quality restrictions over the past few years have helped increase the quality of its balance sheet and sensitivity to changes in short-term rates
CMA should see an improvement in total loan growth as the environment for middle market businesses continues to improve

20University of South FloridaMuma College of Business
Key Statistics(As of May 2015)
P/E (TTM) 19
Fwd P/E 16.5
P/S 2.9
P/B 3.3
Dividend Yield 1.71%
Market Cap 35.04 B
Beta 1.26
Performance Since Purchase (4/9/2012 – 5/1/2015)
CSX Corp (CSX) 78.2%
S&P 500 52.2%
2015 Current PerformanceCSX Corp (CSX) 4.5%
S&P 500 2.5%
ORIGINAL THESIS
Continued expansion of fracking operations in the U.S. will drive demand for sand shipments
Higher diesel prices will cause manufacturers and distributors to shift from trucking to railroads to transport goods
An improving U.S. economy will drive demand for durable goods which will drive continued earnings growth
Strong cash flows will benefit shareholders in the form of stock buy backs and dividend increases
CSX CORP. (CSX)
CSX Corporation, together with its subsidiaries, provides rail-based transportation services. It offers traditional rail services and transports inter modal containers and trailers.
RISK
New regulations could affect the railroad industry’s ability to negotiate prices and could negatively affect earnings
Failure to complete collective bargaining negotiations would result in strikes or work stoppages
The transportation of hazardous materials could subject CSX to significant costs and claims
A severe recession would negatively affect railcar volumes and in turn earnings
Since Purchase

University of South FloridaMuma College of Business
21
Key Statistics(As of May 2015 )
P/E (TTM) 21.3
Fwd P/E 12.6
P/S 2.1
P/B 2.5
Dividend Yield 1.7%
Market Cap 52.12 B
Beta 1.47
Performance Since Purchase (3/3/2014 – 5/1/2015)
EMC Corporation (EMC) 1.4%
S&P 500 (Benchmark) 12.3%
2015 Current PerformanceEMC Corporation (EMC) -10.9%
S&P 500 (Benchmark) 2.5%
ORIGINAL THESIS
As companies harness more data, EMC’s ability to offer value added and scalable products make EMC a key player in the secular change to cloud computing and Big Data management.
Fifty-fold growth in data from 2010 to 2020 to 40 zettabytes will drive growth for EMC
Prolific inorganic acquisitions funded by $5.5 billion in FCF allow EMC to efficiently expand and capitalize on new technologies.
EMC CORPORATION (EMC)
EMC Corporation, together with its subsidiaries, develops, delivers, and supports information infrastructure and virtual infrastructure technologies, solutions, and services.
RISK
Soft expenditures that are experienced in enterprise information technologies due to macroeconomic and industry specific events.
Cybersecurity breaches that may lead to adverse litigation and unforeseen costs.
Product obsoleteness that may cause both increasing costs and decreasing revenues.
Since Purchase
-‐10%
0%
10%
20%
Mar-‐14 Jul-‐14 Nov-‐14 Mar-‐15
EMC S&P 500

22University of South FloridaMuma College of Business
Key Statistics(As of May 2015)
P/E (TTM) 24.8
Fwd P/E 19.8
P/S 2.8
P/B 14.2
Dividend Yield 2.23%
Market Cap 20.49 B
Beta 0.76
Performance Since Purchase (04/25/2014 – 5/1/2015)
Hershey -6.5%
S&P 500 13.2%
2015 Current PerformanceHershey -9.7%
S&P 500 2.5%
ORIGINAL THESIS
The Hershey Company (HSY) has shown the most consistent growth amongst large cap food companies in the U.S. in recent years, a trend that is likely to continue over our investment holding period. Emerging countries are the top drivers of growth in chocolate sales and HSY is capitalizing on the tremendous growth opportunities in this area as evidenced by the successful penetration of its products. Also, domestically HSY is adding value through acquisitions and new product innovations.
Given its current price and our valuation, we consider HSY to be undervalued and an attractive investment opportunity to add positive alpha to the SMIF.
HERSHEY (HSY)
The Hershey Company manufactures, markets, distributes, and sells chocolate and sugar confectionery products, pantry items, gum, and mint refreshment products.
RISK
Weaker sales of confectionery products would lead to a lower growth rate than the one assumed in our analysis.
The Hershey Trust Company is the controlling shareholder with approximately 80% of the voting power.
Unsuccessful company innovations would hinder growth and place downward pressure on sales.
The main raw materials that are a direct input cost in HSY’s products are sugar, cocoa and corn sweeteners. Volatility in these commodities would negatively impact margins.
Since Purchase

University of South FloridaMuma College of Business
23
Key Statistics(As of May 2015)
P/E (TTM) 63.9
Fwd P/E 13.4
P/S 3.8
P/B 1.1
Dividend Yield 8.26%
Market Cap 280.43 MM
Beta .65
Performance Since Purchase (5/1/2015)
Independence Realty Trust (IRT) N/A
S&P 500 N/A
2015 Current PerformanceIndependence Realty Trust (IRT) -.06%
S&P 500 2.5%
ORIGINAL THESIS
There is a fundamental shift in the real estate industry as more consumers are seeking multi-family properties over purchasing a new home.
The firm invests in properties located in secondary markets that have the potential for rental and occupancy growth.
It can continue to acquire new properties that fit its current property portfolio.
Rental vacancy and available units for rent has decreased, which enables rent per unit price growth
INDEPENDENCE REALTY TRUST (IRT)
Independence Realty Trust (IRT) is a real estate investment trust (REIT) that invests in multi-family properties located in secondary markets. Some key property locations include Oklahoma, Arizona, Kentucky, and Tennessee. The firm acquires properties in areas with rental and occupancy growth potential. The firm has seen strong growth in funds from operations (FFO), net operating income (NOI), and net asset value (NAV).
MULTI-FAMILY INDUSTRY DRIVERS
Millennials have flocked to secondary cities such as Houston, Louisville, Oklahoma, Austin, and Phoenix among others.
The shift away from the 5 largest cities is driven by prices levels at all time highs that eat away at earnings for people in the early stages of their career.
Apartments located in secondary markets allow consumers to enjoy the benefits of a big city atmosphere while also paying a reasonable price.
Increasing student loan debt, percentage of 25-34 year olds who are married gradually decreasing since the 1980’s, and average age of mothers giving birth increasing from 28 to 31-32 all point towards new home purchases being put off till later in life.
Year to Date
-‐5%
-‐3%
0%
3%
5%
Jan-‐15 Feb-‐15 Mar-‐15 Apr-‐15
IRT S&P 500

24University of South FloridaMuma College of Business
Key Statistics(As of May 2015)
P/E (TTM) 14.6
Fwd P/E 13.9
P/S 0.9
P/B 1.0
Dividend Yield -
Market Cap 278.21 MM
Beta 1.34
Performance Since Purchase (3/1/2015 – 5/1/2015)
Omega Protein (OME) 23.1%
S&P 500 0.2%
2015 Current PerformanceOmega Protein (OME) 26.7%
S&P 500 2.5%
ORIGINAL THESIS
Growing demand from consumers becoming more conscious about their health
Increased product offerings in Human Segment will drive revenue growth
Acquisitions of Cyvex (12/10) and InCon (9/11) enable vertical integration and differentiate its fish oil from substitutes
Acquisition of Bioriginal (9/14) creates steady revenue stream for Human Segment to hedge against seasonality in the Animal Segment
Fish oil from menhaden is the only Omega-3 oil approved by FDA
Consistent catch of menhaden will provide Omega with consistent revenue as demand for fish meal and fish oil from the aquaculture and pork production industries grow
OMEGA PROTEIN (OME)
Omega Protein Corporation manufactures Omega-3 fish oil, specialty fish products, and nutritional supplements for sale to various feed manufactures and wholesale organic distributors. The company operates in two segments: Animal Nutrition and Human Nutrition.
RISK
New entrants into menhaden fishing market
Government/FDA regulations adversely affect the firm’s ability to catch menhaden
Energy swap adjustments and seasonality of the business could dilute earnings more than anticipated
Reliance on menhaden
Since Purchase
-‐10%
0%
10%
20%
30%
Mar-‐15 Mar-‐15 Mar-‐15 Apr-‐15 Apr-‐15
OME S&P 500

University of South FloridaMuma College of Business
25
Key Statistics(As of May 2015)
P/E (TTM) 16.1
Fwd P/E 15.4
P/S 3.0
P/B 2.5
Dividend Yield 0.6%
Market Cap 31.14 B
Beta 1.05
Performance Since Purchase (4/9/2013 – 5/1/2015)
Precision Castparts (PCP) 13.4%
S&P 500 (Benchmark) 32.7%
2015 Current PerformancePrecision Castparts (PCP) -12.4%
S&P 500 (Benchmark) 2.5%
ORIGINAL THESIS
PCP mitigates risks of certain airline companies outperforming the industry by offering low costs for all jet craft engines.Strong competitive moat by being one of the few large metal casting producers as well as producing components that demand a high level of expertise in addition to high manufacturing capacity.Transparent growth with backlogged work orders that will drive revenue. Improved profit margins on next generation aircrafts, which are set to start being manufactured in 2016 by Boeing and AirbusManagement’s acquisition’s of Aerospace Dynamic International can expand their reach to next-gen aircraftsAcquisitions of Permaswage and Airdome strengthened the companies permanent and separable fittings segment.Strong cash and financial position provides liquidity for organic growth and the ability to acquire other firms to increase manufacturing capacity
PRECISION CASTPARTS CORPORATION (PCP)
Precision Castparts (PCP) is a world leader in structural investment castings, forged components, and airfoil castings for aircraft engines and industrial gas turbines. Airbus, Boeing, GE, Rolls-Royce, and many other leading manufacturers depend on PCP for critical airframe, engine, power generation and general industrial components.
RISK
U.S. economy’s growth becomes stagnate, and consumer spending decreases
Heavy reliance on a few customers, Boeing, Airbus and GE
Price fluctuations in raw materials
Seasonal markets of aerospace and power generation markets
Emerging markets demand for small sized aircrafts decrease
Since Purchase
26University of South FloridaMuma College of Business
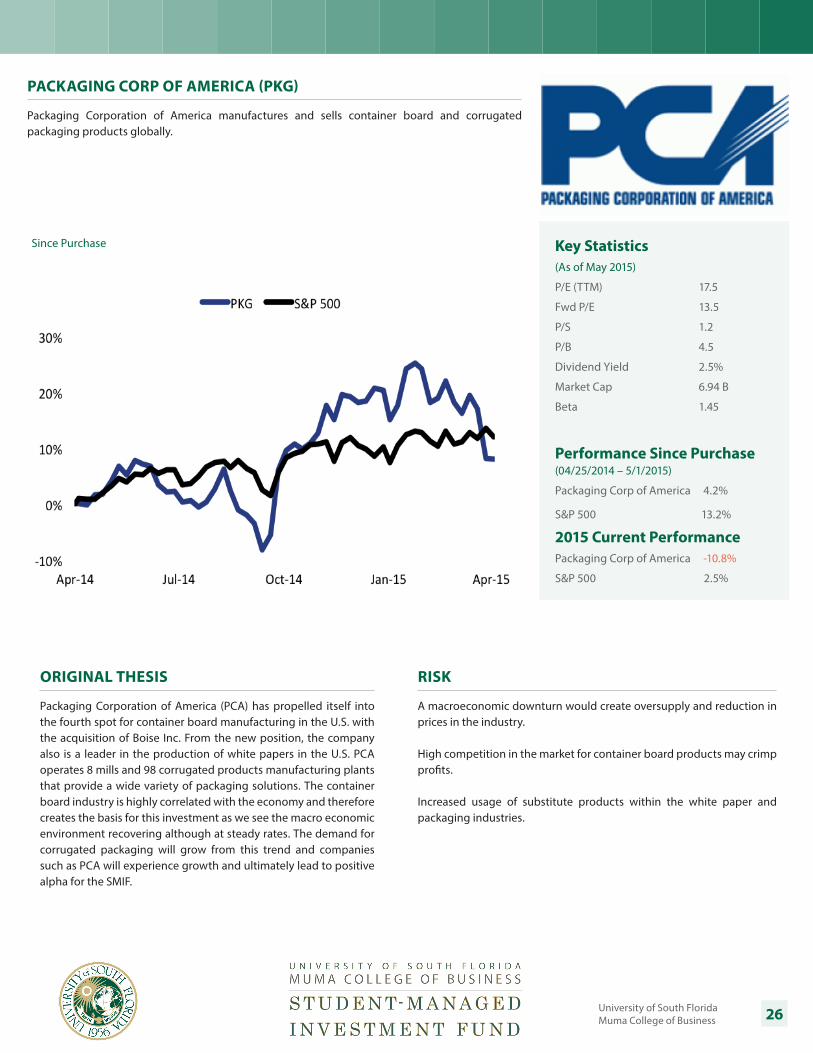
Key Statistics(As of May 2015)
P/E (TTM) 17.5
Fwd P/E 13.5
P/S 1.2
P/B 4.5
Dividend Yield 2.5%
Market Cap 6.94 B
Beta 1.45
Performance Since Purchase (04/25/2014 – 5/1/2015)
Packaging Corp of America 4.2%
S&P 500 13.2%
2015 Current PerformancePackaging Corp of America -10.8%
S&P 500 2.5%
ORIGINAL THESIS
Packaging Corporation of America (PCA) has propelled itself into the fourth spot for container board manufacturing in the U.S. with the acquisition of Boise Inc. From the new position, the company also is a leader in the production of white papers in the U.S. PCA operates 8 mills and 98 corrugated products manufacturing plants that provide a wide variety of packaging solutions. The container board industry is highly correlated with the economy and therefore creates the basis for this investment as we see the macro economic environment recovering although at steady rates. The demand for corrugated packaging will grow from this trend and companies such as PCA will experience growth and ultimately lead to positive alpha for the SMIF.
PACKAGING CORP OF AMERICA (PKG)
Packaging Corporation of America manufactures and sells container board and corrugated packaging products globally.
RISK
A macroeconomic downturn would create oversupply and reduction in prices in the industry.
High competition in the market for container board products may crimp profits.
Increased usage of substitute products within the white paper and packaging industries.
Since Purchase

University of South FloridaMuma College of Business
27
ORIGINAL THESIS
Brand Transformation: RH has the ability to scale its unique lifestyle brand via expanding product offerings, growing square footage, and continuing superior sales growth. We see this allowing RH to propel its market share gains and market beating shareholder returns over our three to five year investment horizon
Strong Competitive Advantage: From a competition standpoint, RH’s combination of shopping experience, storefront appeal, and transforming economies of scale is unparalleled by any brand in its industry.
Favorable Macro and Industry Environment: We see significant top-down tailwinds for RH’s developing business: the strength of the luxury consumer, the accelerating positive trend in housing and renovation, and the fragmented and stale competitive environment in the retail and the home furnishing business.
Strategic Execution: RH’s strategic focus, ambitious brand vision, economies of scale, and impeccable record of executing its growth strategies make RH’s growth sustainable and the value creation goals feasible
RESTORATION HARDWARE (RH)
Restoration Hardware is a luxury home furnishing retailer that intends to offer the finest and most desirable designs at unmatched value. Its expanding merchandise offerings include: furniture, lighting, textiles, bath ware, decor, outdoor and garden, as well as baby & child products. RH curates this home furnishing merchandise in its stand-alone galleries and sells directly through catalogs that it calls source books.
RISK
High comparison against prior growth
Market expectations/valuations
Economic slowdown
Lower square footage growth
Changing consumer preferences
Loss of key personnel
Since Purchase
-‐8%
-‐4%
0%
4%
8%
12%
Mar-‐15 Mar-‐15 Mar-‐15 Apr-‐15 Apr-‐15
RH S&P 500
Key Statistics(As of May 2015)
P/E (TTM) 40
Fwd P/E 29.5
P/S 2.0
P/B 5.0
Dividend Yield 0%
Market Cap 3.67 B
Beta 0.64
Performance Since Purchase (3/1/2015 – 5/1/2015)
Restoration Hardware (RH) 1.4%
S&P 500 0.2%
2015 Current PerformanceRestoration Hardware (RH) -3.7%
S&P 500 2.5%

28University of South FloridaMuma College of Business
Key Statistics(As of May 2015)
P/E (TTM) 19.5
Fwd P/E 17.5
P/S 0.7
P/B 2.8 Dividend Yield 0%
Market Cap 173.60 MM
Beta 0.17
Performance Since Purchase (5/1/2015 – 5/1/2015)
Inventure Foods, Inc. (SNAK) N/A
S&P 500 N/A
2015 Current PerformanceInventure Foods, Inc. (SNAK) -25.9%
S&P 500 2.5%
ORIGINAL THESIS
Management’s priority on growing healthy/natural food segment
Strong Portfolio of brand name foods
Diverse distribution network with large customer base
Continued product innovation will keep its brands at the forefront of the industry
Frozen vegetables market will improve top line growth and decrease seasonality of revenues
Growing demand for healthy snack alternatives
Increasing demand for smoothies and frozen fruit products
INVENTURE FOODS, INC. (SNAK)
Inventure Foods, Inc. is one of the market leaders in distributing, processing, and marketing both healthy/natural and indulgent foods. The company operates in two segments: frozen products (63%) and snack products (37%). The majority of its sales come from healthy/natural products (81%), while the rest consists of indulgent specialty foods (19%).
RISK
Increasing commodity prices
Costco accounted for 26% of total revenues
Operates in a highly competitive market
New products could lose consumers’ appeal
Year to Date
-‐45%
-‐30%
-‐15%
0%
15%
Jan-‐15 Feb-‐15 Mar-‐15 Apr-‐15
SNAK S&P 500

University of South FloridaMuma College of Business
29
Key Statistics(As of May 2015)
P/E (TTM) 82.3
Fwd P/E 54.1
P/S 5.2
P/B 12.0
Dividend Yield 0%
Market Cap 16.91 B
Beta -0.03
Performance Since Purchase (2/10/2015 – 5/1/2015)
Under Armour (UA) 11.1%
S&P 500 1.9%
2015 Current PerformanceUnder Armour (UA) 21.8%
S&P 500 2.5%
ORIGINAL THESIS
Major opportunity for international expansion. Sales from overseas currently account for ~8% of total revenue. Under Armour will continue to establish brand recognition globally in Asia, EMEA and the Middle East. In the long-term international sales have the potential to account for close to half of total revenues.
Ability to establish brand loyalty by targeting consumers at a young age. Under Armour penetrated the sports and youth markets first before expanding to Men and Women’s apparel. The firm’s strong foothold in the youth market will continue to benefit Under Armour by establishing brand loyalty for their products. These consumers along with the ability to continue to expand and make innovative clothing and footwear will enable Under Armour to become the next Nike.
Capturing market share from Nike and Adidas as it grows into the leading athletic brand. Successful investments in athletes and universities will increase brand popularity and demand. The success of Under Armour endorsees will continue to increase brand recognition and install loyalty and a recurring revenue stream.
UNDER ARMOUR (UA)
Under Armour designs, distributes and markets its brand of performance apparel, footwear and accessories. Headquartered in Baltimore, Maryland, Under Armour offers unique and high quality products geared towards men, woman and youth. The firm operates in the clothing and apparel sector.
RISK
Economic Downturn would decrease consumer purchases of discretionary items, which could hurt Under Armour’s earning potential.
A loss of one or more key customers could adversely affect growth strategy.
Rapid growth that Under Armour will see in the future will lead to operating deficiencies.
The large size and abundance of resources of Nike and Adidas could be difficult for Under Armour to compete with.
Since Purchase
-‐5%
0%
5%
10%
15%
20%
Feb-‐15 Mar-‐15 Mar-‐15 Apr-‐15
UA S&P 500

30University of South FloridaMuma College of Business
Key Statistics(As of May 2015)
P/E (TTM) 31.4
Fwd P/E 26.1
P/S 5.1
P/B 5.0
Dividend Yield 0%
Market Cap 1.07 B
Beta 1.58
Performance Since Purchase (4/1/2015 – 5/1/2015)
Vasco Data Security (VDSI) 13.1%
S&P 500 2.4%
2015 Current PerformanceVasco Data Security (VDSI) -10.0%
S&P 500 2.5%
ORIGINAL THESIS
Growing demand for firms to have secure networks because of the increasing number of data breaches
Solid customer base creates reliance on Vasco solutions
Growing demand for cloud and mobile based security solutions will enable Vasco to earn recurring revenues
Cloud solutions improve scalability and improve top and bottom line growth
Increasing demand for two-step user authentication systems will drive demand for Digipass
Vasco will see increasing demand from other markets besides financial firms as it will leverage its expertise in user authentication across all industries
Increasing regulation of governments requiring corporations to increase IT security spending will drive growth
VASCO DATA SECURITY (VDSI)
VASCO Data Security International Incorporated, together with its subsidiaries, designs, develops, and markets security systems to protect and manage access to digital assets worldwide. The firm is headquartered in Delaware but operates worldwide. The company operates in two segments: banking and financial services market (83% of sales) and the enterprise and application security market (17% of sales).
RISK
Ability to penetrate non-financial firm markets
Vasco systems or customers experience a hack from authentication system
Reliance on small number of customers attributing 46% of revenue
Foreign currency fluctuations
Since Purchase
-‐5%
0%
5%
10%
15%
20%
25%
Apr-‐15 Apr-‐15 Apr-‐15 Apr-‐15 Apr-‐15
VDSI S&P 500
University of South FloridaMuma College of Business
31
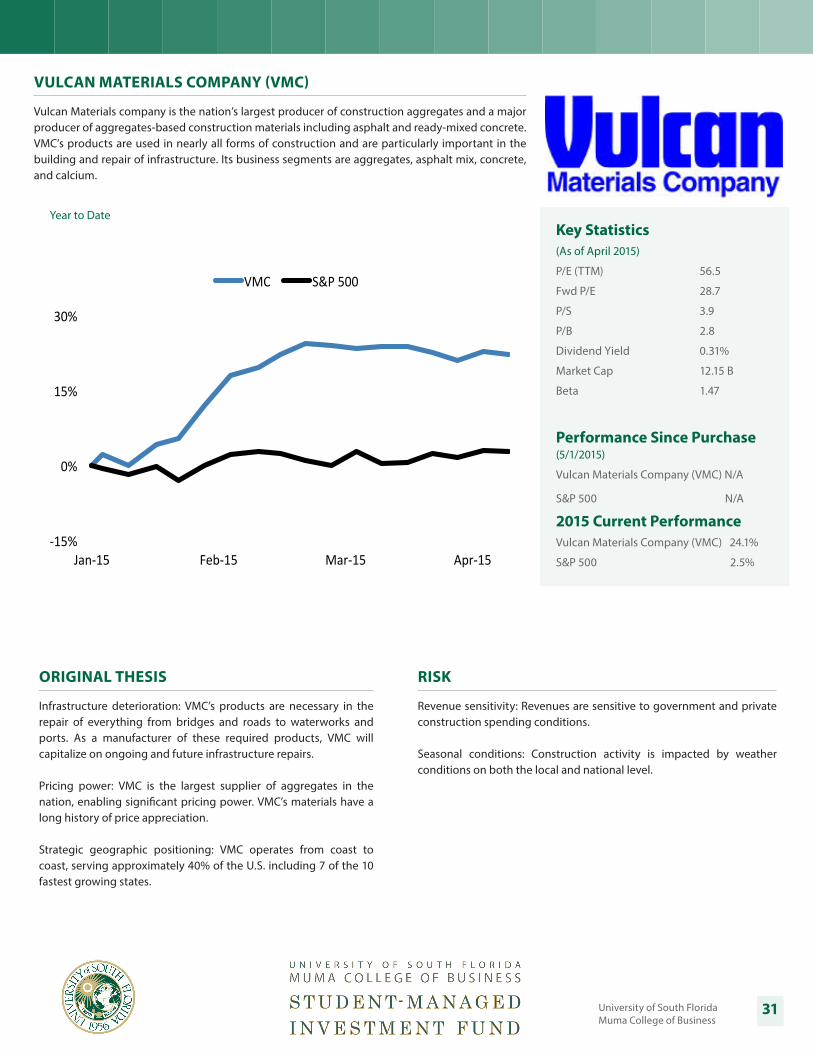
Key Statistics(As of April 2015)
P/E (TTM) 56.5
Fwd P/E 28.7
P/S 3.9
P/B 2.8
Dividend Yield 0.31%
Market Cap 12.15 B
Beta 1.47
Performance Since Purchase (5/1/2015)
Vulcan Materials Company (VMC) N/A
S&P 500 N/A
2015 Current PerformanceVulcan Materials Company (VMC) 24.1%
S&P 500 2.5%
ORIGINAL THESIS
Infrastructure deterioration: VMC’s products are necessary in the repair of everything from bridges and roads to waterworks and ports. As a manufacturer of these required products, VMC will capitalize on ongoing and future infrastructure repairs.
Pricing power: VMC is the largest supplier of aggregates in the nation, enabling significant pricing power. VMC’s materials have a long history of price appreciation.
Strategic geographic positioning: VMC operates from coast to coast, serving approximately 40% of the U.S. including 7 of the 10 fastest growing states.
VULCAN MATERIALS COMPANY (VMC)
Vulcan Materials company is the nation’s largest producer of construction aggregates and a major producer of aggregates-based construction materials including asphalt and ready-mixed concrete. VMC’s products are used in nearly all forms of construction and are particularly important in the building and repair of infrastructure. Its business segments are aggregates, asphalt mix, concrete, and calcium.
RISK
Revenue sensitivity: Revenues are sensitive to government and private construction spending conditions.
Seasonal conditions: Construction activity is impacted by weather conditions on both the local and national level.
Year to Date
-‐15%
0%
15%
30%
Jan-‐15 Feb-‐15 Mar-‐15 Apr-‐15
VMC S&P 500

Prepared by: 2015 Analyst GroupFor more information please visit: http://www.usf.edu/smif
University of South FloridaMuma College of Business