smith barney citigroup 2005 financial services conference
TRANSCRIPT

Managing for GrowthManaging for Growth
Citigroup Smith Barney Investor ConferenceJanuary 26, 2005
Ken Lewis
Bank of America

2
Forward Looking StatementsForward Looking Statements
This presentation contains forward-looking statements, including statements about the financial conditions, results of operations and earnings outlook of Bank of America Corporation. The forward-looking statements involve certain risks and uncertainties. Factors that may cause actual results or earnings to differ materially from such forward-looking statements include, among others, the following: 1) projected business increases following process changes and other investments are lower than expected; 2) competitive pressure among financial services companies increases significantly; 3) general economic conditions are less favorable than expected; 4) political conditions and related actions by the United States military abroad may adversely affect the company’s businesses and economic conditions as a whole; 4) changes in the interest rate environment reduce interest margins and impact funding sources; 5) changes in foreign exchange rates increases exposure; 6) changes in market rates and prices may adversely impact the value of financial products and assets; 7) legislation or regulatory environments, requirements or changes adversely affect the businesses in which the company is engaged; 8) litigation and regulatory liabilities, including costs, expenses, settlements and judgments, may adversely affect the company or its businesses; and 9) decisions to downsize, sell or close units or otherwise change the business mix of any of the company. For further information regarding either company, please read the Bank of America reports filed with the SEC and available at www.sec.gov.

3
Characteristics for Success
• Effective
• Efficient
• Opportunistic
• Admired
Overriding Management GoalsOverriding Management Goals

4
“Bank of America will be effective by consistent execution of our customer strategy
to grow revenue and be the number one financial services provider”
EffectiveEffective

5
America’s LeadingFinancial Solutions CompanyAmerica’s LeadingFinancial Solutions Company
Serving…
• 33 million consumerhouseholds
• 3.4 million smallbusinesses
• In the best growthand wealth markets
• Relationships with 96% of US Fortune 500 companies
• Relationships with 82% of Global Fortune 500 companies

6
Ken Lewis
Chief Executive Officer
Ken Lewis
Chief Executive Officer
Steele Alphin
Principal Personnel Executive
Steele Alphin
Principal Personnel Executive
Milton Jones
Quality and Productivity
Executive
Milton Jones
Quality and Productivity
Executive
Cathy Bessant
Chief Marketing andCommunications
Officer
Cathy Bessant
Chief Marketing andCommunications
Officer
Jim Hance
Vice Chairman
Jim Hance
Vice Chairman
Amy Brinkley
Chief Risk Officer
Amy Brinkley
Chief Risk Officer
Jay Sarles
Vice ChairmanSpecial Advisor
to CEO
Jay Sarles
Vice ChairmanSpecial Advisor
to CEO
Liam McGee
PresidentConsumer & Small Business
Liam McGee
PresidentConsumer & Small Business
Gene Taylor
PresidentCommercial
Banking
Gene Taylor
PresidentCommercial
Banking
Brian Moynihan
PresidentWealth& Investment
Management
Brian Moynihan
PresidentWealth& Investment
Management
Barbara Desoer
Technology, Service & Fulfillment Executive
Barbara Desoer
Technology, Service & Fulfillment Executive
Marc Oken
Chief Financial Officer
Marc Oken
Chief Financial Officer
Al deMolina
PresidentGlobal Corporate &
Investment Bank
Al deMolina
PresidentGlobal Corporate &
Investment Bank
Strong LeadershipStrong Leadership
29

7
Formula for SuccessFormula for Success
Process Improvement
Customer Satisfaction
Account Growth
Revenue Growth

8
Establishing a Culture of Productivity Establishing a Culture of Productivity
Key Components of Culture• Core process improvement• People• Products • Channels• Tools / technology
Error – free processing6σ6σ CustomerCustomer
DelightDelight
• More than 35,000 associates have participated in Quality and Productivity training
• Now employ more than 5,250 “Green Belts and Black Belts”

9
Improving Customer DelightImproving Customer Delight
Improved Customer Delight, while Growing Number of Accounts and Reducing Unit Costs
Top 2 Box Customer Delight - Checking Accounts
56%60%
63%
Q4- 2002 Q4-2003 Q4-2004

10
Bank of America only Fleet legacy
Sales Volume Is RisingSales Volume Is Rising
Net New Checking Account Growth
528,000
1,253,000
2,106,000
2002 2003 2004
Net New Savings Account Growth
(265,000)
640,000
2,565,000
2002 2003 2004
New Consumer Credit Card Growth
2,665,000
4,277,000
5,591,000
2002 2003 2004

11
Consistently Growing the BusinessConsistently Growing the Business
($ billions)11% growth over 2003
* Ratio of Legacy BAC retail deposits to Industry deposits less stores with >$500 million in FDIC DepositsSource: Fiscal 2004 FDIC (June-June) and BAC data
$240
6%12% 14%
9%
$406
2001 2002 2003 2004
Legacy Fleet
Legacy BAC
Retail DepositMarket Share* 13.6% 13.6% 13.8% 14.6%
Retail Deposit Balance Growth

12
Consumer Revenue Is GrowingConsumer Revenue Is Growing
*CAGR based on legacy BAC 2004 estimate
+12% CAGR*
(Legacy BAC)
$15$17
$21
$27
2001 2002 2003 2004
(Includes Fleet)
($ billions)
13
EfficientEfficient
“Efficiency is determined not only by how we manage costs but also measured by the
productivity of our associates”
Productivity is a journey with no end….

14
61%
55%54%
56%
53% 52%54%
1998 1999 2000 2001 2002 2003 2004
A Strong History of Managing Costs A Strong History of Managing Costs
Efficiency Ratio
Excludes merger & restructuring charges

15
2003 4.1
Seller Productivity Is IncreasingSeller Productivity Is Increasing
Average Sales/Seller/Day(Legacy BAC)
3Q02 4Q02 1Q03 2Q03 3Q03 4Q03 1Q04 2Q04 3Q04 4Q04
Full Year Sales/Seller/Day QTD Sales/Seller/Day
2004 6.2
2002 3.4

16
Scale is a Competitive Advantage Scale is a Competitive Advantage
• Unparalleled convenience
• Vendor leverage
• National marketing
• Business reinvestment opportunities

17
Operating LeverageOperating Leverage
Earnings Growth from Operating Leverage
0% 1% 2% 3% 4%4% 4% 6% 6% 8% 9%6% 6% 7% 8% 10% 11%8% 9% 10% 12% 13% 14%10% 10% 11% 12% 14% 15%R
even
ue G
row
th
Operating Leverage
•Normal range for revenue growth of 7 – 9%, and
•Operating leverage range of 2 – 4% produces
•earnings growth of 8 – 14%

18
OpportunisticOpportunistic
“Substantial cash flow provides a company the flexibility to invest for future growth and
to return excess capital to shareholders”

19
Earnings Power Provides AdvantagesEarnings Power Provides Advantages
$13,103 $12,652$10,995
$13,209
$16,078
$21,885
1999 2000 2001 2002 2003 2004
($ millions) Pre-tax Cash Earnings

20
Business Reinvestment
Dividends
Share Repurchases
Capital OpportunitiesCapital Opportunities
Strong Balance
Sheet
Acquisition Opportunities
Cash Flow
21
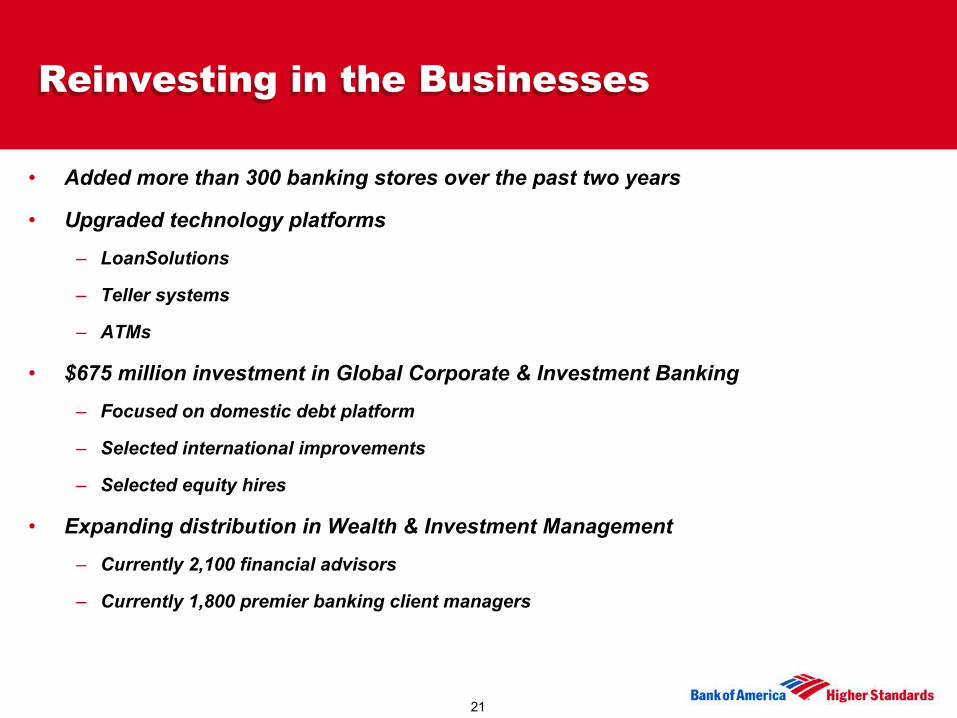
• Added more than 300 banking stores over the past two years
• Upgraded technology platforms– LoanSolutions
– Teller systems
– ATMs
• $675 million investment in Global Corporate & Investment Banking– Focused on domestic debt platform
– Selected international improvements
– Selected equity hires
• Expanding distribution in Wealth & Investment Management– Currently 2,100 financial advisors
– Currently 1,800 premier banking client managers
Reinvesting in the BusinessesReinvesting in the Businesses
22
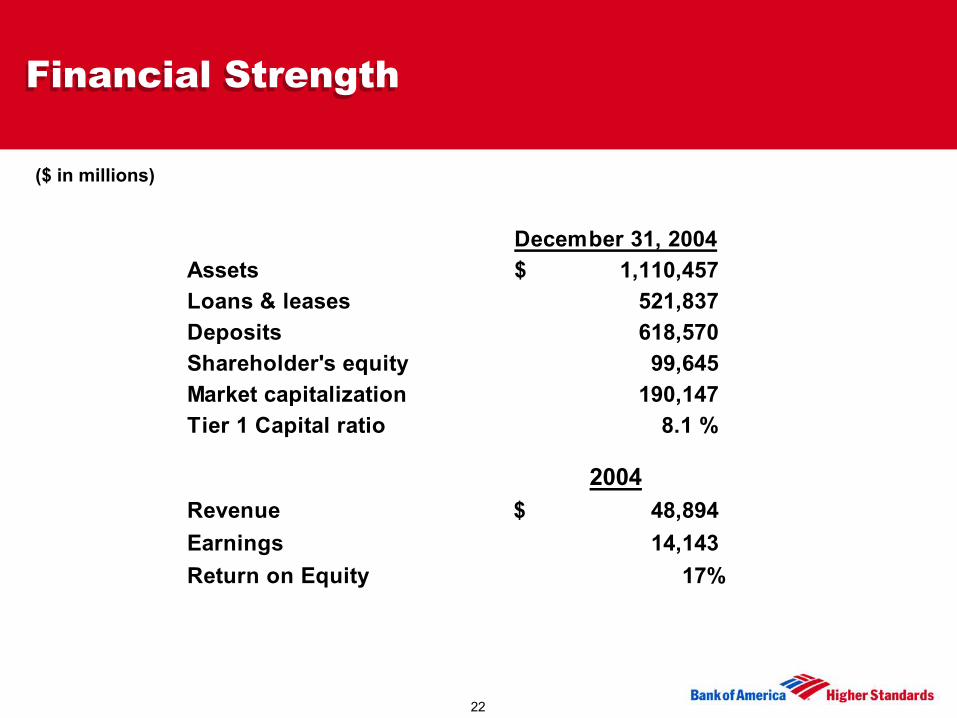
December 31, 2004Assets 1,110,457$ Loans & leases 521,837 Deposits 618,570 Shareholder's equity 99,645 Market capitalization 190,147 Tier 1 Capital ratio 8.1 %
2004Revenue 48,894$ Earnings 14,143 Return on Equity 17%
Financial StrengthFinancial Strength
($ in millions)

23
• 24.9 percent investment in Grupo Financiero Santander Serfin
– Advance Bank of America's strategy to better serve the Hispanic market
– Leverage Santander expertise for other business opportunities
• National Processing acquisition
– Created 2nd largest bankcard merchant acquirer
– Created scale in merchant service processing
• Fleet Financial Merger
– Extended #1 U.S. consumer retail bank
– Enhanced business banking franchise
– Significantly increased position as wealth manager
Investments and AcquisitionsInvestments and Acquisitions

24
Positive Fleet Integration Results Positive Fleet Integration Results
• Financial results on track
• Positive customer reaction
Customer satisfaction
Net new account growth
• Improved sales productivity
• Cross-footprint transactions rising
• Cost savings on track
• Exceeded first year early projections

25
Tier 1 7.06%Tier 1 7.06%
Tier 1 8.10%Tier 1 8.10%
$38,221
6,375$27,271
6,469
1998
1999
2000
2001
2002
2003
2004
Cumulative
Repurchases Dividends
$65,492
EOP Common Shares 3,354 3,228 3,118 3,0023,448 2,882 4,047
$ in millions
Consistently Strong Return of Capital to ShareholdersConsistently Strong Return of Capital to Shareholders
• Returned more than $65 billion in capital since 1998
• Improved Tier 1 capital ratio

26
AdmiredAdmired
Our goal is to be:
•the best place to do business
•the best place to work
•the best place to invest your money

27
Best Place to Do BusinessBest Place to Do Business
12.6%
42.5%
9.5%
53.2%
0%
20%
40%
60%
80%
100%
4Q 2001 4Q04
Extremely/Highly Satisfied (9-10)
Satisfied (6-8)
Somewhat/Not At All Satisfied (1-5)
Delighted
Dissatisfied
Legacy Bank of America data
Customer Delight is Improving

28
Leadership Positions Across Businesses
• #1 US deposit market share
• #1 debit card market share
• #2 home equity lender
• #1 small business lender
• #5 consumer credit card lender
• #6 retail mortgage originator
• Top 10 private bank
• Top 10 wealth manager
• #1 middle market lender
• #1 bank-owned asset-based lender
• #1 treasury services provider
• Top foreign exchange dealer
• #2 in loan syndications
• Top 3 US capital markets debt capabilities
• Top 10 equity and M & A platform
Best Place to Do BusinessBest Place to Do Business
29
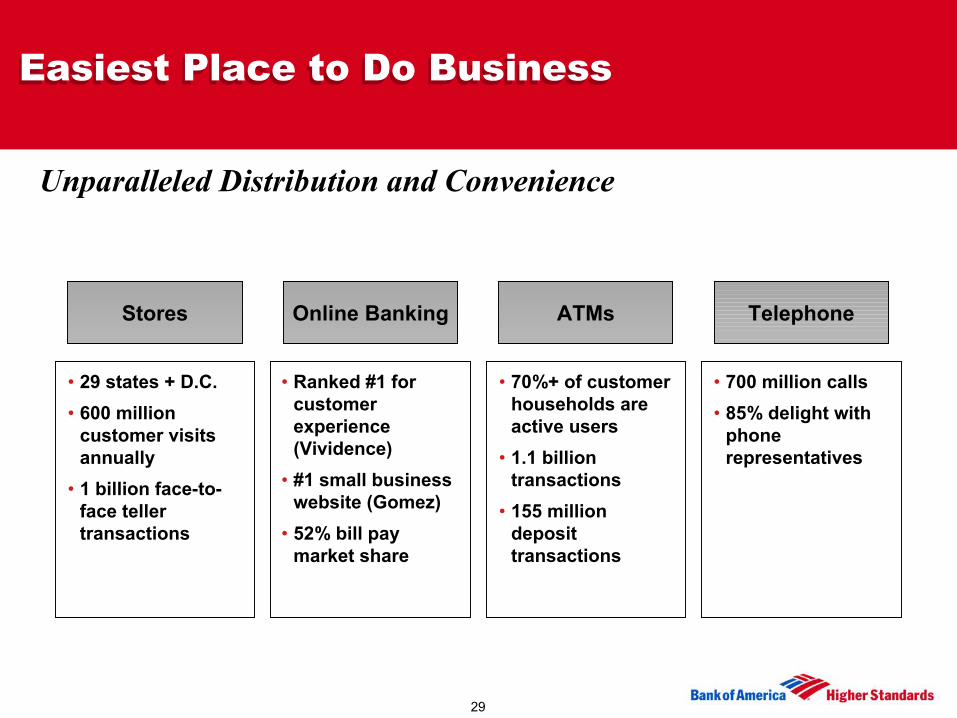
Unparalleled Distribution and Convenience
Stores
• 29 states + D.C.• 600 million
customer visits annually
• 1 billion face-to-face teller transactions
Online Banking
• Ranked #1 for customer experience (Vividence)
• #1 small business website (Gomez)
• 52% bill pay market share
ATMs
• 70%+ of customer households areactive users
• 1.1 billion transactions
• 155 milliondeposit transactions
Telephone
• 700 million calls• 85% delight with
phone representatives
Easiest Place to Do BusinessEasiest Place to Do Business
30
Working Mother
Bank of America has been chosen as one of the 100 Best Companies for Working Mothers by Working Mother magazine.
Hispanic Magazine
Hispanic Magazine has named Bank of America one of the top 100 companies in the U.S., acknowledging a number of innovations that provide business and job opportunities for Hispanic Americans.
DiversityInc. Magazine
Bank of America has been recognized by DiversityInc as one of the Top 50 Companies for Diversity. Fortune Magazine
50 Best Companies for Minorities
In Fortune's Global Most Admired Companies list, Bank of America has been ranked #4 in the industry category.
Best Place to WorkBest Place to Work

31
Best Place to InvestBest Place to Invest
$3.56
$2.96
$2.67
2001 2002 2003
10% Compound Growth
Versus First Call
estimate in June ’01
$2.62
Versus First Call
estimate in June ’02
$2.83
Versus First Call
estimate in June ’03
$3.15
2000 - $2.26 reported EPS has been adjusted to exclude $.10 impact of restructuring charges as well as $.19 goodwill amortization expense eliminated in 2002 for comparability to other periods.
2001 - $2.09 reported EPS has been adjusted to exclude $.39 impact of business exit costs as well as $.19 goodwill amortization expense eliminated in 2002 for comparability to other periods.
2004 - $2.76 reported YTD has been adjusted $. 11 to exclude charges for merger and restructuring costs.
Diluted EPS
2004
Versus First Call
estimate in June `04
$3.63
$3.80
2000
Versus First Call
estimate in June ’00
$2.52
$2.55

32
• 27 consecutive years of dividend increases• 13% annualized dividend growth rate since 1977
$1.70
$0.07
1977 2004
13% annualized growth
Excellent Dividend Growth
Best Place to InvestBest Place to Invest

33
19% 18%19%
10%
7%
11%
4%
12%
21% 21%
5%
-2%
1 Year 3 Year 5 Year 10 Year
Bank of America Large Cap Peers S & P 500 Index
BA
C
BA
C
BA
C
12/31/03 –12/31/04
Annualized Total Shareholder Return
BA
C
12/31/01 –12/31/04
12/31/99 –12/31/04
12/31/94 –12/31/04
Best Place to InvestBest Place to Invest
Large cap peers include Citigroup, JP Morgan, US Bancorp, Wachovia, Wells Fargo and Fifth Third.

34
CAGR
2000-2004
Revenue Per Share 7%
Diluted EPS 10%
Dividends per share 13%
Total Share return 24%
Market Value 27%
Energized Focus on Customer in 2000 was Watershed EventEnergized Focus on Customer in 2000 was Watershed Event
