smith & wesson holding corporporation...
TRANSCRIPT

1
WWW.SMITH-WESSON.COM
NASDAQ: SWHC
SMITH & WESSON
HOLDING CORPORPORATION
INVESTOR PRESENTATIONSeptember 2016

2
SAFE HARBOR
Certain statements contained in this presentation may be deemed to be forward-looking
statements under federal securities laws, and the Company intends that such forward-looking
statements be subject to the safe-harbor created thereby. Such forward-looking statements
include but are not limited to statements regarding the Company’s vision, mission, and strategy;
the Company’s structure and objectives; the Company’s strategic corporate growth objectives;
the demand for the Company’s products and services; the Company’s new products and
strategic product development; the Company’s market position; the Company’s expansion
goals and opportunities; strategic and financial benefits of recent acquisitions; the Company’s
markets and opportunities for growth; positioning the Company for future growth; and
anticipated revenue, GAAP and non-GAAP earnings per share, tax rate, and share count for the
Company in future periods. The Company cautions that these statements are qualified by
important factors that could cause actual results to differ materially from those reflected by
such forward-looking statements. Such factors include the demand for the Company’s
products, the Company’s growth opportunities, the ability of the Company to obtain operational
enhancements, the success of new products, the potential for increased regulation of firearms
and firearm-related products, and other risks detailed from time to time in the Company’s
reports filed with the SEC.

3
To be the leading provider of quality products for the shooting and outdoor enthusiast
To leverage our employees’ capabilities and experiences to design, produce, and market high quality, innovative firearms, accessories, and outdoor products that meet the needs and desires of our consumer and professional customers while delivering a healthy financial performance
-Develop innovative products-Take market share-Grow our brands-Expand organically and inorganically into adjacent and complimentary markets-Enhance and add strategic partnerships
Vision
Mission
Strategy

4
6 BIG BOX RETAILERS*
2 BUYING GROUPS*
4 PATHS TO OUR MARKETSDIVERSITY = ENHANCED INSIGHT
*During periods of high consumer demand or fully utilized manufacturing capacity, the company may allocate firearms product based on historical sales volumes. Therefore, those retailers/distributors with higher historical sales volumes will have larger allocations.
14 DISTRIBUTORS*65.6% of Consumer Channel Sales (TTM)
Note: Additional non big-box, direct retail relationships not included
DIR
ECT
DIR
ECT
se
Buying Groups: 600 Member Firearm
Retailers
10,000+ independent
firearm retailers
INTERNET (Outdoor Products Only)se
DIR
ECT
2-S
TEP

5
Shared Services
HR, IT, Finance
STRUCTURE & OBJECTIVES
Smith & Wesson Holding Corporation
: : :
Outdoor Products & Accessories
Segment
FirearmsSegment
Electro Optics
Division(CTC)
Potential New
Division
Accessories Division(BTI, BTI
Tools)
Mfg ServicesDivision
(SW Corp)
FirearmsDivision
(SW Corp)
Diversify Revenue: By acquiring counter-cyclical / counter-seasonalbusinesses and selling manufacturing services B2B
Harvest Synergies: From current and future divisions
Leverage Manufacturing: Capability to serve all divisions and drive deeper verticalintegration
Delight Customer: By centralizing logistics and driving excellence incustomer service

6
FIREARMS SEGMENT
Our Firearms Division consists of products and servicesmanufactured and sold from our Massachusetts, Maine, andConnecticut facilities. Products include revolvers, pistols,rifles, handcuffs, and related products sold through adistribution chain and directly to consumers and international,state, and federal governments. Our manufacturing servicesdivision provides forging, precision molding, and otherservices to internal and external customers.
$192.4 million in sales, + 47.7% Y/Y
93% of total sales
41.9% gross margin
Q1 FISCAL 2017
7
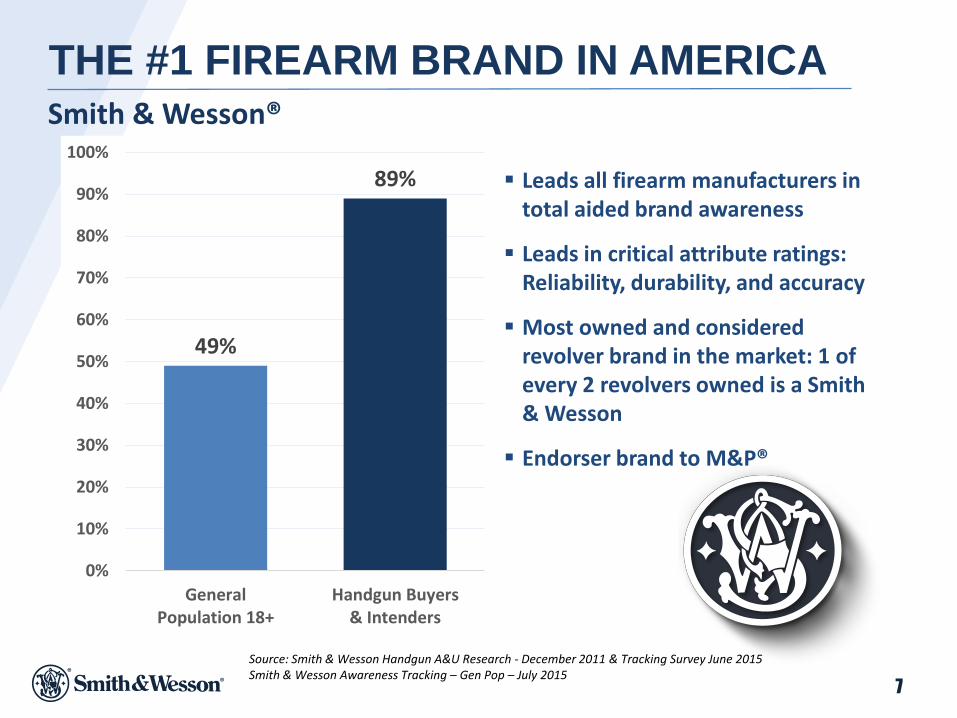
THE #1 FIREARM BRAND IN AMERICA
Leads all firearm manufacturers in total aided brand awareness
Leads in critical attribute ratings: Reliability, durability, and accuracy
Most owned and considered revolver brand in the market: 1 of every 2 revolvers owned is a Smith & Wesson
Endorser brand to M&P®
Source: Smith & Wesson Handgun A&U Research - December 2011 & Tracking Survey June 2015Smith & Wesson Awareness Tracking – Gen Pop – July 2015
Smith & Wesson®
49%
89%
0%
10%
20%
30%
40%
50%
60%
70%
80%
90%
100%
GeneralPopulation 18+
Handgun Buyers& Intenders

8
ADJUSTED NICS CY AUGUST 2016HANDGUNS +18.9% LONG GUNS +15.1% (Y/Y )
Source: National Shooting Sports Foundation (NSSF) and Smith & Wesson. The NSSF adjusts FBI NICS (National Instant Criminal Check) background check data to eliminate background checks associated with permit applications and checks on active CCW permit databases. NSSF adjusted NICS data provides a more accurate picture of market conditions. August 2016 data source is a Smith & Wesson estimate, as NSSF has not provided adjusted NICS data for that month.
January February March April May June July August September October November December
CY'08 655,143 735,314 728,992 625,494 591,123 538,963 551,314 653,380 672,421 847,531 1,210,043 1,184,246
CY'09 847,808 911,043 942,288 817,118 662,956 602,191 602,353 687,252 726,572 841,631 861,575 1,031,344
CY'10 715,309 848,036 861,408 731,955 625,763 602,908 628,125 718,971 770,310 854,563 945,463 1,133,371
CY'11 784,856 963,746 990,840 843,484 696,947 679,840 680,258 815,858 878,345 945,088 1,101,076 1,410,937
CY'12 920,840 1,266,344 1,189,152 931,660 840,412 846,437 853,355 1,042,924 1,007,259 1,118,994 1,525,177 2,237,731
CY'13 1,790,154 1,634,309 1,501,730 1,185,231 974,457 872,025 855,259 1,016,559 1,034,701 1,113,818 1,308,100 1,510,529
CY'14 970,510 1,264,010 1,224,705 988,726 877,655 805,571 816,588 989,337 1,024,272 1,174,797 1,329,688 1,624,524
CY'15 1,052,441 1,280,825 1,187,823 987,698 918,707 886,825 946,528 1,031,959 1,071,945 1,211,478 1,432,451 2,235,560
CY'16 1,362,847 1,487,274 1,289,670 1,111,205 928,532 1,140,088 1,210,731 1,211,989
0
500,000
1,000,000
1,500,000
2,000,000
2,500,000
August '16 compared to August '15
shows a 17.4% increase
TOTAL
8,993,964
9,534,131
9,436,182
10,791,275
13,780,285
14,796,872
13,090,383
14,244,240
9,742,336

99
FYQ1 FYQ2 FYQ3 FYQ4
ADJUSTED NICS FY AUGUST 2016
Source: NSSF The NSSF adjusts FBI NICS data to eliminate background checks associated with permit applications and checks on active CCW permit databases. NSSF adjusted NICS data provides a more accurate picture of market conditions. August 2016 data source is a Smith & Wesson estimate, as NSSF has not provided adjusted NICS data for that month.
May June July August September October November December January February March April
FY'10 662,956 602,191 602,353 687,252 726,572 841,631 861,575 1,031,344 715,309 848,036 861,408 731,955
FY'11 625,763 602,908 628,125 718,971 770,310 854,563 945,463 1,133,371 784,856 963,746 990,840 843,484
FY'12 696,947 679,840 680,258 815,858 878,345 945,088 1,101,076 1,410,937 920,840 1,266,344 1,189,152 931,660
FY'13 840,412 846,437 853,355 1,042,924 1,007,259 1,118,994 1,525,177 2,237,731 1,790,154 1,634,309 1,501,730 1,185,231
FY'14 974,457 872,025 855,259 1,016,559 1,034,701 1,113,818 1,308,100 1,510,529 970,510 1,264,010 1,224,705 988,726
FY'15 877,655 805,571 816,588 989,337 1,024,272 1,174,797 1,329,688 1,624,524 1,052,441 1,280,825 1,187,823 987,698
FY'16 918,707 886,825 946,528 1,031,959 1,071,945 1,211,478 1,432,451 2,235,560 1,362,847 1,487,871 1,297,275 1,130,238
FY'17 928,532 1,140,088 1,210,731 1,211,989
0
500,000
1,000,000
1,500,000
2,000,000
2,500,000
August '16 compared to August '15
shows a 17.4% increase
TOTAL
9,172,582
9,862,400
11,516,345
15,583,713
13,133,399
13,151,219
15,013,684
4,491,340

10
ADJUSTED NICS +AVG. 7.2% ANNUALLY OVER 9 YEARS*
*CY07 – CY16 YTDSource: NSSF, Smith & Wesson, and https://www.fbi.gov/about-us/cjis/nics
0
500,000
1,000,000
1,500,000
2,000,000
2,500,000
2007
2008
2009
2010
2011
2012
2013
2014
2015
2016
Actual Adj NICS Linear (Actual Adj NICS)
9,534,131+6.0% Y/Y
9,436,182-1.0% Y/Y
13,780,285+27.7% Y/Y
14,796,872+7.4% Y/Y
13,090,383-11.5% Y/Y
8,993,964+11.3% Y/Y
14,244,240+8.8% Y/Y
8,083,470+1.6% Y/Y
10,791,275+14.4% Y/Y

11
Total Handguns & Long Guns Total Handguns Total Long Guns*
Source: Federal Excise Tax collections on manufacturing sales value as translated to sales by NSSF. *Long guns include all rifles, shotguns, and muzzle loaders.
INDUSTRY SHIPMENTS: HANDGUNS AND LONG GUNS
(in Millions)
$0
$500
$1,000
$1,500
$2,000
$2,500
$3,000
$3,500
$4,000
$4,500
$5,000
$5,500
2008 2009 2010 2011 2012 2013 2014 2015 2016
Q4
Q3
Q2
Q1Q1 19.7%
$0
$500
$1,000
$1,500
$2,000
$2,500
$3,000
2008 2009 2010 2011 2012 2013 2014 2015 2016
Q4
Q3
Q2
Q1
$0
$500
$1,000
$1,500
$2,000
$2,500
$3,000
2008 2009 2010 2011 2012 2013 2014 2015 2016
Q4
Q3
Q2
Q1Q1 26.7%
Q1 11.5%

12
Smith & Wesson SW22 Victory™ targetpistol, a fully featured .22LR pistolsuitable for multiple sporting applications.Standard with adjustable fiber optic sightsand match grade, interchangeable barrelfor superb accuracy at the range or in thefield. MSRP $409
FIREARMS: NEW PRODUCTS
The acclaimed Smith &Wesson PerformanceCenter M&P Shieldpistol, in both 9mm and.40 S&W, with factoryported barrel and slide.Engineered by MasterGunsmiths, the newM&P Shield Portedpistols, provide a host ofpremium featuresdesired by the mostastute shooters. MSRP$519
Our custom designed, machine engravedSW1911 pistol, featuring a scrollworkdesign created by Smith & Wesson’sMaster Engraver using a highly precisediamond-tipped tool. The engravingembellishes the all-steel canvas andelevates the venerable 1911 platform to anew level of sophistication and beauty.MSRP $1,219
T/C Compass®, an affordable, feature-rich,bolt-action rifle that exceeds expectationsin terms of accuracy, reliability andfunctionality. MSRP $399

13
OUTDOOR PRODUCTS & ACCESSORIES SEGMENT
$14.6 million in sales, - 16.9% Y/Y
7% of total sales
47.3% gross margin
The Accessories Division was established in December 2014 with theacquisition of Battenfeld Technologies (BTI) in Missouri, whichestablished our Accessories Division. We acquired the assets of TaylorBrands, thereby eliminating a licensee and adding several knife brandsto our accessories portfolio. An Electro-Optics Division was establishedin August 2016 with the acquisition of Crimson Trace Corporation (CTC)in Oregon, a leader in laser sighting and tactical lighting.
Q1 FISCAL 2017
(Does not include Q2 acquisitions of Crimson Trace, Taylor Brands)

14
• 121 new SKU’s successfully launched at the 2016 SHOT SHOW
• Product development focus on innovation and productivity remain incredibly strong
• Engineering team expansions have more than doubled new product introductions
2016 new SKU count by Brand
Caldwell® 54
Frankford® 4
LockDown® 3
Tipton® 3
Wheeler® 12
Hooyman® 13
S&W® 9
M&P® 17
TC® 6
TOTAL 121
NEW PRODUCTS:ACCESSORIES DIVISION

15
• Acquired August 2016
• Long-standing licensee of ours that produced and sold Smith & Wesson and M&P branded knives
• Paid cash for asset acquisition
• Owner of many highly-regarded, legacy knife brands including Schrade, Uncle Henry, Old Timer, and Imperial
• This business will tuck-in to our accessories division and will provide us with an opportunity to deliver future organic growth
ACQUISITION: TAYLOR BRANDS (assets)

16
• Acquired August 2016
• Crimson Trace will serve as ideal platform for our new Electro-Optics Division
• The undisputed market leader in laser sighting & tactical lighting systems
• Long been a key supplier to our company
• Paid cash for acquisition
• New Electro-Optics Division will provide ample opportunities (organic/inorganic) for expansion
ACQUISITION: CRIMSON TRACE

17
Since 2011, our strategy has focused on unlocking the tremendous value in our firearms business
Our parallel strategy has been to expand, when the time was right, into adjacent markets
(i.e. Rugged Outdoor Market – which addresses needs of our core firearm consumers)
In 2014, we acquired BTI and entered the firearm-related and outdoor lifestyle accessories business
In 2016, we acquired Crimson Trace and entered the electro-optics business
Our objective is to expand our multi-divisional structure via additional divisions to facilitate growth and value creation (will serve Firearms & Accessories divisions, as well as future divisions)
NEW - Manufacturing Services Division
NEW – Electro-Optics Division
NEW - Shared Services Division
With strong teams operating each division, we can continue to unlock further value in firearms, while we explore acquisitions that can:
Either tuck-in to existing divisions, or operate as standalone divisions within this scalable operating structure
Deliver strong brands and products that serve the needs, wants, and desires of our core consumers
Meet strict criteria for return on investment (ROI)
Build upon our record of execution and long-term shareholder value creation
POSITIONING OUR COMPANY
FOR FUTURE GROWTH

18
Organic: Expand breadth of product portfolio
and strive towards our goal of being the
leading manufacturer in each major product
category
Firearms
EXPAND ORGANICALLY & INORGANICALLY
Inorganic: Seek companies that are strong in
product categories where S&W is weak or non-
existent, such as bolt action rifles, shotguns,
lever action rifles.
Organic: Maintain manufacturing process
flexibility, maximize plant utilization, drive
increased margins via cost reduction, and sell
manufacturing services externally (B2B)
Manufacturing Services
Inorganic: Seek companies that deliver
vertical integration of supply chain, cost
reduction, streamlined product development
processes, or incremental B2B sales, such as
MIM, stamping, and finishing
Organic: Continue new product development
and enhance existing products while
expanding customer base
Accessories
Inorganic: Seek companies with outdoor
accessory products and similar (offshore)
sourcing model. Ideal candidates have
existing sourcing base and are easily
integrated (purchase only IP and inventory)
Electro-Optics

19
FINANCIAL REVIEW

20
REVENUE - ANNUAL U.S.$ Millions
Note: Excludes Walther sales – an agreement which ended in Fiscal 2013
Note: Guidance for revenue, GAAP earnings per share, non-GAAP earnings per share, tax rate and share count reflects information as of September 1, 2016. The Company is not updating any of this guidance to the present date nor does its inclusion constitute a reiteration or modification of this information. *See Appendices for GAAP to non-GAAP reconciliations.
$0
$100
$200
$300
$400
$500
$600
$700
$800
$900
$1,000
FY13 FY14 FY15 FY16 FY17
$546
$621 $551$723
$900-$920(Estimate)

21
EARNINGS PER SHARE - ANNUAL
Note: Guidance for revenue, GAAP earnings per share, non-GAAP earnings per share, tax rate and share count reflects information as of September 1, 2016. The Company is not updating any of this guidance to the present date nor does its inclusion constitute a reiteration or modification of this information. *See Appendices for GAAP to non-GAAP reconciliations.
= Represents non-GAAP
U.S. $
FY13 FY14 FY15 FY16 FY17
$1.18
$1.49
$0.90
$1.68
$2.09-$2.19(Estimate)
$1.23
$1.55
$1.02
$1.83
$2.38-$2.48(Estimate)
= Represents GAAP
22
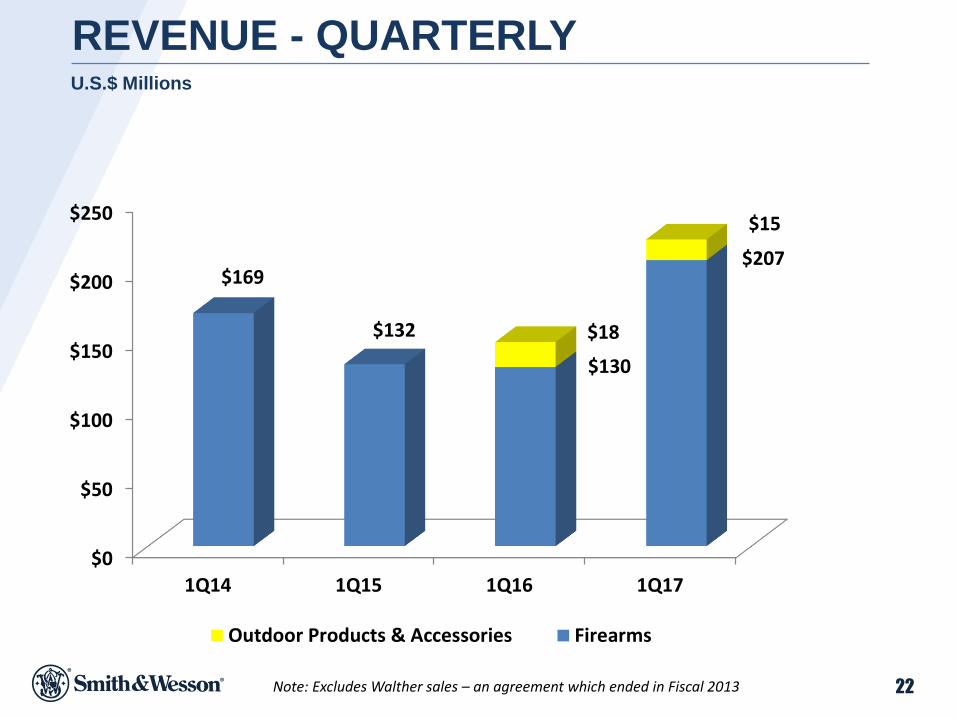
REVENUE - QUARTERLY
Note: Excludes Walther sales – an agreement which ended in Fiscal 2013
U.S.$ Millions
$0
$50
$100
$150
$200
$250
1Q14 1Q15 1Q16 1Q17
$169
$132
$130
$207
$18
$15
Outdoor Products & Accessories Firearms

23
MARGINS - QUARTERLY
GROSS MARGIN OPERATING PROFIT MARGIN
ADJUSTED EBITDAS MARGIN
1Q14 1Q15 1Q16 1Q17
42.6%
37.2%39.8%
42.3%
= Represents non-GAAP: See Appendices for GAAP to non-GAAP reconciliations.
1Q14 1Q15 1Q16 1Q17
28.1%
19.5% 20.2%25.4%
1Q14 1Q15 1Q16 1Q17
32.3%
25.4% 26.3%31.8%

24
PROFITABILITY - QUARTERLY
EARNINGS PER DILUTED SHARENET INCOME(U.S.$ Millions)
1Q14 1Q15 1Q16 1Q17
$26.5
$14.6
$17.7
$35.1
= Represents non-GAAP: See Appendices for GAAP to non-GAAP reconciliations.
1Q14 1Q15 1Q16 1Q17
$0.40
$0.26
$0.32
$0.62

25
INCOME STATEMENT
CONDENSED INCOME STATEMENT
For the three months ended: (U.S.$ Thousands, except per share data)
July 31, 2016 July 31, 2015
Net sales $206,951 $147,763
Cost of sales 119,382 88,893
Gross profit 87,569 58,870
Total operating expenses 35,045 29,053
Operating income 52,524 29,817
Total other (expense)/income (2,012) (7,206)
Income taxes 17,896 8,199
Net income 32,616 14,412
Net income per share – Diluted $0.57 $0.26
Weighted average shares outstanding – Diluted 56,883 55,487

26
BALANCE SHEET & CASH FLOW
CONDENSED BALANCE SHEET CONDENSED CASH FLOWS
For the period ending: (U.S.$ Thousands) For the three months ended: (U.S.$ Thousands)
July 31, 2016 April 30, 2016 July 31, 2016 July 31, 2015
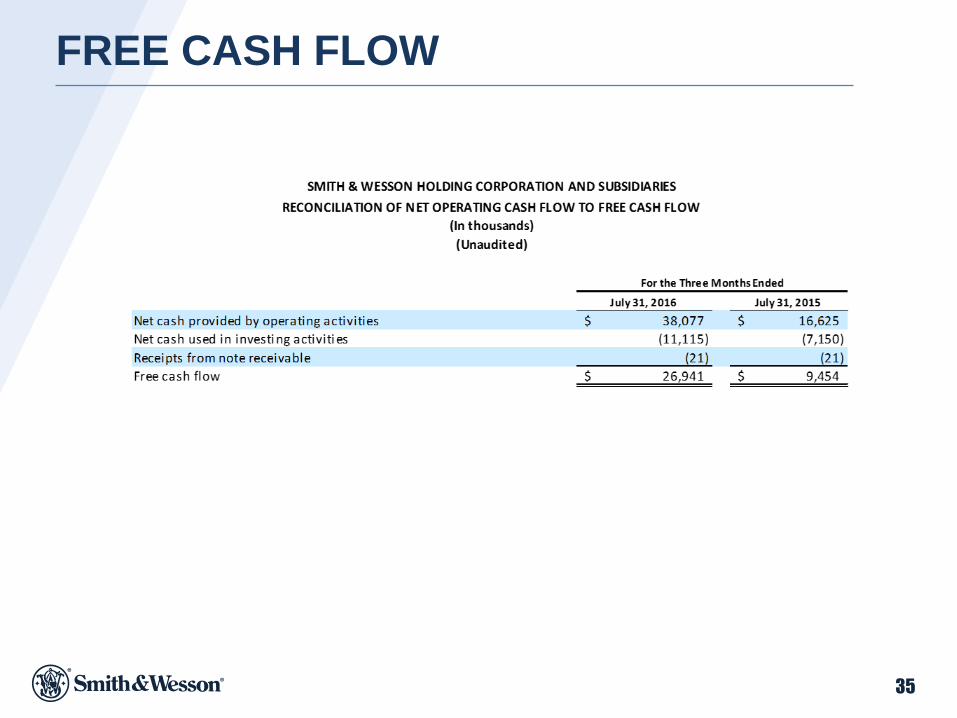
Cash and cash equivalents $ 215,012 $ 191,279 Net cash provided by operating activities $ 38,077 $ 16,625
Accounts receivable 55,711 57,792 Net cash used in investing activities (11,115) (7,150)
Inventories 87,649 77,789Net cash (used in)/provided by financing activities (3,229) 3,720
Other current assets 7,417 6,371 Net increase in cash $ 23,733 $ 13,195
Total current assets 365,789 333,231
Long-term assets 288,894 286,272
Total assets $ 654,683 $ 619,503
Current liabilities $ 126,466 $ 122,592
Other non-current liabilities 22,651 22,531
Notes payable, net of current portion 165,205 166,564
Total liabilities 314,322 311,687
Total equity 340,361 307,816
Total liabilities & equity $ 654,683 $ 619,503

27
KEY FINANCE ACTIVITIESOptimizing capital efficiency, lowering the average weighted cost of capital, and strengthening the balance sheet to support future growth initiatives
Issued $75M of 5.000% Senior Notes due 2018
Expanded credit facility from $75M to $125M
Borrowed $100M toward the acquisition of BTI (the company’s new accessories division)
Repaid entire $100M prior to April 2015 utilizing cash flows from operations
Expanded credit facility from $125M to $175M
Added $105M Term Loan A due 2020 (Interest rate 3.06%)
Repurchased $100M of 5.875% Senior Notes due 2017 with 2.9375% call premium
SHARE REPURCHASE PROGAM HIGHLIGHTS $165M in cumulative share repurchases since 2012 (14.4M shares)
Represents 21.7% reduction in public float
New $50M repurchase authorized by the Board of Directors in June 2015
JULY 2014 DECEMBER 2014 APRIL/JUNE 2015

28
FINANCIAL GUIDANCE
Note: Guidance for revenue, GAAP earnings per share, non-GAAP earnings per share, tax rate, and share count reflects information as of September 1, 2016. The Company is not updating any of this guidance to the present date nor does its inclusion constitute a reiteration or modification of this information. *See Appendices for GAAP to non-GAAP reconciliations.
FISCAL SECOND QUARTER 2017
Revenue $220M to $230M
GAAP Earnings Per Share $0.44 to $0.48
Non-GAAP Earnings Per Share* $0.53 to $0.57
FISCAL YEAR 2017
Revenue $900M to $920M
GAAP Earnings Per Share $2.09 to $2.19
Non-GAAP Earnings Per Share* $2.38 to $2.48
Tax Rate
Share Count
Estimate
Estimate
36%
57.1M
(Fiscal Year Ending April 30)

29
APPENDICES

30
INCOME STATEMENT

31
GAAP to NON-GAAP RECONCILIATION
In this presentation, certain non-GAAP financial measures, including “non-GAAP net income,” “AdjustedEBITDAS,” and “free cash flow” are presented. From time-to-time, the company considers and uses thesesupplemental measures of operating performance in order to provide the reader with an improvedunderstanding of underlying performance trends. The company believes it is useful for itself and thereader to review, as applicable, both (1) GAAP measures that include (i) amortization of acquiredintangible assets, (ii) TCA accessories transition costs, (iii) discontinued operations, (iv) DOJ and SEC costsincluding insurance recovery costs, (v) acquisition-related costs, (vi) bond premium paid, (vii) debtextinguishment costs, (viii) the tax effect of non-GAAP adjustments, (ix) net cash provided by operatingactivities, (x) net cash used in investing activities, (xi) receipts from note receivable, (xii) interest expense(xiii) income tax expense, (xiv) depreciation and amortization, and (xv) stock-based compensationexpense; and (2) the non-GAAP measures that exclude such information. The company presents thesenon-GAAP measures because it considers them an important supplemental measure of its performance.The company’s definition of these adjusted financial measures may differ from similarly named measuresused by others. The company believes these measures facilitate operating performance comparisonsfrom period to period by eliminating potential differences caused by the existence and timing of certainexpense items that would not otherwise be apparent on a GAAP basis. These non-GAAP measures havelimitations as an analytical tool and should not be considered in isolation or as a substitute for thecompany's GAAP measures. The principal limitations of these measures are that they do not reflect thecompany's actual expenses and may thus have the effect of inflating its financial measures on a GAAPbasis.

32
GAAP to NON-GAAP RECONCILIATION

33
GAAP to NON-GAAP RECONCILIATION
34
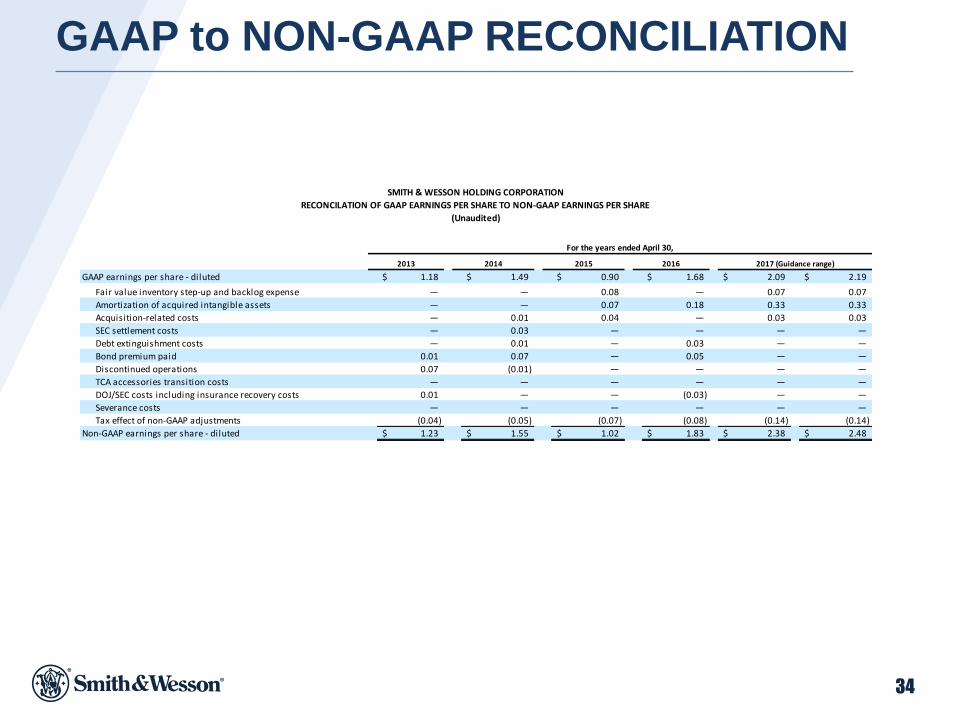
GAAP to NON-GAAP RECONCILIATION
GAAP earnings per share - diluted 1.18$ 1.49$ 0.90$ 1.68$ 2.09$ 2.19$
Fair value inventory step-up and backlog expense — — 0.08 — 0.07 0.07
Amortization of acquired intangible assets — — 0.07 0.18 0.33 0.33
Acquisition-related costs — 0.01 0.04 — 0.03 0.03
SEC settlement costs — 0.03 — — — —
Debt extinguishment costs — 0.01 — 0.03 — —
Bond premium paid 0.01 0.07 — 0.05 — —
Discontinued operations 0.07 (0.01) — — — —
TCA accessories transition costs — — — — — —
DOJ/SEC costs including insurance recovery costs 0.01 — — (0.03) — —
Severance costs — — — — — —
Tax effect of non-GAAP adjustments (0.04) (0.05) (0.07) (0.08) (0.14) (0.14)
Non-GAAP earnings per share - diluted 1.23$ 1.55$ 1.02$ 1.83$ 2.38$ 2.48$
SMITH & WESSON HOLDING CORPORATION
RECONCILATION OF GAAP EARNINGS PER SHARE TO NON-GAAP EARNINGS PER SHARE
(Unaudited)
2013 2017 (Guidance range)
For the years ended April 30,
2014 2015 2016
35
FREE CASH FLOW
36
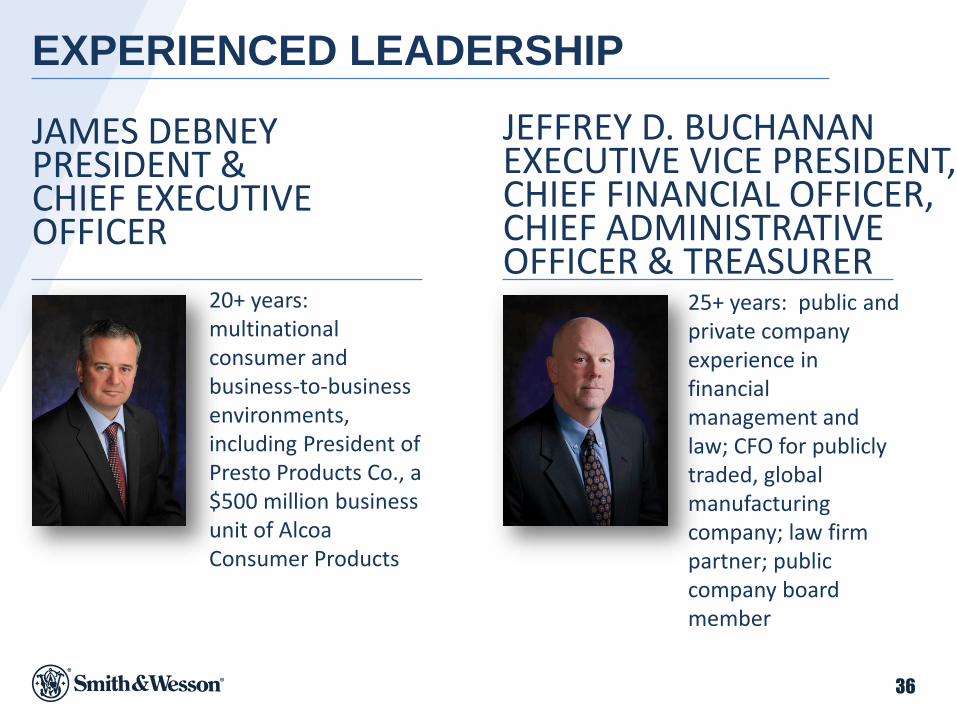
JAMES DEBNEYPRESIDENT &CHIEF EXECUTIVE OFFICER
JEFFREY D. BUCHANANEXECUTIVE VICE PRESIDENT, CHIEF FINANCIAL OFFICER, CHIEF ADMINISTRATIVE OFFICER & TREASURER
EXPERIENCED LEADERSHIP
20+ years: multinational consumer and business-to-business environments, including President of Presto Products Co., a $500 million business unit of Alcoa Consumer Products
25+ years: public and private company experience in financial management and law; CFO for publicly traded, global manufacturing company; law firm partner; public company board member

37
WWW.SMITH-WESSON.COM
NASDAQ: SWHC
SMITH & WESSON
HOLDING CORPORATION
INVESTOR PRESENTATIONSeptember 2016