smoking - nhs wales smoking ban report e...smoking is the largest single cause of avoidable ill...
TRANSCRIPT

smokingSmoking in Wales: current facts
Publication date November 2007

Authors: Rachel Dolman, Rhys Gibbon, Cath Roberts
The authors were supported by an editorial board consisting of Sue Leake, Chris Roberts and Neil Riley
Acknowledgements: Thanks to the following people for their help and support; Ginny Blakey (WAG), Hugo Cosh (NPHS), Andrea Gartner, Rhian Huws (both WCfH), Alan Jackson (WAG), Andrew Jones (NPHS), Anne Kingdon (WAG), Su Mably, Jo Menzies (both WCfH) and Ian Scale (NPHS).
Publication details:Title: Smoking in Wales: Current FactsPublisher: Wales Centre for HealthDate: November 2007ISBN: 0-9545544-4-2
This publication is also available in electronic format (portable document format) on our website: www.wch.wales.nhs.uk
Contacts:Wales Centre for Health14 Cathedral RoadCardiff CF11 9LJ
Tel: 029 2022 7744Fax: 029 2022 6749Email: [email protected]
©WCfH 2007

Smoking in Wales: current facts
Contents
Figures and tables 2
Foreword 3
Summary of key findings 4
1. Introduction 5
2. Background 6Trends in adult smoking 6
Smoking by country 7
3. Maternity, children and young people 8Smoking in pregnancy 8
Children who live in households where adults smoke 9
Smoking amongst young people 9
4. Adult smoking 12Reported smoking status of adults 12
Variations in adult smoking behaviour 13
Factors associated with smoking 15
5. Outcomes and service use 16Exposure of non-smokers to other people’s smoke 16
Smoking cessation services 16
Smoking and general health 16
Deaths from smoking-related diseases 17
6. Conclusion 18
Data sources and notes 19
Selected tables 20
1

Smoking in Wales: current facts
Figures and tables
Fig. 1 Prevalence of cigarette smoking, Wales (1978–2005) 6
Fig. 2 Cigarette smoking by country (2005) 7
Fig. 3 Mothers smoking during pregnancy, by country (2005) 8
Fig. 4 Weekly smoking amongst 15-year-olds, Wales (1986-2004) 10
Fig. 5 Weekly smoking amongst 15-year-olds for selected countries (2002) 11
Fig. 6 Smoking behaviour by sex (2005/06) 12
Fig. 7 Smoking by age group (2005/06) 13
Fig. 8 Smoking by local authority (2004/06) 14
Fig. 9 Smoking by socio-economic class (2005/06) 14
Fig. 10 Smoking by area deprivation score (2005/06) 15
Fig. 11 Non smokers exposure to passive smoke (2005/06) 16
Fig. 12 Deathsfromspecificcausesforpeopleunder75(2003-05) 17
Table 1 Percentage of adults smoking cigarettes, by sex, 1978 to 2005 20
Table 2 Percentage of 15-year-olds smoking weekly, by sex, 1986 to 2004 20
Table 3 Adults’ smoking behaviour, by sex (2005/06) 20
Table 4 Exposure of non-smoking adults to other people’s smoke, by sex (2005/06) 20
2

Smoking in Wales: current facts
Foreword by the Chief Medical Officer
Smoking is the largest single preventable cause of premature death and one of the main determinants of health inequalities. It accounts for more than half of the difference in risk of premature death between social classes, with striking differences in prevalence by social position and by geography across Wales. There is a wealth of evidence showing that our current level of smoking is a major cause of lifelong nicotine addiction, avoidable illness and premature deaths.
Against such a background, the announcement by the First Minister in September 2006 that the Welsh Assembly Government aimed to bring the smoke free legislation into force on 2 April 2007 was amajorstepforward,whichwillhaveasignificantandbeneficialimpactonthehealthofourpopulation.Maximisingthebenefitofthishistoriclegislationwillbeapriorityinthecomingyears. We anticipate a reduction in heart attack admissions, with some promising evidence from Scotland supporting this, and that smoking prevalence will reduce but we will need to sustain other actions. Current data shows that some children are taking up the habit around the age of 12. We have to try and prevent young people starting to smoke. We also need to build the campaign for smoke-free homes especially where there are children exposed to second-hand smoke.
The aim is ultimately a smoke-free Wales, but a realistic intermediate goal must be aiming to reach the 17% prevalence level which has already been achieved in both Sweden and California.
I welcome this report in casting a light on evidence relating to smoking in Wales. I would like to congratulate the project team of Cath Roberts, Rachel Dolman and Rhys Gibbon for producing this work.
Dr Tony Jewell
3

Smoking in Wales: current facts
Summary of key findings
Trends in adult smoking
The percentage of adults in Wales who smoke has fallen over the last thirty years.•
Maternity, children and young people
In 2005, 37% of mothers smoked at some stage during their pregnancy or the year •before it, with 22% of mothers smoking throughout pregnancy.
In 2005/06, 37% of households with children contained at least one adult who smoked •daily.
Regular (weekly) smoking was reported by 19% of 15-year-old boys and 28% of 15-year-•old girls in 2004.
Adult smoking
In 2005/06, 25% of adults reported that they currently smoked.•
Men were slightly more likely to smoke than women; the percentage of the population •who are smokers decreased with age.
Adults in households headed by someone in the semi-routine / routine occupation group •or someone who had never worked / was long-term unemployed were more likely to smoke than those in other socio-economic groups.
Adultsinmoredeprivedareas(asdefinedusingtheWelshIndexofMultipleDeprivation)•were more likely to smoke than those in less deprived areas.
Factors associated with smoking include age, socio-economic group, area deprivation, •housing tenure and education.
Outcomes and service use
In 2005/06, 66% of adult non-smokers said they were regularly exposed to other •people’s tobacco smoke, mostly in pubs and other public places. (This was before the introduction of the ban on smoking in enclosed public places.)
In 2006-07, more than 12,000 people contacted smoking cessation services. •
Smokers were more likely to report fair or poor health than those who did not smoke.•
An estimated 6,000 deaths per year are caused by smoking.•
It is estimated that approximately half of persistent smokers will die as a direct result •of their habit. It is also estimated that on average smokers die about 10 years younger than non-smokers.
4

Smoking in Wales: current facts
1. IntroductionSmoking is the largest single cause of avoidable ill health and early death in Wales.
Smokers are at greater risk of developing a number of diseases, including lung cancer, heart disease, and chronic obstructive pulmonary diseases (such as bronchitis). Smoking is thought to account for 8 in 10 deaths due to lung cancer, 3 in 4 deaths from chronic obstructive pulmonary disease and 1 in 5 deaths due to heart disease1. Other cancers which are linked to smoking include those of the mouth, throat, bladder, pancreas, stomach and cervix2. About half of all smokers will die from diseases caused by smoking and their risk of dying before the age of 65 is double that of non-smokers. There is also evidence that smoking damages the health of non-smokers.TheUKScientificCommitteeonTobaccoandHealthconcludedin1998thatcontactwith second-hand smoke causes lung cancer and heart disease among adult non-smokers and respiratory disease, cot death and asthma among children3.
Overall, it is estimated that smoking causes some 6,000 deaths each year in Wales. The cost to the NHS in the UK of treating smoking related diseases is £1.5 billion annually and 34 million working days are lost in England and Wales every year4 5. Smoking has also been recognised as the main reason for the gap in life expectancy between rich and poor. Therefore, reducing smoking is one of the main ways to reduce health inequalities.
Action led by the Welsh Assembly Government has focused on three areas in recent years: discouraging young people from starting to smoke; helping smokers to give up; and extending smoke-free environments. Prevention messages have been targeted at young people in primary and secondary schools in Wales, including the school-based ASSIST peer education project with 12- and 13-year-olds which is being implemented by the National Public Health Service (NPHS) following extensive development work. Working with the NPHS, community-based smoking cessation services have been established across Wales, with the numbers of smokers using the service increasing. Most recently, on 2 April 2007, legislation was introduced banning smoking in enclosed public places in Wales. It is estimated that smoke-free legislation could prevent over 400 deaths each year among non-smokers in Wales from lung cancer, heart disease, stroke and respiratory disease6.Itisalsoanticipatedthattherewillbehealthbenefitstosmokers,asexperience elsewhere suggests that smoke-free legislation can help with cutting down and giving up cigarettes.
This report aims to present a current picture of smoking in Wales, bringing together a variety of sources of statistics on smoking. The focus is on trends in smoking rates among adults and young people, socio-demographic and geographic variations, factors associated with smoking, exposure to second-hand smoke, use of smoking cessation services and outcomes in terms of health and mortality. The data present the picture prior to the introduction of the smoke-free legislation and will provide a baseline against which progress can be monitored. This work will be repeated at appropriate intervals to provide evidence of the effect of the range of policy initiatives in place in Wales.
1 Royal College of Physicians Tobacco Advisory Group (2000). Nicotine addiction in Britain. London: Royal College of Physicians.2 International Agency for Research on Cancer (2002) Tobacco smoke and involuntary smoking. IARC monographs on the evaluation
of carcinogenic risks to humans. Vol 83. Lyon: IARC3 ReportoftheScientificCommitteeonTobaccoandHealth(1998).London:DepartmentofHealth.4 Parrott S, Godfrey C, Raw M et al. (1998). Guidance for commissioners on the cost effectiveness of smoking cessation interven-
tions. Thorax v 53 (supplement 5, part 2): S15 Parrott S, Godfrey C (2004). Economics of smoking cessation. BMJ v 328, 947-949.6 David Cohen and Cathy Lisles, University of Glamorgan (2005): Modelling the Impact of a Ban on Smoking in Public Places in
Wales.
5

Smoking in Wales: current facts
2. BackgroundInformation about smoking in the population is usually gathered from sample surveys such as the General Household Survey or the Welsh Health Survey. This chapter provides a brief picture of smoking trends in Wales and a comparison with Scotland and England.
Trends in adult smoking
Information regarding smoking behaviour among adults has been reported since the 1970s through the General Household Survey (covering England, Scotland and Wales).
Figure 1 shows the trend in the percentage of cigarette smokers in Wales. It shows that the overall percentage of the population classed as current smokers fell from over 35% in 1978 to under 25% in 2005. Generally there are higher percentages of men smoking than women.
Fig. 1: Prevalence of cigarette smoking, Wales (1978–2005*)
Prevalence of cigarette smoking, Wales (1978-2005*) Source: GHS
0
5
10
15
20
25
30
35
40
45
50
1978
1982
1986
1990
1994
1998
**
2000
**
2001
**
2002
**
2003
**
2004
**
2005
**
Per
centa
ge
Men Women
* Information on smoking has been collected annually from 2000 onwards** Weighted data
Source: General Household Survey
6

Smoking in Wales: current facts
Smoking by country
Figure 2 shows the percentage of adult cigarette smokers in England, Scotland and Wales for 2005. The chart illustrates that smoking rates are higher in Scotland than in England and Wales. Of the three nations, Wales has the lowest percentage. However, this difference is unlikely to be significantduetotherelativelysmallsampleineachcountry.
Fig. 2: Cigarette smoking by country (2005)
Cigarette smoking by country, (2005)Source: GHS
0
5
10
15
20
25
30
Wales England Scotland
Perc
enta
ge
Source: General Household Survey
7
Smoking in Wales: current facts
3. Maternity, children and young peopleThis chapter illustrates the extent to which children and unborn babies are exposed to tobacco smoke. Exposure during pregnancy and at an early age can lead to a greater chance of low birth weight, cot death and lung cancer in later life7. Smoking behaviour among young people is also analysed here.
Smoking in pregnancy
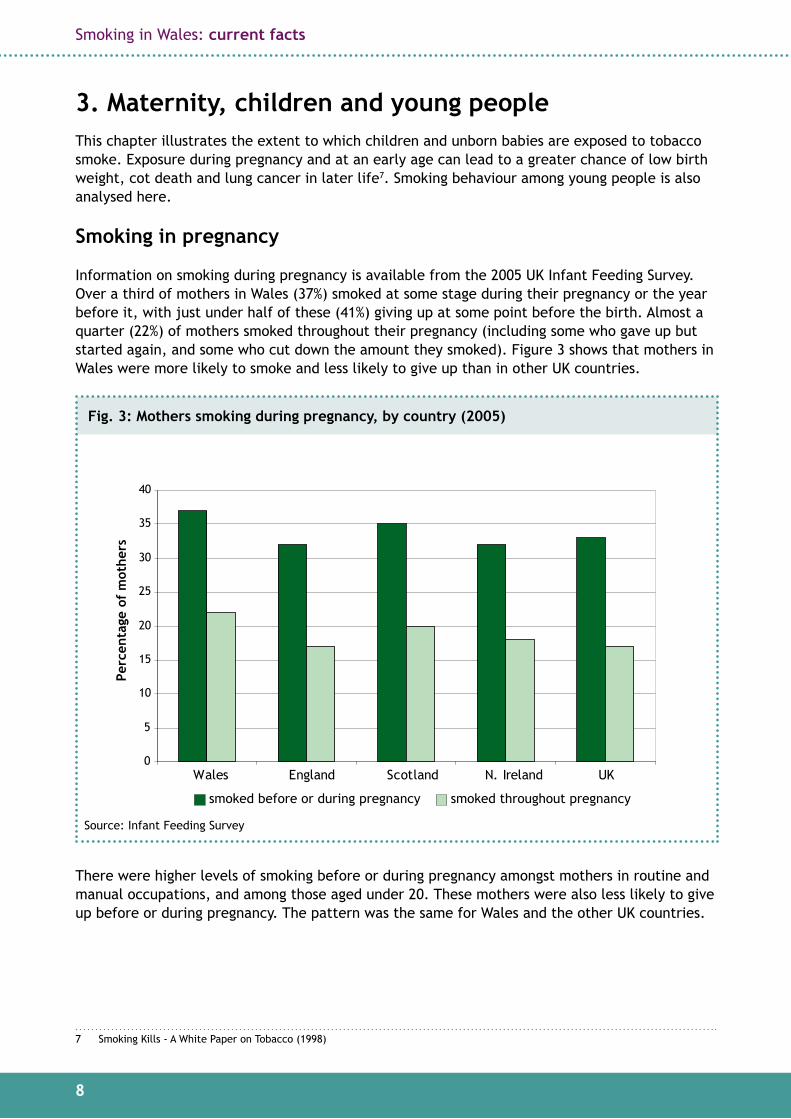
Information on smoking during pregnancy is available from the 2005 UK Infant Feeding Survey. Over a third of mothers in Wales (37%) smoked at some stage during their pregnancy or the year before it, with just under half of these (41%) giving up at some point before the birth. Almost a quarter (22%) of mothers smoked throughout their pregnancy (including some who gave up but started again, and some who cut down the amount they smoked). Figure 3 shows that mothers in Wales were more likely to smoke and less likely to give up than in other UK countries.
Fig. 3: Mothers smoking during pregnancy, by country (2005)
Mothers smoking during pregnancy, by country (2005)Source: IFS
0
5
10
15
20
25
30
35
40
Wales England Scotland N. Ireland UK
Perc
enta
ge o
f m
othe
rs
smoked before or during pregnancy smoked throughout pregnancy
Source: Infant Feeding Survey
There were higher levels of smoking before or during pregnancy amongst mothers in routine and manual occupations, and among those aged under 20. These mothers were also less likely to give up before or during pregnancy. The pattern was the same for Wales and the other UK countries.
7 Smoking Kills - A White Paper on Tobacco (1998)
8

Smoking in Wales: current facts
After the birth, mothers were asked not only whether they or anyone in the household smoked, but also whether anyone ever smoked inside the home. This gives some indication of the proportion of young infants who are likely to be exposed to tobacco smoke in the home. After 4-6 months, 6% of all mothers in Wales said that they sometimes smoked in the home (that is 29% of mothers who smoke). Overall, 10% of infants lived in a household where at least one person sometimessmokedinthehome.After8-10months,thefiguresformotherssmokinginthehomeand for at least one person smoking in the home were 6% and 9% respectively.
Children who live in households where adults smoke
As well as questions about smoking, the Welsh Health Survey includes questions on the composition of the household. It is therefore possible to identify households containing children and look at the smoking behaviour of adults in these households. In 2005/06, 37% of households with children contained at least one adult who smoked daily (with 43% containing at least one adult who smoked daily or occasionally). From 2007 it will also be possible to look at households with children where an adult smokes in the home.
Smoking amongst young people
Smoking behaviour often starts during adolescence and affects health-related outcomes in later life. Evidence suggests that the later someone starts smoking the less likely it is that they will become addicted8. Smoking behaviour in young people is monitored through the Health Behaviour in School-aged Children Study, an international study in which Wales participates.
The HBSC study uses the following questions to measure smoking behaviour: whether someone haseversmokedtobacco,howoftentheysmokeatpresent,andtheageatwhichtheyfirstsmoked a cigarette.
The proportion of young people in Wales reporting that they have ever smoked tobacco (at least one cigarette, cigar or pipe) rose steadily from age 11 to age 15, with more girls than boys reporting having tried smoking. In 2002, 51% of boys and 65% of girls aged 15 reported ever having smoked.
8 US Department of Health and Human Services (1994). Preventing tobacco use among young people: a report of the Surgeon General.
9

Smoking in Wales: current facts
The proportion of 15-year-olds reporting that they smoke weekly can be used as an indicator of regularsmoking,andthetrendforWalesisshowninfigure4.Ahigherlevelofweeklysmokingwas reported by girls than boys (28% for girls compared with 19% for boys in 2004). Regular (weekly) smoking among 15-year-olds rose sharply between 1988 and 1996, rates then stabilised among girls and fell among boys. A slight drop was observed for girls between 2000 and 2002, thefirstfallrecordedsince1988.Whilstthemostrecentfiguresfor2004showedaslightriseforboth boys and girls it would be inappropriate to conclude that smoking amongst young people was rising based on this one year of data. Further data will allow continued monitoring.
Fig. 4: Weekly smoking amongst 15-year-olds, Wales (1986-2004)
Weekly smoking amongst 15-year-olds, Wales (1986-2004)Source: HBSC
0
5
10
15
20
25
30
35
1986 1988 1990 1992 1994 1996 1998 2000 2002 2004
Perc
enta
ge
boys girls
Source: Health Behaviour in School-aged Children
10
Smoking in Wales: current facts
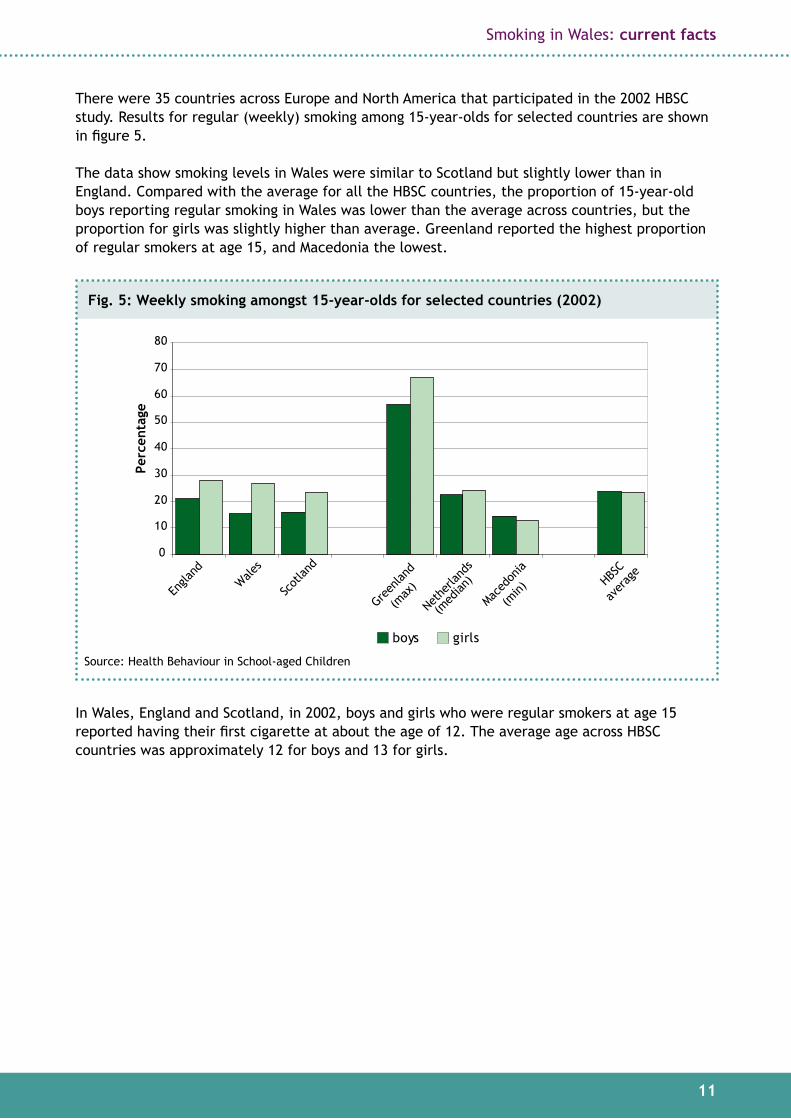
There were 35 countries across Europe and North America that participated in the 2002 HBSC study. Results for regular (weekly) smoking among 15-year-olds for selected countries are shown infigure5.
The data show smoking levels in Wales were similar to Scotland but slightly lower than in England. Compared with the average for all the HBSC countries, the proportion of 15-year-old boys reporting regular smoking in Wales was lower than the average across countries, but the proportion for girls was slightly higher than average. Greenland reported the highest proportion of regular smokers at age 15, and Macedonia the lowest.
Fig. 5: Weekly smoking amongst 15-year-olds for selected countries (2002)
Weekly smoking amongst 15-year-olds for selected countries (2002)Source: HBSC
0
10
20
30
40
50
60
70
80
Engla
ndWale
s
Scot
land
Green
land
(max
)
Neth
erlan
ds
(med
ian)
Maced
onia
(min)
HBSC
aver
age
Perc
enta
ge
boys girls
Source: Health Behaviour in School-aged Children
In Wales, England and Scotland, in 2002, boys and girls who were regular smokers at age 15 reportedhavingtheirfirstcigaretteatabouttheageof12.TheaverageageacrossHBSCcountries was approximately 12 for boys and 13 for girls.
11

Smoking in Wales: current facts
4. Adult smokingThis chapter uses data from the Welsh Health Survey to look at smoking behaviour of adults in Wales and the prevalence amongst different population sub-groups. Identifying patterns in smoking prevalence can help target interventions.
Reported smoking status of adults
In the 2005/06 Welsh Health Survey, 25% of adults reported that they currently smoke, 28% that they used to smoke, and 47% that they have never smoked. This suggests that around 600,000 adults in Wales smoke (either daily or occasionally). The proportion who reported smoking in the Welsh Health Survey was slightly higher than that reported in the General Household Survey. This may be due to differences in the precise questions asked, the context of the surveys, and the factthatthefiguresquotedfromtheGeneralHouseholdSurveyincludecigarettesmokersonlyand may exclude a small number of people who smoke only a pipe or cigar.
Figure 6 shows the reported smoking behaviour of adults by sex. It illustrates that the percentage who have ‘never smoked’ is higher amongst women than men. A higher percentage of men than women reported themselves as ‘daily smokers’. Fewer women ‘ex-smokers’ supports this pattern suggesting that historically there have been fewer women smokers than men.
Smoking behaviour by sex (2005/6) Source: WHS
0
10
20
30
40
50
60
Dailysmoker
Occasionalsmoker
Smoker(a)
Ex-dailysmoker
Ex-occasional
smoker
Ex-smoker(b)
Neversmoked
Perc
enta
ge
Men aged 16+ Women aged 16+
Fig. 6: Smoking behaviour by sex (2005/06)
Source: Welsh Health Survey
Smoker (a) indicates those who smoke either daily or occasionally, and ex-smoker (b) indicates those who used to smoke either daily or occasionally.
12
Smoking in Wales: current facts
Variations in adult smoking behaviour
Adults’ smoking behaviour can be analysed by age, sex and where they live. Data on socio-economicclassificationanddeprivationofanareacanalsobeapplied.
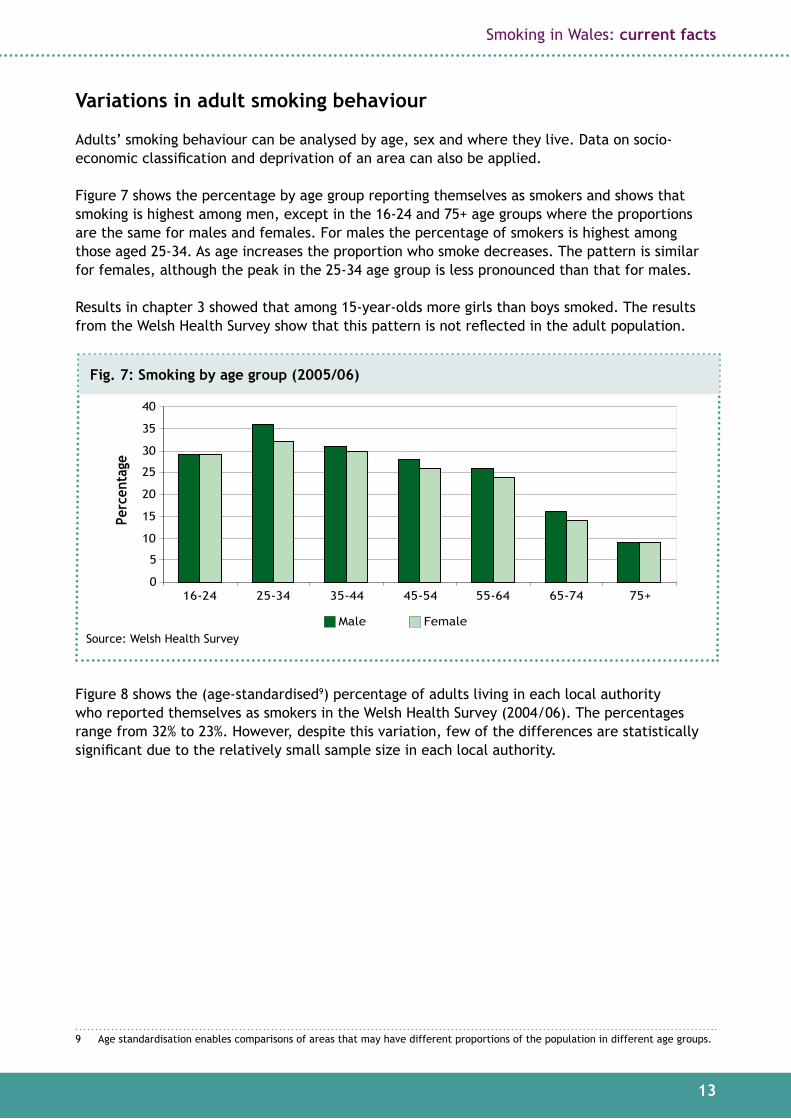
Figure 7 shows the percentage by age group reporting themselves as smokers and shows that smoking is highest among men, except in the 16-24 and 75+ age groups where the proportions are the same for males and females. For males the percentage of smokers is highest among those aged 25-34. As age increases the proportion who smoke decreases. The pattern is similar for females, although the peak in the 25-34 age group is less pronounced than that for males.
Results in chapter 3 showed that among 15-year-olds more girls than boys smoked. The results fromtheWelshHealthSurveyshowthatthispatternisnotreflectedintheadultpopulation.
Smoking by age group (2005/06)Source: WHS
0
5
10
15
20
25
30
35
40
16-24 25-34 35-44 45-54 55-64 65-74 75+
Perc
enta
ge
Male Female
Fig. 7: Smoking by age group (2005/06)
Source: Welsh Health Survey
Figure 8 shows the (age-standardised9) percentage of adults living in each local authority who reported themselves as smokers in the Welsh Health Survey (2004/06). The percentages range from 32% to 23%. However, despite this variation, few of the differences are statistically significantduetotherelativelysmallsamplesizeineachlocalauthority.
9 Age standardisation enables comparisons of areas that may have different proportions of the population in different age groups.
13

Smoking in Wales: current facts
0
5
10
15
20
25
30
35
Blae
nau G
went
Caer
phill
y
Gwyned
d
Bridg
end
Conw
y
Neat
Por
t Talb
ot
Rhon
dda C
ynon
Taf
Torfa
en
Wre
xham
Card
iff
Denb
ighsh
ire
Merth
yr T
ydfil
Newpo
rt
Pembr
okes
hire
Swan
sea
The V
ale of
Glam
orga
n
Flint
shire
Powys
Carm
arth
ensh
ire
Cere
digion
Isle o
f Ang
lesey
Monmou
thsh
ire
Age
-sta
ndar
dise
d pe
rcen
tage
Wales
Fig. 8: Smoking by local authority (2004/06)
Source: Welsh Health Survey
Figure 9 shows the (age-standardised) percentage of adults who said they currently smoked, by socio-economic group of the household (using NS-SEC10). The chart illustrates that adults in households headed by someone in the higher managerial and professional group were least likely to smoke (12%); those in households headed by someone in the semi-routine, routine occupation group or someone who had never worked or was long-term unemployed were most likely to smoke (between 34% and 48%).
Smoking by socio-economic class* (2005/06)Source: WHS
0
10
20
30
40
50
Higher
man
ager
ial
and
prof
essio
nal
Lower
man
ager
ial
and
prof
essio
nal
Inter
med
iate
Small
empl
oyer
s
and
own ac
coun
t
Lower
supe
rviso
ry
and
tech
nica
l
Semi-r
outin
e
Rout
ine
Neve
r wor
ked
and
long
-term
unem
ploy
ed
Age-
stan
dard
ised
per
cent
age
*National Statistics Socio-Economic Classification (NS-SEC)
Fig. 9: Smoking by socio-economic class* (2005/06)
Source: Welsh Health Survey
10 NS-SECisanoccupationallybasedclassificationofsocio-economicposition,introducedduring2001foruseinofficialstatisticsand surveys. Here the operational categories have been aggregated to eight, based on occupation. NS-SEC of the household reference person is used.
14

Smoking in Wales: current facts
Figure 10 shows adult smokers analysed by area deprivation, based on the Welsh Index of Multiple Deprivation11.Thatisitshowsthepercentageintheleastdeprivedfifthofthepopulationwhosmoke,uptothepercentageinthemostdeprivedfifth.Thechartsuggeststhatthere is a relationship between deprivation and smoking status, with higher smoking rates in the moredeprivedfifths,comparedtotheleastdeprivedfifth.
Smoking by area deprivation scoreSource WHS (2005/06), WIMD 2005
0
5
10
15
20
25
30
35
40
1 (least deprived) 2 3 4 5 (most deprived)
Perc
enta
ge
Fig. 10: Smoking by area deprivation score (2005/06)
Source: Welsh Health Survey (2005/06), Welsh Index of Multiple Deprivation 2005
Factors associated with smoking
To explore the factors associated with smoking among adults, various statistical techniques, such as logistic regression, can be used. The data from the Welsh Health Survey were analysed in this way12.
Resultsformenandwomenwerelookedatseparately,andthefactorsfoundtobesignificantlyassociated with smoking were age, socio-economic group (of household), Welsh Index of Multiple Deprivationscore,housingtenure,andhighesteducationalqualification.Inaddition,economicstatuswasfoundtobesignificantformen,andethnicoriginforwomen.Localauthorityofresidencewasnotsignificantoncetheothervariablesweretakenintoaccount.
The odds of smoking, once other factors were taken into account, were highest among men aged 25-34 and women aged 25-44, thereafter they dropped with increasing age. In general, higher odds of smoking were associated with routine and manual occupation households, increased areadeprivation,livinginrentedaccommodation,andlowerlevels(orlack)ofqualification.Unemployed men had higher odds of smoking than those in employment, and white women had higher odds than non-white women.
11 The WIMD is made up of a number of domains including income, employment, health, education, housing, physical environment, and access to services, plus an overall index combining all the domains. WIMD 2005 gives deprivation scores for small areas inWales(LowerLayerSuperOutputAreas,orLSOA).LSOAsweresplitinto“fifths”ofdeprivationaccordingtooverallWIMDdeprivationscores,andeachrespondenttotheWelshHealthSurveywasallocatedtotherelevantfifth.(E.g.Ofthe1,896LSOAsinWales,thefirstbarshowstheresultforthe379leastdeprivedLSOAsandthefifthbarshowstheresultforthe379mostdeprived LSOAs.) Information on the WIMD can be found at http://www.wales.gov.uk/statistics.
12 Full details of the logistic regression are given in a separate report, available through the Welsh Health Survey webpages. Welsh Health Survey data from 2003/04 and 2004/05 combined was used. The technique estimates the independent effect of each factor on smoking after adjusting for all other factors in the model. For instance, it may be used to look at the effect of socio-economic class on the likelihood of smoking after taking account of other factors such as age, housing tenure and educational qualifications.
15

Smoking in Wales: current facts
5. Outcomes and service use This chapter discusses the outcomes of exposure to tobacco smoke. It focuses on exposure of non-smokers to tobacco smoke, before the ban on smoking in enclosed public places was introduced in April 2007; the uptake of smoking cessation services within Wales; smoking and general health and deaths from smoking-related diseases.
Exposure of non-smokers to other people’s smoke
The Welsh Health Survey asks adults whether they are regularly exposed to other people’s tobacco smoke in a range of places. In 2005/06, 66% of non-smokers said that they were. Figure 11 shows that most non-smokers reported exposure to second-hand smoke in pubs and in ‘other public places’. Other places included other people’s homes, on public transport, at work and within the home. The ban on smoking in enclosed public places (introduced in Wales from April 2007) will directly affect the levels of smoke individuals are exposed to. In future years the patternofexposurereflectedbythischartisexpectedtochange,withoverallnumbersfallingand the percentage exposed in their own and other people’s homes making up most of those exposed.
Non smokers exposure* to passive smoke (2005/06)Source: WHS
0
10
20
30
40
50
60
On publictransport
At home At work In otherpeople'shomes
In otherpublic places
In pubs
Perc
enta
ge
* Those reporting exposure to smoke in more than one type of place are counted in each relevant category
Fig. 11: Non smokers exposure* to passive smoke (2005/06)
Source: Welsh Health Survey
Smoking cessation services
For the year April 2006-March 2007, people living in Wales made around 12,700 contacts with National Public Health Service smoking cessation services. The number of smokers who participated in a treatment programme was around 9,400, and the number remaining smoke free atthe4-weekstagewasaround4,800.Allfiguresshowedanincreaseonthepreviousyear.
Smoking and general health
A simple comparison between smoking behaviour and general health would not take account of theinfluenceofotherfactorsorthedifferentcharacteristicsofsmokersandnon-smokers.Work
16

Smoking in Wales: current facts
in Scotland examined factors associated with poor self-assessed health13. It found that for both menandwomeninScotland,ex-regularsmokersandcurrentcigarettesmokershadsignificantlyhigher odds of poor health compared with those who had never smoked. Some exploratory work on the Welsh Health Survey using similar techniques suggested that current smoking was significantlyassociatedwithgeneralhealth,andthatmenandwomenwhowerecurrentsmokerswere more likely to report fair or poor health than those who did not smoke14.
Deaths from smoking-related diseases
It has been estimated that between 1998 and 2002 an average of 6,000 deaths per year were caused by smoking in Wales, and that 24% of male deaths and 12% of female deaths were attributable to smoking15. It is also estimated that approximately half of persistent smokers will die from a condition associated with their habit, that stopping smoking reduces the hazard, and that on average cigarette smokers who continue to smoke die about 10 years younger than life-long non-smokers16.
Figure 12 shows the direct standardised rate (DSR) (standardised to the European population) formortalityfromsomespecificcausesofdeath:lungcancer,coronaryheartdisease(CHD),respiratory disease and chronic obstructive pulmonary disease (COPD) by sex for those aged under 75. This provides an indication of early death. The chart indicates that there are higher rates of death from lung cancer, CHD, respiratory disease and COPD in men compared to women. There are a number of reasons why people develop these diseases but one of the main ones is smoking.
Deaths from specific causes for people under 75 (2003-05) Source: Healthshow
0
10
20
30
40
50
60
70
80
90
100
Coronary HeartDisease
Respiratory Lung Cancer Chronic ObstructivePulmonary Disease
Age
sta
ndar
dise
d ra
te p
er 1
00,0
00
Males Females
Fig. 12: Deaths from specific causes for people under 75 (2003-05)
Source: Healthshow
13 Scottish Executive (2005). The Scottish Health Survey 2003. The work used logistic regression - by simultaneously controlling for a number of factors, the independent effect each factor has on the variable of interest can be established.
14 Unpublished report by National Centre for Social Research (2007). Applying logistic regression techniques to Welsh Health Survey data.
15 Health Development Agency (2004). The smoking epidemic in England.16 Doll et al (2004). Mortality in relation to smoking: 50 years’ observations on male British doctors. British Medical Journal.
328:1519
17

Smoking in Wales: current facts
6. Conclusion
This report has presented a range of statistics related to smoking prior to the ban on smoking in enclosed public places. Evidence from those countries where a ban has been introduced, mostrecentlyfromScotland,demonstratesthattherewillbeabeneficialimpactonthehealthof people in Wales in the long term, with an immediate reduction in individuals’ exposure to environmental tobacco smoke.
Whilst the ban on smoking in enclosed public places will reduce environmental tobacco smoke, the evidence in this report suggests that the culture and attitude towards smoking must also change, particularly amongst school children and young people. Other policies such as the school-based ASSIST peer education project and community-based smoking cessation services should complement the ban on smoking in enclosed public places.
This report will be repeated after an appropriate interval to help monitor progress in this area.
18

Smoking in Wales: current facts
General Household Survey (GHS)TheGeneralHouseholdSurveyisconductedbytheOfficeforNationalStatisticsandprovidesestimates for England, Scotland and Wales. The survey is used to present a picture of households, families and individuals. It commenced in 1971 and has been conducted annually since, except for breaks to review it in 1997/1998 and for re-development work in 1999/2000.
Questions about smoking behaviour have been asked of GHS respondents aged 16 and over in alternate years since 1974. Since 2000 the smoking questions have been included every year.
Care should be used when comparing different years as weighting to compensate for non-response has been introduced in recent years. The effect of weighting on smoking data is small, increasing the overall levels of smoking as weighting reduces the contribution to the overall figureofthoseaged60andover,amongwhomsmokingisrelativelylow.www.statistics.gov.uk/statbase/Product.asp?vlnk=5756
Health Behaviour in School-aged Children (HBSC) The Health Behaviour in School-aged Children study is a cross-national research study conducted incollaborationwiththeWorldHeathOrganisation(WHO)RegionalOfficeforEurope.Itinvolvescountries from Europe and North America. Surveys are conducted every four years, and Wales has also undertaken interim surveys every two years. The study is school-based, and in Wales involves a sample of pupils aged around 11,13 and 15. www.hbsc.org/ www.hbsc.org/countries/wales.html
Infant Feeding Survey (IFS)The 2005 Infant Feeding Survey is a national survey providing estimates for the four countries of the UK. It covers the incidence, prevalence and duration of breastfeeding and other feeding practicesadoptedbymothersinthefirsteighttotenmonthsaftertheirbabywasborn,togetherwith information about their smoking and alcohol use.www.ic.nhs.uk/statistics-and-data-collections/health-and-lifestyles/infant-feeding/infant-feeding-survey-2005
Welsh Health Survey (WHS)The Welsh Health Survey is a source of information about the health and health-related lifestyle of people in Wales. It started in 2003/04 and around 15,000 adults participate fully each year. It is nationally representative of people of different ages, sex and geographic area. Figures shown in this report are for 2005/06 unless otherwise stated.www.wales.gov.uk/statistics
Age-standardisationTheprevalenceofsmokingvariesbyage,andsodifferentageprofilesindifferentgroupsofpeople can affect comparisons between them. Age standardisation has been used on selected data within the Welsh Health Survey to remove the confounding factor of age when comparing indicatorsaffectedbyageorareasofresidencewithdifferentageprofiles.PleaseseetheWelshHealth Survey report for further details. Age-standardisation has also been applied to mortality data.
Data sources and notes
19

Smoking in Wales: current facts
Selected tablesThissectionincludesselectedtablesofkeyfiguresforWales.Moredetailedtablesareavailablein reports of the data sources mentioned above.
Table 1 – Percentage of adults smoking cigarettes, by sex, 1978 to 2005 Per cent
1978 1982 1986 1990 1994 1998* 2000* 2001* 2002* 2003* 2004* 2005*Men 44 36 33 30 28 29 25 27 27 29 24 24Women 37 34 30 31 27 27 24 26 27 26 22 21All persons 40 35 31 31 27 28 25 27 27 27 23 22* indicates weighted dataSource: General Household Survey (GHS)
Table 2 – Percentage of 15-year-olds smoking weekly, by sex, 1986 to 2004 Per cent
1986 1988 1990 1992 1994 1996 1998 2000 2002 2004Boys 16 12 14 18 18 23 21 20 16 19Girls 20 19 22 25 26 29 29 29 27 28
Source: Health Behaviour in School-aged Children (HBSC)
Table 3 – Adults’ smoking behaviour, by sex (2005/06)Per cent
Daily
smokerOccasional
smokerSmoker
(a)Ex-daily smoker
Ex-occasional
smokerEx-smoker
(b)Never
smoked
Non-smoker
(c)Men 21 5 27 18 12 30 43 73Women 20 5 24 13 12 25 51 76All persons 20 5 25 15 12 28 47 75
Includes those who smoke daily or occasionally(a) Includes those who used to smoke daily or occasionally(b) Includes those who used to smoke daily or occasionally, and those who have never smoked(c)
Source: 2005/06 Welsh Health Survey (WHS)
Table 4 – Exposure of non-smoking adults to other people’s smoke, by sex (2005/06)Per cent
Regularly exposed to passive smoke when:
Regularly exposed
to passive smoke At home At work
In other people’s homes
On public transport In pubs
In other public places
Non-smoking men 70 11 14 21 11 57 48Non-smoking women 63 11 8 22 10 46 46All non-smokers 66 11 11 21 10 52 47
Source: 2005/06 Welsh Health Survey (WHS)
20