snap annual report - fns-prod.azureedge.net · by the retailer policy and management ... 632 stores...
TRANSCRIPT

SNAP Retailer Management
2014 Annual Report

2
TABLE OF CONTENTS Year 2014 in Review ………………………………………………………………. 3‐5 Fiscal Year 2014 at a Glance …………………………………………………… 6 Redemp ons by Firm Type ……………………………………………………. 7 Redemp ons by Region and State …………………………………………. 8‐9 Administra ve Ac vity …………………………………………………………. 10 Farmers’ Markets and Direct Marke ng Farmers …………………… 11 Key Facts About SNAP Farmers’ Markets Par cipa on …………… 12 Compliance Ac vity ………………………………………………………………. 13 Undercover Retailer Inves ga ons ………………………………………… 14 Administra ve Review …………………………………………………………… 15‐16 Sanc ons in Fiscal Year 2014 by State ……………………………………. 17‐18 Sanc ons in Fiscal Year 2014 by Store Type ……………………………. 19

3
RPMD con nues to oversee na onal SNAP retailer and issuance policy, manage na onal systems and contracts, and handle due process ac vi es associated with retailer sanc ons. ROD staff perform front‐end authoriza on, reauthoriza on (re‐assessment of the eligibility of par cipa ng stores and businesses), maintenance and administra on related to retailer par cipa on, administra ve sanc on ac vi es, and retailer inves ga ons in coordina on with compliance partners (i.e. USDA Office of the Inspector General, State Law Enforcement Bureaus, Special Supplemental Nutri on Program for Women, Infants and Children). The Year In Review In fiscal year 2014 slightly over $70 billion in client benefits were redeemed in the 261,150 par cipa ng stores, farmers’ markets, direct marke ng farmers, homeless meal providers, treatment centers, group homes, and others authorized to accept SNAP. Due to changes in benefit levels and par cipa on, there has been a decrease in na onwide redemp ons of close to $6 billion since FY 2013.* Over the past five fiscal years, the number of authorized firms has increased by more than 20 percent. Informa on regarding trends in overall retailer par cipa on can be found on page 6. Supermarkets and superstores made up just 14.37 percent of the 261,150 firms authorized in fiscal year 2014 but con nue to redeem the majority (81.67 percent) of benefits. The percentage of benefits redeemed by each of the 25 firm types is found on page 7. A State‐by‐State breakdown of the amount of benefits and percentage of authorized firms is found on pages 8‐9.
The Department of Agriculture’s (USDA) Food
and Nutri on Service (FNS) is directly responsible for the authoriza on and oversight of retailers who par cipate in the Supplemental Nutri on Assistance Program (SNAP). In fiscal year 2014, this was accomplished jointly by the Retailer Policy and Management Division (RPMD) within SNAP, and the Retailer Opera ons Division (ROD) within FNS’ Regional Opera ons and Support.
*Unless otherwise noted, all data in this report were obtained from the Store Tracking and Redemp on System (STARS) Man‐
agement Ac vity Reports.

4
Administra ve Ac ons: Over 99,500 administra ve ac ons, from authoriza on to withdrawal, took place in fiscal year 2014. Administra ve Ac ons are detailed on page 10. Farmers’ Markets: As one of many ini a ves focused on improving access to healthy foods, USDA’s strategic plan includes a goal to increase farmers’ market par cipa on in SNAP. In fiscal year 2014 farmers’ markets and direct marke ng farmers par cipa ng in SNAP increased by approximately 25 percent from fiscal year 2013. Page 11 reflects the con nual steady growth in the number of par cipa ng farmers’ markets and direct marke ng farmers. Maintaining Program Integrity: The retailer management team con nues ac vely working on behalf of American taxpayers to protect the Federal investment in SNAP. Comba ng abuse and misuse of SNAP benefits is a top priority. The sale/purchase of SNAP benefits for cash is one of several serious program viola ons that fall under the defini on of trafficking. Trafficking is punishable by administra ve ac on (i.e. permanent disqualifica on and monetary penal es), civil, and/or criminal prosecu on. Over the last 15 years, FNS aggressively implemented a number of measures to reduce the prevalence of trafficking in SNAP. As a result, the trafficking rate was reduced from 4 percent in the 1990’s to 1.3 percent during the period 2009 through 2011. The most recent trafficking report is available at h p://www.fns.usda.gov/extent‐trafficking‐supplemental‐nutri on‐assistance‐program‐2009‐2011‐august‐2013. FNS uses a fraud detec on system to monitor electronic transac on ac vity at the store level and to iden fy suspicious retail grocers for further analysis and inves ga on. FNS has con nually updated the system to capitalize on new, more advanced technology and to make use of innova ve analy cal tools to strengthen our fraud detec on capabili es. This system is instrumental to our success in iden fying violators and decreasing trafficking because it allows FNS to detect and prosecute bad actors who defraud the Program. In fiscal year 2014, compliance analysts across the country reviewed the transac ons of over
17,700 stores iden fied by the system. ROD conducted nearly 7,700 inves ga ons of
authorized retail grocers to determine compliance with program regula ons.
Of the 2,226 sanc ons in FY 2014, 1,496 stores were permanently disqualified and another 632 stores were given a me‐limited term disqualifica on.
5
Retailers who are sanc oned for SNAP viola ons and also par cipate in the WIC Program are reciprocally disqualified from the WIC Program, and retailers who are sanc oned for WIC viola ons are subject to disqualifica on from SNAP. FNS relies on its inves ga ve partners, including the USDA Office of Inspector General (OIG) and State Law Enforcement Bureaus (SLEB), to complement FNS inves ga ve resources. OIG is the primary inves ga ve arm for FNS Programs; it pursues criminal prosecu on of viola ng retailers. SLEBs can also bring criminal cases against violators based on State and local statutes. Fiscal year 2014 compliance ac vi es including inves ga on, adjudica on, and final sanc on are found detailed on pages 13 through 19. More informa on about FNS efforts to combat fraud and abuse is available and can be found on‐line at h p://www.fns.usda.gov/. Retailer Management: The Agricultural Act of 2014 brought many significant changes to SNAP retailer policy and opera ons. To make retailers and other stakeholders aware of these changes following the bill’s passage in February 2014, SNAP released Policy Memoranda and Ques ons and Answers to provide guidance to States and retailers on the new provisions. A significant provision of the Agricultural Act of 2014 no longer allows SNAP‐authorized retailers to receive free Electronic Benefit Transfer (EBT) equipment, supplies and related services. As of September 21, 2014 all SNAP‐authorized retailers, with the excep on of certain firms, were required to make arrangements to lease or purchase EBT equipment and services.* More informa on about SNAP Provisions and the Agricultural Act of 2014 can be found on‐line at h p://www.fns.usda.gov/snap/2014‐farm‐bill‐implementa on.
*Firm excep ons include: Farmers’ markets, direct‐marke ng farmers, military commissaries, non‐profit food buying coop‐era ves, group living arrangements, treatment centers, and prepared meal services (except restaurants par cipa ng in State‐op on restaurant programs).

6
FNS performed the following retailer compliance ac vi es in fiscal year 2014:
Reviewed the transac ons of over 17,700 stores iden fied as poten ally viola ng. Completed nearly 7,700 inves ga ons of authorized retail grocers to determine
compliance with program regula ons.
Ini ated compliance ac ons on 3,123 authorized firms found in viola on of program regula ons. This included:
2,226 sanc on ac ons,
131 transfer of ownership civil monetary penal es,
154 involuntary withdrawals,
5 unauthorized acceptance fines, and
issuance of 573 warning le ers. Completed 1,416 reviews of FNS administra ve ac ons appealed by aggrieved firms. FNS
sustained almost 88 percent of all appeals, reversed or modified 1 percent, and found that 10 percent were moot.
Retailer Compliance Ac vi es
Number of Authorized Firms
FISCAL YEAR 2014 AT A GLANCE
As of September 30, 2014 261,150 firms were authorized to par cipate in SNAP. Over the past five fiscal years, the number of authorized firms increased by 20.5 percent. In fiscal year 2014, supermarkets and superstores redeemed 81.67 percent of all SNAP benefits.
Retailer Administra on Ac vi es
FNS performed the following retailer administra on ac vi es in fiscal year 2014: Approved SNAP par cipa on for 30,544 store loca ons. Confirmed the con nued eligibility of 43,401 firms through reauthoriza on. Reinstated 1,634 firms. Withdrew 19,476 firms due to voluntary request, non‐redemp on, or failure to meet
eligibility requirements.
216,738 231,435
246,565 252,962 261,150
100,000
125,000
150,000
175,000
200,000
225,000
250,000
275,000
300,000
FY 2010 FY 2011 FY 2012 FY 2013 FY 2014

7
Firms are classified by type. There are currently 25 firm types. Classifica ons are differen ated by sales volume, ra o of food sales to total sales, or whether firms specialize in one staple food group. They are further grouped based upon those that provide tradi onal retailer services and those that provide meal services. Combined, supermarkets and super stores redeem just under 82 percent of all SNAP benefits while making up only 14.37 percent of the total number of authorized firms.
Redemp ons by Firm Type
Firm Types Total
Authorized Percent of
Total Redemp on Amount
Percent of Total
Bakery Specialty 2,732 1.05% $127,639,914 0.18%
Combina on Grocery/Other 68,283 26.15% $4,788,366,966 6.84%
Convenience Store 105,742 40.49% $3,465,179,629 4.95%
Delivery Route 1,080 0.41% $114,945,699 0.16%
Direct Marke ng Farmer 2,309 0.88% $5,367,057 0.01%
Farmers' Market 2,866 1.10% $13,470,334 0.02%
Fruits/Veg Specialty 1,337 0.51% $69,763,944 0.10%
Large Grocery Store 3,827 1.47% $1,088,856,398 1.55%
Meat/Poultry Specialty 3,128 1.20% $415,044,865 0.59%
Medium Grocery Store 11,746 4.50% $1,451,718,600 2.07%
Military Commissary 190 0.07% $84,989,540 0.12%
Non‐profit Food Buying Co‐op 403 0.15% $27,153,341 0.04%
Seafood Specialty 1,634 0.63% $163,353,855 0.23%
Small Grocery Store 13,845 5.30% $808,915,552 1.16%
Super Store 18,942 7.25% $34,071,887,427 48.66%
Supermarket 18,594 7.12% $23,119,481,444 33.02%
Wholesaler 12 0.00% $8,786,800 0.01%
Store Subtotal 256,670 98.28% $69,824,921,364 99.71%
Communal Dining Facility 368 0.14% $3,624,918 0.01%
Drug and/or Alcohol Treatment Program 1,016 0.39% $51,662,172 0.07%
Group Living Arrangement 609 0.23% $73,335,040 0.10%
Homeless Meal Provider 218 0.08% $6,761,093 0.01%
Meal Delivery Service 287 0.11% $1,586,845 0.00%
Private For‐Profit Restaurant 1,796 0.69% $53,294,316 0.08%
Senior Ci zens Center/Residen al Building 147 0.06% $8,459,658 0.01%
Shelter for Ba ered Women and Children 39 0.01% $865,659 0.00%
Meal Service Subtotal 4,480 1.72% $199,589,700 0.29%
Total 261,150 100.00% $70,024,511,064 100.00%

8
The following pages show the number of authorized firms and redemp on amounts broken out by FNS Region and by State. California, New York, Texas, and Florida con nue to have the highest number of firms and redemp ons.
Redemp ons by Region and State
North East Connec cut 2,623 $692,728,246 1.00% 0.99%
Maine 1,602 $315,709,469 0.61% 0.45%
Massachuse s 5,367 $1,272,398,415 2.06% 1.82%
New Hampshire 1,073 $181,755,884 0.41% 0.26%
New York 19,419 $5,129,041,403 7.44% 7.32%
Rhode Island 1,012 $258,138,598 0.39% 0.37%
Vermont 747 $91,440,012 0.29% 0.13%
Region Totals 31,843 $7,941,212,027 12.19% 11.34%
Mid– Atlan c Delaware 835 $226,919,696 0.32% 0.32%
District of Columbia 513 $125,775,560 0.20% 0.18%
Maryland 4,042 $1,214,137,704 1.55% 1.73%
New Jersey 6,417 $1,344,691,404 2.46% 1.92%
Pennsylvania 10,479 $2,578,566,321 4.01% 3.68%
Virgin Islands 108 $54,691,025 0.04% 0.08%
Virginia 6,563 $1,341,516,556 2.51% 1.92%
West Virginia 2,211 $451,031,584 0.85% 0.64%
Region Totals 31,168 $7,337,329,851 11.93% 10.48%
Southeast Alabama 5,388 $1,313,207,196 2.06% 1.88%
Florida 16,461 $5,491,876,039 6.30% 7.84%
Georgia 10,206 $2,850,636,733 3.91% 4.07%
Kentucky 4,663 $1,191,004,456 1.79% 1.70%
Mississippi 3,679 $941,505,360 1.41% 1.34%
North Carolina 9,395 $2,380,121,708 3.60% 3.40%
South Carolina 5,295 $1,254,818,724 2.03% 1.79%
Tennessee 6,946 $1,917,927,196 2.66% 2.74%
Region Totals 62,033 $17,341,097,411 23.75% 24.76%
Southwest Arkansas 2,761 $673,423,989 1.06% 0.96%
Louisiana 4,955 $1,295,373,261 1.90% 1.85%
New Mexico 1,539 $614,985,502 0.59% 0.88%
Oklahoma 3,547 $848,080,967 1.36% 1.21%
Texas 19,051 $5,404,532,747 7.30% 7.72%
Region Totals 31,853 $8,836,396,467 12.20% 12.62%
Region State Authorized
Firms Redemp on Amount
Percent of Total Firms
Percent of Total Redemp ons

9
Redemp ons by Region and State (con nued)
Mid‐West Illinois 9,562 $3,135,037,421 3.66% 4.48%
Indiana 5,156 $1,331,583,809 1.97% 1.90%
Michigan 10,389 $2,575,241,160 3.98% 3.68%
Minnesota 3,356 $636,001,757 1.29% 0.91%
Ohio 9,658 $2,573,289,708 3.70% 3.67%
Wisconsin 4,088 $1,107,562,530 1.57% 1.58%
Region Totals 42,209 $11,358,716,384 16.16% 16.22%
Mountain Plains Colorado 2,758 $771,918,962 1.06% 1.10%
Iowa 2,847 $536,229,888 1.09% 0.77%
Kansas 2,000 $398,821,834 0.77% 0.57%
Missouri 4,888 $1,247,074,859 1.87% 1.78%
Montana 790 $175,342,555 0.30% 0.25%
Nebraska 1,242 $247,417,720 0.48% 0.35%
North Dakota 507 $83,816,570 0.19% 0.12%
South Dakota 739 $142,461,540 0.28% 0.20%
Utah 1,411 $316,723,176 0.54% 0.45%
Wyoming 335 $50,979,271 0.13% 0.07%
Region Totals 17,517 $3,970,786,374 6.71% 5.67%
Western Alaska 555 $174,820,191 0.21% 0.25%
Arizona 4,306 $1,474,918,034 1.65% 2.11%
California 26,875 $7,456,173,413 10.29% 10.65%
Guam 266 $108,143,727 0.10% 0.15%
Hawaii 1,033 $515,912,619 0.40% 0.74%
Idaho 1,073 $293,870,469 0.41% 0.42%
Nevada 1,805 $556,792,879 0.69% 0.80%
Oregon 3,574 $1,113,692,762 1.37% 1.59%
Washington 5,040 $1,544,648,459 1.93% 2.21%
Region Totals 44,527 $13,238,972,551 17.05% 18.91%
Na onal Totals Totals 261,150 $70,024,511,064 100.00% 100.00%
Region State Authorized
Firms Redemp on Amount
Percent of Total Firms
Percent of Total Redemp ons
10
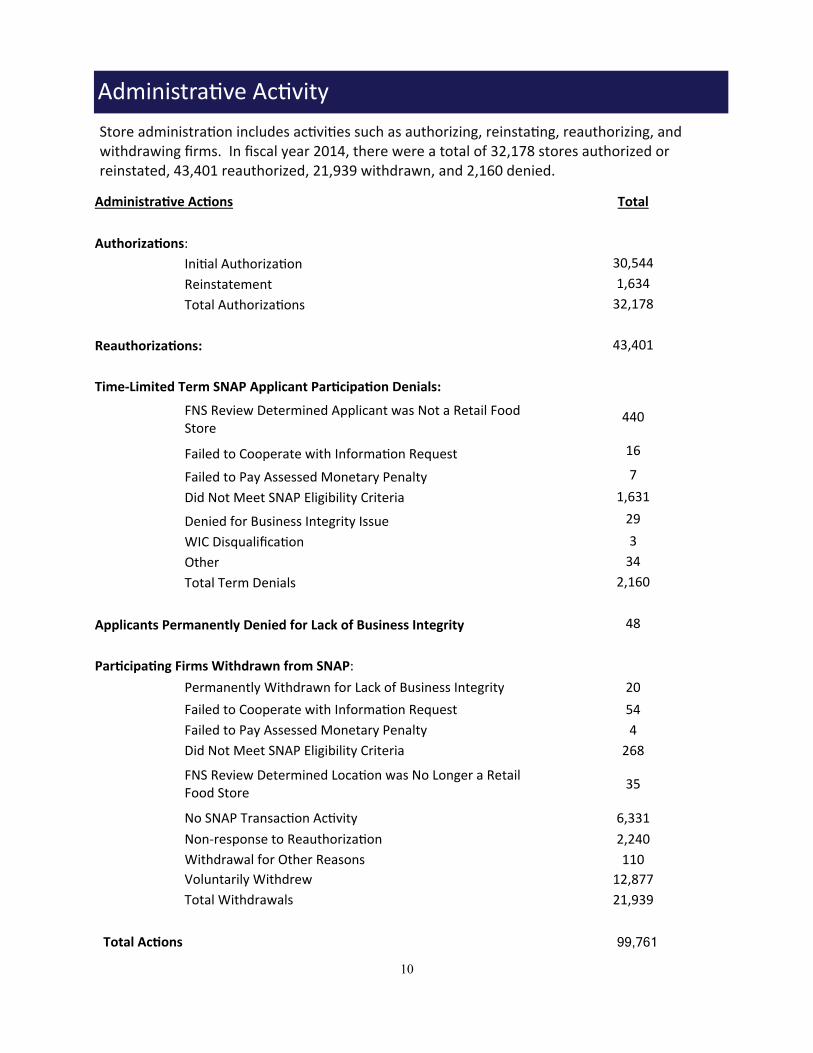
Administra ve Ac ons Total
Authoriza ons:
Ini al Authoriza on 30,544
Reinstatement 1,634
Total Authoriza ons 32,178
Reauthoriza ons: 43,401
Time‐Limited Term SNAP Applicant Par cipa on Denials:
FNS Review Determined Applicant was Not a Retail Food Store
440
Failed to Cooperate with Informa on Request 16
Failed to Pay Assessed Monetary Penalty 7
Did Not Meet SNAP Eligibility Criteria 1,631
Denied for Business Integrity Issue 29
Other 34
Total Term Denials 2,160
Applicants Permanently Denied for Lack of Business Integrity 48
Par cipa ng Firms Withdrawn from SNAP:
Permanently Withdrawn for Lack of Business Integrity 20
Failed to Cooperate with Informa on Request 54
Failed to Pay Assessed Monetary Penalty 4
Did Not Meet SNAP Eligibility Criteria 268
FNS Review Determined Loca on was No Longer a Retail Food Store
35
No SNAP Transac on Ac vity 6,331
Non‐response to Reauthoriza on 2,240
Withdrawal for Other Reasons 110
Voluntarily Withdrew 12,877
Total Withdrawals 21,939
Total Ac ons
WIC Disqualifica on 3
Store administra on includes ac vi es such as authorizing, reinsta ng, reauthorizing, and withdrawing firms. In fiscal year 2014, there were a total of 32,178 stores authorized or reinstated, 43,401 reauthorized, 21,939 withdrawn, and 2,160 denied.
Administra ve Ac vity
99,761
11
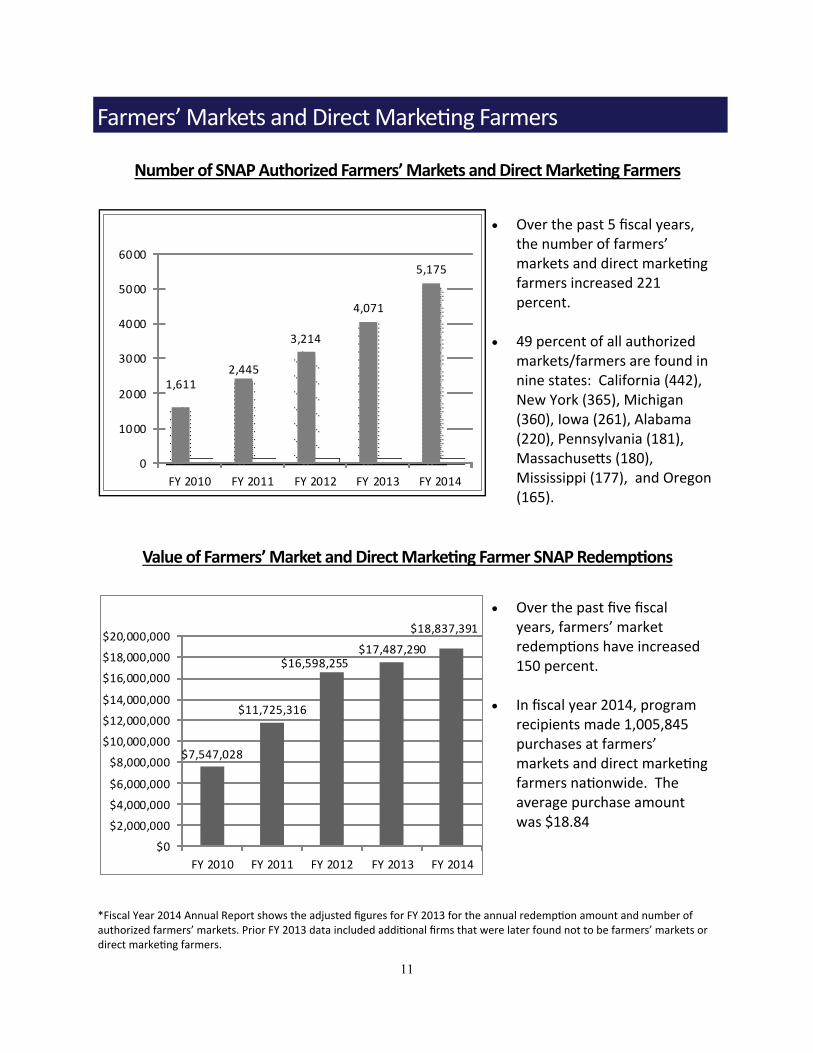
Number of SNAP Authorized Farmers’ Markets and Direct Marke ng Farmers
Farmers’ Markets and Direct Marke ng Farmers
Value of Farmers’ Market and Direct Marke ng Farmer SNAP Redemp ons
Over the past 5 fiscal years, the number of farmers’ markets and direct marke ng farmers increased 221 percent.
49 percent of all authorized
markets/farmers are found in nine states: California (442), New York (365), Michigan (360), Iowa (261), Alabama (220), Pennsylvania (181), Massachuse s (180), Mississippi (177), and Oregon (165).
Over the past five fiscal years, farmers’ market redemp ons have increased 150 percent.
In fiscal year 2014, program
recipients made 1,005,845 purchases at farmers’ markets and direct marke ng farmers na onwide. The average purchase amount was $18.84
1,6112,445
3,214
4,071
5,175
0
1000
2000
3000
4000
5000
6000
FY 2010 FY 2011 FY 2012 FY 2013 FY 2014
$7,547,028
$11,725,316
$16,598,255 $17,487,290
$18,837,391
$0
$2,000,000
$4,000,000
$6,000,000
$8,000,000
$10,000,000
$12,000,000
$14,000,000
$16,000,000
$18,000,000
$20,000,000
FY 2010 FY 2011 FY 2012 FY 2013 FY 2014
*Fiscal Year 2014 Annual Report shows the adjusted figures for FY 2013 for the annual redemp on amount and number of authorized farmers’ markets. Prior FY 2013 data included addi onal firms that were later found not to be farmers’ markets or direct marke ng farmers.

12
Key Facts About SNAP Farmers’ Market Par cipa on
More SNAP benefits were redeemed at farmers’ markets and direct marke ng farmers in fiscal year 2014 during August than any other month of the year.
Of the 3,232, coun es in the U.S., 1,577 (49 percent) have at least one SNAP
authorized farmers’ market or farmer; this is an increase of 8 percent over 2013. 362,477 SNAP households made at least one purchase at a farmers’ market in fiscal
year 2014. Households shopping at farmers’ markets spent $52.38 on average over the course of the year.
The top five busiest coun es based on the number of SNAP households shopping at
farmers’ markets or direct marke ng farmers are shown below: 54 percent of the 362,477 households that shopped at a farmers’ market or direct
marke ng farmer made one purchase; another 18 percent made two purchases; and 28 percent made three or more purchases within the year. These percentages have remained rela vely unchanged over the last four fiscal years.
99 percent of all SNAP transac ons at a market or direct marke ng farmer were
electronic (either swipe or key entry), and the remaining 1 percent were paper voucher authoriza ons.
Source: An ‐fraud Locator using EBT Retailer Transac ons (ALERT) 02/09/15
County/State Number of SNAP Households Shopping
New York, NY 26,744
Wayne, MI 13,055
St. Louis City, MO 12,153
Los Angeles, CA 11,206
Monroe, NY 7,122

13
Key Fact: In Fiscal Year 2014, FNS staff reviewed over
17,700 stores to determine whether viola ons
were occurring.
FNS closely monitors retailers to ensure they comply with Program rules and regula ons. FNS may sanc on or warn retailers found viola ng Program rules. Sanc ons include permanent or me‐limited term disqualifica ons and civil money penal es. Retailers who commit minor vio‐
la ons are issued official warning le ers. Retailers who are disqualified permanently and later sell their stores are also subject to a transfer of ownership civil money penalty. In fiscal year 2014, there were 3,123 total compliance ac ons, including 2,226 sanc ons.
Sanc ons Total
Permanent Disqualifica ons 1,496
Time‐Limited Term Disqualifica on 632
Trafficking Civil Money Penalty (CMP) 6
Hardship CMP 92
Total Sanc ons 2226
Other Compliance Ac ons
Transfer of Ownership CMP 131
Official Warning 573
Involuntary Withdrawal (for other than non‐redemp on) 154
Permanent Involuntary Withdrawal 34
Unauthorized Acceptance Fine 5
Total Sanc ons and Compliance Ac ons 3,123
Total Compliance Ac ons 897
Compliance Ac vity

14
The Office of Inspector General (OIG) has responsibility for all inves ga ve ac vity within USDA. However, authority to conduct SNAP retailer compliance inves ga ons is delegated to FNS. In January 1977, the Retailer Inves ga ons Branch (RIB) was established. Its primary mission is to safeguard the integrity of SNAP by monitoring retailers authorized to accept SNAP benefits. This is accomplished by staff na onwide that conduct undercover inves ga‐ons of SNAP approved retailers.
RIB undercover inves ga ons are conducted throughout the year. A posi ve inves ga on is one in which the inves ga on reveals evidence of any program viola ons. In fiscal year 2014, there were a total of 3,645 RIB inves ga ons completed, of which 1,354 resulted in viola ons. Trafficking is the most serious viola on and is defined primarily as the exchange of SNAP ben‐efits for cash. In fiscal year 2014, there were 322 inves ga ons in which trafficking occurred.
Undercover Retailer Inves ga ons
Completed Inves ga ons Total Percent of Total
Posi ve Results 1,354 37.15%
Trafficking 322 8.83%
1,032 28.31%
Nega ve Results 2,060 56.52%
None/No Result 231 6.34%
Total Completed 3,645 100%
Non‐Trafficking
Undercover
24%
76%
Positive Investigations
Trafficking Non‐Trafficking
37%
57%
6%
Total Undercover Investiagtions
Positive Results Negative Results
None/No Results

15
The Administra ve Review Branch (ARB) performs the final administra ve review of retailer appeals within USDA. The vast majority of administra ve reviews are
for firms aggrieved by ac on of FNS to deny, withdraw, or disqualify them from SNAP par cipa on. In addi on, ARB performs administra ve reviews for sponsors and vendors aggrieved in the Summer Food Service Program and the Child and Adult Care Food Program, as well as for State agencies aggrieved by FNS ac ons such as Quality Control sanc ons and other sanc ons due to non‐compliance with SNAP regula ons or State Plans of Opera on.
ARB’s mission is to ensure that
firms, ins tu ons, and State Agencies aggrieved by FNS’ adverse ac ons receive the opportunity to have their posi ons fairly considered by an impar al reviewing authority prior to the adverse ac on becoming final.
Administra ve Review Officers
(AROs) are designated by the Secretary of Agriculture to conduct administra ve reviews and issue final agency decisions. They have the authority to reverse or otherwise alter an adverse decision found to be in error or which may be inconsistent with FNS policy. An ARO’s decision is the final administra ve ac on of the USDA, subject only to judicial review.
Source: STARS Management Ac vity Report 12/17/14
Administra ve Review
2014 ARB cases at a glance:
1,249 Sustained
6 Reversed
147 Moot*
14 Modified
813979
1,385
1,239
1,459
0
200
400
600
800
1,000
1,200
1,400
1,600
2010 2011 2012 2013 2014
Appeals Received
1,061 1,0111,161 1,257
1,416
0
200
400
600
800
1,000
1,200
1,400
1,600
2010 2011 2012 2013 2014
Appeals Completed
* Of the 147 cases closed as “moot”, 6 were withdrawn by appellants, 90 were withdrawn by FNS, 49 were closed as a result of appellants’ failure to provide a sufficient basis for review, and 2 were withdrawn for unspecified reasons

16
Administra ve Review (con nued)
There was an increase in the number of administra ve review requests from 1,239 in fiscal
year 2013 to 1,459 in fiscal year 2014. ARB strives to expedite decisions. By moving quickly, there is a posi ve impact on
integrity. For example: Stores whose sanc on ac ons are held in abeyance pending final agency decision
do not stay on the Program for long periods of me if the Administra ve Review decision supports the original finding.
Stores found to have trafficked and who are removed pending final agency decision have their appeals heard quickly. If the decision is reversed, the amount of me they are off the Program is minimized.
Collec ons for civil money penal es can begin earlier in the process, making it more likely that retailers can be located.
As in past years, the majority of FNS ini al determina ons were upheld. A total of 88 percent of cases were upheld in fiscal year 2014.
FY 2014 Administra ve Review Branch Final Decisions
Sustained 88%
Reversed 0%
Modified 1%Moot 10%

17
Sanc ons In Fiscal Year 2014 by State
State Time-Limited
Term Disqualifica-tion
Permanent Dis-qualification
Hardship CMP in Lieu of Term Dis-
qualification
Trafficking CMP in Lieu of Permanent
Disqualification Total
AK 0 0 0 0 0
AL 4 24 1 0 29
AR 2 2 1 0 5
AZ 8 13 2 1 24
CA 114 92 23 2 231
CO 11 7 3 0 21
CT 24 77 3 0 104
DC 3 6 0 0 9
DE 2 7 0 0 9
FL 42 148 4 0 194
GA 18 84 1 1 104
GU 1 15 0 0 16
HI 0 16 0 0 16
IA 1 4 0 0 5
ID 1 0 0 0 1
IL 11 119 2 0 132
IN 6 12 1 0 19
KS 1 3 1 0 5
KY 3 17 1 0 21
LA 5 20 1 0 26
MA 35 48 2 0 85
MD 11 55 2 0 68
ME 2 0 0 0 2
MI 10 25 2 1 38
MN 9 6 1 0 16
MO 7 15 0 1 23
MS 3 14 2 0 19
NC 24 25 6 0 55
NE 0 2 0 0 2
NH 1 3 0 0 4
NJ 27 54 1 0 82
NM 4 3 0 0 7
NV 1 3 1 0 5
NY 117 338 1 0 456
OH 7 22 2 0 31

18
Sanc ons In Fiscal Year 2014 by State (con nued)
State Time-Limited
Term Disqualifica-tion
Permanent Dis-qualification
Hardship CMP in Lieu of Term Dis-
qualification
Trafficking CMP in Lieu of Permanent
Disqualification Total
OK 13 6 4 0 23
OR 3 1 0 0 4
PA 17 54 4 0 75
RI 10 36 2 0 48
SC 5 18 2 0 25
TN 13 41 7 0 61
TX 41 31 3 0 75
UT 1 1 0 0 2
VA 3 10 3 0 16
VI 0 1 0 0 1
VT 0 1 0 0 1
WA 6 8 2 0 16
WI 5 7 0 0 12
WV 0 1 1 0 2
WY 0 1 0 0 1
Total 632 1,496 92 6 2,226

19
Sanc ons In Fiscal Year 2014 by Store Type
Store Type Time‐Limited Term Disqualifica on
Permanent Disqualifica on
Hardship Civil Money Penalty in Lieu of Time Limited Term Disqualifica on
Trafficking Civil Money Penalty in Lieu of Permanent Disqualifica on
Total
Bakery Specialty 2 1 0 0 3
Combina on Grocery/Other
25 49 7 0 81
Convenience Store 384 902 47 5 1,338
Delivery Route 0 8 0 0 8
Fruits/Vegetables Specialty
1 7 0 0 8
Large Grocery Store 5 2 3 1 11
Meat/Poultry Specialty
0 6 0 0 6
Medium Grocery Store
89 160 18 0 267
Seafood Specialty 1 1 2 0 4
Small Grocery Store 122 359 15 0 496
Super Store 0 0 0 0 0
Supermarket 3 1 0 0 4
Private Restaurant/Meal Delivery
0 0 0 0 0
Total 632 1,496 92 6 2,226

20
To access this report online, please visit our website at
www.fns.usda.gov/snap/retailers/merchants.htm.
More informa on about FNS efforts to combat fraud and abuse is available at
www.fns.usda.gov/snap/fraud.htm.
For more informa on about SNAP in general, please visit our website at
www.fns.usda.gov/snap.