snap lake mine water treatment plant alternatives evaluation
TRANSCRIPT

425332_WBG073112092156 COPYRIGHT 2012 BY CH2M HILL CANADA LIMITED • ALL RIGHTS RESERVED COMPANY CONFIDENTIAL
F ina l
Snap Lake Mine Water Treatment Plant Alternatives Evaluation
Prepared for
De Beers Canada Inc.
December 2012
Prepared by


Contents Section Page
425332_WBG073112092156 i COPYRIGHT 2012 BY CH2M HILL CANADA LIMITED • ALL RIGHTS RESERVED COMPANY CONFIDENTIAL
1. Summary .......................................................................................................................................... 1-1
2. Introduction ...................................................................................................................................... 2-1
3. Wastewater Quality Characterization ................................................................................................ 3-1
4. Future Effluent Requirements............................................................................................................ 4-1
5. Alternative Treatment Technologies .................................................................................................. 5-1 5.1 Total Suspended Solids Removal ..................................................................................................... 5-1
5.1.1 Treatment Option for TSS Removal .................................................................................... 5-1 5.2 Nutrients Removal ........................................................................................................................... 5-8
5.2.1 Scale of Treatment............................................................................................................ 5-10 5.2.2 Treatment Options for Nitrate Removal .......................................................................... 5-12
5.3 Metal Removal ............................................................................................................................... 5-17 5.4 Major Ion Removal ........................................................................................................................ 5-19
5.4.1 Scale of Treatment............................................................................................................ 5-19 5.4.2 Treatment Options for Chloride and/or Fluoride Removal .............................................. 5-22 5.4.3 Summary of Treatment Technologies for Fluoride and Chloride Removal ...................... 5-24
6. Treatment Technology Screening ....................................................................................................... 6-1
7. Treatment Train Alternatives ............................................................................................................. 7-1 7.1 Scenario 1: Current Licence Requirements ..................................................................................... 7-1
7.1.1 Alternative 1: Densadeg® Integrated Reactor/Clarifier/Thickener with Continuous Backwash Filters ................................................................................................................. 7-1
7.1.2 Alternative 2: Actiflo® Package Plant Clarifier with Metal Precipitation and Polishing Filters7-4 7.2 Scenario 2: Future Licence Requirements ....................................................................................... 7-6
7.2.1 Alternative 3: Densadeg® Integrated Reactor/Clarifier/ Thickener with Microfiltration/Ultrafiltration and Reverse Osmosis.......................................................... 7-6
7.2.2 Alternative 4: Actiflo® Package Plant Clarifier with Microfiltration/ Ultrafiltration and Reverse Osmosis ................................................................................................................. 7-7
7.2.3 Upgrades to Existing Treatment Train at the Snap Lake Mine WTP................................... 7-9 7.2.4 Waste Treatment/Disposal Options ................................................................................. 7-10
7.3 Preliminary Layouts for Alternative Treatment Options ............................................................... 7-13 7.4 Equipment Costs ............................................................................................................................ 7-18
8. Conclusions and Recommendations ................................................................................................... 8-1
9. References ........................................................................................................................................ 9-1
Appendices
A Data Review Findings Technical Memorandum B Kickoff Meeting Presentation Slides and Minutes
Tables
TABLE 1 Mine Water Quality in 2011 (January 1 to October 9, 2011) ..................................................................... 3-1 TABLE 2 WMP Water Quality in 2011 (January 1 to October 27, 2011) ................................................................... 3-2

CONTENTS
Section Page
ii 425332_WBG073112092156 COPYRIGHT 2012 BY CH2M HILL CANADA LIMITED • ALL RIGHTS RESERVED COMPANY CONFIDENTIAL
TABLE 3 Summary of the Contaminant Concentrations in the Effluent (January 1st to October 29th, 2011) Compared with the Existing Licence Limits ............................................................................................................... 3-2 TABLE 4 Comparison of Future Licence Requirements for the Snap Lake Mine WTP Effluent with the Current Requirements ............................................................................................................................................................ 4-1 TABLE 5 Comparison of 2011 Effluent Data from the Snap Lake Mine WTP with the Current and Future Licence Limits .......................................................................................................................................................................... 4-2 TABLE 6 Comparison of Advantages and Disadvantages of Tube Settlers Versus plate Settlers ............................. 5-2 TABLE 7 Comparison of High Rate Clarification/Softening Processes ...................................................................... 5-5 TABLE 8 Comparison of Microfiltration to Ultrafiltration Membranes .................................................................... 5-7 TABLE 9 Comparison of Conventional Filtration to Microfiltration/Ultrafiltration Membranes Filtration for Effluent Polishing ..................................................................................................................................................................... 5-8 TABLE 10 Treatment Technology Comparison for Nitrate Removal....................................................................... 5-16 TABLE 11 Average percentage of total and dissolved metals removed at the Snap Lake Mine WTP - 2011 ......... 5-17 TABLE 12 Comparison of 2010 and 2011 effluent data from the Snap Lake Mine WTP with current licence limits (total metals ............................................................................................................................................................. 5-18 TABLE 13 Comparison of dissolved metal concentrations in the mine water with current effluent licence limits ... 5-18 TABLE 14 Comparison of 2011 Chloride, Fluoride, Sulphate Data with 2012 and 2015 Licence Limits ................. 5-19 TABLE 15 Treatment Technology Comparison (References: Pickard, 2004; Feenstra et al., 2007) ....................... 5-25 TABLE 16 Treatment Technology Screening ............................................................................................................. 6-1 TABLE 17 Specifications for the Components of the Densadeg® Integrated Reactor/Clarifier/Thickener .............. 7-3 TABLE 18 Specifications for the Dynasand® Continuous Backwash Filters .............................................................. 7-3 TABLE 19 Mass Balance of Contaminants throughout the Reverse Osmosis 2 Stage System ............................... 7-10 TABLE 20 Equipment Costs for Alternative Treatment Train Options for the Snap Lake Mine WTP ..................... 7-18 TABLE 21 Capital Costs for Preferred Treatment Alternative ................................................................................. 7-19
Figures
FIGURE 1 Discharge from the mine and WMP to the Snap Lake Mine WTP (2008-2011) ....................................... 3-1 FIGURE 2 DensaDeg® High Rate Solids Contact Unit Process Design (Courtesy of IDI) ............................................ 5-3 FIGURE 3 Actiflo® High Rate Softening/Clarification Unit (Courtesy of Veolia) ........................................................ 5-4 FIGURE 4 Contrafast Process Diagram ...................................................................................................................... 5-5 FIGURE 5 Simplified Flow Schematic for a Pressure-Driven Membrane Process ..................................................... 5-7 FIGURE 6 Nitrite and Ammonia Concentrations in the Snap Lake Mine WTP Effluent from 2010 to 2011 Compared with Current Licence Limits ....................................................................................................................................... 5-9 FIGURE 7 Nitrate Concentrations in the Snap Lake Mine WTP Effluent from 2010 to 2011 Compared with Current and Future Licence Limits ........................................................................................................................................ 5-10 FIGURE 8 Estimated Nitrate Concentration in the Snap Lake Mine WTP Effluent if 90 percent of the Influent WMP Nitrate is Removed Prior to Blending with the Mine Water (note the scale is different for the WMP) ................. 5-11 FIGURE 9 Estimated Nitrate Concentration in the Snap Lake Mine WTP Effluent if 90 Percent of the Nitrate is Removed from the Secondary Treatment Train and WMP Water (note the scale is different for the WMP) ....... 5-11 FIGURE 10 Estimated Nitrate Concentration in the Snap Lake Mine WTP Effluent if 90 Percent of the Nitrate is Removed from the Full Influent Flow (note the scale is different for the WMP).................................................... 5-12 FIGURE 11 Simplified Schematic a Membrane Bioreactor ..................................................................................... 5-15 FIGURE 12 2011 Fluoride Concentrations in the Mine Water and WMP Compared with the 2015 Limits ........... 5-20 FIGURE 13 2011 Chloride Concentrations in the Mine Water and WMP Compared with the 2015 Limits ........... 5-21 FIGURE 14 Estimated Chloride Concentration in the Snap Lake Mine WTP Effluent if 50 percent of Influent Mine Water and 100 percent of the WMP Water is Treated for Chloride Removal (≥90 percent). Estimates are Based on 2010-2011 Data ....................................................................................................................................................... 5-21

ERROR! NO TEXT OF SPECIFIED STYLE IN DOCUMENT.
425332_WBG073112092156 iii COPYRIGHT 2012 BY CH2M HILL CANADA LIMITED • ALL RIGHTS RESERVED COMPANY CONFIDENTIAL
FIGURE 15 Estimated Chloride Concentration in the Snap Lake Mine WTP Effluent if 100 percent of Influent Mine Water and 100 Percent of the WMP Water is Treated for Chloride Removal (≥90 percent). Estimates are based on 2010-2011 data. ....................................................................................................................................................... 5-22 FIGURE 16 Process Schematic of the Secondary Treatment Train Equipped with Densadeg® and Continuous Backwash Sand Filters ................................................................................................................................................ 7-1 FIGURE 17 Process Schematic of the Secondary Treatment Train Equipped with Actiflo® Package Plant Clarifier and Filtration..................................................................................................................................................................... 7-4 FIGURE 18 Process Schematic of the Secondary Treatment Train Equipped with Densadeg®, Microfiltration/Ultrafiltration, and Reverse Osmosis ................................................................................................ 7-6 FIGURE 19 Process Schematic of the Secondary Treatment Train Equipped with Actiflo® Package Plant Clarifier, Microfiltration/Ultrafiltration, and Reverse Osmosis ................................................................................................ 7-8 FIGURE 20 Process Schematic of Snap Lake Mine WTP Following Expansion and Upgrades to the Existing Treatment Train ....................................................................................................................................................... 7-10 FIGURE 21 Schematic of a Brine Concentrator followed by a Crystallizer.............................................................. 7-11 FIGURE 22 Typical Deep Well injection System ...................................................................................................... 7-12 FIGURE 23 Preliminary Layout for Alternative 1 – Densadeg® Integrated Reactor/Clarifier/Thickener with Continuous Backwash Filters ................................................................................................................................... 7-14 FIGURE 24 Preliminary Layout for Alternative 2 – Actiflo® Package Plant Clarifier with Metal Precipitation and Cloth Media Filtration .............................................................................................................................................. 7-15 FIGURE 25 Preliminary Layout for Alternative 3 – Densadeg® Integrated Reactor/Clarifier/Thickener with MF/UF and RO ..................................................................................................................................................................... 7-16 FIGURE 26: Preliminary Layout for Alternative 4 – Actiflo® Package Plant Clarifier with MF/UF and RO ............... 7-17


425332_WBG073112092156 1-1 COPYRIGHT 2012 BY CH2M HILL CANADA LIMITED • ALL RIGHTS RESERVED COMPANY CONFIDENTIAL
SECTION 1
Summary This report presents an evaluation of treatment alternatives for the expansion of the Snap Lake Mine water treatment plant (WTP) from a capacity of less than 35 ML/d to a capacity of 45 ML/d. While the existing Snap Lake Mine WTP has a reported capacity of 35 ML/d, the actual capacities of some of the individual treatment processes, such as the thickener, are thought to be significantly lower. Expansion to 45 ML/d will require the addition of a secondary treatment train. Furthermore, future effluent licence limits have been set for nitrate, chloride, and fluoride which will come into effect in 2015 (on January 1st). To comply with these new limits, advanced treatment processes will be required, in addition to conventional treatment to remove suspended solids and metals.
Alternative treatment technologies were identified, reviewed, and compared for the removal of total suspended solids (TSS), nitrate, metals, chloride and fluoride from the mine and water management pond (WMP) water. Additionally, the scale-of-treatment required to comply with the 2015 licence limits for each contaminant was assessed.
High rate clarification processes were compared for the reduction of TSS and heavy metals in the secondary treatment train. The Densadeg® Integrated Reactor/Clarifier/Thickener was found to be more economical in terms of equipment costs compared to the Actiflo® Package Plant Clarifier. Although the current licence limits for all regulated metals are expected to be attainable with the inclusion of high rate clarification and filtration in the secondary treatment train, provisions for lime addition could be added to ensure continued compliance if limits should change in the future.
In terms of nitrate removal technologies, nitrate specific ion-exchange (IX) and reverse osmosis (RO) were identified as viable options to comply with the 2015 licence limits. Similarly for chloride removal, IX and RO were identified as viable treatment options. Electrodialysis reversal (EDR) was eliminated from consideration as it is typically more costly than RO, more complex, and can be difficult to operate and maintain. While distillation can achieve high removals of all three contaminants, it was deemed to be not economically viable, as it would require a large input of thermal energy and has a very low recovery ratio (~50 percent). For fluoride removal, RO, IX, and activated alumina were all identified as potentially viable options; however, the efficiency to which activated alumina or IX processes can remove fluoride from the mine water is uncertain; these options could potentially be explored further through bench/pilot-scale testing to ensure that licence limits can be consistently met.
As a worst case scenario, RO was selected in the absence of bench/pilot-scale testing to ensure compliance with the 2015 effluent licence requirements for fluoride, chloride, and nitrate. The RO process will require pretreatment with conventional or high-rate clarification and microfiltration/ultrafiltration (MF/UF) to remove potential membrane foulants, resulting in a total equipment cost of approximately $ 20 million to treat a flow of 45 ML/d. Additionally, concentrate from the RO system containing high levels of dissolved ions and nutrients will require a proper treatment/disposal strategy. This will increase the costs for the RO alternative significantly, as a brine concentrator/crystallizer system would total approximately $33 million in equipment costs alone. If permitted, deep well injection is expected to be a much more cost effective disposal option; however, it may still be in the order of several million dollars in capital costs.
Due to the significant costs associated with RO treatment and brine treatment/disposal, it is recommended that bench/pilot-scale studies be carried out to investigate the feasibility of nitrate, chloride, and fluoride removal from the Snap Lake Mine WTP effluent through a multi-stage IX/adsorption treatment, including contaminant specific resins for nitrate and chloride and activated alumina for fluoride removal. Furthermore, it is recommended that De Beers conduct further investigation into the source/s of fluoride which enters the mine water during production to determine if sources can be eliminated to reduce the overall costs associated with treatment.


425332_WBG073112092156 2-1 COPYRIGHT 2012 BY CH2M HILL CANADA LIMITED • ALL RIGHTS RESERVED COMPANY CONFIDENTIAL
SECTION 2
Introduction De Beers Canada Inc. (De Beers) currently operates a diamond mine, the Snap Lake Mine, located approximately 220 km northeast of Yellowknife, Northwest Territories. The diamond mine is completely underground with the majority of the mine being located beneath Snap Lake. Water from Snap Lake infiltrates the mine through cracks in the rocks below the lake. The Snap Lake Mine Water Treatment Plant (WTP) was designed to remove particulate matter from the mine water via flocculation, sedimentation, and filtration, prior to discharge into Snap Lake. The final treatment stage involves adjusting the pH of the water to match that of the lake. Some of the treated water is sent to the Process Plant; however, the majority is sent back to the lake and discharged via a diffuser. Sludge from the clarification process is pumped to the Process Plant and combined with processed Kimberlite, which is then sent to the North Pile for containment.
Mine water accounts for the majority of the influent flow entering the Snap Lake Mine WTP (20 to 25 ML/d). During the spring to fall, surface water mixed with North Pile leachate, stored in the Water Management Pond (WMP), is also sent through the WTP (typically ranges from 0 to 5 ML/d). The WMP water contains elevated levels of nutrients (such as ammonia, nitrite, and nitrate) and dissolved ions (such as chloride and fluoride) which are not removed during treatment, as the existing WTP is designed primarily for reducing total suspended solids (TSS) and not for nutrient or TDS removal.
The effluent from the Snap Lake Mine WTP is in compliance with the current operating licence requirements; however, future licence requirements will require upgrades to the existing WTP via the addition of advanced treatment processes to comply with limits set for nitrate, chloride, and fluoride. To compound existing treatment concerns, an increase in production capacity is expected in the near future, which will affect the demand placed upon the existing WTP. It is estimated that an increase in mining production or an increase in mine water, due to Snap Lake water infiltration, would require a WTP capable of treating 45 ML/d. The current Snap Lake Mine WTP has a reported capacity of 35 ML/d; however, a preliminary investigation has identified that the actual capacity of the plant may be much less than the reported capacity. Any mining expansion or increased flow to the WTP would impact the final effluent quality and/or would require diverting the additional water to the WMP. Increased flows at the existing WTP could potentially increase effluent nutrient levels beyond the current licence limits.
To allow for future increases in mining production/water infiltration, and to ensure compliance with the future licence requirements, alternative treatment technologies were investigated relating to upgrades to the existing treatment process and the expansion of the Snap Lake Mine WTP.


425332_WBG073112092156 3-1 COPYRIGHT 2012 BY CH2M HILL CANADA LIMITED • ALL RIGHTS RESERVED COMPANY CONFIDENTIAL
SECTION 3
Wastewater Quality Characterization On November 9, 2011, De Beers provided CH2M HILL with influent flow data for the period of January 1, 2008 to October 31, 2011, including mine water and WMP discharges to the Snap Lake Mine WTP (Figure 1). Based on the flow data, it was determined that if mine production increases at the same rate observed over the last four years, the WTP will need to treat approximately 45 ML/d by mid-2015.
FIGURE 1 Discharge from the mine and WMP to the Snap Lake Mine WTP (2008-2011)
Water quality data was also provided for the period of January to October, 2011, for nine different monitoring points, including the final mine water collection sump, WMP water, and water treatment plant effluent. The water quality characteristics from these monitoring points are summarized in Tables 1, 2, and 3, respectively.
TABLE 1 Mine Water Quality in 2011 (January 1 to October 9, 2011)
Parameter Minimum (mg/L) Average (mg/L) Maximum (mg/L)
Total Suspended Solids 63 636 3220
Total Dissolved Solids 360 517 810
Ammonia, NH3-N 0.46 1.66 4.81
Nitrate, NO3-N 2.01 4.14 30.7
Nitrite, NO2-N 0.090 0.193 0.445
Aluminum 3.11 12.1 31.5
Arsenic 0.0011 0.0018 <0.00401
Barium 0.099 0.367 1.01
Boron 0.092 0.121 0.190
Cadmium 0.000015 0.00021 <0.00082
Chloride 120 237 310
0
5
10
15
20
25
30
35
40
45
50
Flo
w R
ate
(ML/
D)
Date Mine Water Discharge to WTP WMP Discharge to WTP Total Influent to WTP
45 ML/d

SECTION 3—WASTEWATER QUALITY CHARACTERIZATION
3-2 425332_WBG073112092156 COPYRIGHT 2012 BY CH2M HILL CANADA LIMITED • ALL RIGHTS RESERVED COMPANY CONFIDENTIAL
TABLE 1 Mine Water Quality in 2011 (January 1 to October 9, 2011)
Parameter Minimum (mg/L) Average (mg/L) Maximum (mg/L)
Chromium 0.033 0.171 0.438
Copper 0.0029 0.014 0.040
Fluoride 0.278 0.351 0.420
Iron 4.08 21.0 56.6
Lead 0.00266 0.0162 0.0512
Manganese 0.126 0.437 0.997
Nickel 0.062 0.305 0.824
Strontium 1.55 1.76 2.20
Zinc 0.0133 0.0605 0.150 1The maximum concentration was <4 µg/L; not clear how much less
2The maximum concentration was <0.8 µg/L; not clear how much less
TABLE 2 WMP Water Quality in 2011 (January 1 to October 27, 2011)
Parameter Minimum (mg/L) Average (mg/L) Maximum (mg/L)
Total Suspended Solids 1.0 9.4 209
Total Dissolved Solids 390 1359 4100
Ammonia, NH3-N 0.987 6.15 14.7
Nitrate, NO3-N 3.83 88 244
Nitrite, NO2-N 0.094 0.367 1.09
Aluminum 0.010 0.144 1.08
Arsenic 0.00013 0.00022 <0.00401
Barium 0.039 0.095 0.220
Boron 0.149 0.581 1.37
Cadmium 0.000007 0.00018 0.0008
Chloride 124 343 825
Chromium 0.001 0.0017 0.0078
Copper 0.00047 0.00126 0.0033
Fluoride 0.304 0.553 1.18
Iron 0.044 0.266 1.70
Lead 0.00004 0.00022 0.00138
Manganese 0.025 0.140 0.783
Nickel 0.015 0.068 0.248
Strontium 0.744 2.15 5.49
Zinc 0.002 0.031 0.268 1The maximum concentration was <4 µg/L; not clear how much less
TABLE 3 Summary of the Contaminant Concentrations in the Effluent (January 1st to October 29th, 2011) Compared with the Existing Licence Limits
Parameter Minimum
(mg/L) Average (mg/L)
Maximum (mg/L)
Maximum Grab Limit
(mg/L)
Average Monthly Limit
(mg/L) In Compliance?
Total Suspended Solids 4 5.5 9 14 7 Yes
Ammonia, NH3-N 0.56 1.33 2.57 20 - Yes
Nitrate, NO3-N 3.9 8.1 18.1 56 28 Yes
Nitrite, NO2-N 0.07 0.15 0.41 2 1 Yes
Aluminum 0.008 0.030 0.160 2 1 Yes
Arsenic 0.00003 0.0001 <0.0041 0.04 0.02 Yes
Cadmium 0.000006 0.000009 <0.00081 0.002 0.001 Yes

SECTION 3—WASTEWATER QUALITY CHARACTERIZATION
425332_WBG073112092156 3-3 COPYRIGHT 2012 BY CH2M HILL CANADA LIMITED • ALL RIGHTS RESERVED COMPANY CONFIDENTIAL
TABLE 3 Summary of the Contaminant Concentrations in the Effluent (January 1st to October 29th, 2011) Compared with the Existing Licence Limits
Parameter Minimum
(mg/L) Average (mg/L)
Maximum (mg/L)
Maximum Grab Limit
(mg/L)
Average Monthly Limit
(mg/L) In Compliance?
Chromium 0.00007 0.0005 <0.0031 0.04 0.02 Yes
Copper 0.0002 0.0005 <0.0041 0.02 0.01 Yes
Nickel 0.007 0.010 0.013 0.10 0.05 Yes
Lead 0.00004 0.00009 <0.00041 0.009 0.005 Yes
Zinc 0.0016 0.0025 <0.0161 0.02 0.01 Yes
1The maximum concentration was listed as “<” µg/L; not clear how much less
Based on the review and analysis of the Snap Lake Mine WTP data, CH2M HILL prepared a memorandum (Appendix A) outlining the major findings. These findings are summarized below:
The current influent flow rate into the WTP is approaching its rated capacity (35 ML/d). The total influent flow into the WTP has been increasing steadily over the past 4 years. If the discharge from the mine continues to increase at the same rate relative to production, the WTP will require a treatment capacity of 45 ML/d by mid-2015.
Mine water constitutes the majority of the influent flow entering the WTP (typically >80 percent). During the spring to fall, the WMP discharge contributes approximately 0 to 20 percent of the total influent flow. The treated sewage effluent and process water contribute minimally (<5 percent) to the total influent flow into the WTP.
The WMP water contains high concentrations of TDS, nutrients (such as ammonia, nitrate, and nitrite), boron, strontium, chloride, and fluoride, which exceed the concentrations measured in the mine water.
Although the WMP only contributed to approximately 10 percent of the total flow (volume basis) entering the WTP in 2011, the nitrate mass loading from the WMP contributed to approximately 52 percent of the total mass entering the WTP; additionally, the WMP contributed to more than 10 percent of the total mass of ammonia, nitrite, and TDS entering the WTP.
The existing WTP is in compliance with the current licence requirements; however, TSS and nitrate concentrations occasionally approach the licence limits. To further reduce TSS concentrations in the effluent, upgrades/modifications could be made to the existing treatment process (that is, tube settlers and coagulation optimization). To remove nitrate, a nutrient removal process could be added to the existing WTP (for example, ion-exchange, membrane filtration, or biological nutrient removal).
Effluent limits proposed by the Mackenzie Valley Land and Water Board (MVLWB) are far more restrictive than the current licence limits in terms of nutrient and metal concentrations. Additionally, new effluent limits have been proposed for parameters which are currently not regulated (such as TDS, chloride, fluoride, strontium, manganese, etc.).
If the proposed limits are adopted into the licence requirements, in addition to expanding the WTP capacity to 45 ML/d, advanced treatment processes will be required to treat the water.


425332_WBG073112092156 4-1 COPYRIGHT 2012 BY CH2M HILL CANADA LIMITED • ALL RIGHTS RESERVED COMPANY CONFIDENTIAL
SECTION 4
Future Effluent Requirements On April 17, 2012, De Beers provided CH2M HILL with the future licence limits for the Snap Lake Mine WTP effluent (Table 4). As of June 14, 2012, the maximum monthly average and maximum grab limits have been reduced for nutrients (ammonia, nitrite, and nitrate) and several metals (aluminum, arsenic, chromium, and copper). Additionally, new limits have been set for chloride and sulphate. On January 1, 2015, limits for nitrate and chloride will be further reduced and new limits will come into effect for fluoride.
TABLE 4 Comparison of Future Licence Requirements for the Snap Lake Mine WTP Effluent with the Current Requirements
Parameter
Previous Licence June 14, 2012 (Current) January 1, 2015
Max Average (mg/L)
Max Grab (mg/L)
Max Average (mg/L)
Max Grab (mg/L)
Max Average (mg/L)
Max Grab (mg/L)
Total Suspended Solids 7 14 7 14 NC NC
Ammonia, NH3-N n/a 20 10 20 NC NC
Nitrate , NO3-N 28 56 22 44 4 8
Nitrite, NO2-N 1 2 0.5 1.0 NC NC
Chloride n/a n/a 310 640 160 320
Fluoride n/a n/a n/a n/a 0.15 0.3
Sulphate n/a n/a 75 150 NC NC
Aluminum 1 2 0.1 0.2 NC NC
Arsenic 0.04 0.02 0.007 0.014 NC NC
Cadmium 0.001 0.002 n/a n/a NC NC
Chromium 0.02 0.04 0.01 0.02 NC NC
Copper 0.02 0.04 0.003 0.006 NC NC
Lead 0.005 0.009 0.005 0.01 NC NC
Nickel 0.05 0.1 0.05 0.1 NC NC
Zinc 0.01 0.02 0.01 0.02 NC NC
F1 Fractions 4.6 4.6 NC NC
F2 Fractions 2.1 2.1 NC NC
NC = No change currently planned
Table 5 compares the 2011 effluent data with the current 2012 limits and the future limits set for 2015. Based on the 2011 data, the 2012 limits should be achievable with conventional treatment. However, the 2015 limits for nitrate, chloride, and fluoride will require alternative treatment processes to ensure compliance.

SECTION 4—FUTURE EFFLUENT REQUIREMENTS
4-2 425332_WBG073112092156 COPYRIGHT 2012 BY CH2M HILL CANADA LIMITED • ALL RIGHTS RESERVED COMPANY CONFIDENTIAL
TABLE 5 Comparison of 2011 Effluent Data from the Snap Lake Mine WTP with the Current and Future Licence Limits
Parameter
SLM WTP Effluent
Minimum (mg/L)
SLM WTP Effluent Average (mg/L)
SLM WTP Effluent
Maximum (mg/L)
June 14, 2012
Average Monthly
Limit (mg/L)
June 14, 2012
Maximum Grab Limit
(mg/L)
Jan. 1, 2015 Average Monthly
Limit (mg/L)
Jan. 1, 2015 Maximum Grab Limit
(mg/L) In
Compliance?
Ammonia, NH3-N 0.56 1.33 2.57 10 20 NC NC Yes
Nitrate, NO3-N 3.9 8.1 18.1 22 44 4 8 Not with 2015
Nitrite, NO2-N 0.07 0.15 0.41 0.5 1.0 NC NC Yes
Chloride 168 237 316 310 640 160 320 Not with 2015
Fluoride 0.292 0.359 0.432 n/a n/a 0.15 0.3 Not with 2015
Sulphate 39.5 46.0 60.5 75 150 NC NC Yes
Aluminum 0.008 0.030 0.160 0.1 0.2 NC NC Yes
Arsenic 0.00003 0.0001 <0.0041 0.007 0.014 NC NC Yes
Chromium 0.00007 0.0005 <0.0031 0.01 0.02 NC NC Yes
Copper 0.0002 0.0005 <0.0041 0.003 0.006 NC NC Yes
1The maximum concentration was listed as “<” µg/L; not clear how much less
NC = No change currently planned

425332_WBG073112092156 5-1 COPYRIGHT 2012 BY CH2M HILL CANADA LIMITED • ALL RIGHTS RESERVED COMPANY CONFIDENTIAL
SECTION 5
Alternative Treatment Technologies Alternative treatment technologies were investigated to allow for the expansion of the Snap Lake Mine WTP to a capacity of 45 ML/d and to ensure compliance with the current and future licence requirements. A preliminary review of potential treatment approaches and technologies was presented to De Beers during the kick-off meeting held on December 15th, 2011. The meeting slides and minutes are included in Appendix B for reference. Treatment technologies considered for TSS removal include: high rate clarification processes, gravity media filtration or alternative filtration processes, and membrane filtration. Technologies for nitrate removal were also investigated as the 2015 limits will not be achievable with conventional treatment alone. These technologies include ion-exchange (IX), reverse osmosis (RO), electrodialysis reversal (EDR), and biological processes. Additionally, technologies were investigated for chloride and fluoride removal to comply with the future 2015 limits. These include lime precipitation, RO, EDR, IX, adsorption, and distillation.
5.1 Total Suspended Solids Removal TSS are typically removed from water through conventional treatment with coagulation, flocculation, sedimentation, and filtration. The existing Snap Lake Mine WTP incorporates coagulation with the addition of ferric sulphate into a reactor tank. A flocculant is added to the water following the reactor tank as it flows into the thickener where the majority of solids settle out. Twelve pressure filters are used for further solids removal.
Preliminary calculations indicate that the thickener is currently operating beyond its intended capacity and WTP operators have noted that the plant is capable of producing high quality (turbidity <1 NTU) water when influent flows are less than 1000 m3/h (24 ML/d). To increase the capacity of the thickener while maintaining high quality clarified water, tube or plate settlers could be added to the thickener.
The addition of tube/plate settlers to the thickener will only increase the capacity of the existing thickener by approximately 20 to 25 percent. To increase the capacity of the WTP to 45 ML/d, an additional treatment train will be required. Current licence limits for TSS will remain the same in 2015. Hence, the secondary treatment train will need to comply with the maximum monthly average limit of 7 mg/L and the maximum grab limit of 14 mg/L.TSS removal in the second treatment train could be provided by a high rate clarification process followed filtration, or microfiltration/ultrafiltration (MF/UF) membranes.
5.1.1 Treatment Options for TSS Removal Tube and Plate Settlers The addition of tube or plate settlers is an inexpensive approach to upgrading an existing WTP sedimentation basin or clarifier to improve performance. Tube and plate settlers allow the overflow rate in sedimentation basins and clarifiers to be increased, while maintaining or improving clarified water quality. While coagulation/flocculation processes increase the size of particles to accelerate settling, tube and plate settlers decrease the distance that particles must fall before they can settle out of a suspension; solids collect on the tube/plate surface and form a compact mass. Tube/plate surfaces are inclined to allow for the settled solids to slide down into the sludge collection zone where they can be removed.
Tube settlers are typically inclined at a 60 degree angle to optimize solids collection and mobility. The vertical height of tubes typically ranges from 0.5 to 2 m; longer tubes may be advantageous in high flow/high turbidity applications as they offer a longer residence time.
Tube settlers are typically made of lightweight PVC to minimize support structures. Circular clarifiers can use supports that span from the outside diameter to the centre well. Settler modules may be hung by an existing launder system, eliminating the need for an elaborate support system. The support system is typically constructed out of stainless steel, painted carbon steel, or aluminum.

SECTION 5—ALTERNATIVE TREATMENT TECHNOLOGIES
5-2 425332_WBG073112092156 COPYRIGHT 2012 BY CH2M HILL CANADA LIMITED • ALL RIGHTS RESERVED COMPANY CONFIDENTIAL
Parallel plates are also efficient at removing solids; however, it can be difficult to maintain even spacing and uniform flow, as wide plates in operation tend to be hydraulically unstable. Depending on the number of plates, plate size, and plate spacing, surface hydraulic loading rates will typically range from 9.5 to 17 m/h. The plates are typically spaced 50 mm (2 in) apart with an inclined length of 1 to 2 m. Plate settlers are typically more expensive than tube settlers as they are constructed out of stainless steel or aluminum; however, plate settlers will last longer than tube settlers and have fewer maintenance requirements. Composite plate settlers (PVC or FRP) are available but can degrade and distort over time due to water absorption and in the presence of UV light.
A comparison of the advantages and disadvantages of tube and plate settlers is shown in Table 6 below:
TABLE 6 Comparison of Advantages and Disadvantages of Tube Settlers Versus plate Settlers
Comparison Tube Settlers Plate Settlers
Advantages Lower initial cost than plate settlers
Tubes are lightweight; support structure can also be lightweight
Increases the rise rate of the existing clarifier; potentially decreases coagulant dosage and improves clarified water turbidity (rise rates from 1.0 gpm/ft
2 to 2.5 gpm/ft
2)
Plate materials (stainless steel and aluminum) will not chip-off and damage pumps
Plate materials (stainless steel and aluminum) are resistant to corrosion, robust, and not subject to damage during cleaning
Provides a more effective surface area for settling (smaller footprint)
Increases the rise rate of the existing clarifier; potentially decreases coagulant dosage and improves clarified water turbidity
Contractors/operators can walk on the plates for installation and cleaning
Disadvantages Can be damaged during cleaning; large chips of plastic can clog drains and damage pumps
Must be replaced after 10 to 25 years
Effluent quality is better with plate settlers
Can degrade and distort due to water absorption and in the presence of UV light
Higher initial cost than tube settlers
Composite plate settlers can warp overtime causing unbalances in the flow and short circuiting
Plate settlers require significant structural supports due to weight
Greater vertical height requirement for plates may impact solid collection system
Tanks equipped with high-rate settler modules must provide continuous sludge removal to keep up with the high sludge accumulation rate. The existing thickener at the Snap Lake Mine WTP is designed to remove sludge at a continuous rate but operators are currently practicing intermittent sludge disposal; the addition of tube/plate settlers may require the operators to switch back to continuous sludge disposal.
High Rate Clarification To expand the capacity of the Snap Lake Mine WTP to 45 ML/d, while continuing to meet the existing/future licence requirements for TSS, an additional treatment train will be required that can remove suspended solids. This could be accomplished by adding a high rate clarification process followed by a filtration or MF/UF.
High rate clarification processes typically incorporate ballasted flocculation with fine sand or recirculated sludge and/or plate/tube settlers to promote settling at a faster rate than in a conventional clarification process. This leads to higher rise rates, higher treatment capacities, and a smaller plant footprint. High rate clarification processes are typically bundled into pre-engineered package plants that are easy to install and operate. Three examples of these packaged units include the DensaDeg® clarifier/thickener, the Actiflo™ high rate clarification unit, and the CONTRAFAST® high rate sludge thickening clarifier/softener.
DensaDeg® Clarifier/Thickener
The DensaDeg® Clarifier/Thickener is a high-rate solids contact unit manufactured by Infilco Degremont Inc. The DensaDeg® unit combines optimized flocculation, internal and external sludge recirculation, and lamella settling tubes in two conjoined vessels to maximize hydraulic loading and treatment efficiencies. It can be used for

SECTION 5—ALTERNATIVE TREATMENT TECHNOLOGIES
425332_WBG073112092156 5-3 COPYRIGHT 2012 BY CH2M HILL CANADA LIMITED • ALL RIGHTS RESERVED COMPANY CONFIDENTIAL
treating industrial wastewaters to remove TSS and heavy metals (precipitation). Figure 2 shows a side view of a typical DensaDeg® high rate solids contact unit.
FIGURE 2 DensaDeg® High Rate Solids Contact Unit Process Design (Courtesy of IDI)
The DensaDeg® unit incorporates an integrated process involving: 1) a rapid mix stage; 2) a reactor-zone; 3) settling and separation; and 4) and sludge collection and thickening. Water flows into the rapid mix area and a coagulant is added, along with sodium hydroxide or lime for pH adjustment. In the reactor-zone the water is mixed by an axial flow turbine and recirculated through a cylindrical draft tube to promote solids contact and floc formation. A polymer and thickened sludge (recycled from the clarifier) are injected into the reactor draft tube to accelerate the flocculation process and promote the formation of dense floc particles. Following flocculation, the water flows into the setting zone over a submerged weir wall where dense floc particles settle out to the sludge thickening zone. Tube settlers provide additional removal of lighter, low-density solids, as the clarified effluent exits the DensaDeg® unit. Sludge is thickened at the bottom of the clarifier via a rotating scraper mechanism and periodically removed. A small portion of the sludge is recycled back to the reactor zone to enhance flocculation.
A DensaDeg® unit can either be constructed out of concrete or steel. Concrete tanks can have capacities ranging from 4 to 83 ML/d (1.0 to 22 MG/D) and steel tanks can have capacities ranging from 0.6 to 57 ML/d (0.15 to 15 MG/D). Rise rates for the DensaDeg® unit range from 14 to 36 m/h (6 to 15 gpm/ft2) and the unit can range from 4.6 to 6.7 m (15 to 22 ft) in height. For a unit that is capable of treating approximately 25 ML/d, the footprint required for coagulation, flocculation, and clarification (~300 m2) is much smaller than the footprint of a conventional clarifier (>500 m2). Thickened sludge produced by a DensaDeg® unit ranges from 2 to 10 percent solids. Compared to sand ballasted systems, the DensaDeg® unit produces an extremely low waste volume (10 times less).
Actiflo®
The Actiflo® high rate clarification unit, developed by Veolia Water Solutions & Technologies, is a compact process that includes coagulation, ballasted flocculation, and settling. The ballasted flocculation process uses microsand (Actisand®) as a seed for flocculate formation to promote rapid floc settlement and to allow for high overflow
Coagulation Heavy Metal
TankReactor
Clarifier/Thickener
Coagulant
Turbine
Draft Tube
Reactor
Turbine DriveLaunder
Assembly
Recirculation Cone
Lifting Assembly
Settling
Tube
Assembly
Sludge
Blowdown
Sludge
RecirculationSludge
Recycle PumpFlow
Splitter
Polymer
Settling
Tube Support
1)
2) 3)
4)
Rapid Mix

SECTION 5—ALTERNATIVE TREATMENT TECHNOLOGIES
5-4 425332_WBG073112092156 COPYRIGHT 2012 BY CH2M HILL CANADA LIMITED • ALL RIGHTS RESERVED COMPANY CONFIDENTIAL
rates and shorter retention times. An Actiflo® unit, capable of treating approximately 25 ML/d (~144 m2), has a smaller footprint than both a conventional clarifier (>500 m2) and the DensaDeg®(~300 m2).
The Actiflo® unit can be used to treat industrial process water and reduce concentrations of TSS (>90 percent), heavy metals, total organic carbon (TOC), phosphorus, and color; hence, it can serve as pretreatment process prior to membrane filtration or RO. For highly loaded industrial effluents, the Actiflo® unit can maintain rise rates of 50 to 100 m/h (21 to 41 gpm/ft2).
To achieve higher reductions in heavy metal concentrations, the Actiflo® unit can come equipped with a softening tank (Figure 3).
FIGURE 3 Actiflo® High Rate Softening/Clarification Unit (Courtesy of Veolia)
Chemical inputs to the unit include lime/soda ash, coagulant, polymer, and microsand. After the sludge is removed from the settling tank it is sent through a hydrocyclone where the microsand is recovered and recycled in the flocculation process.
CONTRAFAST®
The CONTRAFAST® is a high rate sludge thickening clarifier/softener that combines clarification and sludge
thickening in a single compact unit. Internal and external sludge recirculation and tube settling are included to
optimize clarification. As shown in the flow diagram in Figure 4, raw water combined with recycled sludge and
treatment chemicals enters the center draft tube (1). There they are mixed and recirculated within the reactor (2)
by the variable speed impeller. The impeller aids in accelerating solids formation and densifying the sludge. A
high-velocity upflow port prevents settling in the reactor and transfers the water to the settling chamber. The
water passes under a baffle and continues upward through the settling tubes (3) and into the effluent collection
launder (4). The dense sludge settles to the basin floor where it is continually scraped and further thickened, until
it is removed from the unit (5).
To Sludge Treatment
Clarified Water
Carbonates microsand ballasted flocs to hydrocyclone
Carbonates Sludge Recirculation
Coagulant Service Water
Hydrocyclone
Lime/Soda
Raw Water
Flocculation Tank
Coagulation Tank
Settling tank with lamella and scraper
Softening Tank

SECTION 5—ALTERNATIVE TREATMENT TECHNOLOGIES
425332_WBG073112092156 5-5 COPYRIGHT 2012 BY CH2M HILL CANADA LIMITED • ALL RIGHTS RESERVED COMPANY CONFIDENTIAL
FIGURE 4 Contrafast Process Diagram
The CONTRAFAST® can be used for treating industrial wastewaters to remove TSS (>80 percent), iron and manganese (>90 percent), and hardness (50 to 60 percent). It has a similar rise rate (14 m/h) and footprint (~264 m2) as the DensaDeg®. The main advantage of the CONTRAFAST® is that it is capable of producing sludge with more than 20 percent solids by weight, making additional sludge thickening unnecessary; hence, there is a low volume of waste to be disposed.
A comparison of the three different high rate clarification units is shown in Table 7.
TABLE 7 Comparison of High Rate Clarification/Softening Processes
Comparison Criteria DensaDeg® ActiFlo® CONTRAFAST®
Ballast Material Recirculated sludge; no maintenance concerns
Microsand; potential for abrasive wear
Recirculated sludge; no maintenance concerns
Waste volume and sludge solids content
Low waste volume (thickened sludge 2 to 10% solids by weight)
A hydrocyclone is used to separate sludge from microsand; final sludge concentration is 2,000 to 5,000 mg/L; up to 8% dry solids can be achieved with softening
Extremely low waste volume (thickened sludge more than 20% solids by weight)
Removes: TSS, heavy metals, TOC (enhanced removal with softening), phosphorus, and color
TSS, heavy metals, TOC (enhanced removal with softening), phosphorus, and color
TSS, iron, manganese, and hardness
Clarified Water Quality Treated water turbidity is normally less than 1 NTU
Turbidity removal greater than 90 percent; with lime softening clarified water turbidity is typically less than 1 NTU and TSS is less than 3 mg/L
Turbidity removal greater than 90 percent; TSS removal greater than 80 percent

SECTION 5—ALTERNATIVE TREATMENT TECHNOLOGIES
5-6 425332_WBG073112092156 COPYRIGHT 2012 BY CH2M HILL CANADA LIMITED • ALL RIGHTS RESERVED COMPANY CONFIDENTIAL
TABLE 7 Comparison of High Rate Clarification/Softening Processes
Comparison Criteria DensaDeg® ActiFlo® CONTRAFAST®
Start-up Time Rapid start-up due to internal/external sludge recirculation (~30 minutes)
Rapid start-up (less than 20 minutes)
Adaptability Can be operated over a wide range of flows and raw water characteristics
Reacts to changing water quality and provides consistent effluent quality
Softening? Yes Yes Yes
Filtration in a Combined Unit?
No Possible No
Chemical Addition Coagulant and/or lime, and polymer
Coagulant and/or lime, polymer, and microsand
Lime and soda ash; may require a polymer
Chemical Consumption Slightly less than ActiFlo® based on pilot studies (CDM, 2009)
1 Slightly higher than DensaDeg® based on pilot studies (CDM, 2009)
1
No comparative information available
Rise Rates (m/h) High rise rates (14 to 36 m/h) Very high rise rates (50 to 100 m/h)
High rise rate (~14 m/h)
Heights (m) 4.6 to 6.7 5 7
Footprint For 25 MLD ~26.5 m x 11.5 m or 300 m
2
Smallest footprint; for 25 ML/d ~12 m x 12 m or 144 m
2
For 28 ML/d ~16.5 m x 16 m or 264 m
2
Tank Materials External: steel or concrete
Internal: Painted carbon steel, stainless steel, or special coating
Tanks available in epoxy coated steel, stainless steel or glass fibre armed polyester (GAP).
1Camp, Dresser & McKee. 2009. City of Springfield, Ohio Comprehensive Facility Plan Technical Memorandum No. 3.
Filtration Technologies To ensure compliance with the Snap Lake Mine WTP licence requirement for TSS, filtration processes can be applied to provide further polishing of the settled water (following high rate clarification) to remove fine flocs, which are carried over after the clarification process.
High rate, gravity media filtration is the most common technology for treating municipal drinking water over a wide range of water quality conditions. Filter beds are typically comprised of a layer of sand overlain by granulated anthracite coal. Filtration occurs as particles are trapped within the voids of the filter bed. Periodic (often daily or more frequently) cleaning of the filters is accomplished by backwashing (reverse flow with or without supplemental surface wash or air scour). Backwashed solids are thickened in a settling basin or pond prior to disposal. Thickened sludge (2 to 6 percent solids) can be further dewatered by mechanical or non-mechanical methods depending on the needs for ultimate disposal. Common disposal options include onsite storage, land-filling, discharge to sanitary sewer system, and land application.
Some alternatives to conventional gravity media filtration include pressure filters, continuous backwash upflow filters, and surface filtration. Pressure filters and continuous backwash upflow filters are both considered depth filtration processes. In pressure filters, water is pumped through a pressurized vessel containing filter media (sand or anthracite). Filtration rates in pressure filters are similar to gravity filters. In continuous backwash upflow filters, water is introduced at the bottom of the filter; as the water flows upwards through the sand media, particles are trapped. A small portion of sand is continuously cleaned and recycled to eliminate the need for a backwash cycle. Surface filtration involves the removal of particulate matter via mechanical sieving with a filter septum (cloths or synthetic materials). Pore size of the material dictates the degree of particle removal.
Micro/Ultra - Membrane Filtration MF/UF processes can also be used as an alternative to granular media filtration to remove TSS following clarification. In MF/UF processes, water is sent through a semi-permeable membrane to remove TSS; dissolved
SECTION 5—ALTERNATIVE TREATMENT TECHNOLOGIES
425332_WBG073112092156 5-7 COPYRIGHT 2012 BY CH2M HILL CANADA LIMITED • ALL RIGHTS RESERVED COMPANY CONFIDENTIAL
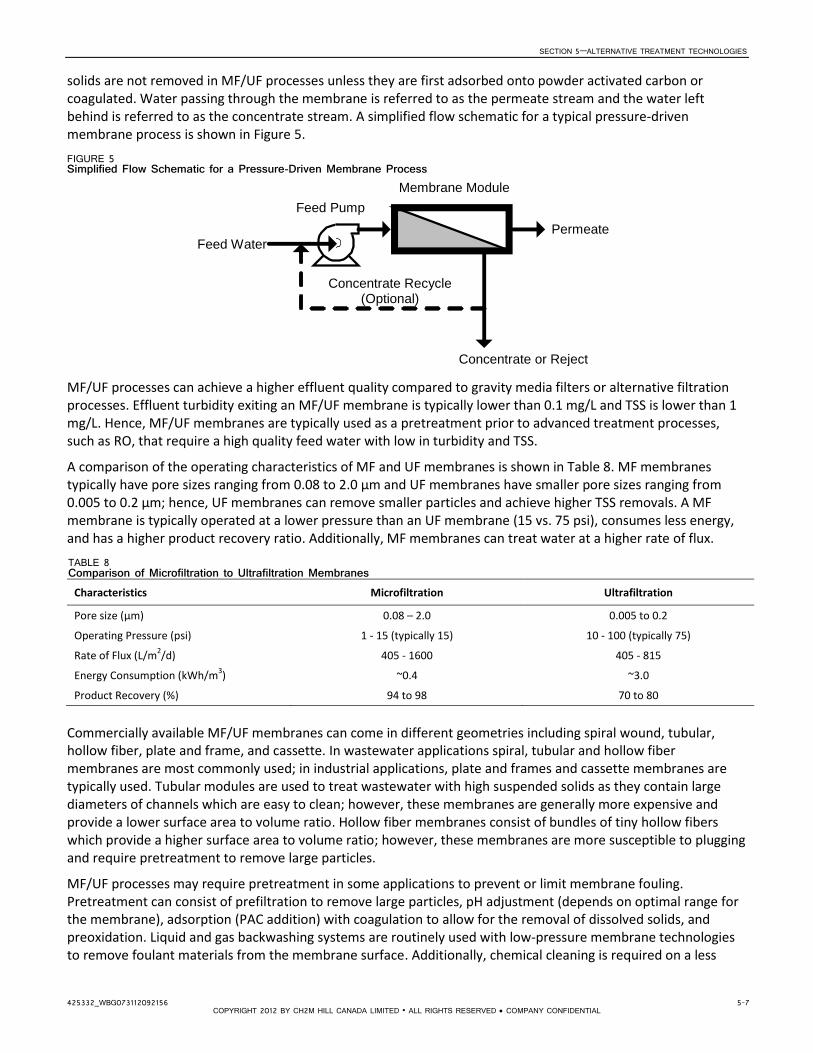
solids are not removed in MF/UF processes unless they are first adsorbed onto powder activated carbon or coagulated. Water passing through the membrane is referred to as the permeate stream and the water left behind is referred to as the concentrate stream. A simplified flow schematic for a typical pressure-driven membrane process is shown in Figure 5.
FIGURE 5 Simplified Flow Schematic for a Pressure-Driven Membrane Process
MF/UF processes can achieve a higher effluent quality compared to gravity media filters or alternative filtration processes. Effluent turbidity exiting an MF/UF membrane is typically lower than 0.1 mg/L and TSS is lower than 1 mg/L. Hence, MF/UF membranes are typically used as a pretreatment prior to advanced treatment processes, such as RO, that require a high quality feed water with low in turbidity and TSS.
A comparison of the operating characteristics of MF and UF membranes is shown in Table 8. MF membranes typically have pore sizes ranging from 0.08 to 2.0 µm and UF membranes have smaller pore sizes ranging from 0.005 to 0.2 µm; hence, UF membranes can remove smaller particles and achieve higher TSS removals. A MF membrane is typically operated at a lower pressure than an UF membrane (15 vs. 75 psi), consumes less energy, and has a higher product recovery ratio. Additionally, MF membranes can treat water at a higher rate of flux.
TABLE 8 Comparison of Microfiltration to Ultrafiltration Membranes
Characteristics Microfiltration Ultrafiltration
Pore size (µm) 0.08 – 2.0 0.005 to 0.2
Operating Pressure (psi) 1 - 15 (typically 15) 10 - 100 (typically 75)
Rate of Flux (L/m2/d) 405 - 1600 405 - 815
Energy Consumption (kWh/m3) ~0.4 ~3.0
Product Recovery (%) 94 to 98 70 to 80
Commercially available MF/UF membranes can come in different geometries including spiral wound, tubular, hollow fiber, plate and frame, and cassette. In wastewater applications spiral, tubular and hollow fiber membranes are most commonly used; in industrial applications, plate and frames and cassette membranes are typically used. Tubular modules are used to treat wastewater with high suspended solids as they contain large diameters of channels which are easy to clean; however, these membranes are generally more expensive and provide a lower surface area to volume ratio. Hollow fiber membranes consist of bundles of tiny hollow fibers which provide a higher surface area to volume ratio; however, these membranes are more susceptible to plugging and require pretreatment to remove large particles.
MF/UF processes may require pretreatment in some applications to prevent or limit membrane fouling. Pretreatment can consist of prefiltration to remove large particles, pH adjustment (depends on optimal range for the membrane), adsorption (PAC addition) with coagulation to allow for the removal of dissolved solids, and preoxidation. Liquid and gas backwashing systems are routinely used with low-pressure membrane technologies to remove foulant materials from the membrane surface. Additionally, chemical cleaning is required on a less
Feed Water Permeate
Concentrate or Reject
Concentrate Recycle (Optional)
Feed Pump
Membrane Module

SECTION 5—ALTERNATIVE TREATMENT TECHNOLOGIES
5-8 425332_WBG073112092156 COPYRIGHT 2012 BY CH2M HILL CANADA LIMITED • ALL RIGHTS RESERVED COMPANY CONFIDENTIAL
frequent basis (1 to 6 months) to remove constituents that are not removed during conventional backwashing and restore the transmembrane flux.
Compared to a conventional treatment process, MF/UF processes can reduce chemical consumption and save on space and labour requirements. However, MF/UF processes typically use more electricity (high energy costs), have lower recovery ratios, require disposal of concentrate streams, and may require pretreatment to prevent membrane fouling. A comparison of conventional gravity media filtration to MF/UF membranes processes is shown in Table 9.
TABLE 9 Comparison of Conventional Filtration to Microfiltration/Ultrafiltration Membranes Filtration for Effluent Polishing
Filtration Process Typical Performance Advantages Disadvantages
Conventional Filtration TSS (<5 mg/L)
Turbidity (<1 NTU)
Can also remove iron, manganese, arsenic, and some organics,
Low to moderate capital cost
Less waste to treat/dispose; single waste stream from backwashing (4 to 6%)
Low energy consumption compared to membranes
Low cost to replace granular media (~10 to 20% per year)
Larger footprint
Requires pretreatment with coagulation and sedimentation
More labour required to operate
Typically, additional treatment is required prior to RO to reduce turbidity
MF/UF Membrane Filtration
TSS (<1 mg/L)
Turbidity (<0.1 NTU)
Can also remove iron, manganese, arsenic, and some organics.
Improved effluent quality; reduced cleaning costs and fouling associated with subsequent membrane processes (i.e., RO)
More space efficient; smaller footprint than conventional filtration
Can reduce the amount of treatment chemicals (if pretreatment isn’t required)
Reduced labour requirement; automated easily
High capital costs and high cost to replace membranes (every 3 to 5 years)
Higher O & M costs due to high energy consumption and membrane washing and cleaning
Waste streams can be large for UF (10 to 15%)
Can require pretreatment if the feed water contains high turbidity and organics, and other potential membrane foulants (i.e., coagulation and sedimentation)
Scaling formation
5.2 Nutrients Removal The existing Snap Lake Mine WTP was not designed to remove nutrients; however, the 2011 effluent nutrient levels for ammonia, nitrate, and nitrite are all below the current licence limits. The 2010/2011 effluent concentrations of ammonia and nitrite are plotted in Figure 6, along with the current licence limits. The current maximum grab and maximum average monthly limits for nitrite in the effluent are 1 mg/L and 0.5 mg/L, respectively. Ammonia has a maximum grab limit of 20 mg/L and a maximum average monthly limit of 10 mg/L.

SECTION 5—ALTERNATIVE TREATMENT TECHNOLOGIES
425332_WBG073112092156 5-9 COPYRIGHT 2012 BY CH2M HILL CANADA LIMITED • ALL RIGHTS RESERVED COMPANY CONFIDENTIAL
FIGURE 6 Nitrite and Ammonia Concentrations in the Snap Lake Mine WTP Effluent from 2010 to 2011 Compared with Current Licence Limits
On November 11, 2010, a maximum grab sample of 55.5 mg/L of nitrate was reported, which exceeds current maximum grab limit of 44 mg/L; however, at that time the licence limit was 56 mg/L. All other effluent samples tested in 2010 contained nitrate concentrations below the current maximum grab limit (44 mg/L). In 2015, the average monthly licence limit for nitrate will be reduced to 4 mg/L (maximum grab = 8 mg/L). Nitrate levels in the effluent will exceed these new limits if it is not removed during treatment (Figure 7). To ensure compliance with the future 2015 limits for nitrate, treatment technologies for nitrate removal must be incorporated into the Snap Lake Mine WTP as part of the expansion. Typical processes that will remove nitrates and nitrites include IX (anion), RO, EDR, and biological treatment.
0
2
4
6
8
10
12
14-Oct-09 22-Jan-10 2-May-10 10-Aug-10 18-Nov-10 26-Feb-11 6-Jun-11 14-Sep-11 23-Dec-11
Effl
uen
t C
on
cen
trat
ion
(m
g/L)
Date
Effluent Nitrate Concentration
Effluent Ammonia Concentration
2012 Ammonia: Max. Average Monthly Limit = 10 mg/L
2012 Nitrite: Max. Average Monthly Limit = 0.5 mg/L
2012 Nitrite: Max. Grab Limit = 1 mg/L
Nitrite

SECTION 5—ALTERNATIVE TREATMENT TECHNOLOGIES
5-10 425332_WBG073112092156 COPYRIGHT 2012 BY CH2M HILL CANADA LIMITED • ALL RIGHTS RESERVED COMPANY CONFIDENTIAL
FIGURE 7 Nitrate Concentrations in the Snap Lake Mine WTP Effluent from 2010 to 2011 Compared with Current and Future Licence Limits
5.2.1 Scale of Treatment During the water quality data review, a mass balance was conducted to estimate the percent mass contribution of the mine and WMP water on the total influent nutrient mass loading (see Data Review Findings TM in Appendix A). The WMP was found to contribute to more than 50 percent of the total nitrate mass loading in 2011. Additionally, the WMP contributed to more than 20 percent of the total ammonia mass loading and to more than 15 percent for nitrite. Side-stream treatment of the WMP water for nutrient removal, prior to blending with the mine water, could result in significant reductions in ammonia, nitrate, and nitrite, during the periods when the WMP discharge to the WTP is high.
Figure 8 shows the estimated concentration of nitrate in the Snap Lake Mine WTP effluent under a scenario where 90 percent of the influent nitrate is removed from the WMP prior to the WTP (note the scale is different for the WMP since nitrate concentrations are significantly higher). Although, effluent nitrate concentrations are reduced significantly during the periods of high nitrate loading from the WMP, effluent nitrate concentrations often exceed the 2015 maximum average monthly limit of 4 mg/L. Hence, a side-stream treatment approach for nitrate removal from the WMP will not be sufficient to comply with the 2015 effluent requirements; the mine water will also require at least partial treatment for nitrate removal.
0
10
20
30
40
50
60
14-Oct-09 22-Jan-10 2-May-10 10-Aug-10 18-Nov-10 26-Feb-11 6-Jun-11 14-Sep-11 23-Dec-11
Nit
rate
Eff
luen
t C
on
cen
trat
ion
(m
g/L)
Date
2015 Nitrate: Max. Average Monthly Limit = 4 mg/L (Future Limit)
2015 Nitrate: Max. Grab Limit = 8 mg/L (Future Limit)
2012 Nitrate: Max. Average Monthly Limit = 22 mg/L (Current Limit)
2012 Nitrate: Max. Grab Limit = 44 mg/L (Current Limit)

SECTION 5—ALTERNATIVE TREATMENT TECHNOLOGIES
425332_WBG073112092156 5-11 COPYRIGHT 2012 BY CH2M HILL CANADA LIMITED • ALL RIGHTS RESERVED COMPANY CONFIDENTIAL
FIGURE 8 Estimated Nitrate Concentration in the Snap Lake Mine WTP Effluent if 90 percent of the Influent WMP Nitrate is Removed Prior to Blending with the Mine Water (note the scale is different for the WMP)
Alternatively, nitrate removal could be incorporated into a secondary treatment train. In this option the WMP water would be directed into the second treatment train (expansion), along with a portion of the mine water (~50 percent). The remaining mine water would be treated by the existing WTP train. Then, the two treatment trains would be blended prior to discharge into Snap Lake. Figure 9 shows the estimated concentration of nitrate in the blended effluent under a scenario where 90 percent of the influent nitrate is removed from the secondary treatment train (including the WMP water).
FIGURE 9 Estimated Nitrate Concentration in the Snap Lake Mine WTP Effluent if 90 Percent of the Nitrate is Removed from the Secondary Treatment Train and WMP Water (note the scale is different for the WMP)
0
50
100
150
200
250
300
0
10
20
30
40
50
60
14-Oct-09 22-Jan-10 2-May-10 10-Aug-10 18-Nov-10 26-Feb-11 6-Jun-11 14-Sep-11 23-Dec-11
Nit
rate
Co
nce
ntr
atio
n (
mg/
L)
- W
MP
wat
er
Nit
rate
Co
nce
ntr
atio
n (
mg/
L)
- M
ine
wat
er a
nd
Eff
luen
t
Date Mine Water Effluent Estimated Effluent (90% Removal WMP Only) WMP Water
2015 Max. Average Monthly Limit = 4 mg/L
2015 Max. Grab Limit = 8 mg/L
0
50
100
150
200
250
300
0
10
20
30
40
50
60
14-Oct-09 22-Jan-10 2-May-10 10-Aug-10 18-Nov-10 26-Feb-11 6-Jun-11 14-Sep-11 23-Dec-11
Nit
rate
Co
nce
ntr
atio
n (
mg/
L)
- W
MP
wae
ter
Nit
rate
Co
nce
ntr
atio
n (
mg/
L)
- M
ine
wat
er a
nd
Eff
lue
nt
Date
Mine Water Effluent Estimated Effluent (90% Treatment Second Train with WMP) WMP Water
2015 Max. Average Monthly Limit = 4 mg/L
2015 Max. Grab Limit = 8 mg/L
SECTION 5—ALTERNATIVE TREATMENT TECHNOLOGIES
5-12 425332_WBG073112092156 COPYRIGHT 2012 BY CH2M HILL CANADA LIMITED • ALL RIGHTS RESERVED COMPANY CONFIDENTIAL
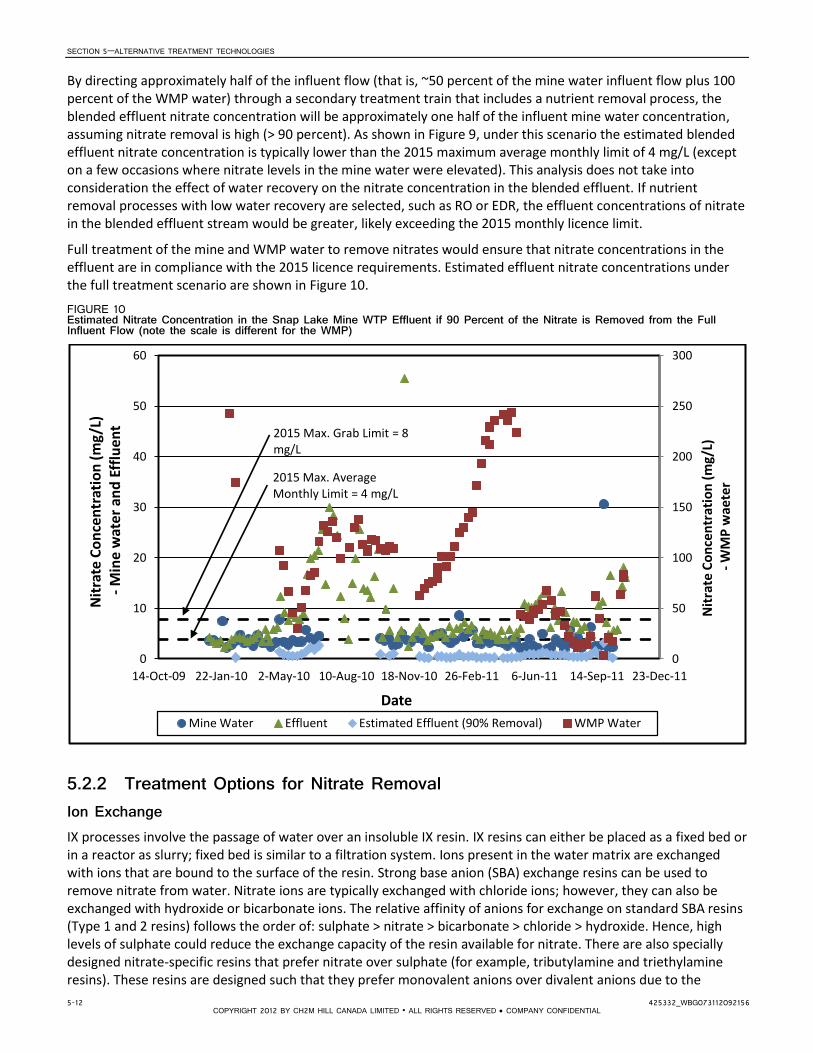
By directing approximately half of the influent flow (that is, ~50 percent of the mine water influent flow plus 100 percent of the WMP water) through a secondary treatment train that includes a nutrient removal process, the blended effluent nitrate concentration will be approximately one half of the influent mine water concentration, assuming nitrate removal is high (> 90 percent). As shown in Figure 9, under this scenario the estimated blended effluent nitrate concentration is typically lower than the 2015 maximum average monthly limit of 4 mg/L (except on a few occasions where nitrate levels in the mine water were elevated). This analysis does not take into consideration the effect of water recovery on the nitrate concentration in the blended effluent. If nutrient removal processes with low water recovery are selected, such as RO or EDR, the effluent concentrations of nitrate in the blended effluent stream would be greater, likely exceeding the 2015 monthly licence limit.
Full treatment of the mine and WMP water to remove nitrates would ensure that nitrate concentrations in the effluent are in compliance with the 2015 licence requirements. Estimated effluent nitrate concentrations under the full treatment scenario are shown in Figure 10.
FIGURE 10 Estimated Nitrate Concentration in the Snap Lake Mine WTP Effluent if 90 Percent of the Nitrate is Removed from the Full Influent Flow (note the scale is different for the WMP)
5.2.2 Treatment Options for Nitrate Removal Ion Exchange IX processes involve the passage of water over an insoluble IX resin. IX resins can either be placed as a fixed bed or in a reactor as slurry; fixed bed is similar to a filtration system. Ions present in the water matrix are exchanged with ions that are bound to the surface of the resin. Strong base anion (SBA) exchange resins can be used to remove nitrate from water. Nitrate ions are typically exchanged with chloride ions; however, they can also be exchanged with hydroxide or bicarbonate ions. The relative affinity of anions for exchange on standard SBA resins (Type 1 and 2 resins) follows the order of: sulphate > nitrate > bicarbonate > chloride > hydroxide. Hence, high levels of sulphate could reduce the exchange capacity of the resin available for nitrate. There are also specially designed nitrate-specific resins that prefer nitrate over sulphate (for example, tributylamine and triethylamine resins). These resins are designed such that they prefer monovalent anions over divalent anions due to the
0
50
100
150
200
250
300
0
10
20
30
40
50
60
14-Oct-09 22-Jan-10 2-May-10 10-Aug-10 18-Nov-10 26-Feb-11 6-Jun-11 14-Sep-11 23-Dec-11
Nit
rate
Co
nce
ntr
atio
n (
mg/
L)
- W
MP
wae
ter
Nit
rate
Co
nce
ntr
atio
n (
mg/
L)
- M
ine
wat
er a
nd
Eff
luen
t
Date
Mine Water Effluent Estimated Effluent (90% Removal) WMP Water
2015 Max. Average Monthly Limit = 4 mg/L
2015 Max. Grab Limit = 8 mg/L

SECTION 5—ALTERNATIVE TREATMENT TECHNOLOGIES
425332_WBG073112092156 5-13 COPYRIGHT 2012 BY CH2M HILL CANADA LIMITED • ALL RIGHTS RESERVED COMPANY CONFIDENTIAL
spacing of binding sites. Pretreatment for nitrate specific IX resins may include de-chlorination (if chlorine is present) and pre-filtration to prevent oxidation and physical fouling from occurring.
High TDS levels can also significantly reduce nitrate removal efficiencies. In general, an IX process is not economically attractive if source water contains greater than 500 mg/L of TDS and greater than 150 mg/L of sulphate. The Snap Lake mine water and effluent often contains over 500 mg/L of TDS; however, sulphate concentration is typically less than 50 mg/L.
If IX was implemented at the Snap Lake Mine WTP to treat nitrate, preference would be for an IX resin that exchanges hydroxide ions rather than chloride ions, as a new licence limit for chloride will be introduced in 2015 that will require additional treatment to remove chloride ions from the mine water. For an SBA resin, a sodium hydroxide (NaOH) solution or sodium bicarbonate solution (NaHCO3
-) can used as a regenerant to replenish the exchange sites. One disadvantage of using NaOH or NaHCO3
- solutions for regeneration instead of sodium chloride is the cost, as NaOH or NaHCO3
- solutions are more expensive per tonne. During regeneration, a concentrated brine stream is produced that must be disposed of; the brine is typically 1 to 2 percent of the total treated water flow.
Reverse Osmosis RO is a non-ion-specific technology which involves the use of high-pressure membranes capable of generating a high-purity treated effluent. By applying a pressure to water that is greater than the natural osmotic pressure, the water is forced to flow across a semi-permeable membrane towards a more dilute solution. RO membranes are primarily used to reduce high TDS concentrations (>90 percent reduction) but they can also be used to remove nitrates (>90 percent reduction possible). Additionally, RO can remove ions, including chloride and fluoride, and heavy metals. Although RO membranes will remove heavy metals from the feed water, some metals compounds should be removed during pretreatment to prevent scaling (for example, iron and manganese).
Compared to MF/UF membranes, RO membranes have smaller pores (0.1 to 1 nm), they operate at higher pressures (125 to 1000 psi), and they consume more energy (10 to 20 kWh/m3); hence, they are more expensive to operate. Additionally, RO membranes have lower product recovery ratios than MF/UF membranes (65 to 85 percent); as such, they produce a larger amount of concentrate that must be treated and disposed of. As with MF/UF membranes, RO membranes require regular chemical cleaning (once per month) to remove foulants and to restore the membrane flux. Residuals are generated during chemical cleaning which also require treatment and disposal.
Pretreatment for an RO membrane is typically more stringent than for MF/UF membranes. Chemical oxidants such as chlorine and potassium permanganate can damage an RO membrane and must be removed if pre-oxidation is practiced. To prevent fouling/scaling of the membrane, the feed water pH is adjusted to modify the solubility of precipitates; at a pH of 5.5 to 6.0, carbonate is in the form of carbon dioxide and will pass through the membrane. An antiscalent can be added to interfere with or slow down the rate of precipitate formation. Additionally, pretreatment with MF/UF is typically required to prevent fouling of the RO membrane with larger particles. RO is a continuous separation process without a periodic backwash cycle; thus, if it is not removed, particulate matter can clog the feed channels and accumulate on the membrane surface. RO feed water requires turbidity less than 1 NTU and a salt density index (SDI) less than 4. Compared to conventional filtration processes, MF/UF pretreatment will result in a consistently higher feed water quality (SDI of 2 to 3), reducing the rate of RO fouling thereby extending membrane life.
Based on review of available water quality data from the Snap Lake Mine WTP, pretreatment for metal /mineral removal and/or the addition of an antiscalent will be required to minimize scale formation if RO is selected to remove nitrate. Compounds present in feed water with a low solubility that tend scale include calcium carbonate, calcium fluoride, calcium orthophosphate, calcium sulphate, strontium sulphate, barium sulphate, iron, manganese, aluminum, and silica dioxide. The Snap Lake WTP effluent contains elevated levels of strontium (1 to 2 mg/L), and moderate level of iron (average = 0.05 mg/L) and manganese (average = 0.06 mg/L). Reactive soluble silica concentrations were measured in drift water at the Snap Lake Mine in 2008 and reported to range from 9.6

SECTION 5—ALTERNATIVE TREATMENT TECHNOLOGIES
5-14 425332_WBG073112092156 COPYRIGHT 2012 BY CH2M HILL CANADA LIMITED • ALL RIGHTS RESERVED COMPANY CONFIDENTIAL
to 15.4 mg/L; hence, silica is not expected to cause major scaling problems if an antiscalent is applied to the feed water.
Another factor to consider is the temperature of the feed water entering the RO membrane. The optimum water temperature for most RO membranes is 25°C. As the temperature drops to 5°C, the capacity of the RO unit will be reduced to less than one half. The water temperature at of the Snap Lake Mine water is typically ranges from 6 to 11°C; hence, unless the water temperature is increased, the capacity of the membrane will be reduced from what is specified under optimal conditions.
Electrodialysis Reversal Electrodialysis (ED) is an electrochemical process that involves passing an electric current through a series of ion-selective semipermeable membranes to mobilize and remove dissolved ions from a solution. The membranes are composed of ion-exchange material, with alternating cation and anion membranes assembled into stacks. As cations move towards the anode, they become trapped behind an anion-selective membrane and are disposed of into a brine solution; the opposite occurs for anions. In the EDR system, the polarity of the electric field is periodically reversed, which aids in flushing scale-forming ions off the membrane surface and further concentrating the brine solution.
Similar to RO, EDR removes TDS, chloride, fluoride, nitrate, and nitrite. Nitrate removals have been reported to range from 50 to 85 percent, typically lower than the removals achieved with RO membranes. However, EDR systems can achieve higher product recovery ratios than RO membranes; recoveries of greater than 90 percent are possible, as such a smaller volume of concentrated water waste is generated. Additionally, less pretreatment is typically required with EDR compared to RO, as EDR membranes are more durable, can operate over a wide range of pH values, can withstand high cleaning temperatures, are more resistant to organics, and are chlorine tolerant. In EDR, antiscalents are not required to prevent membrane fouling, as with RO.
Compared to RO, EDR systems are more complex, can be difficult to operate and maintain, and require close full-time monitoring. Costs for EDR systems are high (typically more costly than RO), as the process requires a large amount of energy, high operating costs, and waste treatment and disposal. For a TDS concentration greater than 3,000 mg/L, an EDR system can become more economically viable than RO due to the high scaling potential of the feedwater. However, this is not the case at the Snap Lake Mine WTP as the effluent TDS concentration is typically less than 600 mg/L.
Membrane Bioreactor Membrane bioreactors (MBRs) combine microfiltration with a suspended growth bioreactor into a single unit process. In a typical MBR system, MF modules are immersed directly into an activated-sludge reactor. A vacuum is applied to the membranes on the effluent-side, drawing water through the modules, while solids remain in the reactor. An air blower forces compressed air into a distribution manifold at the base of the reactors to clean the exterior of the membranes, maintain TSS, and provide oxygen to promote anaerobic conditions. A schematic diagram of a MBR is shown in Figure 11.

SECTION 5—ALTERNATIVE TREATMENT TECHNOLOGIES
425332_WBG073112092156 5-15 COPYRIGHT 2012 BY CH2M HILL CANADA LIMITED • ALL RIGHTS RESERVED COMPANY CONFIDENTIAL
FIGURE 11 Simplified Schematic a Membrane Bioreactor
At low dissolved oxygen concentrations, MBRs are capable of simultaneous nitrification and denitrification. Denitrification requires an external carbon source, which can be added to the water in the form of methanol or ethanol. Denitrification rates also depend on water temperature, with rates doubling for every 4°C increase in temperature. The temperature of the mine water entering the Snap Lake Mine WTP typically ranges from 6 to 11°C during the year; hence, denitrification via MBRs may not be as efficient as reported for WWTPs located in warmer climates.
Typical MBR configurations include hollow fiber grouped into bundles (for example, GE/Zenon ZeeWeed and Siemens MemPulse™ MBR) or flat plates (Kubota, Enviroquip). Membranes are constructed out of cellulose or polymer material with pore sizes ranging from 0.1 to 0.4 µm. High removal efficiencies can be achieved with an MBR for nutrients and TSS. Greater than 95 percent removal of ammonia-nitrogen (effluent ammonia-nitrogen <0.5 mg/L) and TSS (TSS <1 mg/L) has been achieved, as well as greater than 90 percent of total kjeldahl nitrogen (TKN <3 mg/L) and greater than 80 percent of total phosphorus (TP <1 mg/L). Dissolved solids are not removed with MBRs; hence, additional processes would be required to remove chloride and fluoride ions from the mine water. Compared to conventional biological treatment processes, MBRs can be operated with longer solids residence times (SRTs), resulting in lower sludge production.
Depending on the wastewater quality, pretreatment may be required to protect the membranes from physical damage. This may consist of primary settling and fine screens (1 to 3 mm cut-off) before the membranes. To prevent fouling and extend membrane life, continuous and intermittent cleaning is typically employed. Continuous air scouring prevents solids build-up on the surface of the membranes. If an anaerobic environment is desired for denitrification, scouring can be achieved by flushing the membrane with water. Intermittent treatments can include back-pulsing of permeate to keep the pores cleared, chemical cleaning with a strong sodium hypochlorite or citric acid solution (weekly), and periodic chemical bath cleaning (3 to 6 months).
In contrast to separation processes, such as RO or EDR, MBRs can achieve a high recovery of water and they do not produce waste brine or concentrate (reduction of nitrate rather than removal to a waste stream). A small volume of sludge waste (biological solids and organic matter) is produced that must be stored and disposed.
Influent
Permeate
Compressed Air
Waste Sludge
Bioreactor
Membrane Module

SECTION 5—ALTERNATIVE TREATMENT TECHNOLOGIES
5-16 425332_WBG073112092156 COPYRIGHT 2012 BY CH2M HILL CANADA LIMITED • ALL RIGHTS RESERVED COMPANY CONFIDENTIAL
Summary of Treatment Technologies for Nitrate Removal A summary of the different treatment process for removing nitrate are shown in Table 10.
TABLE 10 Treatment Technology Comparison for Nitrate Removal
Treatment Technologies
Removal Efficiency of Nitrate (%)
Water Loss (%)
Optimal Conditions
Advantages Disadvantages
Ion Exchange (Anion)
Up to 90% possible under optimal conditions
1 to 2% (depends on influent water quality and operating conditions)
Low turbidity, low TDS and low concentration of competing ions (e.g., sulphate) in feed water
High removals of nitrate may be possible
Smaller waste stream that RO or EDR
Moderate capital cost
Moderate to high O & M costs
Low capacity for fluoride; water will require additional treatment
Capacity affected by competing ions (e.g., sulphate)
Capacity for nitrate may be reduced due to high TDS in mine water
Requires disposal of brine solution produced during regeneration
Pretreatment will be required to reduce suspended solids
NaOH or NaCO3 will be required for regeneration; theses chemicals are more expensive than NaCl.
Reverse Osmosis
>90% possible under optimal conditions
20 to 40% <30 mg/L of silica; no particulates
Slightly acidic pH (5.5 to 6.0)
High removals of nitrate are possible
Also removes chloride, fluoride, TDS and heavy metals
Will ensure compliance if future limits are set for TDS
High capital and O & M costs
High energy consumption
High water loss
Inference by turbidity and silica
May require addition of antiscalent
Requires pretreatment and may require post-treatment (pH and/or alkalinity adjustment)
Brine stream and chemical cleaning residuals must be treated and disposed of
EDR 50 to 85% 10 to 30% Treats most waters without preference; most economical for TDS of 3000 to 5000 mg/L; maximum turbidity = 0.5 NTU
Higher water recovery than RO
Also removes chloride, fluoride, TDS and heavy metals
Not affected by silica concentrations in feed water
Multiple desalting stages required to achieve high removals of nitrate
High capital and O & M costs
Complex operation (close monitoring)
High energy consumption
High water loss
Brine stream must be must be treated and disposed of
MBR >90% Very low May require pH adjustment. Will require the addition of a substrate (carbon source)
High removals of nitrate, ammonia, and TSS
No waste brine or concentrate
High water
Will not remove chloride and fluoride ions; additional treatment required
High capital costs
High O & M costs associated with membrane cleaning, fouling control, and potential membrane

SECTION 5—ALTERNATIVE TREATMENT TECHNOLOGIES
425332_WBG073112092156 5-17 COPYRIGHT 2012 BY CH2M HILL CANADA LIMITED • ALL RIGHTS RESERVED COMPANY CONFIDENTIAL
TABLE 10 Treatment Technology Comparison for Nitrate Removal
Treatment Technologies
Removal Efficiency of Nitrate (%)
Water Loss (%)
Optimal Conditions
Advantages Disadvantages
recovery
Footprint can be comparable to RO or EDR systems
replacement
Complex, close monitoring required
High energy consumption
Will require an external source of carbon to allow for denitrification (e.g. methanol)
Chemicals are required to produce biosolids acceptable for disposal
5.3 Metal Removal The existing Snap Lake Mine WTP can achieve high reductions in total metal concentrations using a conventional treatment process (coagulation, clarification, and filtration). The mine water typically has low metal concentrations (refer to Table 1, Section 3) with the exception of aluminum (average = 12.1 mg/L), iron (average = 21.0 mg/L), and strontium (average = 1.76 mg/L); these metals can exist at concentrations above 1 mg/L. Metal concentrations are even lower in the WMP water (refer to Table 2, Section 3), with the exception of strontium (average = 2.15 mg/L). Although the existing train includes the option for lime addition to the reactor tank (to induce the chemical precipitation of dissolved metals), lime is currently not added to the water and coagulation is controlled at a pH close to 8; hence, low removals of some dissolved metals is expected.
The current treatment process is achieving high removals of total metals (Table 11) through the removal of the particulate fraction and low to moderate removals of the dissolved metals. The 2010 and 2011 effluent concentrations of regulated metals are in compliance with the current licence limits (Table 12). Table 13 compares the 2011 dissolved metal concentrations in the mine water to the current licence limits. All regulated metals, except for copper, had maximum dissolved metal concentrations which were less than or equal to the monthly average limits (Table 13). As such, the Snap Lake Mine WTP can meet the current effluent licence limits for most metals, even when the dissolved fraction is not removed during treatment (no precipitation). It should be noted that there was uncertainty regarding a few of the lab measurements of total and dissolved concentrations of metals; hence, the average dissolved concentrations reported in Tables 11 and 13 are likely higher than the actual average concentrations found in the mine water.
TABLE 11 Average percentage of total and dissolved metals removed at the Snap Lake Mine WTP - 2011
Metal
Average Mine Water Influent Concentration (mg/L)
Average WTP Effluent Concentration (mg/L)
Average Percent Removed (%)
Total Dissolved Total Dissolved Total Dissolved
Aluminum1 12.13 0.015 0.030 0.017 99.8 -17.5
Arsenic1,2
0.0018 0.0004 0.0001 0.00009 94.4 77.1
Cadmium1,2
0.00021 <0.0001 0.00003 0.00004 86.8 59.9
Chromium1,2
0.171 0.0004 0.0004 0.0005 99.8 -9.9
Copper1,2
0.014 0.004 0.0006 0.002 96.2 50.4
Lead1,2
0.016 0.0001 0.00009 0.00007 99.5 40.3
Nickel 0.305 0.009 0.010 0.010 96.8 -8.3
Zinc1 0.061 0.004 0.002 0.004 95.9 7.5
1Uncertainty regarding a few of the dissolved metal concentrations. Actual average concentrations may be lower than those reported.
2Uncertainty regarding a few of the total metal concentrations. Actual average concentrations may be lower than those reported.

SECTION 5—ALTERNATIVE TREATMENT TECHNOLOGIES
5-18 425332_WBG073112092156 COPYRIGHT 2012 BY CH2M HILL CANADA LIMITED • ALL RIGHTS RESERVED COMPANY CONFIDENTIAL
TABLE 12 Comparison of 2010 and 2011 effluent data from the Snap Lake Mine WTP with current licence limits (total metals)
Parameter
2010 SLM WTP Effluent
Average (mg/L)
2010 SLM WTP Effluent
Maximum (mg/L)
2011 SLM WTP Effluent
Average (mg/L)
2011 SLM WTP Effluent
Maximum (mg/L)
June 14, 2012 Average Monthly
Limit (mg/L)
June 14, 2012 Maximum Grab Limit
(mg/L)
In Compliance?
Aluminum 0.059 0.124 0.030 0.160 0.1 0.2 Yes
Arsenic 0.0005 <0.0041 0.0001 <0.004
1 0.007 0.014 Yes
Chromium 0.002 0.01 0.0005 <0.0031 0.01 0.02 Yes
Copper 0.001 <0.0041 0.0005 <0.004
1 0.003 0.006 Yes
Lead 0.0003 0.0011 0.00009 <0.00041 0.005 0.010 Yes
Nickel 0.013 0.040 0.010 0.013 0.05 0.10 Yes
Zinc 0.004 <0.0161 0.0025 <0.016
1 0.01 0.02 Yes
1The maximum concentration was listed as “<” µg/L; not clear how much less
TABLE 13 Comparison of dissolved metal concentrations in the mine water with current effluent licence limits
Metal
Dissolved Metal Concentration in Mine Water (mg/L)
2012 Effluent Average Monthly
Limit (mg/L)
2012 Effluent Max Grab Limit
(mg/L)
Dissolved Metals below limit?
Minimum Average Maximum
Aluminum 0.005 0.0151 0.054 0.1 0.2 Yes
Arsenic 0.0001 0.00041 <0.0016
2 0.007 0.014 Yes
Chromium 0.0001 0.00041 <0.008
2 0.01 0.02 Yes
Copper 0.0008 0.0039 0.0127 0.003 0.006 No
Lead 0.00005 0.000121 <0.0004
2 0.005 0.010 Yes
Nickel 0.0075 0.0088 0.0111 0.05 0.10 Yes
Zinc 0.0012 0.00431 0.0101 0.01 0.02 Yes
1Uncertainty regarding a few of the dissolved metal concentrations. Actual average concentrations may be lower than those reported.
2The maximum concentration was listed as “<” µg/L; not clear how much less
Expansion of the Snap Lake Mine WTP to 45 ML/d will require a secondary treatment train. Compliance with current limits for aluminum, arsenic, chromium, and copper should be attainable as long as the secondary treatment train incorporates conventional treatment, including optimized coagulation, clarification, and filtration processes. The existing WTP includes the option for lime addition to the reactor tank to induce the precipitation of dissolved metals. Likewise, provisions for lime addition could be integrated in the secondary treatment train to ensure continued compliance in the future if licence requirements become more stringent and the removal of dissolved metals is necessary.
If RO membranes are incorporated into the Snap Lake Mine WTP to remove nitrate, chloride, and fluoride, they will also remove dissolved metals. However, lime softening may be required as a pretreatment step to remove potential membrane foulants. Some minerals/metals present in the mine water can cause scale formation on the surface of RO membranes. These minerals/metals include aluminum, iron, manganese, barium (barium sulphate), strontium (strontium sulphate), and calcium (calcium carbonate and calcium sulphate).
To minimize scale formation, RO manufacturers typically recommend that combined iron levels in the feed water are less than 0.05 mg/L. Total iron concentrations in the effluent at the existing Snap Lake Mine WTP have exceeded 0.05 mg/L in the past, reaching up to 0.35 mg/L on July 14, 2010. The majority of this iron is insoluble and can foul the front end of an RO system; hence, pretreatment with lime softening is required to prevent fouling. Similarly, potential RO fouling can occur if the aluminum or manganese concentration reaches 0.05 mg/L. Effluent levels of manganese at the Snap Lake Mine WTP are typically higher than 0.05 mg/L and the majority of manganese is present in the dissolved form (soluble). Aluminum levels are typically lower than 0.05 mg/L but can

SECTION 5—ALTERNATIVE TREATMENT TECHNOLOGIES
425332_WBG073112092156 5-19 COPYRIGHT 2012 BY CH2M HILL CANADA LIMITED • ALL RIGHTS RESERVED COMPANY CONFIDENTIAL
exceed on occasion. Lime softening is very effective at removing dissolved iron and manganese from water and moderately effective at removing dissolved aluminum.
Due to their low solubility, very low levels of barium or strontium in the feed water can cause membrane fouling. Barium levels in the effluent at the Snap Lake Mine WTP are typically less than 0.05 mg/L. On the other hand, strontium is present in very high concentrations (1 to 3 mg/L) in the Snap Lake Mine WTP influent and it is not reduced significantly through conventional treatment; the effluent concentration is typically greater than 1 mg/L and present in the dissolved form. These contaminants may not be reduced significantly during lime softening and will require the addition of an antiscalent prior to the RO membrane to limit scale formation.
5.4 Major Ion Removal The existing Snap Lake Mine WTP is not designed to remove dissolved ions during treatment. On June 14, 2012, new licence limits came into effect for chloride and sulphate. The 2011 effluent concentrations of chloride and sulphate were found to comply with these new limits (Table 14). However, the licence limits for chloride will be further reduced in 2015 (on January 1) and a new limit will come into effect for fluoride. Mine water and WMP concentrations of chloride and fluoride measured in 2011 exceed the 2015 limits; hence, the water will need to be treated to remove these ions.
TABLE 14 Comparison of 2011 Chloride, Fluoride, Sulphate Data with 2012 and 2015 Licence Limits
Parameter
SLM WTP Effluent
Minimum (mg/L)
SLM WTP Effluent Average (mg/L)
SLM WTP Effluent
Maximum (mg/L)
June 14, 2012
Average Monthly
Limit (mg/L)
June 14, 2012
Maximum Grab Limit
(mg/L)
Jan. 1, 2015 Average Monthly
Limit (mg/L)
Jan. 1, 2015 Maximum Grab Limit
(mg/L) In
Compliance?
Chloride 168 237 316 310 640 160 320 Not with 2015
Fluoride 0.292 0.359 0.432 n/a n/a 0.15 0.3 Not with 2015
Sulphate 39.5 46.0 60.5 75 150 Yes
Treatment technologies that will remove chloride from water, as well as sulphates and fluoride, include ion-exchange, RO, EDR, and distillation. Fluoride can also be removed using adsorption processes (activated alumina) or with lime softening.
5.4.1 Scale of Treatment To comply with the 2015 limits for chloride and fluoride, both the mine water and WMP water will need to be treated for the removal of these ions, as the 2011 chloride and fluoride concentrations in the mine water and WMP exceed the future 2015 limits (Figure 12 and 13).
As shown in Figure 12, current effluent concentrations of fluoride approach 0.4 mg/L and can be higher on occasion. The fluoride concentration in the effluent is similar to that of the mine water. In 2010, the fluoride concentrations measured at the Snap Lake water intake were all less than 0.1 mg/L; hence, the fluoride concentrations in the mine water exceed background levels. Fluoride is likely entering the mine water during the mining process, as it can occur naturally in groundwater due to weathering of rocks containing fluoride bearing minerals (such as apatite, fluorite, and biotite). The WMP water can contain even higher concentrations of fluoride than present in the mine water; however, this does not appear to significantly increase the effluent concentration above that of the mine water. To ensure compliance with the 2015 effluent limits, at least 65 percent of the fluoride in the mine water will need to be removed (this could increase depending on the recovery of the treatment process selected). Hence, the best strategy for fluoride removal at the Snap Lake Mine WTP is to treat the full influent flow. This includes treating the existing train and any additional treatment trains required to expand capacity to 45 ML/d.

SECTION 5—ALTERNATIVE TREATMENT TECHNOLOGIES
5-20 425332_WBG073112092156 COPYRIGHT 2012 BY CH2M HILL CANADA LIMITED • ALL RIGHTS RESERVED COMPANY CONFIDENTIAL
FIGURE 12 2011 Fluoride Concentrations in the Mine Water and WMP Compared with the 2015 Limits
Effluent chloride concentrations typically range between 200 and 300 mg/L (Figure 13). The mine water concentrations of chloride are similar to the effluent concentrations exiting the Snap Lake Mine WTP, suggesting that the WMP water has a negligible effect on the resulting effluent concentration. To comply with the 2015 maximum average monthly limit of 160 mg/L, approximately 50 percent of the chloride in the mine water must be removed during treatment. One option would be to treat the WMP water (100 percent) and approximately half of the mine water (~20 ML/d) with a secondary treatment train that removes a high percentage of chloride (≥90 percent). Under this scenario, chloride concentrations in the effluent would fall below 160 mg/L most of the time (Figure 14). Under the full treatment scenario, effluent chloride concentrations would fall below 30 mg/L most of the time (Figure 15).
0.00
0.20
0.40
0.60
0.80
1.00
1.20
1.40
8-Nov-10 28-Dec-10 16-Feb-11 7-Apr-11 27-May-11 16-Jul-11 4-Sep-11 24-Oct-11 13-Dec-11
Flu
ori
de
Co
nce
ntr
atio
n (
mg/
L)
Date
Mine Water
WMP Water
Effluent
2015 Max. Average Monthly Limit = 0.15 mg/L
2015 Max. Grab Limit = 0.3 mg/L

SECTION 5—ALTERNATIVE TREATMENT TECHNOLOGIES
425332_WBG073112092156 5-21 COPYRIGHT 2012 BY CH2M HILL CANADA LIMITED • ALL RIGHTS RESERVED COMPANY CONFIDENTIAL
FIGURE 13 2011 Chloride Concentrations in the Mine Water and WMP Compared with the 2015 Limits
FIGURE 14 Estimated Chloride Concentration in the Snap Lake Mine WTP Effluent if 50 percent of Influent Mine Water and 100 percent of the WMP Water is Treated for Chloride Removal (≥90 percent). Estimates are Based on 2010-2011 Data
0
100
200
300
400
500
600
700
800
900
8-Nov-10 28-Dec-10 16-Feb-11 7-Apr-11 27-May-11 16-Jul-11 4-Sep-11 24-Oct-11 13-Dec-11
Ch
lori
de
Co
nce
ntr
atio
n (
mg/
L)
Date
Mine Water
WMP Water
Effluent
2015 Max. Average Monthly Limit = 160 mg/L
2015 Max. Grab Limit = 320 mg/L
0
100
200
300
400
500
600
700
800
900
14-Oct-09 22-Jan-10 2-May-10 10-Aug-10 18-Nov-10 26-Feb-11 6-Jun-11 14-Sep-11 23-Dec-11
Ch
lori
de
Co
nce
ntr
atio
n (
mg/
L)
Date
Mine Water
WMP Water
Effluent
Estimated Effluent (50 % Removal)
2015 Max. Average Monthly Limit = 160 mg/L
2015 Max. Grab Limit = 320 mg/L
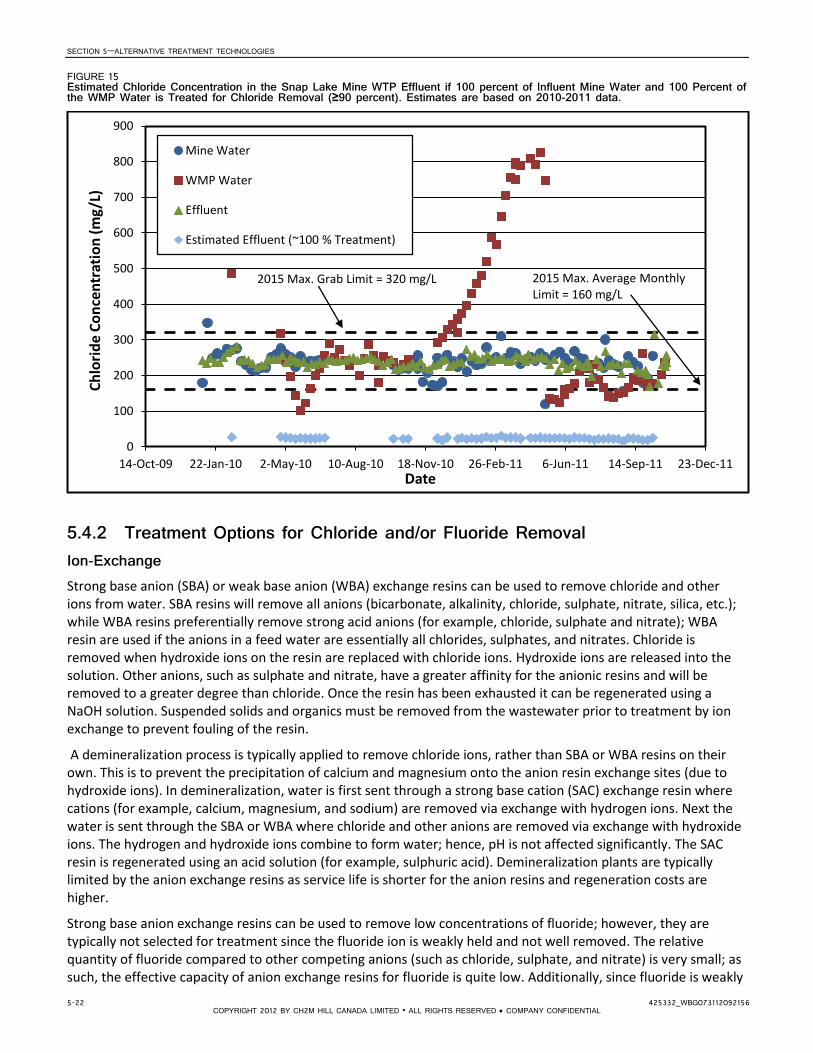
SECTION 5—ALTERNATIVE TREATMENT TECHNOLOGIES
5-22 425332_WBG073112092156 COPYRIGHT 2012 BY CH2M HILL CANADA LIMITED • ALL RIGHTS RESERVED COMPANY CONFIDENTIAL
FIGURE 15 Estimated Chloride Concentration in the Snap Lake Mine WTP Effluent if 100 percent of Influent Mine Water and 100 Percent of the WMP Water is Treated for Chloride Removal (≥90 percent). Estimates are based on 2010-2011 data.
5.4.2 Treatment Options for Chloride and/or Fluoride Removal Ion-Exchange Strong base anion (SBA) or weak base anion (WBA) exchange resins can be used to remove chloride and other ions from water. SBA resins will remove all anions (bicarbonate, alkalinity, chloride, sulphate, nitrate, silica, etc.); while WBA resins preferentially remove strong acid anions (for example, chloride, sulphate and nitrate); WBA resin are used if the anions in a feed water are essentially all chlorides, sulphates, and nitrates. Chloride is removed when hydroxide ions on the resin are replaced with chloride ions. Hydroxide ions are released into the solution. Other anions, such as sulphate and nitrate, have a greater affinity for the anionic resins and will be removed to a greater degree than chloride. Once the resin has been exhausted it can be regenerated using a NaOH solution. Suspended solids and organics must be removed from the wastewater prior to treatment by ion exchange to prevent fouling of the resin.
A demineralization process is typically applied to remove chloride ions, rather than SBA or WBA resins on their own. This is to prevent the precipitation of calcium and magnesium onto the anion resin exchange sites (due to hydroxide ions). In demineralization, water is first sent through a strong base cation (SAC) exchange resin where cations (for example, calcium, magnesium, and sodium) are removed via exchange with hydrogen ions. Next the water is sent through the SBA or WBA where chloride and other anions are removed via exchange with hydroxide ions. The hydrogen and hydroxide ions combine to form water; hence, pH is not affected significantly. The SAC resin is regenerated using an acid solution (for example, sulphuric acid). Demineralization plants are typically limited by the anion exchange resins as service life is shorter for the anion resins and regeneration costs are higher.
Strong base anion exchange resins can be used to remove low concentrations of fluoride; however, they are typically not selected for treatment since the fluoride ion is weakly held and not well removed. The relative quantity of fluoride compared to other competing anions (such as chloride, sulphate, and nitrate) is very small; as such, the effective capacity of anion exchange resins for fluoride is quite low. Additionally, since fluoride is weakly
0
100
200
300
400
500
600
700
800
900
14-Oct-09 22-Jan-10 2-May-10 10-Aug-10 18-Nov-10 26-Feb-11 6-Jun-11 14-Sep-11 23-Dec-11
Ch
lori
de
Co
nce
ntr
atio
n (
mg/
L)
Date
Mine Water
WMP Water
Effluent
Estimated Effluent (~100 % Treatment)
2015 Max. Average Monthly Limit = 160 mg/L
2015 Max. Grab Limit = 320 mg/L

SECTION 5—ALTERNATIVE TREATMENT TECHNOLOGIES
425332_WBG073112092156 5-23 COPYRIGHT 2012 BY CH2M HILL CANADA LIMITED • ALL RIGHTS RESERVED COMPANY CONFIDENTIAL
held by SBA resins, if the process is over-run, it can be dumped into the effluent at concentrations greater than the influent loading. In anion exchange, fluoride is removed when chloride ions on the resin are replaced with fluoride ions. Hence, the chloride concentration in the effluent will increase, which is not desirable at the Snap Lake Mine WTP. Furthermore, high TDS levels (> 500 mg/L) can decrease IX capacity and hinder the IX reaction. The Snap Lake mine water and effluent often contains over 500 mg/L of TDS.
Reverse Osmosis RO is an effective process for removing chloride from drinking water. Removals greater than 95 percent can be achieved. Additionally, the US EPA has identified RO as a Best Available Technology (BAT) for the control of fluoride in drinking water; 85 to 95 percent of fluoride can be removed with RO. Removal efficiency depends upon pH, membrane characteristics, flow rate, feed water composition, and the initial feed water fluoride concentration. Pretreatment of the feed water is required to prevent membrane fouling and scaling. Disadvantages of RO include its high capital cost, high operational costs, high energy consumption, and high water loss (20 to 40 percent).
Electrodialysis Reversal For high initial feed water concentrations (>100 mg/L), removals of chloride by EDR can range from 70 to greater than 90 percent depending on the number of desalting stages. Additionally, EDR is can achieved 85 to 95 percent removal of fluoride.
Less pretreatment is typically required with EDR compared to RO, as EDR membranes are more durable, can operate over a wide range of pH values, can withstand high cleaning temperatures, are more resistant to organics, and are chlorine tolerant. Process efficiency is not affect by silica, as with RO, and membranes are tolerant to the turbidity values typically achieved following clarification and media filtration processes. The guideline for maximum feed water turbidity is 0.5 NTU. Additionally, antiscalents are not required to prevent membrane fouling.
Similar to RO, the disadvantages of EDR include its high capital cost, high operational costs, high energy consumption, and high water loss (10 to 30 percent). The product recovery ratio can sometimes be higher than with RO.
Distillation Treatment by distillation involves the separation of ions from water by vaporization and then condensation to turn the vapour back to water. Chloride salts and fluoride are left behind when the water vaporizes; additionally, distillation will remove nitrate from the water. Distillation is an expensive process (high capital costs and high energy consumption) and it’s typically limited to applications were a high degree of treatment is required for contaminants that cannot be removed by any other means. Since thermal energy makes up the majority of operating costs, distillation can become more economically feasible if a source of waste heat is available from another process (for example, power production). As with RO, distillation processes produce a concentrated waste stream that must be disposed of. Recovery ratios for distillation plants are low (~50 percent), typically less than those observed for membrane processes.
The boiling chamber in a distillation process requires periodic cleaning to remove the accumulated minerals and prevent scaling. Calcium sulfate, magnesium hydroxide, and calcium carbonate can cause scaling on heat exchanger tube surfaces; scaling is typically controlled using an antiscalent or by operating at a lower temperature. Pretreatment with nanofiltration can also be used to reduce the potential of calcium sulfate scaling. Corrosion can be controlled by adjusting the operating temperature and pH, and/or by limiting the concentration of corrosive gases and chloride ions in the feed water. Sand must be removed before the evaporator with sedimentation to prevent erosion of tubing surfaces and the plugging of spray nozzles.
Adsorption Adsorption processes, such as activated alumina and powdered activated carbon (PAC) have been used to remove fluoride from water. The US EPA has identified activated alumina as another BAT for the control of fluoride in drinking water.

SECTION 5—ALTERNATIVE TREATMENT TECHNOLOGIES
5-24 425332_WBG073112092156 COPYRIGHT 2012 BY CH2M HILL CANADA LIMITED • ALL RIGHTS RESERVED COMPANY CONFIDENTIAL
Activated alumina is primarily composed of aluminum oxide that is ground into the granular form and has been exposed to high temperature and caustic soda. As fluoride accumulates on the surface of the alumina media, adsorption capacity decreases and less fluoride is removed. Hence, alumina must be periodically replaced or regenerated to continue removing fluoride. Spent regenerant can be treated with lime or dried in evaporation ponds. Activated alumina can be advantageous compared to other fluoride removal techniques (such as ion-exchange) as it is not affected significantly by competing anions such as sulphate, nitrate, or chloride and it will adsorb fluoride without releasing aluminum ions into the water. Additionally, compared with RO, treatment with activated alumina is more economical, as a smaller waste stream is generated (typically 3 percent), lower costs are associated with equipment and operation, and the activated alumina process consumes less energy.
Adsorption with activated alumina is generally is most effective at a slightly acidic pH (5.5 to 6.5). At the Snap Lake Mine WTP, the influent pH of the mine water is typically close to 8; hence, sulphuric acid would need to be added prior to treatment with activated alumina to maximize effectiveness. Additionally, the pH would need to be raised to between 7 and 8 following treatment, prior to discharge into Snap Lake. Treatment is less effective in waters containing a high concentration of compounds that can interfere with the adsorption process. Compounds such as metal hydroxides, suspended solids, carbonates, and adsorbed silicates can reduce the adsorption capacity of activated alumina (Health Canada, 2010). Treatment with activated alumina would need to follow coagulation, sedimentation and filtration to reduce the feed water TSS and prevent clogging.
Fluoride removals with activated alumina have been reported to range from less than 50 percent, to 100 percent, in bench- and pilot-scale experiments (US EPA, 2012). Most of these studies have focused on reducing elevated concentrations of fluoride (>4.0 mg/L) to achieve an effluent concentration less than 1 mg/L; however, few studies have been completed to assess fluoride reduction in waters with low influent concentrations (< 1 mg/L), such as in case of the Snap Lake Mine WTP influent (0.3 to 0.43 mg/L). In the majority of studies, the effluent concentrations reported typically exceeded 0.2 mg/L, which is greater than the maximum average monthly effluent limit for 2015. Furthermore, the capacity of activated alumina for fluoride has been found to be reduced with a decrease in influent fluoride concentration (Health Canada, 2010). Without bench or pilot-scale testing on the mine water, it is uncertain whether activated alumina can be used to consistently reduce fluoride concentrations below the 2015 effluent limits.
PAC has been found to be effective at removing fluoride from drinking water at a pH of 3.0 or less (up to 100 percent removal); however, at a pH of 8, removals less than 5 percent have been observed (US EPA, 2012).Due to the low pH required for effective removal, the use of PAC for fluoride removal is limited.
Lime Precipitation Fluoride can be precipitated as calcium fluoride at an alkaline pH (10 to 11) through the addition of lime. Calcium fluoride has a minimum solubility of 7.7 mg/L. Theoretically, the lowest fluoride concentration achievable by lime precipitation is 8 mg/L; however, lower fluoride concentrations (≤ 1 mg/L) have been observed following treatment. Removals up to 80 percent have been reported (US EPA, 2012). Source water quality can influence fluoride removal through lime precipitation. Higher removal of fluoride can occur in waters with higher magnesium concentrations as precipitation of fluoride can also occur as a coprecipitation process with magnesium hydroxide.
Since the influent concentration of fluoride entering the Snap Lake Mine WTP is already less than 1 mg/L, lime softening will not be an effective treatment to remove additional fluoride to comply with the 2015 licence limits. However, lime softening may still be necessary as a pretreatment, if RO is selected to remove chloride and fluoride, to precipitate silica and dissolved metals (such as iron and manganese) that can cause scaling/fouling problems.
5.4.3 Summary of Treatment Technologies for Fluoride and Chloride Removal A summary of the different treatment process for removing chloride and fluoride are shown in Table 15.

SECTION 5—ALTERNATIVE TREATMENT TECHNOLOGIES
425332_WBG073112092156 5-25 COPYRIGHT 2012 BY CH2M HILL CANADA LIMITED • ALL RIGHTS RESERVED COMPANY CONFIDENTIAL
TABLE 15 Treatment Technology Comparison (References: Pickard, 2004; Feenstra et al., 2007)
Treatment Technologies
Removal Efficiency Water Loss
Optimal Conditions
Advantages Disadvantages Fluoride Chloride
Ion Exchange Low 65 to >90% 1 to 2% pH 6.5 to 9 (decreased efficiency at high pH)
<50 mg/L SO4
<5 mg/L NO3
Low turbidity (<0.3 NTU)
<500 mg/L TDS
Can also remove some nitrate
Smaller waste stream that RO or EDR
Moderate capital cost
Moderate to high O & M costs
Low capacity for fluoride
Can impart chloride into the water
Demineralization IX may be required to remove chloride
Capacity affected by competing ions, turbidity, and TDS
Reverse Osmosis 85 to 95% >95% 20 to 40% <30 mg/L of silica; no particulates
Slightly acidic pH (5.5 to 6.0)
Treats for both chloride and fluoride
Can also remove nitrate
High capital and O & M costs
High energy consumption
High water loss
Inference by turbidity and silica
Requires pretreatment and may require post-treatment (pH alkalinity adjustment)
Brine stream must be disposed of
EDR 85 to 95% 70 to >90% 10 to 30% Treats most waters without preference; most economical for TDS of 3000 to 5000 mg/L; maximum turbidity = 0.5 NTU
Treats for both chloride and fluoride
Can also remove nitrate
Not affected by silica concentrations in the feed water
High capital and O & M costs
High energy consumption
High water loss
Brine stream must be disposed of
Distillation >99% >99% 50% Can be more economic is waste heat is available
Removes chloride fluoride, and nitrate
Higher capital costs and energy requirements compared with membrane processes
Large footprint

SECTION 5—ALTERNATIVE TREATMENT TECHNOLOGIES
5-26 425332_WBG073112092156 COPYRIGHT 2012 BY CH2M HILL CANADA LIMITED • ALL RIGHTS RESERVED COMPANY CONFIDENTIAL
TABLE 15 Treatment Technology Comparison (References: Pickard, 2004; Feenstra et al., 2007)
Treatment Technologies
Removal Efficiency Water Loss
Optimal Conditions
Advantages Disadvantages Fluoride Chloride
High quality water produced
Less monitoring than for membrane processes
No membrane replacement
Lower recovery ratios than membrane processes
Pretreatment required to prevent scaling and corrosion of plant components
Activated Alumina <50 to 100%
(most removals have been reported for influent conc. > 1 mg/L)
- 1 to 2% pH of 5.5 to 6.5
<30 mg/L Silica
low turbidity
Smaller waste stream
Low energy consumption
Low water loss (3 to 5%)
Sludge typically non-hazardous
Requires pH adjustment before and after treatment
Periodic regeneration
Chemical and sludge handling required
Will not remove chloride and nitrate
Lime Precipitation Up to 80 % removal at high fluoride conc.; not very effective at lower fluoride conc.
- 1 to 2% Precipitation occurs at an alkaline pH (10 to 11)
Easy to operate
Provisions for lime softening already at the Snap Lake WTP
Not very effective at low fluoride concentrations (< 1 mg/L)
Will not remove chloride or nitrate
Requires sludge handling and disposal
Requires post-pH adjustment
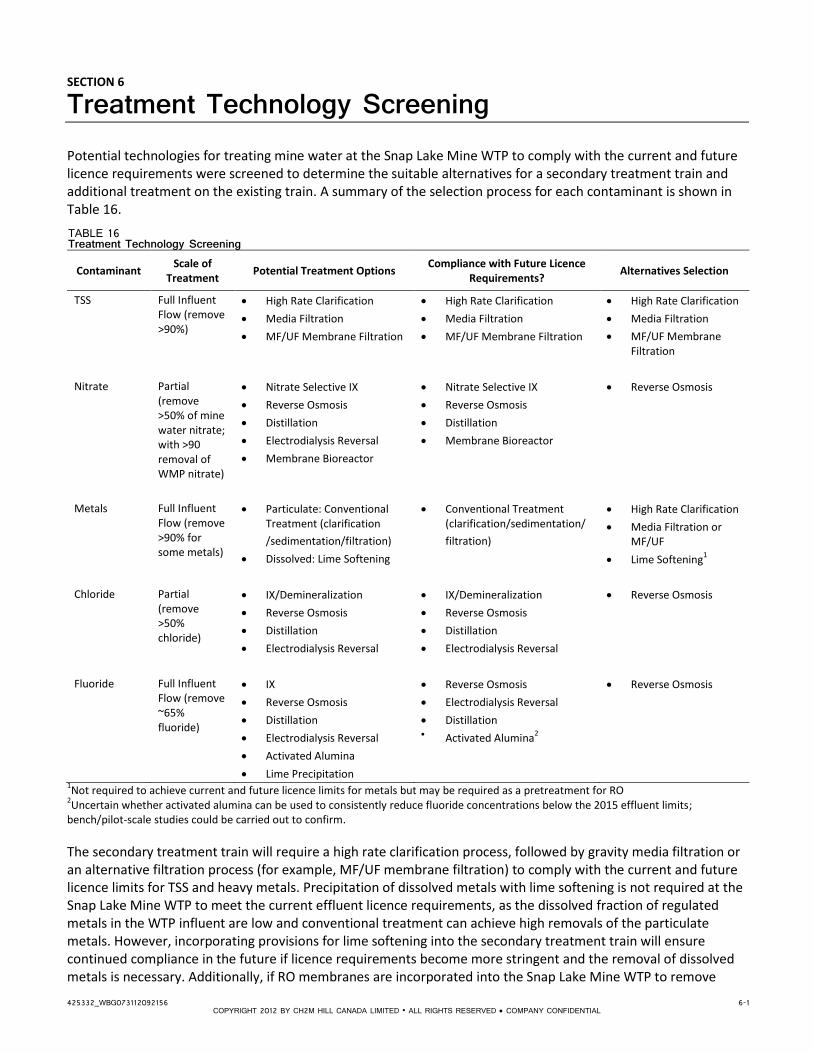
425332_WBG073112092156 6-1 COPYRIGHT 2012 BY CH2M HILL CANADA LIMITED • ALL RIGHTS RESERVED COMPANY CONFIDENTIAL
SECTION 6
Treatment Technology Screening Potential technologies for treating mine water at the Snap Lake Mine WTP to comply with the current and future licence requirements were screened to determine the suitable alternatives for a secondary treatment train and additional treatment on the existing train. A summary of the selection process for each contaminant is shown in Table 16.
TABLE 16 Treatment Technology Screening
Contaminant Scale of
Treatment Potential Treatment Options
Compliance with Future Licence Requirements?
Alternatives Selection
TSS Full Influent Flow (remove >90%)
High Rate Clarification
Media Filtration
MF/UF Membrane Filtration
High Rate Clarification
Media Filtration
MF/UF Membrane Filtration
High Rate Clarification
Media Filtration
MF/UF Membrane Filtration
Nitrate Partial
(remove >50% of mine water nitrate; with >90 removal of WMP nitrate)
Nitrate Selective IX
Reverse Osmosis
Distillation
Electrodialysis Reversal
Membrane Bioreactor
Nitrate Selective IX
Reverse Osmosis
Distillation
Membrane Bioreactor
Reverse Osmosis
Metals Full Influent Flow (remove >90% for some metals)
Particulate: Conventional Treatment (clarification
/sedimentation/filtration)
Dissolved: Lime Softening
Conventional Treatment (clarification/sedimentation/
filtration)
High Rate Clarification
Media Filtration or MF/UF
Lime Softening1
Chloride Partial (remove >50% chloride)
IX/Demineralization
Reverse Osmosis
Distillation
Electrodialysis Reversal
IX/Demineralization
Reverse Osmosis
Distillation
Electrodialysis Reversal
Reverse Osmosis
Fluoride Full Influent Flow (remove ~65% fluoride)
IX
Reverse Osmosis
Distillation
Electrodialysis Reversal
Activated Alumina
Lime Precipitation
Reverse Osmosis
Electrodialysis Reversal
Distillation Activated Alumina
2
Reverse Osmosis
1Not required to achieve current and future licence limits for metals but may be required as a pretreatment for RO
2Uncertain whether activated alumina can be used to consistently reduce fluoride concentrations below the 2015 effluent limits;
bench/pilot-scale studies could be carried out to confirm.
The secondary treatment train will require a high rate clarification process, followed by gravity media filtration or an alternative filtration process (for example, MF/UF membrane filtration) to comply with the current and future licence limits for TSS and heavy metals. Precipitation of dissolved metals with lime softening is not required at the Snap Lake Mine WTP to meet the current effluent licence requirements, as the dissolved fraction of regulated metals in the WTP influent are low and conventional treatment can achieve high removals of the particulate metals. However, incorporating provisions for lime softening into the secondary treatment train will ensure continued compliance in the future if licence requirements become more stringent and the removal of dissolved metals is necessary. Additionally, if RO membranes are incorporated into the Snap Lake Mine WTP to remove

SECTION 6—TREATMENT TECHNOLOGY SCREENING
6-2 425332_WBG073112092156 COPYRIGHT 2012 BY CH2M HILL CANADA LIMITED • ALL RIGHTS RESERVED COMPANY CONFIDENTIAL
nitrate, chloride, and fluoride, lime softening will likely be required as a pretreatment step to remove potential membrane foulants.
The secondary treatment train and the existing WTP plant will require additional treatment to comply with the future licence limits for nitrate, chloride, and fluoride. For nitrate removal, EDR was eliminated as a treatment option since it has a lower rejection rate of nitrate than the other technologies. Additionally, EDR systems are typically more costly than RO, more complex, and can be difficult to operate and maintain. Treatment with an MBR was deemed non-viable due to its high costs and complex biological requirements (i.e. temperature, external carbon source, dissolved oxygen, etc.). For fluoride removal, lime precipitation was eliminated as a treatment option since it is not be capable of achieving high enough removals of fluoride to comply with the future licence requirements. The efficiency to which activated alumina or IX processes can remove fluoride from an industrial mine water with a low influent fluoride concentration and high TDS is uncertain. These options could potentially be explored further through bench/pilot-scale testing. While distillation can achieve high removals of all three contaminants, it was deemed to be not economically viable, as it would require a large input of thermal energy and has a very low recovery ratio (~50 percent). As a worst case scenario, RO was selected over other potential treatment options in the absence of bench/pilot-scale testing to ensure compliance with the 2015 effluent licence requirements for fluoride, chloride, and nitrate.

425332_WBG073112092156 7-1 COPYRIGHT 2012 BY CH2M HILL CANADA LIMITED • ALL RIGHTS RESERVED COMPANY CONFIDENTIAL
SECTION 7
Treatment Train Alternatives Alternative treatment trains were investigated under two different treatment scenarios to allow for cost comparisons to be made regarding treatment options to comply with the current and future licence limits. Under Scenario No. 1, alternative treatment trains were considered to expand the plant capacity to 45 ML/d, while continuing to comply with the current licence requirements. Under Scenario No. 2, alternative treatment trains, including additions to the existing treatment train, were considered to comply with the 2015 licence requirements and to expand treatment capacity to 45 ML/d.
7.1 Scenario 1: Current Licence Requirements Based on the treatment technologies selected through the screening process, secondary treatment trains were investigated for the Snap Lake Mine WTP to expand capacity to 45 ML/d and to ensure compliance with the current licence requirements. Each alternative includes a high rate clarification process to remove TSS and metals, followed by polishing filters to further reduce TSS:
Alternative 1: Densadeg® with Continuous Backwash Filters
Alternative 2: Actiflo® Package Plant Clarifier and Polishing Filter
7.1.1 Alternative 1: Densadeg® Integrated Reactor/Clarifier/Thickener with Continuous Backwash Filters
The secondary train will be able to treat an average flow of 20 ML/d and a maximum flow of 25 ML/d. Treatment will consist of coagulation (with optional lime precipitation), flocculation, clarification and thickening, and filtration. All processes prior to filtration will be provided for with the Densadeg® Integrated Reactor/Clarifier/Thickener. Chemical feed systems will be required for coagulation, flocculation, and pH adjustment prior to filtration. A process schematic of the secondary treatment train is shown in Figure 16.
FIGURE 16 Process Schematic of the Secondary Treatment Train Equipped with Densadeg® and Continuous Backwash Sand Filters
P
Ferric Sulphate Polymer
Hydrated Lime
Sulphuric Acid
Process Description Coagulation
Coagulation will occur in a single rapid mix tank (RMT) with the addition of ferric sulphate and hydrated lime at a pH of 9 to 10. Ferric sulphate serves as a co-precipitating agent to enhance heavy metal removal. Hydrated lime is added to the RMT to adjust and maintain the pH between 9 and 10 and provide alkalinity. The coagulant will react
Mine water
Sand Filters Reactor/Clarifier/Thickener Tank
Waste Sludge
Sludge Recycle
pH Adjustment Tank
Equalization Tank
Snap Lake

SECTION 7—TREATMENT TRAIN ALTERNATIVES
7-2 425332_WBG073112092156 COPYRIGHT 2012 BY CH2M HILL CANADA LIMITED • ALL RIGHTS RESERVED COMPANY CONFIDENTIAL
with the alkalinity in the water to create pin flocs of ferric hydroxide that can settle rapidly in the clarification tank.
Flocculation
Flocculation will occur in a single Densadeg® Reactor Tank with the addition of an anionic polyelectrolyte (polymer). The polymer is added to bridge between the pin flocs and create larger floc which will settle faster during clarification. Additionally, a portion of the thickened sludge (recycled from the clarifier) is injected into the Reactor Tank to promote the formation of dense floc particles.
Clarification
Clarification and thickening will occur in a single Densadeg® Clarifier Tank. Flocs will settle to the bottom as the clarifier and collect as sludge, which is compacted by gravity and further thickened by a rotating scraping mechanism. A portion of the sludge is recycled back to the Reactor Tank to promote the densification of the floc particles. The sludge densification that is achieve through internal and external sludge recirculation, leads to a thick sludge, ranging from 2 to 5 percent solids by weight. The upper portion of the Clarifier Tank contains lamella settling modules to catch light particles that would otherwise carry-over into the settled water. The TSS in the settled water is typically less than 5 mg/L (less than the current/future licence effluent limit of 7 mg/L).
pH Adjustment Tank
Prior to the filtration process, sulphuric acid will be added to the settled water in a pH Adjustment Tank to bring the pH back down, between 7 and 7.5.
Filtration
Following treatment with the Densadeg®, the settled water will require further polishing to remove suspended solids and turbidity. This will be accomplished by conventional gravity media filtration or continuous backwash sand filters. Continuous backwash filters can efficiently filter out heavy metal flocs that carry over from the clarification process at a high flow rate.
Parkson Corporation manufactures the Dynasand® filter, an upflow, deep bed, granular media filter with continuous backwash. The deep media bed allows the filters to handle a higher loading of suspended solids. For an influent TSS concentration of 15 mg/L, the Dynasand® filter can achieve an effluent TSS concentration of 5 mg/L, which would comply with the current max grab licence limit at the Snap Lake Mine WTP (7 mg/L). The Dynasand® filter media is cleaned by a simple internal washing system and does not require backwashing pumps or storage tanks; hence, the filters have low energy consumption.
Equalization Tank
Filtered water will flow by gravity to an equalization tank. Finished water in the equalization tank will be pumped for discharge into Snap Lake, with the option to divert a portion of the flow to the process plant.
Preliminary Equipment List The Densadeg® Integrated Reactor/Clarifier/Thickener comes equipped with:
Rapid Mix Tank (1)
Densadeg® Reactor Tank (1)
Densadeg® Clarifier/Thickener Tank with sludge scraper (1)
Sludge Recycle/Blowdown Pumps contained on one skid (3 pumps)
One pump for recycle stream,
One pump for the sludge blowdown
One standby pump to serve as a backup for both the recycle stream pump and sludge blowdown pump
Instrumentation and PLC control system
The specifications for tank size are presented in Table 17 below.

SECTION 7—TREATMENT TRAIN ALTERNATIVES
425332_WBG073112092156 7-3 COPYRIGHT 2012 BY CH2M HILL CANADA LIMITED • ALL RIGHTS RESERVED COMPANY CONFIDENTIAL
TABLE 17 Specifications for the Components of the Densadeg® Integrated Reactor/Clarifier/Thickener
Component Specification
Rapid Mix Tank
Diameter (m) 4.4
Cylindrical Height (m) 6.9 SS
Reactor Tank
Diameter (m) 7.6
Cylindrical Height (m) 6.4 SS
Clarifier/Thickener Tank
Diameter (m) 11.6
Cylindrical Height (m) 6.4 SS
SS = seam-to-seam
The chemical feed systems and storage tanks required include:
Hydrated lime chemical feed and storage
Lime hopper (1)
Screw feeder (1)
Lime slurry holding tank (1)
Lime dosing system skid with duty/standby metering pumps (2)
Coagulant (ferric sulphate) chemical feed and storage
Coagulant mixing tank (1)
Coagulant holding tank (1)
Coagulant dosing system skid complete with three metering pumps (3)
Polymer Dosing Package
Polymer preparation system (1)
Polymer dosing system skids (2) with duty/standby metering pumps (2)
Sulphuric acid chemical feed
Sulphuric acid dosing system skid with duty/standby metering pumps (2)
Based on the assumption that approximately 50 mg/L of sulphuric acid would be required to adjust the pH of the mine water prior to filtration, 40,000 L of storage would be required for 30 days storage at 45 ML/d. The existing sulphuric acid storage at the Snap Lake WTP consists of three tanks, each with a capacity of approximately 90,000 L (Ø = 3.5 m, h = 9.76 m), and 270,000 L in total. Hence, there is already sufficient storage available onsite for sulphuric acid. Additional metering pumps would be required to dose sulphuric acid into the pH adjustment tank in the secondary treatment train.
To treat 25 ML/d, 20 continuous backwash filter modules would be required, installed within two common filter cells (10 modules per cell) in a concrete tank. The specifications for the continuous backwash filters are provided in Table 18.
TABLE 18 Specifications for the Dynasand® Continuous Backwash Filters
Component Specification
Type Continuous backwash filters
Number of filter cells 2
Number of modules per cell 10
Filtration area per module (m2) 4.65
Filtration depth (m) 1.02
Design loading rate (m/h) 11,221 (all cells in service)
Design headloss across filter (m) 0.91

SECTION 7—TREATMENT TRAIN ALTERNATIVES
7-4 425332_WBG073112092156 COPYRIGHT 2012 BY CH2M HILL CANADA LIMITED • ALL RIGHTS RESERVED COMPANY CONFIDENTIAL
Component Specification
Plant Dimensions, L x W x D (m) 23.7 x 4.9 x 5.9
7.1.2 Alternative 2: Actiflo® Package Plant Clarifier with Metal Precipitation and
Polishing Filters The second alternative combines high rate clarification via ballasted flocculation and lamella settling with filtration to treat a maximum flow of 25 ML/d. Treatment will consist of metal precipitation, coagulation, flocculation, sedimentation, and pH adjustment in two parallel trains and further polishing with disc filters (or conventional gravity media filtration). Chemical feed systems will be required for metal precipitation, coagulation, flocculation, and pH adjustment. A process schematic of the secondary treatment train is shown in Figure 17.
FIGURE 17 Process Schematic of the Secondary Treatment Train Equipped with Actiflo® Package Plant Clarifier and Filtration
Hydrated LimePolymer
Ferric Sulphate
Sulphuric Acid
Polymer
Process Description Metal Precipitation
The mine water flows through a Metal Precipitation Reactor to precipitate dissolved metals and remove TSS. Hydrated lime is added to the reactor to raise the pH between 9 and 10, so that the majority of metals will precipitate as hydroxides (pH can be optimized for metal removal). Ferric sulphate is added as the coagulant, which will form a ferric hydroxide floc that can adsorb a portion of the dissolved metals by coprecipitation and capture fine solids. Additionally, a large portion of the sludge recycled from the Actiflo® clarifier is sent back to the Metal Precipitation Reactor to act as a seed and aid in precipitation.
Coagulation/Flocculation
Next, the Metal Precipitation Reactor effluent flows into the coagulation chamber of the Actiflo® Package Plant Clarifier where the reaction is completed. In the flocculation chamber of the Actiflo®, an anionic polymer is added is added and microsand to initiate floc formation. Microsand provides a surface area to enhance flocculation and acts as a ballast or weight during sedimentation. The TURBOMIX™ draft tube in the flocculation chamber provides ideal conditions for bridging between the microsand and destabilized suspended solids.
Sedimentation
Ballasted flocs enter the clarification chamber in the Actiflo® and settle rapidly with the aid of lamella settling tubes. Sludge mixed with microsand is collected at the bottom of the clarifier and continuously pumped to a hydrocyclone, where the sand is separated from the sludge. The recovered microsand is recycled back into the flocculation chamber and the light density sludge is split; the majority of the sludge is recycled back into the Metal Precipitation Reactor to act as a seed for precipitation and the remaining sludge is sent to waste. Clarified water exits the Actiflo® and is sent to the filters for further polishing.
Mine water
Metal Precipitation Tank
Microsand Recirculation
ACTIFLO®
Snap Lake
pH Adjustment Tank
Sludge Recycle
Sludge Waste
Hydrocyclone
Disc Filters Equalization Tank

SECTION 7—TREATMENT TRAIN ALTERNATIVES
425332_WBG073112092156 7-5 COPYRIGHT 2012 BY CH2M HILL CANADA LIMITED • ALL RIGHTS RESERVED COMPANY CONFIDENTIAL
pH Adjustment Tank
Clarified water from the Actiflo® flows into the pH Adjustment Tank where the pH is adjusted to between 7 and 7.5 with sulphuric acid. Polymer can also be added, prior to the filters, to agglomerate any residual suspended solids.
Polishing Filters
Settled water could be treated with conventional gravity media filtration or cloth-media disc filters to further reduce the suspended solids and turbidity. In disc filtration, solids are separated from the water via cloth filter media mounted on the two sides of the discs, which are partially submerged in the water. Filtered water flows into the collection tank, while solids are retained inside the media disc. Backwashing is automatically initiated when the water level in the inlet channel increases to a specific height. Solids from the filter media are washed into the collection trough as the discs are rotated.
Equalization Tank
Filtered water flows by gravity to an equalization tank. Finished water in the equalization tank will be pumped for discharge into Snap Lake, with the option to divert a portion of the flow to the process plant.
Preliminary Equipment List The Actiflo® high rate clarification process comes equipped with:
Metal Precipitation Reactor (2)
Actiflo® Package Plant Clarifier (2), each includes:
Microsand recirculation line equipped with pumps (2) and hydrocyclone
Sludge pumps (2)
pH Correction Reactor (2)
Control Panel for All Equipment (1)
The chemical feed systems and storage tanks required include:
Hydrated lime chemical feed and storage
Lime hopper (1)
Screw feeder (1)
Lime slurry holding tank (1)
Lime dosing system skid with duty/standby metering pumps (2)
Coagulant (ferric sulphate) chemical feed and storage
Coagulant mixing tank (1)
Coagulant holding tank (1)
Coagulant dosing system skid complete with three metering pumps (3)
Polymer dosing package, skid mounted
Automatic polymer preparation system (1)
Polymer dosing system skid (1) with three metering pumps (3)
Sulphuric acid chemical feed and storage
Sulphuric acid dosing system skid with duty/standby metering pumps (2)
Microsand for startup
Based on the assumption that approximately 50 mg/L of sulphuric acid would be required to adjust the pH of the mine water prior to filtration, 40,000 L of storage would be required for 30 days storage at 45 ML/d. The existing sulphuric acid storage at the Snap Lake WTP consists of three tanks, each with a capacity of approximately 90,000 L (Ø = 3.5 m, h = 9.76 m), and 270,000 L in total. Hence, there is already sufficient storage available onsite for sulphuric acid. Additional metering pumps would be required to dose sulphuric acid into the pH adjustment tank in the secondary treatment train.

SECTION 7—TREATMENT TRAIN ALTERNATIVES
7-6 425332_WBG073112092156 COPYRIGHT 2012 BY CH2M HILL CANADA LIMITED • ALL RIGHTS RESERVED COMPANY CONFIDENTIAL
The equipment required for filtration includes:
Hydrotech Discfilter (2), each includes:
Tank (1)
Drum (1)
Backwash pump (1)
Woven polyester filter media discs (12)
7.2 Scenario 2: Future Licence Requirements Based on the treatment technologies selected through the screening process, secondary treatment trains were investigated for the Snap Lake Mine WTP to expand capacity to 45 ML/d and to ensure compliance with the future 2015 licence requirements. Each alternative includes a high rate clarification process to remove TSS and metals, followed by MF/UF to further reduce TSS, and RO membranes to remove nitrate, chloride, and fluoride from the mine water. Options for the secondary treatment train include:
Alternative 3: Densadeg® with MF/UF and RO
Alternative 4: Actiflo® Package Plant Clarifier with MF/UF and RO
7.2.1 Alternative 3: Densadeg® Integrated Reactor/Clarifier/ Thickener with Microfiltration/Ultrafiltration and Reverse Osmosis
The secondary train will be able to treat an average flow of 20 ML/d and a maximum flow of 25 ML/d. Treatment will consist of coagulation (with optional lime precipitation), flocculation, clarification and thickening, MF/UF, and RO. All processes prior to pH adjustment will be provided for with the Densadeg® Reactor/Clarifier/Thickener. Chemical feed systems will be required for coagulation, flocculation, and pH adjustment prior to the RO process. A process schematic of the secondary treatment train is shown in Figure 18.
FIGURE 18 Process Schematic of the Secondary Treatment Train Equipped with Densadeg®, Microfiltration/Ultrafiltration, and Reverse Osmosis
P
Polymer
Hydrated Lime
Sulphuric AcidFerric Sulphate
Process Description Coagulation/Flocculation/Clarification
Coagulation will occur in a single rapid mix tank (RMT) with the addition of ferric sulphate and hydrated lime at a pH of 9 to 10 followed by flocculation will occur in a single Densadeg® Reactor Tank with the addition of an anionic polyelectrolyte (polymer). Additionally, a portion of the thickened sludge (recycled from the clarifier) is injected into the Reactor Tank to promote the formation of dense floc particles. Clarification and thickening will occur in a single Densadeg® Clarifier Tank. Flocs will settle to the bottom as the clarifier and collect as sludge, which is compacted by gravity and further thickened by a rotating scraping mechanism. The upper portion of the
Mine water
Microfiltration/ Ultrafiltration
Reactor/Clarifier/Thickener Tank
Waste Sludge
Sludge Recycle
2-Stage Reverse Osmosis
pH Adjustment Tank
Equalization Tank
Snap Lake
RO Reject MF/UF Reject Recycle

SECTION 7—TREATMENT TRAIN ALTERNATIVES
425332_WBG073112092156 7-7 COPYRIGHT 2012 BY CH2M HILL CANADA LIMITED • ALL RIGHTS RESERVED COMPANY CONFIDENTIAL
Clarifier Tank contains lamella settling modules to catch light particles that would otherwise carry-over into the settled water. The TSS in the settled water is typically less than 5 mg/L.
pH Adjustment Tank
Prior to the filtration process, sulphuric acid will be added to the settled water in a pH Adjustment Tank to bring the pH back down, between 7 and 7.5.
Microfiltration/Ultrafiltration and Reverse Osmosis Systems
The settled water will require further polishing to remove suspended solids and turbidity prior to the RO membrane. This will be accomplished by an MF/UF system. Reject water from the MF/UF system will be recycled to the front of the WTP, as it contains mostly solids which can be removed in the Densadeg®. Following MF/UF, the permeate is pumped through two stages of RO to remove nitrate, chloride, and fluoride from the filtered water to comply with the future 2015 effluent licence requirements. The addition of an antiscalent may be required prior to the RO process to minimize membrane fouling/scaling. Reject from the second stage RO will need to be managed. Options for treatment and disposal of RO brine are discussed following the description of the alternative treatment options.
Equalization Tank
Permeate from the RO system will flow by gravity to an equalization tank. Finished water in the equalization tank will be pumped for discharge into Snap Lake, with the option to divert a portion of the flow to the process plant.
Preliminary Equipment List The preliminary equipment list and specifications for the Densadeg® Integrated Reactor/Clarifier/Thickener and chemical feed systems are listed under Alternative No. 1 in Section 7.1.1
The MF/UF system will include:
MF/UF membranes, skid mounted (8 skids)
MF/UF membrane feed pumps (8)
MF/UF permeate tank (1)
Low pressure permeate transfer pumps, skid mounted (2)
Chemical enhanced backwash (CEB) skids, shared with RO system (5)
CEB tank (1 per CEB skid)
CEB pumps (2 per CEB skid)
Controls
The RO system will include:
Two stages of RO membranes, skid-mounted (12 skids)
RO membrane feed pumps (12)
RO permeate tank (1)
Low pressure permeate transfer pumps, skid mounted (2)
Chemical enhanced backwash (CEB) skids, shared with UF system (5)
CEB tank (1 per CEB skid)
CEB pumps (2 per CEB skid)
Controls
7.2.2 Alternative 4: Actiflo® Package Plant Clarifier with Microfiltration/ Ultrafiltration and Reverse Osmosis
The second alternative combines high rate clarification via ballasted flocculation and lamella settling with MF/UF and RO to treat a maximum flow of 25 ML/d. Treatment will consist of metal precipitation, coagulation, flocculation, sedimentation, and pH adjustment, in two parallel trains, prior to the MF/UF and RO systems.

SECTION 7—TREATMENT TRAIN ALTERNATIVES
7-8 425332_WBG073112092156 COPYRIGHT 2012 BY CH2M HILL CANADA LIMITED • ALL RIGHTS RESERVED COMPANY CONFIDENTIAL
Chemical feed systems will be required for metal precipitation, coagulation, flocculation, and pH adjustment. A process schematic of the secondary treatment train is shown in Figure 19.
FIGURE 19 Process Schematic of the Secondary Treatment Train Equipped with Actiflo® Package Plant Clarifier, Microfiltration/Ultrafiltration, and Reverse Osmosis
Hydrated LimePolymer
Ferric Sulphate
Sulphuric AcidPolymer
Process Description Metal Precipitation
The mine water flows through a Metal Precipitation Reactor to precipitate dissolved metals and remove TSS. Hydrated lime is added to the reactor to raise the pH between 9 and 10, so that the majority of metals will precipitate as hydroxides (pH can be optimized for metal removal). Ferric sulphate is added as the coagulant, which will form a ferric hydroxide floc that can adsorb a portion of the dissolved metals by coprecipitation and capture fine solids. Additionally, a large portion of the sludge recycled from the Actiflo® clarifier is sent back to the Metal Precipitation Reactor to act as a seed and aid in precipitation.
Coagulation/Flocculation
Next, the Metal Precipitation Reactor effluent flows into the coagulation chamber of the Actiflo® Package Plant Clarifier where the reaction is completed. In the flocculation chamber of the Actiflo®, an anionic polymer is added is added and microsand to initiate floc formation. Microsand provides a surface area to enhance flocculation and acts as a ballast or weight during sedimentation.
Sedimentation
Ballasted flocs enter the clarification chamber in the Actiflo® and settle rapidly with the aid of lamella settling tubes. Sludge mixed with microsand is collected at the bottom of the clarifier and continuously pumped to a hydrocyclone, where the sand is separated from the sludge. The recovered microsand is recycled back into the flocculation chamber and the light density sludge is split; the majority of the sludge is recycled back into the Metal Precipitation Reactor to act as a seed for precipitation and the remaining sludge is sent to waste. Clarified water exits the Actiflo® and is sent to the filters for further polishing.
pH Adjustment Tank
Clarified water from the Actiflo® flows into the pH Adjustment Tank where the pH is adjusted to between 7 and 7.5 with sulphuric acid.
Microfiltration/Ultrafiltration and Reverse Osmosis
The settled water will require further polishing to remove suspended solids and turbidity prior to the RO membrane. This will be accomplished by an MF/UF system. Reject water from the MF/UF system will be recycled
Mine water
Metal Precipitation Tank
Recirculation
ACTIFLO®
Snap Lake
pH Adjustment Tank
Sludge Recycle
Sludge Waste
Hydrocyclone
2-Stage Reverse Osmosis
Equalization Tank
RO Reject
Microfiltration/ Ultrafiltration
MF/UF Reject Recycle

SECTION 7—TREATMENT TRAIN ALTERNATIVES
425332_WBG073112092156 7-9 COPYRIGHT 2012 BY CH2M HILL CANADA LIMITED • ALL RIGHTS RESERVED COMPANY CONFIDENTIAL
to the front of the WTP, as it contains mostly solids which can be removed in the Densadeg®. Following MF/UF, the permeate is pumped through two stages of RO to remove nitrate, chloride, and fluoride from the filtered water to comply with the future 2015 effluent licence requirements. The addition of an antiscalent may be required prior to the RO process to minimize membrane fouling/scaling. Reject from the second stage RO will need to be managed. Options for treatment and disposal of RO brine are discussed following the description of the alternative treatment options.
Equalization Tank
Permeate from the RO system flows by gravity to an equalization tank. Finished water in the equalization tank will be pumped for discharge into Snap Lake, with the option to divert a portion of the flow to the process plant.
Preliminary Equipment List The preliminary equipment list and specifications for the Actiflo® high rate clarification process and chemical feed systems are listed under Alternative No. 2 in Section 7.1.2
The MF/UF system will include:
MF/UF membranes, skid mounted (8 skids)
MF/UF membrane feed pumps (8)
MF/UF permeate tank (1)
Low pressure permeate transfer pumps, skid mounted (2)
Chemical enhanced backwash (CEB) skids, shared with RO system (5)
CEB tank (1 per CEB skid)
CEB pumps (2 per CEB skid)
Controls
The RO system will include:
Two stages of RO membranes, skid-mounted (12 skids)
RO membrane feed pumps (12)
RO permeate tank (1)
Low pressure permeate transfer pumps, skid mounted (2)
Chemical enhanced backwash (CEB) skids, shared with UF system (5)
CEB tank (1 per CEB skid)
CEB pumps (2 per CEB skid)
Controls
7.2.3 Upgrades to Existing Treatment Train at the Snap Lake Mine WTP In addition to providing MF/UF and RO treatment at the end of the secondary treatment train, the existing treatment train at the Snap Lake Mine WTP will need to be upgraded to include MF/UF and RO treatment to ensure compliance with the 2015 licence requirements for chloride, fluoride, and nitrate. Construction of the secondary treatment train and upgrades to the existing treatment train can be phased to allow for continued operation of the WTP. In the first phase, the existing WTP will continue to treat the mine water while the secondary treatment train is under construction. Following commissioning of the secondary treatment train, the existing treatment train will be shut down for upgrades. The pressure filters in the existing treatment train will not provide sufficient pretreatment for the RO system; hence the pressure filters will be decommissioned and an RO system with MF/UF pretreatment will be installed (similar to the secondary treatment train). Additionally plate/tube settling modules could be added to the existing thickener to increase its capacity. At this point the full WTP will be capable of treating 45 ML/d. A process schematic of the full WTP, following construction and upgrades is shown in Figure 20.

SECTION 7—TREATMENT TRAIN ALTERNATIVES
7-10 425332_WBG073112092156 COPYRIGHT 2012 BY CH2M HILL CANADA LIMITED • ALL RIGHTS RESERVED COMPANY CONFIDENTIAL
FIGURE 20 Process Schematic of Snap Lake Mine WTP Following Expansion and Upgrades to the Existing Treatment Train
PolymerHydrated Lime
Ferric SulphateSulphuric Acid
Reverse Osmosis Mass Balance The finished water concentrations of nitrate, chloride, fluoride, and TDS were calculated for a two-stage RO system assuming 60 percent product recovery for each stage and 90 percent or greater rejection of each contaminant (Table 19). Maximum effluent concentrations from 2011 were used in this analysis, as MF/UF will not remove the dissolved soluble ions. Finished water concentrations of all contaminants are below the 2015 average monthly limits.
TABLE 19 Mass Balance of Contaminants throughout the Reverse Osmosis 2 Stage System
Location/Recovery Flow Rate (ML/d) Nitrate (mg/L) Chloride (mg/L) Fluoride (mg/L) TDS (mg/L)
Influent 45 ML/d 18.11 316
1 0.432
1 937
1
Recovery or Rejection Ratio per Stage (%) 60% 90%2 95% 90% 90%
Permeate – Stage 1 27 ML/d 1.81 15.8 0.043 93.7
Brine Stage - 1 18 ML/d 42.5 766 1.015 2202
Permeate Stage 2 10.8 ML/d 4.3 38.3 0.102 220
Brine Stage 2 7.2 ML/d 100 1858 2.386 5175
Finished Water – Equalization Tanks 37.8 ML/d 2.5 22.2 0.060 130
Overall Recovery (%) 84%3 - - - -
1Maxmimum concentration reported in effluent in 2011
2Assumed 90% rejection of nitrate, however this may be less depending on the membrane selected
380 to 90% overall recovery is anticipated as the concentrate will become supersaturated with BaSO4
- limiting further recovery
7.2.4 Waste Treatment/Disposal Options The RO system will generate a large amount of reject water, highly concentrated with contaminants; hence a treatment/disposal plan is required for this waste. The waste could either be disposed of as a liquid or salt cake. A brine concentrator/crystallizer system could be employed to recover most of the reject water (>99 percent) and
Mine water
Existing Treatment Train
High Rate Clarification Process
Snap Lake
MF/UF Reject Recycle
MF/UF 2-Stage RO Equalization Tanks
RO Reject
RO Reject
MF/UF Reject Recycle

SECTION 7—TREATMENT TRAIN ALTERNATIVES
425332_WBG073112092156 7-11 COPYRIGHT 2012 BY CH2M HILL CANADA LIMITED • ALL RIGHTS RESERVED COMPANY CONFIDENTIAL
produce a salt cake suitable for landfill disposal. Alternatively, the reject water could be disposed through deep well injection.
Brine Concentrator/Crystallizer System Mechanical evaporation involving a brine concentrator followed by a forced-circulation crystallizer can be used to process concentrate and separate salt from the water. Prior to entering the brine concentrator, the reject water may require pre-treatment to limit scaling, including pH adjustment and de-aeration to remove non-condensable gases (for example, oxygen, carbon dioxide, etc.). The reject water is pumped through a heat exchanger to raise its boiling point and then sent to the evaporator sump where it combines with brine slurry. The brine slurry is constantly circulated from the sump to the top of the heat transfer tubes. As the brine flows down the vertical heat transfer tubes back to the sump, some of it evaporates. This vapour passes through a vapour compressor and then flows on the outside of the heat transfer tubes, transferring heat to the cooler brine falling inside the tubes. As the heat is transferred to the brine, some of the vapour condenses into water and is sent to the heat exchanger to warm the incoming reject water. A portion of the brine concentrate is passed onto the forced-circulation crystallizer where it is further concentrated.
Brine concentrate from the mechanical evaporator joins the recirculated concentrate in the crystallizer and is pumped through the forced-circulation heat exchanger. The concentrate is heated above its normal boiling temperature with steam. The heated concentrate then enters the flash evaporation tank, which is operated at a slightly lower pressure and this causes the evaporation of water. As the water evaporates, crystals form in the brine. The vapour passes through a compressor and a heat exchanger, where it condenses as it heats the recirculated concentrate. Condensed water is cooled further as it passes through another heat exchanger and provides heat to the incoming reject water. The treated water (condensed water) can be disposed of or reused as process water; however, it may need further cooling prior to discharge into Snap Lake. A small stream of the recirculated brine is sent to a centrifuge or a belt-filter and dewatered. The liquid portion is returned to the crystallizer for further concentration, while the salt cake is collected for disposal.
A schematic of a brine concentrator in combination with a forced-circulation crystallizer is presented in Figure 21.
FIGURE 21 Schematic of a Brine Concentrator followed by a Crystallizer
12
3
4
5
6
7
89
10
12
11
Salt to Disposal
Brine (reject water)
Condensed Water

SECTION 7—TREATMENT TRAIN ALTERNATIVES
7-12 425332_WBG073112092156 COPYRIGHT 2012 BY CH2M HILL CANADA LIMITED • ALL RIGHTS RESERVED COMPANY CONFIDENTIAL
1
2
3
4
5
6
7
8
SALT TO DISPOSAL
FORCED CIRCULATION HEAT EXCHANGER
BRINE CONCENTRATE
HEATED COMPRESSED VAPOUR
VAPOR COMPRESSOR
VERTICAL HEAT TRANSFER TUBES
EVAPORATOR SUMP
HEAT EXCHANGER
MEMBRANE REJECT
LEGEND
9
10
11
12 CONDENSED WATER
VAPOR COMPRESSOR
FLASH EVAPORATION TANK
Deep-Well Injection
Deep well injection is a technique used to dispose of liquid wastes via injection beneath the lowermost geologic formations (confining zone) to prevent contaminants from migrating into potable water aquifers and surface waters. An injection well will typically extend several thousand feet below the ground level. Brine is injected into the well through injection tubing surrounded by an intermediate casing (inner casing) and a surface casing on the exterior (Figure 22). The space between the injection tubing and intermediate casing, referred to as the annulus, is filled with a pressurized fluid that isolates the casing from the injected wastewater. The pressure inside the annulus can be monitored to detect leaks and verify the integrity of the well.
FIGURE 22 Typical Deep Well injection System
When properly sited and constructed, deep well injection can be a safe means of waste disposal; however, extensive contamination of the ground or surface water can occur if the wastewater migrates towards the surface. A site assessment and aquifer characterization are required to determine the suitability of the site for disposal; the underlying geology of the site is a main factor influencing the decision. The geological formation should be highly impermeable to act as a hydraulically confining barrier. Additionally, extensive assessments must be completed to obtain approval for injection from the regulatory authority.
Ground Surface
Brine
Injection Pressure
Annulus Pressure
Annulus
Surface Casing
Injection Tube
Inner Casing
Packer
Injection Zone
Confining Zone
Impermeable
Annulus
Confining Zone

SECTION 7—TREATMENT TRAIN ALTERNATIVES
425332_WBG073112092156 7-13 COPYRIGHT 2012 BY CH2M HILL CANADA LIMITED • ALL RIGHTS RESERVED COMPANY CONFIDENTIAL
7.3 Preliminary Layouts for Alternative Treatment Options Preliminary layout drawings were prepared for each alternative secondary treatment train, including the RO system for the entire WTP. These layouts are shown in Figures 23 to 26.

SECTION 7—TREATMENT TRAIN ALTERNATIVES
7-14 425332_WBG073112092156 COPYRIGHT 2012 BY CH2M HILL CANADA LIMITED • ALL RIGHTS RESERVED COMPANY CONFIDENTIAL
FIGURE 23 Preliminary Layout for Alternative 1 – Densadeg® Integrated Reactor/Clarifier/Thickener with Continuous Backwash Filters

SECTION 7—TREATMENT TRAIN ALTERNATIVES
425332_WBG073112092156 7-15 COPYRIGHT 2012 BY CH2M HILL CANADA LIMITED • ALL RIGHTS RESERVED COMPANY CONFIDENTIAL
FIGURE 24 Preliminary Layout for Alternative 2 – Actiflo® Package Plant Clarifier with Metal Precipitation and Cloth Media Filtration

SECTION 7—TREATMENT TRAIN ALTERNATIVES
7-16 425332_WBG073112092156 COPYRIGHT 2012 BY CH2M HILL CANADA LIMITED • ALL RIGHTS RESERVED COMPANY CONFIDENTIAL
FIGURE 25 Preliminary Layout for Alternative 3 – Densadeg® Integrated Reactor/Clarifier/Thickener with MF/UF and RO

SECTION 7—TREATMENT TRAIN ALTERNATIVES
425332_WBG073112092156 7-17 COPYRIGHT 2012 BY CH2M HILL CANADA LIMITED • ALL RIGHTS RESERVED COMPANY CONFIDENTIAL
FIGURE 26: Preliminary Layout for Alternative 4 – Actiflo® Package Plant Clarifier with MF/UF and RO

SECTION 7—TREATMENT TRAIN ALTERNATIVES
7-18 425332_WBG073112092156 COPYRIGHT 2012 BY CH2M HILL CANADA LIMITED • ALL RIGHTS RESERVED COMPANY CONFIDENTIAL
7.4 Equipment Costs Four different treatment alternatives were developed for the Snap Lake Mine WTP upgrades/expansion. The first two alternatives were developed to expand capacity to 45 ML/d, while continuing to comply with the current licence requirements (Scenario 1). The second two alternatives were developed to ensure compliance with the more stringent 2015 licence requirements for nitrate, chloride, and fluoride (Scenario 2).
Scenario 1, Alternative 1: Densadeg® Integrated Reactor/Clarifier/Thickener with Continuous Backwash Filters
Scenario 1, Alternative 2: Actiflo® Package Plant Clarifier with Metal Precipitation and Cloth-Media Filtration
Scenario 2, Alternative 3: Densadeg® Integrated Reactor/Clarifier/Thickener with MF/UF and RO
Scenario 2, Alternative 4: Actiflo® Package Plant Clarifier with MF/UF and RO
Table 20 presents the estimated equipment costs for the four treatment train alternatives. In terms of high rate clarification, the equipment costs for the Densadeg® System are approximately half of the costs for the Actiflo® system. In terms of overall equipment costs for Scenario 1, Alternative No. 1 will cost approximately 36 percent less than Alternative No. 2. In Scenario 2, the equipment cost increase significantly by approximately $17 million with the addition of an MF/UF system and a two-stage RO system to treat the future flow of 45 ML/D (existing WTP flow plus expansion). The total equipment costs for Alternative 3 and 4 will be approximately $20 million and $ 22 million, respectively.
TABLE 20 Equipment Costs for Alternative Treatment Train Options for the Snap Lake Mine WTP
Component Scenario 1, Alternative 1:
DensaDeg + Filtration Scenario 1, Alternative 2:
Actiflo + Filtration Scenario 2, Alternative 3: Densadeg + MF/UF + RO
Scenario 2, Alternative 4: Actiflo + MF/UF + RO
High Rate Clarification1
Densadeg® System $2,609,037 - $2,609,037 -
ACTIFLO® System - $4,664,532 - $4,664,532
Polishing Filter/s
Dynasand Filters $723,985 - - -
Disc Filter - $600,000.00 - -
MF/UF + RO System2 - - $17,000,000 $17,000,000
Equalization $120,000 $120,000 $120,000 $120,000
Total Equipment Cost $3,453,000 $5,385,000 $19,730,000 $21,785,000
1 Includes chemical dosing systems and pH adjustment tank
2Total capital costs for MF/UF and RO system to treat 45 ML/d (existing WTP flow plus expansion)
Under Scenario 2, the RO process will generate a large amount of highly concentrated wastewater (~7 ML/d). A brine concentrator/crystallizer system with a centrifuge, capable of producing a salt cake suitable for landfill disposal, would cost approximately $33 million in equipment costs. This would increase the total equipment costs for Alternative 3 and 4 to $ 53 million and $55 million, respectively. The costs associated with the disposal of the RO reject via deep well injection have not been tabulated as this approach is subject to many site-specific factors (i.e. terrain, geology, proximity to WTP, regulatory issues etc.); however, we are confident that the overall costs associated with deep well injection will be substantially less than the costs associated with the brine concentrator/crystallizer system.
A Class 4 Opinion of Cost for Alternative 3, the Densadeg® Integrated Reactor/Clarifier/Thickener with MF/UF and RO, are shown in Table 21.

—TREATMENT TRAIN ALTERNATIVES
425332_WBG073112092156 7-19 COPYRIGHT 2012 BY CH2M HILL CANADA LIMITED • ALL RIGHTS RESERVED COMPANY CONFIDENTIAL
TABLE 21 Class 4 Opinion of Capital Cost for Preferred Treatment Alternative
Cost Category Densadeg + MF/UF + RO (Alternative 3)
Process Mechanical Allowance $ 19,730,000
Mechanical Allowance $ 4,000,000
Electrical Allowance $ 4,000,000
I & C Allowance $ 3,000,000
Structural, Pre-Eng Building Allowance $ 10,000,000
Civil / Site Work Allowance $ 3,000,000
Subtotal $ 43,730,000
Total Opinion of Capital Cost Range (-10% to +50%)
$ 39,357,000 to $ 65,595,000
The opinion of capital cost estimates have been developed to a Class 4 estimate as defined by the American Association of Cost Engineers (AACE). Rough order-of-magnitude cost estimates are generally performed when the design is approximately 1 to 15 percent complete and normally are expected to have an accuracy level between -30 percent and +50 percent. Cost information from major equipment suppliers, published unit costs for labor and commodities, and historical cost information from CH2M HILL’s previous projects have been used to develop the cost estimates. For the above opinion of capital cost, we have reduced the lower accuracy level to -10% as process equipment costs were provided by the vendors, while the remaining costs were developed from historical information.
The opinion of cost does not include the cost to dispose of the RO brine as it depends on the selected / approved disposal option (concentrator/crystallizer versus deep well injection). Consultation with the regulatory authorities is recommended to determine if deep well injection is a viable option.


425332_WBG073112092156 8-1 COPYRIGHT 2012 BY CH2M HILL CANADA LIMITED • ALL RIGHTS RESERVED COMPANY CONFIDENTIAL
SECTION 8
Conclusions and Recommendations Alternative treatment technologies were identified, reviewed, and compared to allow for the expansion of the Snap Lake Mine WTP to a capacity of 45 ML/d, while ensuring compliance with the current/future licence requirements for TSS, metals, nitrate, chloride and fluoride.
To continue to meet the current licence limits for TSS and heavy metals, while increasing mining production, it is recommended that De Beers proceed with the design and construction of a secondary treatment train which incorporates a high-rate clarification process. In terms of equipment costs, the Densadeg® Integrated Reactor/Clarifier/Thickener was found to be more economical than the Actiflo® Package Plant Clarifier. Although the current licence limits for all regulated metals are anticipated to be attainable with the inclusion of high rate clarification and filtration in the secondary treatment train, provisions for lime addition could be added to ensure continued compliance if metal limits are reduced in the future.
To comply with the 2015 licence limits for nitrate, chloride and fluoride, it is recommended that De Beers incorporate advanced treatment processes to treat both the mine and WMP waters. The WMP water should be treated in full, as it typically contains greater concentrations of nitrate, chloride and fluoride compared to the mine water. While partial treatment to remove approximately 50 percent (or greater depending on recovery of the treatment process) of nitrate and chloride from the mine water may be sufficient to meet the 2015 limits, at least 65 percent of the mine water (possibly more depending on recovery of the treatment process) will need to be treated to ensure that fluoride levels do not exceed the 2015 limits.
As a worst case scenario, RO was selected over other potential treatment options in the absence of bench/pilot-scale testing to ensure compliance with the 2015 effluent licence requirements for fluoride, chloride, and nitrate. The RO process will require pretreatment with conventional or high-rate clarification and MF/UF to remove suspended solids, turbidity, and other potential membrane foulants. The equipment costs associated with an MF/UF and RO treatment system, capable of treating 45 ML/D will be approximately $ 17 million; this is in addition to the cost of adding a secondary treatment train with high-rate clarification (~ $ 3 million). Additionally, concentrate from the RO system containing high levels of dissolved ions and nutrients will require a proper treatment/disposal strategy. This will increase the costs for the RO alternatives significantly, as a brine concentrator/crystallizer system to treat 7 ML/d of concentrate would total approximately $33 million in
equipment costs alone. If permitted, deep well injection is expected to be a much more cost effective disposal option; however, it may still be in the order of several million dollars in capital costs.
Due to the significant costs associated with RO treatment and brine treatment/disposal, we recommend that bench/pilot-scale studies be carried out to investigate the feasibility of nitrate, chloride, and fluoride removal from the Snap Lake Mine WTP effluent through a multi-stage IX/adsorption treatment, including contaminant specific resins for nitrate and chloride and activated alumina for fluoride removal. Bench-scale testing can be conducted to evaluate the adsorption capacity of each resin, determine the efficiency of removal for each contaminant, examine the effects of competitive exchange (e.g. chloride, sulfate, etc.) and high TDS, and monitor the fouling potential of TSS and metals/minerals. Additionally, this will allow for the identification of operating parameters such as run-length, service flow rate, backwash flow rate, and the dose and concentration of regenerant required. Pilot-scale studies would be required to monitor resin stability under cyclic operation over longer-periods of time.
We also recommend further investigation into the source/s of fluoride that is entering the mine water during production. Removing fluoride to comply with the 2015 licence requirements complicates treatment by requiring additional fluoride-specific treatment technologies or by increasing the scale-of-treatment required for technologies such as RO that can be used to remove multiple dissolved ions. If fluoride can be prevented from entering the mine water, this will reduce the overall costs associated with treatment.


425332_WBG073112092156 9-1 COPYRIGHT 2012 BY CH2M HILL CANADA LIMITED • ALL RIGHTS RESERVED COMPANY CONFIDENTIAL
SECTION 9
References Camp, Dresser & McKee. 2009. City of Springfield, Ohio Comprehensive Facility Plan Technical Memorandum No. 3.
Feenstra, L., Vasak, L., and Griffioen, J. 2007. Fluoride in groundwater: Overview and evaluation of removal methods. Report nr. SP 2007-1. International Groundwater Resources Assessment Centre. TA Utrecht, The Netherlands.
Health Canada. 2010. Guidelines for Canadian Drinking Water Quality: Guideline Technical Document – Fluoride. Water, Air and Climate Change Bureau, Healthy Environments and Consumer Safety Branch, Health Canada, Ottawa, Ontario.
Pickard. 2004. Feasibility of Water Treatment Technologies for Arsenic and Fluoride Removal from Groundwater. AWWA Water Quality Technology Conference. November 17, 2004.
US EPA. 2012. Drinking Water Treatability Database: Fluoride. United States Environmental Protection Agency website. Accessed on May 8, 2012. Available at: http://iaspub.epa.gov/tdb/pages/contaminant/contaminantOverview.do;jsessionid=ef5001e6816a3e7a0a3b134ec5af70928a29235ffc89b04b364da0b1bf0c0dd5?contaminantId=10700