snapper point power station project - sa planning portal
TRANSCRIPT

PORT ADELAIDE ENERGY PTY LTD
SNAPPER POINT POWER STATION PROJECT AIR QUALITY IMPACT ASSESSMENT
NOVEMBER 2019

ABBREVIATIONS ............................................................................ V
EXECUTIVE SUMMARY ............................................................... VII
1 INTRODUCTION ................................................................... 1
1.1 PROJECT DESCRIPTION .......................................................... 1
1.2 PROJECT AREA ........................................................................ 1
1.3 PURPOSE OF ASSESSMENT ................................................... 4
1.4 SCOPE OF WORKS ................................................................... 4
1.5 POLLUTANTS OF INTEREST .................................................... 5
2 LEGISLATIVE CONTEXT .................................................... 6
2.1 COMMONWEALTH LEGISLATION ........................................... 6
2.2 SOUTH AUSTRALIAN LEGISLATION ...................................... 7
3 EXISTING ENVIRONMENT ............................................... 10
3.1 LOCAL SETTING ...................................................................... 10
3.2 SENSITIVE RECEPTORS ........................................................ 10
3.3 TOPOGRAPHY ......................................................................... 12
3.4 LOCAL METEOROLOGY ......................................................... 13
3.5 LOCAL AIR QUALITY .............................................................. 18
4 ASSESSMENT METHODOLOGY .................................... 30
4.1 CONSTRUCTION PHASE ASSESSMENT .............................. 30
4.2 OPERATION PHASE ASSESSMENT ...................................... 30
5 AIR QUALITY ASSESSMENT .......................................... 39
5.1 CONSTRUCTION PHASE ........................................................ 39
5.2 OPERATION PHASE ................................................................ 39
6 MANAGEMENT MEASURES ........................................... 53
6.1 CONSTRUCTION ...................................................................... 53
6.2 OPERATION ............................................................................. 54
TABLE OF CONTENTS

CONTENTS (Continued)
7 CONCLUSION ..................................................................... 55
8 LIMITATIONS ...................................................................... 56
BIBLIOGRAPHY .............................................................................. 57
LIST OF TABLES TABLE 2.1 AIR NEPM STANDARDS .............................................................. 6 TABLE 2.2 PROPOSED NEW NO2 AND SO2 NEPM STANDARDS .............. 7 TABLE 2.3 MAXIMUM GROUND LEVEL CONCENTRATIONS ...................... 8 TABLE 2.4 MAXIMUM POLLUTANT LEVELS FOR STACK
EMISSIONS .................................................................................. 8 TABLE 2.5 PROJECT ASSESSMENT CRITERIA ........................................... 9 TABLE 3.1 LONG TERM WEATHER DATA AT PARAFIELD
AIRPORT AWS ........................................................................... 15 TABLE 3.2 CLIMATE STATISTICS FOR EDINBURGH RAAF AWS1 ........... 17 TABLE 3.3 1-HOUR AVERAGE NO2 CONCENTRATIONS AT LE
FEVRE 2 AAQMS FOR 2014 TO 2018 ....................................... 21 TABLE 3.4 1-HOUR AVERAGE SO2 CONCENTRATIONS AT LE
FEVRE 2 AAQMS FOR 2014 TO 2018 ....................................... 23 TABLE 3.5 24-HOUR AVERAGE SO2 CONCENTRATIONS AT LE
FEVRE 2 AAQMS FOR 2014 TO 2018 ....................................... 23 TABLE 3.6 24-HOUR AVERAGE PM10 CONCENTRATIONS AT LE
FEVRE 2 AAQMS FOR 2014 TO 2018 ....................................... 25 TABLE 3.7 24-HOUR PM10 EXCEEDANCES AT LE FEVRE 2
AAQMS FOR 2014 TO 2018 ....................................................... 25 TABLE 3.8 24-HOUR AVERAGE PM2.5 CONCENTRATIONS AT LE
FEVRE 2 AAQMS FOR 2014 TO 2018 ....................................... 27 TABLE 3.9 1-HOUR AVERAGE CO CONCENTRATIONS AT
ADELAIDE CBD AAQMS FOR 2014 TO 2018 ............................ 28 TABLE 3.10 8-HOUR AVERAGE CO CONCENTRATIONS AT
ADELAIDE CBD AAQMS FOR 2014 TO 2018 ............................ 28 TABLE 3.11 BACKGROUND CONCENTRATIONS USED IN THE
AIR QUALITY IMPACT ASSESSMENT ...................................... 29 TABLE 4.1 INDEX OF KEY DATA AND RESOURCES FOR THE
AIR QUALITY TECHNICAL STUDY ............................................ 30 TABLE 4.2 MODELLED SOURCE EMISSION PARAMETERS .................... 33 TABLE 4.3 MODEL OUTPUT PARAMETERS TO FACILITATE
RESULTS ANALYSIS ................................................................. 37
LIST OF TABLES (CONTINUED) TABLE 5.1 SUMMARY OF PREDICTED 1-HOUR NO2
CONCENTRATIONS AT ALL MODELLED DISCRETE SENSITIVE RECEPTORS .......................................................... 40
TABLE 5.2 SUMMARY OF PREDICTED ANNUAL MEAN NO2 CONCENTRATIONS AT RELEVANT MODELLED DISCRETE RECEPTORS ........................................................... 42
TABLE 5.3 SUMMARY OF PREDICTED 1-HOUR CO MAXIMUM CONCENTRATIONS AT ALL MODELLED DISCRETE SENSITIVE RECEPTORS .......................................................... 43
TABLE 5.4 SUMMARY OF PREDICTED 8-HOUR CO MAXIMUM CONCENTRATIONS AT ALL MODELLED DISCRETE SENSITIVE RECEPTORS .......................................................... 44
TABLE 5.5 SUMMARY OF PREDICTED 1-HOUR SO2 MAXIMUM CONCENTRATIONS AT ALL MODELLED DISCRETE SENSITIVE RECEPTORS .......................................................... 45
TABLE 5.6 SUMMARY OF PREDICTED 24-HOUR SO2 MAXIMUM CONCENTRATIONS AT RELEVANT MODELLED SENSITIVE RECEPTORS .......................................................... 46
TABLE 5.7 SUMMARY OF PREDICTED ANNUAL MEAN SO2 CONCENTRATIONS AT RELEVANT MODELLED SENSITIVE RECEPTORS .......................................................... 47
TABLE 5.8 SUMMARY OF PREDICTED 24-HOUR PM10 MAXIMUM CONCENTRATIONS AT RELEVANT MODELLED SENSITIVE RECEPTORS .......................................................... 48
TABLE 5.9 SUMMARY OF PREDICTED ANNUAL MEAN PM10 CONCENTRATIONS AT RELEVANT MODELLED SENSITIVE RECEPTORS .......................................................... 49
TABLE 5.10 SUMMARY OF PREDICTED 24-HOUR PM2.5 MAXIMUM CONCENTRATIONS AT RELEVANT MODELLED SENSITIVE RECEPTORS ...................................... 50
TABLE 5.11 SUMMARY OF PREDICTED ANNUAL MEAN PM2.5 CONCENTRATIONS AT RELEVANT MODELLED SENSITIVE RECEPTORS .......................................................... 51
TABLE 5.12 IN-STACK MAXIMUM POLLUTANT LEVELS ............................. 52 TABLE 6.1 PROPOSED MANAGEMENT MEASURES ................................ 53
LIST OF FIGURES FIGURE 1.1 LOCATION OF THE SNAPPER POINT POWER
STATION PROJECT ..................................................................... 2 FIGURE 1.2 LOCATION OF PELICAN POINT POWER STATION
(BOUNDARY IN YELLOW) ADJACENT TO SNAPPER POINT POWER STATION ............................................................ 3
LIST OF FIGURES FIGURE 3.1 LOCATION OF MODELLED SENSITIVE RECEPTORS
(BLUE) AND STACK EMISSION SOURCES (RED) ................... 11 FIGURE 3.2 TERRAIN ELEVATIONS INCLUDED WITHIN
ATMOSPHERIC DISPERSION MODELLING ............................. 12 FIGURE 3.3 9 AM AND 3 PM WIND ROSES AT PARAFIELD
AIRPORT AWS ........................................................................... 14 FIGURE 3.4 9 AM AND 3 PM WIND ROSES AT EDINBURGH RAAF
AWS ............................................................................................ 16 FIGURE 3.5 LOCATION OF LE FEVRE 2 AND ADELAIDE CBD
AAQMS ....................................................................................... 19 FIGURE 3.6 1-HOUR AVERAGE NO2 CONCENTRATIONS AT LE
FEVRE 2 AAQMS FOR 2014 TO 2018 ....................................... 20 FIGURE 3.7 ANNUAL AVERAGE NO2 CONCENTRATIONS AT LE
FEVRE 2 AAQMS FOR 2014 TO 2018 ....................................... 21 FIGURE 3.8 1-HOUR AVERAGE SO2 CONCENTRATIONS AT LE
FEVRE 2 AAQMS FOR 2014 TO 2018 ....................................... 22 FIGURE 3.9 ANNUAL AVERAGE SO2 CONCENTRATIONS AT LE
FEVRE 2 AAQMS FOR 2014 TO 2018 ....................................... 22 FIGURE 3.10 24-HOUR AVERAGE PM10 CONCENTRATIONS AT LE
FEVRE 2 AAQMS FOR 2014 TO 2018 ....................................... 24 FIGURE 3.11 ANNUAL AVERAGE PM10 CONCENTRATIONS AT LE
FEVRE 2 AAQMS FOR 2014 TO 2018 ....................................... 24 FIGURE 3.12 24-HOUR AVERAGE PM2.5 CONCENTRATIONS AT LE
FEVRE 2 AAQMS FOR 2014 TO 2018 ....................................... 26 FIGURE 3.13 ANNUAL AVERAGE PM2.5 CONCENTRATIONS AT LE
FEVRE 2 AAQMS FOR 2014 TO 2018 ....................................... 26 FIGURE 3.14 1-HOUR AVERAGE CO CONCENTRATION AT
ADELAIDE CBD AAQMS FOR 2014 TO 2018 ............................ 27 FIGURE 3.15 8-HOUR ROLLING AVERAGE CO CONCENTRATION
AT ADELAIDE CBD AAQMS FOR 2014 TO 2018 ...................... 28 FIGURE 4.1 ANNUAL AND SEASONAL WIND ROSES BASED ON
CALMET MODELLING FOR 2009 AT PROJECT SITE .............. 32 FIGURE 4.2 MODELLED STACK LOCATIONS (RED) AND
BUILDINGS (BLUE) INCLUDED WITHIN CALPUFF DISPERSION MODEL SET-UP................................................... 35
FIGURE 4.3 MODELLED EXTENT OF UNIFORM CARTESIAN RECEPTOR GRID ....................................................................... 36
LIST OF APPENDICES APPENDIX A CONTOUR PLOTS

Project No PS114349 Snapper Point Power Station Project Air Quality Impact Assessment Port Adelaide Energy Pty Ltd
WSP November 2019
Page v
ABBREVIATIONS AAQMS Ambient air quality monitoring station
AAQA guidelines Ambient Air Quality Assessment Guidelines
agl Above ground level
Air EPP Environment Protection (Air Quality) Policy
Air NEPM National Environment Protection (Ambient Air Quality) Measure
AQMP Air quality management plan
AWS Automatic weather station
BoM Bureau of Meteorology
CBD Central business district
CEMP Construction environment management plan
CO Carbon monoxide
DA Development Application
EP Act Environment Protection Act 1993
EPA Environment Protection Authority
EPAV Environment Protection Authority of Victoria
GLCs Ground level concentration
GLCC Global Land Cover Characterisation
HCVs Heavy commercial vehicles
LGA Local government area
MW Megawatt
NEM National Electricity Market
NEPC National Environment Protection Council
NEPM National Environment Protection Measure
NOx Oxides of Nitrogen
NO2 Nitrogen dioxide
NO Nitrogen monoxide
PAHs Polycyclic aromatic hydrocarbons
PDI Act Planning, Development and Infrastructure Act 2016
PM Particulate Matter
PM10 Particulate Matter less than 10 microns in aerodynamic diameter

Project No PS114349 Snapper Point Power Station Project Air Quality Impact Assessment Port Adelaide Energy Pty Ltd
WSP November 2019
Page vi
PM2.5 Particulate Matter less than 2.5 microns in aerodynamic diameter
RH Relative humidity
RAAF Royal Australian Air Force
SA South Australia
SA EPA South Australia Environment Protection Authority
SO2 Sulphur dioxide
SRTM Shuttle radar topography mission
SVOCs Semi-volatile organic compounds
TEOM Tapered element oscillating metre
TSP Total suspended particulates
VOCs Volatile organic compounds
WRF World Research and Forecasting
WSP WSP Australia Proprietary Limited
Units
°C Degree celsius
ppm Parts per million
m metres
mg/m3 Milligrams per cubic metre
MJ/m2 Megajoule per squared metre
mm millimetres
m/s Metres per second
km kilometres
kV kilovolt
ng/m3 Nanograms per cubic metre
µg/m3 Micrograms per cubic metre
% Per cent

Project No PS114349 Snapper Point Power Station Project Air Quality Impact Assessment Port Adelaide Energy Pty Ltd
WSP November 2019
Page vii
EXECUTIVE SUMMARY WSP Australia Pty Ltd (WSP) was engaged by Port Adelaide Energy Pty Ltd (Nexif Energy) to conduct an air quality assessment (AQA) for the proposed development of a peaking power station (Snapper Point Power Station) at Outer Harbor, South Australia (SA).
Nexif Energy, propose to develop the Snapper Point Power Station (the Project) in support of a Development Application (DA). The Project will involve the de-commissioning, relocation and re-commissioning of five (5) trailer-mounted GE TM2500 Gen 8 aero-derivative turbine generators and ancillary infrastructure from an existing site at Elizabeth SA to a proposed new site adjacent to the Pelican Point Power Station. The turbines will be converted to operate primarily on natural gas, with diesel as a secondary fuel source.
The objective of this AQA is to support a Development Application (DA) for the Project under Schedule 1 Part A of the Environment Protection Act 1993 (EPA Act) for the operation of 5 turbines and associated balance of plant using:
— natural gas only — diesel only and — a combination of natural gas and diesel fuel.
Key air emissions expected to be emitted from the turbines operating on natural gas and diesel were identified. These included:
— Oxides of nitrogen (NOx) — Carbon monoxide (CO) — Sulphur dioxide (SO2) [diesel fuel only) — Particulate matter with an aerodynamic diameter of less than 10 microns (PM10) [diesel fuel only] — Particulate matter with an aerodynamic diameter of less than 2.5 microns (PM2.5) [diesel fuel only].
Maximum concentration criteria for each pollutant as prescribed in the Environment Protection (Air Quality) Policy 2016 were used as assessment criteria for the Project.
The receiving environment in the vicinity of the Project area was characterised using publicly available information. Ambient air quality data collected by the South Australian Environment Protection Authority (SA EPA) at the Le Fevre 2 ambient air quality monitoring station (AAQMS) [NO2, SO2, PM10 and PM2.5] and Adelaide Central Business District (CBD) AAQMS (CO) was used as background data for this assessment for the years 2014 to 2018.
Potential air quality impacts during construction of the Project were addressed qualitatively. Management measures were proposed to control air emissions and ensure impacts on the receiving environment are minimised.
Air dispersion modelling was conducted for the operation phase, based on three operational scenarios defined by the fuel source type to each proposed turbine as outlined above, using the CALPUFF model. The modelling incorporated a series of conservative assumptions, with the emissions and operating parameters representing worst case release conditions.
In each scenario, air emissions from the adjacent Pelican Point Power Station were included in the dispersion model along with appropriately adopted background concentrations, thereby providing a cumulative assessment of local emissions associated with both energy plants under a worst case scenario.
The modelling study has identified the potential for exceedances of the 1-hour NO2 assessment criterion at identified sensitive receptors, particularly where the proposed turbine generators are fuelled solely by diesel or a combination of natural gas and diesel. Further, the predicted exceedances occurred primarily within the winter months, specifically June to September of the year, when energy demand is not expected to be as high relative to the summer months and therefore the generating units are least likely to operate. It should also be noted that the primary fuel source for all proposed turbine generators will be natural gas, with diesel being an emergency back-up fuel in case of disruption of gas supply to the Project. Consequently, these modelled exceedances are considered to be of minor significance on the receiving environment.

Project No PS114349 Snapper Point Power Station Project Air Quality Impact Assessment Port Adelaide Energy Pty Ltd
WSP November 2019
Page viii
The key aim of the Project is to supplement the grid during periods of high energy demand, the proposed Snapper Point Power Station will not operate continuously at 100% load. For commercial reasons, the Project will only operate between 5% to 10% of the year, during periods of high energy demand and low natural gas supply. Additionally, natural gas will be the predominant fuel source during periods of operation with diesel only being used as an emergency back-up fuel.
Consequently, the potential for exceedances of the 1-hour NO2 standard at all identified sensitive receptors is expected to be substantially reduced relative to the modelled worst case.
To further manage and minimise the potential for ground level 1-hour NO2 exceedances, the proposed turbine generators should be operated and managed in an efficient manner with respect to monitoring the required operational load arrangement (i.e. the required load of each turbine or number of turbines in operation) during periods of high energy demand if operating on diesel fuel during the winter months of June to September.
For all other pollutants and averaging periods assessed, predicted concentrations at all receptor locations are below the relevant Project assessment criteria.
Based on the outcomes of this air quality assessment, and accounting for the conservative assumptions and recommended operational management measures, the Project Site is considered suitable for the operation of the proposed Snapper Point Power Station.
Project No PS114349 Snapper Point Power Station Project Air Quality Impact Assessment Port Adelaide Energy Pty Ltd
WSP November 2019
Page 1
1 INTRODUCTION WSP Australia Pty Ltd (WSP) was engaged by Nexif Energy Australia Pty Ltd (Nexif Energy) to conduct an air quality assessment (AQA) for the proposed development of a peaking power station (Snapper Point Power Station) at Outer Harbor, South Australia (SA).
1.1 PROJECT DESCRIPTION Port Adelaide Energy Pty Ltd (P A Energy P/L), an affiliate of Nexif Energy, propose to develop the Snapper Point Power Station (the Project) in support of a Development Application (DA). The Project will involve the de-commissioning, relocation and re-commissioning of five (5) trailer-mounted GE TM2500 Gen 8 aero-derivative turbine generators and ancillary infrastructure from an existing site at Elizabeth SA to a proposed new site adjacent to the Pelican Point Power Station at Outer Harbor. The diesel turbines are currently operated by the South Australian Government (SA Government) for emergency electricity generation, as part of South Australia’s emergency back-up power provision. The Project has been developed in response to state-wide blackouts in 2017.
P A Energy P/L, plan to lease the turbines from the SA Government and operate them on a commercial basis to supplement the energy grid at high demand times, and reduce the risk of load shedding.
The turbines will be converted to operate primarily on natural gas, with diesel as a secondary fuel source. The turbines are rated to produce 30.8 megawatt (MW) and together the turbines are expected to produce approximately 154 MW of energy.
It is proposed that the Project will connect into the nearby Pelican Point Power Station fuel gas yard (owned by Epic Energy) and Pelican Point Power Station switchyard (owned by ElectraNet).
The Project is a prescribed activity of environmental significance under Schedule 1 Part A of the Environment Protection Act 1993 (EPA Act); which is fuel burning at a heat release rate exceeding 5 MW. As such, an environmental licence will be required for operation.
Figure 1.1 shows the location of the Project.
1.2 PROJECT AREA The Project site (the Site) will be located adjacent to the Pelican Point Power Station at Outer Harbor, approximately 20 kilometres (km) north of Adelaide. The land is owned by Renewal SA, and will be leased by Nexif Energy for this Project. The Site is situated between the coastal waters of the Port Adelaide River and the Pelican Point Power Station, and is located within the City of Port Adelaide Enfield under the Industry Zone.
Connecting infrastructure, including a gas pipe line and 275 kV overhead cable, will connect the Project to an existing substation and gas yard located at the Pelican Point Power Station to the south of the Site.
The location of the Snapper Point Power Station in relation to the Pelican Point Power Station is illustrated in Figure 1.2.
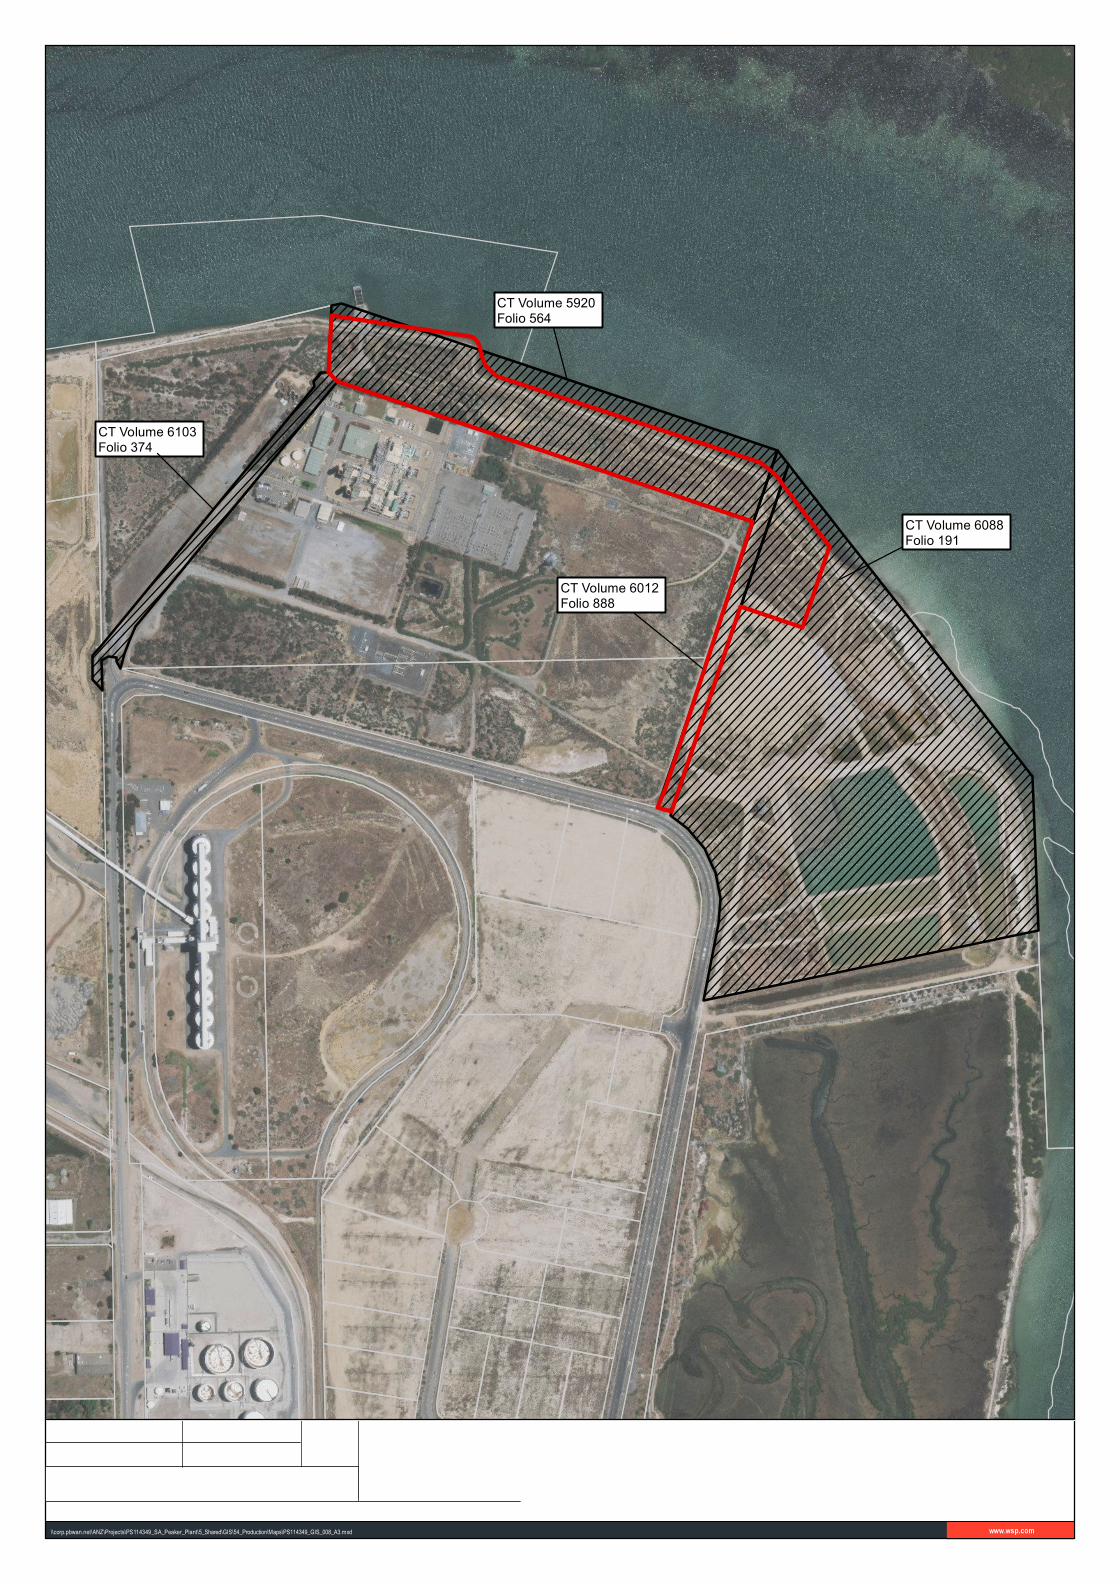
\\corp.pbwan.net\ANZ\Projects\PS114349_SA_Peaker_Plant\5_Shared\GIS\54_Production\Maps\PS114349_GIS_008_A3.mxd www.wsp.com
CT Volume 6103 Folio 374
CT Volume 5920 Folio 564
CT Volume 6012 Folio 888
CT Volume 6088 Folio 191
LegendCertificates of titleCadastreSite Boundary
° 1:5,000
0 60 120m
Coordinate system: GDA 1994 MGA Zone 54
Snapper Point Gas Turbine Peaker ProjectFigure 1.1
Location of the Snapper Point Power Station ProjectScale ratio correct when printed at A3
NEXIF
Approved by:
Author: MOMap: PS114349_GIS_008_A3
Date: 30/09/2019Data source: Source: Esri, DigitalGlobe, GeoEye, Earthstar Geographics, CNES/Airbus DS, USDA, USGS,AeroGRID, IGN, and the GIS User Community
© WSP Australia Pty Ltd ("WSP") Copyright in the drawings, information and data recorded ("the information") is the property of WSP. This document and the information are solely for the use of the authorised recipient and this document may not be used, copied orreproduced in whole or part for any purpose other than that which it was supplied by WSP. WSP makes no representation, undertakes no duty and accepts no responsibility to any third party who may use or rely upon this document or the information. NCSI CertifiedQuality System to ISO 9001. © APPROVED FOR AND ON BEHALF OF WSP Australia Pty Ltd.

www.wsp.com\\corp.pbwan.net\ANZ\Projects\PS114349_SA_Peaker_Plant\5_Shared\GIS\54_Production\Maps\PS114349_GIS_001_A6.mxd
© WSP Australia Pty Ltd ("WSP") Copyright in the drawings, information and data recorded ("the information") is the property of WSP. This document and the information are solely for the use of the authorised recipient and this documentmay not be used, copied or reproduced in whole or part for any purpose other than that which it was supplied by WSP. WSP makes no representation, undertakes no duty and accepts no responsibility to any third party who may use or relyupon this document or the information. NCSI Certified Quality System to ISO 9001. © APPROVED FOR AND ON BEHALF OF WSP Australia Pty Ltd.
ELECTRANET SUBSTATION
PELICAN POINT POWER LTD.
(5) GAS TURBINE, 66kV, 50HzSEE DETAIL DWG. P0007-05-GGA-00-002
FUTURE AREASEE DETAIL DWG. P0007-05-GGA-00-002
STORM WATER PONDSEE DETAIL DWG.P0007-05-GGA-00-002 CONSTRUCTION
LAYDOWN
Coordinate system: GDA 1994 MGA Zone 541:3,107
0 40 80m°Approved by: Date: 10/10/2019
Map: PS114349_GIS_001_A6 Author: MO
Scale ratio correct when printed at A3
Pelican Point Gas Turbine Peaker ProjectFigure 1.2
Location of Pelican Point Power Station (boundary in yellow) adjacent to Snapper Point Power Station
NEXIF
Data source: -Source: Esri, DigitalGlobe, GeoEye, Earthstar Geographics, CNES/Airbus DS, USDA, USGS, AeroGRID, IGN, and the GIS User Community

Project No PS114349 Snapper Point Power Station Project Air Quality Impact Assessment Port Adelaide Energy Pty Ltd
WSP November 2019
Page 4
1.3 PURPOSE OF ASSESSMENT The purpose of this air quality assessment (AQA) is to support a Development Application (DA) for the Project under Schedule 1 Part A of the Environment Protection Act 1993 (EPA Act) for the operation of 5 turbines using:
— natural gas only — diesel only and — a combination of natural gas and diesel fuel.
Given its proximity to the Project site, air emissions from the adjacent Pelican Point Power Station are included as sources in the dispersion model for all model scenarios.
Predicted pollutant ground level concentrations are compared against relevant legislative criteria for all model scenarios to determine compliance, or the need for mitigation through design.
1.4 SCOPE OF WORKS Following discussions with the South Australian Environment Protection Authority (SA EPA), the scope of works for the Project was agreed as follows:
— review available information for the Project and request additional information from Nexif Energy if required — determine the key pollutants likely to be emitted during the operation of the turbines operating on natural gas and
diesel fuel — review relevant legislation, policies and standards for the Project and establish appropriate criteria — characterise the existing ambient air quality and meteorological conditions for the Project, using publicly available
information — identify the nearest sensitive receptors to the Project site — determine the scenarios to be modelled (up to 3 in total) — determine the model outputs for each model scenario — seek agreement with Nexif Energy and SA EPA of all model inputs for both the Snapper Point Power Station and the
Pelican Point Power Station — generate a meteorological file for one year (2009) using prognostic data (WRF) and CALMET — predict ground level concentrations (GLCs) of key pollutants modelled for each scenario using CALPUFF — compare model outputs to the applicable assessment criteria — determine cumulative impacts of key pollutants using appropriate background concentrations — prepare contour plots illustrating the extent of pollutant dispersal — prepare an AQA report in support of a Development Application for the Project.

Project No PS114349 Snapper Point Power Station Project Air Quality Impact Assessment Port Adelaide Energy Pty Ltd
WSP November 2019
Page 5
1.5 POLLUTANTS OF INTEREST The main pollutants of interest for the Project are as follows.
For the turbines operating on natural gas:
— oxides of nitrogen (NOx comprising of primarily nitrogen dioxide [NO2] and nitrogen monoxide [NO]) — carbon monoxide (CO).
For the turbines operating on diesel:
— NOx — CO — Sulphur dioxide (SO2) — Particulate matter with an aerodynamic diameter of less than 10 microns (PM10) — Particulate matter with an aerodynamic diameter of less than 2.5 microns (PM2.5).
For the existing Pelican Point Power Station, which operates on natural gas, the pollutants of interest are:
— NOx — CO.

Project No PS114349 Snapper Point Power Station Project Air Quality Impact Assessment Port Adelaide Energy Pty Ltd
WSP November 2019
Page 6
2 LEGISLATIVE CONTEXT
2.1 COMMONWEALTH LEGISLATION The National Environment Protection Council (NEPC) was established under the National Environment Protection Council Act 1994 with the main function of:
— developing National Environment Protection Measures (NEPMs) — assessing and reporting on the implementation and effectiveness of the NEPMs in each State and Territory.
The NEPM relevant to air quality for this Project is:
— National Environment Protection (Ambient Air Quality) Measure (Air NEPM).
The Air NEPM outlines standards and goals for key pollutants that are required to be achieved nationwide, with due regard to population exposure. The national environment protection standards of this measure are outlined in Table 2.1.
It is noted that these standards are not relevant to air emissions from individual sources, specific industries or roadside locations. Air NEPM standards are intended to be applied at performance monitoring locations that represent air quality for a region or sub-region of 25,000 people or more. These performance monitoring stations are operated by the relevant environmental regulatory authority in each State and Territory.
Table 2.1 Air NEPM standards
POLLUTANT AVERAGING PERIOD AIR QUALITY STANDARD1,2
MAXIMUM ALLOWABLE EXCEEDANCE
PM10 1 day
Annual
50 µg/m3
25 µg/m3
None
None
PM2.5 1 day
Annual
25 µg/m3
20 µg/m3 (from 2025)
8 µg/m3
7 µg/m3(from 2025)
None
None
NO2 1-hour
Annual
0.12 ppm
0.03 ppm
1 day a year
None
CO 8-hours 9.0 ppm 1 day a year
SO2 1-hour
24-hours
Annual
0.20 ppm
0.08 ppm
0.02 ppm
1 day a year
1 day a year
None
(1) Defined as a standard that consists of quantifiable characteristics of the environment against which environmental quality can be assessed
(2) 100th percentile
Project No PS114349 Snapper Point Power Station Project Air Quality Impact Assessment Port Adelaide Energy Pty Ltd
WSP November 2019
Page 7
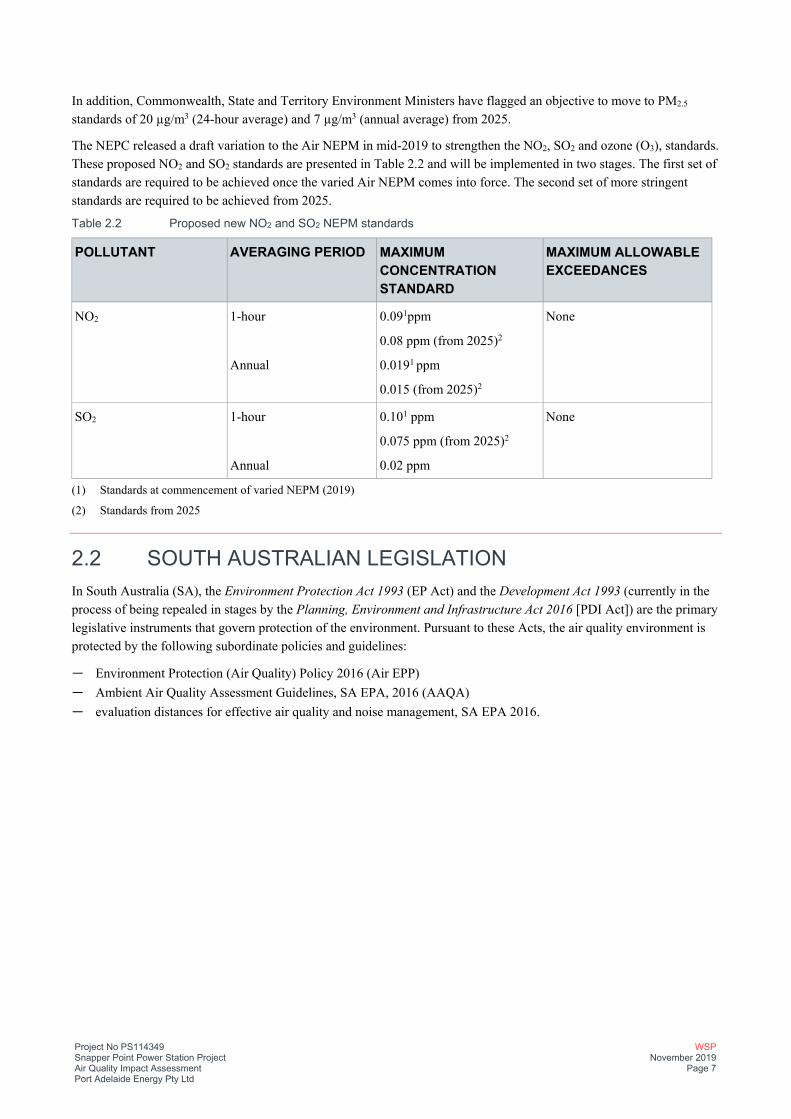
In addition, Commonwealth, State and Territory Environment Ministers have flagged an objective to move to PM2.5
standards of 20 µg/m3 (24-hour average) and 7 µg/m3 (annual average) from 2025.
The NEPC released a draft variation to the Air NEPM in mid-2019 to strengthen the NO2, SO2 and ozone (O3), standards. These proposed NO2 and SO2 standards are presented in Table 2.2 and will be implemented in two stages. The first set of standards are required to be achieved once the varied Air NEPM comes into force. The second set of more stringent standards are required to be achieved from 2025.
Table 2.2 Proposed new NO2 and SO2 NEPM standards
POLLUTANT AVERAGING PERIOD MAXIMUM CONCENTRATION STANDARD
MAXIMUM ALLOWABLE EXCEEDANCES
NO2 1-hour
Annual
0.091ppm
0.08 ppm (from 2025)2
0.0191 ppm
0.015 (from 2025)2
None
SO2 1-hour
Annual
0.101 ppm
0.075 ppm (from 2025)2
0.02 ppm
None
(1) Standards at commencement of varied NEPM (2019)
(2) Standards from 2025
2.2 SOUTH AUSTRALIAN LEGISLATION In South Australia (SA), the Environment Protection Act 1993 (EP Act) and the Development Act 1993 (currently in the process of being repealed in stages by the Planning, Environment and Infrastructure Act 2016 [PDI Act]) are the primary legislative instruments that govern protection of the environment. Pursuant to these Acts, the air quality environment is protected by the following subordinate policies and guidelines:
— Environment Protection (Air Quality) Policy 2016 (Air EPP) — Ambient Air Quality Assessment Guidelines, SA EPA, 2016 (AAQA) — evaluation distances for effective air quality and noise management, SA EPA 2016.

Project No PS114349 Snapper Point Power Station Project Air Quality Impact Assessment Port Adelaide Energy Pty Ltd
WSP November 2019
Page 8
2.2.1 AIR EPP
The Air EPP is designed to protect the air quality environment through a range of objectives and measures including the requirement to comply with maximum ground level ambient concentrations and stack emissions to which industries must comply.
Schedule 2 of the Air EPP prescribes GLCs for key pollutants likely to be emitted during operation of the turbines using natural gas and diesel fuel. These are presented in Table 2.3.
Table 2.3 Maximum ground level concentrations
POLLUTANT AVERAGING PERIOD MAXIMUM CONCENTRATION (mg/m3)
Particles as PM10 24-hours 0.05
Particles as PM2.5 24-hours
Annual
0.025
0.008
Carbon monoxide 1-hour
8-hours
31.24
11.25
Nitrogen dioxide 1-hour
Annual
0.25
0.06
Sulphur dioxide 1-hour
24-hours
Annual
0.57
0.23
0.06
Emissions from the turbines would be required to demonstrate compliance with relevant GLCs listed in Table 2.3 using air dispersion modelling in accordance with the AAQA guidelines (SA EPA 2016).
Schedule 4 of the Air EPP provides maximum pollutant levels for some of the pollutants expected to be emitted during operation of the turbines using natural gas and diesel. These are presented in Table 2.4.
Table 2.4 Maximum pollutant levels for stack emissions
POLLUTANT ACTIVITY MAXIMUM POLLUTANT LEVEL
Carbon monoxide Any activity 1,000 mg/m3
Oxides of nitrogen Gas turbines for power generation of 10MW or greater –
(a) For gaseous fuels
(b) For liquid or solid fuels
70 mg/m3 referenced to 15% by volume of oxygen
150 mg/m3 referenced to 15% by volume of oxygen
Particulate matter Any activity other than heating metals or metal ores
100 mg/m3
Emissions from the turbines would be required to comply with these maximum pollutant levels operating on natural gas and diesel.
Project No PS114349 Snapper Point Power Station Project Air Quality Impact Assessment Port Adelaide Energy Pty Ltd
WSP November 2019
Page 9
2.2.2 EVALUATION DISTANCES
Regarding power generation, there are no specific evaluation distances recommended in the EPA guidance document ‘Evaluation distances for effective air quality and noise management’ (EPA 2016). For diesel fuel power generators and power generators in general, the main concerns regarding air quality are emissions of oxides of nitrogen and particulates dependent on whether the station is ‘base load’ or ‘peaking’. This guideline document (EPA 2016) does not prescribe a recommended evaluation distance and states this is dependent on ‘individual assessment’. This document does not provide any definition or guidance on what an ‘individual assessment’ entails.
It is assumed that an air quality assessment of emissions would be required to determine potential ground level concentrations at and beyond the site boundary and compared against relevant maximum pollutant levels as prescribed in the Air EPP. The results of this assessment may form the basis of an evaluation distance, if requested by the regulatory authorities.
2.2.3 WORKS APPROVAL AND LICENSING
Schedule 1 of the EP Act 1993, lists prescribed activities of environmental significance.
Schedule 1, Section 8 – Other (2) Fuel Burning states:
‘the conduct of works or facilities involving the use of fuel burning equipment, including flaring (other than flaring at petroleum production, storage or processing works or facilities that do not have a total storage capacity or total production rate exceeding the levels respectively specified in clause (15) or incineration, where the equipment alone or in aggregate is capable of burning combustible matter-
(a) At a rate of heat release exceeding 5 megawatts; or
(b) At a rate of heat release exceeding 500 kilowatts and the products of combustion are used-
(i) To stove enamel; or
(ii) To bake or dry any substance that on heating releases dust or air impurities’.
For commercial operation of dual fired turbine generators with natural gas as the primary fuel and diesel as an emergency back-up fuel with a capacity greater than 5 MW, an EPA Works Approval and EPA licence to operate will be required.
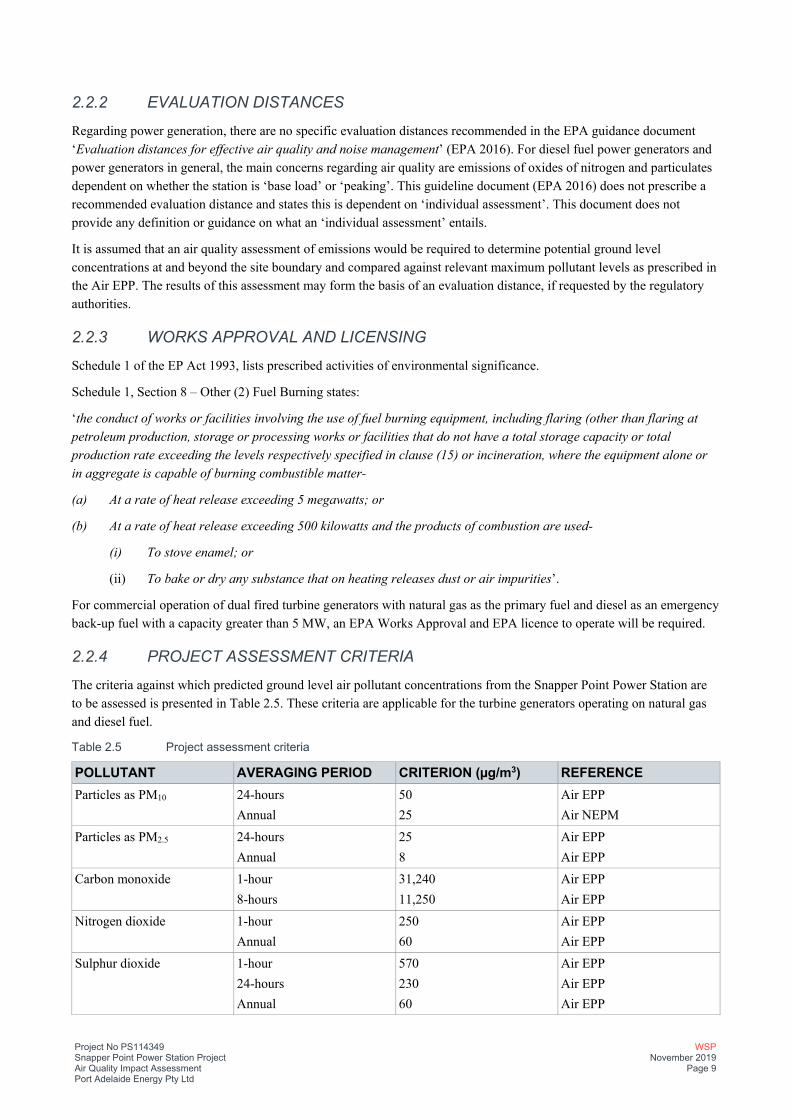
2.2.4 PROJECT ASSESSMENT CRITERIA
The criteria against which predicted ground level air pollutant concentrations from the Snapper Point Power Station are to be assessed is presented in Table 2.5. These criteria are applicable for the turbine generators operating on natural gas and diesel fuel.
Table 2.5 Project assessment criteria
POLLUTANT AVERAGING PERIOD CRITERION (µg/m3) REFERENCE Particles as PM10 24-hours
Annual 50 25
Air EPP Air NEPM
Particles as PM2.5 24-hours Annual
25 8
Air EPP Air EPP
Carbon monoxide 1-hour 8-hours
31,240 11,250
Air EPP Air EPP
Nitrogen dioxide 1-hour Annual
250 60
Air EPP Air EPP
Sulphur dioxide 1-hour 24-hours Annual
570 230 60
Air EPP Air EPP Air EPP
Project No PS114349 Snapper Point Power Station Project Air Quality Impact Assessment Port Adelaide Energy Pty Ltd
WSP November 2019
Page 10
3 EXISTING ENVIRONMENT
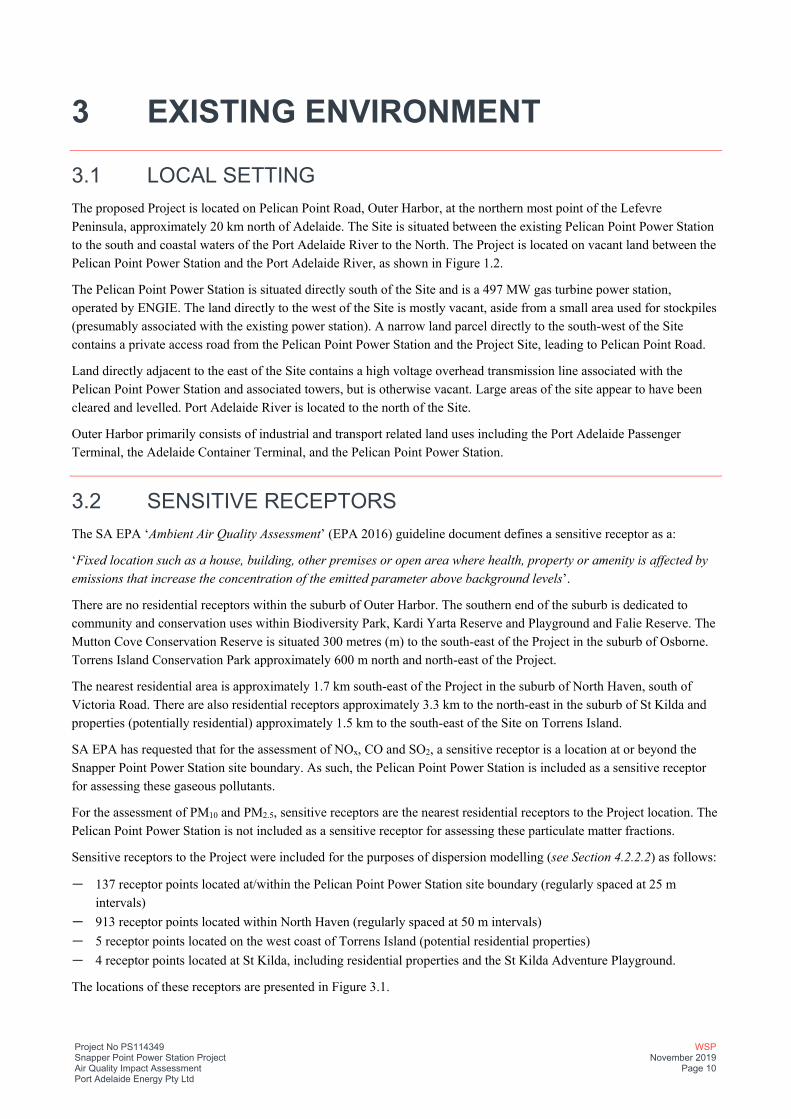
3.1 LOCAL SETTING The proposed Project is located on Pelican Point Road, Outer Harbor, at the northern most point of the Lefevre Peninsula, approximately 20 km north of Adelaide. The Site is situated between the existing Pelican Point Power Station to the south and coastal waters of the Port Adelaide River to the North. The Project is located on vacant land between the Pelican Point Power Station and the Port Adelaide River, as shown in Figure 1.2.
The Pelican Point Power Station is situated directly south of the Site and is a 497 MW gas turbine power station, operated by ENGIE. The land directly to the west of the Site is mostly vacant, aside from a small area used for stockpiles (presumably associated with the existing power station). A narrow land parcel directly to the south-west of the Site contains a private access road from the Pelican Point Power Station and the Project Site, leading to Pelican Point Road.
Land directly adjacent to the east of the Site contains a high voltage overhead transmission line associated with the Pelican Point Power Station and associated towers, but is otherwise vacant. Large areas of the site appear to have been cleared and levelled. Port Adelaide River is located to the north of the Site.
Outer Harbor primarily consists of industrial and transport related land uses including the Port Adelaide Passenger Terminal, the Adelaide Container Terminal, and the Pelican Point Power Station.
3.2 SENSITIVE RECEPTORS The SA EPA ‘Ambient Air Quality Assessment’ (EPA 2016) guideline document defines a sensitive receptor as a:
‘Fixed location such as a house, building, other premises or open area where health, property or amenity is affected by emissions that increase the concentration of the emitted parameter above background levels’.
There are no residential receptors within the suburb of Outer Harbor. The southern end of the suburb is dedicated to community and conservation uses within Biodiversity Park, Kardi Yarta Reserve and Playground and Falie Reserve. The Mutton Cove Conservation Reserve is situated 300 metres (m) to the south-east of the Project in the suburb of Osborne. Torrens Island Conservation Park approximately 600 m north and north-east of the Project.
The nearest residential area is approximately 1.7 km south-east of the Project in the suburb of North Haven, south of Victoria Road. There are also residential receptors approximately 3.3 km to the north-east in the suburb of St Kilda and properties (potentially residential) approximately 1.5 km to the south-east of the Site on Torrens Island.
SA EPA has requested that for the assessment of NOx, CO and SO2, a sensitive receptor is a location at or beyond the Snapper Point Power Station site boundary. As such, the Pelican Point Power Station is included as a sensitive receptor for assessing these gaseous pollutants.
For the assessment of PM10 and PM2.5, sensitive receptors are the nearest residential receptors to the Project location. The Pelican Point Power Station is not included as a sensitive receptor for assessing these particulate matter fractions.
Sensitive receptors to the Project were included for the purposes of dispersion modelling (see Section 4.2.2.2) as follows:
— 137 receptor points located at/within the Pelican Point Power Station site boundary (regularly spaced at 25 m intervals)
— 913 receptor points located within North Haven (regularly spaced at 50 m intervals) — 5 receptor points located on the west coast of Torrens Island (potential residential properties) — 4 receptor points located at St Kilda, including residential properties and the St Kilda Adventure Playground.
The locations of these receptors are presented in Figure 3.1.

Project No PS114349 Snapper Point Power Station Project Air Quality Impact Assessment Port Adelaide Energy Pty Ltd
WSP November 2019
Page 11
Figure 3.1 Location of modelled sensitive receptors (blue) and stack emission sources (red)
Project No PS114349 Snapper Point Power Station Project Air Quality Impact Assessment Port Adelaide Energy Pty Ltd
WSP November 2019
Page 12
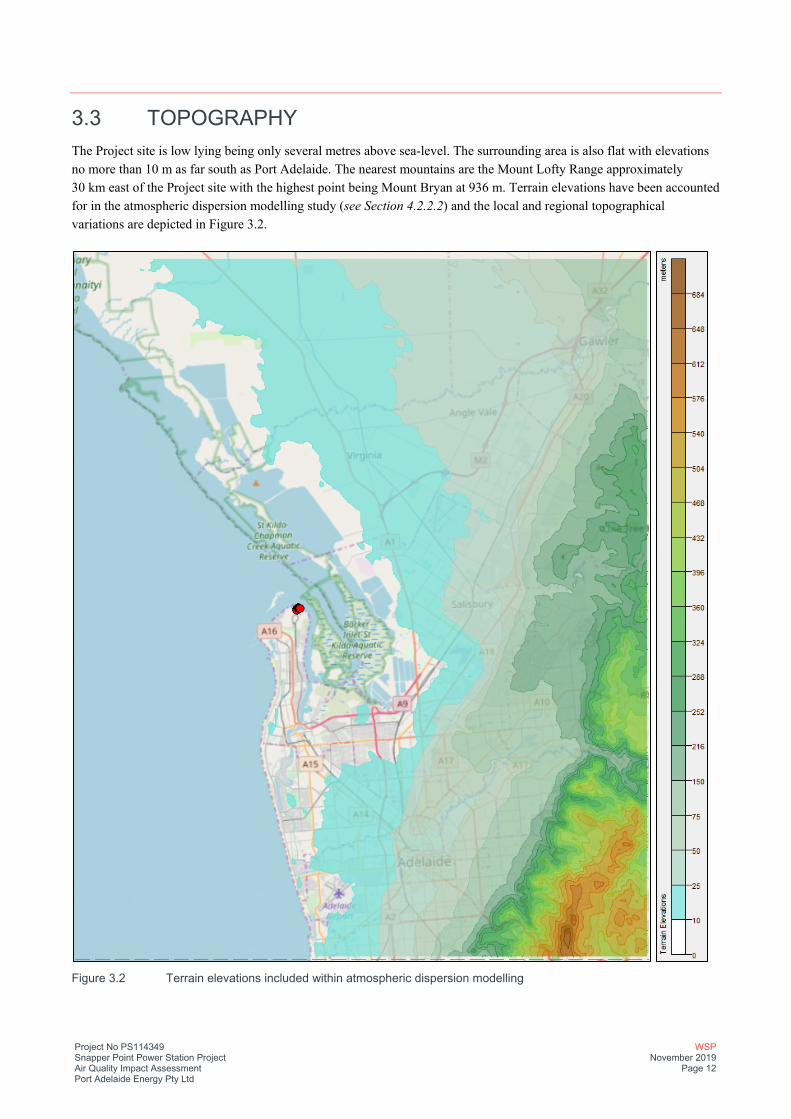
3.3 TOPOGRAPHY The Project site is low lying being only several metres above sea-level. The surrounding area is also flat with elevations no more than 10 m as far south as Port Adelaide. The nearest mountains are the Mount Lofty Range approximately 30 km east of the Project site with the highest point being Mount Bryan at 936 m. Terrain elevations have been accounted for in the atmospheric dispersion modelling study (see Section 4.2.2.2) and the local and regional topographical variations are depicted in Figure 3.2.
Figure 3.2 Terrain elevations included within atmospheric dispersion modelling

Project No PS114349 Snapper Point Power Station Project Air Quality Impact Assessment Port Adelaide Energy Pty Ltd
WSP November 2019
Page 13
3.4 LOCAL METEOROLOGY Meteorological conditions are important for determining the direction and rate at which emissions from a source would disperse. The key meteorological requirements for an air quality assessment are typically hourly records of wind speed, wind direction, temperature, rainfall and relative humidity. The following section discusses meteorological conditions in the vicinity of the Project area.
The Bureau of Meteorology (BoM) collects meteorological data at automatic weather stations (AWS) across Australia and can be used for determining climate statistics over long term periods.
The Project area has a Mediterranean climate with mild to cool winters and moderate rainfall, and warm to hot, dry summers.
There are two AWS located in the vicinity of the Project area that characterises the local meteorology using the most recent long-term dataset available. These are:
— Parafield Airport AWS (Site Number: 023013), located approximately 12 km south-east of the Project. It is situated at an elevation of 10 m on flat plains. This AWS commenced operation in 1929 and is currently operational.
— Edinburgh Royal Australian Air Force (RAAF) AWS (Site Number: 023083), approximately 14 km northeast of the Project. It is situated at an elevation of 17 m and approximately 10 km east of the coast. This AWS commenced operation in 1972 and is currently operational.
3.4.1 PARAFIELD AIRPORT AWS
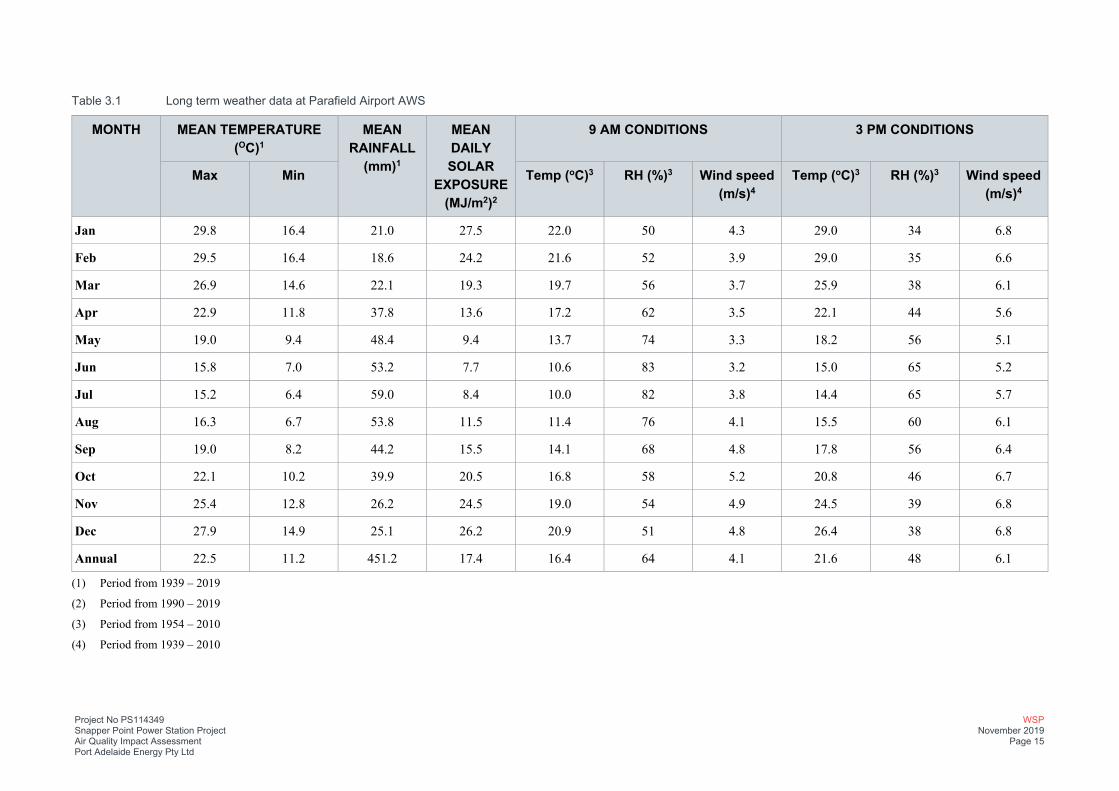
Long term weather data collected by BoM at Parafield Airport AWS is presented in Table 3.1 and summarised below.
The mean temperature ranges from 6.6oC to 29.8oC with the coldest month occurring in July and the hottest in January. Rainfall is variable across the year with an annual average of 451 millimetres (mm). The wettest months occur in winter (June to August) and early spring with the highest monthly rainfall of 59 mm occurring in July. Mean daily solar exposure is highest in the summer months with January recording of 27.5 MJ/m2 and a lowest recording of 7.7 MJ/m2 in June.
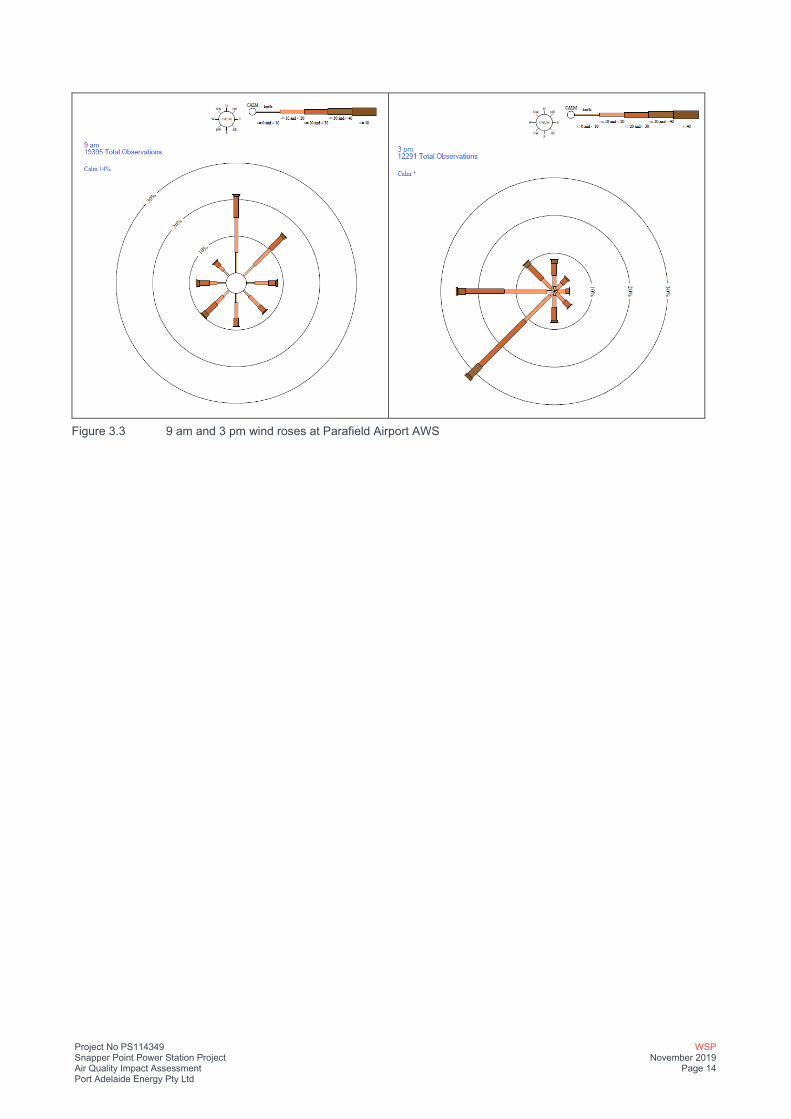
Long term wind roses at the Parafield Airport AWS at 9 am and 3 pm are presented in Figure 3.3 for the period 1 January 1942 to 11 August 2019. Wind flows are primarily northerly and north-easterly at 9 am veering south-westerly and westerly at 3 pm. Wind speeds are generally weaker at 9 am ranging from 3.2 metres per second (m/s) in June to 5.2 m/s in October. At 3 pm, the wind strengthens with speeds ranging from 5.1 m/s (May) to 6.8 m/s (November). Relative humidity levels vary across the year and are higher at 9 am ranging from 50% in January to 83 per cent (%) in June.
Project No PS114349 Snapper Point Power Station Project Air Quality Impact Assessment Port Adelaide Energy Pty Ltd
WSP November 2019
Page 14
Figure 3.3 9 am and 3 pm wind roses at Parafield Airport AWS
Project No PS114349 Snapper Point Power Station Project Air Quality Impact Assessment Port Adelaide Energy Pty Ltd
WSP November 2019
Page 15
Table 3.1 Long term weather data at Parafield Airport AWS
MONTH MEAN TEMPERATURE (OC)1
MEAN RAINFALL
(mm)1
MEAN DAILY SOLAR
EXPOSURE (MJ/m2)2
9 AM CONDITIONS 3 PM CONDITIONS
Max Min Temp (oC)3 RH (%)3 Wind speed (m/s)4
Temp (oC)3 RH (%)3 Wind speed (m/s)4
Jan 29.8 16.4 21.0 27.5 22.0 50 4.3 29.0 34 6.8
Feb 29.5 16.4 18.6 24.2 21.6 52 3.9 29.0 35 6.6
Mar 26.9 14.6 22.1 19.3 19.7 56 3.7 25.9 38 6.1
Apr 22.9 11.8 37.8 13.6 17.2 62 3.5 22.1 44 5.6
May 19.0 9.4 48.4 9.4 13.7 74 3.3 18.2 56 5.1
Jun 15.8 7.0 53.2 7.7 10.6 83 3.2 15.0 65 5.2
Jul 15.2 6.4 59.0 8.4 10.0 82 3.8 14.4 65 5.7
Aug 16.3 6.7 53.8 11.5 11.4 76 4.1 15.5 60 6.1
Sep 19.0 8.2 44.2 15.5 14.1 68 4.8 17.8 56 6.4
Oct 22.1 10.2 39.9 20.5 16.8 58 5.2 20.8 46 6.7
Nov 25.4 12.8 26.2 24.5 19.0 54 4.9 24.5 39 6.8
Dec 27.9 14.9 25.1 26.2 20.9 51 4.8 26.4 38 6.8
Annual 22.5 11.2 451.2 17.4 16.4 64 4.1 21.6 48 6.1
(1) Period from 1939 – 2019
(2) Period from 1990 – 2019
(3) Period from 1954 – 2010
(4) Period from 1939 – 2010

Project No PS114349 Snapper Point Power Station Project Air Quality Impact Assessment Port Adelaide Energy Pty Ltd
WSP November 2019
Page 16
3.4.2 EDINBURGH RAAF AWS
Long term weather data collected by BoM at Edinburgh RAAF AWS is presented in Table 3.2 and summarised below. The mean temperature ranges from 6.1oC to 30.2oC with the coldest month occurring in July and the hottest in January. Rainfall is variable across the year with an annual average of 431 mm. The wettest months occur in winter (June to August) and early spring with the highest monthly rainfall of 53 mm occurring in July.
Long term wind roses at the Edinburgh RAAF AWS at 9 am and 3 pm are presented in Figure 3.4 for the period 18 November 1972 to 10 August 2019. Wind flows are primarily north-easterly then northerly at 9 am veering south-westerly and westerly at 3 pm. Wind speeds are generally weaker at 9 am ranging from 3.3 metres per second (m/s) in February to 5.1 m/s in October. At 3 pm, the wind strengthens with speeds ranging from 5.3 m/s (July) to 6.7 m/s (November). Relative humidity levels vary across the year and are higher at 9 am ranging from 50 per cent (%) in December to 84% in June.
Figure 3.4 9 am and 3 pm wind roses at Edinburgh RAAF AWS

Project No PS114349 Snapper Point Power Station Project Air Quality Impact Assessment Port Adelaide Energy Pty Ltd
WSP November 2019
Page 17
Table 3.2 Climate statistics for Edinburgh RAAF AWS1
MONTH MEAN TEMPERATURE (OC)
MEAN RAINFALL
(mm)
MEAN NUMBER OF
CLEAR DAYS
9 AM CONDITIONS 3 PM CONDITIONS
Max Min Temp (oC) RH (%) Wind speed (m/s)
Temp (oC) RH (%) Wind speed (m/s)4
Jan 30.2 16.6 21.2 5.6 21.9 51 3.9 27.9 35 6.5
Feb 30.0 16.6 17.7 8.5 21.6 52 3.3 28.5 34 5.9
Mar 27.0 14.6 24.6 7.1 19.7 56 3.3 25.7 39 5.8
Apr 23.2 11.8 29.5 4.5 17.3 61 3.6 21.8 45 5.4
May 19.2 9.3 45.2 2.9 13.6 75 3.4 18.2 56 4.9
Jun 15.9 6.7 53.1 2.6 10.5 84 3.4 14.9 65 4.9
Jul 15.3 6.1 53.2 2.9 9.8 83 3.7 14.3 64 5.3
Aug 16.5 6.5 50.3 3.2 11.3 78 4.4 15.4 59 6.0
Sep 19.0 8.1 47.7 3.5 14.0 69 5.0 17.5 54 6.3
Oct 22.4 10.1 36.8 4.1 16.7 58 5.1 20.4 46 6.3
Nov 25.9 12.9 24.3 4.3 18.9 53 4.6 23.9 39 6.3
Dec 28.0 14.8 25.5 3.7 20.8 50 4.5 25.5 38 6.7
Annual 22.7 11.2 431 53.9 16.3 64 4.0 21.2 48 5.9
(1) Period from 1972 – 2019

Project No PS114349 Snapper Point Power Station Project Air Quality Impact Assessment Port Adelaide Energy Pty Ltd
WSP November 2019
Page 18
3.5 LOCAL AIR QUALITY
3.5.1 AIR EMISSION SOURCES
The main industrial and non-industrial air emission sources contributing to the local airshed include:
— Pelican Point power station — Port Adelaide Passenger Terminal — Flinders Adelaide Container Terminal — Terminal Proprietary (Pty) Limited (Ltd) — gas metering station — Osborne co-generation plant — Torrens Island power station — trains using the local rail network — traffic using the local road networks — domestic fuel burning (gas, liquid, solid) — residential activities (e.g. lawnmowers, barbecues).
These sources emit key pollutants relevant to this Project including:
— NOx — CO — SO2 — Particulate matter of varying size fractions (PM10 and PM2.5).
3.5.2 HISTORICAL AMBIENT AIR QUALITY DATA
SA EPA conducts long-term ambient air quality at performance monitoring station to comply with the requirements of the Air NEPM. The concentrations are compared with Air NEPM standards.
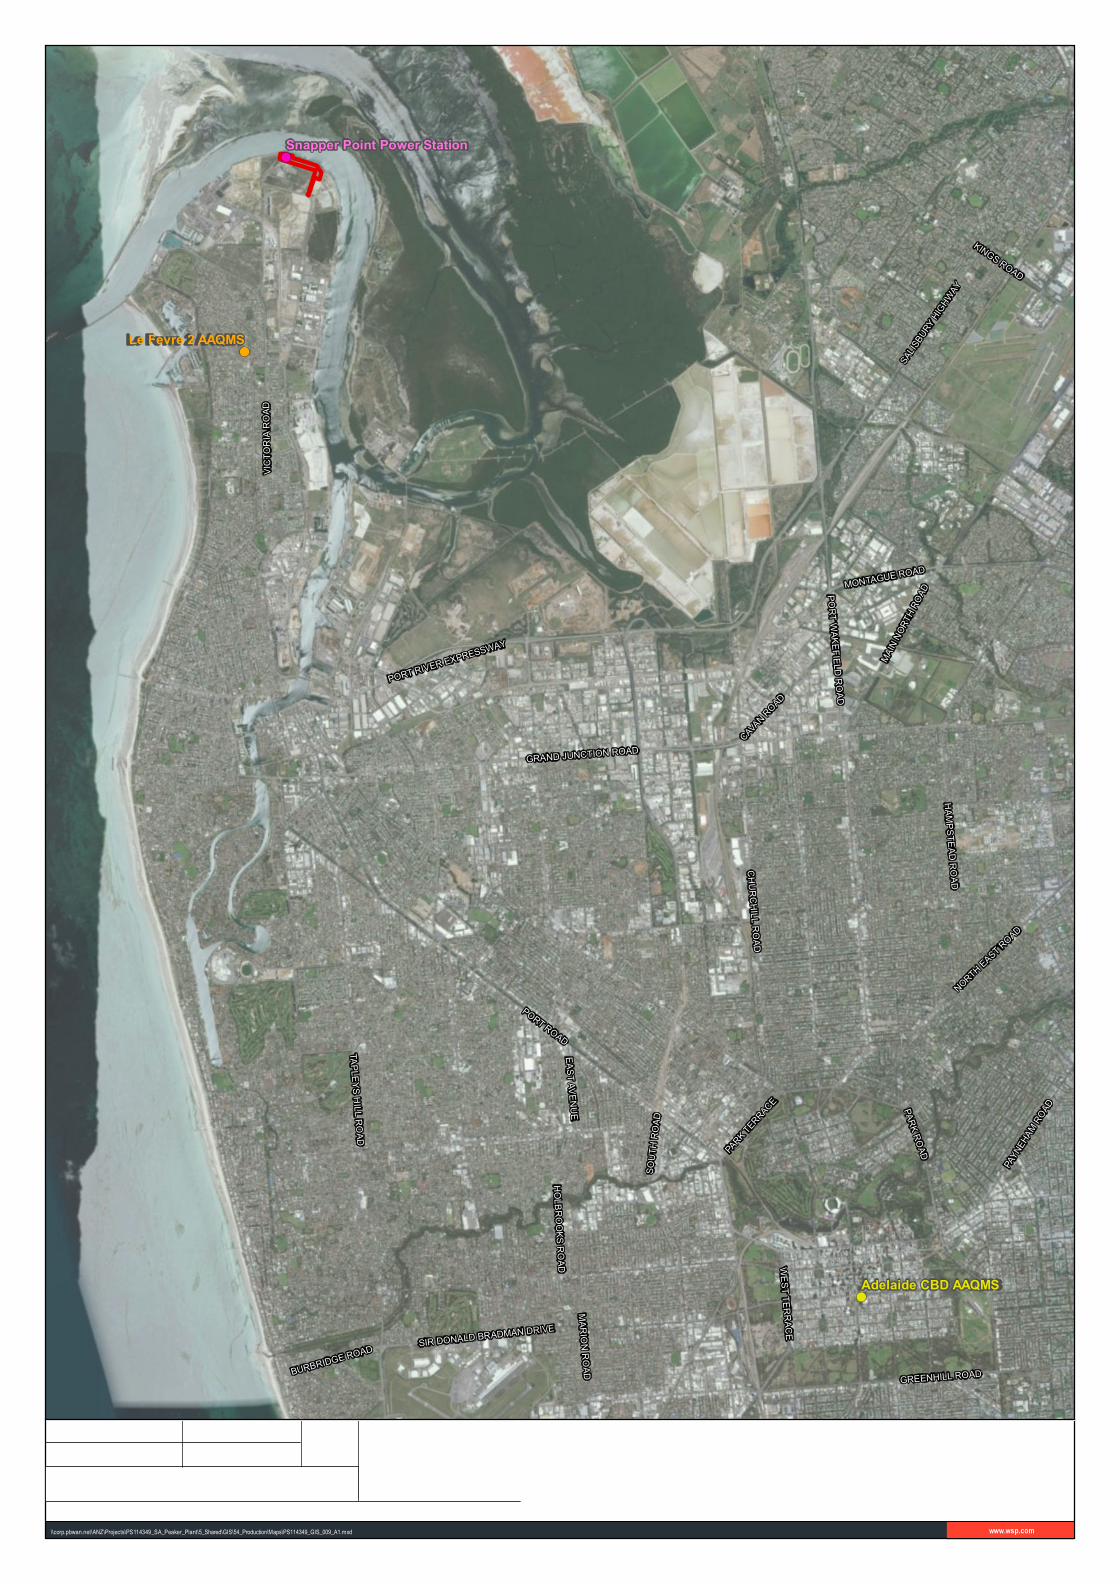
The nearest SA EPA performance monitoring station to the Project is the Le Fevre 2 ambient air quality monitoring station (AAQMS) located approximately 3.1 km south-southwest of the Project site at North Haven School off Sir Claud Gibb Street. This AAQMS continuously measures PM10, PM2.5, NO2, and SO2 respectively.
The closest SA EPA performance monitoring station to the Project that continuously measures CO is Adelaide Central Business District (CBD) AAQMS, located approximately 20 km south-east of the Project. This AAQMS also measures PM10, PM2.5, and NO2 continuously.
The locations of the Le Fevre 2 and Adelaide CBD AAQMS are presented in Figure 3.5.
\\corp.pbwan.net\ANZ\Projects\PS114349_SA_Peaker_Plant\5_Shared\GIS\54_Production\Maps\PS114349_GIS_009_A1.mxd www.wsp.com
!(
!(
!(Snapper Point Power Station
Le Fevre 2 AAQMS
Adelaide CBD AAQMS
VICTO
RIA R
OAD
PARK TERRACE
MARION ROAD
PAYN
EHAM
ROAD
NORTH EAST ROAD
TAPLEYS HILL ROAD
MONTAGUE ROAD
PARK ROAD
CHURCHILL ROAD
MAIN
NORT
H ROA
D
HAMPSTEAD ROAD
BURBRIDGE ROAD
HOLBROOKS ROAD
SIR DONALD BRADMAN DRIVE
KINGS ROAD
WEST TERRACE
CAVAN ROAD
SOUT
H RO
AD
SALIS
BURY
HIGHW
AY
PORT ROAD
EAST AVENUE
GRAND JUNCTION ROAD
GREENHILL ROAD
PORT WAKEFIELD ROAD
PORT RIVER EXPRESSWAY
Legend!( Adelaide CBD AAQMS!( Le Fevre 2 AAQMS!( Snapper Point Power Station
Site Boundary
° 1:60,000
0 790 1,580m
Coordinate system: GDA 1994 MGA Zone 54
Snapper Point Power Station ProjectFigure 3.5
Location of Le Fevre 2 and Adelaide CBD AAQMS
Scale ratio correct when printed at A3
NEXIF
Approved by:
Author: MOMap: PS114349_GIS_009_A1
Date: 26/11/2019Data source: Source: Esri, DigitalGlobe, GeoEye, Earthstar Geographics, CNES/Airbus DS, USDA, USGS,AeroGRID, IGN, and the GIS User Community
© WSP Australia Pty Ltd ("WSP") Copyright in the drawings, information and data recorded ("the information") is the property of WSP. This document and the information are solely for the use of the authorised recipient and this document may not be used, copied orreproduced in whole or part for any purpose other than that which it was supplied by WSP. WSP makes no representation, undertakes no duty and accepts no responsibility to any third party who may use or rely upon this document or the information. NCSI CertifiedQuality System to ISO 9001. © APPROVED FOR AND ON BEHALF OF WSP Australia Pty Ltd.

Project No PS114349 Snapper Point Power Station Project Air Quality Impact Assessment Port Adelaide Energy Pty Ltd
WSP November 2019
Page 20
3.5.2.1 SA EPA LE FEVRE 2 AAQMS
NO2 monitoring at Le Fevre 2 AAQMS is conducted in accordance with Australian Standard AS 3580.5.1:1993 (Standards Australia 2011). The results are compared with the following Air NEPM standards:
— One hour average: 0.12 ppm — Annual average: 0.03 ppm.
The NO2 concentrations for 2014 to 2018 are illustrated in Figure 3.6 and Figure 3.7 and summarised in Table 3.3.
NITROGEN DIOXIDE
Figure 3.6 1-hour average NO2 concentrations at Le Fevre 2 AAQMS for 2014 to 2018

Project No PS114349 Snapper Point Power Station Project Air Quality Impact Assessment Port Adelaide Energy Pty Ltd
WSP November 2019
Page 21
Figure 3.7 Annual average NO2 concentrations at Le Fevre 2 AAQMS for 2014 to 2018
Table 3.3 1-hour average NO2 concentrations at Le Fevre 2 AAQMS for 2014 to 2018
YEAR 1-HOUR NO2 CONCENTRATIONS (PPM)
MAX. MIN. AVE 99%ILE 98%ILE 95%ILE 90%ILE 75%ILE 50%ILE
2014 0.032 <DL 0.005 0.024 0.021 0.017 0.013 0.008 0.004
2015 0.036 <DL 0.006 0.036 0.025 0.018 0.014 0.008 0.003
2016 0.028 <DL 0.005 0.021 0.018 0.013 0.010 0.006 0.003
2017 0.031 <DL 0.005 0.023 0.017 0.013 0.010 0.007 0.004
2018 0.031 <DL 0.005 0.023 0.021 0.016 0.012 0.007 0.004
NEPM standard 0.12
The Le Fevre 2 AAQMS NO2 results for 2014 to 2018 demonstrate compliance with the Air NEPM 1-hour and annual average standards. The maximum 1-hour average concentration of 0.036 ppm occurred in 2015 on 31 March 2015 at 9 pm, which is below the 0.12 ppm hourly Air NEPM standard.
SULPHUR DIOXIDE
SO2 monitoring at Le Fevre 2 AAQMS is conducted in accordance with Australian Standard AS 3580.4.1:1990 (Standards Australia 2011). The results are compared with the following Air NEPM standards:
— One hour average: 0.20 ppm — 24-hour average: 0.08 ppm — Annual average: 0.02 ppm.
The SO2 concentrations for 2014 to 2018 are illustrated in Figure 3.8 and Figure 3.9 and summarised in Table 3.4 and
Table 3.5.

Project No PS114349 Snapper Point Power Station Project Air Quality Impact Assessment Port Adelaide Energy Pty Ltd
WSP November 2019
Page 22
Figure 3.8 1-hour average SO2 concentrations at Le Fevre 2 AAQMS for 2014 to 2018
Figure 3.9 Annual average SO2 concentrations at Le Fevre 2 AAQMS for 2014 to 2018

Project No PS114349 Snapper Point Power Station Project Air Quality Impact Assessment Port Adelaide Energy Pty Ltd
WSP November 2019
Page 23
Table 3.4 1-hour average SO2 concentrations at Le Fevre 2 AAQMS for 2014 to 2018
YEAR 1-HOUR SO2 CONCENTRATIONS (PPM)
MAX. MIN. AVE 99%ILE 98%ILE 95%ILE 90%ILE 75%ILE 50%ILE
2014 0.027 <DL 0.003 0.005 0.003 0.002 0.001 0.0002 <DL
2015 0.034 <DL 0.003 0.004 0.003 0.002 0.001 <DL <DL
2016 0.022 <DL 0.0002 0.004 0.003 0.001 0.001 <DL <DL
2017 0.017 <DL 0.0005 0.007 0.005 0.003 0.002 0.001 <DL
2018 0.040 <DL 0.003 0.006 0.004 0.002 0.001 <DL <DL
NEPM standard 0.2 Note 1: DL: Detection limit
Table 3.5 24-hour average SO2 concentrations at Le Fevre 2 AAQMS for 2014 to 2018
YEAR 24-HOUR SO2 CONCENTRATIONS (PPM)
MAX. MIN. AVE 99%ILE 98%ILE 95%ILE 90%ILE 75%ILE 50%ILE
2014 0.0037 <DL 0.0003 0.0020 0.0017 0.0012 0.0008 0.0005 0.0002
2015 0.0020 <DL 0.0003 0.0018 0.0015 0.0011 0.0009 0.0005 0.0001
2016 0.0025 <DL 0.0002 0.0016 0.0013 0.0010 0.0007 0.0003 0.0001
2017 0.0032 <DL 0.0005 0.0026 0.0024 0.0019 0.0014 0.0008 0.0003
2018 0.0046 <DL 0.0003 0.0025 0.0021 0.0013 0.0008 0.0003 0.0001
NEPM standard 0.08 Note 1: DL: Detection limit
The Le Fevre 2 AAQMS SO2 results for 2014 to 2018 demonstrate compliance with the Air NEPM 1-hour, 24-hour and annual average standards. The maximum 1-hour and 24-hour average concentration of 0.0046 ppm occurred in 2018 and is below the relevant Air NEPM standards.
PM10
PM10 sampling at Le Fevre 2 AAQMS is conducted using a tapered element oscillating balance (TEOM) in accordance with Australian Standard AS 3580.9.8: 2001 (Standards Australia 2011). TEOM data has been adjusted in accordance with National Environment Council (NEPC) requirements (NEPC 2001).
The results are compared with the following Air NEPM standards:
— 24-hour averaging period: 50 µg/m3 — Annual average period: 25 µg/m3
The 24-hour and annual average PM10 results are illustrated in Figure 3.10 and Figure 3.11, with the 24-hour data summarised in Table 3.6.

Project No PS114349 Snapper Point Power Station Project Air Quality Impact Assessment Port Adelaide Energy Pty Ltd
WSP November 2019
Page 24
Figure 3.10 24-hour average PM10 concentrations at Le Fevre 2 AAQMS for 2014 to 2018
Figure 3.11 Annual average PM10 concentrations at Le Fevre 2 AAQMS for 2014 to 2018

Project No PS114349 Snapper Point Power Station Project Air Quality Impact Assessment Port Adelaide Energy Pty Ltd
WSP November 2019
Page 25
Table 3.6 24-hour average PM10 concentrations at Le Fevre 2 AAQMS for 2014 to 2018
YEAR 24-HOUR PM10 CONCENTRATIONS (µG/M3)
MAX. MIN. AVE 99%ILE 98%ILE 95%ILE 90%ILE 75%ILE 50%ILE
2014 62.2 6.3 21.9 48.1 44.5 37.4 31.2 25.1 21.1
2015 114.2 5.4 19.9 41.3 35.6 32.9 29.2 23.8 18.5
2016 80.6 5.5 19.2 38.6 33.7 30.8 28.6 22.5 18.4
2017 67.3 7.2 20.6 48.4 39.2 33.7 30.1 24.5 19.2
2018 60.9 6.7 21.9 49.2 45.4 36.8 31.7 25.7 20.2
NEPM standard 50
The 24-hour PM10 concentrations at Le Fevre 2 AAQMS show exceedances of the Air NEPM standard for all years (2014 to 2018). Details of these exceedances are presented in Table 3.7.
Table 3.7 24-hour PM10 exceedances at Le Fevre 2 AAQMS for 2014 to 2018
YEAR DATE OF EXCEEDANCE CONCENTRATION (µG/m3) REASON
2014 12 February 62.2 No reason provided
2015 4 May 114.2 Regional dust event
2016 20 June 80.6 Regional dust storm
2017 29 January
2 August
52.9
67.3
No reason provided. Possibly bushfire related.
No reason provided.
2018 22 March
11 April
2 August
60.9
59.0
54.7
Prescribed burn at Mt Lofty Ranges on 21 March.
Local fires and a state-wide dust storm on 11 April.
Dust storm on 2 August.
Annual average PM10 concentrations shows compliance with the Air NEPM standard for 2014 to 2018.
PM2.5
PM2.5 sampling at Le Fevre 2 AAQMS is conducted using a tapered element oscillating balance (TEOM) in accordance with Australian Standard AS 3580.9.8: 2001 (Standards Australia 2011).
The results are compared with the following Air NEPM standards:
— 24-hour averaging period: 25 µg/m3 — Annual average period: 8 µg/m3
The 24-hour and annual average PM2.5 results are illustrated in Figure 3.12 and Figure 3.13, with the 24-hour data summarised in Table 3.8.

Project No PS114349 Snapper Point Power Station Project Air Quality Impact Assessment Port Adelaide Energy Pty Ltd
WSP November 2019
Page 26
Figure 3.12 24-hour average PM2.5 concentrations at Le Fevre 2 AAQMS for 2014 to 2018
Figure 3.13 Annual average PM2.5 concentrations at Le Fevre 2 AAQMS for 2014 to 2018

Project No PS114349 Snapper Point Power Station Project Air Quality Impact Assessment Port Adelaide Energy Pty Ltd
WSP November 2019
Page 27
Table 3.8 24-hour average PM2.5 concentrations at Le Fevre 2 AAQMS for 2014 to 2018
YEAR 24-HOUR PM2.5 CONCENTRATIONS (µG/M3)
MAX. MIN. AVE 99%ILE 98%ILE 95%ILE 90%ILE 75%ILE 50%ILE
2014 23.1 1.1 7.1 15.5 14.2 11.7 10.8 8.6 6.8
2015 17.7 2.2 7.8 15.6 14.1 12.9 11.0 8.8 7.5
2016 18.9 2.3 6.4 13.9 13.1 10.2 9.0 7.5 6.0
2017 17.5 2.5 6.7 12.7 11.4 10.3 9.4 7.8 6.4
2018 21.2 1.8 7.3 19.0 16.3 14.6 11.9 8.8 6.7
NEPM standard 25
The Le Fevre 2 AAQMS PM2.5 results for 2014 to 2018 demonstrate compliance with the Air NEPM 24-hour and annual average standards. The maximum 24-hour average concentration of 23.1 µg/m3 occurred in 2014 and is below the relevant Air NEPM standards. The maximum annual average PM2.5 concentration of 7.8 µg/m3 occurred in 2015, which is marginally below the Air NEPM standard of 8 µg/m3.
3.5.2.2 ADELAIDE CBD AAQMS
CO
CO monitoring at Adelaide CBD AAQMS is conducted in accordance with Australian Standard AS 3580.7.1:1992 (Standards Australia 2011). The results are compared with the following Air NEPM standards:
— One hour average: 25 ppm — 24-hour average: 9 ppm
The 1-hour and 8-hour CO concentrations for the years 2014 (April onwards) to 2018 are presented in Figure 3.14 and Figure 3.15, and Table 3.9 and Table 3.10.
Figure 3.14 1-hour average CO concentration at Adelaide CBD AAQMS for 2014 to 2018

Project No PS114349 Snapper Point Power Station Project Air Quality Impact Assessment Port Adelaide Energy Pty Ltd
WSP November 2019
Page 28
Figure 3.15 8-hour rolling average CO concentration at Adelaide CBD AAQMS for 2014 to 2018
Table 3.9 1-hour average CO concentrations at Adelaide CBD AAQMS for 2014 to 2018
YEAR 1-HOUR CO CONCENTRATIONS (PPM)
MAX. MIN. AVE 99%ILE 98%ILE 95%ILE 90%ILE 75%ILE 50%ILE
2014 1.68 0 0.20 0.82 0.67 0.52 0.40 0.26 0.16
2015 2.14 0 0.21 0.79 0.67 0.51 0.40 0.28 0.18
2016 2.24 0 0.18 0.67 0.56 0.44 0.34 0.23 0.15
2017 2.28 0 0.23 0.80 0.65 0.51 0.40 0.28 0.20
2018 2.47 0 0.15 0.50 0.44 0.34 0.28 0.20 0.13
NEPM standard 25
Table 3.10 8-hour average CO concentrations at Adelaide CBD AAQMS for 2014 to 2018
YEAR 8-HOUR CO CONCENTRATIONS (PPM)
MAX. MIN. AVE 99%ILE 98%ILE 95%ILE 90%ILE 75%ILE 50%ILE
2014 1.15 0.01 0.20 0.68 0.56 0.44 0.36 0.26 0.17
2015 1.94 0.09 0.21 0.64 0.55 0.45 0.37 0.28 0.19
2016 2.14 0.01 0.18 0.50 0.45 0.38 0.32 0.23 0.16
2017 2.10 0.01 0.23 0.61 0.55 0.47 0.39 0.29 0.21
2018 1.11 0.004 0.15 0.39 0.36 0.31 0.26 0.20 0.14
NEPM standard 9

Project No PS114349 Snapper Point Power Station Project Air Quality Impact Assessment Port Adelaide Energy Pty Ltd
WSP November 2019
Page 29
The Adelaide CBD AAQMS CO results for 2014 to 2018 demonstrate compliance with the Air NEPM 1-hour and 8-hour Air NEPM standards. The maximum recorded 1-hour and 8-hour rolling average concentrations were 2.47 ppm (2018) and 1.11 ppm (2016) respectively and are below the relevant Air NEPM standards.
3.5.2.3 ADOPTED BACKGROUND CONCENTRATIONS
Ambient air quality data collected at the Le Fevre 2 and Adelaide CBD AAQMS between 1 January 2014 and 31 December 2018 were sourced from the SA EPA website (www.epa.sa.gov.au) to determine background concentrations for the Project.
SA EPA does not provide specific guidance for selecting appropriate background concentrations in the document ‘Ambient air quality assessment’ (SA EPA 2016).
The Environment Protection Agency Victoria (EPAV) State Environment Protection Policy (Ambient Air Quality) [SEPP(AQM)] states ‘proponents must include background data where no appropriate hourly background data exists must add the 70th percentile of one year’s observed hourly concentrations as a constant value to the predicted maximum concentration from the model simulation. In cases where a 24-hour averaging time us used in the model the background data must be based on 24-hour averages.’
For this assessment, a conservative approach is adopted and the 75th percentile concentration is used for the hourly and 24-hour averaging periods. The year chosen represents the highest 75th percentile concentrations. For PM10, PM2.5, SO2
and CO the year chosen was 2017. For NO2, the year chosen for background concentrations was 2015. The selected background concentrations for each pollutant are presented in Table 3.11.
Table 3.11 Background concentrations used in the air quality impact assessment
POLLUTANT AVERAGING PERIOD CONCENTRATION (µG/M3)1
NO2 1-hour
Annual
16.4
12.3
CO 1-hour
8-hour
350
363
SO2 1-hour
24-hour
Annual
2.9
2.3
1.4
PM10 24-hour
Annual
25.7
21.9
PM2.5 24-hour
Annual
8.8
7.3
(1) Reference conditions of 0oC and 1 atmosphere

Project No PS114349 Snapper Point Power Station Project Air Quality Impact Assessment Port Adelaide Energy Pty Ltd
WSP November 2019
Page 30
4 ASSESSMENT METHODOLOGY
4.1 CONSTRUCTION PHASE ASSESSMENT A qualitative assessment of potential construction phase air quality impacts was completed based on a review of potential sources of fugitive emissions of airborne particulate matter, in addition to potential odour releases and emissions from non-road mobile plant. The extent and nature of construction activities, including the likely frequency of such activities, were considered to assess the potential for local air quality impacts. The outcomes of the assessment are used to inform the need for appropriate management measures to ensure impacts during the construction phase are minimised.
4.2 OPERATION PHASE ASSESSMENT This section provides a detailed account of both the point source emissions to air for the Project, the assessed emission scenarios and the associated atmospheric dispersion modelling approach, in addition to the limitations and assumptions associated with the technical study.
4.2.1 KEY DATA AND RESOURCES
An index of the key data and resources used in preparation air quality impact assessment is presented in Table 4.1.
Table 4.1 Index of key data and resources for the air quality technical study
DATA / RESOURCE REFERENCE & SUMMARY SOURCE
Proposed Site Layout Scaled and geo-referenced plans for the Project Site provided, displaying all associated buildings and infrastructure
Detailed layout plans provided by Nexif Energy dated 8 October 2019 (Drawing no.: P0007-05-GGA-00-002)
Stack Locations Proposed Project stack locations provided on scaled plans for the Site. In addition, X, Y coordinates were provided for the existing Pelican Point stack locations.
As per above detailed layout plans.
Emissions Data (existing) Emissions data and associated stack parameters relating to Pelican Point Power Station, specifically for NOx (as NO2) and CO emissions.
‘Proposed Combined Cycle Gas Turbine Power Station, Pelican Point – Environmental Impact Assessment Report’, October 1998, and as agreed with SA EPA, as per memo dated on 6 November 2019 (Document ref: PS114349-AQ-MEM-006).
Emissions Data (proposed) Emissions data and associated stack parameters relating to the proposed turbine generators as part of the Project, specifically for;
— NOx (as NO2) and CO emissions (turbines operating on natural gas)
— NOx (as NO2), CO, SO2, PM10, and PM2.5 emissions (turbines operating on diesel)
Data supplied by Nexif Energy and agreed with SA EPA, as per memo dated on 6 November 2019 (Document ref: PS114349-AQ-MEM-006)

Project No PS114349 Snapper Point Power Station Project Air Quality Impact Assessment Port Adelaide Energy Pty Ltd
WSP November 2019
Page 31
DATA / RESOURCE REFERENCE & SUMMARY SOURCE
Prognostic Hourly Sequential Meteorological Data
Prognostic ‘Weather Research and Forecasting’ (WRF) modelled meteorological data were obtained for year 2009 for a 50 km x 50 km domain, centred on the Project Site. This data was used within the CALMET model to facilitate diagnostic meteorological modelling of the Project study area.
‘WRF Meteorological Data for CALPUFF’ purchased from Lakes Environmental (October 2019)
Base Mapping Open-source mapping data were utilised within the air quality modelling study to provide appropriate base mapping.
OpenStreetMap tiles, provided within Lakes Environmental CALPUFF View v8.6
Topographical Data Terrain features within the model domain were resolved based on 30 m resolution Shuttle Radar Topography Mission (SRTM1) data.
Global SRTM3 data (NASA), provided via WebGIS.com within Lakes Environmental CALPUFF View v8.6
SRC’s CALMET model v6.5.0 Diagnostic meteorological model used to generate hourly, three-dimensional wind fields for input to CALPUFF dispersion model.
Lakes Environmental CALPUFF View v8.6
SRC’s CALPUFF model v7.3.1 Atmospheric dispersion model used to simulate emissions from Project stack sources and predict ground-level airborne concentrations for each pollutant of concern.
Lakes Environmental CALPUFF View v8.6
4.2.2 ATMOSPHERIC DISPERSION MODELLING
4.2.2.1 CALMET METEOROLOGICAL PROCESSING
CALMET is a meteorological model which includes a diagnostic wind field generator. It accounts for the treatment of slope flows, terrain effects, such as blocking, and a micrometeorological model for overland and overwater boundary layers. CALMET can be run using gridded data fields generated by models (such as WRF model), hourly observational data from weather stations, or a combination of the two. CALMET links to a database (http://www.webgis.com), which accesses both terrain (SRTM1) and land use files specific to the study area being modelled.
Prognostic hourly meteorological data provided by the WRF model outputs for year 2009 (as agreed with SA EPA1) were input to CALMET as an initial guess wind field, which enabled higher resolution three-dimensional hourly wind and temperature fields to be generated over the modelled domain. Associated two-dimensional fields such as mixing height, surface characteristics, and dispersion properties are also included in the CALMET output file. The prognostic WRF data covered a domain of 50 km x 50 km centred on the Project Site, at a resolution of 1 km x 1 km grid.
The diagnostic CALMET wind field was modelled at a resolution of 400 m over a 50 km x 50 km grid equating to the WRF data extents. A total of 10 vertical cells (layers) were modelled within the grid, ranging from ground level to 3 km. Most these cells were within the bottom 1 km of the atmosphere to provide better coverage of boundary layer circulations, within which dispersion of pollutants from the proposed low-level point sources would occur. The output of the diagnostic data was in a format suitable for input to the CALPUFF atmospheric dispersion model.
A series of wind rose plots are presented in Figure 4.1 depicting annual and seasonal wind data outputs from CALMET modelling for 2009 at the Project Site. The annual wind rose demonstrates the dominance of winds originating from the southwest, with relatively smaller components from the northeast, southeast, and south. Prevailing southwest winds are
1 SA EPA 2019a, Approach to air quality impact assessment discussed and agreed with SA EPA at a meeting on 5 September 2019

Project No PS114349 Snapper Point Power Station Project Air Quality Impact Assessment Port Adelaide Energy Pty Ltd
WSP November 2019
Page 32
evident in summer, with relatively small southerly components. Southwest winds continue to form the main component in spring and autumn, but with a wider distribution of winds from the west, northeast, east, and southeast relative to the summer season. Winds during the winter season of 2009 show a strong north-easterly component, with a relatively high frequency of winds from the west, northwest and north.
Annual Summer (Dec-Feb) Autumn (Mar-May)
Winter (Jun-Aug) Spring (Sept-Nov) Legend Figure 4.1 Annual and seasonal wind roses based on CALMET modelling for 2009 at Project Site
4.2.2.2 CALPUFF ATMOSPHERIC DISPERSION MODELLING
CALPUFF is a transport and dispersion model that advects “puffs” of a given material/gaseous species emitted from modelled sources, in turn simulating dispersion and transformation processed within the atmosphere as dictated by the CALMET-generated meteorological fields. The model produces hourly concentrations outputs at discrete and/or gridded receptors, as dictated by the model user, which are processed (using CALPOST) to provide tabulated concentration results equivalent to the required averaging time period.
The CALPUFF model was used to simulate pollutant emissions from the respective existing (Pelican Point Power Station) and proposed (Snapper Point Power Station) stack sources, as detailed below for the Project, using 2009 meteorological data modelled from CALMET.

Project No PS114349 Snapper Point Power Station Project Air Quality Impact Assessment Port Adelaide Energy Pty Ltd
WSP November 2019
Page 33
MODELLED EMISSIONS SCENARIOS
To facilitate the prediction of ground level concentrations for the relevant pollutants (NO2, CO, SO2, PM10, and PM2.5), which can be compared against the relevant Project assessment criteria (see Section 2.2.4), the following emissions scenarios were modelled:
— Scenario 1: All five (5 no.) proposed turbine generators operating on gas at 100% load for each hour of the year — Scenario 2: All five (5 no.) proposed turbine generators operating on diesel at 100% load for each hour of the year — Scenario 3: Three (3 no.) proposed turbine generators operating on diesel and two (2 no.) operating on gas, all at
100% load for each hour of the year.
It is noted than Scenario 3 i.e. a configuration of two fuels operating simultaneously is not expected to occur in reality.
In each of the above scenarios, the Pelican Point Power Station stack sources were included in the model to enable cumulative ground level pollutant concentrations to be derived at each modelled receptor location.
The primary purpose of the Project is to supplement the existing energy grid during periods of high demand. Therefore, modelling of emissions from the proposed turbine generators at 100% load for all hours of the year represents an unrealistic scenario and is considered a worst-case approach with respect to comparing pollutant concentration outputs against long-term (annual mean) Air EPP / NEPM standards. For commercial reasons, the Project will only operate between 5% to 10% of the year, during periods of high energy demand and low natural gas supply.
The stack source parameters and associated emissions data for each of the modelled scenarios is provided in Table 4.2. These model input data were agreed with the SA EPA in advance of completing the modelling study2. The location of each modelled stack is depicted in Figure 4.2.
Table 4.2 Modelled source emission parameters
STACK PARAMETER EXISTING STACK SOURCES 1 PROPOSED STACK SOURCES 2, 3
#1 #2 #1 #2 #3 #4 #5
Location (Xm, Ym) 271650.85, 6150198.56
271661.03, 6150171.67
271762.669, 6150302.163
271783.552, 6150295.242
271804.435, 6150288.321
271859.015, 6150270.233
271879.899, 6150263.312
Height (m agl) 39 39 7.3 7.3 7.3 7.3 7.3
Diameter (m) 6 6 2.23 2.23 2.23 2.23 2.23
Temperature (K) 383 383 796 / 810 796 / 810 796 / 810 796 / 810 796 / 810
Efflux Velocity (m/s) 25 25 56.0 / 57.5 56.0 / 57.5 56.0 / 57.5 56.0 / 57.5 56.0 / 57.5
Volumetric Flow (m3/s) 707 707 221 / 227 221 / 227 221 / 227 221 / 227 221 / 227
NOx Concentration (mg/m3) 4 70 70 70 / 150 70 / 150 70 / 150 70 / 150 70 / 150
NOx Emission Rate (g/s) 50 50 15.5 / 34.1 15.5 / 34.1 15.5 / 34.1 15.5 / 34.1 15.5 / 34.1
CO Concentration (mg/m3)
9.9 9.9 190 / 25 190 / 25 190 / 25 190 / 25 190 / 25
CO Emission Rate (g/s) 7.0 7.0 42 / 5.7 42 / 5.7 42 / 5.7 42 / 5.7 42 / 5.7
SO2 Concentration (mg/m3)
- - - / 20.4 - / 20.4 - / 20.4 - / 20.4 - / 20.4
SO2 Emission Rate (g/s) - - - / 4.5 - / 4.5 - / 4.5 - / 4.5 - / 4.5
2 SA EPA 2019b, Email from SA EPA on 6 November 2019 confirming acceptance of model input parameters

Project No PS114349 Snapper Point Power Station Project Air Quality Impact Assessment Port Adelaide Energy Pty Ltd
WSP November 2019
Page 34
STACK PARAMETER EXISTING STACK SOURCES 1 PROPOSED STACK SOURCES 2, 3
#1 #2 #1 #2 #3 #4 #5
PM10 Concentration (mg/m3)
- - - / 6.2 - / 6.2 - / 6.2 - / 6.2 - / 6.2
PM10 Emission Rate (g/s)
- - - / 1.4 - / 1.4 - / 1.4 - / 1.4 - / 1.4
PM2.5 Concentration (mg/m3)
- - - / 6.1 - / 6.1 - / 6.1 - / 6.1 - / 6.1
PM2.5 Emission Rate (g/s) 5 - - - / 1.37 - / 1.37 - / 1.37 - / 1.37 - / 1.37
Scenario 1 (Fuel Source) ✔ ✔ ✔ (Gas) ✔ (Gas) ✔ (Gas) ✔ (Gas) ✔ (Gas)
Scenario 2 (Fuel Source) ✔ ✔ ✔ (Diesel) ✔ (Diesel) ✔ (Diesel) ✔ (Diesel) ✔ (Diesel)
Scenario 3 (Fuel Source) ✔ ✔ ✔ (Diesel) ✔ (Gas) ✔ (Diesel) ✔ (Gas) ✔ (Diesel)
Modelled Operating Period
Continuous Continuous
(1) Pelican Point Power Station (2 x 160 MW gas turbines, #1 and #2)
(2) Snapper Point Power Station (5 x 30.8 MW trailer-mounted GE TM2500 turbine generators, #1 to #5)
(3) Where two values are entered (e.g. ‘XXX’ / ‘XXX’), the first relates to GAS as the fuel source; the second relates to DIESEL as the fuel source
(4) As per Air EPP (see Table 2-4)
(5) Assumed that 98% of PM10 emissions are emitted as PM2.5 (National Pollution Inventory – Combustion Engines EETM, June 2008)
MODELLED BUILDINGS
The CALPUFF dispersion model accounts for the effects of building downwash3 of pollutants. The principal buildings that are likely to influence dispersion of emissions from the proposed stack locations, and thus were included in the air quality model, are depicted in Figure 4.2.
In the absence of specific building height data for the Project, the buildings selected for inclusion in the model were conservatively inferred from the detailed Site layout plan provided by Nexif Energy and the height of buildings assumed to range between three and four metres above ground level. The buildings located adjacent to the Pelican Point Power Station stacks were modelled at 29 m above ground level (agl), with the buildings further to the east of the stacks modelled at 22 m agl, based on observations made using Google Earth (no detailed site plans were made available at the time of the assessment).
3 The enhanced turbulent mixing of pollutants in the lee of buildings, which can result in high concentrations in the wake of buildings.

Project No PS114349 Snapper Point Power Station Project Air Quality Impact Assessment Port Adelaide Energy Pty Ltd
WSP November 2019
Page 35
Figure 4.2 Modelled stack locations (red) and buildings (blue) included within CALPUFF dispersion model set-up
TREATMENT OF TERRAIN AND LAND USE DATA
To represent the influence of terrain elevations in the dispersion of pollutants, a digital elevation file was used in CALPUFF, based on Shuttle Radar Topography Mission (SRTM1) data with a resolution of 30 m. For both the modelled discrete receptors and grid points, the recommended Lakes Inverse Distance interpolation was used. This function interpolates the neighbouring points using inverse distance to obtain the elevation at the desired point. The terrain variations included in the dispersion modelling are depicted in Figure 3.2.
Global Land Cover Characterisation (GLCC) data were obtained from CALPUFF’s database (http://www.webgis.com) for the modelled area at a resolution of 1 km. However, visualisation of this data indicated that the coastline within the modelled domain was poorly defined. As such, a land use data file was created manually to supplement the existing data, which allowed the coastline to be better defined and land uses within and adjacent to the Project Site operational area to be assigned.
MODELLED SENSITIVE RECEPTORS
The discrete sensitive receptors included within the CALPUFF modelling are depicted in Figure 3.1, specifically capturing the nearest residential properties to the Site within North Haven, St Kilda, and Torrens Island, in addition to encompassing potential pollutant exposure within the Pelican Point Power Station. Ground level pollutant concentrations were predicted at each receptor.
A uniform Cartesian receptor grid was modelled to cover a 16 km x 20 km area (0.2 km resolution). This enabled the dispersion of the criteria pollutants to be visualised throughout the wider area as concentration contour plots, including residential areas to the south of the Project Site. The extent of the receptor grid is depicted in Figure 4.3.

Project No PS114349 Snapper Point Power Station Project Air Quality Impact Assessment Port Adelaide Energy Pty Ltd
WSP November 2019
Page 36
Figure 4.3 Modelled extent of uniform Cartesian receptor grid
MODEL OUTPUT PROCESSING (CALPOST)
The model outputs for each criteria pollutant are summarised in Table 4.3. The respective background pollutant concentrations, as presented in Table 3.11, were added to the respective contribution from the modelled point sources at each receptor location.
For the conversion of NOx stack source emissions to NO2 in the atmosphere, a fixed ratio was assumed whereby 35% of NOx would be converted to NO2 with respect to the 1-hour averaging period, with 70% of NOx converted to NO2 for the annual averaging period. This approach was adopted with reference to the UK Environment Agency’s ‘Air Quality Modelling and Assessment Unit’ guidance note – Conversion Ratios for NOx and NO2 (2015).

Project No PS114349 Snapper Point Power Station Project Air Quality Impact Assessment Port Adelaide Energy Pty Ltd
WSP November 2019
Page 37
Table 4.3 Model output parameters to facilitate results analysis
CRITERIA POLLUTANT
AVERAGING PERIOD (UNITS)
VALUE PRESENTED FOR ANALYSIS (µG/M3)
APPLICABLE MODELLED RECEPTOR(S)
NO2 1-hour Maximum 1-hour All
Annual Annual mean Residential only
CO 1-hour Maximum 1-hour All
8-hour Maximum 8-hour All
SO2
1-hour Maximum 1-hour All
24-hour Maximum 1-hour Residential only
Annual Annual mean Residential only
PM10 24-hour Maximum 1-hour Residential only
Annual Annual mean Residential only
PM2.5
24-hour Maximum 1-hour Residential only
Annual Annual mean Residential only
4.2.2.3 ASSESSMENT LIMITATIONS
MODELLED EMISSIONS DATA
Emissions from each proposed turbine generator (gas / diesel) stack within the Project Site were modelled to be representative of continuous operation under 100% load for each hour of the year. However, the proposed generators will be operational for between 5% and 10% of all hours in the year, during periods of high energy demand and low natural gas supply. Furthermore, emissions of NOx from these stacks have been modelled at the maximum allowed concentrations, as prescribed in the Air EPP, for both natural gas and diesel fuel sources. This approach reflects an ultimate worst-case scenario and would not be a realistic assumption with respect to deriving annual mean ground level concentrations for the criteria pollutants.
However, whilst remaining conservative, this approach is relatively more representative for indicating the potential for short-term exceedances of criteria pollutants at the respective receptor locations, particularly as these conservative operating assumptions are modelled under varying meteorological conditions across the year.
MODELLED BUILDINGS
Where precise building height and dimension data were not available, the approach to including buildings within the model for the purposes of accounting for building downwash has been conservative. That is, existing and proposed structures in proximity to the modelled stacks have been modelled as solid structures at a height of between 3-4 m agl (Project Site) and between 22-29 m agl (Pelican Point Power Station).
CONVERSION OF NOX TO NO2
A fixed ratio was assumed for converting NOx to NO2 in the atmosphere, whereby 35% of NOx would be converted to NO2 with respect to the 1-hour averaging period, with 70% of NOx converted to NO2 for the annual averaging period. This approach was adopted with reference to the UK Environment Agency’s ‘Air Quality Modelling and Assessment Unit’ (AQMAU) guidance note – Conversion Ratios for NOx and NO2 (2015). This approach is considered to provide a level of conservatism within the model results for NO2 (i.e. ‘worse case’ as stated within the AQMAU guidance note) was adopted for the purposes of this assessment.

Project No PS114349 Snapper Point Power Station Project Air Quality Impact Assessment Port Adelaide Energy Pty Ltd
WSP November 2019
Page 38
ATMOSPHERIC DISPERSION MODELLING
Modelling of complex physical systems is based on the use of numerical techniques to solve a set of governing equations. In general, the more complicated the system modelled, the more parameterisations (or approximations) are required to solve these equations; particularly in relation to the representation of sub-grid scale processes. Thus, there are inherently a number of ‘tuneable’ parameters that are required as input into the models. Model developers often suggest default values for these parameters, which may be based on observational data, laboratory experiments or professional experience. Depending on the scale of the site, assessing the sensitivity of model results to input data and/or the value of tuneable parameters can be prohibitive, either in terms of computational requirements, timeframes for completion of the assessment and/or budgetary constraints.
For this study, CALPUFF model defaults were selected for the following parameters:
— vertical dispersion constants — wind speed defined for calm conditions (<0.5 m/s) — dispersion of puffs released from each source — plume path adjustment according to atmospheric stability and local terrain (‘partial plume path adjustment’) — chemical transformation not modelled.
Validation is a critical component to both model development and application. Rarely however, does a suitable data set exist with which to conduct a detailed, statistically meaningful model validation study. The CALPUFF dispersion model has been developed to estimate the impact of emissions from a range of source types including: point sources (tall and short stacks), buoyant line sources, buoyant area sources (i.e. forest fires), area sources and volume sources. Model validation exercises have tended to focus on the impacts of emissions from point sources (i.e. stacks).
In general, models have difficulty in accurately predicting dispersion under light wind speeds (less than 1 m/s) due to the dominance of physical processes other than advection and or turbulent diffusion under such conditions. The inability to accurately predict the minimum mixing height is another limiting factor of dispersion modelling and is particularly important when dealing with low level, non-buoyant (or low buoyancy) emission sources, which are not relevant in this study.
Further limitations in dispersion modelling are the uncertainties relating to the precision and applicability of input data, and the lack of observational data with which to validate the predicted concentrations. Given that the modelled scenarios incorporate significant emissions contributions from proposed point sources, there are no local ambient monitoring data with which to compare the modelled outputs for this study.

Project No PS114349 Snapper Point Power Station Project Air Quality Impact Assessment Port Adelaide Energy Pty Ltd
WSP November 2019
Page 39
5 AIR QUALITY ASSESSMENT
5.1 CONSTRUCTION PHASE The main air quality impacts during construction of the Project would be associated with airborne particulate matter (PM) of varying size fractions (deposited dust, TSP, PM10 and PM2.5)
— site preparation works; including fencing, preliminary civil works and drainage, access road and internal track construction, construction of site offices and facilities
— installation of footings and infrastructure — removal of temporary construction facilities and rehabilitation of disturbed areas.
The proposed timing for construction of the Project is early-2020 to late-2020 (approximately 10 months), pending development approval.
Equipment required for construction would include earth moving equipment, trucks and cranes. Materials required will include gravel, concrete and infrastructure components.
Odour emissions for some of the activities e.g. excavation works of potentially contaminated soil, may also occur although it is anticipated that any such occurrence would be localised and not impact sensitive receptors off-site. Emissions (CO, NOx, SO2, particulate matter fractions [PM10 and PM2.5], VOCs and semi-volatile organic compounds [SVOCs including PAHs]) from heavy commercial vehicles (HCVs) and mobile plant and machinery would occur from the combustion of diesel and petrol fuel.
Impacts from the operation of mobile plant and machinery would depend on the number and power outputs of the combustion engines, the quality of the fuel and engine maintenance. Notwithstanding, these sources are considered to be minor given their intermittent nature, duration, geographical extent over which these emissions occur and the low number of sensitive receptors that may be directly impacted.
Proposed management measures presented in Section 6 should ensure air quality impacts during construction are minimised.
5.2 OPERATION PHASE The results of the atmospheric dispersion modelling study are presented in the below subsections, providing summary statistics for each criteria pollutant and respective averaging period at the modelled discrete receptors and for each scenario.
In addition, the predicted maximum ground level concentration values for selected criteria pollutants (NO2, PM10, and PM2.5) across the modelled Cartesian receptor grid are visualised as a series of concentration contour plots illustrated in Appendix A. These plots are referenced appropriately within the subsections below.
5.2.1 NO2
5.2.1.1 1-HOUR NO2 AVERAGING PERIOD
A summary of the predicted 1-hour maximum concentrations is presented for each scenario in Table 5.1, inclusive of the respective background concentration (as per Table 3.11). The results are presented within the context of the 1-hour NO2 Project assessment criterion (see Table 2.5) for all discrete receptor locations.
Concentration contour plots for each scenario, depicting the distribution of maximum predicted 1-hour average concentrations throughout the modelled Cartesian grid are presented as Figures A1 to A3, respectively, in Appendix A.

Project No PS114349 Snapper Point Power Station Project Air Quality Impact Assessment Port Adelaide Energy Pty Ltd
WSP November 2019
Page 40
Table 5.1 Summary of predicted 1-hour NO2 concentrations at all modelled discrete sensitive receptors
STATISTIC SCENARIO 1 (GAS) SCENARIO 2 (DIESEL) SCENARIO 3 (MIX)
Pelican Point Power Station
No. of receptors 137 137 137
No. receptors exceeding Project criterion 7 97 49
Max. concentration (µg/m3) 316.2 652.4 518.8
Location of Max. concentration (Xm, Ym) 271842, 6150243 271842, 6150243 271842, 6150243
Max. number of exceedances at single receptor*
2 74 48
Location of Max. number of exceedances* 271842, 6150243 271842, 6150243 271842, 6150243
North Haven (Residential)
No. of receptors 913 913 913
No. receptors exceeding Project criterion 0 184 66
Max. concentration (µg/m3) 193.9 411.9 323.7
Location of Max. concentration (Xm, Ym) 270296, 6164698 270296, 6164698 270296, 6164698
Max. number of exceedances at single receptor*
0 2 2
Location of Max. number of exceedances* - At 63 receptors At 5 receptors
Torrens Island (Residential)
No. of receptors 5 5 5
No. receptors exceeding Project criterion 0 1 0
Max. concentration (µg/m3) 138.3 264.8 205.9
Location of Max. concentration (Xm, Ym) 273196, 6149013 273196, 6149013 273196, 6149013
Max. number of exceedances at single receptor*
0 1 0
Location of Max. number of exceedances* - 273196, 6149013 -
St Kilda (Residential and Adventure Playground)
No. of receptors 4 4 4
No. receptors exceeding Project criterion 0 0 0
Max. concentration (µg/m3) 73.6 107.5 92.9
Location of Max. concentration (Xm, Ym) 274522, 6152770 274522, 6152770 274522, 6152770
Max. number of exceedances at single receptor*
0 0 0
Location of Max. number of exceedances* - - -
1-hour NO2 Project Criterion 250 µg/m3
* The location at which the most exceedances of the 1-hour criterion are predicted to occur throughout the modelled year
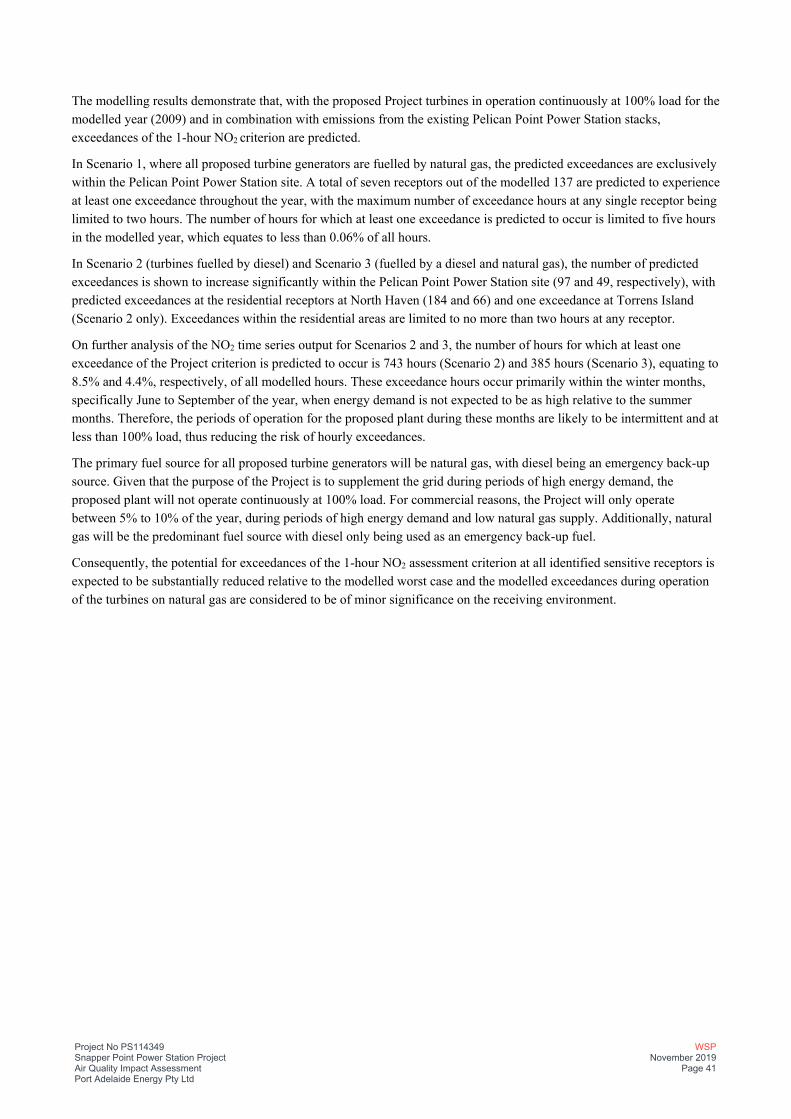
Project No PS114349 Snapper Point Power Station Project Air Quality Impact Assessment Port Adelaide Energy Pty Ltd
WSP November 2019
Page 41
The modelling results demonstrate that, with the proposed Project turbines in operation continuously at 100% load for the modelled year (2009) and in combination with emissions from the existing Pelican Point Power Station stacks, exceedances of the 1-hour NO2 criterion are predicted.
In Scenario 1, where all proposed turbine generators are fuelled by natural gas, the predicted exceedances are exclusively within the Pelican Point Power Station site. A total of seven receptors out of the modelled 137 are predicted to experience at least one exceedance throughout the year, with the maximum number of exceedance hours at any single receptor being limited to two hours. The number of hours for which at least one exceedance is predicted to occur is limited to five hours in the modelled year, which equates to less than 0.06% of all hours.
In Scenario 2 (turbines fuelled by diesel) and Scenario 3 (fuelled by a diesel and natural gas), the number of predicted exceedances is shown to increase significantly within the Pelican Point Power Station site (97 and 49, respectively), with predicted exceedances at the residential receptors at North Haven (184 and 66) and one exceedance at Torrens Island (Scenario 2 only). Exceedances within the residential areas are limited to no more than two hours at any receptor.
On further analysis of the NO2 time series output for Scenarios 2 and 3, the number of hours for which at least one exceedance of the Project criterion is predicted to occur is 743 hours (Scenario 2) and 385 hours (Scenario 3), equating to 8.5% and 4.4%, respectively, of all modelled hours. These exceedance hours occur primarily within the winter months, specifically June to September of the year, when energy demand is not expected to be as high relative to the summer months. Therefore, the periods of operation for the proposed plant during these months are likely to be intermittent and at less than 100% load, thus reducing the risk of hourly exceedances.
The primary fuel source for all proposed turbine generators will be natural gas, with diesel being an emergency back-up source. Given that the purpose of the Project is to supplement the grid during periods of high energy demand, the proposed plant will not operate continuously at 100% load. For commercial reasons, the Project will only operate between 5% to 10% of the year, during periods of high energy demand and low natural gas supply. Additionally, natural gas will be the predominant fuel source with diesel only being used as an emergency back-up fuel.
Consequently, the potential for exceedances of the 1-hour NO2 assessment criterion at all identified sensitive receptors is expected to be substantially reduced relative to the modelled worst case and the modelled exceedances during operation of the turbines on natural gas are considered to be of minor significance on the receiving environment.
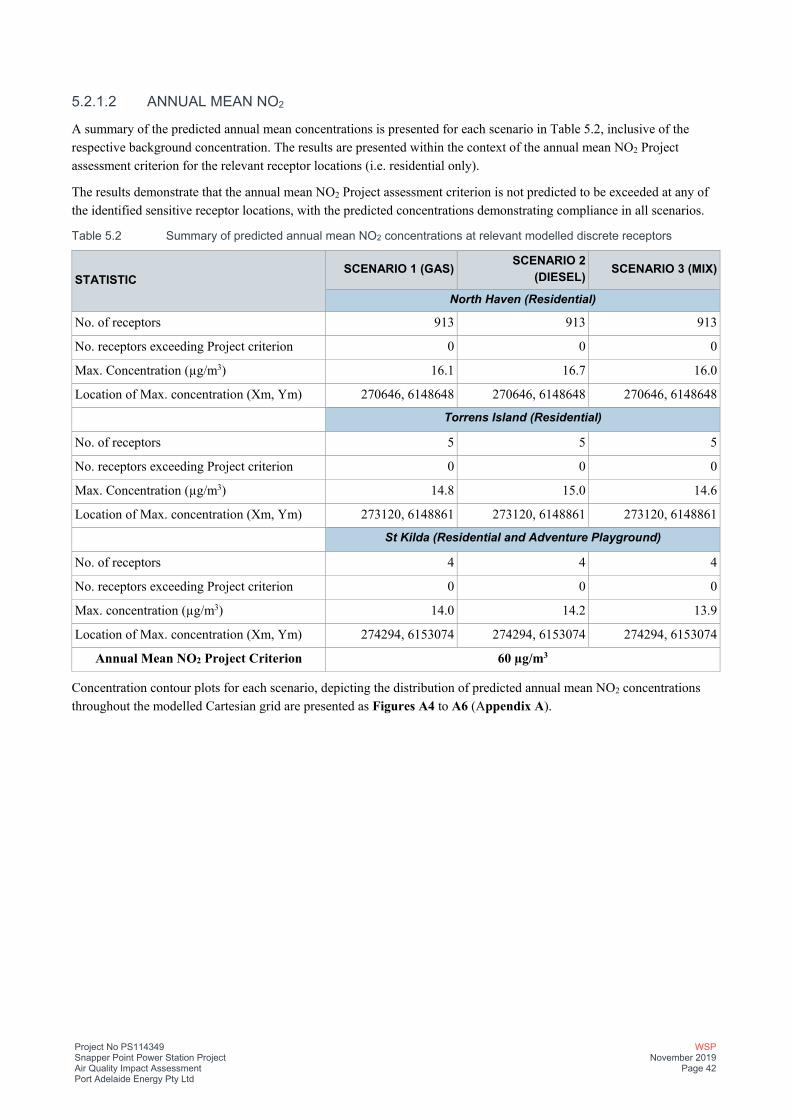
Project No PS114349 Snapper Point Power Station Project Air Quality Impact Assessment Port Adelaide Energy Pty Ltd
WSP November 2019
Page 42
5.2.1.2 ANNUAL MEAN NO2
A summary of the predicted annual mean concentrations is presented for each scenario in Table 5.2, inclusive of the respective background concentration. The results are presented within the context of the annual mean NO2 Project assessment criterion for the relevant receptor locations (i.e. residential only).
The results demonstrate that the annual mean NO2 Project assessment criterion is not predicted to be exceeded at any of the identified sensitive receptor locations, with the predicted concentrations demonstrating compliance in all scenarios.
Table 5.2 Summary of predicted annual mean NO2 concentrations at relevant modelled discrete receptors
STATISTIC SCENARIO 1 (GAS) SCENARIO 2
(DIESEL) SCENARIO 3 (MIX)
North Haven (Residential)
No. of receptors 913 913 913
No. receptors exceeding Project criterion 0 0 0
Max. Concentration (µg/m3) 16.1 16.7 16.0
Location of Max. concentration (Xm, Ym) 270646, 6148648 270646, 6148648 270646, 6148648
Torrens Island (Residential)
No. of receptors 5 5 5
No. receptors exceeding Project criterion 0 0 0
Max. Concentration (µg/m3) 14.8 15.0 14.6
Location of Max. concentration (Xm, Ym) 273120, 6148861 273120, 6148861 273120, 6148861
St Kilda (Residential and Adventure Playground)
No. of receptors 4 4 4
No. receptors exceeding Project criterion 0 0 0
Max. concentration (µg/m3) 14.0 14.2 13.9
Location of Max. concentration (Xm, Ym) 274294, 6153074 274294, 6153074 274294, 6153074
Annual Mean NO2 Project Criterion 60 µg/m3
Concentration contour plots for each scenario, depicting the distribution of predicted annual mean NO2 concentrations throughout the modelled Cartesian grid are presented as Figures A4 to A6 (Appendix A).

Project No PS114349 Snapper Point Power Station Project Air Quality Impact Assessment Port Adelaide Energy Pty Ltd
WSP November 2019
Page 43
5.2.2 CO
5.2.2.1 1-HOUR CO AVERAGING PERIOD
A summary of the predicted 1-hour maximum concentrations is presented for each scenario in Table 5.3, inclusive of the respective background concentration. The results are presented within the context of the 1-hour CO Project assessment criterion for all modelled receptor locations.
The results demonstrate that the 1-hour CO Project assessment criterion is not predicted to be exceeded at any of the modelled receptor locations, with the maximum predicted CO concentrations below the criterion for all scenarios.
Table 5.3 Summary of predicted 1-hour CO maximum concentrations at all modelled discrete sensitive receptors
STATISTIC SCENARIO 1 (GAS) SCENARIO 2
(DIESEL) SCENARIO 3 (MIX)
Pelican Point Power Station
No. of receptors 137 137 137
No. receptors exceeding Project criterion 0 0 0
Max. concentration (µg/m3) 2,671.1 653.7 1,500.9
Location of Max. concentration (Xm, Ym) 271842, 6150243 271842, 6150243 271696, 6150273
North Haven (Residential)
No. of receptors 913 913 913
No. receptors exceeding Project criterion 0 0 0
Max. concentration (µg/m3) 1,724.4 538.9 1,018.2
Location of Max. concentration (Xm, Ym) 270296, 6164698 270296, 6164698 270296, 6164698
Torrens Island (Residential)
No. of receptors 5 5 5
No. receptors exceeding Project criterion 0 0 0
Max. concentration (µg/m3) 1,233.1 468.7 760.1
Location of Max. concentration (Xm, Ym) 273196, 6149013 273196, 6149013 273196, 6149013
St Kilda (Residential & Adventure Playground)
No. of receptors 4 4 4
No. receptors exceeding Project criterion 0 0 0
Max. concentration (µg/m3) 677.9 391.2 500.9
Location of Max. concentration (Xm, Ym) 274153, 6152895 274522, 6152770 274153, 6152895
1-hour CO Project Criterion 31,240 µg/m3
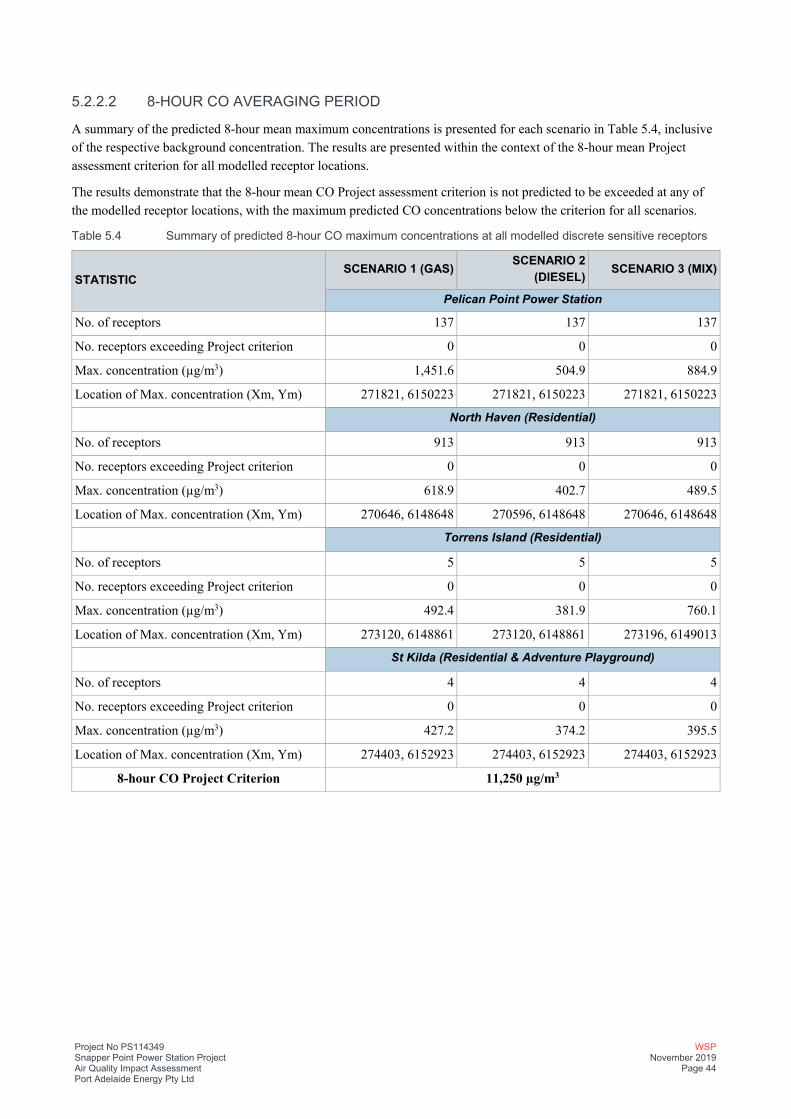
Project No PS114349 Snapper Point Power Station Project Air Quality Impact Assessment Port Adelaide Energy Pty Ltd
WSP November 2019
Page 44
5.2.2.2 8-HOUR CO AVERAGING PERIOD
A summary of the predicted 8-hour mean maximum concentrations is presented for each scenario in Table 5.4, inclusive of the respective background concentration. The results are presented within the context of the 8-hour mean Project assessment criterion for all modelled receptor locations.
The results demonstrate that the 8-hour mean CO Project assessment criterion is not predicted to be exceeded at any of the modelled receptor locations, with the maximum predicted CO concentrations below the criterion for all scenarios.
Table 5.4 Summary of predicted 8-hour CO maximum concentrations at all modelled discrete sensitive receptors
STATISTIC SCENARIO 1 (GAS) SCENARIO 2
(DIESEL) SCENARIO 3 (MIX)
Pelican Point Power Station
No. of receptors 137 137 137
No. receptors exceeding Project criterion 0 0 0
Max. concentration (µg/m3) 1,451.6 504.9 884.9
Location of Max. concentration (Xm, Ym) 271821, 6150223 271821, 6150223 271821, 6150223
North Haven (Residential)
No. of receptors 913 913 913
No. receptors exceeding Project criterion 0 0 0
Max. concentration (µg/m3) 618.9 402.7 489.5
Location of Max. concentration (Xm, Ym) 270646, 6148648 270596, 6148648 270646, 6148648
Torrens Island (Residential)
No. of receptors 5 5 5
No. receptors exceeding Project criterion 0 0 0
Max. concentration (µg/m3) 492.4 381.9 760.1
Location of Max. concentration (Xm, Ym) 273120, 6148861 273120, 6148861 273196, 6149013
St Kilda (Residential & Adventure Playground)
No. of receptors 4 4 4
No. receptors exceeding Project criterion 0 0 0
Max. concentration (µg/m3) 427.2 374.2 395.5
Location of Max. concentration (Xm, Ym) 274403, 6152923 274403, 6152923 274403, 6152923
8-hour CO Project Criterion 11,250 µg/m3
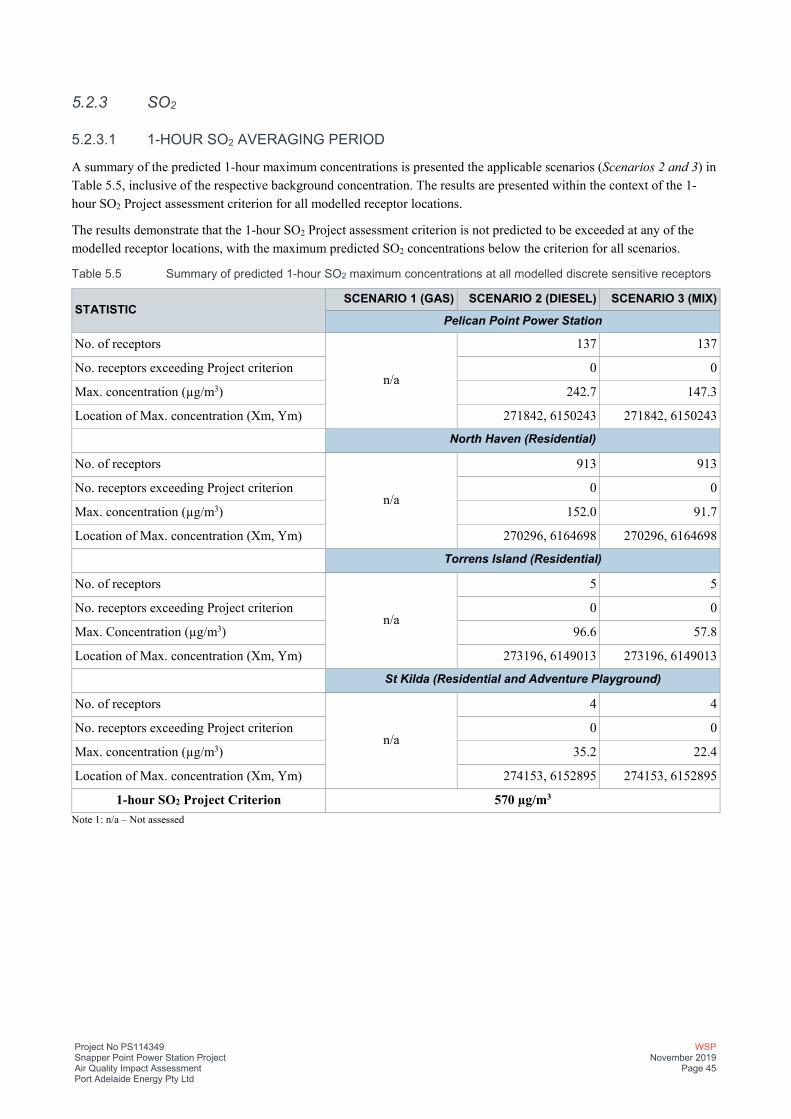
Project No PS114349 Snapper Point Power Station Project Air Quality Impact Assessment Port Adelaide Energy Pty Ltd
WSP November 2019
Page 45
5.2.3 SO2
5.2.3.1 1-HOUR SO2 AVERAGING PERIOD
A summary of the predicted 1-hour maximum concentrations is presented the applicable scenarios (Scenarios 2 and 3) in Table 5.5, inclusive of the respective background concentration. The results are presented within the context of the 1-hour SO2 Project assessment criterion for all modelled receptor locations.
The results demonstrate that the 1-hour SO2 Project assessment criterion is not predicted to be exceeded at any of the modelled receptor locations, with the maximum predicted SO2 concentrations below the criterion for all scenarios.
Table 5.5 Summary of predicted 1-hour SO2 maximum concentrations at all modelled discrete sensitive receptors
STATISTIC SCENARIO 1 (GAS) SCENARIO 2 (DIESEL) SCENARIO 3 (MIX)
Pelican Point Power Station
No. of receptors
n/a
137 137
No. receptors exceeding Project criterion 0 0
Max. concentration (µg/m3) 242.7 147.3
Location of Max. concentration (Xm, Ym) 271842, 6150243 271842, 6150243
North Haven (Residential)
No. of receptors
n/a
913 913
No. receptors exceeding Project criterion 0 0
Max. concentration (µg/m3) 152.0 91.7
Location of Max. concentration (Xm, Ym) 270296, 6164698 270296, 6164698
Torrens Island (Residential)
No. of receptors
n/a
5 5
No. receptors exceeding Project criterion 0 0
Max. Concentration (µg/m3) 96.6 57.8
Location of Max. concentration (Xm, Ym) 273196, 6149013 273196, 6149013
St Kilda (Residential and Adventure Playground)
No. of receptors
n/a
4 4
No. receptors exceeding Project criterion 0 0
Max. concentration (µg/m3) 35.2 22.4
Location of Max. concentration (Xm, Ym) 274153, 6152895 274153, 6152895
1-hour SO2 Project Criterion 570 µg/m3 Note 1: n/a – Not assessed

Project No PS114349 Snapper Point Power Station Project Air Quality Impact Assessment Port Adelaide Energy Pty Ltd
WSP November 2019
Page 46
5.2.3.2 24-HOUR SO2 AVERAGING PERIOD
A summary of the predicted maximum 24-hour mean concentrations is presented for the applicable scenarios (Scenarios 2 and 3) in Table 5.6, inclusive of the respective background concentration. The results are presented within the context of the 24-hour SO2 Project assessment criterion for the relevant modelled receptor locations (i.e. residential only).
The results demonstrate that the 24-hour mean SO2 Project assessment criterion is not predicted to be exceeded at any of the modelled receptor locations, with the maximum predicted SO2 concentrations below the criterion for all scenarios.
Table 5.6 Summary of predicted 24-hour SO2 maximum concentrations at relevant modelled sensitive receptors
STATISTIC SCENARIO 1 (GAS) SCENARIO 2
(DIESEL) SCENARIO 3 (MIX)
North Haven (Residential)
No. of receptors
n/a
913 913
No. receptors exceeding Project criterion 0 0
Max. Concentration (µg/m3) 13.8 9.2
Location of Max. concentration (Xm, Ym) 270646, 6148648 273120, 6148861
Torrens Island (Residential)
No. of receptors
n/a
5 5
No. receptors exceeding Project criterion 0 0
Max. concentration (µg/m3) 7.3 5.3
Location of Max. concentration (Xm, Ym) 273120, 6148861 273120, 6148861
St Kilda (Residential and Adventure Playground)
No. of receptors
n/a
4 4
No. receptors exceeding Project criterion 0 0
Max. concentration (µg/m3) 5.2 4.1
Location of Max. concentration (Xm, Ym) 274522, 6152770 274522, 6152770
24-hour SO2 Project Criterion 230 µg/m3 Note 1: n/a – Not assessed

Project No PS114349 Snapper Point Power Station Project Air Quality Impact Assessment Port Adelaide Energy Pty Ltd
WSP November 2019
Page 47
5.2.3.3 ANNUAL MEAN SO2
A summary of the predicted annual mean concentrations is presented for the applicable scenarios (Scenarios 2 & 3) in Table 5.7, inclusive of the respective background concentration. The results are presented within the context of the annual mean SO2 Project assessment criterion for the relevant modelled receptor locations (i.e. residential only).
The results demonstrate that the annual mean SO2 Project assessment criterion is not predicted to be exceeded at any of the modelled receptor locations, with the predicted SO2 concentrations below the criterion for all scenarios.
Table 5.7 Summary of predicted annual mean SO2 concentrations at relevant modelled sensitive receptors
STATISTIC SCENARIO 1 (GAS) SCENARIO 2
(DIESEL) SCENARIO 3 (MIX)
North Haven (Residential)
No. of receptors
n/a
913 913
No. receptors exceeding Project criterion 0 0
Max. concentration (µg/m3) 2.0 1.8
Location of Max. concentration (Xm, Ym) 270646, 6148648 273120, 6148861
Torrens Island (Residential)
No. of receptors
n/a
5 5
No. receptors exceeding Project criterion 0 0
Max. concentration (µg/m3) 1.7 1.6
Location of Max. concentration (Xm, Ym) 273120, 6148861 273120, 6148861
St Kilda (Residential and Adventure Playground)
No. of receptors
n/a
4 4
No. receptors exceeding Project criterion 0 0
Max. concentration (µg/m3) 1.7 1.6
Location of Max. concentration (Xm, Ym) 274294, 6153074 274294, 6153074
Annual Mean SO2 Project Criterion 60 µg/m3 Note 1: n/a – Not assessed

Project No PS114349 Snapper Point Power Station Project Air Quality Impact Assessment Port Adelaide Energy Pty Ltd
WSP November 2019
Page 48
5.2.4 PM10
5.2.4.1 24-HOUR PM10 AVERAGING PERIOD
A summary of the predicted 24-hour mean maximum concentrations is presented for the applicable scenarios (Scenarios 2 and 3) in Table 5.8, inclusive of the respective background concentration. The results are presented within the context of the 24-hour PM10 Project assessment criterion for the relevant modelled receptor locations (i.e. residential only).
The results demonstrate that the 24-hour mean PM10 Project assessment criterion is not predicted to be exceeded at any of the modelled receptor locations, with the maximum predicted PM10 concentrations below the criterion for all scenarios.
Table 5.8 Summary of predicted 24-hour PM10 maximum concentrations at relevant modelled sensitive receptors
STATISTIC SCENARIO 1 (GAS) SCENARIO 2 (DIESEL) SCENARIO 3 (MIX)
North Haven (Residential)
No. of receptors
n/a
913 913
No. receptors exceeding Project criterion 0 0
Max. concentration (µg/m3) 29.3 27.8
Location of Max. concentration (Xm, Ym) 270646, 6148648 270646, 6148648
Torrens Island (Residential)
No. of receptors
n/a
5 5
No. receptors exceeding Project criterion 0 0
Max. concentration (µg/m3) 27.2 26.6
Location of Max. concentration (Xm, Ym) 273120, 6148861 273120, 6148861
St Kilda (Residential and Adventure Playground)
No. of receptors
n/a
4 4
No. receptors exceeding Project criterion 0 0
Max. concentration (µg/m3) 26.6 26.2
Location of Max. concentration (Xm, Ym) 274522, 6152770 274522, 6152770
24-hour PM10 Project Criterion 50 µg/m3 Note 1: n/a – Not assessed

Project No PS114349 Snapper Point Power Station Project Air Quality Impact Assessment Port Adelaide Energy Pty Ltd
WSP November 2019
Page 49
5.2.4.2 ANNUAL MEAN PM10
A summary of the predicted annual mean concentrations is presented for the applicable scenarios (Scenarios 2 and 3) in Table 5.9, inclusive of the respective background concentration. The results are presented within the context of the annual mean PM10 Project assessment criterion for the relevant modelled receptor locations (i.e. residential only).
Concentration contour plots for each scenario, depicting the distribution of predicted annual mean concentrations throughout the modelled Cartesian grid are presented as Figures A7 (Scenario 2) and A8 (Scenario 3), in Appendix A.
The results demonstrate that the annual mean PM10 Project assessment criterion is not predicted to be exceeded at any of the modelled receptor locations and below the criterion for all scenarios. The background concentration adopted for this assessment was 21.9 µg/m3, which indicates that the contribution of the Project emissions under worst case conditions is relatively negligible.
Table 5.9 Summary of predicted annual mean PM10 concentrations at relevant modelled sensitive receptors
STATISTIC SCENARIO 1 (GAS) SCENARIO 2 (DIESEL) SCENARIO 3 (MIX)
North Haven (Residential)
No. of receptors
n/a
913 913
No. receptors exceeding Project criterion 0 0
Max. concentration (µg/m3) 22.1 22.0
Location of Max. concentration (Xm, Ym) 270646, 6148648 270646, 6148648
Torrens Island (Residential)
No. of receptors
n/a
5 5
No. receptors exceeding Project criterion 0 0
Max. concentration (µg/m3) 22.0 22.0
Location of Max. concentration (Xm, Ym) 273120, 6148861 273120, 6148861
St Kilda (Residential and Adventure Playground)
No. of receptors
n/a
4 4
No. receptors exceeding Project criterion 0 0
Max. concentration (µg/m3) 22.0 21.9
Location of Max. concentration (Xm, Ym) 274294, 6153074 274294, 6153074
Annual Mean PM10 Project Criterion 25 µg/m3 Note 1: n/a – Not assessed

Project No PS114349 Snapper Point Power Station Project Air Quality Impact Assessment Port Adelaide Energy Pty Ltd
WSP November 2019
Page 50
5.2.5 PM2.5
5.2.5.1 24-HOUR PM2.5 AVERAGING PERIOD
A summary of the predicted 24-hour mean maximum concentrations is presented for the applicable scenarios (Scenarios 2 and 3) in Table 5.10, inclusive of the respective background concentration. The results are presented within the context of the 24-hour PM2.5 Project assessment criterion for the relevant modelled receptor locations (i.e. residential only).
Concentration contour plots for each scenario, depicting the distribution of predicted 24-hour mean concentrations throughout the modelled Cartesian grid are presented as Figures A9 and A10 (Appendix A).
The results demonstrate that the 24-hour mean PM2.5 Project assessment criterion is not predicted to be exceeded at any of the modelled receptor locations, with the maximum predicted PM2.5 concentrations below the criterion in all scenarios.
Table 5.10 Summary of predicted 24-hour PM2.5 maximum concentrations at relevant modelled sensitive receptors
STATISTIC SCENARIO 1 (GAS) SCENARIO 2 (DIESEL) SCENARIO 3 (MIX)
North Haven (Residential)
No. of receptors
n/a
913 913
No. receptors exceeding Project criterion 0 0
Max. concentration (µg/m3) 12.3 10.9
Location of Max. concentration (Xm, Ym) 270646, 6148648 270646, 6148648
Torrens Island (Residential)
No. of receptors
n/a
5 5
No. receptors exceeding Project criterion 0 0
Max. concentration (µg/m3) 10.3 9.7
Location of Max. concentration (Xm, Ym) 273120, 6148861 273120, 6148861
St Kilda (Residential and Adventure Playground)
No. of receptors
n/a
4 4
No. receptors exceeding Project criterion 0 0
Max. concentration (µg/m3) 9.7 9.3
Location of Max. concentration (Xm, Ym) 274522, 6152770 274522, 6152770
24-hour PM2.5 Project Criterion 25 µg/m3 Note 1: n/a – Not assessed

Project No PS114349 Snapper Point Power Station Project Air Quality Impact Assessment Port Adelaide Energy Pty Ltd
WSP November 2019
Page 51
5.2.5.2 ANNUAL MEAN PM2.5
A summary of the predicted annual mean concentrations is presented for the applicable scenarios (Scenarios 2 and 3) in Table 5.11, inclusive of the respective background concentration. The results are presented within the context of the annual mean PM2.5 Project assessment criterion for the relevant modelled receptor locations (i.e. residential only).
Concentration contour plots for each scenario, depicting the distribution of predicted annual mean concentrations throughout the modelled Cartesian grid are presented as Figures A11 and A12 (Appendix A).
The results demonstrate that the annual mean PM2.5 Project assessment criterion is not predicted to be exceeded at any of the modelled receptor locations, with the maximum predicted PM2.5 concentrations marginally below the criterion for all scenarios. The background concentration adopted for this assessment was 7.3 µg/m3, which indicates that the contribution of the Project emissions under worst case conditions, is relatively negligible.
Table 5.11 Summary of predicted annual mean PM2.5 concentrations at relevant modelled sensitive receptors
STATISTIC SCENARIO 1 (GAS) SCENARIO 2 (DIESEL) SCENARIO 3 (MIX)
North Haven (Residential)
No. of receptors
n/a
913 913
No. receptors exceeding Project criterion 0 0
Max. concentration (µg/m3) 7.5 7.4
Location of Max. concentration (Xm, Ym) 270646, 6148648 270646, 6148648
Torrens Island (Residential)
No. of receptors
n/a
5 5
No. receptors exceeding Project criterion 0 0
Max. concentration (µg/m3) 7.4 7.4
Location of Max. concentration (Xm, Ym) 273120, 6148861 273120, 6148861
St Kilda (Residential and Adventure Playground)
No. of receptors
n/a
4 4
No. receptors exceeding Project criterion 0 0
Max. concentration (µg/m3) 7.4 7.3
Location of Max. concentration (Xm, Ym) 274294, 6153074 274294, 6153074
Annual Mean PM2.5 Project Criterion 8 µg/m3 Note 1: n/a – Not assessed
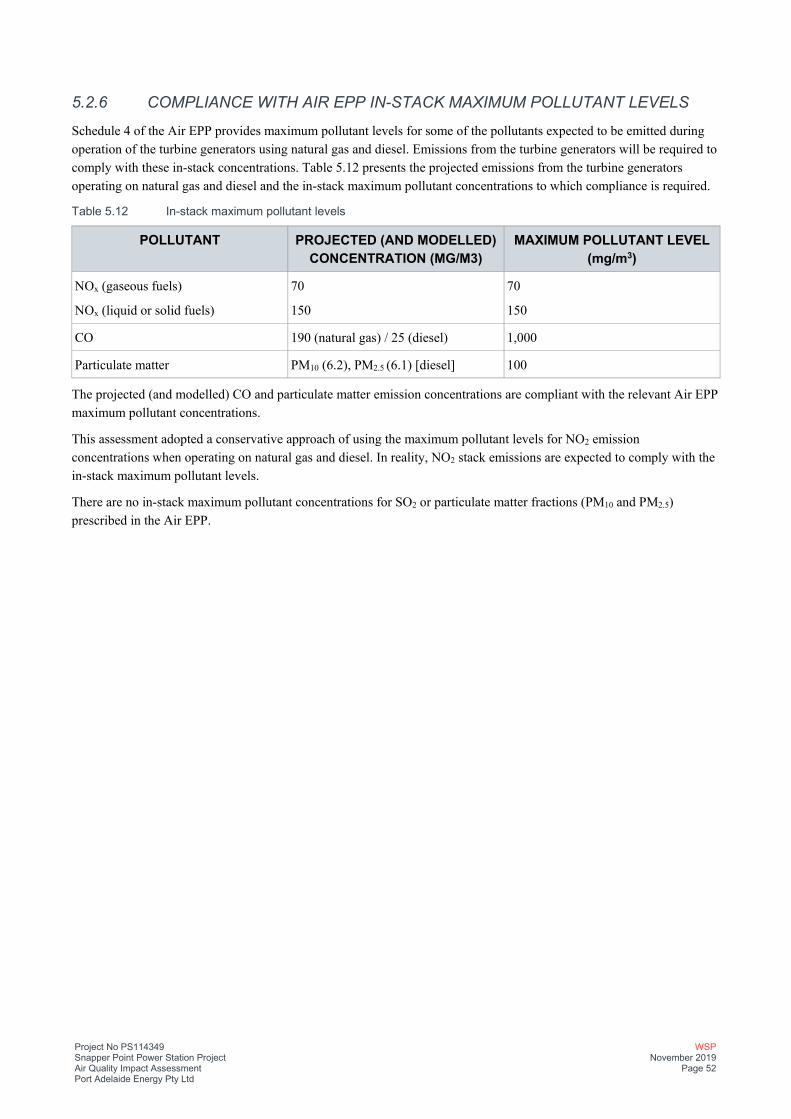
Project No PS114349 Snapper Point Power Station Project Air Quality Impact Assessment Port Adelaide Energy Pty Ltd
WSP November 2019
Page 52
5.2.6 COMPLIANCE WITH AIR EPP IN-STACK MAXIMUM POLLUTANT LEVELS
Schedule 4 of the Air EPP provides maximum pollutant levels for some of the pollutants expected to be emitted during operation of the turbine generators using natural gas and diesel. Emissions from the turbine generators will be required to comply with these in-stack concentrations. Table 5.12 presents the projected emissions from the turbine generators operating on natural gas and diesel and the in-stack maximum pollutant concentrations to which compliance is required.
Table 5.12 In-stack maximum pollutant levels
POLLUTANT PROJECTED (AND MODELLED) CONCENTRATION (MG/M3)
MAXIMUM POLLUTANT LEVEL (mg/m3)
NOx (gaseous fuels)
NOx (liquid or solid fuels)
70
150
70
150
CO 190 (natural gas) / 25 (diesel) 1,000
Particulate matter PM10 (6.2), PM2.5 (6.1) [diesel] 100
The projected (and modelled) CO and particulate matter emission concentrations are compliant with the relevant Air EPP maximum pollutant concentrations.
This assessment adopted a conservative approach of using the maximum pollutant levels for NO2 emission concentrations when operating on natural gas and diesel. In reality, NO2 stack emissions are expected to comply with the in-stack maximum pollutant levels.
There are no in-stack maximum pollutant concentrations for SO2 or particulate matter fractions (PM10 and PM2.5) prescribed in the Air EPP.

Project No PS114349 Snapper Point Power Station Project Air Quality Impact Assessment Port Adelaide Energy Pty Ltd
WSP November 2019
Page 53
6 MANAGEMENT MEASURES
6.1 CONSTRUCTION An air quality management plan (AQMP) will be prepared as part of the Construction Environmental Management Plan (CEMP). The AQMP will incorporate a range of management measures summarised in Table 6.1.
Table 6.1 Proposed management measures
SOURCE MANAGEMENT MEASURES
Site preparation works — Works to be limited to the areas required to construct the works.
On-site traffic movements — Water sprays to be used as required
— Vehicle movements to be strictly limited to designated entry/exit routes and parking area.
— Speed limits to be enforced on unsealed roads and access roads.
— Vehicles transporting spoil or material to/from the site to be covered immediately after loading.
Diesel exhaust emissions — Proper maintenance and tuning of engines in accordance with manufacturers recommendations
— Catalytic converters and diesel particulate filters (if available) to be fitted to all HCVs
— Turning off idling plant and trucks when not in use.
— Appropriate height of discharge above ground level
— Comply with the requirements of the National Environment Protection (Diesel Vehicle Emissions) Measure 2001.
Earthmoving and excavation — Use of water sprays as required
Unpaved access roads and pathways and clearing of access roads
— Use of water sprays or waters as required
— Use of wind breaks
Wind erosion from exposed surfaces — Stabilise all disturbed areas as soon as is practical
Handling and transfer of materials — Use of water sprays or water cart as required.
Project No PS114349 Snapper Point Power Station Project Air Quality Impact Assessment Port Adelaide Energy Pty Ltd
WSP November 2019
Page 54
6.2 OPERATION The dispersion modelling study has identified the potential for exceedances of the 1-hour NO2 criterion, particularly where the proposed turbine generators are fuelled solely by diesel or a combination of diesel and natural gas (see Section 5.2.1.1). However, the potential for exceedances has been analysed within the context of the conservative assumptions included in the modelling, as outlined in Section 4.2.2.3.
In addition, the predicted exceedances of the 1-hour NO2 criterion are primarily within the winter months, specifically June to September of the year, when energy demand is not expected to be as high relative to the summer months. Therefore, the periods of operation for the proposed plant during these months are likely to be intermittent and at less than 100% load, thus reducing the risk of hourly exceedances. For commercial reasons, the Project will only operate between 5% to 10% of the year, during periods of high electricity pool price in the National Electricity Market (NEM) and low energy supply from renewable sources.
Notwithstanding, it is recommended that the proposed turbine generators are operated and managed in an efficient manner with respect to monitoring the required operational load arrangement (i.e. the required number and load of each turbine) during periods of high energy demand. Where operationally feasible, natural gas should remain the sole fuel source to each turbine, thereby reducing the risk of ground level exceedances of the 1-hour NO2 criterion at sensitive receptor locations.
During operation, the turbines should be maintained in accordance with the manufacturers specifications with regular testing and scheduled regular maintenance.
It is a requirement of the Air EPP that emissions during operation of the turbines, using either natural gas or diesel as a fuel should, need to comply with the relevant maximum pollutant levels (stack emissions). The dispersion modelling study reported in this document has adopted the respective Air EPP stack emissions limits for NOx (as NO2) for the proposed turbine generators. In reality, NO2 stack emissions are expected to comply with the in-stack maximum pollutant levels.

Project No PS114349 Snapper Point Power Station Project Air Quality Impact Assessment Port Adelaide Energy Pty Ltd
WSP November 2019
Page 55
7 CONCLUSION WSP was engaged by Nexif Energy to prepare an Air Quality Impact Assessment in support of a Development Application for the proposed Snapper Point Power Station Project.
Potential air quality impacts during construction of the Project were addressed qualitatively. Management measures are proposed to control air emissions and ensure impacts on the receiving environment are minimised.
Atmospheric dispersion modelling was conducted to determine potential impacts during operation of the five turbines for the following three scenarios:
— Scenario 1: Five turbines operation on natural gas only — Scenario 2: Five turbines operating on diesel only — Scenario 3: A combination of operating fuels (3 turbines on diesel and 2 turbines on natural gas).
In each scenario, the emissions contributions from the existing Pelican Point Power Station stacks were included along with appropriately adopted background concentrations, thereby providing a cumulative assessment of local emissions associated with both energy plant.
The dispersion modelling completed for the operation phase has incorporated a series of conservative assumptions, which are detailed in Section 4.2.2.3, but primarily relate to the assumed operational load of each proposed turbine generator, hours of operation, and stack emissions parameters.
Notwithstanding, the outcomes of the study have demonstrated that, with the exception of 1-hour NO2 concentrations, the predicted total ground level concentrations for each criteria pollutant and associated averaging period are predicted to comply with the respective Air EPP and Air NEPM standards.
The modelling study has identified the potential for exceedances of the 1-hour NO2 Air EPP criterion at identified receptor locations, particularly where the proposed turbine generators are fuelled solely by diesel or a combination of diesel and natural gas. The predicted exceedances of the 1-hour NO2 criterion occurred primarily within the winter months, specifically June to September of the year, when energy demand is not expected to be as high relative to the summer months and hence the turbine generators are less likely to operate.
Given the primary fuel source for all proposed turbine generators will be natural gas, with diesel used as an emergency back-up fuel source, the modelled exceedances are considered to be of minor significance on the receiving environment.
The key aim of the Project is to supplement the grid during periods of high energy demand, the proposed Snapper Point Power Station will not operate continuously at 100% load. For commercial reasons, the Project will only operate between 5% to 10% of the year, during periods of high energy demand and low renewable power supply on the grid which are more likely to occur during the warmer months i.e. November to April.
Additionally, natural gas will be the predominant fuel source during periods of operation with diesel only being used as an emergency back-up fuel. Consequently, the potential for exceedances of the 1-hour NO2 standard at all identified sensitive receptors is expected to be substantially reduced relative to the modelled worst case.
To further manage and minimise the potential for ground level 1-hour NO2 exceedances, the proposed turbine generators should be operated and managed in an efficient manner with respect to monitoring the required operational load arrangement (i.e. the required load of each turbine) during periods of high energy demand if operating on diesel and during the winter months. Where operationally feasible, natural gas should remain the sole fuel source to each turbine.
Based on the outcomes of this air quality impact assessment, and accounting for the conservative assumptions and recommended operational management measures, the Project Site is considered suitable for the operation of the proposed Snapper Point Power Station.
Project No PS114349 Snapper Point Power Station Project Air Quality Impact Assessment Port Adelaide Energy Pty Ltd
WSP November 2019
Page 56
8 LIMITATIONS This Report is provided by WSP Australia Pty Limited (WSP) for Nexif Energy (Client) in response to specific instructions from the Client and in accordance with WSP’s proposal (Agreement).
PERMITTED PURPOSE
This Report is provided by WSP for the purpose described in the Agreement and no responsibility is accepted by WSP for the use of the Report in whole or in part, for any other purpose (Permitted Purpose).
QUALIFICATIONS AND ASSUMPTIONS
The services undertaken by WSP in preparing this Report were limited to those specifically detailed in the Report and are subject to the scope, qualifications, assumptions and limitations set out in the Report or otherwise communicated to the Client.
Except as otherwise stated in the Report and to the extent that statements, opinions, facts, conclusion and/or recommendations in the Report (Conclusions) are based in whole or in part on information provided by the Client and other parties identified in the report (Information), those Conclusions are based on assumptions by WSP of the reliability, adequacy, accuracy and completeness of the Information and have not been verified. WSP accepts no responsibility for the Information.
WSP has prepared the Report without regard to any special interest of any person other than the Client when undertaking the services described in the Agreement or in preparing the Report.
USE AND RELIANCE
This Report should be read in its entirety and must not be copied, distributed or referred to in part only. The Report must not be reproduced without the written approval of WSP. WSP will not be responsible for interpretations or conclusions drawn by the reader. This Report (or sections of the Report) should not be used as part of a specification for a Project or for incorporation into any other document without the prior agreement of WSP.
WSP is not (and will not be) obliged to provide an update of this Report to include any event, circumstance, revised Information or any matter coming to WSP’s attention after the date of this Report. Data reported and Conclusions drawn are based solely on information made available to WSP at the time of preparing the Report. The passage of time; unexpected variations in ground conditions; manifestations of latent conditions; or the impact of future events (including (without limitation) changes in policy, legislation, guidelines, scientific knowledge; and changes in interpretation of policy by statutory authorities); may require further investigation or subsequent re-evaluation of the Conclusions.
This Report can only be relied upon for the Permitted Purpose and may not be relied upon for any other purpose. The Report does not purport to recommend or induce a decision to make (or not make) any purchase, disposal, investment, divestment, financial commitment or otherwise. It is the responsibility of the Client to accept (if the Client so chooses) any Conclusions contained within the Report and implement them in an appropriate, suitable and timely manner.
In the absence of express written consent of WSP, no responsibility is accepted by WSP for the use of the Report in whole or in part by any party other than the Client for any purpose whatsoever. Without the express written consent of WSP, any use which a third party makes of this Report or any reliance on (or decisions to be made) based on this Report is at the sole risk of those third parties without recourse to WSP. Third parties should make their own enquiries and obtain independent advice in relation to any matter dealt with or Conclusions expressed in the Report.
DISCLAIMER
No warranty, undertaking or guarantee whether expressed or implied, is made with respect to the data reported or the Conclusions drawn. To the fullest extent permitted at law, WSP, its related bodies corporate and its officers, employees and agents assumes no responsibility and will not be liable to any third party for, or in relation to any losses, damages or expenses (including any indirect, consequential or punitive losses or damages or any amounts for loss of profit, loss of revenue, loss of opportunity to earn profit, loss of production, loss of contract, increased operational costs, loss of business opportunity, site depredation costs, business interruption or economic loss) of any kind whatsoever, suffered on incurred by a third party.
Project No PS114349 Snapper Point Power Station Project Air Quality Impact Assessment Port Adelaide Energy Pty Ltd
WSP November 2019
Page 57
BIBLIOGRAPHY — Australian Government, Department of Environment. (2016). National Environment Protection (Ambient Air
Quality) Measure.
— Hyder Consulting 1998, Proposed Combined Cycle Gas Turbine Power Station, Pelican Point – Environmental Impact Assessment Report’, October 1998.
— NEPC (2003), National Environment Protection Council, National Environment Protection (Ambient Air Quality) Measure, March 2003 (as amended February 2016).
— NEPC (2016), National Environment Protection Council, National Environment Protection (Ambient Air Quality) Measure, as amended, February 2016.
— National Environment Protection (Ambient Air Quality) Measure 2016
— NPI (2008), National Pollutant Inventory (NPI) Emission Estimation Technique Manual for Combustion Engines Version 3.0, June 2008.
— South Australian Government 1993, Environment Protection Act 1993
— South Australian Government 2016, Planning, Development and Infrastructure Act 2016
— SA EPA 2016, Ambient air quality assessment
— SA EPA 2016, Environment Protection (Air Quality) Policy 2016
— SA EPA 2016, Evaluation distances for effective air quality and noise management
— SA EPA 2019, Publications and Data
— SA EPA 2019a, Approach to air quality impact assessment discussed and agreed with SA EPA at a meeting on 5 September 2019
— SA EPA 2019b, Email from SA EPA on 6 November 2019 confirming acceptance of model input parameters
— SEPP(AQM), State Environment Protection Policy (Air Quality Management), Victorian Government Gazette. Melbourne, Victoria, Australia, 2001
— UK Environment Agency 2015, Air Quality Modelling and Assessment Unit guidance note – Conversion Ratios for NOx and NO2, 2015
— WSP 2019, Model Input Parameters Memo Reference: PS114349-AQ-MEM-006, 6 November 2019
— www.bom.gov.au.
— www.npi.gov.au.
— www.saepa.gov.au

CONTOUR PLOTS

Project No PS114349 Snapper Point Power Station Project Air Quality Impact Assessment Port Adelaide Energy Pty Ltd
WSP November 2019
Page A-1
A1 LIST OF FIGURES Figure A1 Predicted maximum 1-hour average NO2 ground level concentrations (µg/m3) for Scenario 1 (Gas)
Figure A2 Predicted maximum 1-hour average NO2 ground level concentrations (µg/m3) for Scenario 2 (Diesel)
Figure A3 Predicted maximum 1-hour average NO2 ground level concentrations (µg/m3) for Scenario 3 (Mix)
Figure A4 Predicted annual mean NO2 ground level concentrations (µg/m3) for Scenario 1 (Gas)
Figure A5 Predicted annual mean NO2 ground level concentrations (µg/m3) for Scenario 2 (Diesel)
Figure A6 Predicted annual mean NO2 ground level concentrations (µg/m3) for Scenario 3 (Mix)
Figure A7 Predicted annual mean PM10 ground level concentrations (µg/m3) for Scenario 2 (Diesel)
Figure A8 Predicted annual mean PM10 ground level concentrations (µg/m3) for Scenario 3 (Mix)
Figure A9 Predicted maximum 24-hour average PM2.5 ground level concentrations (µg/m3) for Scenario 2 (Diesel)
Figure A10 Predicted maximum 24-hour average PM2.5 ground level concentrations (µg/m3) for Scenario 3 (Mix)
Figure A11 Predicted annual mean PM2.5 ground level concentrations (µg/m3) for Scenario 2 (Diesel)
Figure A12 Predicted annual mean PM2.5 ground level concentrations (µg/m3) for Scenario 3 (Mix)

Project No PS114349 Snapper Point Power Station Project Air Quality Impact Assessment Port Adelaide Energy Pty Ltd
WSP November 2019
Page A-2
Figure A1: Predicted maximum 1-hour average NO2 ground level concentrations (µg/m3) for Scenario 1 (Gas)

Project No PS114349 Snapper Point Power Station Project Air Quality Impact Assessment Port Adelaide Energy Pty Ltd
WSP November 2019
Page A-3
Figure A2: Predicted maximum 1-hour average NO2 ground level concentrations (µg/m3) for Scenario 2 (Diesel)

Project No PS114349 Snapper Point Power Station Project Air Quality Impact Assessment Port Adelaide Energy Pty Ltd
WSP November 2019
Page A-4
Figure A3: Predicted maximum 1-hour average NO2 ground level concentrations (µg/m3) for Scenario 3 (Mix)

Project No PS114349 Snapper Point Power Station Project Air Quality Impact Assessment Port Adelaide Energy Pty Ltd
WSP November 2019
Page A-5
Figure A4: Predicted annual mean NO2 ground level concentrations (µg/m3) for Scenario 1 (Gas)

Project No PS114349 Snapper Point Power Station Project Air Quality Impact Assessment Port Adelaide Energy Pty Ltd
WSP November 2019
Page A-6
Figure A5: Predicted annual mean NO2 ground level concentrations (µg/m3) for Scenario 2 (Diesel)

Project No PS114349 Snapper Point Power Station Project Air Quality Impact Assessment Port Adelaide Energy Pty Ltd
WSP November 2019
Page A-7
Figure A6: Predicted annual mean NO2 ground level concentrations (µg/m3) for Scenario 3 (Mix)

Project No PS114349 Snapper Point Power Station Project Air Quality Impact Assessment Port Adelaide Energy Pty Ltd
WSP November 2019
Page A-8
Figure A7: Predicted annual mean PM10 ground level concentrations (µg/m3) for Scenario 2 (Diesel)

Project No PS114349 Snapper Point Power Station Project Air Quality Impact Assessment Port Adelaide Energy Pty Ltd
WSP November 2019
Page A-9
Figure A8: Predicted annual mean PM10 ground level concentrations (µg/m3) for Scenario 3 (Mix)

Project No PS114349 Snapper Point Power Station Project Air Quality Impact Assessment Port Adelaide Energy Pty Ltd
WSP November 2019
Page A-10
Figure A9: Predicted maximum 24-hour average PM2.5 ground level concentrations (µg/m3) for Scenario 2 (Diesel)

Project No PS114349 Snapper Point Power Station Project Air Quality Impact Assessment Port Adelaide Energy Pty Ltd
WSP November 2019
Page A-11
Figure A10: Predicted maximum 24-hour average PM2.5 ground level concentrations (µg/m3) for Scenario 3 (Mix)

Project No PS114349 Snapper Point Power Station Project Air Quality Impact Assessment Port Adelaide Energy Pty Ltd
WSP November 2019
Page A-12
Figure A11: Predicted annual mean PM2.5 ground level concentrations (µg/m3) for Scenario 2 (Diesel)

Project No PS114349 Snapper Point Power Station Project Air Quality Impact Assessment Port Adelaide Energy Pty Ltd
WSP November 2019
Page A-13
Figure A12: Predicted annual mean PM2.5 ground level concentrations (µg/m3) for Scenario 3 (Mix)