snc2d brennan climate change. paleoclimate record ice samples sediment cores pollen records peat...
TRANSCRIPT

SNC2DBrennan
Climate Change

Paleoclimate record
• Ice samples• Sediment cores• Pollen records• Peat Bogs• Fossil records
• Proxies– Use data that
represents the conditions at a time in History

2 Proxies• Pollens in sediments
– finding and dating sediments under lake bottoms.
– Anywhere pollen can be found, it will tell you the plant species that lived around the location at the time the sediments were deposited, thus the temperature range at the time of deposition
• O18/O16 - Observing the year that ice was deposited- O16 is preferentially evaporated from oceans- O18 preferentially rains out- Finding the relative abundance of O18/O16 determines the global temperature of the oceans at that time and thus the global temperature


• Different scales present different data trends


An increasing body of observations gives a collective picture of a warming world and other
changes in the climate system.
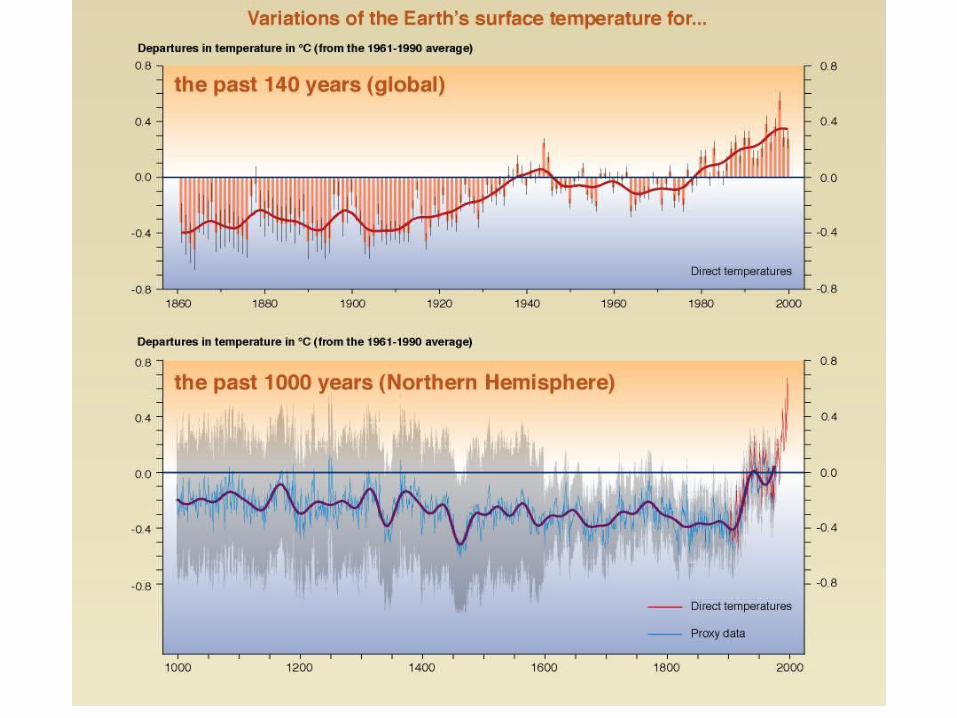
Global-average surface temperature increased by about 0.6 ºC over 20th century
1990s warmest decade and 1998 warmest year in last 1000 years in Northern Hemisphere
Over last 50 years night-time minimum temperatures increased by about 0.2 ºC per decade
10% reduction in snow cover ice since late 1960s Reduction of about two weeks in annual duration of
lake and river ice over 20th century Widespread retreat of mountain glaciers during 20th
century

Northern Hemisphere spring and summer sea-ice
extent decreased by 10-15% since 1950s
40% decline in late summer Arctic sea-ice thickness in recent decades
Global-average sea level has increased by 10-20 cm during 20th century
0.5-1% per decade increase in Northern Hemisphere mid-latitude precipitation during 20th century
2-4% increase in frequency of heavy precipitation events in Northern Hemisphere mid- and high-latitudes over latter half of 20th century

Human activities have changed the composition of the atmosphere since the pre- industrial era

(BP 1950)
Projected levels of atmospheric CO2 during the next 100 years would be higher than at anytime in the last 440,000 yrs

How Fast do we have to act?


Climate Models
Climate models are computer models that take in correlations from observed changes and predict, using a given set of variable, the future outcome.
Using different sets of variables like production of CO2 or natural factors determines the predicted result.
For example, there are many different climate models based on how much CO2 we will be putting into the environment. Lower emissions = Lower impact on climate.
Scenarios and the predicted results are listed next.

Most of the observed warming in the past 50 years is attributable to human activities and models are
CONSERVATIVE

Projected concentrations of CO2 during the 21st century are two to four times the pre-industrial level

Projected Temperatures During the 21st Century Are Significantly Higher Than at Any Time During the Last 1000
Years

Global mean temperature changes

Land areas are projected to warm more than the oceans with the greatest warming at high latitudes
Annual mean temperature change, 2071 to 2100 relative to 1990: Global Average in 2085 = 3.1oC


Global-average temperature and sea level are projected to rise under all scenarios
Global-average surface temperature projected to increase by 1.4 ºC to 5.8 ºC by 2100 Rate of warming likely unprecedented in at least last 10,000 years Land areas will warm more than the global average Global average precipitation will increase over 21st century Very likely to be more intense precipitation events Snow cover and sea-ice extent projected to decrease further Glaciers and icecaps projected to continue widespread retreat Global mean sea-level projected to increase by 9 cm to 88 cm by 2100 Thermal expansion of water also a factor
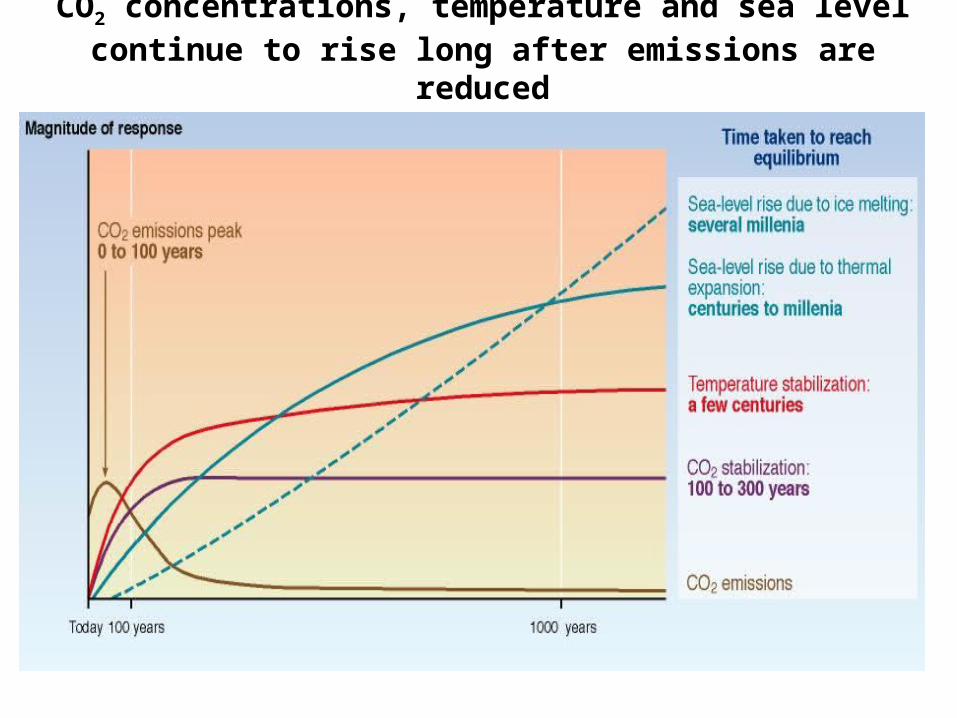
CO2 concentrations, temperature and sea level continue to rise long after emissions are
reduced

More adverse than beneficial impacts on biological and socioeconomic systems are projected

World Population 6,056,528,577
The Challenge: Sustainable Management of an Ever-Changing Planet

Developing countries are the most vulnerable to climate change
• Impacts are worse - already more flood and drought prone and a large share of the economy is in climate sensitive sectors
• Lower capacity to adapt because of a lack of financial, institutional and technological capacity and access to knowledge
• Climate change is likely to impact disproportionately upon the poorest countries and the poorest persons within countries, exacerbating inequities in health status and access to adequate food, clean water and other resources.
• Net market sector effects are expected to be negative in most developing countries