snohomish county economic report - everett, wa december 2015_final.… · we believe that the...
TRANSCRIPT

Snohomish CountyEconomic ReportDecember 2015
Coastal Community Bank Corporate Headquarters5415 Evergreen Way - Everett, WA 98203

1 | P a g e
Summary:
Overall, the economic environment in Snohomish County is one of the strongest in the Country and is expected to continue to flourish over the next 12 to 24 months. The employment market is favorable as the unemployment rate was 5.0% at the end of the fourth quarter in Snohomish County compared to 5.0% nationally and 5.9% in Washington State. In addition, housing prices are rising closer to pre-recession highs and migration continues to be strong as demand for housing in the area is growing. Consumer spending is also picking up in Snohomish County as taxable retail sales have increased year-over-year even during a time in which national consumer spending is flat and the national savings rate is at 5.5 percent, a three year high. We believe that the outlook for the local economy will be stable over the next couple of years due to the strength of technology, the eight year contract that was signed by Boeing’s Machinists union in early 2014 for the 777x project, and the carbon fiber wing plant.
The following points summarize a few of the highlights in the report:
Employment
• Just over 13% of total employment in Snohomish County is concentrated in Boeing and anadditional 161,000 jobs in the state are indirectly supported by Boeing. While this concentrationis high, it is mitigated by Boeing’s decision to locate their new factory for building the wings ofits forthcoming 777X jet in Everett where it currently builds 777 jetliners. The first 777X jet has atarget date of 2020 and Boeing agreed to build the plant after Boeing’s 31,000 machinistsratified an eight year extension to their labor contract in early January 2014.
• In December 2015, Business Insider ranked the State of Washington’s economy the best in theentire country (up from 6th best in the third quarter of 2015). The annualized GDP growth ratefor the second quarter of 2015 in the state of Washington was 8.0% and the November 2015average weekly wage of $1,073 was the second highest in the country. Change in housing prices,change in non-farm payroll jobs, the unemployment rate, state GDP per capita, average weeklywage, and state government surplus or deficit were the variables considered in their rankings.
• Business Insider ranked the city of Seattle’s economy as the fourteenth best in the country. Theunemployment rate, GDP per capita, change in housing prices, average weekly wages, and thepoverty rate were the variables considered in their analysis.
Boeing
• Boeing’s annual net orders have increased by 262.08%, from 240 during the recession in 2009 to869 in 2015. There is an estimated 4,754 planes that are in backlog since 2005. If Boeing were todeliver 762 planes a year (their total for 2015) and orders were held constant, it would take 6.2years for all of the orders since 2005 to be delivered. Therefore, it appears that the localeconomy will continue to benefit for years to come. The construction of the carbon fiberreinforced polymer wing plant is currently underway in Everett. Boeing is investing over $1Billion in the facility which is a sign of their commitment to the local region.

2 | P a g e
Housing
• Snohomish County housing prices are nearing pre-crisis level as the current median home priceis $344,300 compared to $350,000 in 2007.
• Increasing interest rates have the potential to hinder home affordability. If interest ratesincrease by 1%, a household’s required annual gross income will have to increase by $7,890 or12.38% from $63,723 to $71,614 in order to afford the median home list price of $344,300. Ifinterest rates increase by 3%, a household’s required annual gross income will have to increaseby $24,940, or 39.14%, from $63,723 to $88,663 in order to afford the median home list price of$344,300. If interest rates increase, housing prices will likely stabilize and could even decline ifthe rate increase is large enough. This could also cause the volume of housing sales to declineand inventory to increase.
Vacancy Rates
• Office vacancy rates in Snohomish County have increased from 8.67% in third quarter of 2014 to8.91% in the third quarter of 2015. Furthermore, industrial vacancy rates in Snohomish Countyhave decreased from 6.24% in the third quarter of 2014 to 5.85% in the third quarter of 2015.
Employment: The employment market in Snohomish County is strong. The following chart and graph compares the unemployment rate of Snohomish County, Washington State, and the United States.
Snohomish County Washington State U.S.1Q12 8.3% 8.9% 8.2%2Q12 8.4% 8.3% 8.2%3Q12 7.1% 7.4% 7.8%4Q12 6.8% 7.6% 7.9%1Q13 5.7% 7.5% 7.5%2Q13 5.7% 7.0% 7.5%3Q13 5.9% 6.3% 7.2%4Q13 5.3% 6.5% 6.7%1Q14 6.0% 6.9% 6.7%2Q14 5.1% 5.6% 6.2%3Q14 5.1% 5.4% 5.8%4Q14 4.6% 6.3% 5.6%1Q15 4.4% 5.7% 5.5%2Q15 4.3% 5.3% 5.3%3Q15 4.1% 4.8% 5.1%4Q15 5.0% 5.9% 5.0%
Unemployment Rate
s://fortress.wa.gov/esd/employmentdata/reports-publications/regional-reports/labor-are

3 | P a g e
The unemployment rate in Snohomish County has increased from 4.1% in September 2015 to 5.0% in December 2015. Over the same time period, the unemployment rate for the State of Washington increased from 4.8% to 5.9% and the unemployment rate in the United States decreased from 5.1% to 5.0%. Although the unemployment rate in Snohomish County increased from 4.1% in September 2015 to 5.0% in December 2015, the number of jobs in the County increased by 3,700 or 1.3% over the same period. As a result, the increase in the Snohomish County unemployment rate is likely due to more people entering the workforce during the Holiday season rather than a reduction in jobs. Despite the increase, the 5.0% unemployment rate in Snohomish County is 0.90% below the State of Washington and equal to the overall U.S. rate. This is further evidence that the local economy continues to show strength. These trends illustrate the health of the economy which should continue to foster opportunities.
Snohomish County added several thousand jobs over the past two years, particularly in the service providing sector, illustrating the overall strength the region’s employment market. The following is a chart illustrating the level of jobs in Snohomish County since the fourth quarter of 2012:

4 | P a g e
Service providing jobs have increased by a count of 16,900, or 9.10%, from 185,800 in December 2012 to 202,700 in December 2015. The sub-categories that increased the most over that time period are education & health services (+18.47%), financial activities (+14.04%), and retail (+11.87%). In addition, overall goods producing jobs in Snohomish County have increased by a count of 1,900, or 2.33% from 81,500 in December 2012 to 83,400 in December 2015 and overall non-farm jobs in Snohomish County have increased by a count of 18,800, or 7.03%, from 267,300 in December 2012 to 286,100 in December 2015. Overall, service providing jobs have really been the driver in reducing the unemployment rate for Snohomish County and trends suggest that will continue to be the case moving forward.
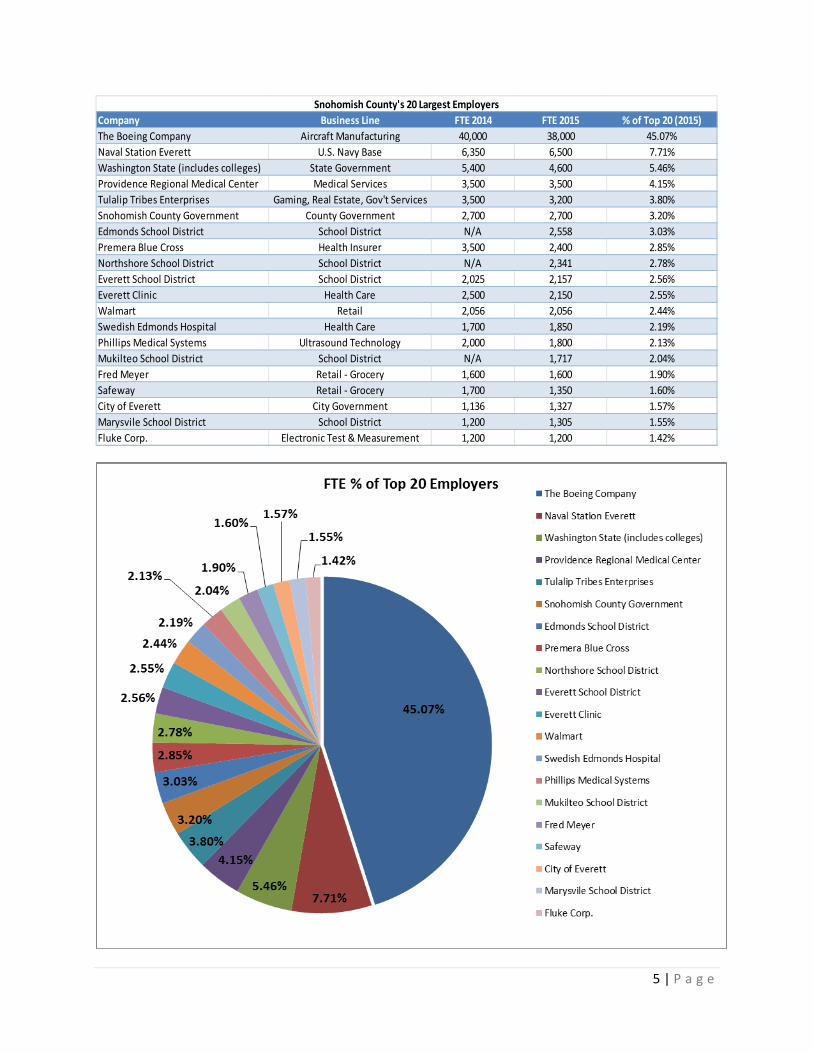
Below is a chart and graph that shows the 20 largest employers in Snohomish County based on 2014 Full-Time Employees (FTE):
Industry 4Q12 1Q13 2Q13 3Q13 4Q13 1Q14 2Q14 3Q14 4Q14 1Q15 2Q15 3Q15 4Q15Non-Farm 267,300 268,600 269,900 268,300 272,800 270,300 270,100 272,000 274,000 275,300 279,100 282,400 286,100Goods Producing 81,500 81,600 81,100 82,600 81,900 79,400 79,000 80,600 79,300 80,000 81,500 84,400 83,400Manufacturing 65,500 65,400 64,800 64,300 64,100 63,300 63,600 61,800 62,400 62,500 62,300 63,200 63,600Services Providing 185,800 187,000 188,800 185,700 190,900 190,900 191,100 191,400 194,700 195,300 197,600 198,000 202,700Trade, Transporation, Util ities 45,900 43,300 44,200 45,000 47,500 44,400 44,600 45,400 46,300 45,500 46,000 47,300 50,700Wholesale 8,100 8,000 8,000 8,300 8,400 8,300 7,900 8,000 8,100 8,200 7,900 8,000 8,200Retail 33,700 31,400 32,200 32,600 34,700 31,700 32,700 33,300 33,800 32,900 33,700 34,900 37,700Information 5,700 5,700 5,600 5,600 5,600 5,600 5,800 5,900 5,700 5,700 5,700 5,600 5,700Financial Activities 11,400 11,700 12,600 11,900 12,200 12,200 12,200 12,800 12,700 12,700 12,400 12,500 13,000Professional & Business 23,300 23,300 23,400 24,000 24,000 23,400 23,300 23,800 23,600 24,000 24,400 25,200 25,300Education & Health Services 28,700 32,100 31,800 28,400 29,600 32,900 32,400 32,800 33,600 33,900 34,100 33,700 34,000Leisure & Hospitality 23,300 23,000 24,000 24,100 23,800 24,100 24,800 23,900 24,000 24,500 26,100 25,500 24,900Government 37,400 37,900 37,400 37,500 37,900 38,000 37,900 36,800 38,700 38,900 38,700 38,100 39,000
Data Source: https://fortress.wa.gov/esd/employmentdata/reports-publications/regional-reports/labor-area-summaries
5 | P a g e
Company Business Line FTE 2014 FTE 2015 % of Top 20 (2015)The Boeing Company Aircraft Manufacturing 40,000 38,000 45.07%Naval Station Everett U.S. Navy Base 6,350 6,500 7.71%Washington State (includes colleges) State Government 5,400 4,600 5.46%Providence Regional Medical Center Medical Services 3,500 3,500 4.15%Tulalip Tribes Enterprises Gaming, Real Estate, Gov't Services 3,500 3,200 3.80%Snohomish County Government County Government 2,700 2,700 3.20%Edmonds School District School District N/A 2,558 3.03%Premera Blue Cross Health Insurer 3,500 2,400 2.85%Northshore School District School District N/A 2,341 2.78%Everett School District School District 2,025 2,157 2.56%Everett Clinic Health Care 2,500 2,150 2.55%Walmart Retail 2,056 2,056 2.44%Swedish Edmonds Hospital Health Care 1,700 1,850 2.19%Phillips Medical Systems Ultrasound Technology 2,000 1,800 2.13%Mukilteo School District School District N/A 1,717 2.04%Fred Meyer Retail - Grocery 1,600 1,600 1.90%Safeway Retail - Grocery 1,700 1,350 1.60%City of Everett City Government 1,136 1,327 1.57%Marysvile School District School District 1,200 1,305 1.55%Fluke Corp. Electronic Test & Measurement 1,200 1,200 1.42%
Snohomish County's 20 Largest Employers

6 | P a g e
The 20 largest employers in Snohomish County account for 84,311 or 29.47% of total full-time jobs in the market. Furthermore, there is a large concentration among the 20 largest employers as Boeing accounts for 38,000 or 45.07% of the aforementioned 84,311 jobs. In fact, the Naval Station Everett is the second largest employer with 6,500 jobs which is 31,500 or 82.89% less jobs than Boeing. Snohomish County relies heavily on job creation from the healthcare industry as five of the top 20 employers provide healthcare services, totaling 13.88% of all jobs in the top 20. Furthermore, jobs in health services have increased by 5,300, or 18.47% from 28,700 in December 2012 to 34,000 in December 2015.
Another positive sign for the employment environment in Snohomish County is the growth in traffic that the Port of Everett is experiencing. A January 2016 article in The Herald Business Journal explained that the Port of Everett docked 195 cargo ships, moving 422,488 tons of goods through the seaport in 2015. The 195 cargo ships was the highest number of ships since 2000. The article also states that Port officials expect traffic to drop slightly by about 4 percent in 2016, mainly due to lower prices for commodities which is considered a niche business for the Port of Everett. Despite the forecasted reduction in traffic, the Port commissioners approved a $78 million budget for 2016 that includes $18.5 million in projects to help the port handle bigger cargo ships which have grown steadily since the 1950s. The expansion to the port should allow the Port of Everett to continue its growth in the future.
Below is a chart and graph illustrating Boeing’s employment trend since 2005:
2005 2006 2007 2008 2009 2010 2011 2012 2013 2014 2015Snohomish County 23,000 N/A N/A N/A 32,000 N/A 39,000 39,000 39,000 40,000 38,000Washington 62,103 68,170 74,160 76,417 72,352 73,617 81,978 86,480 81,939 80,758 79,238Total Company 153,309 154,031 159,313 162,191 157,073 160,537 171,715 174,429 168,421 165,529 163,070
Boeing Employment
Source: http://www.boeing.com/commercial/#/orders-deliveries

7 | P a g e
As the chart illustrates, Boeing has created several thousand jobs in Snohomish County since 2005. In fact, Boeing employment in Snohomish County has increased by 15,000 jobs, or 65.22%, from 23,000 jobs in 2005 to 38,000 in December 2015. Nearly half of Boeing’s total workforce is located in the State of Washington. Boeing employment in the state of Washington has increased by 17,135 jobs, or 27.59%, from 62,103 jobs in 2005 to 79,238 jobs in December 2015. Of the approximately 286,100 non-farm jobs in Snohomish County, Boeing accounts for about 38,000 or 13.28% of the total jobs. While this concentration is high, it is mitigated by Boeing’s decision to locate their new factory for building the wings of its forthcoming 777X jet in Everett where it currently builds 777 jetliners. The first 777X jet has a target date of 2020 and Boeing agreed to build the plant after Boeing’s 31,000 machinists ratified an eight year extension to their labor contract in early January 2014. Boeing is also having a positive impact on the local economy in the sense that their Everett expansion is drawing in supply and support companies, which is absorbing available space and increasing building. John Monroe, the chief operations officer for Economic Alliance Snohomish County, in a December article published in the Puget Sound Business Journal said “the Boeing expansion solidified the future for the next 15 or 20 years. People saw the Boeing Co. make a renewed commitment to the area, and that encourages developers to do a commitment and want to do growth here.” The article in the Puget Sound Business Journal went on to say that several aerospace companies have moved to the area already and many more that need between 15,000 and 100,000 square feet have been searching for real estate to either purchase or lease in order to support Boeing’s business ventures. Furthermore, according to Boeing’s website, they work with 1,943 businesses in Washington and have purchased $5.7 billion from suppliers and vendors in the state. As a result, Boeing estimates that they support an additional 161,000 jobs in the state of Washington indirectly.
As illustrated in the chart below, Boeing has recovered from the most recent recession as demonstrated by an increase in net orders and deliveries since 2010:
2005 2006 2007 2008 2009 2010 2011 2012 2013 2014 2015Net Orders 959 902 1,140 573 240 507 860 1,306 1,527 1,529 869Deliveries 290 398 441 375 481 462 477 601 648 723 762Backlog 669 1,173 1,872 2,070 1,829 1,874 2,257 2,962 3,841 4,647 4,754
Source: http://www.boeing.com/commercial/#/orders-deliveries
Boeing

8 | P a g e
Annual net orders have increased by 262.08%, from 240 during the recession in 2009 to 869 in 2015. However, net orders have decreased by 660, or 43.17%, from 1,529 in 2014 to 869 in 2015. Furthermore, their 2015 deliveries total 762, which is an increase of 39 planes, or 5.39%, from the 723 planes that Boeing delivered in 2014. In 2015, Boeing received 869 orders and delivered 762 planes, resulting in a backlog for 2015 of 107 planes. The backlog line in the chart above was calculated by taking the difference between the net orders and deliveries in each year and adding them to create a cumulative total. There is an estimated 4,754 planes that are in backlog since 2005. If Boeing were to deliver 762 planes a year (equals 2015 deliveries) and orders were held constant, it would take 6.2 years for all of the orders since 2005 to be delivered. Therefore, it appears that the local economy is well positioned for years to come.
A January 28, 2016 article from USA Today stated that Boeing is planning on boosting the production of their popular 737 jetliners from the current level of 42 per month to a record level of 57 airplanes per month in 2019. The 737 jetliners are produced at Boeing’s Renton, WA plant which should increase the number of jobs at that facility. Boeing employees that are currently commuting to the Everett plant may migrate to the Renton plant as production ramps up in the coming three years. At the same time, the USA Today article announced that Boeing plans to scale back the production of its 777 jetliners which are produced in the Everett plant. However, the scale back should not significantly impact employment in Snohomish County because the production rate of the 777 jetliners will only be reduced from the current level of 8.3 airplanes per month to 7 airplanes per month in 2017. In the article, Boeing did admit that the reduction in its 777 jetliners production will come with job cuts, but did not specify how many. Boeing’s main reason for the decline in the production rate is they are struggling to transition between the current 777 jetliner and the next-generation 777X which is due for delivery in 2020 and also produced in the Everett plant.

9 | P a g e
Boeing continues attain high valued orders from major airlines. In December 2015, Boeing landed a $10 billion order from China Southern Airlines Co., Asia’s largest carrier by passenger volume. A January 12, 2016 article in the Seattle Times, explained how Boeing still has a strong hold on the aerospace industry over their main rival Airbus. In 2015, Boeing built 762 jets valued at approximately $62 billion while Airbus managed to build 635 jets valued at approximately $42 billion. With Boeing’s new 777X jetliner which has a higher profit margin, Boeing is expected to continue holding the lead position in the industry for the foreseeable future.
Housing Market: The following graphs and charts will display some of the residential mortgage data in Snohomish County:
1Q13 2Q13 3Q13 4Q13 1Q14 2Q14 3Q14 4Q14 1Q15 2Q15 3Q15 4Q15Listings 1,470 2,030 2,666 2,172 2,105 2,395 2,990 2,001 1,780 2,129 2,425 1,735Pending 1,576 1,488 1,150 835 1,481 992 1,328 956 1,938 1,777 1,501 1,307Closed 932 1,159 1,032 871 949 955 1,057 920 1,075 1,315 1,290 973Median Home Price $269,950 $284,900 $284,950 $290,000 $295,000 $313,375 $310,000 $318,250 $320,000 $331,100 $333,375 $344,300
Snohomish County - Housing Data
Data Source: http://www.zillow.com/snohomish-county-wa/home-values/

10 | P a g e
The median home price in Snohomish County is $344,300 as of December 2015. This is up by $26,050 or 8.19% compared to December 2014. In addition, the median home price has increased by approximately $89,325, or 35.03%, from $254,975 in December of 2012 to $344,300 in December 2015. The red trend line in the median home price graph above represents a 3% annual increase in the beginning median home price of $247,000 in 2005. As the trend line shows, if there was a 3% increase every year since 2005, the median home price would be about $342,571. Thus, the average home price in Snohomish County of $344,300 for December is slightly above this figure. As a result, home prices may start to become too expensive for the median income family in Snohomish County unless wages start to increase at a pace that is equal to or greater than the median home price increase. In addition, according to Zillow.com, the average days a home is on the market decreased by 35.85% from 106 days in December 2012 to 78 days in December 2015. According, to an article in The Herald Business Journal, OB Jacobi, president of Windermere Real Estate said “We are still very clearly in the midst of a seller’s market and unless we see a significant increase in listings, it will remain that way for the foreseeable future.” Home listings in Snohomish County have decreased year-over-year by a count of 266, or 13.29%, from 2,001 in December 2014 to 1,735 in December 2015. Based on this information, it appears that the market will remain a “seller’s market” as the average days a home is on the market will continue to remain very low and the average home price may continue to rise.
The percentage of homes in the Seattle Metropolitan Area that have negative equity have also declined significantly over the past three years.
1Q12 2Q12 3Q12 4Q12 2Q13 3Q13 4Q13 2Q14 3Q14 4Q14 1Q15 2Q15 3Q15U.S. 31% 31% 28% 28% 24% 21% 19% 17% 17% 17% 15% 14% 13%Seattle 40% 38% 34% 34% 28% 22% 20% 17% 16% 16% 15% 12% 10%
Percentage of Homes with Negative Equity

11 | P a g e
The data indicates that Seattle residents have seen an improvement in the equity position of their homes as the housing market continues to gain steam. As of the third quarter of 2015, just 10.0% of homes in Seattle have negative equity (down, from 12% in the second quarter of 2015) which is less than the U.S. average of 13%. In addition, the percentage of homes with negative equity in Seattle has declined from a recent high of 39.6% in the first quarter of 2012 to 10.0% in the third quarter of 2015. Based on the improving trend, one would expect that negative equity in Seattle will continue to fall in the fourth quarter of 2015 and into 2016.
Housing Affordability Increasing interest rates can have a major impact on home affordability. Below is an analysis that shows the impact that increasing rates may have on home affordability based on the median home price of $344,300 in Snohomish County for December 2015:
Current Rate (4.08%) +100bps +200bps +300bpsMedian Sale Price (December 2015) - Zillow.com $344,300 $344,300 $344,300 $344,30020% Down Payment $68,860 $68,860 $68,860 $68,860Financing Required $275,440 $275,440 $275,440 $275,440Monthly Mortgage Payment $1,327.57 $1,491.95 $1,665.42 $1,847.15Annual Payment $15,930.82 $17,903.38 $19,985.01 $22,165.75Required Annual Gross Income (25% Dedicated to Mortgage Payment) $63,723.28 $71,613.53 $79,940.05 $88,663.02

12 | P a g e
The black trend line represents the percentage of households that can afford the median price home ($344,300) when interest rates increase. The general rule suggests that a 1% increase in interest rates will lead to a 10% decline in home affordability. If interest rates increase 1%, a household’s required annual gross income will have to increase by $7,890, or 12.38%, from $63,723 to $71,614 in order to afford the median home price of $344,300. If interest rates increase by 3%, a household’s required annual gross income will have to increase by $24,940, or 39.14%, from $63,723 to $88,663 in order to afford the median home list price of $344,300. Furthermore, based on income brackets in Snohomish County from the U.S. Census Bureau, it is estimated that approximately 55.0% of households can afford the median home price of $344,300 based on the analysis above. However, if rates go up 3%, then only 45.0% of households will be able to afford the median home price holding everything else constant. Builders are continuing their search for available land which is becoming harder and harder find, driving up prices and reducing affordability. If rates rise, income continues to increase at a low rate, and the supply of land remains tight, housing prices may begin to stabilize and possibly decline at some point in the future.
Other Factors:
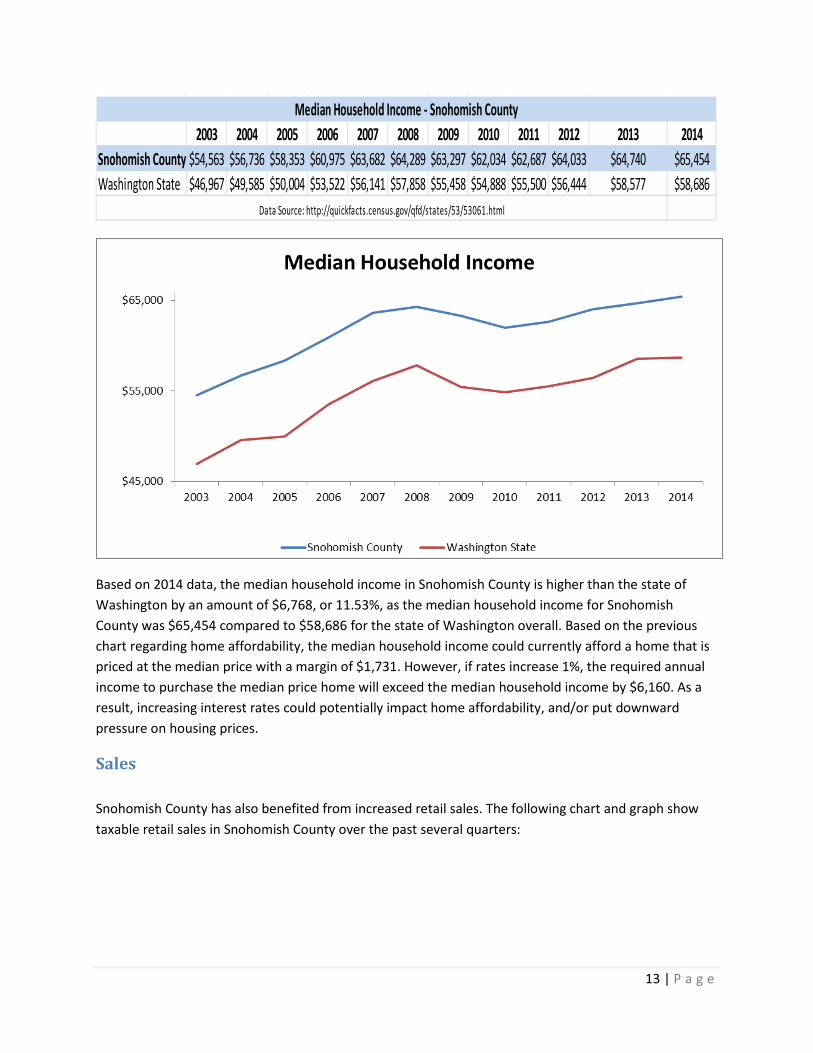
Median household income in Snohomish County has been relatively stable for the past several years. Below is a chart and graph that illustrates the trend in median household income for the county over the past ten years:
13 | P a g e
Based on 2014 data, the median household income in Snohomish County is higher than the state of Washington by an amount of $6,768, or 11.53%, as the median household income for Snohomish County was $65,454 compared to $58,686 for the state of Washington overall. Based on the previous chart regarding home affordability, the median household income could currently afford a home that is priced at the median price with a margin of $1,731. However, if rates increase 1%, the required annual income to purchase the median price home will exceed the median household income by $6,160. As a result, increasing interest rates could potentially impact home affordability, and/or put downward pressure on housing prices.
Sales
Snohomish County has also benefited from increased retail sales. The following chart and graph show taxable retail sales in Snohomish County over the past several quarters:
2003 2004 2005 2006 2007 2008 2009 2010 2011 2012 2013 2014Snohomish County $54,563 $56,736 $58,353 $60,975 $63,682 $64,289 $63,297 $62,034 $62,687 $64,033 $64,740 $65,454Washington State $46,967 $49,585 $50,004 $53,522 $56,141 $57,858 $55,458 $54,888 $55,500 $56,444 $58,577 $58,686
Data Source: http://quickfacts.census.gov/qfd/states/53/53061.html
Median Household Income - Snohomish County

14 | P a g e
Taxable retail sales over a rolling 12-months increased by $268,940,038 or 9.35% between the second quarter of 2014 and the second quarter of 2015. It appears that spending in the County is picking up and will continue to show improvement during the remainder of 2015 and into 2016 based on the current trend.
City 2Q13 3Q13 4Q13 1Q14 2Q14 3Q14 4Q14 1Q15 2Q15Arlington $95,732,412 $97,658,372 $96,015,984 $86,558,263 $96,410,233 $101,127,245 $101,033,500 $92,887,884 $106,536,833Bothell $94,961,957 $115,637,753 $112,937,054 $99,761,751 $107,101,677 $107,101,677 $120,856,638 $101,091,135 $117,206,991Brier $5,187,604 $6,240,369 $7,611,014 $5,848,880 $5,657,053 $6,880,787 $8,944,279 $6,403,117 $6,784,943Darrington $2,532,768 $3,143,442 $3,255,945 $2,574,562 $3,450,760 $3,211,799 $3,138,429 $2,513,819 $3,056,699Edmonds $148,768,158 $162,544,064 $168,118,262 $147,756,655 $160,179,351 $178,246,163 $187,393,505 $168,966,713 $199,351,137Everett $600,196,901 $629,668,775 $642,087,091 $542,565,229 $593,011,959 $620,269,494 $685,516,451 $609,528,299 $672,435,202Gold Bar $2,784,252 $3,150,271 $3,007,096 $2,800,716 $3,015,834 $2,998,843 $3,306,616 $2,864,156 $2,942,527Granite Falls $10,058,763 $10,661,863 $9,727,294 $8,618,269 $9,496,786 $11,326,832 $10,194,380 $9,447,311 $10,528,527Index $441,065 $313,124 $403,235 $213,124 $310,685 $380,741 $362,796 $276,854 $223,027Lake Stevens $59,152,773 $63,052,754 $66,463,956 $57,686,245 $64,716,307 $67,456,593 $70,198,716 $64,469,278 $72,764,892Lynnwood $502,648,411 $536,782,734 $572,776,433 $477,418,528 $518,601,012 $554,278,337 $611,212,289 $497,578,108 $556,389,488Marysville $194,423,561 $207,708,496 $233,236,748 $203,136,861 $221,137,671 $228,128,234 $246,320,089 $215,895,853 $241,979,690Mill Creek $61,940,742 $65,854,947 $66,836,890 $58,251,719 $69,665,009 $69,330,207 $69,659,942 $62,307,541 $72,162,588Monroe $104,285,756 $103,564,873 $102,297,859 $93,051,026 $108,625,583 $108,669,416 $114,766,624 $105,302,997 $119,622,757Moutlake Terrace $42,733,982 $47,706,768 $56,383,932 $53,799,130 $47,278,942 $49,101,143 $54,429,090 $49,814,394 $49,989,661Mukilteo $57,474,423 $64,689,955 $58,899,809 $53,080,176 $64,633,964 $68,031,845 $66,168,965 $60,594,584 $69,461,881Snohomish (City) $95,779,031 $98,022,281 $102,575,839 $81,383,355 $96,266,841 $100,396,040 $104,491,685 $93,208,893 $107,796,867Stanwood $31,352,709 $32,195,217 $33,259,899 $28,124,321 $31,349,534 $31,349,534 $34,290,109 $31,810,449 $34,283,807Sultan $6,879,041 $7,667,841 $8,241,572 $8,437,058 $9,154,492 $9,061,045 $9,949,139 $9,133,538 $9,883,969Woodway $6,915,962 $6,368,723 $6,273,185 $4,239,221 $4,286,971 $3,606,631 $4,554,529 $3,247,781 $3,374,671Unincorporated $593,081,186 $677,719,644 $665,382,070 $564,236,618 $662,279,026 $727,165,475 $671,451,330 $579,760,238 $688,793,571Total $2,717,331,457 $2,940,352,266 $3,015,791,167 $2,579,541,707 $2,876,629,690 $3,048,118,081 $3,178,239,101 $2,767,102,942 $3,145,569,728
Rolling 12-Months Taxable Retail Sales in Snohomish County
Data Source: https://www.economicalliancesc.org/about-the-region/business-climate/#economic-indicators

15 | P a g e
Although the data above suggests that Snohomish County has increased their spending over the past several years, the national consumer savings rate is at a 3-year high and consumer spending is flat on a national level. A February 2016 article in The Herald Business Journal explains that U.S. consumers kept their spending flat in December 2015 and instead boosted their savings rate to 5.5 percent which is the highest level since December 2012. The article suggests that consumers were extremely cautious in the final three months of 2015 which slowed the overall U.S. economic growth rate to a meager 0.7 percent in the fourth quarter of 2015. In the article, Jennifer Lee, a senior economist at BMO Capital Markets, expects that an improving national jobs market will fuel spending momentum and help push economic growth back above 2 percent in the first quarter of 2016. It is also important to note that inflation fell by 0.1 percent in December 2015 mainly due the continued reduction in energy prices. The inflation index was at 0.6 percent in December 2015, the largest 12-month gain since December 2014, but still well below the Federal Reserve’s 2 percent target level for inflation. Based on weaknesses in the U.S. and global economies, a lack of inflation pressure and the recent turbulence in financial markets, many economists believe that the Fed will move slowly when it comes to rate increases. According to the article in The Herald Business Journal, economists believe that the Fed will have no more than two rate hikes in 2016.
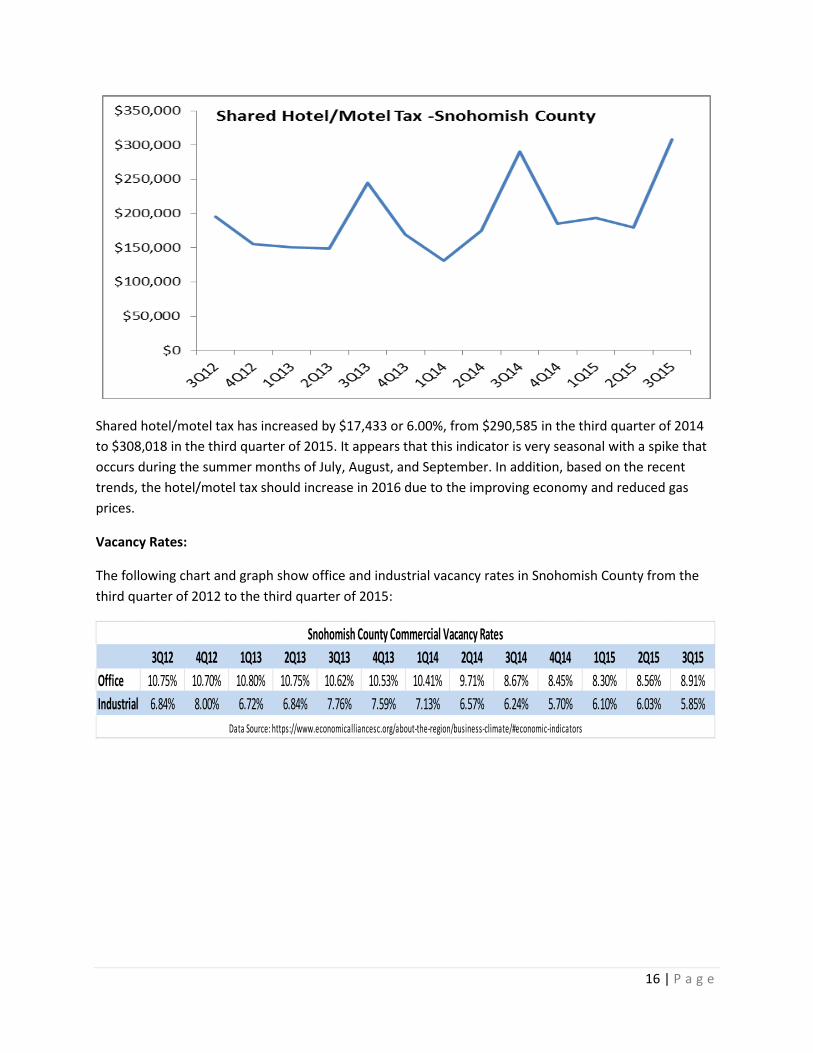
The following chart and graph will highlight shared hotel/motel tax in Snohomish County since the first quarter of 2012 which is also trending in a positive direction:
City 3Q12 4Q12 1Q13 2Q13 3Q13 4Q13 1Q14 2Q14 3Q14 4Q14 1Q15 2Q15 3Q15Arlington $7,757 $5,738 $4,313 $6,000 $9,182 $6,649 $4,875 $7,809 $13,965 $10,016 $6,830 $9,562 $17,592Bothell $26,609 $19,300 $16,349 $18,083 $29,756 $21,151 $16,420 $20,867 $34,802 $22,706 $18,388 $21,817 $35,822Edmonds $9,529 $6,362 $5,114 $5,546 $10,537 $7,404 $5,705 $6,186 $11,504 $7,704 $6,294 $6,998 $12,990Everett $37,332 $24,127 $29,683 $24,586 $39,410 $28,047 $21,951 $28,207 $46,207 $31,324 $23,885 $28,520 $60,983Lynnwood $44,539 $46,675 $39,002 $44,908 $73,854 $50,489 $31,611 $52,189 $94,154 $55,349 $92,690 $57,796 $90,258Marysville $8,420 $6,673 $4,711 $3,975 $9,426 $7,856 $6,295 $7,069 $9,500 $7,904 $5,842 $6,785 $10,550Monroe $6,331 $3,929 $2,133 $4,077 $6,961 $5,079 $3,665 $4,661 $7,989 $5,926 $3,353 $4,295 $9,184Mukilteo $21,435 $16,720 $15,823 $12,097 $25,225 $18,401 $14,817 $18,118 $28,035 $18,918 $16,206 $17,228 $30,770Unclassified $33,625 $25,586 $33,418 $29,296 $40,578 $24,519 $25,447 $30,085 $44,429 $25,194 $20,427 $26,236 $39,869Total $195,577 $155,110 $150,546 $148,568 $244,929 $169,595 $130,786 $175,191 $290,585 $185,041 $193,915 $179,237 $308,018
Shared Hotel/Motel Tax - Snohomish County
16 | P a g e
Shared hotel/motel tax has increased by $17,433 or 6.00%, from $290,585 in the third quarter of 2014 to $308,018 in the third quarter of 2015. It appears that this indicator is very seasonal with a spike that occurs during the summer months of July, August, and September. In addition, based on the recent trends, the hotel/motel tax should increase in 2016 due to the improving economy and reduced gas prices.
Vacancy Rates:
The following chart and graph show office and industrial vacancy rates in Snohomish County from the third quarter of 2012 to the third quarter of 2015:
3Q12 4Q12 1Q13 2Q13 3Q13 4Q13 1Q14 2Q14 3Q14 4Q14 1Q15 2Q15 3Q15Office 10.75% 10.70% 10.80% 10.75% 10.62% 10.53% 10.41% 9.71% 8.67% 8.45% 8.30% 8.56% 8.91%Industrial 6.84% 8.00% 6.72% 6.84% 7.76% 7.59% 7.13% 6.57% 6.24% 5.70% 6.10% 6.03% 5.85%
Data Source: https://www.economicalliancesc.org/about-the-region/business-climate/#economic-indicators
Snohomish County Commercial Vacancy Rates

17 | P a g e
Office vacancy rates in Snohomish County have increased from 8.67% in third quarter of 2014 to 8.91% in the third quarter of 2015. Furthermore, industrial vacancy rates in Snohomish County have decreased from 6.24% in the third quarter of 2014 to 5.85% in the third quarter of 2015. Brett Jackson, vice president of the brokerage group Jones Lang LaSalle in Seattle, recently said in an article published in The Herald Business Journal, “Over the last two to three years, the general trend for industrial space in the north end market has been in a positive direction. It has moved to lower vacancy rates and more demand and more deals getting done as well as the resultant increase in rental rates.” Jackson went on to say that he believes the Snohomish County industrial rental market is in pretty good shape for quite a while and going into 2016, people who want to lease industrial space in this market are going to have a challenge in finding good quality, modern, reasonable priced space which will force tenants searching for properties in the Woodinville, Bothell, Lynnwood, and Everett areas to look further north which is good news for north Snohomish County. In conclusion, it appears that 2016 has great growth potential in Snohomish County, especially for industrial space in the north end of the County.
Disclaimer: The material presented in this report is general in nature and is not investment or economic advice/strategy to any business or person. Information contained in this report is the most readily available, as of the date of the report, and is subject to change. The data in this report was obtained from open sources, and deemed reliable. The source for information is noted below each table in this report; the accuracy is not guaranteed by Coastal Community Bank. Any investment has risks; you should consult your advisor before making significant financial decisions.