snowball recipe book
TRANSCRIPT
Snowball Metrics Recipe Book

Auth ore d by Dr L i s a C o l l e d g e , Sn ow b a l l Me tri c s
Pro g ra m D ire c tor, El s e vi er, on b e ha l f o f a l l th e
Sn ow b a l l Me tri c s pro g ra m p a r tn er s .
E diti on 2
j u n e 2014
Snowball Metrics
Contents
Foreword: about Snowball Metrics and this Recipe Book 5
IntroductIon 9The Snowball Metrics appoach 11
Why is Elsevier involved? 13A pragmatic approach 13
The recommended use of Snowball Metrics 20Using metrics to support decision-making 22Globalizing Snowball Metrics as standards 23
How can you get involved? 30
overvIew 31Display of Snowball Metrics 32
Primary data sources, and implications for benchmarking 32Counting 33
Citation counts 33Outputs included in the calculation of a Snowball Metric 33
The definition of an institution 34The definition of a discipline 34The definition of a researcher 35
The definition of FTE (full-time equivalent) count 35The definition of funder-type 36The definition of time periods 37
CERIFication of Snowball Metrics 38
Input MetrIcs 41Applications Volume 43
Awards Volume 47Academic-Industry Leverage 51
Business Consultancy Activities 53
process MetrIcs 55Income Volume 57
Market Share 59Contract Research Volume 61
output and outcoMe MetrIcs 63Scholarly Output 65Citation Count 69
Citations per Output 71h-index 73
Field-Weighted Citation Impact 75Outputs in Top Percentiles 79
Publications in Top Journal Percentiles 81Collaboration 85
Collaboration Impact 89Academic Corporate Collaboration 93
Academic-Corporate Collaboration Impact 95Altmetrics 97
Public Engagement 101Intellectual Property Volume 103Intellectual Property Income 105
Sustainable Spin-Offs 107Spin-Off-Related Finances 109

5f o r ewo r d
Foreword: about Snowball Metrics and this Recipe Book
The aim of Snowball Metrics is to become the international standard that enables research-intensive universities to understand their strengths and weaknesses, so that they can build and monitor effective strategies.
Snowball Metrics is a response to common frustrations1,2 voiced by universities:
• Informed decisions depend on data, as well as on expert opinion and peer review. If we lack an evidence-base, we prevent ourselves from being able to make the best decisions for our universities.
• Our systems and the data that we collect are often determined in response to frequent demands from funders and agencies. We spend so much time collecting data in the different formats requested that we have very little opportunity to think about which systems and data would be most useful to address our own questions, which is surely what should be driving our approach.
• Universities are poor at collaborating with each other, and especially at working constructively with funders and agencies.
• The commercial systems and tools available have not effectively addressed all the needs of a university, which has led to the proliferation of bespoke institutional systems. These bespoke systems have often been created independently, so that little best practice has been established; consequently commercial suppliers have struggled
1 Research Information Management: developing tools to inform the management of research and translating existing good practice. http://www.snowballmetrics.com/wp-content/uploads/research-information-management1.pdf
2 The Current Health and Future Well-Being of the American Research University. http://www.snowballmetrics.com/wp-content/uploads/RIM_Report_Research-Futures-Consortium-.pdf
5
6 s n ow ba ll m et r i c s r ec i p e b o o k
to determine the universal needs that they should be addressing. This negative feedback loop is not good for the higher education sector.
A general consensus emerged in early studies that “someone” should take ownership of finding a solution to these problems. It was acknowledged that “someone” should lead, not only to attract attention and support to the initiative, but also to address the criticism and cynicism that would undoubtedly be encountered. Snowball Metrics was consequently initiated by a small but influential core of institutions, which together account for nearly 40% each of competitive funding awarded by the United Kingdom’s Research Councils, UK-authored articles, and UK citations. The ambition is that the conclusions and approaches endorsed by this core will “infect” the international higher education sector through a “snowball effect”, hence the name Snowball Metrics. These research institutions, ordered by their Scholarly Output in 2013, are:
• University College London• University of Oxford• University of Cambridge• Imperial College London• University of Bristol• University of Leeds• Queen’s University Belfast• University of St Andrews
The Snowball Metrics approach to address these problems is:• To enable informed evidence-based decision-making by agreeing
a single method to calculate metrics that will provide input to our institutional strategies by ensuring that we are comparing apples with apples. These metrics are based on all the data sources we have available to us, including our own institutional data sources, as well as third party and commercially available sources. Snowball Metrics do not depend on a particular data source or supplier, and are owned by the higher education sector.
• To own the definition of these metrics ourselves, rather than be vulnerable to them being imposed on us by funders and agencies. Snowball Metrics provide the opportunity to approach evaluation
7f o r ewo r d
from our own perspective, and to think about how to best answer our own questions and needs, rather than reacting to the needs of others.
• To collaborate with each other to agree a common solution, and to tr y to influence funders and agencies to adopt this as a common solution in place of the many unique approaches that produce so much inefficiency both for institutions and funders.
• To work together with a commercial supplier of research information so that they can learn about our needs at first hand, and build systems and tools that enable us to effectively and efficiently store our information and provide unambiguous, rigorously defined metrics based on consistent data.
The output of Snowball Metrics is a set of mutually agreed and tested methodologies: “recipes”. These recipes are available free-of-charge and can be used by anyone for their own purposes and, if applicable, under their own business models. I am proud to present the second edition of the Snowball Metrics Recipe Book, which offers a broader perspective on metrics that underpin effective institutional decision-making. This edition clearly demonstrates significant progress towards our aims since publication of the first edition in November 2012.
This recipe book also shows the significant support for Snowball Metrics amongst universities, funders, agencies and suppliers. Consensus amongst and between these stakeholders is critical to success in meeting the challenges which this initiative is addressing. Please give your support to Snowball Metrics by championing their use within your universities, funders, agencies and suppliers. We can transform the way in which evidence-based decisions are made across the sector, but it relies entirely on us working together and speaking with a single, unified voice across all dimensions of our influence.
Dr John Green on behalf of all snowball metrics program partnerschair of the snowball metrics steering committeeuniversity of cambridge, united kingdom

8 s n ow ba ll m et r i c s r ec i p e b o o k
9i n t ro d u c t i o n
Introduction
This section covers:• The Snowball Metrics approach: a bottom-up, academia-industr y
collaboration.• The roles and involvement of the universities and Elsevier.• The pragmatic approach to getting as far as possible as quickly as
possible; social sciences and arts and humanities; and efforts to reuse existing standards.
• The recommended use of Snowball Metrics as a balanced scorecard primarily for internal institutional decision-making, rather than ranking.
• Globalizing Snowball Metrics as standards through the Snowball Metrics Exchange API, national Working Groups, adoption by funders, and implementation in global commercial tools.
• How you can get involved.
Intr
od
uC
tIon

10 s n ow ba ll m et r i c s r ec i p e b o o k
11i n t ro d u c t i o n
the Snowball Metrics approach Snowball Metrics is, at its heart, a bottom-up initiative. This means that it is owned by research-intensive universities around the globe, which ensures that its outcomes are of practical use to them; its outputs are not imposed on universities by funders, agencies, or suppliers of research information.
“We are supportive of the approach being taken by the Snowball Metrics initiative. It recognises the value of stakeholders working together to agree a set of openly available standard metrics which can help institutions to explore their relative strengths, without being prescriptive in the way the metrics are used.” LIz ALLEN, PHD, HEAD OF EVALUATION, THE WELLCOME TRUST, UNITED KINGDOM
The aims of Snowball Metrics are:• To agree on methodologies that are robustly and clearly defined so that
the metrics they describe enable the confident comparison of apples with apples. The resulting benchmarks between research-intensive universities can then be trusted as reliable information to help establish and monitor institutional strategies.
• That the Snowball Metrics kite mark, the snowflake, becomes internationally recognized as a standard to illuminate the strengths and weaknesses of universities.
• That institutions, funders, agencies, and suppliers of research information adopt Snowball Metrics. A single method of requesting and consuming information will drive enormous efficiencies in all sectors of higher education, and the resources saved can be more efficiently deployed.
Snowball Metrics is an academia-industr y collaboration. The universities involved invited Elsevier to collaborate in this initiative because they sought skills that would complement their own expertise. The roles and responsibilities of the academic and industrial project partners are:
• Ever yone covers their own costs. This is extremely important: there is no suspicion that there is a commercial agenda underpinning the conclusions of the initiative.
• Universities:• Agree which metrics will be endorsed as Snowball Metrics.• Determine and agree practical methodologies to generate these
metrics in a commonly understood manner to enable apples-to-apples benchmarking , in a way that is independent of the different systems and data sources they have in house.
12 s n ow ba ll m et r i c s r ec i p e b o o k
• Elsevier:• Conducts the day-to-day project management of the global program.• Ensures that the methodologies agreed by the universities are
technically feasible, before they are shared with the global higher education sector.
• Uses its global networks to share the outcomes, and to communicate about the initiative.
The following are outside the remit of the Snowball Metrics program:• The quality of the data sources used to generate Snowball Metrics.
These are the responsibility of the institutions, third parties, or suppliers who own these data sources.
• The provision of tools to enable the generation and use of Snowball Metrics. Elsevier, and any other commercial supplier, may choose to implement the recipes in their commercial offerings, but this is not part of their participation in the initiative and it is a business decision that they take independently of Snowball Metrics.
“I started from the perspective that working with Elsevier would be the kiss-of-death, but I have found it to be a very positive experience and haven’t experienced a conflict of interest. Commercial partners are out there whatever we do. Other commercial companies are coming up with sets of metrics without involving us: we find that threatening – not because we are worried about funding, but because it threatens science and academic business because it does not properly involve those who know the business. It is a great credit to Elsevier that they have had the patience to involve us, as in some ways it’s a high risk strategy for them.
“If it was not for the involvement of Elsevier, and their project management skills, we’d probably still be talking about the definition of the first metric. They absolutely sat around the table deciding on the metrics, but they have not had any casting vote. They have provided technical expertise in terms of feasibility, as well as project managing the initiative.
“It’s also worth noting that Cambridge is not a customer of the Elsevier products into which they are now building some of the Snowball Metrics, which indicates their openness to the fact that the metrics are owned by the sector and not proprietary.”DR MALCOLM EDWARDS, HEAD OF THE PLANNING AND RESOURCE ALLOCATION OFFICE,
UNIVERSITy OF CAMBRIDGE, UNITED KINGDOM
13i n t ro d u c t i o n
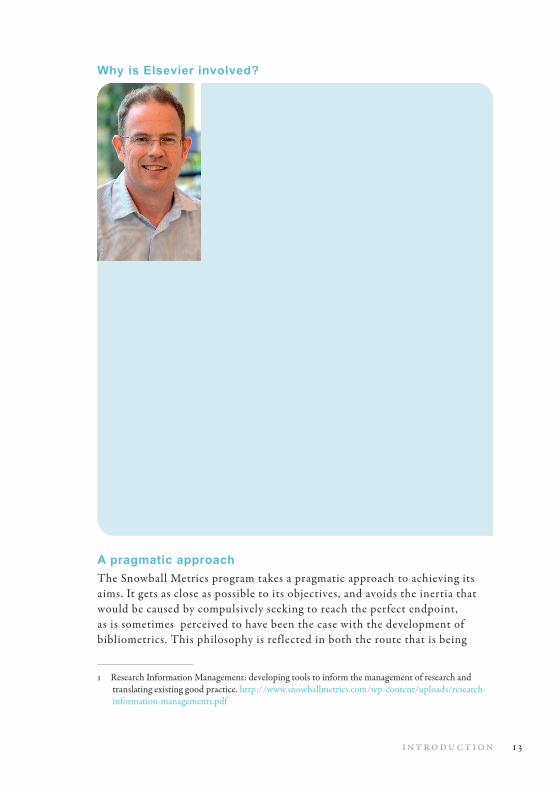
Why is Elsevier involved?
“Elsevier and Imperial College London collaborated with each other to produce a report in 2010 on the perception of institutional research management in England1. It was obvious that research-intensive institutions shared a big unmet need to have standard metrics to benchmark themselves against each other, and also that these universities needed to be in the driving seat to truly be able to endorse these metrics as global standards.”
“We at Elsevier jumped at the chance to support these universities in their ambitions, for several reasons. We believe that we have a responsibility to support initiatives that will
improve the higher education sector, and that we can make significant contributions. It was also clear that we would be able to learn an enormous amount about research information management from the universities involved, and from the funders and agencies who advise the initiative; we are keen to feed all learning from the sector into our systems, tools and services to make them as good as they can be. The vision of a global metric standard is also appealing to us, since it is much more efficient to be able to implement a limited set of metrics rather than customizations for each of our customers.”
“Our participation in Snowball Metrics is in line with Elsevier’s mission is to advance science, technology and health. We have significant skills in house in handling large data sources, communicating globally, and in program management. I was absolutely convinced that our participation would add useful, even critical, skills to those of the university representatives involved, and that we could help to build something with a real chance of transforming decision-making in higher education.”DR NICK FOWLER, MANAGING DIRECTOR, ACADEMIC AND GOVERNMENT INSTITUTIONS,
ELSEVIER, THE NETHERLANDS
A pragmatic approachThe Snowball Metrics program takes a pragmatic approach to achieving its aims. It gets as close as possible to its objectives, and avoids the inertia that would be caused by compulsively seeking to reach the perfect endpoint, as is sometimes perceived to have been the case with the development of bibliometrics. This philosophy is reflected in both the route that is being
1 Research Information Management: developing tools to inform the management of research and translating existing good practice. http://www.snowballmetrics.com/wp-content/uploads/research-information-management1.pdf
14 s n ow ba ll m et r i c s r ec i p e b o o k
taken to agree metrics to enable apples-to-apples benchmarking , and in the efficient reuse of existing standards wherever possible.
the route to agree metrics to enable apples-to-apples benchmarkingThe representatives of the universities who are working on Snowball Metrics are the leaders of the research and planning offices, together with technical experts from within the universities who have experience in responding to requests for information from funders, and who consequently know the strengths and weaknesses of institutional data, systems and tools. These are people who have a daily need to use research information in order to advise, inform, and illuminate their colleagues and the stakeholders that they work with; it is they who recognize the immediate benefit from any improvement in the arsenal of tools that they have available to them.
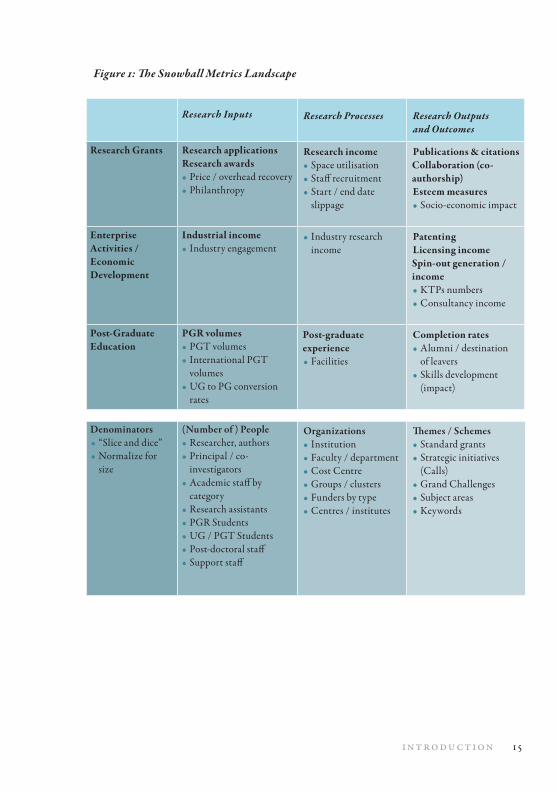
One of the aims of these university representatives is to agree Snowball Metrics throughout the entire landscape of research activities in which a research institution invests resources and would like to excel (Figure 1). In addition to agreeing the metrics themselves, a set of denominators is needed. These denominators:
• “Slice and dice” the Snowball Metrics at levels that are more granular than an entire institution, to enable understanding of strengths within a discipline, for instance.
• Normalize for size between institutions, so that it is not always the case that bigger institutions appear to perform better.
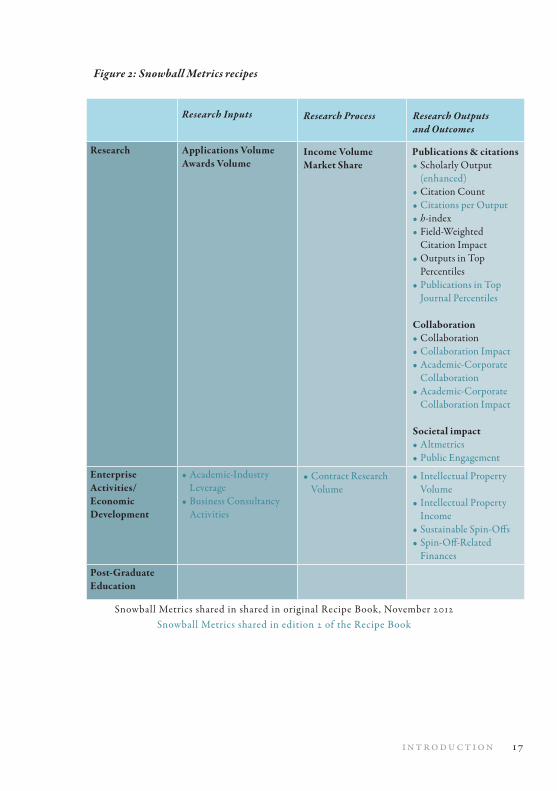
The project partners tackled the “low-hanging fruit” first to make progress, and then moved on to more challenging and perhaps more controversial metrics. Consequently, the first edition of this recipe book, published in November 2012, shared the agreed methods of 10 metrics that are unarguably important for institutional strateg y ; the focus of the project partners then was to work out how to reach consensus, and how to perform the feasibility testing of those metrics. The second phase of metrics built on the success and progress of the first phase, and tackled some more difficult metrics, and they are shared for the first time in this second edition of the recipe book (Figure 2). The third phase will most likely focus on metrics in post-graduate education and collaboration, as well as a thematic subject classification.
15i n t ro d u c t i o n
Figure 1: The Snowball Metrics Landscape
Research Inputs Research Processes Research Outputs and Outcomes
Research Grants Research applicationsResearch awards • Price / overhead recovery• Philanthropy
Research income• Space utilisation• Staff recruitment• Start / end date
slippage
Publications & citationsCollaboration (co-authorship)Esteem measures• Socio-economic impact
Enterprise Activities / Economic Development
Industrial income• Industry engagement
• Industry research income
PatentingLicensing incomeSpin-out generation / income• KTPs numbers• Consultancy income
Post-Graduate Education
PGR volumes• PGT volumes• International PGT
volumes• UG to PG conversion
rates
Post-graduate experience • Facilities
Completion rates• Alumni / destination
of leavers• Skills development
(impact)
Denominators• “Slice and dice”• Normalize for
size
(Number of ) People• Researcher, authors • Principal / co-
investigators• Academic staff by
category• Research assistants• PGR Students• UG / PGT Students• Post-doctoral staff• Support staff
Organizations• Institution • Faculty / department • Cost Centre• Groups / clusters• Funders by type• Centres / institutes
Themes / Schemes• Standard grants• Strategic initiatives
(Calls)• Grand Challenges• Subject areas• Keywords
16 s n ow ba ll m et r i c s r ec i p e b o o k
“The thematic denominator of subject areas is one that we would really like to find a way to address. We need to agree on a single subject classification that will work globally for all disciplines, so that we can start to map our inputs, outputs and outcomes to it; being able to slice Snowball Metrics in this way in the future would give us extremely valuable strategic information. There will be a challenge to map retrospective data to the same classification, but perhaps that can be achieved with the technology available today.”SOPHIE COLLET, HEAD OF RESEARCH AND ENTERPRISE POLICy,
UNIVERSITy OF BRISTOL, UNITED KINGDOM
The approach to get as far as possible as quickly as possible means that there is currently an imbalance between the Snowball Metrics that can be applied to the social sciences and arts and humanities compared with those that are perhaps most relevant to STEM2. While metrics such as Applications Volume , Awards Volume , Income Volume , and Market Share are equally useful across all fields, when the disciplinary denominator is used, metrics such as Citation Count and Collaboration may be less valuable in the non-STEM areas. It is the aim of Snowball Metrics to define recipes that support benchmarking across all disciplines, as well as across all university activities: this is illustrated in this recipe book by the clarifications of definition of Scholarly Output , and by the inclusion of Altmetrics and Public Engagement . We will continue along this route, but so far we have been hampered by the apparent indifference of key influencers to engaging in a practical initiative: we are keen to work with organizations in the social sciences and arts and humanities who would like to collaborate and help define practical metrics that are useful for these areas.
Snowball Metrics nevertheless provide an increasingly balanced metrics scorecard, as input to help establish and monitor institutional strategies. Existing scorecards often tend to be based upon output and citation metrics, largely since comprehensive commercial databases are readily available, and / or financial metrics, since they are relatively easy for institutions to measure. Snowball Metrics are now beginning to draw a much more comprehensive and rounded view of institutional performance across the full range of activities.
2 STEM: Science, Technology, Engineering, and Mathematics.
17i n t ro d u c t i o n
Figure 2: Snowball Metrics recipes
Research Inputs Research Process Research Outputs and Outcomes
Research Applications VolumeAwards Volume
Income VolumeMarket Share
Publications & citations• Scholarly Output
(enhanced)• Citation Count• Citations per Output• h-index• Field-Weighted
Citation Impact• Outputs in Top
Percentiles• Publications in Top
Journal Percentiles
Collaboration• Collaboration• Collaboration Impact• Academic-Corporate
Collaboration• Academic-Corporate
Collaboration Impact
Societal impact• Altmetrics• Public Engagement
Enterprise Activities/ Economic Development
• Academic-Industry Leverage
• Business Consultancy Activities
• Contract Research Volume
• Intellectual Property Volume
• Intellectual Property Income
• Sustainable Spin-Offs• Spin-Off-Related
Finances
Post-Graduate Education
Snowball Metrics shared in shared in original Recipe Book, November 2012Snowball Metrics shared in edition 2 of the Recipe Book
18 s n ow ba ll m et r i c s r ec i p e b o o k
“We recognise that in many information system developments, universities are continually striving for perfection and seeking solutions that deal with the many complexities of research information management. The problem with this, as many universities will no doubt testify, is that focusing on precise systems, expecting perfect data and all-encompassing functionality is an unrealistic goal. We are taking a pragmatic approach with Snowball Metrics whereby we have identified a fit-for-purpose metrics framework, recognising that this is starting point and it will take time to develop. From there, we have begun to source data, taking that which is readily available and trying to ensure it conforms to standards, yet cognisant that something is better than nothing in what is a sector that has struggled to grasp and accept performance management.”SCOTT RUTHERFORD, DIRECTOR OF RESEARCH AND ENTERPRISE,
QUEEN’S UNIVERSITy BELFAST, UNITED KINGDOM
reusing existing standardsSnowball Metrics reuse existing standards whenever they support the needs of the initiative; it does not redefine data elements and calculations that are already usefully well-defined and accepted elsewhere, but rather embraces existing work and builds upon it. Some existing standards are used exactly as they are, and some will provide the basis for an adjusted definition.
One example is the support of Snowball Metrics by the United Kingdom’s Higher Education Statistics Agency (HESA)3. HESA’s mission is to collect a comprehensive body of reliable statistics and information from the funded providers of higher education, in the areas of research, enterprise, teaching and learning , and then to provide that data back to universities and UK Research Councils. The UK Snowball Metrics Steering Group has reused and built on some of HESA’s open and widely-used definitions.
3 http://www.hesa.ac.uk/
19i n t ro d u c t i o n
“Our definitions of a Researcher, a Discipline (HESA Cost Centre), and of Enterprise activities have been valuable to the progress of the Snowball Metrics in defining their recipes. But it is not only the definitions, but also the data that can be useful in generating these metrics, and these data supply some of the numerators as well as denominators.”ALISON ALLDEN, CHIEF ExECUTIVE, HIGHER EDUCATION
STATISTICS AGENCy, UNITED KINGDOM
Another example is the partnership of Snowball Metrics with euroCRIS4, a not-for-profit organization that is dedicated to the development and inter-operability of Current Research Information Systems (CRIS). The recently formed euroCRIS Indicators Task Group aims to develop and share best practice in the use of indicators to support research information management. One of the outputs of the group will be to express multiple sets of indicators in their global data standard, the Common European Research Information Format5 (CERIF), with Snowball Metrics being the first set to be defined.
you will find information associated with this recipe book that enables you to express the original set of 10 Snowball Metrics in CERIF. The complete CERIF xml code, as provided by euroCRIS, is available for download and use from the Snowball Metrics website6, and the code for the new recipes published in this edition of the Recipe Book will be added by them in due course.
4 www.eurocris.org 5 http://www.eurocris.org/Index.php?page=featuresCERIF&t=1 6 www.snowballmetrics.com
20 s n ow ba ll m et r i c s r ec i p e b o o k
“The Snowball Metrics vision is that they become global standards that are implemented in multiple systems, and supported by multiple suppliers. Benchmarking between different systems relies on the exchange of agreed metrics, and the application of the CERIF data standard to the recipes is an important component in enabling this exchange. “The universal nature of CERIF provides an important reference point to which multiple national data sources can be mapped and used with international benchmarking; for example, whatever the US version of the HESA Cost Centre turns out to be, these distinct but equivalent classifications can be mapped to its equivalent by using the CERIF constructs.
“I have worked with the euroCRIS Indicator and CERIF Task Groups to CERIFy the Snowball Metrics that were published in the first recipe book, launched at a euroCRIS Membership Meeting in November 2012, and I hope that this facilitates the implementation and sharing of the Snowball Metrics.” DR BRIGITTE JOERG, ExECUTIVE EUROCRIS BOARD MEMBER, AND FORMER CERIF TASK GROUP
LEADER (2004-2012), UNITED KINGDOM
the recommended use of Snowball MetricsMetrics are a strong complement to peer review and expert opinion when making research management decisions and the ideal situation is to have information from all three types of input. If intelligence from these complementary approaches “triangulates”, or in other words gives a similar message, then this increases the confidence in conclusions. Conflicting messages might suggest further investigation. It is also advisable to “triangulate” within the metrics corner of the triangle, and this is one reason that Snowball Metrics aim to agree on a broad set of metrics. Another reason of course is the broad diversity of questions that they could be used to help address.
Snowball Metrics should be seen as a balanced scorecard of metrics from which a selection can be made to help understand institutional strengths and weaknesses in a particular area. They are not intended to be prescriptive, in that one does not have to use them all at any one time nor for any one purpose – the opportunity is there to use whichever of them is felt might add value to decision making in any particular situation. The selection of Snowball Metrics will depend on the question being asked; the selection may differ from day to day even for one person, who may well have their own preferences and opinions about the usefulness of any one metric in particular circumstances.
21i n t ro d u c t i o n
“Snowball Metrics is about working on and sharing a common language so that institutions are confident that they can use all of their data to compare their performance with each other in an apples-to-apples way. It’s not trying to tell anyone which of these metrics to use to answer any particular question: which sub-set of the metrics you use, whether 1-5, or 2, 9, and 13, is up to the universities and funders. It’s just like using a recipe book to cook your dinner: I don’t need to cook the entire book to find it useful; instead I choose what I like, and perhaps what I have the ingredients in the fridge for.”JENNIFER JOHNSON, HEAD OF PERFORMANCE, GOVERNANCE &
OPERATIONS, RESEARCH & INNOVATION, UNIVERSITy OF LEEDS,
UNITED KINGDOM
Another advantage of the range of Snowball Metrics is that they are unlikely to distort the research process in unanticipated ways through encouraging too much focus on a particular activity. For example, it is well known that rewarding researchers for publishing a high volume of output encourages researchers to slice their work in more pieces in order to be able to publish a higher volume. Snowball Metrics offers a balanced scorecard, rather than a focus on one or only a few metrics, and so it remains the decision of the researchers or institutions where they should focus their efforts.
The purpose of Snowball Metrics is to understand institutional strengths and weaknesses, so that this intelligence can be used to inform university strategies. It is important that the universities who are exchanging Snowball Metrics can trust the underlying data, even when they cannot see the actual data itself, as in the case of metrics generated from institutional data. It is hoped that, because the driver behind Snowball Metrics is internal and not for showcasing or ranking , there is no motivation to “game” the metrics, because there is no gain for an institution in concealing its standing amongst its peers from itself.
2 2 s n ow ba ll m et r i c s r ec i p e b o o k
“The Snowball Metrics provide a new tool for reporting on comparative research activity. It is important that the data on which benchmarks are calculated is trustworthy, since it is likely to be used when reporting to funders or competing for other external support.
“I don’t see Snowball Metrics as a means to provide a more precise measure of international ranking, but rather as a tool for internal use. They’ll tell us about where we are with respect to our peer institutions, and provide information on
where we perform well and where we might wish to decide on further investment.”PROFESSOR IAN WALMSLEy, HOOKE PROFESSOR OF ExPERIMENTAL PHySICS, AND PRO-VICE-
CHANCELLOR (RESEARCH, ACADEMIC SERVICES AND UNIVERSITy COLLECTIONS), UNIVERSITy
OF OxFORD, UNITED KINGDOM
using metrics to support decision-making
“The MRC [Medical Research Council] recently looked at our investment in non-clinical senior fellows compared to a carefully defined group of programme grant holders. Both groups of researchers receive five years of support, but programme grant holders are on average at a later stage in their careers than fellows. We found that the scholarly output of fellows, as measured by citation impact, compared favourably to that of the programme grant holders. This reassured us that we’re selecting high quality researchers, with the best potential to be the leaders of tomorrow, and this evidence helped us to take the decision to continue to invest in the senior fellowship scheme. These are not fine-grained decisions, and we will
continue to rely on expert views, but accurate and comprehensive quantitative and qualitative output information is helpful in supporting strategic evaluation.”DR IAN VINEy, DIRECTOR OF STRATEGIC EVALUATION AND IMPACT, MEDICAL RESEARCH
COUNCIL, UNITED KINGDOM
23i n t ro d u c t i o n
“It is fascinating that within the scientific community, founded on the principles of evidence-based research, when it comes to management decisions such as recruitment, faculty can be tempted to rely only on personal knowledge or impressions without consulting evidence. I believe that a combination of all of these approaches is the best way to make good decisions.
“I joined Imperial College London in 1998 to achieve the enormous challenge of merging and streamlining five independent medical schools. We had an immediate need to develop an evidence-based decision-making model agreed on, and supported by, the faculty. It was critical that the academics
themselves, with guidance, defined a range of criteria and benchmarks against which they should be assessed but we could not even compare one curriculum vitae with another: one academic might list their last five years of publications, another their best, and another something entirely different. In the end, we developed a fair and consistent approach that allowed the faculty of medicine to release an unproductive overhead, invest in new staff and climb quickly to be the strongest UK medical school according to any input or output research measure.
“As the new medical faculty coalesced, we began to monitor factors like success rates in applications for grants. We started looking at data to inform a strategic approach to applying for funding, and this had a huge positive effect on our success rates. We were also able to track that we were losing market share of an increasing base of funding in a particular area and turn that situation around. And we began to use data to support our recruiting decisions.”DR JOHN GREEN, CHAIR OF THE SNOWBALL METRICS STEERING COMMITTEE, UNIVERSITy OF
CAMBRIDGE, UNITED KINGDOM7
Globalizing Snowball Metrics as standards
the Snowball Metrics ExchangeSnowball Metrics can be used within a single institution to give useful information about trends over time, but their real value is for benchmarking and that requires institutions to be able to see each other’s Snowball Metrics. This is already possible to some extent within tools that have implemented
7 Based on “Evidence-based decision making in academic research: The “Snowball” effect”, published in the Academic Executive Brief, 2013. http://academicexecutives.elsevier.com/articles/evidence-based-decision-making-academic-research-snowball-effect
24 s n ow ba ll m et r i c s r ec i p e b o o k
these recipes based entirely on commercial data, such as Elsevier’s SciVal, but maximum benefit depends on users being able to understand their position relative to their peers on a wider set of metrics, including those that rely on institutional data such as Applications Volume .
The model that will address this need has been worked out by the Steering Group, using a pilot called the Snowball Metrics Lab that Elsevier built for this group to support the feasibility testing of the recipes before they were published. This pilot gave rise to the concept of the Snowball Metrics Exchange. Elsevier will build an API which is a free “broker service” for the exchange of Snowball Metrics between peer institutions who agree that they would like to share information with each other (Figure 3):
• Any institution who is using Snowball Metrics can become a member of the Snowball Metrics Exchange.
• The institutional members will be responsible for generating their Snowball Metrics according to the recipes. The metrics could be calculated using a bespoke system, in a spreadsheet, or in a commercial tool.
• Each institution can be a member of one or more benchmarking clubs: groups of institutions which have agreed to exchange metrics with each other. Institutions may choose to accept or decline requests to share all or some Snowball Metrics; this is entirely under their control.
• Institutions will use the “I’ll show you mine if you show me yours” facility in order to exchange equivalent Snowball Metrics with each other.
• The data underlying the metrics will never be exchanged, and will remain behind the institutions’ firewalls.
“The true value of Snowball will only be realised when any university can benchmark themselves against any other one willing to share metrics; we hope to achieve this through an open API (“a metrics exchange”) which we are hopeful will be built soon, open and free to anyone.”GLENN SWAFFORD, DIRECTOR OF RESEARCH SERVICES, UNIVERSITy
OF OxFORD, UNITED KINGDOM
25i n t ro d u c t i o n
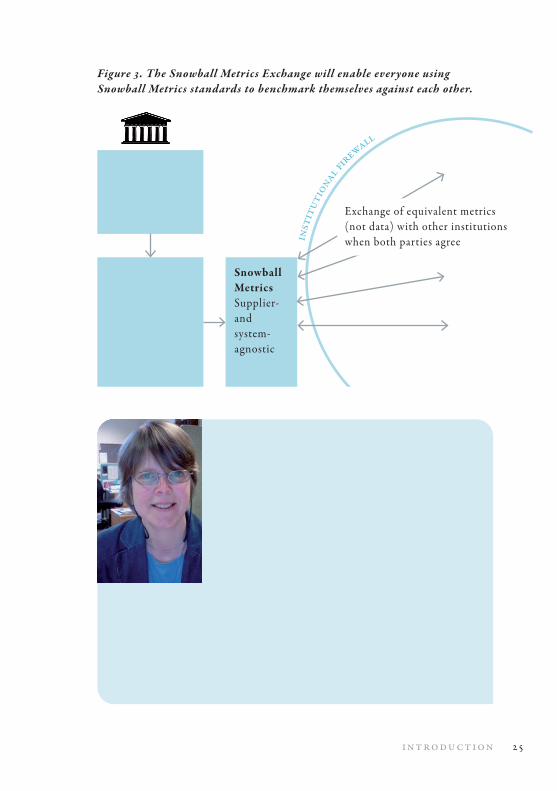
Figure 3. The Snowball Metrics Exchange will enable everyone using Snowball Metrics standards to benchmark themselves against each other.
Data• Institutional• Commercial• Third party
System• Bespoke• SciVal/InCites• Pure/Converis• ResearchFish• Spreadsheet etc.
“Different universities have traditionally collected data in different ways, but the variability is becoming less now that more universities are using CRIS – Current Research Information Systems – such as Pure and Converis, and are extending traditional publication and repository systems such as ePrints, dSpace and Symplectic to collect research information data.
“There will never be a single system used across the entire sector to collect these or other output, outcome or impact data. Therefore ensuring interoperability between systems is the sensible approach
to take to improve data quality whilst keeping the cost of rekeying and rechecking to a minimum. The key is that however an institution collects data, we should work towards a common exchange format for exchanging the metrics derived from those data. The great advantage of Snowball Metrics is that they have been very clearly and transparently defined which makes mapping to a standard, such as CERIF, relatively straightforward.” ANNA CLEMENTS, HEAD OF RESEARCH DATA AND INFORMATION SERVICES, UNIVERSITy OF ST
ANDREWS, UNITED KINGDOM
inst
itut
ional f
irewall
Snowball MetricsSupplier- and system- agnostic
Exchange of equivalent metrics (not data) with other institutions when both parties agree
26 s n ow ba ll m et r i c s r ec i p e b o o k
national Snowball Metrics Working GroupsThe Snowball Metrics initiative started in the United Kingdom because this is where the group of universities that decided to take the initial steps was located. The first steps, whose results were published in the original recipe book, were taken within this UK national group, but it was always the intention to form a global network of Working Groups once they could show progress.
The objectives of the Working Groups are to:
• Endorse all, or as many as possible, Snowball Metrics to drive the move towards global standards8.
• Enhance existing Snowball Metrics with national data and intelligence.• Enable global benchmarking using national data by understanding how
to map national denominators for cross-country compatibility.• Develop new metrics for the global initiative if there are gaps from the
national perspective.• Influence • Funders and agencies to adopt university perspective for their
evaluations to drive efficiency. • Suppliers of research information tools to build more effectively.
This recipe book contains the first contributions from the United States Working Group whose creation was stimulated by a report published in 20129. The Group is composed of the following universities, ordered by their Scholarly Output in 2013:
• University of Michigan• University of Minnesota• Northwestern University• University of Illinois at Urbana-Champaign• Arizona State University• MD Anderson Cancer Center• Kansas State University
The members of the US Working Group have agreed, with each other and with the UK group, a more global, less UK-centric definition of “researcher”,
8 We are aiming for definitions of data elements that apply globally. If, for example, a definition that originated with the UK group is not clear enough for the national situation in the US, then the definition will be improved by the US group while ensuring that it remains relevant to, and inclusive of, the UK (and other countries’) needs.
9 The Current Health and Future Well-Being of the American Research University. http://www.snowballmetrics.com/wp-content/uploads/RIM_Report_Research-Futures-Consortium-.pdf
27i n t ro d u c t i o n
and have also endorsed those Output Metrics that were published in edition 1 of this recipe book, and which are generated at an institutional level. Despite some initial misgivings, and some terminological differences (for example the use of “Economic Development Metrics” in place of “Enterprise Metrics”), there is to date remarkably close alignment between the needs and the solution to those needs between the UK and the US.
“We are excited to be part of the Snowball Metrics initiative, for it provides the US institutions with the opportunity to contribute to the global recipe, that will ultimately lead to improved benchmarking, that will in turn better support institutional decisions.”DAVID W. RICHARDSON, ASSOCIATE VICE CHANCELLOR FOR RESEARCH, DIRECTOR OF
SPONSORED PROGRAMS, UNIVERSITy OF ILLINOIS AT URBANA-CHAMPAIGN, UNITED STATES
A Working Group has also been formed in Australia / New Zealand, composed initially of the following universities, ordered by their Scholarly Output in 2013:
• University of Queensland• University of Western Australia• University of Auckland• University of Wollongong• University of Tasmania• Massey University• University of Canberra• Charles Darwin University
Again, some terminological differences have been noted (for example the use of “amount applied for” in place of “price” of an application for a competitive grant), but the group has confirmed that the needs and their solution is similar in Australia / New zealand, as well as in the UK and the US.
“In Japan we have become increasingly interested in metrics and particularly in Snowball. We believe Snowball Metrics could provide a valuable way of benchmarking our universities within Japan and with other countries. We are hoping to investigate ways to use them, including in humanities and social sciences.”professor jun ikeda, chief advisor to the president, university of tsukuba, japan
28 s n ow ba ll m et r i c s r ec i p e b o o k
Enhancing existing Snowball MetricsThe aim of Snowball Metrics is to become an international standard that enables research-intensive universities to benchmark themselves against each other, to understand their strengths and weaknesses so that they can build and monitor more effective strategies. It is therefore critical that the recipes, and the data elements that underlie them, are universal and globally relevant.
The starting points for the recipes and the definitions of the underlying data elements were laid out by the UK group. In some cases, these starting definitions will not be clear enough in other countries, or will not address a particular national situation, and in these circumstances the Working Groups will add clarity to the existing definition while remaining in line with the intention of the previous Working Groups. These iterations may take place several times, and eventually we will reach a truly global definition that is absolutely unambiguous.
There are several examples of this iterative process in this recipe book, such as:
• Scholarly Output – enhanced by UK group to clarify the outputs besides publications that should be included and excluded.
• The definition of Researcher, on which the US Working Group took the lead to clarify and to align with the UK Working Group to ensure that the underlying meaning was retained.
Encouraging the adoption of Snowball Metrics by fundersThe cross-sector workshops that were held in the UK in December 2012, and whose outcomes were published10, highlighted significant frustration in universities with the frequent requests for information that they receive from both funders and government departments. It was acknowledged that the performance of funders is increasingly being measured, just as is the performance of universities, but it was felt that the quantity of information being requested was excessive, and that the constantly changing details were an additional burden. There was a call for universities, funders and government agencies to agree on a smaller set of measurements whose specifications would change very irregularly or not at all, so that the same information could be reused and would bring value to all stakeholders involved. The adoption of Snowball Metrics by all stakeholders would address these problems.
10 Moving towards the ideal way to manage research information in the United Kingdom: cross-sector workshops. Lisa Colledge (2013). http://www.snowballmetrics.com/wp-content/uploads/CrossSector_workshop_report_FINAL.pdf
29i n t ro d u c t i o n
“There is currently no good way of exchanging all types of data between universities and funders. We can’t yet get data back from funders to push into our systems, and I don’t want to ask researchers to add the same thing to the institutional database that they’ve already added to a funder’s system as it is a waste of their time. In my opinion, the best option is that the university collects the data from researchers, and then supplies it centrally to funders and government agencies as well as using it for their own purposes.
“Snowball Metrics are part of a standardized format and a shared understanding of a benchmarking that will help stop
time being wasted. If everyone adopted these metrics and helped develop them further to cover more content types, we would be able to save time and other resources that we could be spending doing much more interesting things, like research!”DR RACHEL CURWEN, RESEARCH DEVELOPMENT ASSOCIATE FOR LIFE SCIENCES AND HEALTH
RESEARCH, UNIVERSITy OF yORK, UNITED KINGDOM
Encouraging implementation of Snowball Metrics by suppliers of research information and toolsSnowball Metrics recipes are free, and can be used by any organization for their own purposes and, if applicable, under their own business models11. The availability of Snowball Metrics in global tools will greatly accelerate their speed of adoption as global standards for institutional benchmarking. Elsevier has now implemented Snowball Metrics in their Research Intelligence portfolio of systems, tools and services12, and it is hoped that other commercial suppliers will also take this step.
“Researchfish is happy to support Snowball Metrics and can integrate and develop the tools within the system. However the Researchfish development program is led by its stakeholders: Funders, Universities and Principal Investigator user groups. Any or all can determine our adoption via their respective user groups.”MARK CONNELLy, DIRECTOR, RESEARCH FISH13, UNITED KINGDOM
11 http://www.snowballmetrics.com/wp-content/uploads/Snowball-Metrics-Letter-of-Intent.pdf 12 http://www.elsevier.com/online-tools/research-intelligence 13 https://www.researchfish.com/
30 s n ow ba ll m et r i c s r ec i p e b o o k
“We’re very supportive of Snowball Metrics and of the worthy principles behind it, so I’m very happy to see the project partners take the initiative and put forward practical standards for altmetrics in the context of benchmarking. The approach taken is a smart one - structuring the way you look at altmetrics like this is a good way of maximizing the insights that the data can provide. We’re working towards including the recipe in our own reporting tools, to make it as easy as possible to put into practice.”EUAN ADIE, FOUNDER OF ALTMETRIC14, UNITED KINGDOM
How can you get involved?Snowball Metrics are and will continue to be created and owned by higher education institutions, and they will need to be championed by the global sector if they are to reach their potential of becoming global standards for institutional benchmarking. There are several ways in which you can support this initiative:
• Feedback to the initiative about how useful it would be to you to have comparative information based on the Snowball Metrics. Would they give you new intelligence? Could they change the way you approach decision-making ?
• Feedback on the clarity of the recipes in this book. We have been able to clarify the original recipes in several places thanks to input from the sector, and that benefits everyone using this current version.
• Call for influential bodies in the social sciences and arts and humanities to collaborate with the initiative to agree on practical metrics that are particularly useful for these areas. Resistance from these areas has to date hampered our attempt to accommodate their needs more completely.
• Ask funders and suppliers to adopt Snowball Metrics. Change requires momentum: please help us provide it.
Please use the “Contact Us” form available at: www.snowballmetrics.com/contact-form/.
14 www.altmetric.com
3 1ov erv i ew
overview
This section covers agreed approaches that affect multiple Snowball Metrics, and should be consulted in conjunction with the individual recipes:
• Display of Snowball Metrics• Primar y data sources, and implications for benchmarking• Counting• Citation counts• Outputs included in the calculation of a Snowball Metric
Definitions:• Institution• Discipline• Researcher• FTE (full-time equivalent) count• Funder-type• Time periods
CERIFication1 of Snowball Metrics
1 CERIF: Common European Research Information Framework; http://www.eurocris.org/Index.php?page=featuresCERIF&t=1
ovEr
vIEW
3 2 s n ow ba ll m et r i c s r ec i p e b o o k
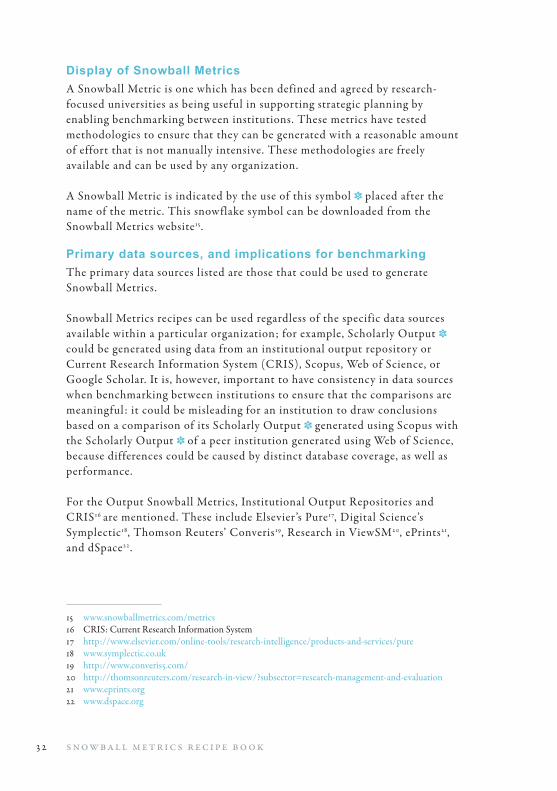
display of Snowball MetricsA Snowball Metric is one which has been defined and agreed by research-focused universities as being useful in supporting strategic planning by enabling benchmarking between institutions. These metrics have tested methodologies to ensure that they can be generated with a reasonable amount of effort that is not manually intensive. These methodologies are freely available and can be used by any organization.
A Snowball Metric is indicated by the use of this symbol placed after the name of the metric. This snowflake symbol can be downloaded from the Snowball Metrics website15.
Primary data sources, and implications for benchmarkingThe primary data sources listed are those that could be used to generate Snowball Metrics.
Snowball Metrics recipes can be used regardless of the specific data sources available within a particular organization; for example, Scholarly Output could be generated using data from an institutional output repository or Current Research Information System (CRIS), Scopus, Web of Science, or Google Scholar. It is, however, important to have consistency in data sources when benchmarking between institutions to ensure that the comparisons are meaningful: it could be misleading for an institution to draw conclusions based on a comparison of its Scholarly Output generated using Scopus with the Scholarly Output of a peer institution generated using Web of Science, because differences could be caused by distinct database coverage, as well as performance.
For the Output Snowball Metrics, Institutional Output Repositories and CRIS16 are mentioned. These include Elsevier’s Pure17, Digital Science’s Symplectic18, Thomson Reuters’ Converis19, Research in ViewSM20, ePrints21, and dSpace22.
15 www.snowballmetrics.com/metrics 16 CRIS: Current Research Information System17 http://www.elsevier.com/online-tools/research-intelligence/products-and-services/pure 18 www.symplectic.co.uk19 http://www.converis5.com/ 20 http://thomsonreuters.com/research-in-view/?subsector=research-management-and-evaluation21 www.eprints.org22 www.dspace.org
3 3ov erv i ew
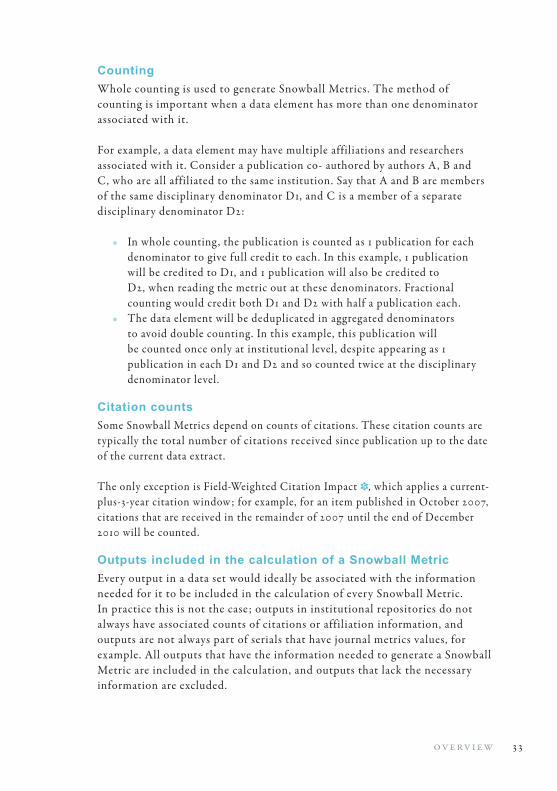
CountingWhole counting is used to generate Snowball Metrics. The method of counting is important when a data element has more than one denominator associated with it.
For example, a data element may have multiple affiliations and researchers associated with it. Consider a publication co- authored by authors A, B and C, who are all affiliated to the same institution. Say that A and B are members of the same disciplinary denominator D1, and C is a member of a separate disciplinary denominator D2:
• In whole counting , the publication is counted as 1 publication for each denominator to give full credit to each. In this example, 1 publication will be credited to D1, and 1 publication will also be credited to D2, when reading the metric out at these denominators. Fractional counting would credit both D1 and D2 with half a publication each.
• The data element will be deduplicated in aggregated denominators to avoid double counting. In this example, this publication will be counted once only at institutional level, despite appearing as 1 publication in each D1 and D2 and so counted twice at the disciplinary denominator level.
Citation countsSome Snowball Metrics depend on counts of citations. These citation counts are typically the total number of citations received since publication up to the date of the current data extract.
The only exception is Field-Weighted Citation Impact , which applies a current-plus-3-year citation window ; for example, for an item published in October 2007, citations that are received in the remainder of 2007 until the end of December 2010 will be counted.
outputs included in the calculation of a Snowball MetricEvery output in a data set would ideally be associated with the information needed for it to be included in the calculation of every Snowball Metric. In practice this is not the case; outputs in institutional repositories do not always have associated counts of citations or affiliation information, and outputs are not always part of serials that have journal metrics values, for example. All outputs that have the information needed to generate a Snowball Metric are included in the calculation, and outputs that lack the necessary information are excluded.
34 s n ow ba ll m et r i c s r ec i p e b o o k
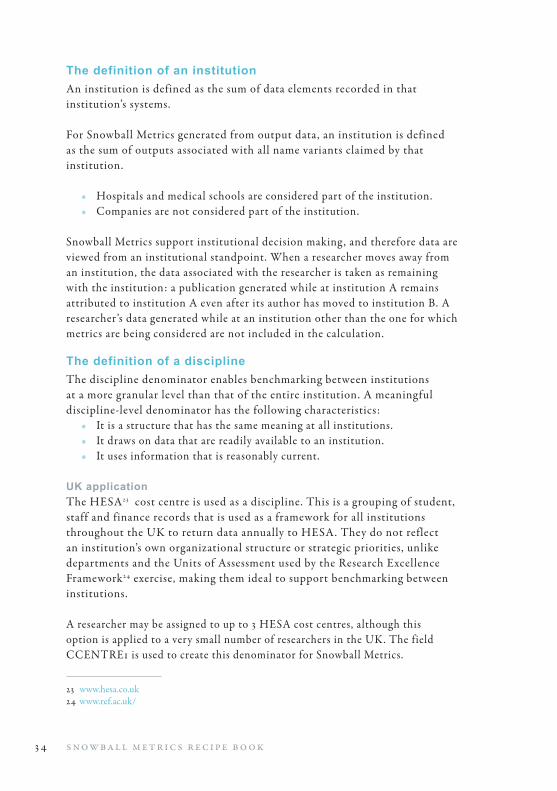
the definition of an institution An institution is defined as the sum of data elements recorded in that institution’s systems.
For Snowball Metrics generated from output data, an institution is defined as the sum of outputs associated with all name variants claimed by that institution.
• Hospitals and medical schools are considered part of the institution.• Companies are not considered part of the institution.
Snowball Metrics support institutional decision making , and therefore data are viewed from an institutional standpoint. When a researcher moves away from an institution, the data associated with the researcher is taken as remaining with the institution: a publication generated while at institution A remains attributed to institution A even after its author has moved to institution B. A researcher’s data generated while at an institution other than the one for which metrics are being considered are not included in the calculation.
the definition of a disciplineThe discipline denominator enables benchmarking between institutions at a more granular level than that of the entire institution. A meaningful discipline-level denominator has the following characteristics:
• It is a structure that has the same meaning at all institutions.• It draws on data that are readily available to an institution.• It uses information that is reasonably current.
uK applicationThe HESA23 cost centre is used as a discipline. This is a grouping of student, staff and finance records that is used as a framework for all institutions throughout the UK to return data annually to HESA. They do not reflect an institution’s own organizational structure or strategic priorities, unlike departments and the Units of Assessment used by the Research Excellence Framework24 exercise, making them ideal to support benchmarking between institutions.
A researcher may be assigned to up to 3 HESA cost centres, although this option is applied to a very small number of researchers in the UK. The field CCENTRE1 is used to create this denominator for Snowball Metrics.
23 www.hesa.co.uk 24 www.ref.ac.uk/
3 5ov erv i ew
the definition of a researcherA Researcher is any faculty or staff member who could act as the principal investigator of a funding application and who spends >0% time on research.
This definition includes all those working in research-focused universities who have time allocated to research of any kind, such as:
• Researchers who engage in “traditional” lab work.• Clinicians who are doing even a small amount of research.• Librarians and professional research staff e.g. research associates who
are performing research solely with internal or philanthropic funds.
This definition excludes trainees including undergraduate and graduate students, post-doctoral researchers, and staff or faculty with limited-term or temporary appointments such as visiting scholars.
It is intended to define post-doctoral researchers as a distinct denominator in a future edition of this recipe book.
uK applicationA researcher is any institutional employee whose contract of employment, as defined by the Higher Education Statistics Agency’s (HESA25) Academic Employment Function field (ACEMPFUN), is either “2: Research-only” or “3: Teaching and research”, and who is also not flagged in the HESA Research Assistant field (RESAST) as “1: Research assistant”.
uS applicationThis is drawn from the annual federal Time & Effort Reporting , directed by the US Office of Management and Budget26.
the definition of FtE (full-time equivalent) countFTE count indicates the extent of a researcher’s workload that is focused on research.
FTE count is used to provide the option or normalizing for different sizes of institutions, and disciplines within those institutions. The FTE normalization option is included for those Snowball Metrics for which a larger institution or discipline would generally be expected to do more of whatever is being measured, and it not included for those Snowball Metrics
25 www.hesa.ac.uk 26 http://www.whitehouse.gov/omb/
3 6 s n ow ba ll m et r i c s r ec i p e b o o k
which are most likely to be affected by factors other than size, such as type of institution, disciplinary focus, strateg y and mission statement. For example:
• Scholarly Output is very strongly related to size, and so the recipe includes FTE normalization.
• Sustainable Spin-Offs is only loosely related to the research activities and the researchers that conducted them, and so the recipe does not include FTE normalization.
uK applicationThe FTE count of those Researchers returned by institutions to HESA.
uS applicationThis is drawn from the annual federal Time & Effort Reporting , directed by the US Office of Management and Budget.
the definition of funder-type This denominator is applied to:
• Applications Volume : to the count, price, or amount applied for.• Awards Volume : to the count and value of awards.• Income Volume : to the income spent.• Market Share : to research income.
37ov erv i ew
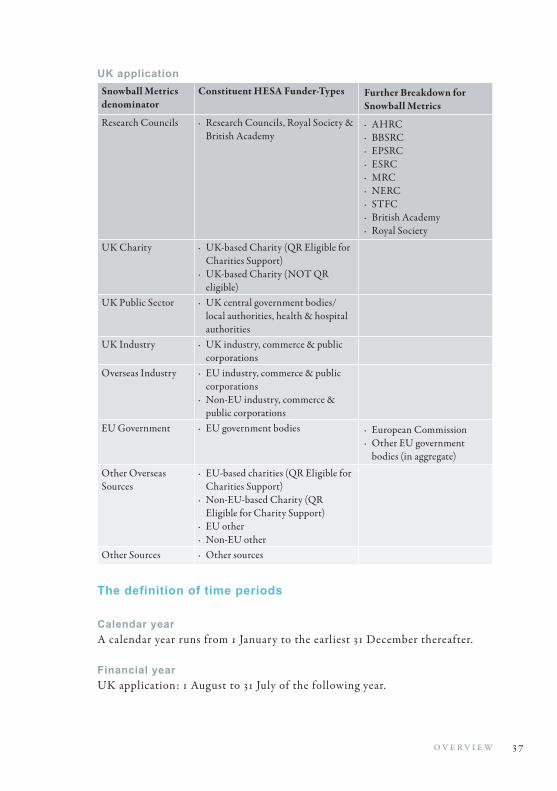
uK applicationSnowball Metrics denominator
Constituent HESA Funder-Types Further Breakdown for Snowball Metrics
Research Councils · Research Councils, Royal Society & British Academy
· AHRC · BBSRC · EPSRC · ESRC · MRC · NERC · STFC · British Academy · Royal Society
UK Charity · UK-based Charity (QR Eligible for Charities Support)
· UK-based Charity (NOT QR eligible)
UK Public Sector · UK central government bodies/local authorities, health & hospital authorities
UK Industry · UK industry, commerce & public corporations
Overseas Industry · EU industry, commerce & public corporations
· Non-EU industry, commerce & public corporations
EU Government · EU government bodies · European Commission · Other EU government
bodies (in aggregate)
Other Overseas Sources
· EU-based charities (QR Eligible for Charities Support)
· Non-EU-based Charity (QR Eligible for Charity Support)
· EU other · Non-EU other
Other Sources · Other sources
the definition of time periods
Calendar year A calendar year runs from 1 January to the earliest 31 December thereafter.
Financial yearUK application: 1 August to 31 July of the following year.
3 8 s n ow ba ll m et r i c s r ec i p e b o o k
QuarterA 3-month period, applied to Applications Volume and Awards Volume .
UK application to financial year: • 1 August to the earliest 31 October thereafter• 1 November to the earliest 31 January thereafter• 1 February to the earliest 30 April thereafter• 1 May to the earliest 31 July thereafter
CErIFication of Snowball MetricsCERIF, the Common European Research Information Format27 (CERIF), is a global data standard developed by euroCRIS28, a not-for-profit organization that is dedicated to the development and inter-operability of Current Research Information Systems (CRIS). euroCRIS is partnering with Snowball Metrics to express the recipes in CERIF, which is an important step towards benchmarking globally by exchanging Snowball Metrics generated in multiple different systems. The complete CERIF xml code for the original set of 10 Snowball Metrics, as prepared by euroCRIS, is available for download and use from the Snowball Metrics website29, and they will add the code for the new recipes published in this edition of the Recipe Book in due course.
The following principles have been applied in the CERIFication of Snowball Metrics:
• The CERIFication is performed by, and approved by, euroCRIS Task Groups.
• The CERIFication is carried out on the metric definition to ensure global relevance, rather than on the national applications.
• The principle of Snowball Metrics being system-agnostic is followed in that the data source is described, but not the methodolog y that a specific system uses to generate the metric value.
• The final calculated Snowball Metric will be exchanged between systems, rather than the separate components needed to generate the value. For example, when normalizing by FTE count, the normalized value is exchanged, and not the metric plus the separate FTE count from which the recipient would need then to complete the normalization themselves.
27 http://www.eurocris.org/Index.php?page=featuresCERIF&t=1 28 www.eurocris.org 29 www.snowballmetrics.com
3 9ov erv i ew
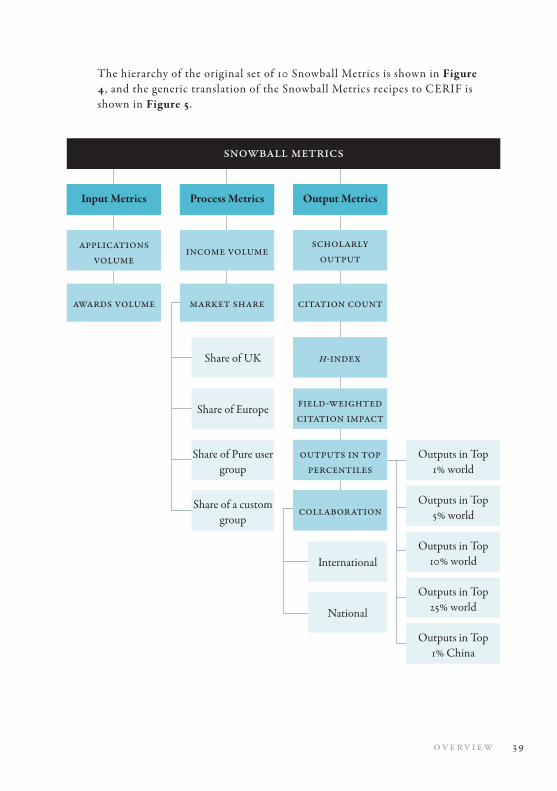
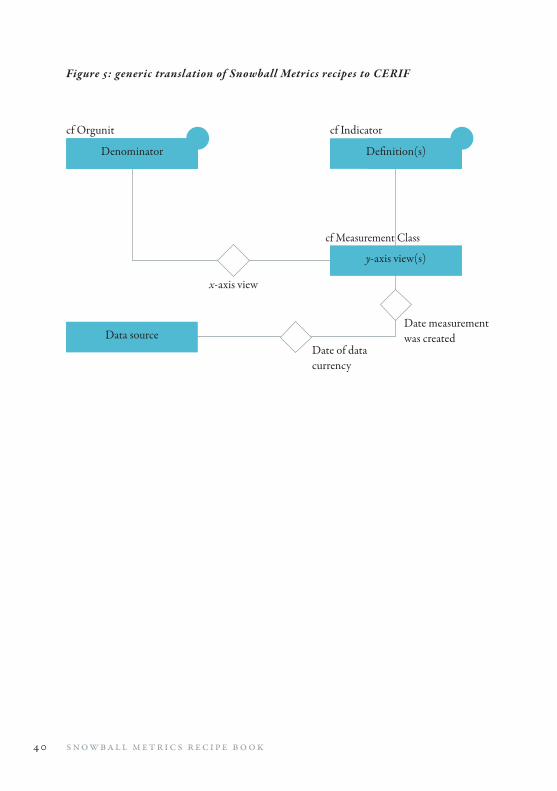
The hierarchy of the original set of 10 Snowball Metrics is shown in Figure 4, and the generic translation of the Snowball Metrics recipes to CERIF is shown in Figure 5.
snowball metrics
Input MetricsInput Metrics
applications volume
awards volume
Process MetricsProcess Metrics
income volume
market share
Share of UK
Share of Europe
Share of Pure user group
Share of a custom group
Output MetricsOutput Metrics
scholarly output
citation count
h-index
field-weighted citation impact
outputs in top percentiles
collaboration
International
National
Outputs in Top 1% world
Outputs in Top 5% world
Outputs in Top 10% world
Outputs in Top 25% world
Outputs in Top 1% China
40 s n ow ba ll m et r i c s r ec i p e b o o k
Figure 5: generic translation of Snowball Metrics recipes to CERIF
Input MetricsDenominator
Data source
Output MetricsDefinition(s)
y-axis view(s)
cf Orgunit
x-axis view
Date of data currency
Date measurement was created
cf Indicator
cf Measurement Class
4 1i n p u t m et r i c s
Input Metrics
This section details the methodologies for the following Snowball Metrics:
• Research Grants Metrics: • Applications Volume • Awards Volume• Enterprise Activities / Economic Development Metrics: • Academic-Industry Leverage • Business Consultancy Activities
InPu
t MEtr
ICS

4 2 s n ow ba ll m et r i c s r ec i p e b o o k
Figure 4: the hierarchy of the original set of 10 Snowball Metrics
4 3i n p u t m et r i c s
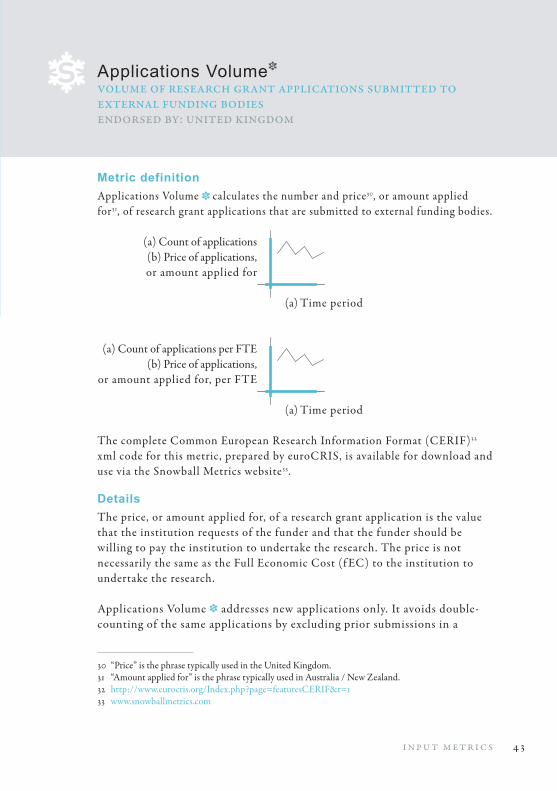
Applications Volumevolume of research grant applications submitted to external funding bodiesendorsed by: united kingdom
Metric definitionApplications Volume calculates the number and price30, or amount applied for31, of research grant applications that are submitted to external funding bodies.
(a) Count of applications (b) Price of applications, or amount applied for
(a) Time period
(a) Count of applications per FTE (b) Price of applications, or amount applied for, per FTE (a) Time period
The complete Common European Research Information Format (CERIF)32 xml code for this metric, prepared by euroCRIS, is available for download and use via the Snowball Metrics website33.
detailsThe price, or amount applied for, of a research grant application is the value that the institution requests of the funder and that the funder should be willing to pay the institution to undertake the research. The price is not necessarily the same as the Full Economic Cost (f EC) to the institution to undertake the research.
Applications Volume addresses new applications only. It avoids double-counting of the same applications by excluding prior submissions in a
30 “Price” is the phrase typically used in the United Kingdom.31 “Amount applied for” is the phrase typically used in Australia / New zealand.32 http://www.eurocris.org/Index.php?page=featuresCERIF&t=1 33 www.snowballmetrics.com
4 4 s n ow ba ll m et r i c s r ec i p e b o o k
multi-stage application process such as outlines and expressions of interest. For example:
• A £1m application is submitted as an expression of interest. At this stage, it should be included in Applications Volume .
• If the application is declined, then the expression of interest is considered to be the application, and is counted within Applications Volume .
• If the application is reviewed favorably and invited to proceed to the full submission stage, then the full application is considered to be the application, and replaces the expression of interest. It is not the intention for the £1m application to be considered as both an expression of interest and as a full application, but only counted once as the most recent.
Supplements should be treated as new applications. For example: • Consider an application for a total of £1m, to start in financial year
2007/2008.• If there is a single application, this will be recorded as £1m in financial
year 2007/2008.• If there are 5 annual applications, each of £200k, then a new
application of £200k is recorded for each of the financial years 2007/2008, 2008/2009, and so on to 2011/2012.
The date used is the date on which the application is submitted to the funding body.
Primary data source• Institutional research grant application system or Current Research
Information System (CRIS)
uK applicationDenominators derived from institutional data :
• HESA cost centre, via prorated mapping of departments to HESA cost centres. This mapping is done on the basis of the HESA cost centre assignment of the application’s principal investigator.
• Funder-type• Institution
Time period:• Financial year• Quarter of financial year
4 5i n p u t m et r i c s
The applications considered are those that reflect activities where the resultant spend would be returned as research grants and contracts income in the HESA financial return34. This excludes, for example:
• Any research funding that would be passed to a collaborating institution.
• Any activity that would not be considered eligible for HESA reporting , such as training activities like Doctoral Training Centres / Grants / Awards, and EU Partner elements.
Currency: British pounds (GBP).
Future opportunitiesProrated mapping of departments to HESA cost centres, on the basis of the assignment of the principal investigator, has been agreed in the UK application of this Snowball Metric. In a subset of cases, institutions also capture co-investigators in their grant application systems; the principal investigator approach was agreed since it is inclusive and ensures that all institutions can use the same methodolog y. It is an interesting opportunity for the future to consider a mapping according to co-investigators as well as to the principal investigator.
A denominator reflecting themes and subject focus of the competitive funding applications would be highly valued, especially if the same thematic denominator could be applied not only to Input, but also to Process, and Output and Outcome, metrics. Most likely, an automated way of assigning subject fields based on abstracts of the items in question, such as submissions or publications, would be needed to enable this.
A critical mass of national funding bodies might be considered a source of data for this metric.
Applications Volume may not lend itself as easily as some other Snowball Metrics to global benchmarking , due to distinct national characteristics of competitive funding structures. It might best be viewed as a metric with multiple national flavors.
34 http://www.hesa.ac.uk/index.php?option=com_content&task=view&id=1145&Itemid=233

4 6 s n ow ba ll m et r i c s r ec i p e b o o k
47i n p u t m et r i c s
Awards Volumevolume of awards granted and available to be spentendorsed by: united kingdom
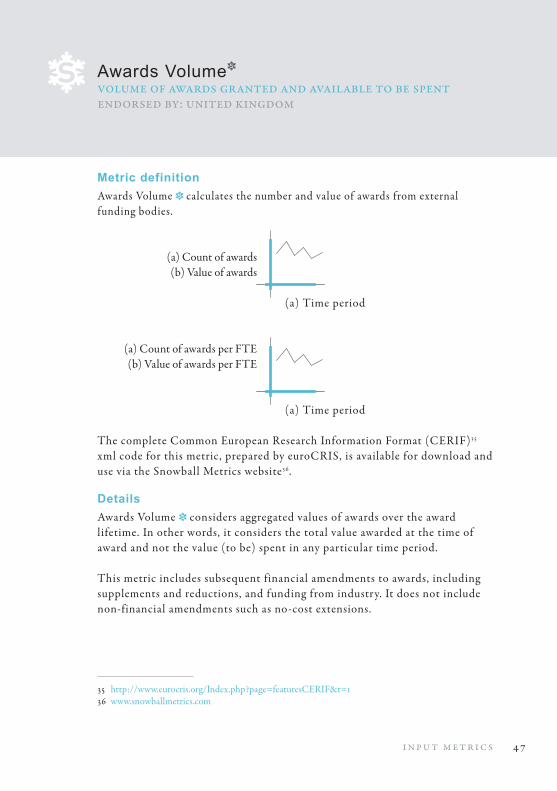
Metric definitionAwards Volume calculates the number and value of awards from external funding bodies.
(a) Count of awards (b) Value of awards
(a) Time period
(a) Count of awards per FTE (b) Value of awards per FTE
(a) Time period
The complete Common European Research Information Format (CERIF)35 xml code for this metric, prepared by euroCRIS, is available for download and use via the Snowball Metrics website36.
detailsAwards Volume considers aggregated values of awards over the award lifetime. In other words, it considers the total value awarded at the time of award and not the value (to be) spent in any particular time period.
This metric includes subsequent financial amendments to awards, including supplements and reductions, and funding from industry. It does not include non-financial amendments such as no-cost extensions.
35 http://www.eurocris.org/Index.php?page=featuresCERIF&t=1 36 www.snowballmetrics.com
4 8 s n ow ba ll m et r i c s r ec i p e b o o k
Amendments to the value of the original award, whether positive or negative, should be treated as new awards. For example:
• A £1m award is received in financial year 2007/2008.• If this award is increased by £0.5m in financial year 2010/2011, an
award of £0.5m, not £1.5m, is recorded in financial year 2010/2011.• If the award is then reduced by £0.2m in financial year 2011/2012, an
award of -£0.2m, not £1.3m, is recorded in financial year 2011/2012.
Income received from a spin out company acting as a funder of research to the university is included in Award Volume . However, any funding that a spin out company receives, as a separate entity to the university, is not included.
The date used is the date on which the award is entered in the institutional grants system.
Primary data source• Institutional grants system or Current Research Information System (CRIS)
uK applicationDenominators derived from institutional data :
• HESA cost centre, via prorated mapping of departments to HESA cost centres. This mapping is done on the basis of the HESA cost centre assignment of the application’s principal investigator.
• Funder-type• Institution
Time period:• Financial year• Quarter of financial year
Awards considered reflect activities where the resultant spend would be returned as research grants and contracts income in the HESA financial return37.
This excludes, for example: • Any research funding that would be passed to a collaborating
institution.• Any activity that would not be considered eligible for HESA reporting ,
such as training activities like Doctoral Training Centres / Grants / Awards, and EU Partner elements.
37 http://www.hesa.ac.uk/index.php?option=com_content&task=view&id=1145&Itemid=233
49i n p u t m et r i c s
Currency: British pounds (GBP).
Future opportunitiesProrated mapping of departments to HESA cost centres, on the basis of the assignment of the principal investigator, has been agreed in the UK application of this Snowball Metric. In a subset of cases, institutions also capture co-investigators in their grant application systems; the principal investigator approach was agreed since it is inclusive and ensures that all institutions can use the same methodolog y. It is an interesting opportunity for the future to consider a mapping according to co-investigators as well as to the principal investigator.
A denominator reflecting themes and subject focus of awards granted would be highly valued, especially if the same thematic denominator could be applied not only to Input, but also to Process, and Output and Outcome, metrics. Most likely, an automated way of assigning subject fields based on abstracts of the items in question, such as submissions or publications, would be needed to enable this.
A critical mass of national funding bodies might be considered a source of data for this metric.
Awards Volume may not lend itself as easily as some other Snowball Metrics to global benchmarking , due to distinct national characteristics of competitive funding structures. It might best be viewed as a metric with multiple national flavors.
The date used is the date that the award is entered in the institutional grants system. This date was selected for pragmatic reasons since it is always available, and ensures that all awards are included. The preferred date of award notification is not consistently available, and would result in less comparable values.

50 s n ow ba ll m et r i c s r ec i p e b o o k
51i n p u t m et r i c s
Academic-Industry Leverageprivate investment leveraged from public sponsorshipendorsed by: united kingdom
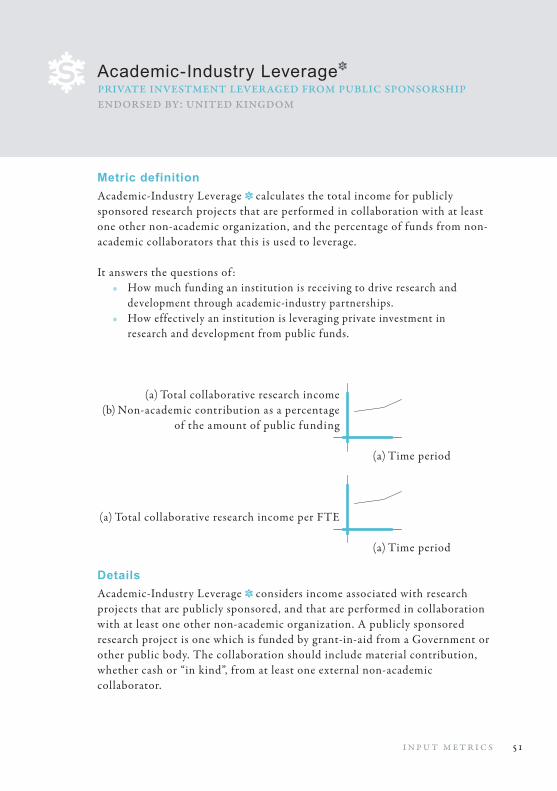
Metric definitionAcademic-Industry Leverage calculates the total income for publicly sponsored research projects that are performed in collaboration with at least one other non-academic organization, and the percentage of funds from non-academic collaborators that this is used to leverage.
It answers the questions of :• How much funding an institution is receiving to drive research and
development through academic-industry partnerships.• How effectively an institution is leveraging private investment in
research and development from public funds.
(a) Total collaborative research income (b) Non-academic contribution as a percentage of the amount of public funding
(a) Time period
(a) Total collaborative research income per FTE
(a) Time period
detailsAcademic-Industry Leverage considers income associated with research projects that are publicly sponsored, and that are performed in collaboration with at least one other non-academic organization. A publicly sponsored research project is one which is funded by grant-in-aid from a Government or other public body. The collaboration should include material contribution, whether cash or “in kind”, from at least one external non-academic collaborator.
5 2 s n ow ba ll m et r i c s r ec i p e b o o k
The total income is the sum of income from both public funding , and from non-academic collaborators.
The non-academic contribution is the sum of cash and in kind contributions.
Primary data sources• Institutional accounts system or Current Research Information System
(CRIS)• Published annual accounts• National statutory reports, such as those available from the Higher
Education Statistics Agency38 (HESA) in the UK
uK applicationDenominator derived from institutional data : institution.
Time period: financial year.
Currency: British pounds (GBP).
38 www.hesa.ac.uk
5 3i n p u t m et r i c s
Business Consultancy Activitiesvolume of business engagementsendorsed by: united kingdom
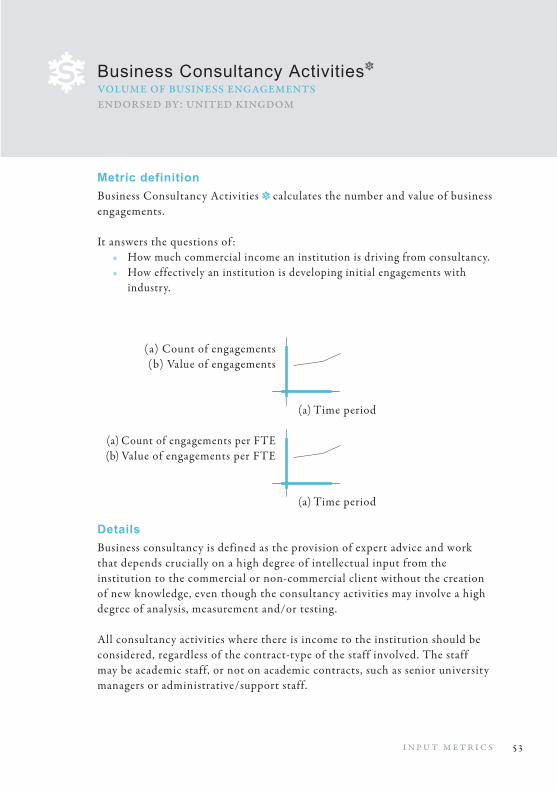
Metric definitionBusiness Consultancy Activities calculates the number and value of business engagements.
It answers the questions of :• How much commercial income an institution is driving from consultancy.• How effectively an institution is developing initial engagements with
industry.
(a) Count of engagements (b) Value of engagements
(a) Time period
(a) Count of engagements per FTE (b) Value of engagements per FTE
(a) Time period
detailsBusiness consultancy is defined as the provision of expert advice and work that depends crucially on a high degree of intellectual input from the institution to the commercial or non-commercial client without the creation of new knowledge, even though the consultancy activities may involve a high degree of analysis, measurement and/or testing.
All consultancy activities where there is income to the institution should be considered, regardless of the contract-type of the staff involved. The staff may be academic staff, or not on academic contracts, such as senior university managers or administrative/support staff.
54 s n ow ba ll m et r i c s r ec i p e b o o k
Primary data sources• Institutional accounts system or Current Research Information System
(CRIS)• Published annual accounts• National statutory reports, such as those available from the Higher
Education Statistics Agency39 (HESA) in the UK
uK applicationDenominator derived from institutional data : institution.Time period: financial year.
Currency: British pounds (GBP).
39 www.hesa.ac.uk
55p ro c ess m et r i c s
Process Metrics
This section details the methodologies for the following Snowball Metrics:
• Research Grants Metrics:• Income Volume• Market Volume
• Enterprise Activities / Economic Development Metrics:• Contract Research Volume
Pro
CESS M
EtrIC
S

56 s n ow ba ll m et r i c s r ec i p e b o o k
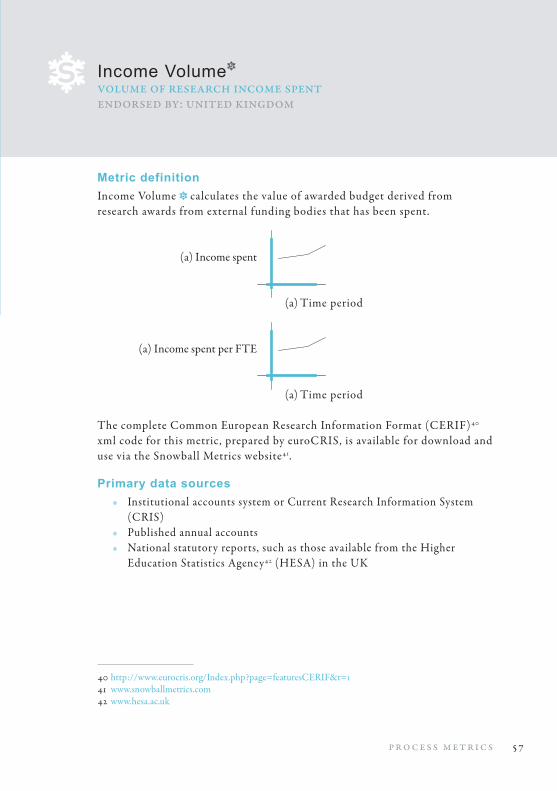
57p ro c ess m et r i c s
Income Volume volume of research income spentendorsed by: united kingdom
Metric definitionIncome Volume calculates the value of awarded budget derived from research awards from external funding bodies that has been spent.
(a) Income spent
(a) Time period
(a) Income spent per FTE
(a) Time period
The complete Common European Research Information Format (CERIF)40 xml code for this metric, prepared by euroCRIS, is available for download and use via the Snowball Metrics website41.
Primary data sources• Institutional accounts system or Current Research Information System
(CRIS)• Published annual accounts• National statutory reports, such as those available from the Higher
Education Statistics Agency42 (HESA) in the UK
40 http://www.eurocris.org/Index.php?page=featuresCERIF&t=1 41 www.snowballmetrics.com 42 www.hesa.ac.uk
58 s n ow ba ll m et r i c s r ec i p e b o o k
uK applicationDenominators derived from institutional data :
• HESA cost centre• Funder-type• Institution
Time period: financial year.
Income data available from the HESA Finance Record43 are used to generate Income Volume .
Currency: British pounds (GBP).
Future opportunitiesA denominator reflecting themes and subject focus of income would be highly valued, especially if the same thematic denominator could be applied not only to Process, but also to Input, and Output and Outcome, metrics. Most likely, an automated way of assigning subject fields based on abstracts of the items in question, such as submissions or publications, would be needed to enable this.
Income Volume may not lend itself as easily as some other Snowball Metrics to global benchmarking , due to distinct national characteristics of competitive funding structures. It might best be viewed as a metric with multiple national flavors.
43 http://www.hesa.ac.uk/index.php?option=com_pubs&task=show_pub_detail&pubid=1710&Itemid=286
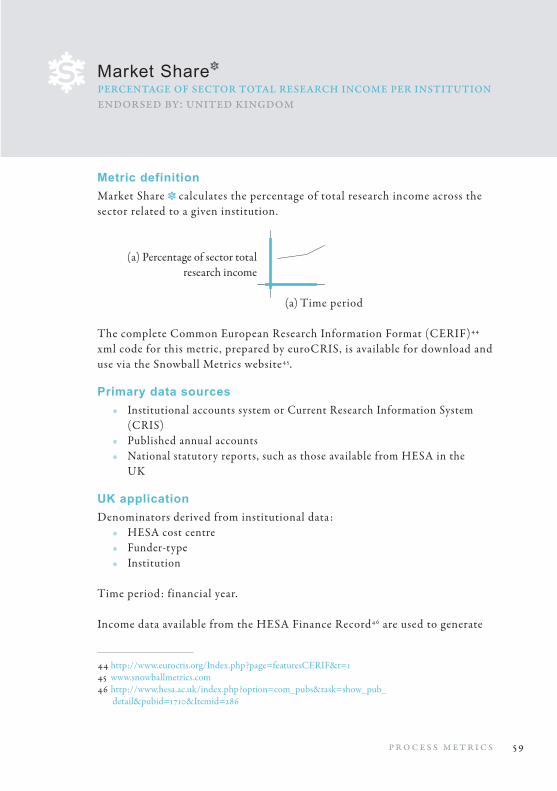
59p ro c ess m et r i c s
Market Sharepercentage of sector total research income per institutionendorsed by: united kingdom
Metric definitionMarket Share calculates the percentage of total research income across the sector related to a given institution.
(a) Percentage of sector total research income
(a) Time period
The complete Common European Research Information Format (CERIF)44 xml code for this metric, prepared by euroCRIS, is available for download and use via the Snowball Metrics website45.
Primary data sources• Institutional accounts system or Current Research Information System
(CRIS)• Published annual accounts• National statutory reports, such as those available from HESA in the
UK
uK applicationDenominators derived from institutional data :
• HESA cost centre• Funder-type• Institution
Time period: financial year.
Income data available from the HESA Finance Record46 are used to generate
44 http://www.eurocris.org/Index.php?page=featuresCERIF&t=1 45 www.snowballmetrics.com 46 http://www.hesa.ac.uk/index.php?option=com_pubs&task=show_pub_
detail&pubid=1710&Itemid=286
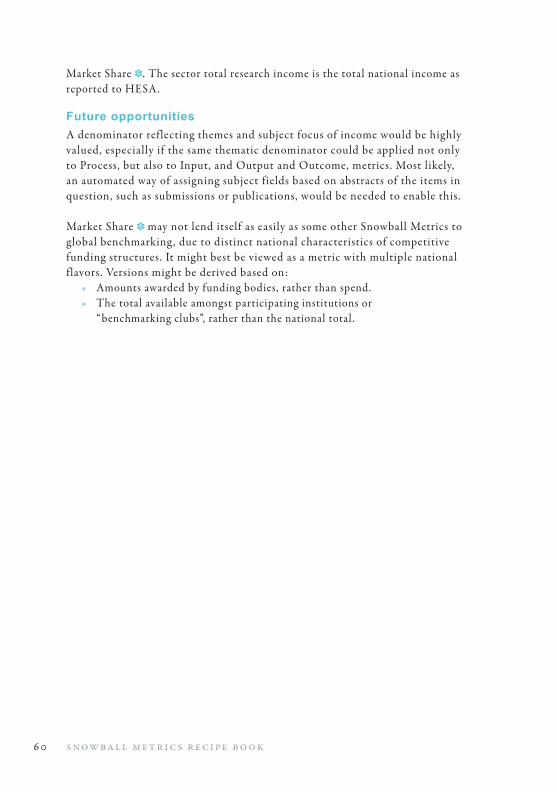
6 0 s n ow ba ll m et r i c s r ec i p e b o o k
Market Share . The sector total research income is the total national income as reported to HESA.
Future opportunitiesA denominator reflecting themes and subject focus of income would be highly valued, especially if the same thematic denominator could be applied not only to Process, but also to Input, and Output and Outcome, metrics. Most likely, an automated way of assigning subject fields based on abstracts of the items in question, such as submissions or publications, would be needed to enable this.
Market Share may not lend itself as easily as some other Snowball Metrics to global benchmarking , due to distinct national characteristics of competitive funding structures. It might best be viewed as a metric with multiple national flavors. Versions might be derived based on:
• Amounts awarded by funding bodies, rather than spend.• The total available amongst participating institutions or
“benchmarking clubs”, rather than the national total.
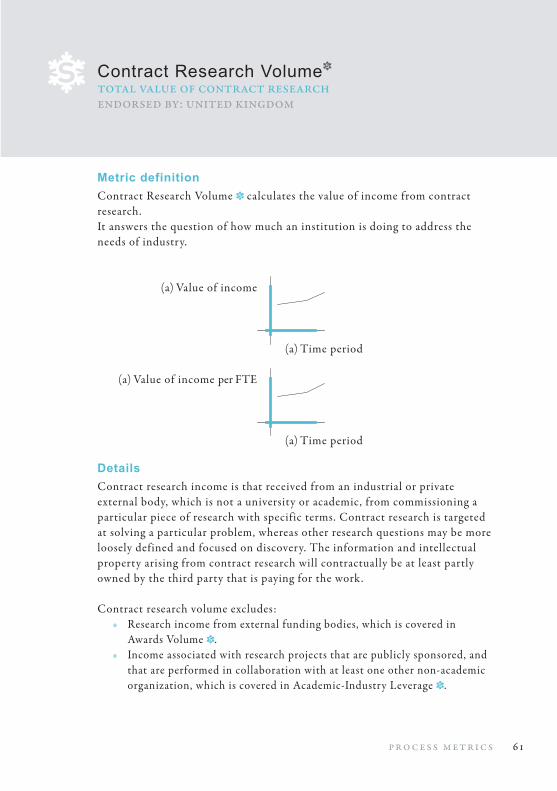
61p ro c ess m et r i c s
Contract Research Volumetotal value of contract researchendorsed by: united kingdom
Metric definitionContract Research Volume calculates the value of income from contract research.It answers the question of how much an institution is doing to address the needs of industry.
(a) Value of income
(a) Time period
(a) Value of income per FTE
(a) Time period
detailsContract research income is that received from an industrial or private external body, which is not a university or academic, from commissioning a particular piece of research with specific terms. Contract research is targeted at solving a particular problem, whereas other research questions may be more loosely defined and focused on discovery. The information and intellectual property arising from contract research will contractually be at least partly owned by the third party that is paying for the work.
Contract research volume excludes:• Research income from external funding bodies, which is covered in
Awards Volume .• Income associated with research projects that are publicly sponsored, and
that are performed in collaboration with at least one other non-academic organization, which is covered in Academic-Industry Leverage .
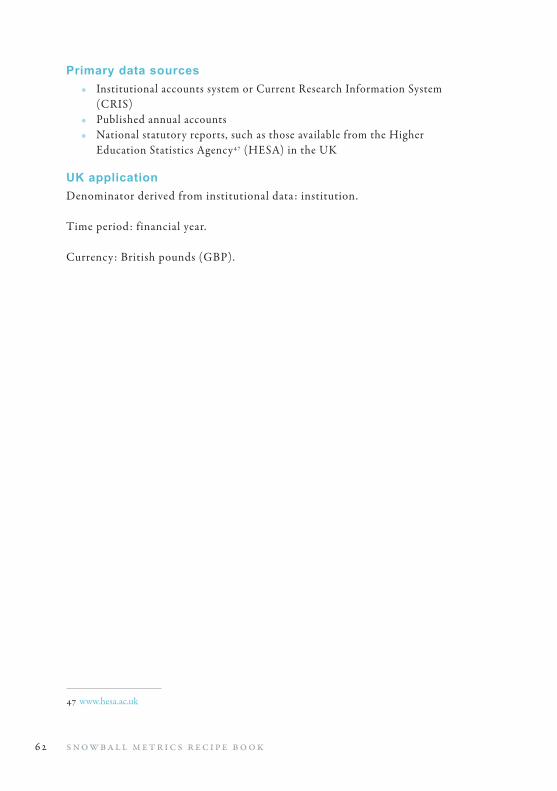
62 s n ow ba ll m et r i c s r ec i p e b o o k
Primary data sources• Institutional accounts system or Current Research Information System
(CRIS)• Published annual accounts• National statutory reports, such as those available from the Higher
Education Statistics Agency47 (HESA) in the UK
uK applicationDenominator derived from institutional data : institution.
Time period: financial year.
Currency: British pounds (GBP).
47 www.hesa.ac.uk
63o u t p u t a n d o u tco m e m et r i c s
output and outcome Metrics
This section details the methodologies for the following Snowball Metrics:• Research Grants Metrics:
• Publications and Citations• Scholarly Output• Citation Count• Citations per Output• h-index• Field-Weighted Citation Impact • Outputs in Top Percentiles• Publications in Top Journal Percentiles
• Collaboration Metrics• Collaboration• Collaboration Impact• Academic-Corporate Collaboration• Academic-Corporate Collaboration Impact
• Esteem and Socio-Economic Impact Metrics• Altmetrics• Public Engagement
• Enterprise Activities / Economic Development Metrics:• Intellectual Property Volume• Intellectual Property Income• Sustainable Spin-Offs• Spin-Off-Related Finances
ou
tPut A
nd
ou
tCo
ME M
EtrIC
S

64 s n ow ba ll m et r i c s r ec i p e b o o k
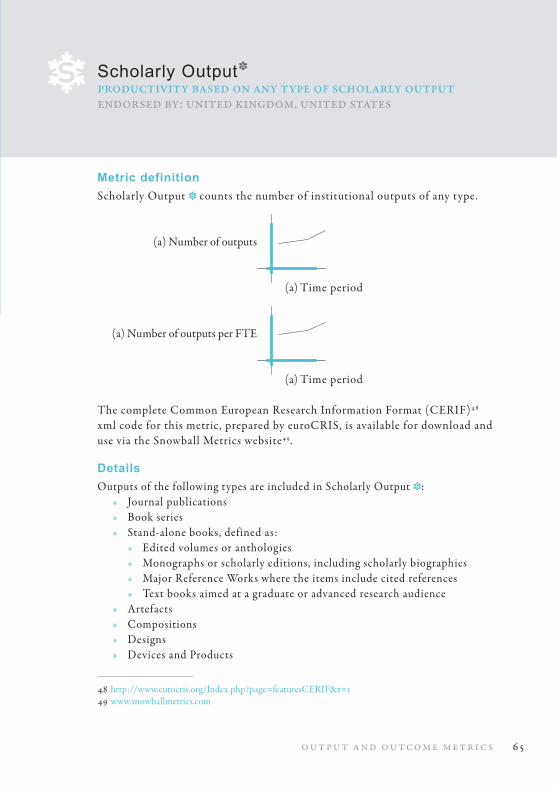
65o u t p u t a n d o u tco m e m et r i c s
Scholarly Outputproductivity based on any type of scholarly outputendorsed by: united kingdom, united states
Metric definitionScholarly Output counts the number of institutional outputs of any type.
(a) Number of outputs
(a) Time period
(a) Number of outputs per FTE
(a) Time period
The complete Common European Research Information Format (CERIF)48 xml code for this metric, prepared by euroCRIS, is available for download and use via the Snowball Metrics website49.
detailsOutputs of the following types are included in Scholarly Output :
• Journal publications• Book series• Stand-alone books, defined as:
• Edited volumes or anthologies• Monographs or scholarly editions, including scholarly biographies• Major Reference Works where the items include cited references• Text books aimed at a graduate or advanced research audience
• Artefacts• Compositions• Designs• Devices and Products
48 http://www.eurocris.org/Index.php?page=featuresCERIF&t=1 49 www.snowballmetrics.com
66 s n ow ba ll m et r i c s r ec i p e b o o k
• Digital or visual media• Exhibitions• Internet publications• Performances• Reports, whether confidential, technical or commissioned• Software
Outputs of the following types are excluded from Scholarly Output : • Patents (they are counted in Intellectual Property Volume)• Theses (these will be addressed separately in the post-graduate research
metrics)
Scholarly Output defines the total count of items, to represent productivity. It may be useful to be able to count and/or exclude sub-groups from the total count; these sub-sets will not be defined by Snowball Metrics, but left to the discretion of the implementer.
Primary data sources• Institutional output repository or Current Research Information
System (CRIS)• Scopus• Web of Science / Book Citation Index• Google Scholar• WorldCat50
uK applicationDenominators derived from institutional data :
• HESA cost centre. Outputs are associated with a HESA cost centre via the researcher(s) who produced them.
• Institution
Time period: calendar year.
Future opportunitiesCommercial abstracting and indexing databases continue to extend their degree of coverage of an institution’s output to give a more comprehensive picture of an institution’s activity.
50 www.worldcat.org/
67o u t p u t a n d o u tco m e m et r i c s
The HESA cost centre denominator can be replaced by any assignment of researchers to groupings that are shared across institutions nationally and internationally. Examples would be the grouping of researchers into clusters for national evaluation exercises.
A denominator reflecting the themes and subject focus of outputs would be highly valued, especially if the same thematic denominator could be applied not only to Output and Outcome, but also to Input and Process, metrics. Most likely, an automated way of assigning subject fields based on abstracts of the items in question, such as submissions or publications, would be needed to enable this.

6 8 s n ow ba ll m et r i c s r ec i p e b o o k
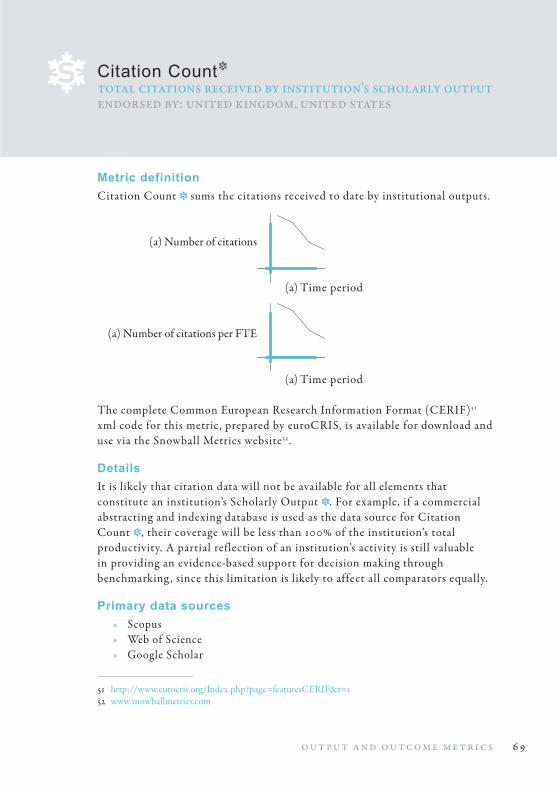
6 9o u t p u t a n d o u tco m e m et r i c s
Citation Counttotal citations received by institution’s scholarly outputendorsed by: united kingdom, united states
Metric definitionCitation Count sums the citations received to date by institutional outputs.
(a) Number of citations
(a) Time period
(a) Number of citations per FTE
(a) Time period
The complete Common European Research Information Format (CERIF)51 xml code for this metric, prepared by euroCRIS, is available for download and use via the Snowball Metrics website52.
detailsIt is likely that citation data will not be available for all elements that constitute an institution’s Scholarly Output . For example, if a commercial abstracting and indexing database is used as the data source for Citation Count , their coverage will be less than 100% of the institution’s total productivity. A partial reflection of an institution’s activity is still valuable in providing an evidence-based support for decision making through benchmarking , since this limitation is likely to affect all comparators equally.
Primary data sources• Scopus• Web of Science• Google Scholar
51 http://www.eurocris.org/Index.php?page=featuresCERIF&t=1 52 www.snowballmetrics.com
70 s n ow ba ll m et r i c s r ec i p e b o o k
uK applicationDenominators derived from institutional data :
• HESA cost centre. Outputs are associated with a HESA cost centre via the researcher(s) who produced them
• Institution
Time period: calendar year. Note that the time period does not refer to the year in which citations were received, but to the year in which outputs were produced.
Future opportunitiesCommercial abstracting and indexing databases continue to extend their degree of coverage of an institution’s output to give a more comprehensive picture of an institution’s activity.
The HESA cost centre denominator can be replaced by any assignment of researchers to groupings that are shared across institutions nationally and internationally. Examples would be the grouping of researchers into clusters for national evaluation exercises.
A denominator reflecting the themes and subject focus of outputs would be highly valued, especially if the same thematic denominator could be applied not only to Output and Outcome, but also to Input and Process, metrics. Most likely, an automated way of assigning subject fields based on abstracts of the items in question, such as submissions or publications, would be needed to enable this.
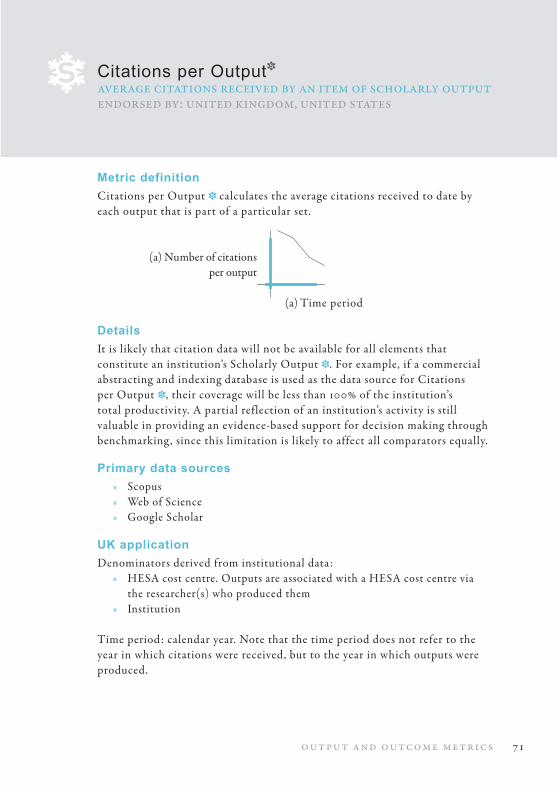
71o u t p u t a n d o u tco m e m et r i c s
Citations per Outputaverage citations received by an item of scholarly outputendorsed by: united kingdom, united states
Metric definitionCitations per Output calculates the average citations received to date by each output that is part of a particular set.
(a) Number of citations per output
(a) Time period
detailsIt is likely that citation data will not be available for all elements that constitute an institution’s Scholarly Output . For example, if a commercial abstracting and indexing database is used as the data source for Citations per Output , their coverage will be less than 100% of the institution’s total productivity. A partial reflection of an institution’s activity is still valuable in providing an evidence-based support for decision making through benchmarking , since this limitation is likely to affect all comparators equally.
Primary data sources• Scopus• Web of Science• Google Scholar
uK applicationDenominators derived from institutional data :
• HESA cost centre. Outputs are associated with a HESA cost centre via the researcher(s) who produced them
• Institution
Time period: calendar year. Note that the time period does not refer to the year in which citations were received, but to the year in which outputs were produced.
72 s n ow ba ll m et r i c s r ec i p e b o o k
Future opportunitiesCommercial abstracting and indexing databases continue to extend their degree of coverage of an institution’s output to give a more comprehensive picture of an institution’s activity.
The HESA cost centre denominator can be replaced by any assignment of researchers to groupings that are shared across institutions nationally and internationally. Examples would be the grouping of researchers into clusters for national evaluation exercises.
A denominator reflecting the themes and subject focus of outputs would be highly valued, especially if the same thematic denominator could be applied not only to Output and Outcome, but also to Input and Process, metrics. Most likely, an automated way of assigning subject fields based on abstracts of the items in question, such as submissions or publications, would be needed to enable this.
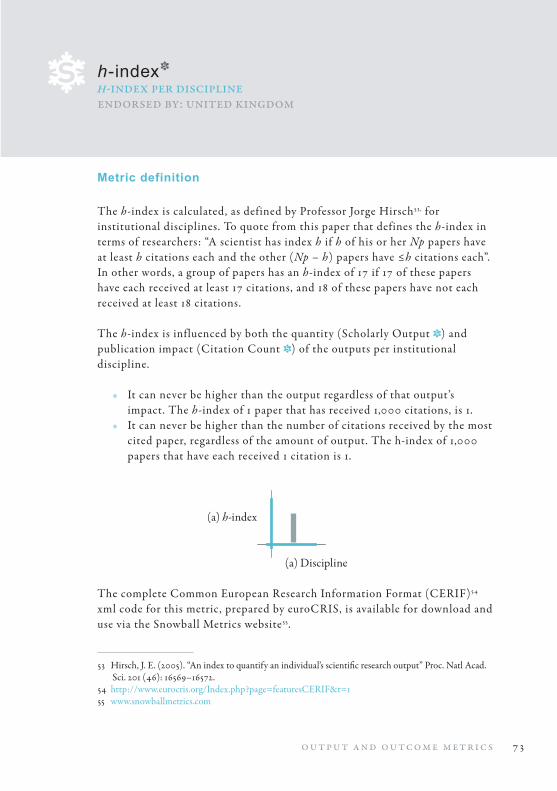
7 3o u t p u t a n d o u tco m e m et r i c s
h-indexh-index per disciplineendorsed by: united kingdom
Metric definition
The h-index is calculated, as defined by Professor Jorge Hirsch53, for institutional disciplines. To quote from this paper that defines the h-index in terms of researchers: “A scientist has index h if h of his or her Np papers have at least h citations each and the other (Np – h) papers have ≤h citations each”. In other words, a group of papers has an h-index of 17 if 17 of these papers have each received at least 17 citations, and 18 of these papers have not each received at least 18 citations.
The h-index is influenced by both the quantity (Scholarly Output ) and publication impact (Citation Count ) of the outputs per institutional discipline.
• It can never be higher than the output regardless of that output’s impact. The h-index of 1 paper that has received 1,000 citations, is 1.
• It can never be higher than the number of citations received by the most cited paper, regardless of the amount of output. The h-index of 1,000 papers that have each received 1 citation is 1.
(a) h-index
(a) Discipline
The complete Common European Research Information Format (CERIF)54 xml code for this metric, prepared by euroCRIS, is available for download and use via the Snowball Metrics website55.
53 Hirsch, J. E. (2005). “An index to quantify an individual’s scientific research output” Proc. Natl Acad. Sci. 201 (46): 16569–16572.
54 http://www.eurocris.org/Index.php?page=featuresCERIF&t=1 55 www.snowballmetrics.com
74 s n ow ba ll m et r i c s r ec i p e b o o k
detailsThe h-index is not calculated at institutional level. The h-index was originally conceived of as a useful reflection of a researcher’s accumulated career, and is represented by a single number which stays the same or increases with time, but which cannot go down. One of the aims of Snowball Metrics is to understand current excellence in recent university performance, and as such metrics values must be able to fall as well as increase: h-index does not encompass this possibility. The project partners are using h-index as it was intended, for researcher-related, disciplinary denominators only.
It is likely that citation data will not be available for all elements that constitute an institution’s Scholarly Output . For example, if a commercial abstracting and indexing database is used as the data source for the h-index , their coverage will be less than 100% of the institution’s total productivity. A partial reflection of an institution’s activity is still valuable in providing an evidence-based support for decision making through benchmarking , since this limitation is likely to affect all comparators equally.
Primary data sources• Scopus• Web of Science• Google Scholar
uK applicationDenominator derived from institutional data : HESA cost centre, via assignment of a researcher associated with an output to a HESA cost centre.
Future opportunitiesCommercial abstracting and indexing databases extend their degree of coverage of an institution’s output to give a more comprehensive picture of an institution’s activity.
The HESA cost centre denominator can be replaced by any assignment of researchers to groupings that are shared across institutions nationally and internationally. Examples would be the grouping of researchers into clusters for national evaluation exercises.
A denominator reflecting the themes and subject focus of outputs would be highly valued, especially if the same thematic denominator could be applied not only to Output and Outcome, but also to Input and Process, metrics. Most likely, an automated way of assigning subject fields based on abstracts of the items in question, such as submissions or publications, would be needed to enable this.
75o u t p u t a n d o u tco m e m et r i c s
Field-Weighted Citation Impact actual citation count relative to the expected world citation countendorsed by: united kingdom, united states
Metric definitionField-Weighted Citation Impact is the ratio of the citations actually received by the denominator’s output, and the average number of citations received by all other similar publications. A Field-Weighted Citation Impact of :
• Exactly 1.00 means that the output performs just as expected for the global average.
• More than 1.00 means that the output is more cited than expected according to the global average; for example, 1.48 means 48% more cited than expected.
• Less than 1 means that the output is cited less than expected according to the global average; for example, 0.91 means 9% less cited than expected.
Field-Weighted Citation Impact takes into account the differences in research behaviour across disciplines. It is particularly useful for a denominator that combines a number of different fields, or when comparing between fields, although it can be applied to any denominator:
• Researchers working in fields such as medicine and biochemistry typically produce more output, with more co-authors and longer reference lists, than researchers working in fields such as mathematics and education; this is a reflection of research culture, and not performance.
• If these differences are not accounted for:• The effects of outputs in medicine and biochemistry will dominate
the effects of those in mathematics and education, in a denominator comprising multiple disciplines, such as an institution.
• Different levels of performance will be disguised by these characteristic behavioral traits when comparing between disciplines.
• This means that, if using non-weighted metrics, an institution that is focused on medicine will generally appear to perform better than an institution that specializes in social sciences.
• The methodolog y of Field-Weighted Citation Impact accounts for these disciplinary differences
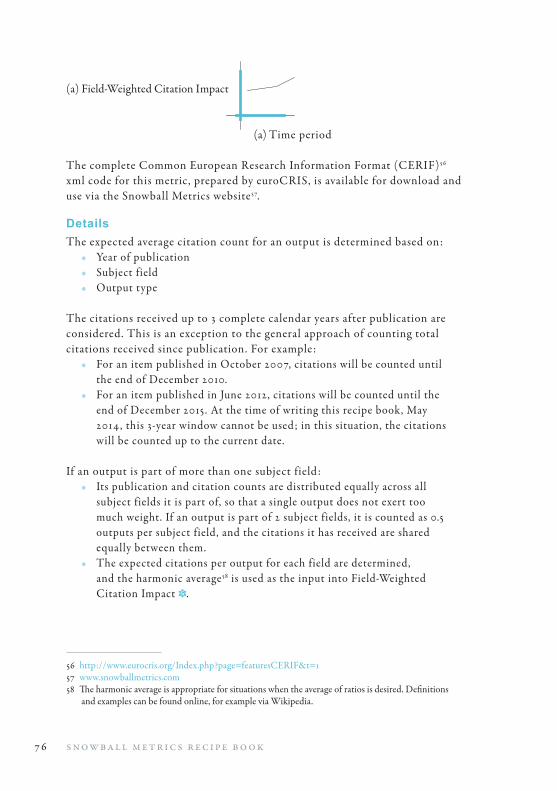
76 s n ow ba ll m et r i c s r ec i p e b o o k
(a) Field-Weighted Citation Impact
(a) Time period
The complete Common European Research Information Format (CERIF)56 xml code for this metric, prepared by euroCRIS, is available for download and use via the Snowball Metrics website57.
detailsThe expected average citation count for an output is determined based on:
• year of publication• Subject field • Output type
The citations received up to 3 complete calendar years after publication are considered. This is an exception to the general approach of counting total citations received since publication. For example:
• For an item published in October 2007, citations will be counted until the end of December 2010.
• For an item published in June 2012, citations will be counted until the end of December 2015. At the time of writing this recipe book, May 2014, this 3-year window cannot be used; in this situation, the citations will be counted up to the current date.
If an output is part of more than one subject field:• Its publication and citation counts are distributed equally across all
subject fields it is part of, so that a single output does not exert too much weight. If an output is part of 2 subject fields, it is counted as 0.5 outputs per subject field, and the citations it has received are shared equally between them.
• The expected citations per output for each field are determined, and the harmonic average58 is used as the input into Field-Weighted Citation Impact .
56 http://www.eurocris.org/Index.php?page=featuresCERIF&t=1 57 www.snowballmetrics.com 58 The harmonic average is appropriate for situations when the average of ratios is desired. Definitions
and examples can be found online, for example via Wikipedia.
77o u t p u t a n d o u tco m e m et r i c s
If an output is not assigned to a subject field, for whatever reason, then it will not be represented in the calculation.
The actual / expected ratio per output in the time period is first calculated, and then the average of these ratios is determined.
It is likely that citation data will not be available for all elements that constitute an institution’s Scholarly Output . For example, if a commercial abstracting and indexing database is used as the data source for Field-Weighted Citation Impact , their coverage will be less than 100% of the institution’s total productivity. A partial reflection of an institution’s activity is still valuable in providing an evidence-based support for decision making through benchmarking , since this limitation is likely to affect all comparators equally.
Primary data sources• Scopus • Web of Science • Google Scholar
uK applicationDenominators derived from institutional data :
• HESA cost centre. Outputs are associated with a HESA cost centre via the researcher(s) who produced them.
• Institution
Time period: calendar year. Note that the time period does not refer to the year in which citations were received, but to the year in which outputs were produced.
Future opportunitiesCommercial abstracting and indexing databases extend their degree of coverage of an institution’s output to give a more comprehensive picture of an institution’s activity.
The HESA cost centre denominator can be replaced by any assignment of researchers to groupings that are shared across institutions nationally and internationally. Examples would be the grouping of researchers into clusters for national evaluation exercises.
A denominator reflecting the themes and subject focus of outputs would be highly valued, especially if the same thematic denominator could be applied

78 s n ow ba ll m et r i c s r ec i p e b o o k
not only to Output and Outcome, but also to Input and Process, metrics. Most likely, an automated way of assigning subject fields based on abstracts of the items in question, such as submissions or publications, would be needed to enable this.
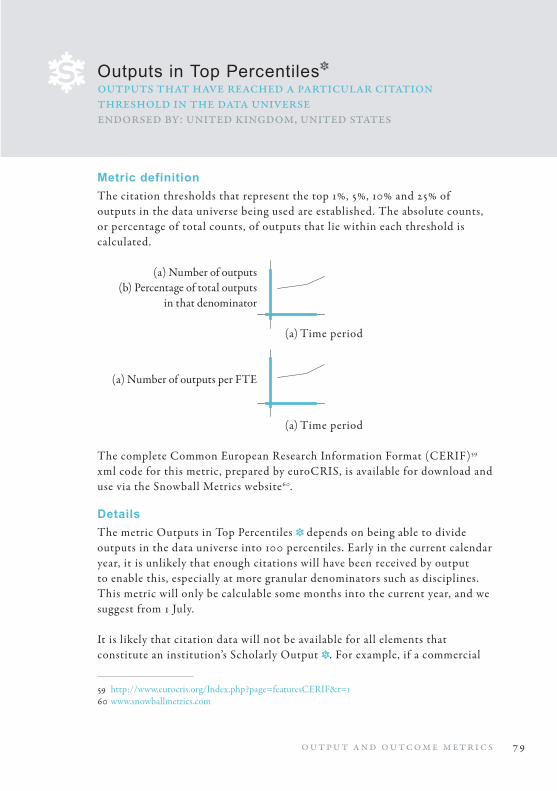
79o u t p u t a n d o u tco m e m et r i c s
Outputs in Top Percentilesoutputs that have reached a particular citation threshold in the data universeendorsed by: united kingdom, united states
Metric definitionThe citation thresholds that represent the top 1%, 5%, 10% and 25% of outputs in the data universe being used are established. The absolute counts, or percentage of total counts, of outputs that lie within each threshold is calculated.
(a) Number of outputs (b) Percentage of total outputs in that denominator (a) Time period
(a) Number of outputs per FTE
(a) Time period
The complete Common European Research Information Format (CERIF)59 xml code for this metric, prepared by euroCRIS, is available for download and use via the Snowball Metrics website60.
detailsThe metric Outputs in Top Percentiles depends on being able to divide outputs in the data universe into 100 percentiles. Early in the current calendar year, it is unlikely that enough citations will have been received by output to enable this, especially at more granular denominators such as disciplines. This metric will only be calculable some months into the current year, and we suggest from 1 July. It is likely that citation data will not be available for all elements that constitute an institution’s Scholarly Output . For example, if a commercial
59 http://www.eurocris.org/Index.php?page=featuresCERIF&t=1 60 www.snowballmetrics.com
8 0 s n ow ba ll m et r i c s r ec i p e b o o k
abstracting and indexing database is used as the data source for Outputs in Top Percentiles , their coverage will be less than 100% of the institution’s total productivity. A partial reflection of an institution’s activity is still valuable in providing an evidence-based support for decision making through benchmarking , since this limitation is likely to affect all comparators equally.
Primary data sources• Institutional output repository and Current Research Information
System (CRIS)• Scopus• Web of Science• Google Scholar
uK applicationDenominators derived from institutional data :
• HESA cost centre, via assignment of a researcher associated with an output to a HESA cost centre.
• Institution
Time period:• Calendar year• Rolling 3-year blocks
Note that the time period does not refer to the year in which citations were received, but to the year in which outputs were produced.
Future opportunitiesCommercial abstracting and indexing databases extend their degree of coverage of an institution’s output to give a more comprehensive picture of an institution’s activity.
The HESA cost centre denominator can be replaced by any assignment of researchers to groupings that are shared across institutions nationally and internationally. Examples would be the grouping of researchers into clusters for national evaluation exercises.
A denominator reflecting the themes and subject focus of outputs would be highly valued, especially if the same thematic denominator could be applied not only to Output and Outcome, but also to Input and Process, metrics. Most likely, an automated way of assigning subject fields based on abstracts of the items in question, such as submissions or publications, would be needed to enable this.
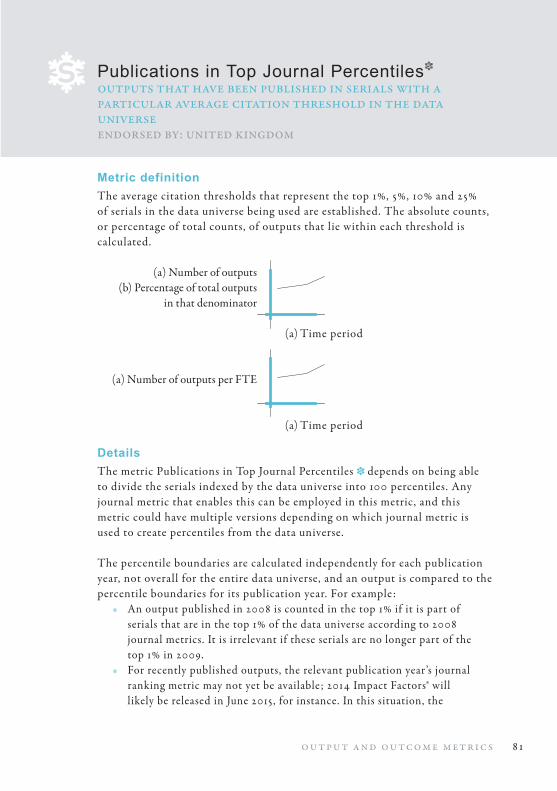
8 1o u t p u t a n d o u tco m e m et r i c s
Publications in Top Journal Percentilesoutputs that have been published in serials with a particular average citation threshold in the data universeendorsed by: united kingdom
Metric definitionThe average citation thresholds that represent the top 1%, 5%, 10% and 25% of serials in the data universe being used are established. The absolute counts, or percentage of total counts, of outputs that lie within each threshold is calculated.
(a) Number of outputs (b) Percentage of total outputs in that denominator (a) Time period
(a) Number of outputs per FTE
(a) Time period
detailsThe metric Publications in Top Journal Percentiles depends on being able to divide the serials indexed by the data universe into 100 percentiles. Any journal metric that enables this can be employed in this metric, and this metric could have multiple versions depending on which journal metric is used to create percentiles from the data universe.
The percentile boundaries are calculated independently for each publication year, not overall for the entire data universe, and an output is compared to the percentile boundaries for its publication year. For example:
• An output published in 2008 is counted in the top 1% if it is part of serials that are in the top 1% of the data universe according to 2008 journal metrics. It is irrelevant if these serials are no longer part of the top 1% in 2009.
• For recently published outputs, the relevant publication year’s journal ranking metric may not yet be available; 2014 Impact Factors® will likely be released in June 2015, for instance. In this situation, the
82 s n ow ba ll m et r i c s r ec i p e b o o k
journal metric for the previous calendar year should be used until the journal metrics for the actual publication year become available.
• Some journal metric values may not be available for older outputs; Source-Normalized Impact per Paper (SNIP) and SCImago Journal Rank (SJR) are available from 1999 onwards, for example. In this instance, for outputs published in serials before 1999, the journal metric value for 1999 is used.
This metric is not itself field-normalized, although if the journal metric is it based on takes different behavior between disciplines into account, then it will behave as a field-normalized metric. Of those journal metrics mentioned in the “Primary data sources” section, only the Impact Factor® is not field-normalized; the tendency for life sciences journals to have higher Impact Factors® than, say, social sciences journals, might affect the choice of denominators for which an Impact Factor®-based Publications in Top Journal Percentiles is used, whereas this might not be a consideration when employing the other journal metrics to generate this metric.
It is likely that journal ranking metrics will not be available for all elements that constitute an institution’s Scholarly Output . For example, stand-alone books cannot, by definition, have an Eigenfactor, or equivalent, because these can only be calculated for serial publications. A partial reflection of an institution’s activity is still valuable in providing an evidence-based support for decision making through benchmarking , since this limitation is likely to affect all comparators equally.
Primary data sources• Institutional output repository and Current Research Information
System (CRIS)• Scopus• Web of Science• Google Scholar• Journal ranking metrics such as Impact Factor®,61, and the following
journal metrics that are available free-of-charge: Source-Normalized Impact per Paper (SNIP) and SCImago Journal Rank (SJR)62; and Eigenfactor and Article Influence63
61 http://thomsonreuters.com/journal-citation-reports/ 62 www.journalmetrics.com 63 www.eigenfactor.org
83o u t p u t a n d o u tco m e m et r i c s
uK applicationDenominators derived from institutional data :
• HESA cost centre, via assignment of a researcher associated with an output to a HESA cost centre.
• Institution
Time period: calendar year. Note that the time period does not refer to the year in which citations were received, but to the year in which outputs were produced.
Future opportunitiesCommercial abstracting and indexing databases extend their degree of coverage of an institution’s output to give a more comprehensive picture of an institution’s activity.
The HESA cost centre denominator can be replaced by any assignment of researchers to groupings that are shared across institutions nationally and internationally. Examples would be the grouping of researchers into clusters for national evaluation exercises.
A denominator reflecting the themes and subject focus of outputs would be highly valued, especially if the same thematic denominator could be applied not only to Output and Outcome, but also to Input and Process, metrics. Most likely, an automated way of assigning subject fields based on abstracts of the items in question, such as submissions or publications, would be needed to enable this.

84 s n ow ba ll m et r i c s r ec i p e b o o k
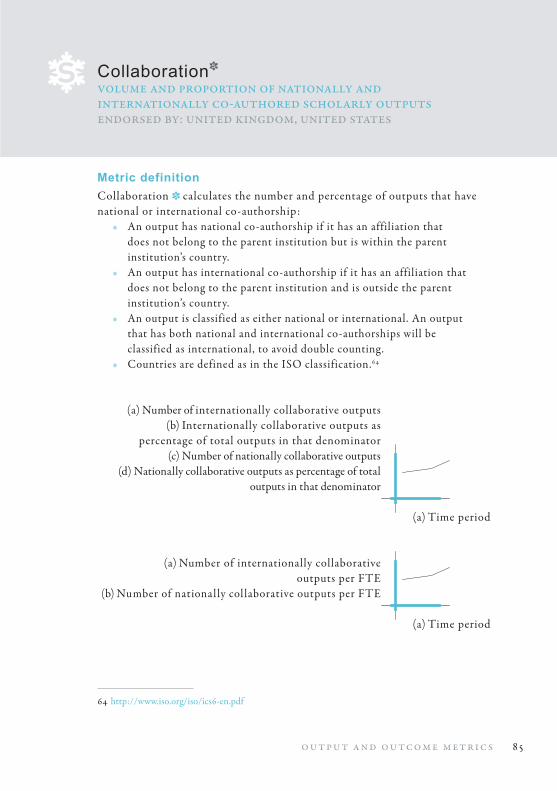
85o u t p u t a n d o u tco m e m et r i c s
Collaborationvolume and proportion of nationally and internationally co-authored scholarly outputsendorsed by: united kingdom, united states
Metric definitionCollaboration calculates the number and percentage of outputs that have national or international co-authorship:
• An output has national co-authorship if it has an affiliation that does not belong to the parent institution but is within the parent institution’s country.
• An output has international co-authorship if it has an affiliation that does not belong to the parent institution and is outside the parent institution’s country.
• An output is classified as either national or international. An output that has both national and international co-authorships will be classified as international, to avoid double counting.
• Countries are defined as in the ISO classification.64
(a) Number of internationally collaborative outputs (b) Internationally collaborative outputs as percentage of total outputs in that denominator (c) Number of nationally collaborative outputs (d) Nationally collaborative outputs as percentage of total outputs in that denominator
(a) Time period
(a) Number of internationally collaborative outputs per FTE (b) Number of nationally collaborative outputs per FTE
(a) Time period
64 http://www.iso.org/iso/ics6-en.pdf
8 6 s n ow ba ll m et r i c s r ec i p e b o o k
The complete Common European Research Information Format (CERIF)65 xml code for this metric, prepared by euroCRIS, is available for download and use via the Snowball Metrics website66.
detailsInstitutions may have research groups or facilities affiliated to them and permanently based overseas, such as researchers in local universities, hospitals, or governmental research centers. Collaboration considers the physical location of the affiliation’s researchers to be irrelevant. As such, and taking the University of Oxford in the United Kingdom as an illustrative model:
• Collaboration between Oxford-affiliated researchers based overseas who are collaborating with an overseas institution is international.
• Collaboration between Oxford-affiliated researchers based overseas who are collaborating with a UK institution is national.
• Collaboration between Oxford-affiliated researchers based overseas and another UK institution’s, other than Oxford, research group also based overseas is international.
• Collaboration between 2 or more Oxford-affiliated researchers is an institutional collaboration, and is not included in the metric definition.
The country information actually provided in the outputs is used. If an author did not include their country in their affiliation information, then their affiliation is not taken into account in the metric.
It is likely that affiliation data will not be available for all elements that constitute an institution’s Scholarly Output . For example, if a commercial abstracting and indexing database is used as the data source for the collaboration information, their coverage will be less than 100% of the institution’s total productivity. An institutional system may only partially capture this information for the outputs it holds. A partial reflection of an institution’s activity is still valuable in providing an evidence-based support for decision making through benchmarking , since this limitation is likely to affect all comparators equally.
65 http://www.eurocris.org/Index.php?page=featuresCERIF&t=1 66 www.snowballmetrics.com
8 7o u t p u t a n d o u tco m e m et r i c s
Primary data sourcesAny data source that structurally captures the affiliation information of outputs, for example:
• Institutional output repository and Current Research Information System (CRIS)
• Scopus• Web of Science• Google Scholar
uK applicationDenominators derived from institutional data :
• HESA cost centre, via assignment of a researcher associated with an output to a HESA cost centre.
• Institution
Time period: calendar year. Note that the time period does not refer to the year in which citations were received, but to the year in which outputs were produced.
The parent institution’s country is the United Kingdom: England, Scotland, Wales and Northern Ireland.
Future opportunitiesCommercial abstracting and indexing databases extend their degree of coverage of an institution’s output to give a more comprehensive picture of an institution’s activity.
The HESA cost centre denominator can be replaced by any assignment of researchers to groupings that are shared across institutions nationally and internationally. Examples would be the grouping of researchers into clusters for national evaluation exercises.
A denominator reflecting the themes and subject focus of outputs would be highly valued, especially if the same thematic denominator could be applied not only to Output and Outcome, but also to Input and Process, metrics. Most likely, an automated way of assigning subject fields based on abstracts of the items in question, such as submissions or publications, would be needed to enable this.

8 8 s n ow ba ll m et r i c s r ec i p e b o o k
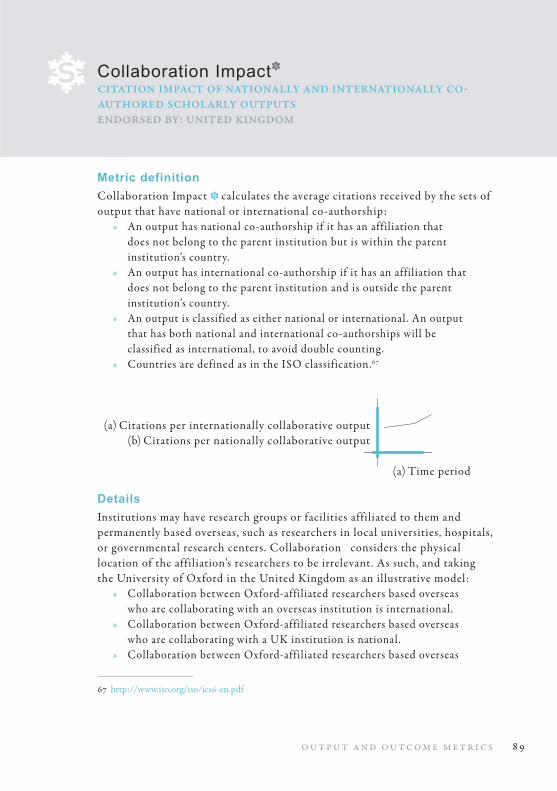
8 9o u t p u t a n d o u tco m e m et r i c s
Collaboration Impactcitation impact of nationally and internationally co-authored scholarly outputsendorsed by: united kingdom
Metric definitionCollaboration Impact calculates the average citations received by the sets of output that have national or international co-authorship:
• An output has national co-authorship if it has an affiliation that does not belong to the parent institution but is within the parent institution’s country.
• An output has international co-authorship if it has an affiliation that does not belong to the parent institution and is outside the parent institution’s country.
• An output is classified as either national or international. An output that has both national and international co-authorships will be classified as international, to avoid double counting.
• Countries are defined as in the ISO classification.67
(a) Citations per internationally collaborative output (b) Citations per nationally collaborative output
(a) Time period
detailsInstitutions may have research groups or facilities affiliated to them and permanently based overseas, such as researchers in local universities, hospitals, or governmental research centers. Collaboration considers the physical location of the affiliation’s researchers to be irrelevant. As such, and taking the University of Oxford in the United Kingdom as an illustrative model:
• Collaboration between Oxford-affiliated researchers based overseas who are collaborating with an overseas institution is international.
• Collaboration between Oxford-affiliated researchers based overseas who are collaborating with a UK institution is national.
• Collaboration between Oxford-affiliated researchers based overseas
67 http://www.iso.org/iso/ics6-en.pdf
9 0 s n ow ba ll m et r i c s r ec i p e b o o k
and another UK institution’s, other than Oxford, research group also based overseas is international.
• Collaboration between 2 or more Oxford-affiliated researchers is an institutional collaboration, and is not included in the metric definition.
The country information actually provided in the outputs is used. If an author did not include their country in their affiliation information, then their affiliation is not taken into account in the metric.
The assignment of international or national applies only to the institutional outputs. The count of citations is independent of the international or national collaboration status of the citing output; if an institution’s internationally collaborative output has only been cited by nationally collaborative publications, then these citations are still counted.
It is likely that affiliation and / or citation data will not be available for all elements that constitute an institution’s Scholarly Output . For example, if a commercial abstracting and indexing database is used as the data source for the collaboration information, and for Citation Count , their coverage will be less than 100% of the institution’s total productivity. A partial reflection of an institution’s activity is still valuable in providing an evidence-based support for decision making through benchmarking , since this limitation is likely to affect all comparators equally.
Primary data sources• Scopus• Web of Science• Google Scholar
uK applicationDenominators derived from institutional data :
• HESA cost centre. Outputs are associated with a HESA cost centre via the researcher(s) who produced them
• Institution
Time period: calendar year. Note that the time period does not refer to the year in which citations were received, but to the year in which outputs were produced.
The parent institution’s country is the United Kingdom: England, Scotland, Wales, and Northern Ireland.
91o u t p u t a n d o u tco m e m et r i c s
Future opportunitiesCommercial abstracting and indexing databases extend their degree of coverage of an institution’s output to give a more comprehensive picture of an institution’s activity.
The HESA cost centre denominator can be replaced by any assignment of researchers to groupings that are shared across institutions nationally and internationally. Examples would be the grouping of researchers into clusters for national evaluation exercises.
A denominator reflecting the themes and subject focus of outputs would be highly valued, especially if the same thematic denominator could be applied not only to Output and Outcome, but also to Input and Process, metrics. Most likely, an automated way of assigning subject fields based on abstracts of the items in question, such as submissions or publications, would be needed to enable this.

92 s n ow ba ll m et r i c s r ec i p e b o o k
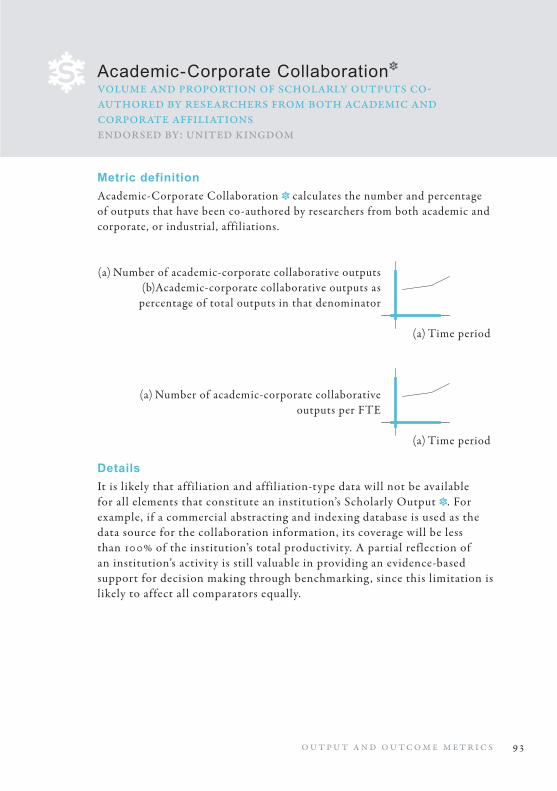
9 3o u t p u t a n d o u tco m e m et r i c s
Academic-Corporate Collaborationvolume and proportion of scholarly outputs co-authored by researchers from both academic and corporate affiliationsendorsed by: united kingdom
Metric definitionAcademic-Corporate Collaboration calculates the number and percentage of outputs that have been co-authored by researchers from both academic and corporate, or industrial, affiliations.
(a) Number of academic-corporate collaborative outputs (b)Academic-corporate collaborative outputs as percentage of total outputs in that denominator
(a) Time period
(a) Number of academic-corporate collaborative outputs per FTE
(a) Time period
detailsIt is likely that affiliation and affiliation-type data will not be available for all elements that constitute an institution’s Scholarly Output . For example, if a commercial abstracting and indexing database is used as the data source for the collaboration information, its coverage will be less than 100% of the institution’s total productivity. A partial reflection of an institution’s activity is still valuable in providing an evidence-based support for decision making through benchmarking , since this limitation is likely to affect all comparators equally.
94 s n ow ba ll m et r i c s r ec i p e b o o k
Primary data sourcesAny data source that structurally captures the affiliation information and type of outputs, for example:
• Institutional output repository and Current Research Information System (CRIS)
• Scopus• Web of Science• Google Scholar• UK application
Denominators derived from institutional data :• HESA cost centre, via assignment of a researcher associated with an
output to a HESA cost centre• Institution
Time period: calendar year. Note that the time period does not refer to the year in which citations were received, but to the year in which outputs were produced.
Future opportunitiesCommercial abstracting and indexing databases extend their degree of coverage of an institution’s output to give a more comprehensive picture of an institution’s activity.
The HESA cost centre denominator can be replaced by any assignment of researchers to groupings that are shared across institutions nationally and internationally. Examples would be the grouping of researchers into clusters for national evaluation exercises.
A denominator reflecting the themes and subject focus of outputs would be highly valued, especially if the same thematic denominator could be applied not only to Output and Outcome, but also to Input and Process, metrics. Most likely, an automated way of assigning subject fields based on abstracts of the items in question, such as submissions or publications, would be needed to enable this.
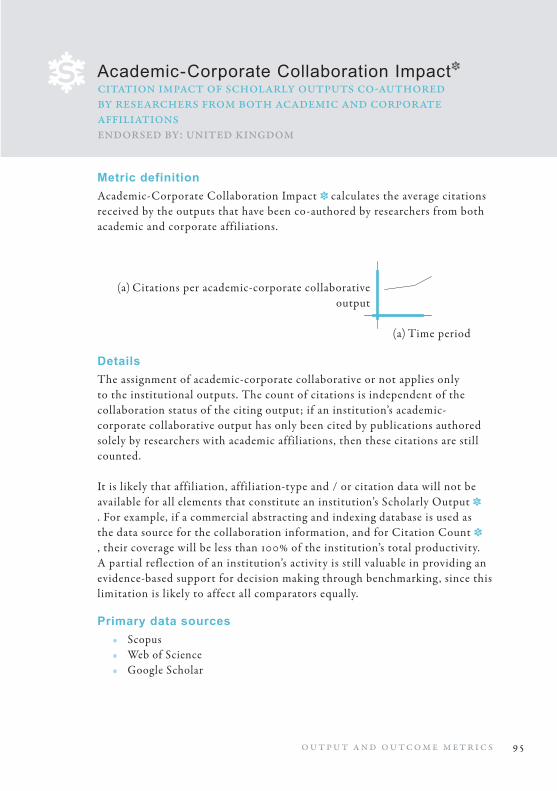
95o u t p u t a n d o u tco m e m et r i c s
Academic-Corporate Collaboration Impactcitation impact of scholarly outputs co-authored by researchers from both academic and corporate affiliationsendorsed by: united kingdom
Metric definitionAcademic-Corporate Collaboration Impact calculates the average citations received by the outputs that have been co-authored by researchers from both academic and corporate affiliations.
(a) Citations per academic-corporate collaborative output
(a) Time period
detailsThe assignment of academic-corporate collaborative or not applies only to the institutional outputs. The count of citations is independent of the collaboration status of the citing output; if an institution’s academic-corporate collaborative output has only been cited by publications authored solely by researchers with academic affiliations, then these citations are still counted.
It is likely that affiliation, affiliation-type and / or citation data will not be available for all elements that constitute an institution’s Scholarly Output . For example, if a commercial abstracting and indexing database is used as the data source for the collaboration information, and for Citation Count , their coverage will be less than 100% of the institution’s total productivity. A partial reflection of an institution’s activity is still valuable in providing an evidence-based support for decision making through benchmarking , since this limitation is likely to affect all comparators equally.
Primary data sources• Scopus• Web of Science• Google Scholar
96 s n ow ba ll m et r i c s r ec i p e b o o k
uK applicationDenominators derived from institutional data :
• HESA cost centre. Outputs are associated with a HESA cost centre via the researcher(s) who produced them.
• Institution
Time period: calendar year. Note that the time period does not refer to the year in which citations were received, but to the year in which outputs were produced.
Future opportunitiesCommercial abstracting and indexing databases extend their degree of coverage of an institution’s output to give a more comprehensive picture of an institution’s activity.
The HESA cost centre denominator can be replaced by any assignment of researchers to groupings that are shared across institutions nationally and internationally. Examples would be the grouping of researchers into clusters for national evaluation exercises.
A denominator reflecting the themes and subject focus of outputs would be highly valued, especially if the same thematic denominator could be applied not only to Output and Outcome, but also to Input and Process, metrics. Most likely, an automated way of assigning subject fields based on abstracts of the items in question, such as submissions or publications, would be needed to enable this.
97o u t p u t a n d o u tco m e m et r i c s
Altmetricsonline activity stimulated by scholarly outputendorsed by: united kingdom
Metric definitionAltmetrics counts the number of online events that have been stimulated by an institution’s output. This metric divides the broad range of online events into 4 categories:
• Scholarly Activity refers to the number of times that an institution’s output has been posted in online tools that are typically used by academic scholars, such as Mendeley68, CiteULike69, Google Scholar Library70, QUOSA71, Papers72, ScienceScape73, MyScienceWork74, colwiz75, zotero76, Academia.edu77, ResearchGate78, VIVO79, and Scopus’ “Add to My List” application.80
• Scholarly Commentar y refers to the number of times that an institution’s output has been commented on in online tools that are typically used by academic scholars, such as science blogs, video posts such as those on youTube81 and vimeo82, peer reviews such as Publons83, post-publication comments such as PubMed Commons84, Faculty of 100085 reviews, Stack Exchange86, and Wikipedia87 posts and citations.
68 www.mendeley.com69 www.citeulike.org 70 http://scholar.google.com 71 www.elsevier.com/online-tools/quosa 72 www.papersapp.com/mac 73 https://sciencescape.org 74 www.mysciencework.com 75 www.colwiz.com 76 www.zotero.org 77 www.academia.edu 78 www.researchgate.net 79 www.vivoweb.org 80 www.scopus.com 81 www.youtube.com 82 https://vimeo.com 83 https://publons.com 84 http://www.ncbi.nlm.nih.gov/pubmedcommons 85 http://f1000.com 86 http://stackexchange.com 87 www.wikipedia.org
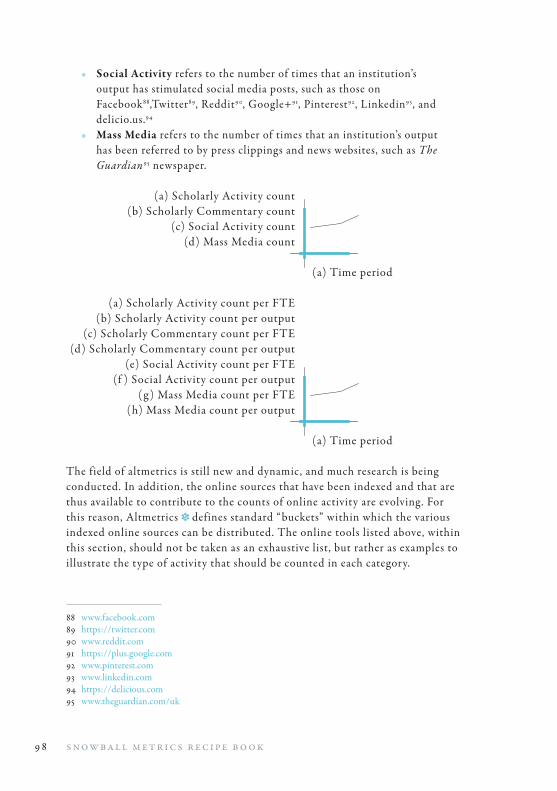
9 8 s n ow ba ll m et r i c s r ec i p e b o o k
• Social Activity refers to the number of times that an institution’s output has stimulated social media posts, such as those on Facebook88,Twitter89, Reddit90, Google+91, Pinterest92, Linkedin93, and delicio.us.94
• Mass Media refers to the number of times that an institution’s output has been referred to by press clippings and news websites, such as The Guardian95 newspaper.
(a) Scholarly Activity count (b) Scholarly Commentary count (c) Social Activity count (d) Mass Media count
(a) Time period
(a) Scholarly Activity count per FTE (b) Scholarly Activity count per output (c) Scholarly Commentary count per FTE (d) Scholarly Commentary count per output (e) Social Activity count per FTE (f ) Social Activity count per output (g ) Mass Media count per FTE (h) Mass Media count per output
(a) Time period
The field of altmetrics is still new and dynamic, and much research is being conducted. In addition, the online sources that have been indexed and that are thus available to contribute to the counts of online activity are evolving. For this reason, Altmetrics defines standard “buckets” within which the various indexed online sources can be distributed. The online tools listed above, within this section, should not be taken as an exhaustive list, but rather as examples to illustrate the type of activity that should be counted in each category.
88 www.facebook.com 89 https://twitter.com 90 www.reddit.com 91 https://plus.google.com 92 www.pinterest.com 93 www.linkedin.com 94 https://delicious.com 95 www.theguardian.com/uk
99o u t p u t a n d o u tco m e m et r i c s
detailsInformation contained within the online activity is used to attribute it to an institution’s output. Depending on the data source used, this may be done by one or more of the following : resolving a DOI®,96 (Digital Object Identifier), resolving a shortened DOI such as by using bitly97, or parsing data, perhaps semi-manually, by detecting pattern strings.
It is likely that altmetric data will not be available for all elements that constitute an institution’s Scholarly Output . For example, it may not be possible to resolve online activity to exhibitions or performances, and mass media often does not mention the output on which they are basing a piece on in a way that can be automatically recognized, so that the database coverage will be less than 100% of the institution’s total productivity. A partial reflection of an institution’s activity is still valuable in providing an evidence-based support for decision making through benchmarking , since this limitation is likely to affect all comparators equally.
Primary data sources• Scopus• Web of Science• Google Scholar• Indexes of online activity that can be resolved to particular
individual outputs, such as Altmetric98, Public Library of Science99, ImpactStory100, and Plum Analytics101 which is owned by EBSCO.102
uK applicationDenominators derived from institutional data :
• HESA cost centre. Outputs are associated with a HESA cost centre via the researcher(s) who produced them.
• Institution
Time period: calendar year. Note that the time period does not refer to the year in which online activity was recorded, but to the year in which outputs were produced.
96 www.doi.org 97 https://bitly.com 98 www.altmetric.com 99 www.plos.org 100 https://impactstory.org 101 www.plumanalytics.com 102 www.ebsco.com
10 0 s n ow ba ll m et r i c s r ec i p e b o o k
Future opportunitiesAdditional categories of Altmetrics may be added by the project partners in future editions of this recipe book.
Commercial abstracting and indexing databases extend their degree of coverage of an institution’s output to give a more comprehensive picture of an institution’s activity.
The HESA cost centre denominator can be replaced by any assignment of researchers to groupings that are shared across institutions nationally and internationally. Examples would be the grouping of researchers into clusters for national evaluation exercises.
A denominator reflecting the themes and subject focus of outputs would be highly valued, especially if the same thematic denominator could be applied not only to Output and Outcome, but also to Input and Process, metrics. Most likely, an automated way of assigning subject fields based on abstracts of the items in question, such as submissions or publications, would be needed to enable this.
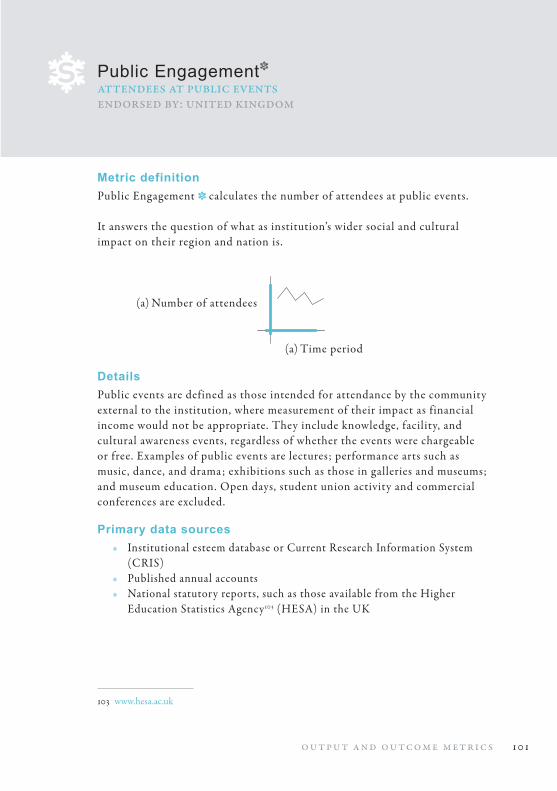
101o u t p u t a n d o u tco m e m et r i c s
Public Engagementattendees at public eventsendorsed by: united kingdom
Metric definitionPublic Engagement calculates the number of attendees at public events.
It answers the question of what as institution’s wider social and cultural impact on their region and nation is.
(a) Number of attendees
(a) Time period
detailsPublic events are defined as those intended for attendance by the community external to the institution, where measurement of their impact as financial income would not be appropriate. They include knowledge, facility, and cultural awareness events, regardless of whether the events were chargeable or free. Examples of public events are lectures; performance arts such as music, dance, and drama; exhibitions such as those in galleries and museums; and museum education. Open days, student union activity and commercial conferences are excluded.
Primary data sources• Institutional esteem database or Current Research Information System
(CRIS)• Published annual accounts• National statutory reports, such as those available from the Higher
Education Statistics Agency103 (HESA) in the UK
103 www.hesa.ac.uk

10 2 s n ow ba ll m et r i c s r ec i p e b o o k
uK applicationDenominator derived from institutional data : institution.
Time period: financial year.
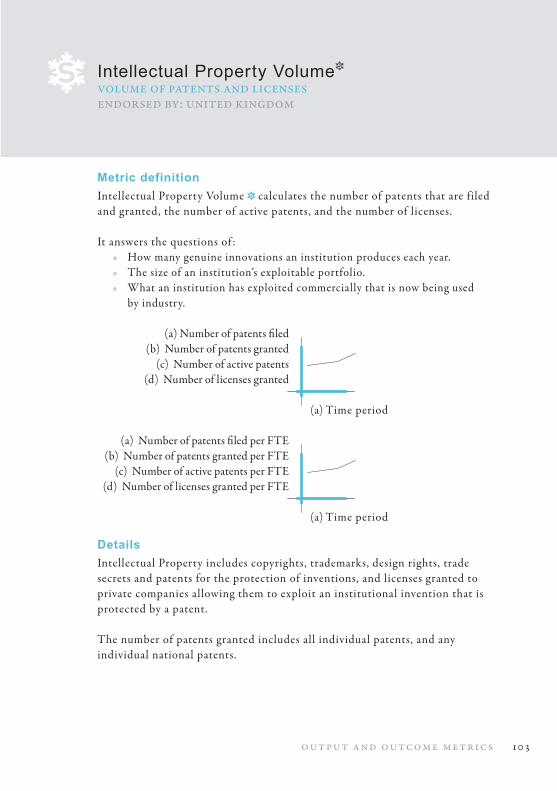
10 3o u t p u t a n d o u tco m e m et r i c s
Intellectual Property Volumevolume of patents and licensesendorsed by: united kingdom
Metric definitionIntellectual Property Volume calculates the number of patents that are filed and granted, the number of active patents, and the number of licenses.
It answers the questions of :• How many genuine innovations an institution produces each year.• The size of an institution’s exploitable portfolio.• What an institution has exploited commercially that is now being used
by industry.
(a) Number of patents filed (b) Number of patents granted (c) Number of active patents (d) Number of licenses granted
(a) Time period
(a) Number of patents filed per FTE (b) Number of patents granted per FTE (c) Number of active patents per FTE (d) Number of licenses granted per FTE
(a) Time period
detailsIntellectual Property includes copyrights, trademarks, design rights, trade secrets and patents for the protection of inventions, and licenses granted to private companies allowing them to exploit an institutional invention that is protected by a patent.
The number of patents granted includes all individual patents, and any individual national patents.
104 s n ow ba ll m et r i c s r ec i p e b o o k
The number of patents is the sum of the number of active (currently registered under licence to an external party) and live (registered but yet to be licensed) patents.
The number of licenses granted includes those granted from licence agreements, assignments, exercised option agreements, licences to spin-outs and income-generating Material Transfer Agreements.
Primary data sources• Institutional intellectual property database or Current Research
Information System (CRIS)• Published annual accounts• National statutory reports, such as those available from the Higher
Education Statistics Agency104 (HESA) in the UK• Scopus• Web of Science• Google Scholar• Lexis®105
• World Intellectual Property Organization (WIPO)106
uK applicationDenominators derived from institutional data : institution.
Time period: financial year.
104 www.hesa.ac.uk 105 www.lexis.com 106 www.wipo.int/portal/en
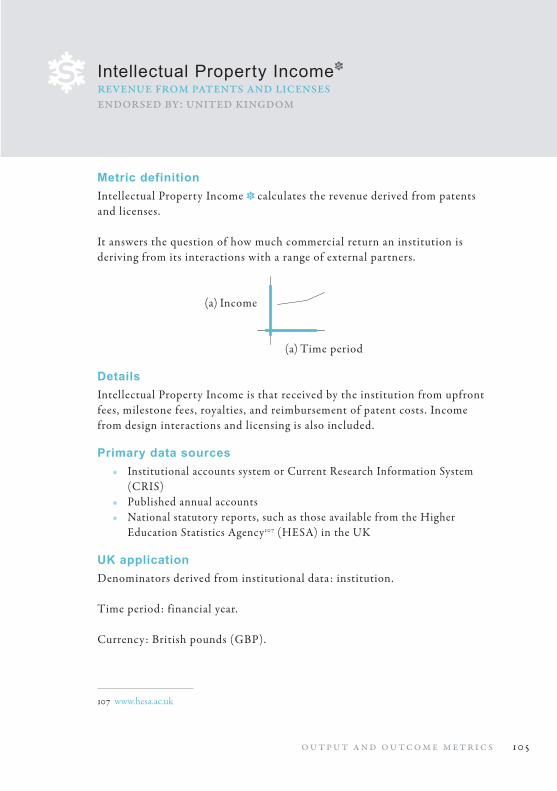
105o u t p u t a n d o u tco m e m et r i c s
Intellectual Property Incomerevenue from patents and licensesendorsed by: united kingdom
Metric definitionIntellectual Property Income calculates the revenue derived from patents and licenses.
It answers the question of how much commercial return an institution is deriving from its interactions with a range of external partners.
(a) Income
(a) Time period
detailsIntellectual Property Income is that received by the institution from upfront fees, milestone fees, royalties, and reimbursement of patent costs. Income from design interactions and licensing is also included.
Primary data sources• Institutional accounts system or Current Research Information System
(CRIS)• Published annual accounts• National statutory reports, such as those available from the Higher
Education Statistics Agency107 (HESA) in the UK
uK applicationDenominators derived from institutional data : institution.
Time period: financial year.
Currency: British pounds (GBP).
107 www.hesa.ac.uk

10 6 s n ow ba ll m et r i c s r ec i p e b o o k
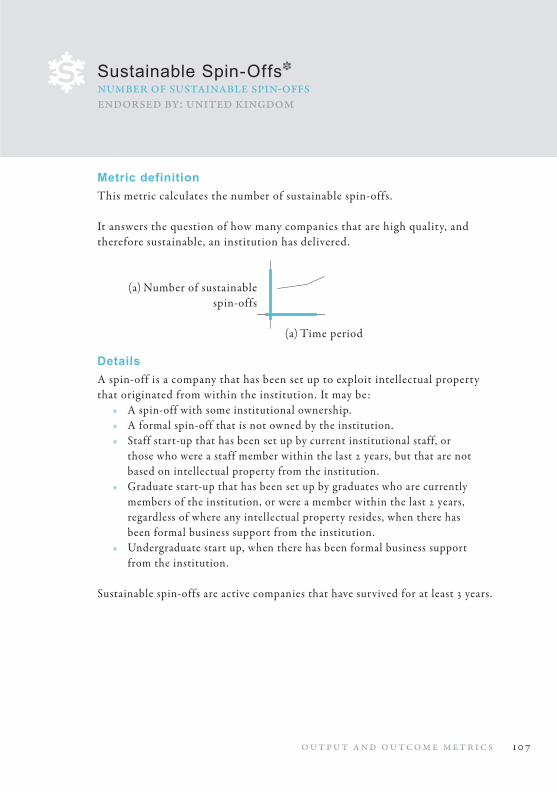
107o u t p u t a n d o u tco m e m et r i c s
Sustainable Spin-Offsnumber of sustainable spin-offsendorsed by: united kingdom
Metric definitionThis metric calculates the number of sustainable spin-offs.
It answers the question of how many companies that are high quality, and therefore sustainable, an institution has delivered.
(a) Number of sustainable spin-offs
(a) Time period
detailsA spin-off is a company that has been set up to exploit intellectual property that originated from within the institution. It may be:
• A spin-off with some institutional ownership.• A formal spin-off that is not owned by the institution.• Staff start-up that has been set up by current institutional staff, or
those who were a staff member within the last 2 years, but that are not based on intellectual property from the institution.
• Graduate start-up that has been set up by graduates who are currently members of the institution, or were a member within the last 2 years, regardless of where any intellectual property resides, when there has been formal business support from the institution.
• Undergraduate start up, when there has been formal business support from the institution.
Sustainable spin-offs are active companies that have survived for at least 3 years.
10 8 s n ow ba ll m et r i c s r ec i p e b o o k
Primary data sources• Institutional intellectual property database or Current Research
Information System (CRIS)• Published annual accounts• National statutory reports, such as those available from the Higher
Education Statistics Agency108 (HESA) in the UK
uK applicationDenominators derived from institutional data : institution.
Time period: financial year.
108 www.hesa.ac.uk
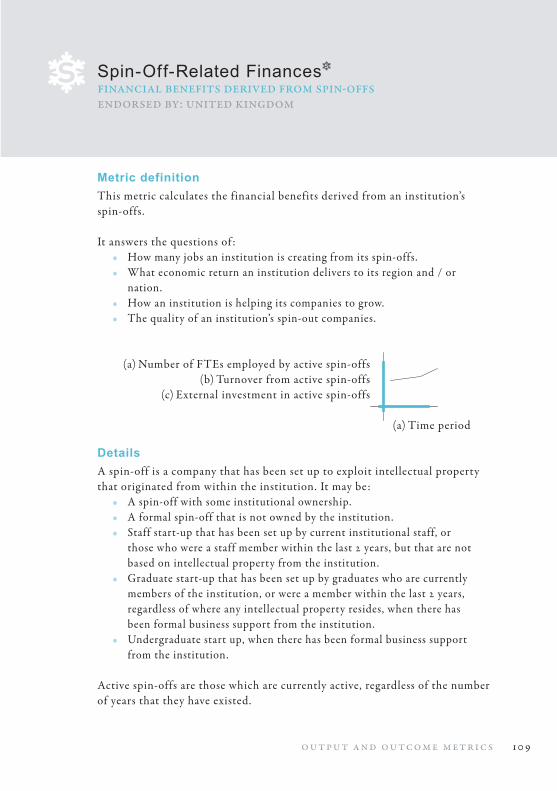
109o u t p u t a n d o u tco m e m et r i c s
Spin-Off-Related Financesfinancial benefits derived from spin-offsendorsed by: united kingdom
Metric definitionThis metric calculates the financial benefits derived from an institution’s spin-offs.
It answers the questions of :• How many jobs an institution is creating from its spin-offs.• What economic return an institution delivers to its region and / or
nation.• How an institution is helping its companies to grow.• The quality of an institution’s spin-out companies.
(a) Number of FTEs employed by active spin-offs (b) Turnover from active spin-offs (c) External investment in active spin-offs
(a) Time period
detailsA spin-off is a company that has been set up to exploit intellectual property that originated from within the institution. It may be:
• A spin-off with some institutional ownership.• A formal spin-off that is not owned by the institution.• Staff start-up that has been set up by current institutional staff, or
those who were a staff member within the last 2 years, but that are not based on intellectual property from the institution.
• Graduate start-up that has been set up by graduates who are currently members of the institution, or were a member within the last 2 years, regardless of where any intellectual property resides, when there has been formal business support from the institution.
• Undergraduate start up, when there has been formal business support from the institution.
Active spin-offs are those which are currently active, regardless of the number of years that they have existed.
110 s n ow ba ll m et r i c s r ec i p e b o o k
External investment includes all investment from external partners, with the exception of third-stream funds.
These measures may need to be estimated, as is the case for the information returned to the Higher Education Statistics Agency109 (HESA) in the UK.
Primary data sources• Institutional accounts system or Current Research Information System
(CRIS)• Published annual accounts• National statutory reports, such as those available from the Higher
Education Statistics Agency (HESA) in the UK
uK applicationDenominators derived from institutional data : institution.
Time period: financial year.
Currency: British pounds (GBP).
External investment excludes investment from third stream funds from the Higher Education Funding Council for England (HEFCE110) and Department of Business, Innovation and Skills (BIS111).
109 www.hesa.ac.uk 110 www.hefce.ac.uk 111 www.gov.uk/government/organisations/department-for-business-innovation-skills


S no wbal l Metr i c s S te e r i ng Gro upu n i v er s i t y co llege l o n d o n u n i v er s i t y o f o x f o r du n i v er s i t y o f c a m b r i d gei m p er i a l co llege l o n d o nu n i v er s i t y o f b r isto lu n i v er s i t y o f leedsq u een ’s u n i v er s i t y b elfa stu n i v er s i t y o f st a n d r ewsels ev i er
United S tate s Worki ng Gro upu n i v er s i t y o f m i c h i g a nu n i v er s i t y o f m i n n esotan o rt h w est er n u n i v er s i t yu n i v er s i t y o f i lli n o is at u r ba na-c h a m pa i gna r i zo na stat e u n i v er s i t ym d a n d er so n c a n c er c en t erk a n s a s stat e u n i v er s i t y y
Au stral i a / Ne w Z eal a n d Worki ng Gro upu n i v er s i t y o f q u een s l a n du n i v er s i t y o f w est er n aust r a li au n i v er s i t y o f au c k l a n du n i v er s i t y o f wo ll o n g o n gu n i v er s i t y o f ta sm a n i am a ss ey u n i v er s i t yu n i v er s i t y o f c a n b er r ac h a r les da rw i n u n i v er s i t y
(ordered within country according to Scholarly Output , 2013. Data source: Scopus. Data cut: 24 February 2014)
www.snowballmetrics.com