so you want to quit smoking: have you tried a mobile...
TRANSCRIPT
Paper No. 110 / June 2008
So You Want to Quit Smoking: Have You Tried a Mobile Phone?
Julien Labonne and Robert S. Chase
44837
Pub
lic D
iscl
osur
e A
utho
rized
Pub
lic D
iscl
osur
e A
utho
rized
Pub
lic D
iscl
osur
e A
utho
rized
Pub
lic D
iscl
osur
e A
utho
rized
Pub
lic D
iscl
osur
e A
utho
rized
Pub
lic D
iscl
osur
e A
utho
rized
Pub
lic D
iscl
osur
e A
utho
rized
Pub
lic D
iscl
osur
e A
utho
rized

Summary Findings Tobacco use, which is rising quickly in developing countries, kills 5.4 million people a
year worldwide. This paper explores the impacts of mobile phone ownership on tobacco
consumption. Indeed, mobile phone ownership could affect tobacco consumption because
individuals might pay for their communication with money they would have spent on
tobacco. Using panel data from 2,100 households in 135 communities of the Philippines
collected in 2003 and 2006, the analysis finds that mobile phone ownership leads to a 20
percent decline in monthly tobacco consumption. Among households in which at least
one member smoked in 2003, purchasing a mobile phone leads to a 32.6 percent decrease
in tobacco consumption per adult over the age of 15. This is equivalent to one less pack
of 20 cigarettes per month per adult. The results are robust to various estimation
strategies. Further, they suggest that this impact materializes through a budget shift from
tobacco to communication.
This paper is also part of the Policy Research Working Paper Series and is listed as
document number 4657.
SOCIAL DEVELOPMENT WORKING PAPERS Paper No. 110/ June 2008
So You Want to Quit Smoking: Have You Tried a Mobile Phone?
Julien Labonne and Robert S. Chase

This Working Papers Series disseminates the findings of work in progress to encourage discussion and exchange of ideas social development issues. The papers carry the names of the authors and should be cited accordingly. The series is edited by the Community Driven Development team in the Social Development Department of the Sustainable Development Network of the World Bank. This paper has not undergone the review accorded to official World Bank publications. The findings, interpretations and conclusions herein are those of the author(s) and do not necessarily reflect the views of the International Bank for Reconstruction and Development/ World Bank and its affiliated organizations, or its Executive Directors, or the governments they represent. To request copies of the paper or for more information on the series, please contact the Social Development Department Social Development The World Bank 1818 H Street, NW Washington, DC 20433 Fax: 202-522-3247 E-mail: [email protected]
Printed on Recycled Paper
i
Table of Contents Foreword .....................................................................................................................................................ii Acknowledgments ....................................................................................................................................iii 1. Introduction ............................................................................................................................................ 1 2. The Data .................................................................................................................................................. 3 3. Estimation Strategy................................................................................................................................ 4
3.1 Basic setup ......................................................................................................................................... 4 3.2 Dealing with selection on observables .......................................................................................... 5
4. Results...................................................................................................................................................... 7 4.1 Basic results ....................................................................................................................................... 7 4.2 Alternative explanations and potential channels ........................................................................ 8
5. Conclusion ............................................................................................................................................ 11 References ................................................................................................................................................. 12 Figures ....................................................................................................................................................... 13 Tables ......................................................................................................................................................... 14
Tables Table 1 - Comparing Households with and without Mobile Phones in 2006 ............................................. 14 Table 2 - Access to Mobile Phones and Tobacco Consumption................................................................. 15 Table 3 - Access to Mobile Phones and the Decision to Quit Smoking ..................................................... 17 Table 4 – Alternative Explanations and Potential Channels ....................................................................... 18 Table A1 - Testing the Conditional Independence Assumption ................................................................. 19 Table A2 – Propensity Score Estimates ...................................................................................................... 20
ii
Foreword As part of its commitment to rigorous evaluation of its projects, the Social Development
Department of the World Bank regularly collects extensive household data in various countries.
While the primary objective is to measure project impacts, the richness of the data available
makes it possible to look at questions outside the typical realm of social development. Papers in
this series use some of the data collected to shed light on broader socio-economic questions of
interest to the development community.

iii
Acknowledgments We are grateful to Charles Kenny and Mark Williams for fruitful discussions that led to this
paper. We would like to thank Damien de Walque, Gillette Hall, Ben Olken and Melody Tulier
for helpful comments. We also wish to thank Bhuvan Bhatnagar, Andrew Parker, Arsenio
Balisacan, Rosemarie Edillon, Sharon Piza and all the staff of APPC without which the field
work would have been impossible. We are grateful to the Philippines Department of Social
Welfare and Development for allowing us to use the data. All remaining errors are ours. The
findings, interpretations, and conclusions expressed in this paper are entirely those of the authors
and should not be attributed in any manner to the World Bank, to its affiliated organizations or to
members of its Board of Executive Directors or the countries they represent.
1
1. Introduction Tobacco use kills 5.4 million people a year.1 This is likely to increase over the next
decades as tobacco consumption grows in developing countries. In addition to health
impacts, smoking diverts poor households’ resources away from other more productive
use. For example, Banerjee and Duflo (2007) report that in Mexico, the extremely poor in
rural areas spend about 8.1 percent of their budget on tobacco and alcohol.
The literature on the determinants of smoking behavior points to a clear link between
price increases and a reduction in the number of cigarettes smoked. Increasing taxes on
tobacco has therefore often been advocated as a means to reduce smoking. However,
recent evidence casts some doubts on the health impacts of tobacco taxes. Indeed, Adda
and Cornaglia (2006) show that price increases lead smokers to smoke more intensively
(i.e., extract more nicotine per cigarette) which is detrimental to health.
Recently, some in the public health community have suggested that, in developed
countries, mobile phone usage could play a role in reducing smoking, especially among
cash constrained teenagers (Charlton and Bates, 2000). Analyses undertaken in European
countries appear to contradict this claim, however (Steggles and Jarvis, 2003). No
analysis has been carried out in a developing country context where mobile phones are
spreading rapidly, even though the potential impact of such phones on tobacco
consumption is the greatest because of stricter household budget constraints.
The paper uses household panel data to examine the impact of mobile phone ownership
on tobacco consumption. Our results point to a large and robust negative impact of
mobile phone ownership on tobacco consumption. Among households in which at least
one member smoked in 2003, purchasing a mobile phone leads to a 32.6 percent decrease
in tobacco consumption per adult over the age of 15. This is equivalent to one less pack
of 20 cigarettes per month. In addition to simple OLS difference-in-differences estimates
we also report matched difference-in-differences estimates. Both methods yield similar
1 http://www.who.int/tobacco/mpower/tobacco_facts/en/index.html Accessed 5/17/2008

2
results. Further, our results suggest that this impact materializes through a budget shift
from tobacco to communication.
The paper is organized as follows. The data and basic descriptive statistics are described
in Section 2. The estimation strategy is presented in Section 3. Results are discussed in
Section 4. The final section concludes.
3
2. The Data Our analysis relies on household panel data collected in 135 villages of the Philippines.
The first round of data collection took place in the fall of 2003 and the sample included
2,400 households of which 2,092 were re-interviewed in the fall of 2006. The dataset
contains detailed information on consumption patterns, mobile phone ownership,
household structure, education achievements as well as asset and land ownership (Chase
and Holmemo, 2005). Because consumption information was collected item by item, we
can extract tobacco and communication consumption (i.e., all phone-related expenses)
from total consumption.
Over the survey period, mobile phone ownership spread quickly in the sampled
communities. Indeed, while the proportion of households owning a mobile phone in 2003
was 8.4 percent, it rose to 35.4 percent in 2006.
Smoking is prevalent in our sample with 41.6 percent of households reporting some
tobacco consumption in 2003. The average monthly tobacco consumption was about 31.2
Philippine Peso (PHP) per adult over the age of 15. This is equivalent to 1.24 packs of 20
sticks.2 This rose to 75.9 PHP for households in which at least one member smoked in
2003. Overall, tobacco consumption represented 2.01 percent of their total budget.
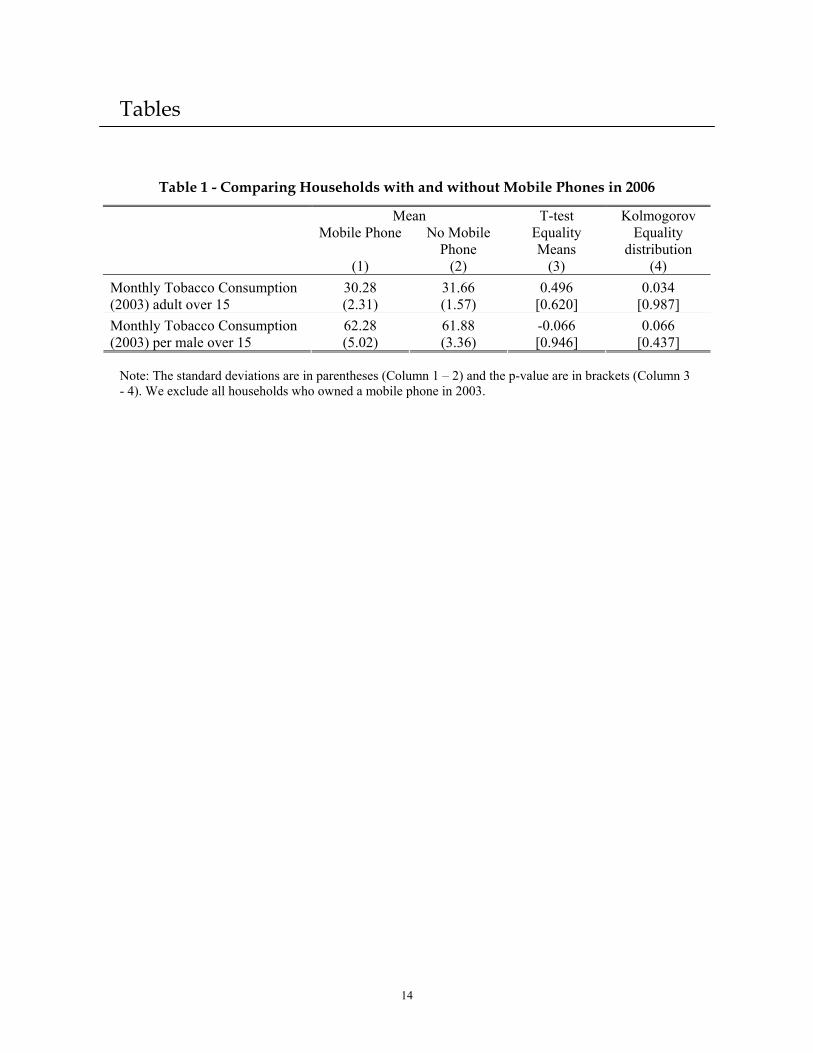
Results from t-tests and Kolmogorov-Smirnov tests (Table 1) indicate that there is no
difference in the 2003 distribution of tobacco consumption between the households who
purchased a mobile phone between 2003 and 2006 and those who did not.
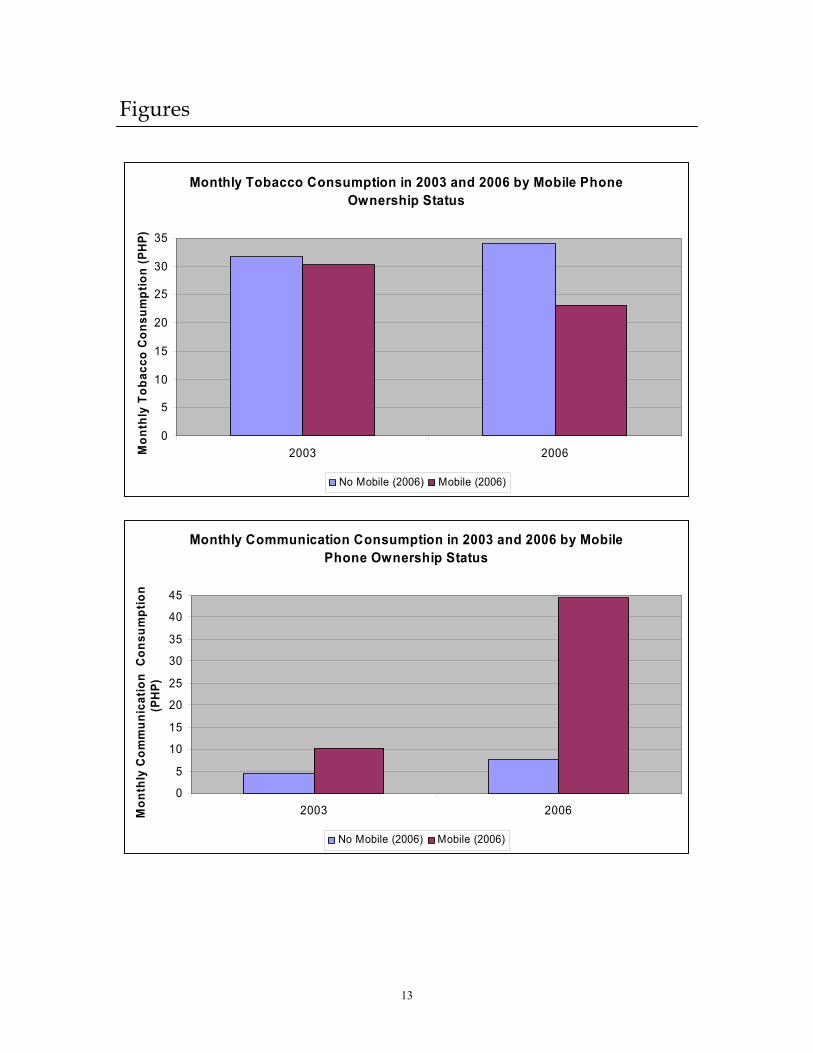
Over the period 2003-2006, the average monthly tobacco consumption decreased to 30.4
PHP per adult over the age of 15. A different picture emerges once we separate
households who owned and who did not own a mobile phone in 2006. Indeed, for
households without a mobile phone, monthly tobacco consumption rose to 33.9 PHP
while it decreased to 23.1 PHP for households who such a phone (cf. Figure 1).
2 According to WHO (2008), the price of a pack of 20 sticks for the most popular brand in the Philippines is 25 PHP.

4
3. Estimation Strategy
3.1 BASIC SETUP
Let )( ijtCLn be household i’s (log) per adult (over 15) tobacco consumption.3 It is
determined by:
ijtjtijijtijtijt wvuXMCLn ++++= **)( βα (1)
where α and β are coefficients to be estimated, ijtM is a dummy equal to one if
household i in village j owns a mobile phone at time t, ijtX is a vector of control
variables that vary across households and time, iju is a time-constant household effect,
jtv is an effect common across all households in village j at time t and, ijtw is the usual
idiosyncratic error term.
We can eliminate iju by differencing equation (1). Rewriting )( 01'
jjj vvv −= and
)( 01'
ijijij www −= leads to:
''**)( ijjijijij wvXMCLn ++Δ+Δ=Δ βα (2)
We will estimate equation (2) through OLS, include village dummies and compute
standard-errors robust to arbitrary variance structure within villages. Further, as smokers
are predominantly men in the Philippines (WHO, 2008), we will also run (2) with a
measure of tobacco consumption per male household member over the age of 15 (in
effect assuming that only males in the household smoke).
3 The main results of the paper are basically unchanged if we run our regressions with a different age cut-off. Results available upon request.
5
The vector ijtX of control variables includes an index of household wealth, the number of
household members working in the farm sector, the number of household members
working in the non-farm sector, the total number of household members, number of
household members above sixty, number of household members under five, household
head age, maximum years of education in the household, household head’s spouse age as
well as a dummy indicating if the household owns land for purposes other than residence.
In addition, we also include in equation (2) a dummy equal to one if a household member
migrated over the period, a dummy equal to one if a household member died over the
period and a dummy equal to one if a household member suffered a serious illness over
the period.
A small proportion of households (8.4 percent) owned a mobile phone in 2003.
Comparing those households with households who did not own a mobile phone in 2003
along the baseline covariates indicate that the differences between the two groups were
large and significant. Thus, while we will present results obtained with the full sample,
we will focus our analysis on households who did not own a mobile phone in 2003.
3.2 DEALING WITH SELECTION ON OBSERVABLES
There are some differences along baseline covariates between households who purchased
a mobile phone between 2003 and 2006 and those who did not. This might lead to biased
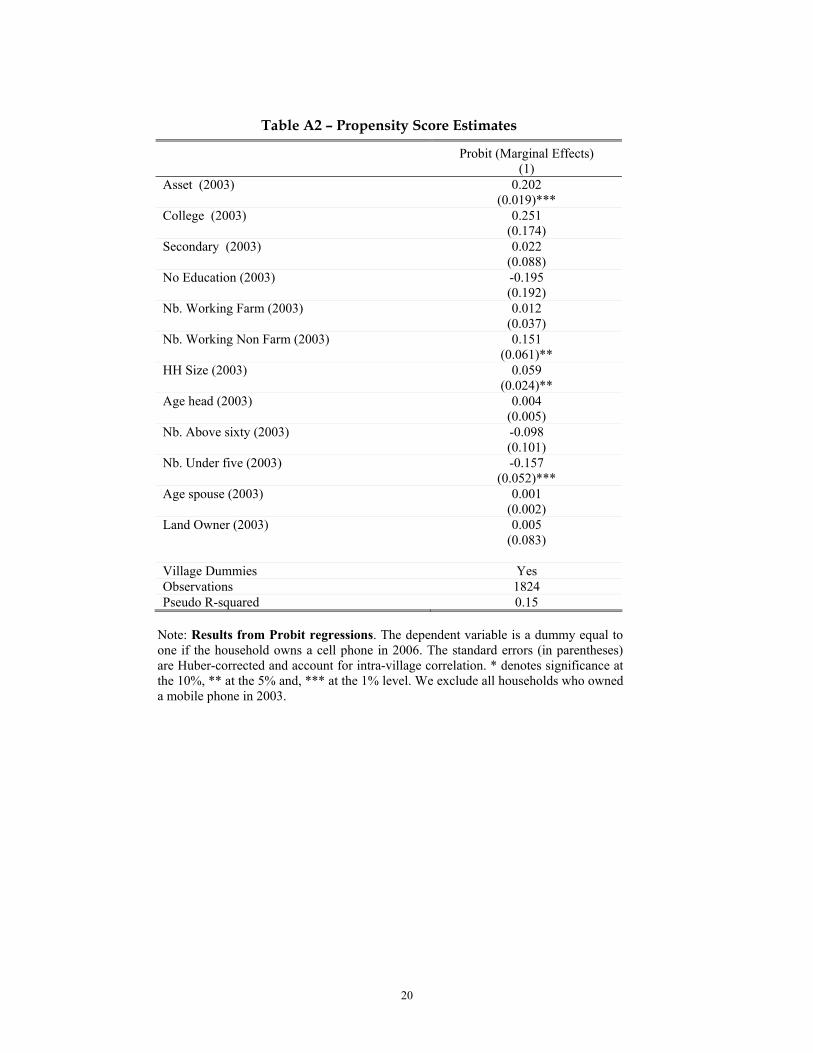
estimates. It is possible to remove such bias by estimating equation (2) through Weighted
Least Squares (WLS) using specific weights (Hirano et al. 2003). Those weights are
computed as follows: )(~1
1)(~
0
1
0
1
ij
ij
ij
ijij Xp
MXp
M−
−+=λ with )(~
0ijXp being a parametric
estimate of the propensity score: )|1( 01 ijij XMP = .4 This leads to efficient and consistent
estimates of α as long as either the propensity score or the regression model are
specified correctly (Imbens and Wooldridge, 2007).
4 Estimates are available in Table A2.
6
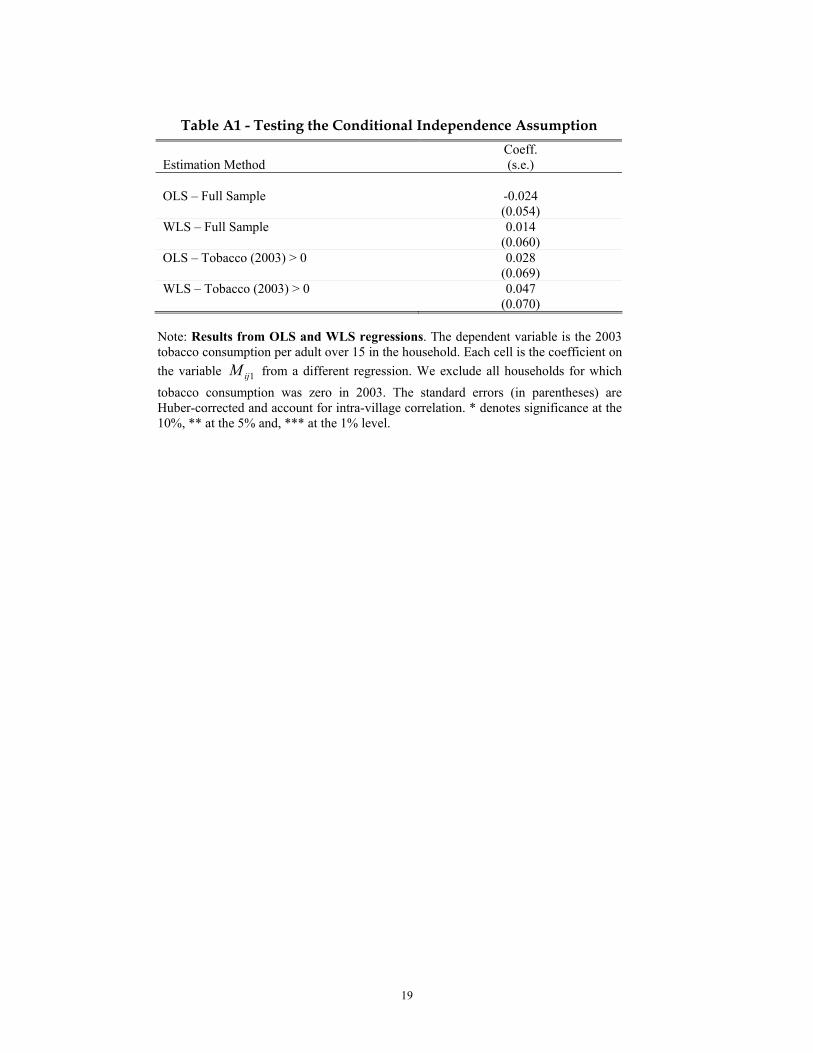
The validity of our WLS estimates relies on the Conditional Independence Assumption:
conditional on the covariates, owning a mobile is exogenous (i.e., not driven by
unobservables that also affect the decision to smoke). While we cannot directly test this
assumption we can assess if it is plausible by regressing )( 0ijCLn on 1ijM . The closer
the estimated coefficient is to zero, the greater the plausibility that the assumption holds
(Imbens and Wooldridge, 2007). Results are available in Table A1. None of the
coefficients are statistically different from zero at the usual levels and none of the t-
statistics are greater than 0.67. Our results are thus unlikely to be driven by selection on
unobservables.5
5 While the results indicate that selection on unobservables is not very likely, as a further test of robustness, we also estimate equation (2) through IV. The validity of such estimates relies on the availability of an instrument that explains the decision to buy a mobile phone but is not correlated with the decision to smoke (other than through the impact of mobile phone). We use the 2003 asset index as an instrument for mobile phone purchase. Results available in Table A2 indicate that this is a good predictor of the decision to buy a phone between 2003 and 2006 (t-stat is equal to 10.8). Further, a regression of the 2003 level of tobacco consumption on the 2003 asset index does not yield any significant results (t-stat is equal to -0.51). (Results available upon request). While not a direct test of the validity of our instruments, this suggests that our asset index is not directly correlated with the decision to smoke. We use the Limited Information Maximum Likelihood (LIML) estimator as it performs better than 2SLS in finite samples. We test whether our instrument set is weak against the alternative hypothesis that it is strong using the test put forward in Stock and Yogo (2005). In all regressions we can reject the null hypothesis that our instruments are weak. All our IV results are consistent with both our OLS and WLS results.
7
4. Results
In this section, we first empirically assess the impact of mobile phone ownership on
smoking behavior by implementing the estimation strategy discussed in Section 3.
Results are available in Table 2. We then discuss potential channels through which this
effect could materialize.
4.1 BASIC RESULTS
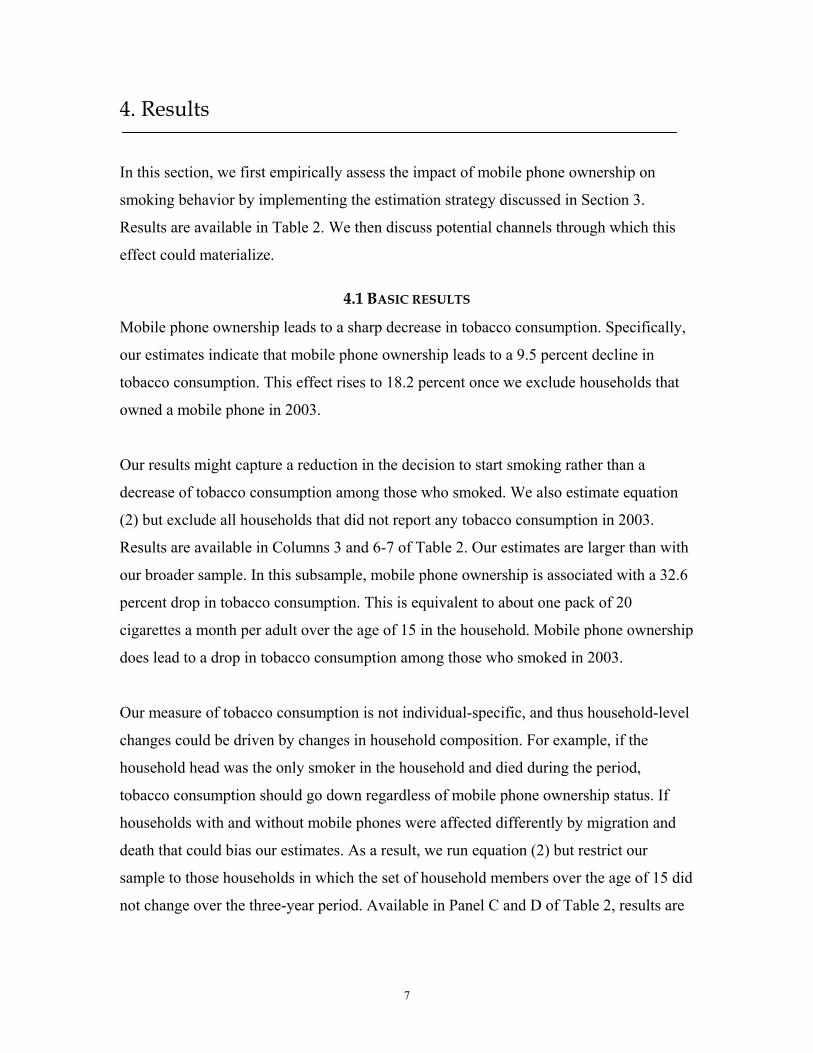
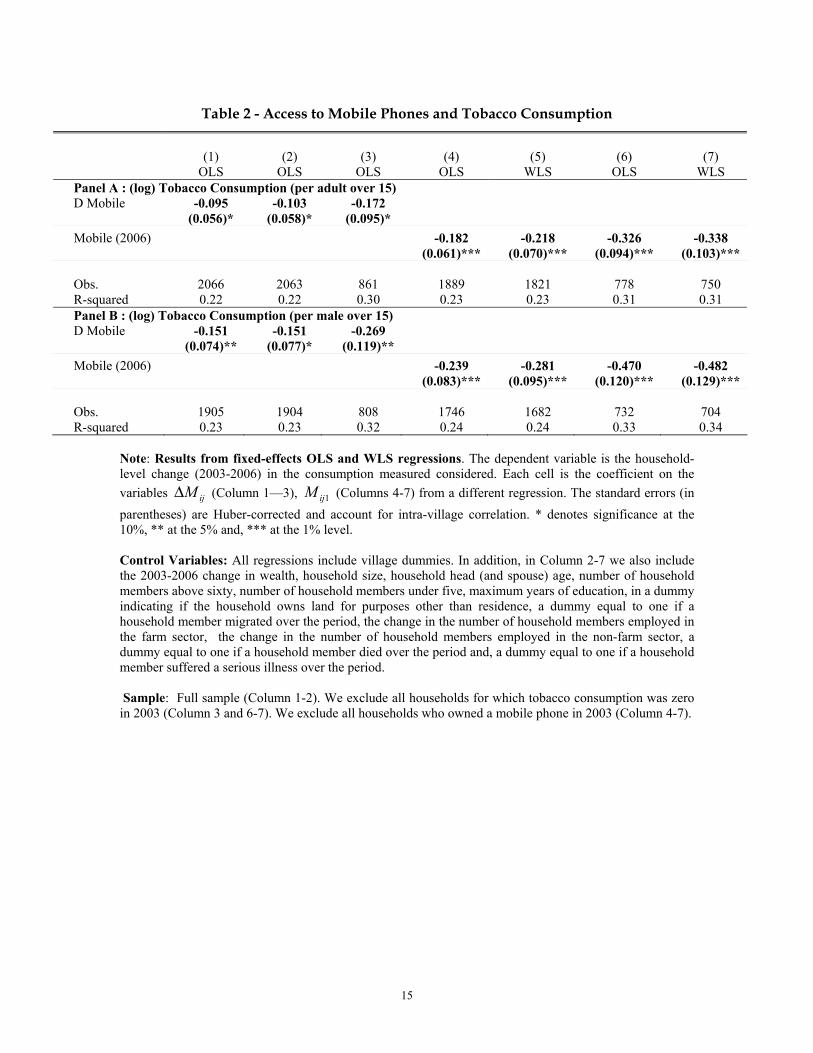
Mobile phone ownership leads to a sharp decrease in tobacco consumption. Specifically,
our estimates indicate that mobile phone ownership leads to a 9.5 percent decline in
tobacco consumption. This effect rises to 18.2 percent once we exclude households that
owned a mobile phone in 2003.
Our results might capture a reduction in the decision to start smoking rather than a
decrease of tobacco consumption among those who smoked. We also estimate equation
(2) but exclude all households that did not report any tobacco consumption in 2003.
Results are available in Columns 3 and 6-7 of Table 2. Our estimates are larger than with
our broader sample. In this subsample, mobile phone ownership is associated with a 32.6
percent drop in tobacco consumption. This is equivalent to about one pack of 20
cigarettes a month per adult over the age of 15 in the household. Mobile phone ownership
does lead to a drop in tobacco consumption among those who smoked in 2003.
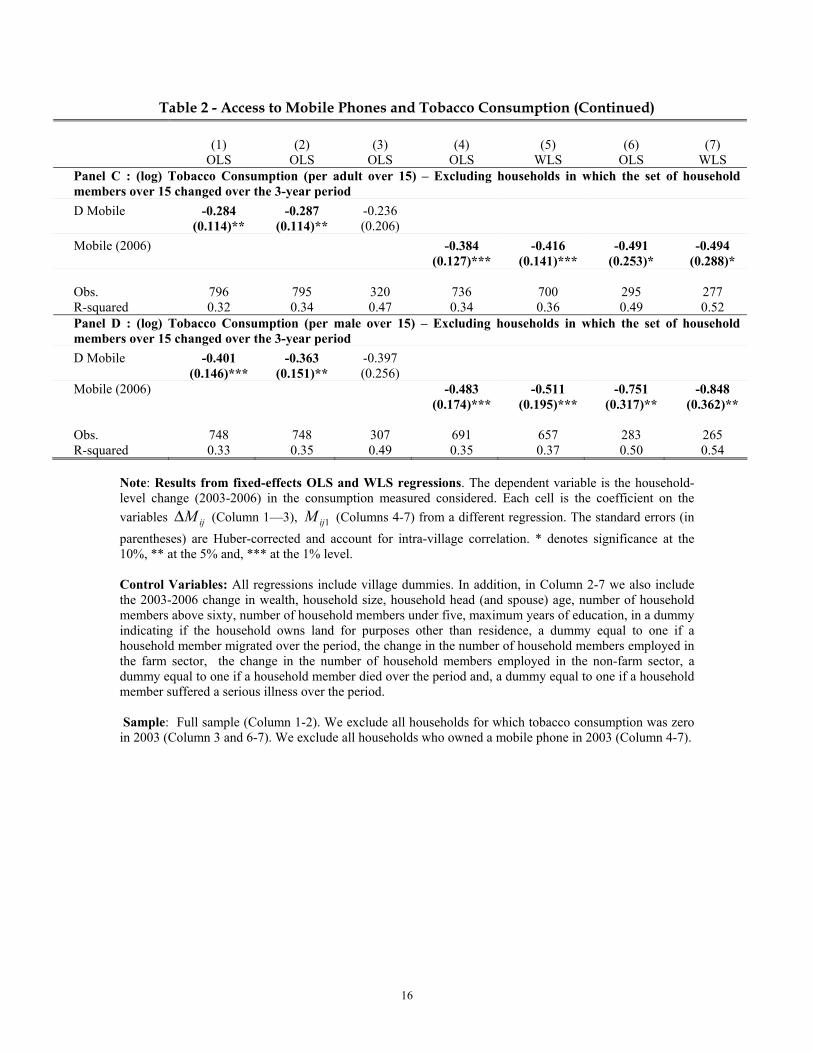
Our measure of tobacco consumption is not individual-specific, and thus household-level
changes could be driven by changes in household composition. For example, if the
household head was the only smoker in the household and died during the period,
tobacco consumption should go down regardless of mobile phone ownership status. If
households with and without mobile phones were affected differently by migration and
death that could bias our estimates. As a result, we run equation (2) but restrict our
sample to those households in which the set of household members over the age of 15 did
not change over the three-year period. Available in Panel C and D of Table 2, results are

8
consistent with the ones obtained previously: mobile phone ownership leads to a drop in
tobacco consumption.
A potential concern with our results is that the observed drop could be explained by a
drop in price rather than a decrease in the number of cigarettes smoked. Indeed, tobacco
sellers could decrease their prices in response to the introduction of mobile phones in
their community. However, changes in tobacco prices are unlikely to explain our results
as we control for time-varying village effects and prices are likely to be the same for all
households in a given village.
Further, households might shift to less expensive brands. To deal with those concerns, we
assess the links between mobile phone ownership and the decision to quit smoking.
Indeed, if the impact of mobile phone was merely capturing a shift to less expensive
brands, we should not observe any impact on the decision to quit smoking. We run Probit
regressions of the decision to quit smoking on the mobile phone dummy and a set of
covariates (measured as 2003-2006 changes). We include village dummies and compute
standard errors robust to arbitrary covariance structure within villages. Households for
which tobacco consumption was greater than zero in 2003 but was equal to zero in 2006
are classified as having quitted smoking. Results are available in Table 3. Households
who purchased a mobile phone between 2003 and 2006 are 20.4 percentage points more
likely to have stopped smoking. This result holds if we restrict our sample to households
in which the set of household members over the age of 15 did not change over the three-
year period (Panel B in Table 4). This indicates that shifts to less expensive brands cannot
fully explain our results.
4.2 ALTERNATIVE EXPLANATIONS AND POTENTIAL CHANNELS
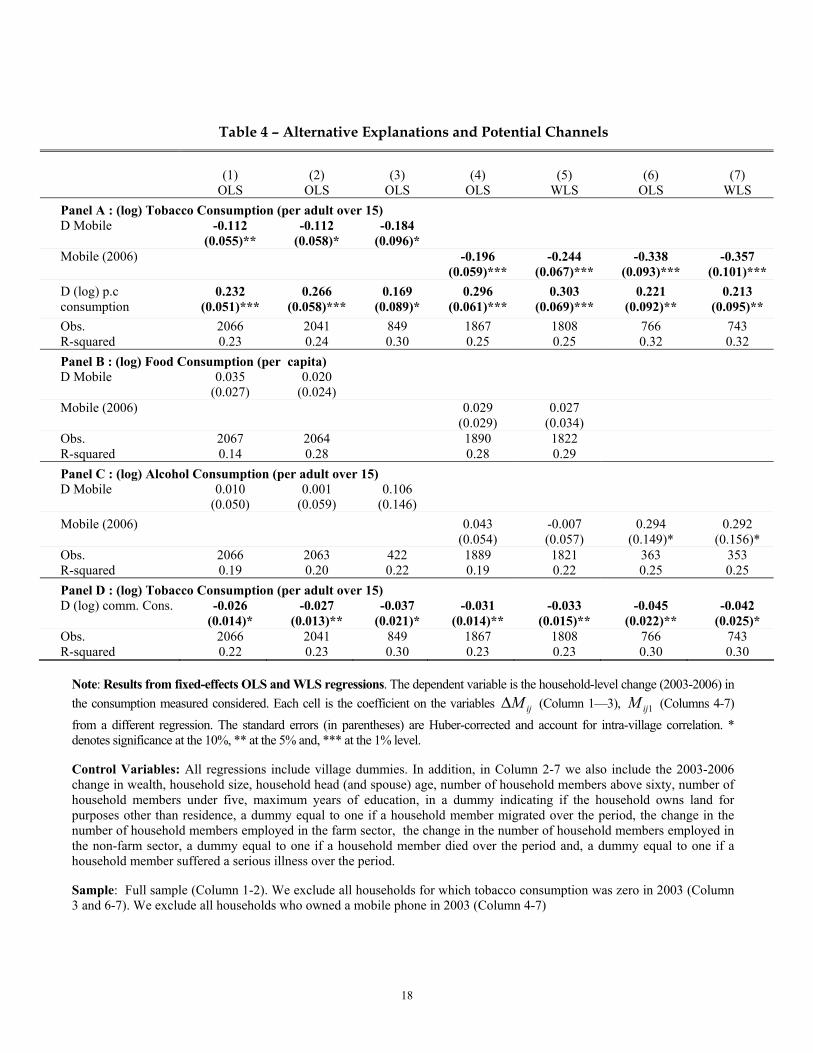
Our results could also capture the links between wealth, mobile phone ownership and
tobacco use. Indeed, if as they get richer, households buy a mobile phone and reduce their
tobacco consumption, we would be merely capturing a wealth effect rather than the actual
impact of mobile phone ownership. We assess if tobacco consumption is explained by
(non tobacco) consumption. We run equation (2) but include the change in total (non
9
tobacco) per capita consumption as a dependent variable. Results are available in Panel A
of Table 4. Our results are consistent with the ones obtained above: even after controlling
for household-fixed effects, tobacco consumption goes up with overall (non-tobacco)
consumption. It is important to note that the mobile phone dummy is still significant.
Overall, the results discussed above indicate that ‘wealth effects’ are not driving our
results.
We now assess if the impact of mobile phone is specific to tobacco consumption. Indeed,
it is possible that mobile phone-related expenses negatively affect not only tobacco
consumption but also the consumption of all other goods consumed by households. We
test if mobile phone ownership has any impact on alcohol consumption (per adult over
15) and per capita food consumption. Results are available in Panel B and C of Table 4.
We find that mobile phone ownership does not negatively impact on alcohol and food
consumption. There is something special about the relationship between mobile phones
and tobacco consumption.
Having shown that mobile phone ownership leads to a sharp decline in tobacco
consumption, we now turn our attention to the channels through which this effect might
materialize.
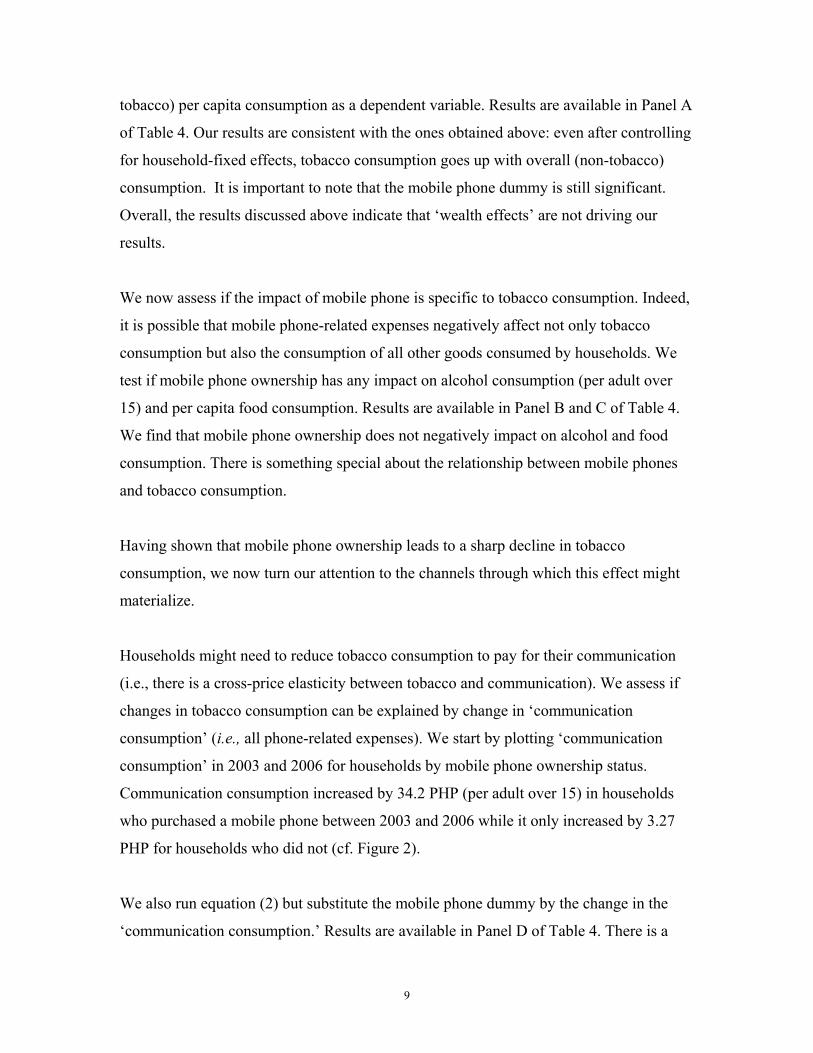
Households might need to reduce tobacco consumption to pay for their communication
(i.e., there is a cross-price elasticity between tobacco and communication). We assess if
changes in tobacco consumption can be explained by change in ‘communication
consumption’ (i.e., all phone-related expenses). We start by plotting ‘communication
consumption’ in 2003 and 2006 for households by mobile phone ownership status.
Communication consumption increased by 34.2 PHP (per adult over 15) in households
who purchased a mobile phone between 2003 and 2006 while it only increased by 3.27
PHP for households who did not (cf. Figure 2).
We also run equation (2) but substitute the mobile phone dummy by the change in the
‘communication consumption.’ Results are available in Panel D of Table 4. There is a
10
negative and significant relationship between communication and tobacco consumption.
This indicates that the impact of mobile phone on tobacco consumption is driven by a
shift of resources from tobacco to communication. This shift might be explained by the
role of tobacco consumption and mobile phone use as a signal for social status. It is
possible that while tobacco consumption used to be a signal for social status, it it now
slowly being replaced by mobile phone ownership and use.

11
5. Conclusion
In this paper, we explore the impact of mobile phone ownership on tobacco consumption.
Using household panel data, we find that purchasing a mobile phone leads to a sharp
decline in tobacco consumption. This effect is large and materializes through a budget
shift from tobacco to communication.
An interesting avenue for further analysis is to understand the role of social status in
explaining the observed shift between tobacco and communication. Indeed, it might be
that smoking used to be a signal for social status and this signal is slowly being replaced
by mobile phone ownership and use.
Finally, it appears important to assess if those results hold in other countries. First, in
countries at similar levels of incomes, other goods might get crowded out by mobile
phones. Second, in richer countries, the budget constraints might not be as strong and
thus mobile phone ownership might not lead to such a crowding-out.

12
References Adda, J and F Cornaglia (2006) “Taxes, Cigarette Consumption and Smoking Intensity”,
American Economic Review, 96(4): 1013-1028. Banerjee, A. and E. Duflo (2007) “The Economic Lives of the Poor” Journal of Economic
Perspectives, Vol. 21(1): 141-167. Charlton, A. and C. Bates (2000) “Decline in Teenage Smoking with Rise in Mobile Phone
Ownership: Hypothesis” BMJ, Vol. 321: 1155. Chase, R. and C. Holmemo (2005) “Community Driven Development and Social Capital:
Designing a Baseline Survey in the Philippines.” Social Development Department. Hirano, K., G. Imbens and G. Ridder. 2003. “Efficient Estimation of Average Treatment Effect
Using the Propensity Score” Econometrica, 71(4): 1161-1189. Imbens, G. and J. Wooldridge (2007) “What’s New in Econometrics?” NBER Summer Institute. Steggles, N. and M Jarvis (2003) “Do Mobile Phones Replace Cigarette Smoking Among
Teenagers?” Tobacco Control, Vol. 12: 339-340. Stock, J. and M. Yogo (2005) “Testing for Weak Instruments in Linear IV Regression” in
D.W.K. Andrews and J.H. Stock, eds., Identification and Inference for Econometric Models: Essays in Honor of Thomas Rothenberg, Cambridge: Cambridge University Press, pp. 80–108.
World Health Organization (2008) “Report on the Global Tobacco Epidemic 2008” Geneva,
Switzerland.
13
Figures
Monthly Tobacco Consumption in 2003 and 2006 by Mobile Phone Ownership Status
0
5
10
15
20
25
30
35
2003 2006Mon
thly
Tob
acco
Con
sum
ptio
n (P
HP)
No Mobile (2006) Mobile (2006)
Monthly Communication Consumption in 2003 and 2006 by Mobile Phone Ownership Status
0
5
10
15
20
25
30
35
40
45
2003 2006Mon
thly
Com
mun
icat
ion
Con
sum
ptio
n (P
HP)
No Mobile (2006) Mobile (2006)
14
Tables
Note: The standard deviations are in parentheses (Column 1 – 2) and the p-value are in brackets (Column 3 - 4). We exclude all households who owned a mobile phone in 2003.
Table 1 - Comparing Households with and without Mobile Phones in 2006
Mean T-test Kolmogorov Mobile Phone No Mobile
Phone Equality Means
Equality distribution
(1) (2) (3) (4) 30.28 31.66 0.496 0.034 Monthly Tobacco Consumption
(2003) adult over 15 (2.31) (1.57) [0.620] [0.987] 62.28 61.88 -0.066 0.066 Monthly Tobacco Consumption
(2003) per male over 15 (5.02) (3.36) [0.946] [0.437]
15
Table 2 - Access to Mobile Phones and Tobacco Consumption
(1) (2) (3) (4) (5) (6) (7) OLS OLS OLS OLS WLS OLS WLS Panel A : (log) Tobacco Consumption (per adult over 15) D Mobile -0.095 -0.103 -0.172 (0.056)* (0.058)* (0.095)* Mobile (2006) -0.182 -0.218 -0.326 -0.338 (0.061)*** (0.070)*** (0.094)*** (0.103)*** Obs. 2066 2063 861 1889 1821 778 750 R-squared 0.22 0.22 0.30 0.23 0.23 0.31 0.31 Panel B : (log) Tobacco Consumption (per male over 15) D Mobile -0.151 -0.151 -0.269 (0.074)** (0.077)* (0.119)** Mobile (2006) -0.239 -0.281 -0.470 -0.482 (0.083)*** (0.095)*** (0.120)*** (0.129)*** Obs. 1905 1904 808 1746 1682 732 704 R-squared 0.23 0.23 0.32 0.24 0.24 0.33 0.34
Note: Results from fixed-effects OLS and WLS regressions. The dependent variable is the household-level change (2003-2006) in the consumption measured considered. Each cell is the coefficient on the variables ijMΔ (Column 1—3), 1ijM (Columns 4-7) from a different regression. The standard errors (in parentheses) are Huber-corrected and account for intra-village correlation. * denotes significance at the 10%, ** at the 5% and, *** at the 1% level. Control Variables: All regressions include village dummies. In addition, in Column 2-7 we also include the 2003-2006 change in wealth, household size, household head (and spouse) age, number of household members above sixty, number of household members under five, maximum years of education, in a dummy indicating if the household owns land for purposes other than residence, a dummy equal to one if a household member migrated over the period, the change in the number of household members employed in the farm sector, the change in the number of household members employed in the non-farm sector, a dummy equal to one if a household member died over the period and, a dummy equal to one if a household member suffered a serious illness over the period. Sample: Full sample (Column 1-2). We exclude all households for which tobacco consumption was zero in 2003 (Column 3 and 6-7). We exclude all households who owned a mobile phone in 2003 (Column 4-7).
16
Table 2 - Access to Mobile Phones and Tobacco Consumption (Continued) (1) (2) (3) (4) (5) (6) (7) OLS OLS OLS OLS WLS OLS WLS Panel C : (log) Tobacco Consumption (per adult over 15) – Excluding households in which the set of household members over 15 changed over the 3-year period D Mobile -0.284 -0.287 -0.236 (0.114)** (0.114)** (0.206) Mobile (2006) -0.384 -0.416 -0.491 -0.494 (0.127)*** (0.141)*** (0.253)* (0.288)* Obs. 796 795 320 736 700 295 277 R-squared 0.32 0.34 0.47 0.34 0.36 0.49 0.52 Panel D : (log) Tobacco Consumption (per male over 15) – Excluding households in which the set of household members over 15 changed over the 3-year period D Mobile -0.401 -0.363 -0.397 (0.146)*** (0.151)** (0.256) Mobile (2006) -0.483 -0.511 -0.751 -0.848 (0.174)*** (0.195)*** (0.317)** (0.362)** Obs. 748 748 307 691 657 283 265 R-squared 0.33 0.35 0.49 0.35 0.37 0.50 0.54
Note: Results from fixed-effects OLS and WLS regressions. The dependent variable is the household-level change (2003-2006) in the consumption measured considered. Each cell is the coefficient on the variables ijMΔ (Column 1—3), 1ijM (Columns 4-7) from a different regression. The standard errors (in parentheses) are Huber-corrected and account for intra-village correlation. * denotes significance at the 10%, ** at the 5% and, *** at the 1% level. Control Variables: All regressions include village dummies. In addition, in Column 2-7 we also include the 2003-2006 change in wealth, household size, household head (and spouse) age, number of household members above sixty, number of household members under five, maximum years of education, in a dummy indicating if the household owns land for purposes other than residence, a dummy equal to one if a household member migrated over the period, the change in the number of household members employed in the farm sector, the change in the number of household members employed in the non-farm sector, a dummy equal to one if a household member died over the period and, a dummy equal to one if a household member suffered a serious illness over the period. Sample: Full sample (Column 1-2). We exclude all households for which tobacco consumption was zero in 2003 (Column 3 and 6-7). We exclude all households who owned a mobile phone in 2003 (Column 4-7).

17
Note: Results from Probit regressions. Each cell is the coefficient on the variables ijMΔ
(Column 1-2), 1ijM (Columns 3) from a different regression. The standard errors (in parentheses) are Huber-corrected and account for intra-village correlation. * denotes significance at the 10%, ** at the 5% and, *** at the 1% level. Control Variables: All regressions include village dummies. In addition, in Column 2-3 we also include the 2003-2006 change in wealth, household size, household head (and spouse) age, number of household members above sixty, number of household members under five, maximum years of education, in a dummy indicating if the household owns land for purposes other than residence, a dummy equal to one if a household member migrated over the period, the change in the number of household members employed in the farm sector, the change in the number of household members employed in the non-farm sector, a dummy equal to one if a household member died over the period and, a dummy equal to one if a household member suffered a serious illness over the period. Sample: We exclude all households for which tobacco consumption was zero in 2003 (Column 1-3). We exclude all households who owned a mobile phone in 2003 (Column 3)
Table 3 - Access to Mobile Phones and the Decision to Quit Smoking
Probit (Marginal Effects) (1) (2) (3) Full Sample D Mobile 0.128 0.135 (0.039)*** (0.044)*** Mobile (2006) 0.204 (0.051)*** Observations 867 866 786 Pseudo R-squared .14 .16 .17 Excluding households in which the set of household members over 15 changed over the 3-year period D Mobile 0.161 0.179 (0.092)* (0.106)* Mobile (2006) 0.284 (0.128)** Observations 250 249 231 Pseudo R-squared .14 .19 .19
18
Table 4 – Alternative Explanations and Potential Channels
(1) (2) (3) (4) (5) (6) (7) OLS OLS OLS OLS WLS OLS WLS Panel A : (log) Tobacco Consumption (per adult over 15) D Mobile -0.112 -0.112 -0.184 (0.055)** (0.058)* (0.096)* Mobile (2006) -0.196 -0.244 -0.338 -0.357 (0.059)*** (0.067)*** (0.093)*** (0.101)*** D (log) p.c 0.232 0.266 0.169 0.296 0.303 0.221 0.213 consumption (0.051)*** (0.058)*** (0.089)* (0.061)*** (0.069)*** (0.092)** (0.095)** Obs. 2066 2041 849 1867 1808 766 743 R-squared 0.23 0.24 0.30 0.25 0.25 0.32 0.32 Panel B : (log) Food Consumption (per capita) D Mobile 0.035 0.020 (0.027) (0.024) Mobile (2006) 0.029 0.027 (0.029) (0.034) Obs. 2067 2064 1890 1822 R-squared 0.14 0.28 0.28 0.29 Panel C : (log) Alcohol Consumption (per adult over 15) D Mobile 0.010 0.001 0.106 (0.050) (0.059) (0.146) Mobile (2006) 0.043 -0.007 0.294 0.292 (0.054) (0.057) (0.149)* (0.156)* Obs. 2066 2063 422 1889 1821 363 353 R-squared 0.19 0.20 0.22 0.19 0.22 0.25 0.25 Panel D : (log) Tobacco Consumption (per adult over 15) D (log) comm. Cons. -0.026 -0.027 -0.037 -0.031 -0.033 -0.045 -0.042 (0.014)* (0.013)** (0.021)* (0.014)** (0.015)** (0.022)** (0.025)* Obs. 2066 2041 849 1867 1808 766 743 R-squared 0.22 0.23 0.30 0.23 0.23 0.30 0.30
Note: Results from fixed-effects OLS and WLS regressions. The dependent variable is the household-level change (2003-2006) in the consumption measured considered. Each cell is the coefficient on the variables ijMΔ (Column 1—3), 1ijM (Columns 4-7) from a different regression. The standard errors (in parentheses) are Huber-corrected and account for intra-village correlation. * denotes significance at the 10%, ** at the 5% and, *** at the 1% level. Control Variables: All regressions include village dummies. In addition, in Column 2-7 we also include the 2003-2006 change in wealth, household size, household head (and spouse) age, number of household members above sixty, number of household members under five, maximum years of education, in a dummy indicating if the household owns land for purposes other than residence, a dummy equal to one if a household member migrated over the period, the change in the number of household members employed in the farm sector, the change in the number of household members employed in the non-farm sector, a dummy equal to one if a household member died over the period and, a dummy equal to one if a household member suffered a serious illness over the period. Sample: Full sample (Column 1-2). We exclude all households for which tobacco consumption was zero in 2003 (Column 3 and 6-7). We exclude all households who owned a mobile phone in 2003 (Column 4-7)
19
Table A1 - Testing the Conditional Independence Assumption Coeff. Estimation Method (s.e.) OLS – Full Sample -0.024 (0.054) WLS – Full Sample 0.014 (0.060) OLS – Tobacco (2003) > 0 0.028 (0.069) WLS – Tobacco (2003) > 0 0.047 (0.070)
Note: Results from OLS and WLS regressions. The dependent variable is the 2003 tobacco consumption per adult over 15 in the household. Each cell is the coefficient on the variable 1ijM from a different regression. We exclude all households for which tobacco consumption was zero in 2003. The standard errors (in parentheses) are Huber-corrected and account for intra-village correlation. * denotes significance at the 10%, ** at the 5% and, *** at the 1% level.
20
Table A2 – Propensity Score Estimates
Probit (Marginal Effects) (1) Asset (2003) 0.202 (0.019)*** College (2003) 0.251 (0.174) Secondary (2003) 0.022 (0.088) No Education (2003) -0.195 (0.192) Nb. Working Farm (2003) 0.012 (0.037) Nb. Working Non Farm (2003) 0.151 (0.061)** HH Size (2003) 0.059 (0.024)** Age head (2003) 0.004 (0.005) Nb. Above sixty (2003) -0.098 (0.101) Nb. Under five (2003) -0.157 (0.052)*** Age spouse (2003) 0.001 (0.002) Land Owner (2003) 0.005 (0.083) Village Dummies Yes Observations 1824 Pseudo R-squared 0.15
Note: Results from Probit regressions. The dependent variable is a dummy equal to one if the household owns a cell phone in 2006. The standard errors (in parentheses) are Huber-corrected and account for intra-village correlation. * denotes significance at the 10%, ** at the 5% and, *** at the 1% level. We exclude all households who owned a mobile phone in 2003.