social attitudes on gender equality and firms’ discriminatory pay …ftp.iza.org/dp7959.pdf ·...
TRANSCRIPT
DI
SC
US
SI
ON
P
AP
ER
S
ER
IE
S
Forschungsinstitut zur Zukunft der ArbeitInstitute for the Study of Labor
Social Attitudes on Gender Equality andFirms’ Discriminatory Pay-Setting
IZA DP No. 7959
February 2014
Simon JanssenSimone N. Tuor SartoreUschi Backes-Gellner
Social Attitudes on Gender Equality and
Firms’ Discriminatory Pay-Setting
Simon Janssen University of Zurich
and IZA
Simone N. Tuor Sartore University of Zurich
Uschi Backes-Gellner
University of Zurich
Discussion Paper No. 7959 February 2014
IZA
P.O. Box 7240 53072 Bonn
Germany
Phone: +49-228-3894-0 Fax: +49-228-3894-180
E-mail: [email protected]
Any opinions expressed here are those of the author(s) and not those of IZA. Research published in this series may include views on policy, but the institute itself takes no institutional policy positions. The IZA research network is committed to the IZA Guiding Principles of Research Integrity. The Institute for the Study of Labor (IZA) in Bonn is a local and virtual international research center and a place of communication between science, politics and business. IZA is an independent nonprofit organization supported by Deutsche Post Foundation. The center is associated with the University of Bonn and offers a stimulating research environment through its international network, workshops and conferences, data service, project support, research visits and doctoral program. IZA engages in (i) original and internationally competitive research in all fields of labor economics, (ii) development of policy concepts, and (iii) dissemination of research results and concepts to the interested public. IZA Discussion Papers often represent preliminary work and are circulated to encourage discussion. Citation of such a paper should account for its provisional character. A revised version may be available directly from the author.
IZA Discussion Paper No. 7959 February 2014
ABSTRACT
Social Attitudes on Gender Equality and Firms’ Discriminatory Pay-Setting
We analyze the relationship between social attitudes on gender equality and firms’ pay-setting behavior by combining information about regional votes relative to gender equality laws with a large data set of multi-branch firms and workers. The results show that multi-branch firms pay more discriminatory wages in branches located in regions with a higher social acceptance of gender inequality than in branches located in regions with a lower acceptance. The results are similar for different subsamples of workers, and we cannot find evidence that regional differences in social attitudes influence how firms assign women and men to jobs and occupations. The investigation of a subsample of performance pay workers for whom we are able to observe their time-based and performance pay component separately shows that social attitudes on gender equality only influence the time-based pay component but not the performance pay component of the same workers. Because regional-specific productivity differences should influence the workers’ performance pay and time-based pay, unobserved gender-specific productivity differences are not likely to explain the regional variation in within firm gender pay gaps. The results support theories and previous evidence showing that social attitudes influence gender pay gaps in the long run. JEL Classification: J31, J33, J71, M5 Keywords: gender pay gaps, social attitudes, firms’ pay setting Corresponding author: Simon Janssen University of Zurich Plattenstrasse 14 8032 Zurich Switzerland E-mail: [email protected]
1
Introduction
Although many economic theories emphasize that prejudices can explain why gender and
racial pay gaps exist and persist in the long run, only some recent studies show empirically
that prejudices indeed account for a substantial part of the regional variation in gender and
racial pay gaps. Commonly, these empirical studies combine regional information about
individual pay with survey information on social attitudes to measure differences in local
prejudices. In this way, Charles and Guryan (2008) show that racist social attitudes account
for about one quarter of the regional variation in black and white pay gaps across US states—
even after controlling for detailed worker and job characteristics. Charles, Guryan, and Pan
(2009) show that sexist attitudes are related to the regional variation of gender pay gaps
across US states. Fortin (2005) shows that gender role attitudes relate to the development of
gender pay gaps across OECD countries.
However, previous empirical studies analyze the relationship between social attitudes and
discriminatory pay gaps solely on the individual level and do not investigate whether and how
firms adjust their pay-setting to differences in their local discriminatory environment. To fill
this research gap, we investigate gender pay gaps within multi-branch firms that operate in
different regions, which are characterized by different levels of social attitudes on gender
equality. Becker’s (1971) seminal work on taste-based discrimination predicts that prejudicial
employers adjust wages of minority workers by exactly the cost of their personal distaste,
while non-prejudicial employers gain rents by hiring minority workers at wages above their
discriminatory outside options. As a result, firms have no incentives to adjust their pay-setting
to their discriminatory environment, and pay gaps will not persist in the long run.
In contrast, more recent theoretical papers argue that it might be optimal for prejudicial,
and most importantly, non-prejudicial employers to set discriminatory wages if labor markets
are not perfectly competitive. These models implicitly predict that firms have incentives to
adjust their pay-setting to their discriminatory environment (e.g. Black 1995; Ros´ n 1997;
Sasaki 1999; Ros´ n 2003). Calibrations show, indeed, that large discriminatory pay gaps are
likely to persist in the long run, because all firms have incentives to pay discriminatory wages,
even if there are only a few discriminatory firms in the market (Lang and Lehmann, 2012;
Lang Manove, and Dickens 2005). Therefore, researchers must understand whether and how
social attitudes on gender equality influence firms’ discriminatory pay-setting to better
understand why discriminatory pay gaps persist in the long run.
2
Nevertheless, to empirically investigate whether and how social attitudes on gender
equality influence firms’ discriminatory pay-setting, we have to overcome two major
challenges: First, we must find a measure for social attitudes that reflects true preferences of
individuals, and is representative for different regions in the labor market. Second, we need
information on the pay-setting behavior of firms that operate under the influence of different
levels of social attitudes on gender-equality, while other influences such as institutions,
technological changes, and economic conditions remain the same. Third, we have to provide
convincing evidence that the relationship between social attitudes for gender equality and the
pay-setting behavior of firms is not a pure consequence of differences in unobservable
gender-specific productivity differences.
We overcome these empirical problems by using information of real votes on two
amendments to the Swiss constitution on gender equality laws, and combine this information
with a data set on multi-branch firms. First, we follow Lalive and Stutzer (2010) in measuring
social attitudes by using information on regional votes on a 1981 amendment to the Swiss
constitution on equal rights for women and men. One central part of this referendum states
that women and men shall have the same rights and duties in the family and in the labor
market. Second, we use information on regional votes on a 2000 amendment to the Swiss
constitution stating that women should be fairly represented in federal authorities. Both
referenda provide adequate measures of the degree to which voters challenge the traditional
role model of women and men in society. Most importantly, voters are likely to reveal their
true preferences and prejudices in a secret ballot. In contrast, previous studies mostly rely on
survey data and face the problem that respondents report the socially desired outcomes rather
than their true preferences.
We combine this data with information on multi-branch firms that operate in different
regions of Switzerland. In this way, we are able to observe the pay-setting behavior of firms
that are exposed to the same national institutional, regulatory, and technological standards
(because they operate in the same country during the same time period) but are exposed to the
influence of differing social attitudes and prejudices (because their branches are located in
different regions with different social attitudes for gender equality). Therefore, we avoid
common problems of some previous studies relying on data from different countries or time
periods, which are exposed to strong institutional, educational, and technological differences.
The most challenging difficulty is to provide evidence showing that the relationship be-
tween social attitudes on gender equality and firms’ pay-setting is not a pure consequence of
unobservable gender-specific productivity differences. By definition, social attitudes are
3
persistent and long lasting and, therefore, not subject to frequent shocks that we might be able
to exploit within a quasi-experimental setting. Instead this paper provides another innovative
solution to the problem. We are fortunate to observe a subsample of workers on performance
pay for which we are able to observe the time-based component and the performance pay
component separately for the same worker. As time-based pay is often subject to bargaining
between workers and firms, and performance pay is commonly tied more to the workers
observed productivity according to specific rules, performance pay is more closely related to
workers productivity than time-based pay (e.g., Lazear 2000; Lemieux, Macleod, and Parent
2009). This relationship allows us to apply an empirical proof by contradiction to show that
the relationship between social attitudes for gender equality and the discriminatory pay-
setting of firms is not driven by a relationship between social attitudes on gender equality and
unobserved gender-specific productivity differences. More specifically, under the assumption
that the relationship between social attitudes for gender equality and pay is driven by regional
gender-specific productivity differences, we have to find an effect of social attitudes on the
performance pay component and on the time-based component of the workers pay. In
contrast, finding that social attitudes affect only the time-based component but not the
performance pay component of the same worker would contradict the assumption that
unobserved gender-specific productivity differences are the main cause for our results.
Our results reveal that—within the same firm—gender pay gaps are larger for branches in
regions where people are more likely to tolerate gender inequality—i.e. where fewer people
approved the equal rights amendment—than in regions where people are less likely to tolerate
gender inequality. Indeed, regional differences in voting outcomes explain about 50% of the
within-firm variation in gender pay gaps.
The results remain robust and stable when we include detailed worker, occupation and
firm characteristics. Although we find that average gender pay gaps are larger for married
than for unmarried workers, and larger for long than short tenured workers, the influence of
social attitudes on gender pay gaps is relatively similar for all these subsamples.
Separate analyses for the time-based and performance pay components on a subsample of
workers receiving performance pay show that firms’ pay-setting behaviors vary according to
regional differences in social attitudes only with regard to their time-based component of pay.
If discrimination would be absent, and unobserved gender-specific productivity differences
would be the only force driving our results, we should find that social attitudes influence the
workers’ performance and time-based pay component in a similar way. Therefore, our results
do not suggest that only regional specific productivity differences drive our results.
4
Finally, we cannot find strong evidence that social attitudes on gender equality influence
the way firms hire and assign women and men for different jobs and occupations. Although
women are on average less likely to hold management positions, have less education, and are
more likely to work in lower paying occupations, these gender-specific differences are similar
for different branches of the same firms.
Overall, our results indicate that firms adjust their pay setting to their discriminatory
environment. Therefore, this study contributes to the discussion of why gender pay gaps
persist in the long run even after controlling for a large number of observable productivity-
relevant characteristics (e.g., Altonji and Blank 1999; Blau and Kahn 2000; 2006). By
showing that firms adjust their pay-setting to their discriminatory environment rather than
maintaining similar payment policies across regions, our results shed light on why gender and
racial pay gaps persist in the long run. At the same time we support previous empirical studies
showing that social attitudes or prejudices explain a substantial part of the variation in
discriminatory pay gaps.
The remainder of the paper is organized as follows: Section I describes the theoretical
background. Section II presents the empirical model. Section III describes the voting and the
firm data. Section IV presents the estimation results. Section V concludes.
I. Why should social attitudes influence the pay-setting behavior of
firms?
Becker’s seminal work on employers’ taste-based discrimination predicts that employers are
only willing to hire minority workers (in our case women) at wages low enough to
compensate for their personal cost of distaste. Therefore, Becker himself and Arrow (1972)
emphasize that employers with weaker prejudicial tastes will gain rents by hiring women. As
a result, labor markets will either fully segregate, or all prejudicial employers leave the
market.
In such a framework, we would not expect that firms adjust their pay-setting to their
discriminatory environment. In the short run, some discriminatory firms might pay women
and men differently but these pay differentials equal the employers’ personal costs of dis-
taste in every region. In contrast, non-discriminatory firms operating in discriminatory
environments have incentives to pay women above their discriminatory market wages and
will not adjust their pay-setting behavior in the long run.
Given the difficulty of Becker’s framework to explain why gender pay gaps persist in the
5
long run, several papers extend his work by incorporating market frictions into Becker’s
model. Black (1995), Rosén (1997), and Rosén (2003), for example, develop equilibrium
search models with prejudicial employers or managers. Their idea is that some prejudicial
employers or managers in the market reduce outside options for all women by influencing the
number or quality of outside offers. As a result gender pay gaps persist in the long run. Lang
and Lehmann (2012) and Lang et al. (2005) develop similar wage-posting and wage-
bargaining models which predict that discriminatory wage gaps can be large even if there are
only a few prejudicial employers on the market. Other studies develop monopsony type
models showing that tastes for discrimination, or gender-specific preferences
disproportionally increase women’s mobility costs or might reduce their possible job choices
(Robinson 1969; Boal and Ransom 1997; Bhaskar, Manning, and To 2002; Manning 2008;
Hirsch 2009).
All of these models implicitly predict that firms will efficiently adjust their pay-setting
behavior to their discriminatory environment. More intuitively, market frictions prevent the
full gender segregation of the labor market, and some prejudicial firms employ women for
lower wages, and thereby reduce women’s outside options. As a consequence non-prejudicial
employers can gain rents by paying discriminatory wages. More specifically, non-prejudicial
firms may pay less-discriminatory wages than prejudicial firms, but market frictions prevent
non-prejudicial firms to pay entirely non-discriminatory wages. However, if not only
prejudicial firms but also non-prejudicial firms will pay women lower wages than men,
discriminatory gender pay gaps are likely to persist in the long run.
II. Estimation strategy
The working model of our empirical investigation has the following simple form:
!"#!,!(!,!)! != !!! !+ !!!"#$%!! !+ !!!"#$!!! ! · !! !+ !! !+ !! !+ !!,!(!,!)! (1)!
!"#!,!(!,!)! is the logarithm of the worker i’s monthly pay. ! indicates the type of pay, and can
be either the total pay (tot) or, for the subsample of workers on performance pay, the time-
based component (tb) or the performance pay component (pp). !(!, !) represents the branch of
firm ! in region !. !"#$%!! is a dummy variable that is 1 if the individual is female and 0
otherwise. !! ! is our proxy for prejudicial attitudes towards gender equality measured as the
regional fraction of voters that approved the Swiss amendment on gender equality rights.!!! !is
6
a firm-specific fixed effect. !! is a canton-specific fixed effects to capture unobserved factors
on the cantonal level that are not directly related to the cantonal votes but might influence the
pay of workers. Because !! varies only on the cantonal level, the incorporation of !! does not
allow us to identify the direct effect of the votes !! on the worker’s pay level.
We analyze firms with branches in different regions. Therefore, our observations are
grouped in non-nested clusters of firms and regions. If we would not account for this
clustering, we might massively underestimate standard errors, and consequently over-reject
standard hypothesis tests, even if would cluster on the regional level. Therefore, we follow
Cameron and Miller (2010) and estimate standard errors that account for non-nested
clustering on the firm and regional level. To ensure that the covariance matrix has full rank,
we partial out the control variables.1
We estimate equation (1) for different sub-populations and with different sets of control
variables. The coefficient estimate of main interest !! displays the relationship between the
firms’ pay-setting behavior and the regional voter approval rate. More precisely, the
coefficient estimate indicates by how much the gender pay gap changes between branches (of
the same firm) that are located in regions with different social attitudes on gender equality.
We can interpret !! in this way because we incorporate a firm-specific fixed effect to the
equation and identify !! only through the within-firm variance.
III. Data
This section describes our data sets in detail. Subsection A describes the voting data, and
subsection B presents our data on the firms.
III.A. The Voting Data
We measure social attitudes on gender equality by voter approval rates across different
regions, i.e., cantons, in Switzerland. More specifically, we use information on votes on two
amendments of the Swiss constitution with regard to gender equality. First, we follow Lalive
and Stutzer (2010) and use voting data on an amendment to the Swiss constitution on equal
rights for women and men from 1981. However, this ballot took place more than 10 years
1 Another approach to account for the cluster structure on the regional level would be to follow Charles and Guryan (2008) by first estimating gender pay-gaps on the regional level, and than perform a second- stage regression of gender pay gaps on voting outcomes. But this approach would not allow us to estimate the within-firm effect.
7
before the observation period of our firm data. Although we could expect that social attitudes
change slowly over time, we cannot be sure that social attitudes do not change over the course
of more than 20 years. Specifically the 1980’s have been a period of substantial progress
towards more gender equality in the labor market and society in general. Such changes would
be problematic for the interpretation of our results if the relative regional structure of social
attitudes had changed substantially. For example, regional specific immigration from other
countries might alter social attitudes on gender equality for specific regions. Therefore, we
alternatively use information on regional votes on the 2000 amendment to the Swiss
constitution on a fair representation of women in the federal authorities. In the following, we
provide more detailed information on the amendment to the Swiss constitution and present
some descriptive statistics for both ballots.
In 1981, Swiss voters had to decide whether to amend the Swiss constitution to reflect not
only the equality of human beings in general but the equality of women and men in particular.
More specifically, the amendment to the Swiss constitution contains the following
expressions:
• “Men and women have equal rights.”
• “Men and women have equal rights and duties in the family.”
• “Men and women are entitled to equal pay for equal work.”
• “Men and women are entitled to equal treatment and equal opportunities in education,
schooling and vocational education, in employment and occupation.”
We argue that the regional voter approval rates provide a measure for identifying social
attitudes towards gender equality. Although we observe regional variation in social attitudes,
the Swiss constitution applies to all regions. In other words, cantons whose voters rejected the
amendment nonetheless have the legal obligation to abide by it. Therefore, the amendment
has no legal consequences that differ across regions, and, therefore, can be considered as an
appropriate measure for social attitudes.
We use data on votes from the Swiss Federal Statistical Office on the equal rights
amendment across the 26 Swiss cantons on June 14, 1981.2 Overall, 60.3% of the voters
favored the constitutional amendment, and 39.7% rejected it. Table A.1 provides the voting
results separately for each canton.
2 The information is available from the Swiss Federal Statistical Office under http://www.bfs.admin. ch/bfs/portal/de/index/themen/17/03/blank/data/05/01.html.
8
—Table A.1 about here—
The variation across cantons is substantial. While in Appenzell Inner Rhoden only about 30%
of the voting population approved the amendment on equal rights, in Geneva more than 80%
of the voting population approved it. In urban areas such as Zurich, the economic capital of
Switzerland, only slightly more than 60% approved the amendment.
As both women and men participated in the voting, the approval rates should represent
the opinion of both women and men within each region. Although actual voter approval rates
for women and men are not available, given the anonymity of the ballot box, table A.2 shows
the results of a post-vote survey on the voting behavior of women and men.3
The survey is provided by the Swiss Foundation for Research and Social Sciences and
stems from a project called VoxIt, which has conducted post-voting surveys during the two or
three weeks following all federal votes since 1977. The project infers information about Swiss
voter behavior and political and social affinities. Thought even the survey data for the
question on gender equality is not representative and is available only for some cantons, the
results show a very similar pattern to the actual votes presented in table A.1.
—Table A.2 about here—
For example, in the real vote on the amendment, the cantonal approval rate was highest in
Geneva at 85.2% and the result in the VoxIt data also shows Geneva with the highest
approval rate, at 88.6%. St. Gallen and Aargau show low approval rates of 46.3% and 52.1%,
in the real amendment and relatively low approval rates of 63.4% and 68.4% in the VoxIt
survey. As overall approval rates are almost always higher in the post-vote survey than in the
real voting outcomes, the data supports that survey data is subject to a desirability bias.
Nevertheless, relative outcomes of both data sets are surprisingly similar.
An important outcome of the post-vote survey is that the women’s votes quite strongly
match men’s votes. Women have the lowest approval rates in St. Gallen and Aargau, whereas
they have the highest approval rates in Geneva and Zurich. Therefore, the post-vote survey
provides some additional indication that the votes proxy social attitudes that manifests in both
women’s and men’s preferences in a particular region.
For our second measure for social attitudes, we use information on regional votes on the 3 For more information on the post-vote survey see http://forsdata.unil.ch/projects/Voxit/ docu_xl_htmD/ListeVoxDispoD.htm?lang=e&menu=4.
9
2000 amendment to the Swiss constitution on a fair representation of women in federal
authorities. The main request of the amendment was that women should be fairly represented
in all federal authorities (i.e., in the parliament, the federal council and the federal court) and
in the administration (in particularly in the federal administration, in state-owned and
operated enterprises and in universities). Like the information for the ballot on gender
equality in the labor market, the data on the votes about the fair representation amendment
comes from the Swiss Federal Statistical Office.4 Although the two amendments differ in
their content, both amendments cover an issue related to social attitudes on gender equality.
Specifically, we plausibly assume that the population’s general feeling about gender equality
affects both amendments in similar ways. Even if the absolute voting outcomes might not be
comparable across the two amendments, the information nevertheless helps to clearly identify
whether relative differences in social attitudes on gender equality determine differences in the
gender pay gap across regions.
Table A.3 presents descriptive statistics on the voting outcome. In contrast to the
amendment on gender equality, Swiss voters rejected the amendment on a fair representation
of women in federal authorities. Overall, 82.0% of Swiss voters rejected the amendment.
Nevertheless, the patterns across regions are very similar to the patterns for the 1981
amendment. Therefore, the results indicate that the relative structure of social attitudes has not
changed across cantons over time.
—Table A.3 about here—
Table A.3 uncovers that the relative pattern for the 2000 amendment is astonishingly similar
to the pattern of the 1981 amendment in table A.1. For example, Geneva has the highest
approval rate for both amendments whereas Appenzell Innerrhoden has the lowest approval
rates for both amendments. To clarify this relationship figure A.1 plots the voting results for
both amendments against each other. The graph shows a strong positive relationship between
both amendments. Moreover, the correlation between both variables amounts to 87.11%.
Thus the results strongly suggest that the relative structure of social attitudes did not change
substantially over the course of more than 20 years.
III.B. The Firm Data
4 The information is available from the Swiss Federal Statistical Office under http://www.bfs.admin. ch/bfs/portal/de/index/themen/17/03/blank/data/07/01.html.
10
Our firm data stems from the Swiss Earnings Structure Survey (ESS), a survey covering a
large number of firms. The ESS is based on two-level sampling (i.e., both firms and workers)
and selects the firms from the Swiss business and enterprise register. The data is
representative of all economic sectors except agriculture. The survey does not cover firms
with fewer than 3 employees and provides no information on trainees, apprentices or workers
who are only paid on commissions. Firms with less than 20 employees are required to report
all employees. Firms with 20 and 50 employees are allowed to report only every second
employee, and firms with more than 50 employees are allowed to report every third
employee. However, the firms are required to select their reported workers randomly. The
ESS, which is based on two-level sampling (i.e., both firms and workers) procedure, selects
the firms from the Swiss business and enterprise register. The ESS was conducted in
biennially repeated cross-sections since 1994, and participation for firms is compulsory.
To identify multiple branches of firms across cantons, we need information on workers’
administrative cantonal districts. As the EES provides such information only for 1994 through
1998, we restrict our sample to that period. Unfortunately, the data only allows identifying
different branches if they are located in different cantonal regions. Multiple branches that are
located in the same region appear in the data source as a single branch. This restriction,
however, is not decisive for the main focus of our analysis, i.e., to analyze the relationship
between social attitudes on gender equality and firms’ pay-setting behavior.
At the firm level, we restrict our sample to companies in the private sector with branches
in more than one canton. To ensure that we can measure a gender pay gap within each branch,
we require that every branch in our sample contains information about at least two employees
and at least one woman and one man. Additionally, we exclude all agricultural firms because
the observations in our data are not representative for this sector. Moreover, some firms report
different industry categorizations for branches in different regions. We drop those firms from
the sample. Given these restrictions, we have to drop the small canton Appenzell Inner
Rhoden from our sample, as none of the branches there matches our restrictions.
At the employee level, we restrict the sample to full-time workers (i.e., workers with
more than 30 working hours per week) that were older than 16 when they entered the firm and
younger than 65 at the time of the survey. We only incorporate full-time workers in our
analysis because part-time workers are likely to differ from full-time workers in terms of their
unobserved productivity. In particular, part-time working women are likely to follow a very
different career path than full-time working men. We are aware that this restriction is
11
somewhat strong and excludes more women from our sample than men. However, our results
do not change if we use the entire sample of workers. In fact the magnitude of the coefficient
estimates becomes even bigger. Nevertheless, as we do not want to capture a part-time effect
in our results, we present only the results for the restricted sample of full-time workers in this
paper. The remaining results are available upon request.
Table A.4 shows an overview of the observations of the restricted sample.
—Table A.4 about here—
The restriction to employees without missing information for the included variables leaves us
with 332,087 employees, of whom 109,058 are women and 223,029 are men. In total, we
observe 1277 firms with 4457 branches. Most firms in our sample have about four branches
in different cantons whereby the maximum is 25—i.e., some firms have branches in every
canton that we include into our sample.
We use the following variables in our investigation: Workers’ pay is measured as
standardized sum of gross monthly wages. This pay measure includes an employee’s
contribution to social insurance, payment in kind, regularly paid-out participation in sales and
bonuses, and compensation for shift- and night-work. In addition, thirteen months of
payments or yearly special payments are included pro rata. Although inflation in Switzerland
is not high, we adjust wages according to the National Consumer Price Index. We obtain the
workers’ education in categories and convert them in years of education according to Wirz
(2008). We have a measure for workers’ years of tenure and weekly working hours. We know
whether workers are covered by a union contract and whether workers are married. We can
observe the workers’ occupation in twenty-four categories and create five dummies for the
workers’ job position ranging from no-management position to upper management position.
Descriptive statistics appear in table A.5 for all workers and for women and men
separately. About 30% of our sample is female. Average weekly working hours are around
40. Men earn about 0.30 log points more than females. Men have also slightly more education
and their average tenure is about 3 years higher than that of women. While we find no big
difference in the weekly working hours of men and women, men are substantially more often
married and are more likely to hold a management position. This difference is most striking in
top and upper management.
—Table A.5 about here—
12
IV. Results
This section presents our results in detail. We begin by presenting our main results. In a
second step, we present a variety of specification to investigate whether regional gender-
specific productivity differences or discriminatory pay setting is more likely to explain the
relationship between social attitudes on gender equality and the firms’ pay setting. Finally, we
investigate whether social attitudes on gender equality influence how firms assign workers to
different jobs and occupations.
The effect of social attitudes on gender pay gaps:
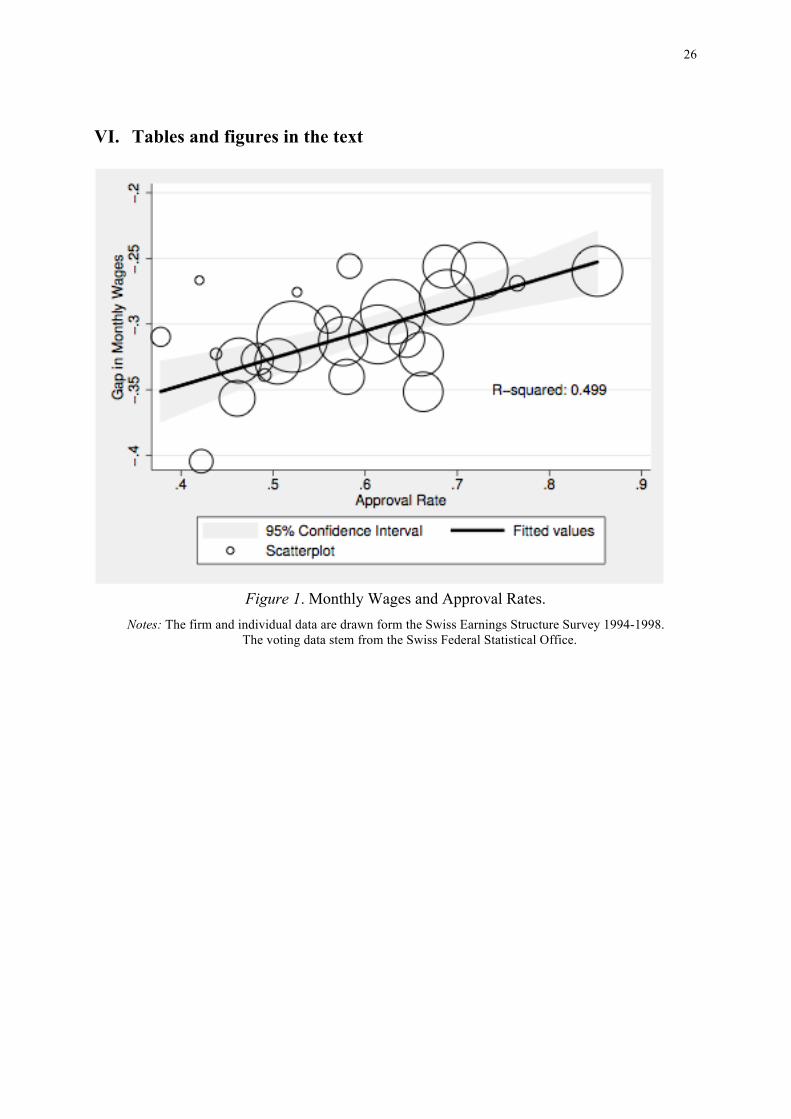
Figure 1 graphically shows a regression of regional firm-internal gender pay gaps and the
average regional approval rates in Switzerland. Specifically, the results in the figure stem
from the following two-step procedure: First, we predict gender pay-gaps for each canton
using all observations. As our interest lies in investigating the differences in gender pay gaps
within firms, we account for firm fixed effects in the first stage. Second, we regress these
predicted pay-gaps on the regional shares of voter approval rates by collapsing the data to the
25 observations on the cantonal level. To take into account that the gender pay gaps are
estimated with varying precision, we weight each of the 25 observations by the inverse of the
coefficient variance of the first-stage regression.
— Figure 1 about here —
The figure is suggestive for a tendency that the average gender pay gap is smaller in branches
located in regions where more voters approved the equality rights amendment than in regions
where fewer voters approved the equality rights amendment. More specifically, the gender
pay gap is on average about 0.10 log points smaller in branches located in regions where
about 80% approved the equal rights amendment than in branches located in regions where
only about 40% approved the equal rights amendment. The R-squared of this regression
amounts to 0.449 indicating that more than half of the variation in within-firm gender pay
gaps can be attributed to changes in voter approval rates.
However, the previous procedure does not display the within-firm effect of voter
approval rates on gender pay gaps. Therefore, in the following, we show the results of various
13
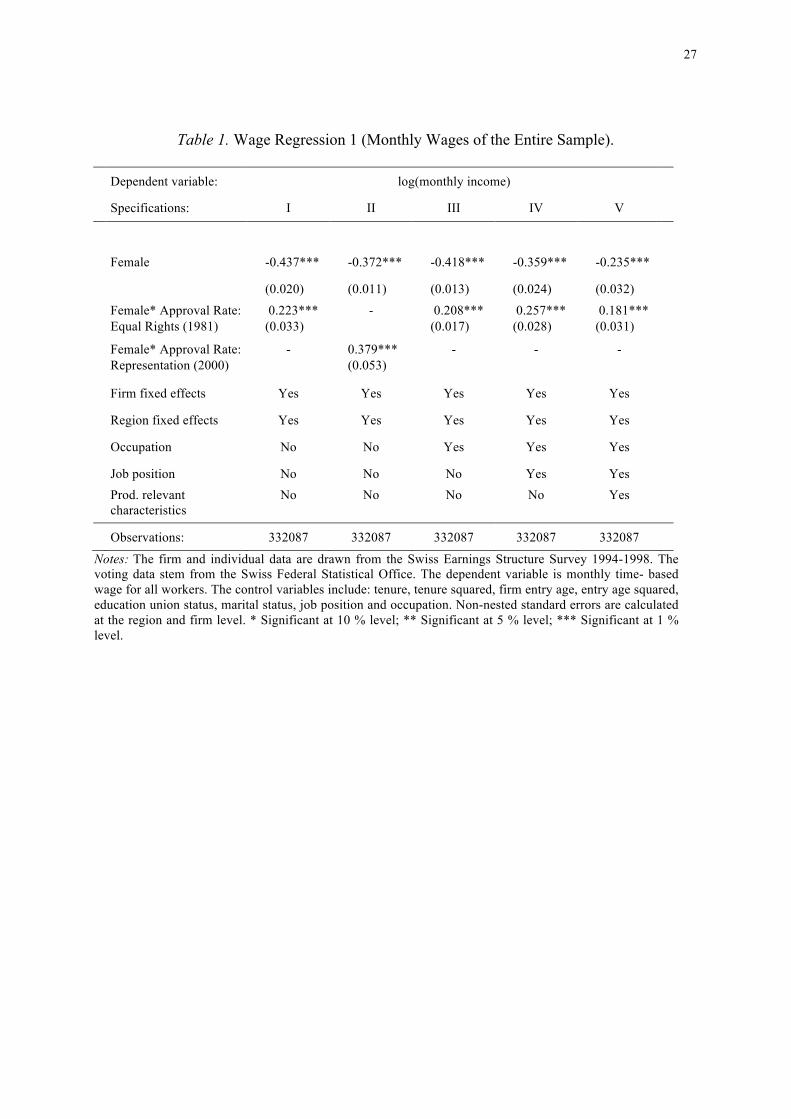
specifications of equation (1) for the entire sample of observed workers. Table I presents the
estimation results. The table shows six different specifications including different sets of
control variables.
— Table I about here —
The first column of Table I shows the results of specification I, which does not include any
control variables. The first row of column I shows a within-firm gender pay gap that amounts
to about 44 percentage points for a branch located in a hypothetical region where nobody
approved the equality rights amendment. The second row displays the effect of main interest.
The point estimate of the interaction term between voter approval rates and the indicator for
females is 0.223. This value indicates that every 10 percentage point difference in voter
approval rate is associated with a 2.2 percentage points decrease in the within-firm gender pay
gap. For example, the two cities of Lucerne and Basel-Stadt are of similar size and have a
similar urban structure. The within-firm average gender pay gap is about 32 percentage points
in a branch in Lucerne where about 50% approved the amendment. Yet the pay gap is only 28
percentage points in Basel-Stadt where about 72% approved the amendment. Thus in our
example the gender pay gap decreases by 4.8 percentage points and is therefore about 12%
smaller in Basel-Stadt than in Lucerne.
Becker’s model implicates that minority workers sort away from discriminatory
employers to non- or less-discriminatory employers. Therefore, the marginal rather than the
average employer’s prejudice should determine discriminatory pay gaps in equilibrium.
However, because women usually account for larger shares of the workforce than racial
minorities, women are more likely to work for employers with average discriminatory
prejudices. Thus in contrast to racial pay gaps, our results are in line with Charles et al.
(2009), who also find that gender pay gaps are determined by average prejudices.
Unfortunately, percentiles of our voting distributions collapse to 1’s and 0’s. As a
consequence, we cannot follow Charles et al. (2009), and investigate the relationship between
gender pay gaps and other parts of the prejudice distribution.
As mentioned in the data section, the amendment for gender-specific equality rights took
place in 1981—more than 10 years before our observation period. Therefore, in the second
specification we replace the voting data on the 1981 amendment with voting data of the 2000
amendment for a fair representation of women in federal authorities. The second column of
table I shows the results. The coefficient estimate of the interaction term between the approval
14
rates of the 2000 amendment and the gender dummy is positive and highly significant.
Specifically, a 10 percentage point increase in voter approval rates is associated with a 3.8
percentage point decrease in the firm internal gender pay gap. Conclusively, the results of the
2000 amendment confirm our results of the 1981 amendment. In the remaining three
specifications, we successively add further control variables to the regression. Specification
III of table I shows that the inclusion of occupational dummies only modestly reduces the
coefficient estimates of both variables. Therefore, occupational segregation appears not to be
the major mechanism by which social norms influence the pay-setting behavior of firms. In
specification IV of table I we examine how the inclusion of the worker’s job position
mitigates the relationship between voter approval rates and gender pay differentials. The job
position is measured in five categories ranging from no management position to high and
upper management position. After the inclusion of the dummies for the worker’s job position
the magnitude of the average isolated gender pay gap decreases to about 36%. In contrast, the
coefficient estimate of the interaction term between approval rates and the gender dummy
increases slightly and now amounts to 0.257.
In specification V, we investigate to what extent observable individual worker
characteristics mitigate the relationship between regional approval rates and firm internal pay
gaps. Specifically, we add variables for tenure and a squared term for tenure, entry-age and a
squared term for entry age, union and marital status, and years of education to specification V.
Moreover, in order to account for the gender specific effects of the workers’ entry age on
wages we interact the entry-age variable with the gender dummy.
In the first row of column V, we find substantial effects of observable worker
characteristics on the isolated gender pay gap. Specifically, the gap drops by about 0.12 log
points from 0.360 log points to about 0.235 log points. This result indicates that observable
worker characteristics mediate a substantial amount of the average gender pay gap. In
comparison to these effects, the decrease in the coefficient estimate of the interaction term
between voter approval rates and the female dummy is a little more modest. The co- efficient
estimate drops from about 0.257 log points to about 0.181 log points. Referring to our
previous example, the conditional gender pay gap under this specification is about 15% in
Lucerne and about 11% in Basel-Stadt. In other words, the conditional gender pay gap is
about 33% higher in Lucerne than in Basel-Stadt.
Even if the inclusion of worker and firm characteristics does not explain the relation- ship
between voter approval rates and the pay setting behavior of firms, our results might be
related to unobserved regional gender-specific productivity differences. Such productivity
15
differences might persist even for women and men who work in the same jobs and firms.
Ideally, we would exploit an exogenous shock to social attitudes to estimate the causal effect
of social attitudes on the firm’s pay setting behavior. But social norms and attitudes are
persistent in the long run, and external influences tend to change social norms only over
longer time periods. Therefore, we deal with this problematic by providing suggestive
evidence to investigate whether specific sources of gender-specific productivity differences
mediate our results substantially in the following.
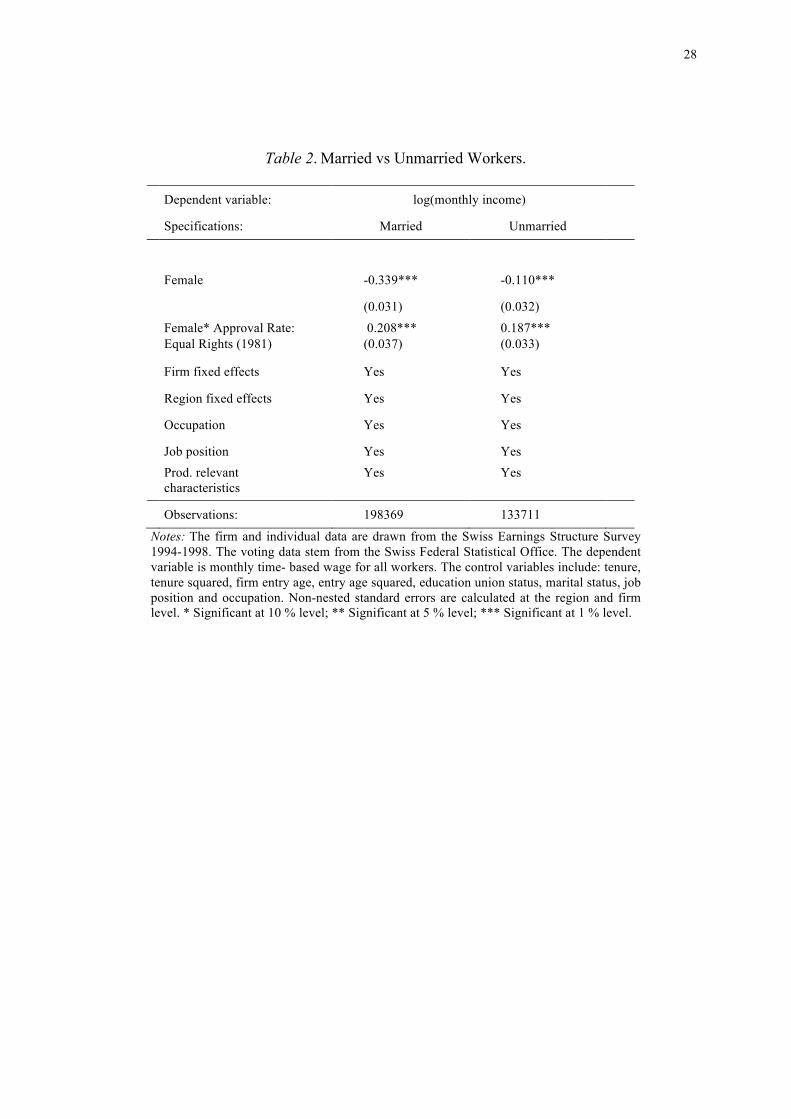
Married and unmarried workers:
Women in socially more conservative regions may undertake a larger share of the house work
than women in socially less conservative regions. The increased workload may detain women
from participating in further work place training and promotions, or simply reduce women’s
resources to engage in productive work. In a similar way, men in socially more conservative
regions may focus relatively less on household work. In particular, married workers are more
likely to have family responsibilities than unmarried workers. If social attitudes are related to
this type of regional productivity differences, social attitudes on gender equality should be
more likely to affect gender gaps of married workers. Therefore, table II shows estimation
results for married and unmarried workers separately.
— Table II about here —
The first row shows that the raw gender pay gap for married workers is three times as large as
the gender pay gap for unmarried workers. Thus married women may be on average more
focused on household work than unmarried women. However, the second row shows that the
gender penalty of working in regions where more people oppose female rights is relatively
similar for married and unmarried workers. Conclusively, gender specific productivity
differences that arise because married women in socially more conservative regions undertake
more household work are unlikely to explain the previous results.
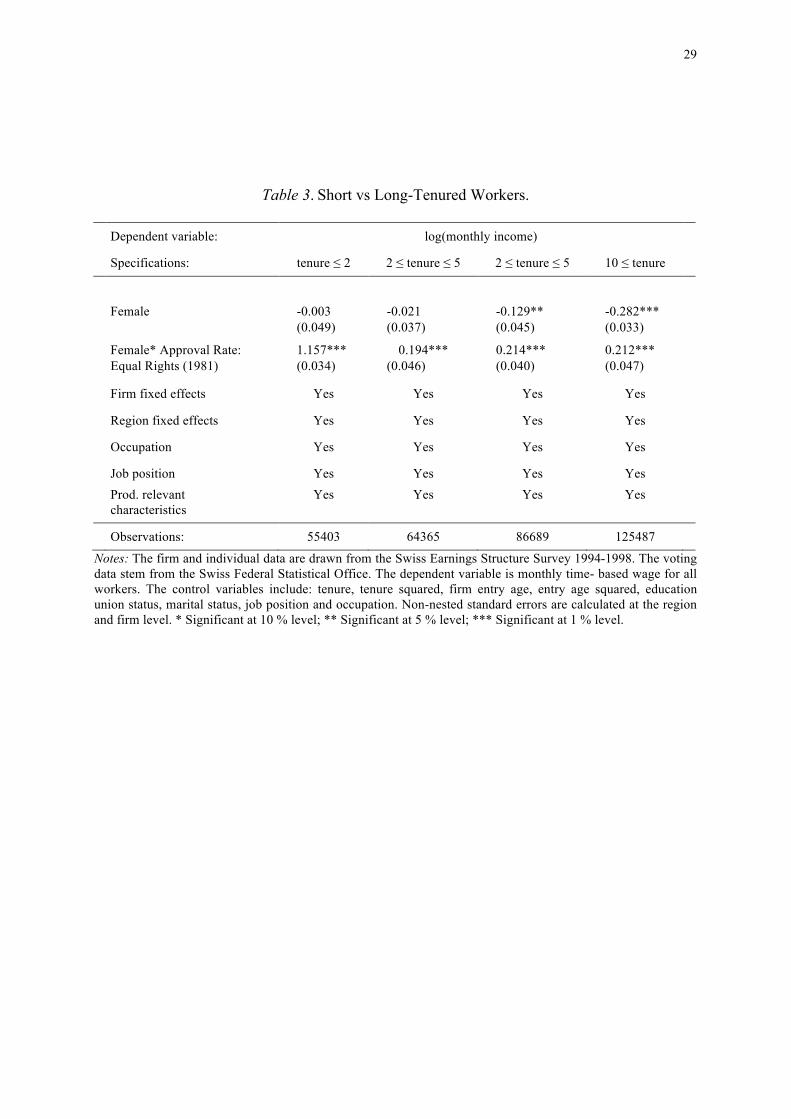
Long vs. short tenured workers:
Unobserved productivity differences are likely to increase with tenure. Women in more
conservative regions may invest less in on the job training, or employers need time to learn
16
about the workers productivity differences. Moreover, women might hit a glass ceiling at later
stages of their careers. On one hand discriminatory attitudes may detain women from higher
paying jobs at later stages of their careers. On the other hand women may have preferences
for less competitive, and maybe lower paying jobs. Therefore, table III shows results for
workers in different tenure categories.
— Table III about here —
The results show that average gender pay gaps increase substantially with the workers’ tenure.
While we do not find a raw gender pay gap for workers with less than two years of tenure, the
raw gender pay gap increases to about 20 percentage points for workers with more than 10
years of tenure. In contrast, the gender penalty for working in regions where more people
oppose female rights in the labor market only increases slightly from about 15 percentage
points to 20 percentage points. Again the results are suggestive that unobserved regional
productivity differences are not likely to explain all of our results.
Time-based vs. performance pay:
In the following, we analyze a subsample of workers whose pay consists of a performance
pay and a time-based pay component. Under the assumption that employers do not dis-
criminate, regional gender-specific productivity differences should influence the workers’
time-based and performance pay component in the same way. In other words, we should
expect to find a similar coefficient estimate for the interaction term between voter approval
rates and the gender dummy in the same workers’ time-based and performance pay
component.
Because performance pay contracts are commonly designed to provide incentives to exert
optimal effort, the performance pay components must be tied to the workers productivity
according to specific rules, such that managers are likely to face more difficulties to
discriminate under performance pay than under time-based pay. Thus finding an effect of
social attitudes on the gender pay gap under the time-based component but not under the
performance pay component contradicts the assumption of gender-specific productivity
differences. Indeed, several previous empirical studies show that wages of performance pay
workers are more closely related to their observed and unobserved productivity than wages of
workers under time-based pay (e.g., Lazear 2000; Lemieux et al. 2009).
17
However, we are aware that some researchers argue that managers may even discriminate
more under performance pay than under time based pay if the workers’ performance pay is
based on the subjective evaluation of managers. But as MacLeod (2003) shows, in contrast to
the discrimination in time-based pay, discrimination in performance pay always reduces
workers’ incentives to exert effort. Specifically, if performance evaluations are based on
workers’ relative performance, discrimination may not only reduce the incentives for minority
but also for majority workers. Therefore, MacLeod (2003) implicates that managers who set
discriminatory, and thus inefficient performance pay components, always reduce the firm’s
potential profitability (even if market friction are present). As a consequence, especially non-
prejudicial employers should not engage in discriminatory wage setting under performance
pay. Nevertheless, even if managers act against this rationality and discriminate more under
performance than under time-based pay, we should expect that social attitudes have a stronger
but not a weaker effect on the workers’ performance pay component.
We investigate these arguments with a subsample of workers for whom we are able to
observe a fixed time-based pay component that is only based on the contractual working
hours and a specific performance pay component that includes payment for premiums, bonus
payments, gratification and profit sharing. Given that for workers who are regularly paid by
commissions and piece rates, we are not able to distinguish the workers’ performance pay
from the workers’ time-based pay, we remove these workers from our sample of performance
pay workers. In total, our sample of performance pay workers amounts to 88,742 individual
workers.
Descriptive statistics of the subsample appear in table A.6
—Table A.6 about here—
30% of the restricted sample of performance pay workers is female. Thus the distribution of
women and men appears similar to that in the entire sample of workers. On average, the time-
based component of pay for performance pay workers is about 0.10 log points higher than the
gross monthly wage for the entire sample of workers. This result holds for both women and
men. The raw gender pay gap is about 0.30 log points for the performance pay and the time-
based pay component. Therefore, the gender pay gap of the restricted sample is very similar
to the gender pay gap of the entire sample.
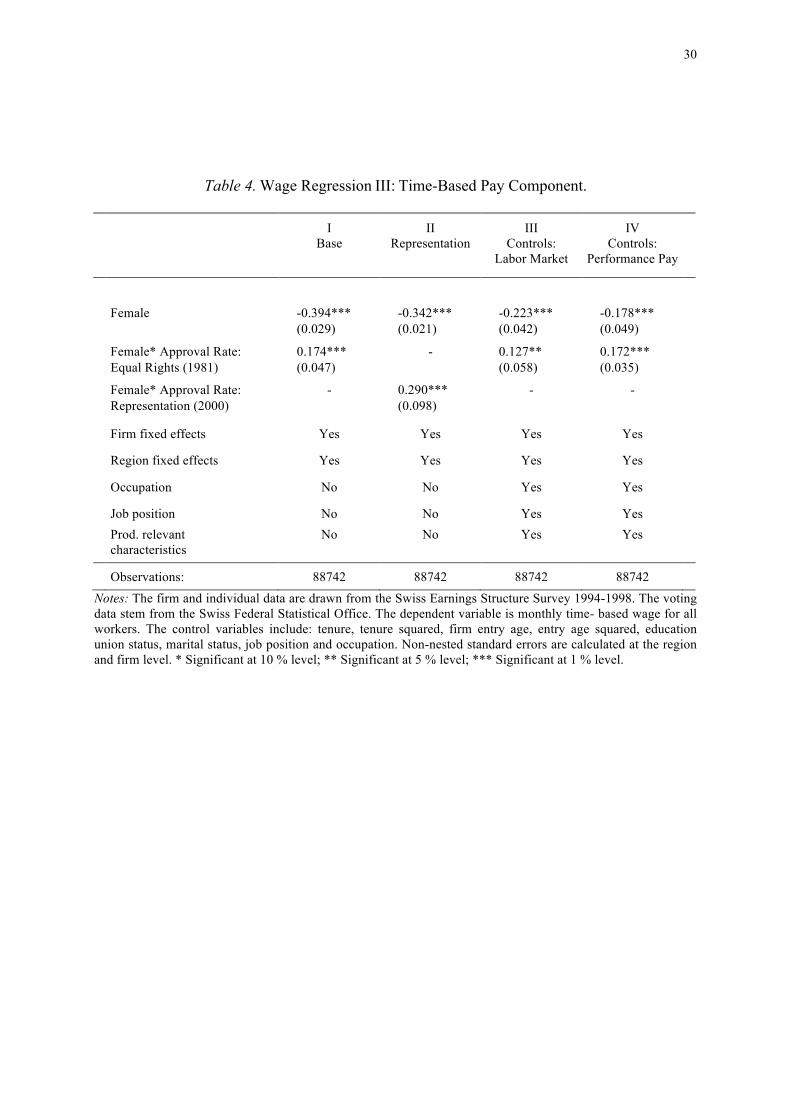
Tables IV and V present the results. Table IV shows the results for the time-based
component of pay. Table V shows the results for the performance pay component of those
18
same workers.
— Table IV about here —
— Table V about here —
In specification I of table IV, we show the results without further control variables. The
results show an isolated gender pay gap for the time-based component of pay of about 0.394
log points. This value is very similar to the estimates from the entire sample in table I.
The result of main interest—the coefficient estimate of the interaction term between the
female dummy and the voter approval rate—shows a positive significant estimate for the
time-based pay component. The effect is with 0.174 log points slightly smaller than the effect
for the entire sample in table I. One possible explanation is that women working under
performance pay are more competitive or more focused on their career, so that the gender pay
gap is somewhat smaller for performance pay workers—even in the time-based pay
component.
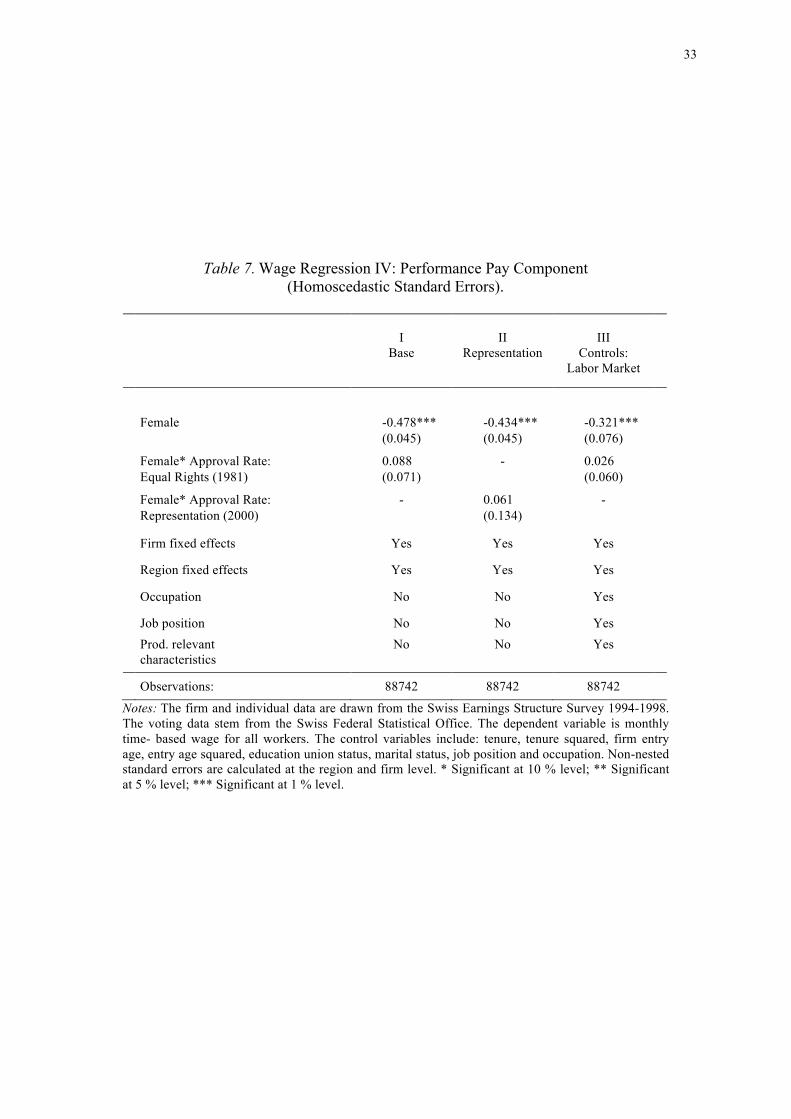
The first specification of table V shows the same results for the performance pay
component of those same workers. In contrast to the results for the time-based component, we
do not find a significant effect of the interaction term on the performance pay component.
Specifically, the effect for the performance pay component is about 0.09 log points smaller
than for the time-based pay component, and is accompanied by a huge standard error.
Therefore, results contradict the assumption that unobserved productivity differences solely
explain the within-firm variation in gender pay gaps. Note that the average gender gap is
larger in performance pay than in time-based pay. This results points out that women benefit
less from performance pay or sort away from jobs with large amounts of performance
compensation. However, this relationship is the same across regions.
In specification II of table IV and V we replace the voting data on the 1981 amendment
by the voting data of the 2000 amendment. The results of specification II are qualitatively
similar to those in specification I and thus support our argumentation.
Specification III incorporates all controls for observable job and worker characteristics,
and show a substantial reduction of the isolated gender pay gap for both the workers’
performance pay and the workers’ time-based pay component. In contrast, the coefficient
estimate of the interaction term between the female dummy and the regional approval rate
decreases only slightly for the time-based pay component, whereas the same interaction term
19
remains insignificant for the performance pay component.
Specification IV of table IV adds the log of the performance pay component to the
regression equation for the time-based component. Under the assumptions that productivity
differences are not the main explanation for the relationship between voter approval rates and
the within-firm gender pay gap and that performance pay is more closely related to the
workers’ productivity than time-based pay, the incorporation of the performance pay
component should not affect the estimate for the interaction term between approval rates and
the gender dummy. The results in specification IV show that the incorporation of performance
pay reduces the isolated gender pay gap substantially but barely affects the coefficient
estimate of the interaction term between voter approval rates and the gender dummy.
Thus far, our results contradict the assumption that regional gender-specific productivity
differences constitute the relationship between social attitudes and the variation of within-firm
gender pay gaps.
One concern with the results in table IV and V is that measurement error might be bigger
for the information about the performance pay component than for the information about the
time-based pay component. Although the data for both forms of payment are collected by the
same source (the statistical office of Switzerland), the information on the performance pay
data might be less adequate than that on the time-based pay data. For example, firms might
collect the data on the time-based pay more adequately than for performance pay. Given that a
structural relationship between this type of measurement error in the dependent variable and
the explanatory variable is not likely, this measurement error does not bias our coefficient
estimates. Nevertheless, measurement error in the dependent variable could increase the
standard errors of the coefficient estimates even if such a structural relationship does not
exist. However, even without the presence of measurement error in the dependent variables
we can expect to observe bigger standard errors under performance pay than under time-based
pay, as performance pay is more closely related to unobserved productivity differences than
time-based pay. Yet, if the results were an artifact stemming from differences in measurement
error between the performance pay and time-based pay component, the results would not
support our argumentation.
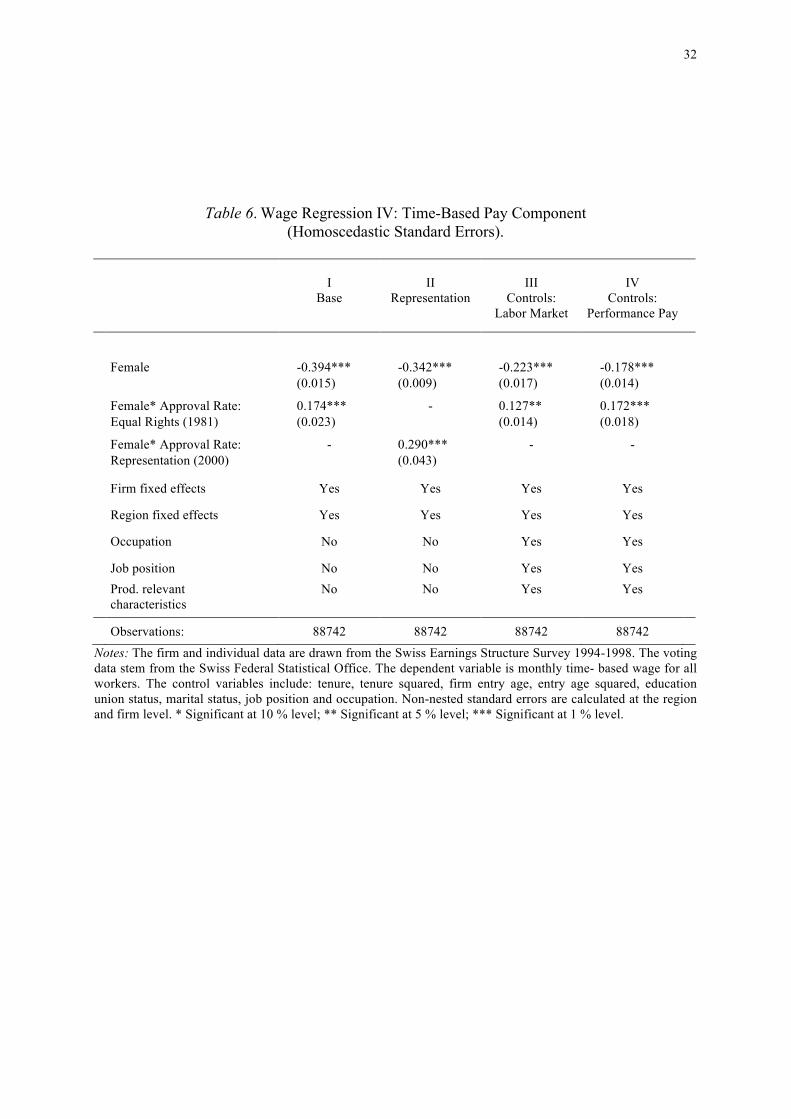
To deal with this concern, we make the following robustness check: We estimate our
regressions with homoscedastic error variances. This approach potentially underestimates
standard errors if the assumption of homoscedasticity is violated. Nevertheless, given that our
argumentation rests upon the insignificance of a coefficient estimate, such an approach is
more conservative for our specific objective.
20
Table VI and VII presents the results of this approach. As the tables show, the
homoscedastic standard errors are substantially smaller than the clustered standard errors. In
most cases standard errors are reduced by more than a half. Nevertheless, these results are still
in line with our argumentation. Specifically, even with these potentially underestimated
standard errors, the interaction term between voter approval rates and the female dummy is
not significantly different from zero for the regressions on performance pay.
— Table VI about here —
— Table VII about here —
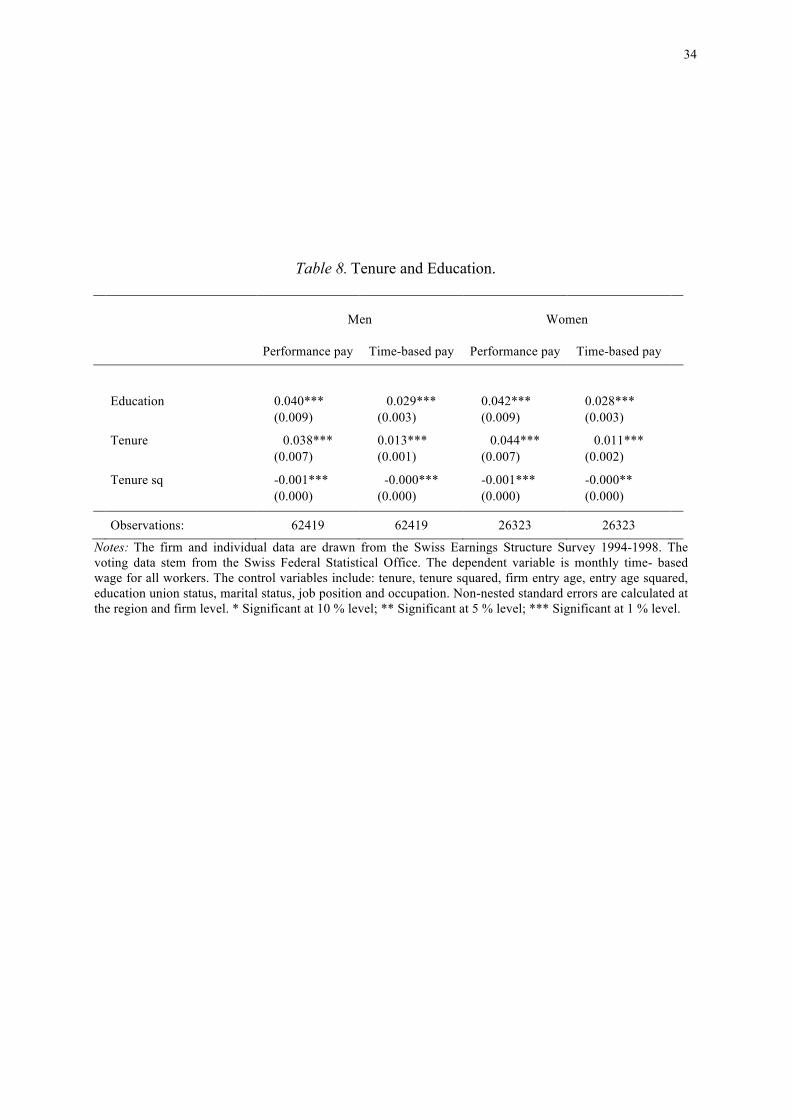
Another potential concern is that performance pay is not at all related to the workers
productivity. For example, firms might pay the lions share of bonuses to all workers in each
firm and do not pay more productive workers more than less productive workers. As a result,
we expect not to find significant correlations between our performance pay measure and other
productivity relevant variables. Therefore, we separately estimate the rates of return to tenure
and education for the time-based and the performance pay component. The results appear in
table VIII. We perform separate regressions for women and men, and the regressions contain
all control variables and firm fixed-effects.
— Table VIII about here —
Table VIII shows that all coefficient estimates have the expected signs and are highly
significant for the time-based and the performance pay component. The estimated coefficients
are even higher for the performance pay component. Moreover, the specifications show very
similar rates of return for women and men—both under the time-based and the performance
pay component. Consequently, these results support the view that performance pay is related
to the workers’ productivity.
The effect of social attitudes on job and firm segregation:
Social attitudes are likely to influence individual preferences for human capital investments,
job choices, and consequently influence how firms hire and assign workers to jobs across
different regions (Akerlof and Kranton 2000). For example, if firms operate under socially
21
conservative norms, fewer women might apply for stereotype male jobs. Moreover, social
expectations might detain women from investing in human capital to obtain the relevant skills
for high-paying jobs. Finally, discrimination and social preferences might lead women to stay
at home. Indeed, a variety of studies support such a relationship by showing that social
attitudes on gender equality affect women’s labor supply and fertility (Fernandez et al. 2004;
Fortin 2005; Charles et al. 2009; Fernandez 2011).
However, it is unclear whether social attitudes influence whether women and men
segregate into entirely different companies, or whether social attitudes do also influence the
way in which firms hire and assign women to different jobs within the same company. Table
IX investigates the relationship between social attitudes on gender-equality and the
segregation of individuals between firms. The first specification presents an OLS regression
of voter approval rates on the share of women per branch. Because all observations are
grouped on the firm and regional level, estimated standard errors account for non-nested
clustering.
— Table IX about here —
The first specification of table IX shows a positive significant coefficient estimate indicating
that the average share of women per branch increases in voter approval rates. Specifically, a
10 percentage point increase in voter approval rates is associated with a 1.8 percentage point
increase in the share of women per branch. This is a quite substantial effect given that the
average share of women per branch is about 32 percent. The result is in line with Becker’s
model and other previous studies, which show that social attitudes influence women’s labor
force participation.
However, if we account for firm-fixed effects in the second specification, the point
estimate decreases substantially and becomes insignificant. Thus the results suggest that
regional social attitudes on gender equality influence how women and men sort between but
not within firms. In other words, woman and men seem to segregate in different firms but
firms do not to employ different shares of women and men in different regions.
The third and fourth column present similar OLS regressions of voter approval rates on the
Duncan index on the branch level. The Duncan index is a common measure for occupational
segregation, and can be interpreted as the percentage of women who would have to change
occupations to achieve an occupational distribution similar to men. On average about 40
percent of women within the average branch had to change occupation to achieve a
22
distribution similar to men. Column three shows a negative coefficient estimate of voter
approval rates indicating that branches are more segregated in socially more conservative
regions. Albeit the point estimate is not particularly small, the effect is not significant. If we
account for firm fixed-effects the point estimate decreases substantially. In summary, the
results suggest that regional social attitudes on gender equality influence how women and
men sort between but not within firms.
Table X investigates the relationship between social attitudes on gender-equality and the
assignment of women and men to different jobs within firms. The first column presents a
linear regression of years of education on an interaction between a female dummy and voter
approval rates. The regression contains firm and canton fixed-effects and standard errors
account for non-nested clustering. The results show a gender gap in years of schooling of
about 1.4 years but we do not find a relationship between voter approval rates and the gap in
years of schooling.
The second column presents a linear probability model in which we regress a dummy
variable indicating whether an individual holds a management position on the same inter-
action terms. The estimates show that women are on average about 18 percentage points less
likely to hold a management position than men. Again this relationship seems to be the same
across branches of the same firm.
In the third column, we replace the dependent variable by a measure for the average log
pay within each occupation. This regression allows us to infer whether women and men select
into jobs with different pay levels. The table shows that the average pay of women’s
occupations is about 8 percentage points lower than the average pay of men’s occupations.
However, we do not find a strong relationship between voter approval rates and gender-
specific differences in the average occupational pay within firms.
The fourth column shows the relationship between voter approval rates and the gender-
specific probability to receive performance pay. For this specification we do not find any
significant outcomes indicating that the probability to receive performance pay does not differ
between women and men within firms.
— Table X about here —
In summary, the results are not suggestive for a strong relationship of voter approval rates
and the assignment of women and men to different jobs within firms.
23
V. Conclusion
We combine information on regional variation in social attitudes on gender equality with a
large data set of multi-branch firms and workers to analyze the relationship between social
attitudes on gender equality and firms’ discriminatory pay-setting behavior. We find that
within-firm gender pay gaps are larger in regions where fewer people challenge traditional
gender roles. The results remain robust if we account for detailed worker and job
characteristics, and we cannot find evidence that social attitudes on gender-equality influence
how firms assign women and men to different jobs and occupations across regions.
Moreover, we find that the relationship between social attitudes on gender equality and
gender pay gaps manifests only in the time-based component but not in the performance pay
component of the same workers. Because several previous empirical studies argue and show
that performance pay is more closely related to workers’ productivity than time based pay
(e.g., Lazear 2000; Lemieux et al. 2009), we argue that regional productivity differences are
not likely to explain the relationship between social attitudes on gender equality and the
firms’ regional pay-setting behavior.
If prejudicial and non-prejudicial firms adjust their pay-setting to their discriminatory
environment, gender pay gaps are likely to be big and persistent in the long run. Conclusively,
our results support theoretical and empirical papers explaining discriminatory pay-setting with
the existence of social attitudes and prejudices against minority workers, and shed light on
why gender pay gaps persist in the long run.
References
Akerlof, George A., Kranton, Rachel E. 2000. Economics and identity. The Quarterly Journal
of Economics, 115(3): 715–753.
Altonji, Joseph G., Blank, Rebecca M. 1999. Race and gender in the labor market. Handbook
of Labor Economics, 3(3): 3143–3259.
Arrow, Kenneth. 1972. Racial Discrimination in Economic Life. Lexington Books, Ch. Some
Mathematical Models of Race in the Labor Market.
Becker, Gary S. 1971. The economics of discrimination. Chicago, IL: University of Chicago
Press.
Bhaskar, Venkataraman, Manning, Alan, To, Ted. 2002. Oligopsony and monopsonistic
competition in labor markets. The Journal of Economic Perspectives, 16(2): 15–174.
24
Black, Dan A. 1995. Discrimination in an equilibrium search model. Journal of Labor Eco-
nomics, 13(2): 309–333.
Blau, Francine D., Kahn, Laurence M. 2000. Gender differences in pay. The Journal of
Economic Perspectives, 14(4): 75–99.
Blau, Francine D., Kahn, Laurence M. 2006. The U.S. gender pay gap in the 1990s: slowing
convergence. Industrial and Labor Relations Review, 60(1): 45–66.
Boal, William M., Ransom, Michael. 1997. Monopsony in the labor market. Journal of
Economic Literature, 35(1): 86–112.
Cameron, A. Colin, Miller, Douglas L. 2010. Robust inference with clustered data. Working
Papers No 107. University of California, Davis, Department of Economics.
Charles, Kerwin K., Guryan, Jonathan. 2008. Prejudice and wages: An empirical assessment
of Becker’s the economics of discrimination. Journal of Political Economy, 116(5): 773–809.
Charles, Kerwin K., Guryan, Jonathan, Pan, Jessica. 2009. Sexism and women’s labor market
outcomes. Unpublished Working Paper.
Fernandez, Raquel. 2011. Does Culture Matter? Handbook of Social Economics, 1A: 481–
510.
Fernandez, Raquel, Fogli, Alessandra, Olivetti, Claudia. 2004. Mothers and sons: Preference
formation and female labor force dynamics. Quarterly Journal of Economics, 119: 1249–
1299.
Fortin, Nicole M. 2005. Gender role attitudes and the labour-market outcomes of women
across OECD countries. Oxford Review of Economic Policy, 21(3): 416–438.
Hirsch, Boris. 2009. The gender pay gap under duopsony: Joan Robinson meets Harold
Hotelling. Scottish Journal of Political Economy, 56(5): 543–558.
Lalive, R., Stutzer, A. 2010. Approval of equal rights and gender differences in well-being.
Journal of Population Economics, 23(3): 933–962.
Lang, Kevin, Lehmann, Jee-Yeon K. 2012. Racial discrimination in the labor market: Theory
and empirics. Journal of Economic Literature, 50(4): 959–1006.
Lang, Kevin, Manove, Michael, Dickens, William T. 2005. Racial discrimination in labor
markets with posted wage offers. The American Economic Review, 95(4): 1327–1340.
Lazear, Edward P. 2000. Performance pay and productivity. The American Economic Review,
90(5): 1346–1361.
Lemieux, Thomas, Macleod, W. Bentley, Parent, Daniel. 2009. Performance pay and wage
inequality. Quarterly Journal of Economics, 124(1): 1–49.
MacLeod, W. Bentley. 2003. Optimal contracting with subjective evaluation. The American
25
Economic Review, 93(1): 216–240.
Manning, Alan. 2008. Monopsony in motion. Oxford, UK: Princeton University Press.
Robinson, Joan. 1969. The economics of imperfect competition. Macmillan St Martin’s Press.
Rose ́n, Åsa. 1997. An equilibrium search-matching model of discrimination. European Eco-
nomic Review, 41(8): 1589–1613.
Rose ́n, Åsa. 2003. Search, bargaining and employer discrimination. Journal of Labor Eco-
nomics, 21(4): 807–829.
Sasaki, Masaru. 1999. An equilibrium search model with coworker discrimination. Journal of
Labor Economics, 17(2): 377–407.
Wirz, Aniela. 2008. Private returns to education versus education spill-over effects. Empirical
Economics, 34: 315–342.
26
VI. Tables and figures in the text
Figure 1. Monthly Wages and Approval Rates. Notes: The firm and individual data are drawn form the Swiss Earnings Structure Survey 1994-1998.
The voting data stem from the Swiss Federal Statistical Office.
27
Table 1. Wage Regression 1 (Monthly Wages of the Entire Sample).
Dependent variable: log(monthly income)
Specifications: I II III IV V
Female -0.437*** -0.372*** -0.418*** -0.359*** -0.235***
(0.020) (0.011) (0.013) (0.024) (0.032) Female* Approval Rate: 0.223*** - 0.208*** 0.257*** 0.181*** Equal Rights (1981) (0.033) (0.017) (0.028) (0.031) Female* Approval Rate: - 0.379*** - - - Representation (2000) (0.053) Firm fixed effects Yes Yes Yes Yes Yes
Region fixed effects Yes Yes Yes Yes Yes
Occupation No No Yes Yes Yes
Job position No No No Yes Yes
Prod. relevant characteristics
No No No No Yes
Observations: 332087 332087 332087 332087 332087
Notes: The firm and individual data are drawn from the Swiss Earnings Structure Survey 1994-1998. The voting data stem from the Swiss Federal Statistical Office. The dependent variable is monthly time- based wage for all workers. The control variables include: tenure, tenure squared, firm entry age, entry age squared, education union status, marital status, job position and occupation. Non-nested standard errors are calculated at the region and firm level. * Significant at 10 % level; ** Significant at 5 % level; *** Significant at 1 % level.
28
Table 2. Married vs Unmarried Workers.
Dependent variable: log(monthly income)
Specifications: Married Unmarried
Female -0.339*** -0.110***
(0.031) (0.032) Female* Approval Rate: 0.208*** 0.187*** Equal Rights (1981) (0.037) (0.033) Firm fixed effects Yes Yes
Region fixed effects Yes Yes
Occupation Yes Yes
Job position Yes Yes
Prod. relevant characteristics
Yes Yes
Observations: 198369 133711
Notes: The firm and individual data are drawn from the Swiss Earnings Structure Survey 1994-1998. The voting data stem from the Swiss Federal Statistical Office. The dependent variable is monthly time- based wage for all workers. The control variables include: tenure, tenure squared, firm entry age, entry age squared, education union status, marital status, job position and occupation. Non-nested standard errors are calculated at the region and firm level. * Significant at 10 % level; ** Significant at 5 % level; *** Significant at 1 % level.
29
Table 3. Short vs Long-Tenured Workers.
Dependent variable: log(monthly income)
Specifications: tenure ≤ 2 2 ≤ tenure ≤ 5 2 ≤ tenure ≤ 5 10 ≤ tenure
Female -0.003 -0.021 -0.129** -0.282*** (0.049) (0.037) (0.045) (0.033) Female* Approval Rate: 1.157*** 0.194*** 0.214*** 0.212*** Equal Rights (1981) (0.034) (0.046) (0.040) (0.047) Firm fixed effects Yes Yes Yes Yes
Region fixed effects Yes Yes Yes Yes
Occupation Yes Yes Yes Yes
Job position Yes Yes Yes Yes
Prod. relevant characteristics
Yes Yes Yes Yes
Observations: 55403 64365 86689 125487
Notes: The firm and individual data are drawn from the Swiss Earnings Structure Survey 1994-1998. The voting data stem from the Swiss Federal Statistical Office. The dependent variable is monthly time- based wage for all workers. The control variables include: tenure, tenure squared, firm entry age, entry age squared, education union status, marital status, job position and occupation. Non-nested standard errors are calculated at the region and firm level. * Significant at 10 % level; ** Significant at 5 % level; *** Significant at 1 % level.
30
Table 4. Wage Regression III: Time-Based Pay Component.
I Base
II Representation
III Controls:
Labor Market
IV Controls:
Performance Pay
Female -0.394*** -0.342*** -0.223*** -0.178*** (0.029) (0.021) (0.042) (0.049) Female* Approval Rate: 0.174*** - 0.127** 0.172*** Equal Rights (1981) (0.047) (0.058) (0.035) Female* Approval Rate: - 0.290*** - - Representation (2000) (0.098) Firm fixed effects Yes Yes Yes Yes
Region fixed effects Yes Yes Yes Yes
Occupation No No Yes Yes
Job position No No Yes Yes
Prod. relevant characteristics
No No Yes Yes
Observations: 88742 88742 88742 88742 Notes: The firm and individual data are drawn from the Swiss Earnings Structure Survey 1994-1998. The voting data stem from the Swiss Federal Statistical Office. The dependent variable is monthly time- based wage for all workers. The control variables include: tenure, tenure squared, firm entry age, entry age squared, education union status, marital status, job position and occupation. Non-nested standard errors are calculated at the region and firm level. * Significant at 10 % level; ** Significant at 5 % level; *** Significant at 1 % level.

31
Table 5. Wage Regression III: Performance Pay Component.
I Base
II Representation
III Controls:
Labor Market
Female -0.478*** -0.434*** -0.321* (0.159) (0.096) (0.173) Female* Approval Rate: 0.088 - 0.127** Equal Rights (1981) (0.238) (0.058) Female* Approval Rate: - 0.061 - Representation (2000) (0.397) Firm fixed effects Yes Yes Yes
Region fixed effects Yes Yes Yes
Occupation No No Yes
Job position No No Yes
Prod. relevant characteristics
No No Yes
Observations: 88742 88742 88742 Notes: The firm and individual data are drawn from the Swiss Earnings Structure Survey 1994-1998.
The voting data stem from the Swiss Federal Statistical Office. The dependent variable is monthly time- based wage for all workers. The control variables include: tenure, tenure squared, firm entry age, entry age squared, education union status, marital status, job position and occupation. Non-nested standard errors are calculated at the region and firm level. * Significant at 10 % level; ** Significant at 5 % level; *** Significant at 1 % level.
32
Table 6. Wage Regression IV: Time-Based Pay Component (Homoscedastic Standard Errors).
I
Base II
Representation III
Controls: Labor Market
IV Controls:
Performance Pay
Female -0.394*** -0.342*** -0.223*** -0.178*** (0.015) (0.009) (0.017) (0.014) Female* Approval Rate: 0.174*** - 0.127** 0.172*** Equal Rights (1981) (0.023) (0.014) (0.018) Female* Approval Rate: - 0.290*** - - Representation (2000) (0.043) Firm fixed effects Yes Yes Yes Yes
Region fixed effects Yes Yes Yes Yes
Occupation No No Yes Yes
Job position No No Yes Yes
Prod. relevant characteristics
No No Yes Yes
Observations: 88742 88742 88742 88742 Notes: The firm and individual data are drawn from the Swiss Earnings Structure Survey 1994-1998. The voting data stem from the Swiss Federal Statistical Office. The dependent variable is monthly time- based wage for all workers. The control variables include: tenure, tenure squared, firm entry age, entry age squared, education union status, marital status, job position and occupation. Non-nested standard errors are calculated at the region and firm level. * Significant at 10 % level; ** Significant at 5 % level; *** Significant at 1 % level.
33
Table 7. Wage Regression IV: Performance Pay Component (Homoscedastic Standard Errors).
I
Base II
Representation III
Controls: Labor Market
Female -0.478*** -0.434*** -0.321*** (0.045) (0.045) (0.076) Female* Approval Rate: 0.088 - 0.026 Equal Rights (1981) (0.071) (0.060) Female* Approval Rate: - 0.061 - Representation (2000) (0.134) Firm fixed effects Yes Yes Yes
Region fixed effects Yes Yes Yes
Occupation No No Yes
Job position No No Yes
Prod. relevant characteristics
No No Yes
Observations: 88742 88742 88742
Notes: The firm and individual data are drawn from the Swiss Earnings Structure Survey 1994-1998. The voting data stem from the Swiss Federal Statistical Office. The dependent variable is monthly time- based wage for all workers. The control variables include: tenure, tenure squared, firm entry age, entry age squared, education union status, marital status, job position and occupation. Non-nested standard errors are calculated at the region and firm level. * Significant at 10 % level; ** Significant at 5 % level; *** Significant at 1 % level.
34
Table 8. Tenure and Education.
Men Women
Performance pay Time-based pay Performance pay Time-based pay
Education 0.040*** 0.029*** 0.042*** 0.028*** (0.009) (0.003) (0.009) (0.003) Tenure 0.038*** 0.013*** 0.044*** 0.011*** (0.007) (0.001) (0.007) (0.002) Tenure sq -0.001*** -0.000*** -0.001*** -0.000** (0.000) (0.000) (0.000) (0.000) Observations: 62419 62419 26323 26323
Notes: The firm and individual data are drawn from the Swiss Earnings Structure Survey 1994-1998. The voting data stem from the Swiss Federal Statistical Office. The dependent variable is monthly time- based wage for all workers. The control variables include: tenure, tenure squared, firm entry age, entry age squared, education union status, marital status, job position and occupation. Non-nested standard errors are calculated at the region and firm level. * Significant at 10 % level; ** Significant at 5 % level; *** Significant at 1 % level.

35
Table 9. Social Attitudes and Gender-Specific Firm Segregation.
Share Female: Duncan index: I II I II
Average 0.328 0.422 (0.172) (0.224)
Approval Rate: 0.184** -0.018 -0.091 -0.16 Equal Rights (1981) (0.077) (0.074) (0.087) (0.050) Firm fixed effects No Yes No Yes
Region fixed effects No Yes No Yes
332087 332087 332087 332087
Notes: The firm and individual data are drawn from the Swiss Earnings Structure Survey 1994-1998. The voting data stem from the Swiss Federal Statistical Office. Non-nested standard errors are calculated at the region and firm level. * Significant at 10 % level; ** Significant at 5 % level; *** Significant at 1 % level.
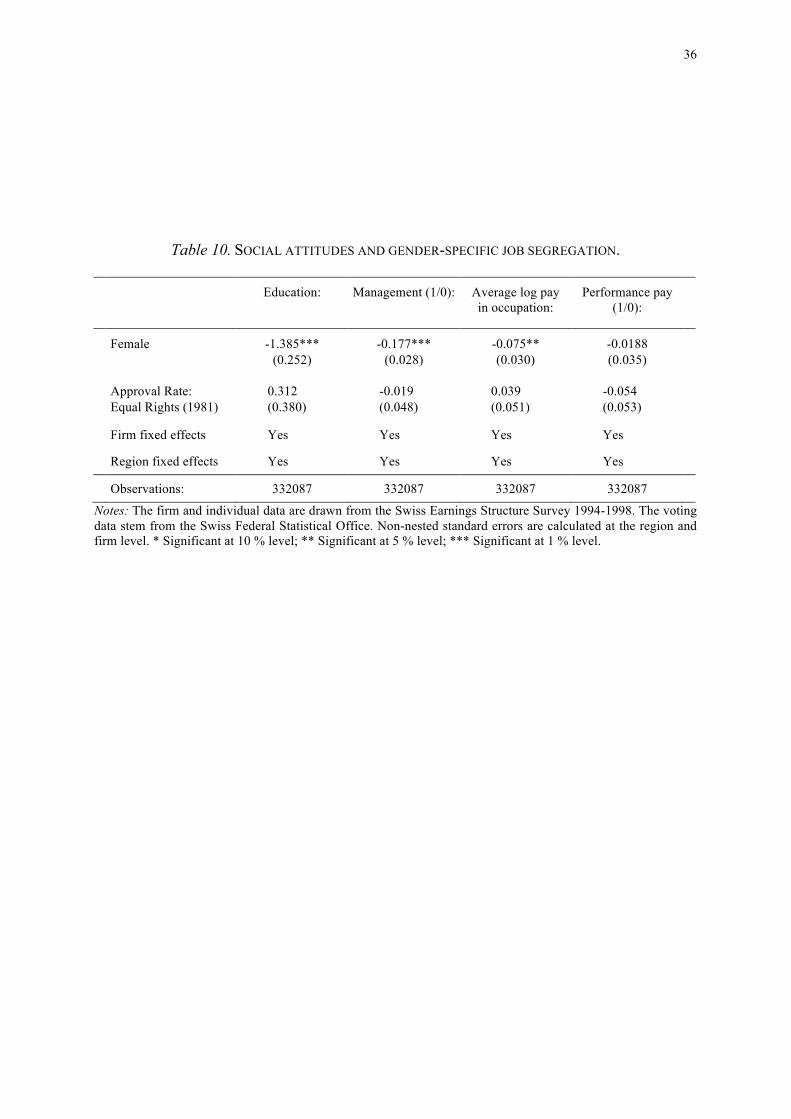
36
Table 10. SOCIAL ATTITUDES AND GENDER-SPECIFIC JOB SEGREGATION.
Education: Management (1/0): Average log pay in occupation:
Performance pay (1/0):
Female -1.385*** -0.177*** -0.075** -0.0188 (0.252) (0.028) (0.030) (0.035) Approval Rate: 0.312 -0.019 0.039 -0.054 Equal Rights (1981) (0.380) (0.048) (0.051) (0.053) Firm fixed effects Yes Yes Yes Yes
Region fixed effects Yes Yes Yes Yes
Observations: 332087 332087 332087 332087
Notes: The firm and individual data are drawn from the Swiss Earnings Structure Survey 1994-1998. The voting data stem from the Swiss Federal Statistical Office. Non-nested standard errors are calculated at the region and firm level. * Significant at 10 % level; ** Significant at 5 % level; *** Significant at 1 % level.
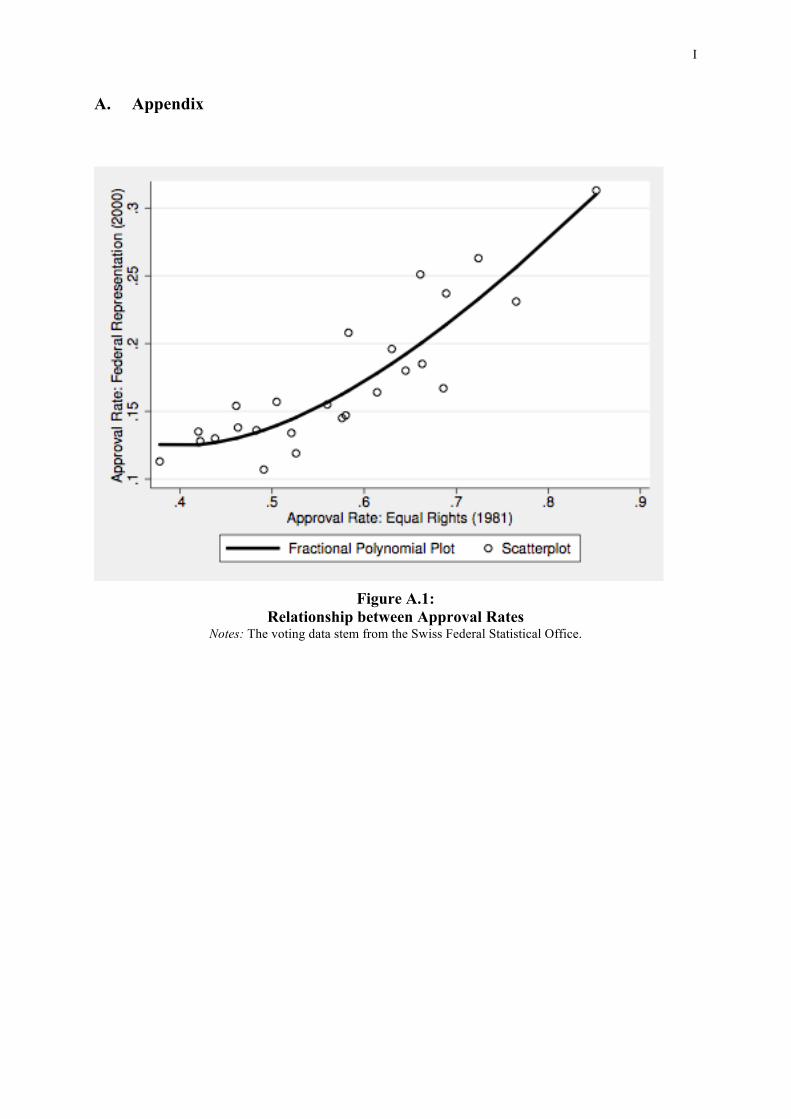
I
A. Appendix
Figure A.1: Relationship between Approval Rates
Notes: The voting data stem from the Swiss Federal Statistical Office.
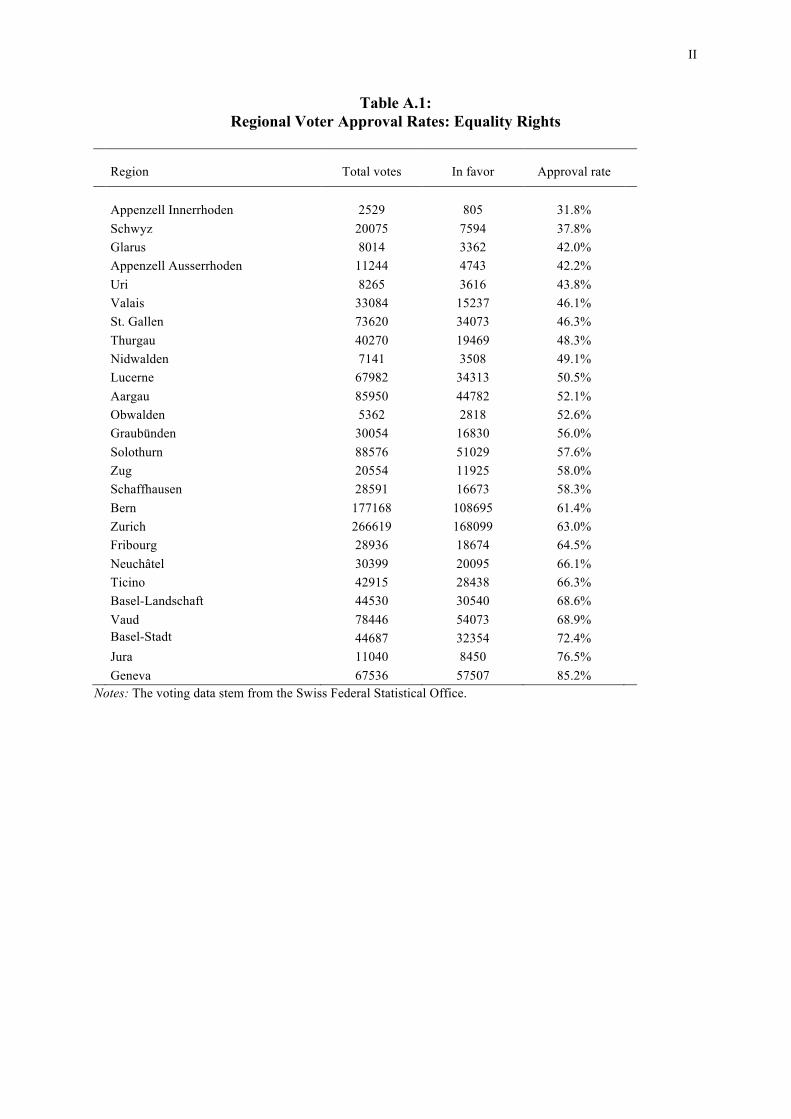
II
Table A.1: Regional Voter Approval Rates: Equality Rights
Region Total votes In favor Approval rate
Appenzell Innerrhoden 2529 805 31.8% Schwyz 20075 7594 37.8% Glarus 8014 3362 42.0% Appenzell Ausserrhoden 11244 4743 42.2% Uri 8265 3616 43.8% Valais 33084 15237 46.1% St. Gallen 73620 34073 46.3% Thurgau 40270 19469 48.3% Nidwalden 7141 3508 49.1% Lucerne 67982 34313 50.5% Aargau 85950 44782 52.1% Obwalden 5362 2818 52.6% Graubünden 30054 16830 56.0% Solothurn 88576 51029 57.6% Zug 20554 11925 58.0% Schaffhausen 28591 16673 58.3% Bern 177168 108695 61.4% Zurich 266619 168099 63.0% Fribourg 28936 18674 64.5% Neuchâtel 30399 20095 66.1% Ticino 42915 28438 66.3% Basel-Landschaft 44530 30540 68.6% Vaud 78446 54073 68.9%
Basel-Stadt 44687 32354 72.4% Jura 11040 8450 76.5% Geneva 67536 57507 85.2%
Notes: The voting data stem from the Swiss Federal Statistical Office.
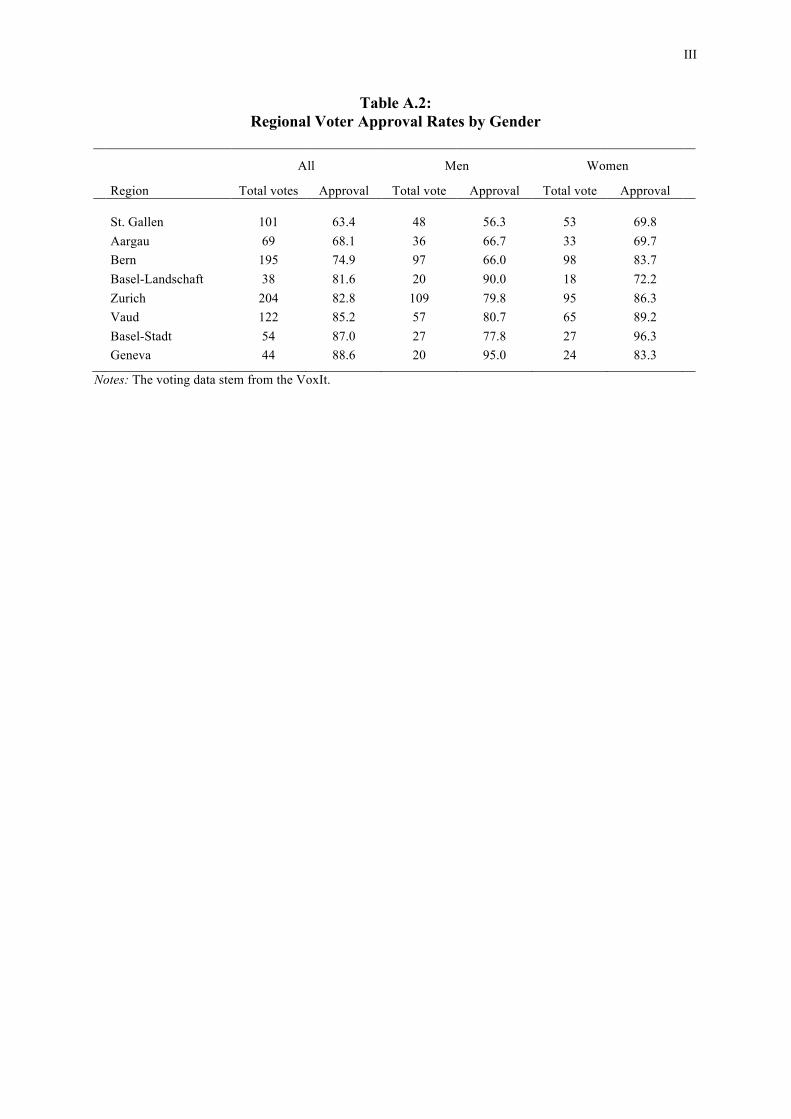
III
Table A.2: Regional Voter Approval Rates by Gender
All Men Women Region Total votes Approval Total vote Approval Total vote Approval
St. Gallen 101 63.4 48 56.3 53 69.8 Aargau 69 68.1 36 66.7 33 69.7 Bern 195 74.9 97 66.0 98 83.7 Basel-Landschaft 38 81.6 20 90.0 18 72.2 Zurich 204 82.8 109 79.8 95 86.3 Vaud 122 85.2 57 80.7 65 89.2 Basel-Stadt 54 87.0 27 77.8 27 96.3 Geneva 44 88.6 20 95.0 24 83.3
Notes: The voting data stem from the VoxIt.
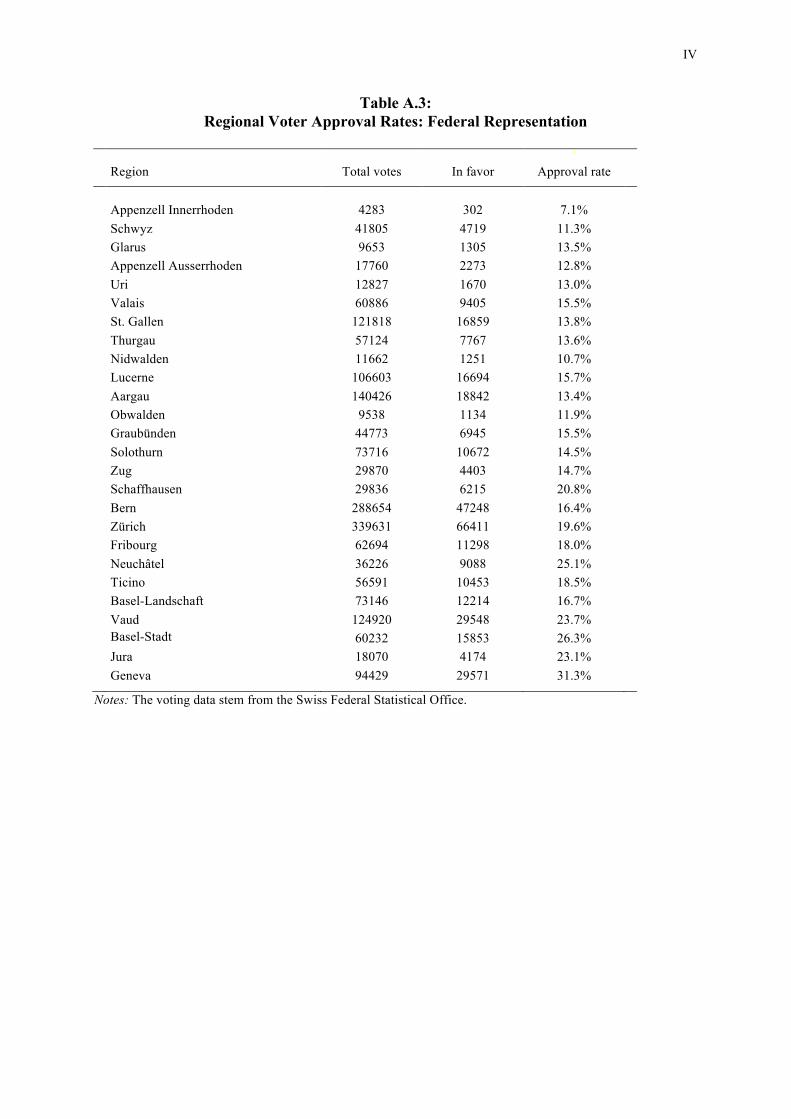
IV
Table A.3: Regional Voter Approval Rates: Federal Representation
Region Total votes In favor Approval rate
Appenzell Innerrhoden 4283 302 7.1% Schwyz 41805 4719 11.3% Glarus 9653 1305 13.5% Appenzell Ausserrhoden 17760 2273 12.8% Uri 12827 1670 13.0% Valais 60886 9405 15.5% St. Gallen 121818 16859 13.8% Thurgau 57124 7767 13.6% Nidwalden 11662 1251 10.7% Lucerne 106603 16694 15.7% Aargau 140426 18842 13.4% Obwalden 9538 1134 11.9% Graubünden 44773 6945 15.5% Solothurn 73716 10672 14.5% Zug 29870 4403 14.7% Schaffhausen 29836 6215 20.8% Bern 288654 47248 16.4% Zürich 339631 66411 19.6% Fribourg 62694 11298 18.0% Neuchâtel 36226 9088 25.1% Ticino 56591 10453 18.5% Basel-Landschaft 73146 12214 16.7% Vaud 124920 29548 23.7%
Basel-Stadt 60232 15853 26.3% Jura 18070 4174 23.1% Geneva 94429 29571 31.3%
Notes: The voting data stem from the Swiss Federal Statistical Office.
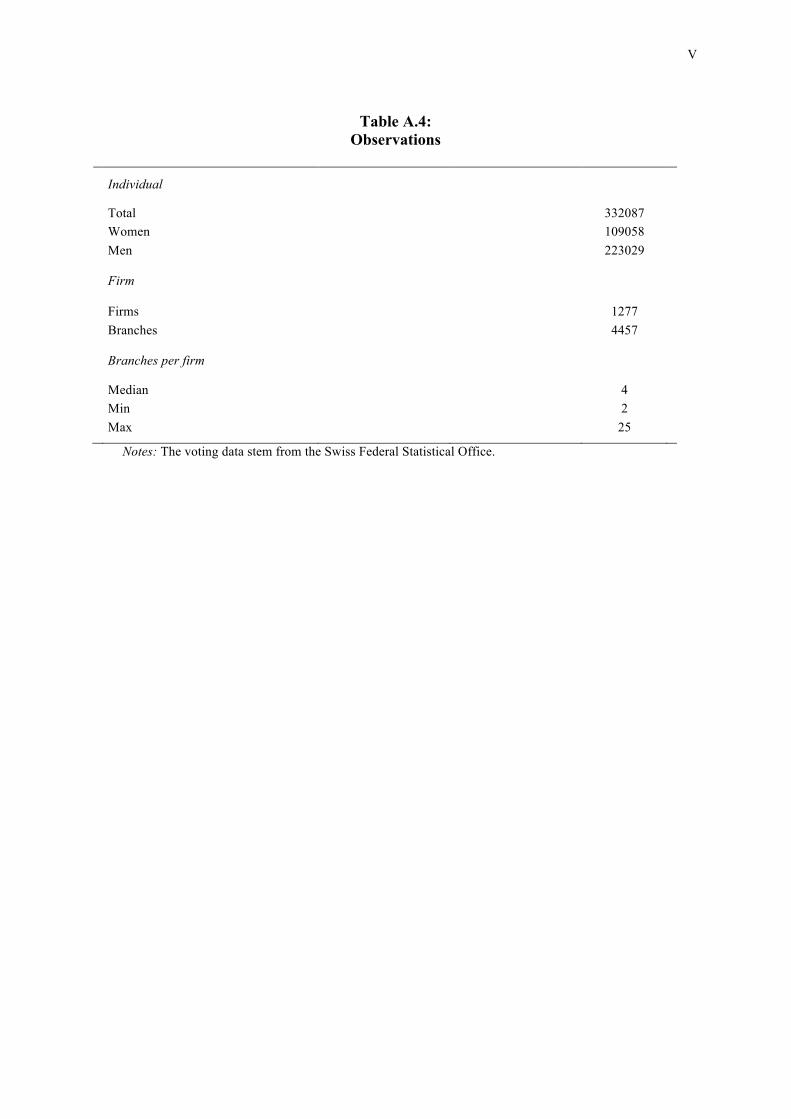
V
Table A.4:
Observations
Individual
Total 332087 Women 109058 Men 223029
Firm
Firms 1277 Branches 4457
Branches per firm
Median 4 Min 2 Max 25
Notes: The voting data stem from the Swiss Federal Statistical Office.
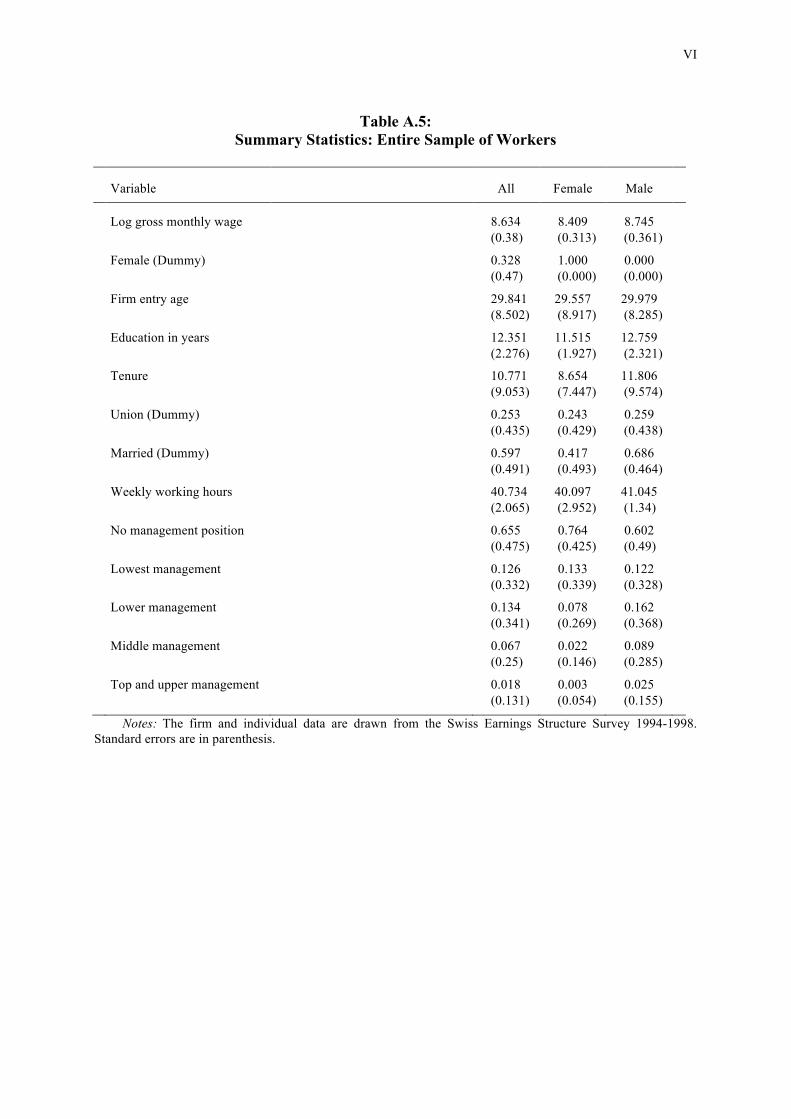
VI
Table A.5:
Summary Statistics: Entire Sample of Workers
Variable All Female Male
Log gross monthly wage 8.634 8.409 8.745 (0.38) (0.313) (0.361) Female (Dummy) 0.328 1.000 0.000 (0.47) (0.000) (0.000) Firm entry age 29.841 29.557 29.979 (8.502) (8.917) (8.285) Education in years 12.351 11.515 12.759 (2.276) (1.927) (2.321) Tenure 10.771 8.654 11.806 (9.053) (7.447) (9.574) Union (Dummy) 0.253 0.243 0.259 (0.435) (0.429) (0.438) Married (Dummy) 0.597 0.417 0.686 (0.491) (0.493) (0.464) Weekly working hours 40.734 40.097 41.045 (2.065) (2.952) (1.34) No management position 0.655 0.764 0.602 (0.475) (0.425) (0.49) Lowest management 0.126 0.133 0.122 (0.332) (0.339) (0.328) Lower management 0.134 0.078 0.162 (0.341) (0.269) (0.368) Middle management 0.067 0.022 0.089 (0.25) (0.146) (0.285) Top and upper management 0.018 0.003 0.025 (0.131) (0.054) (0.155)
Notes: The firm and individual data are drawn from the Swiss Earnings Structure Survey 1994-1998. Standard errors are in parenthesis.
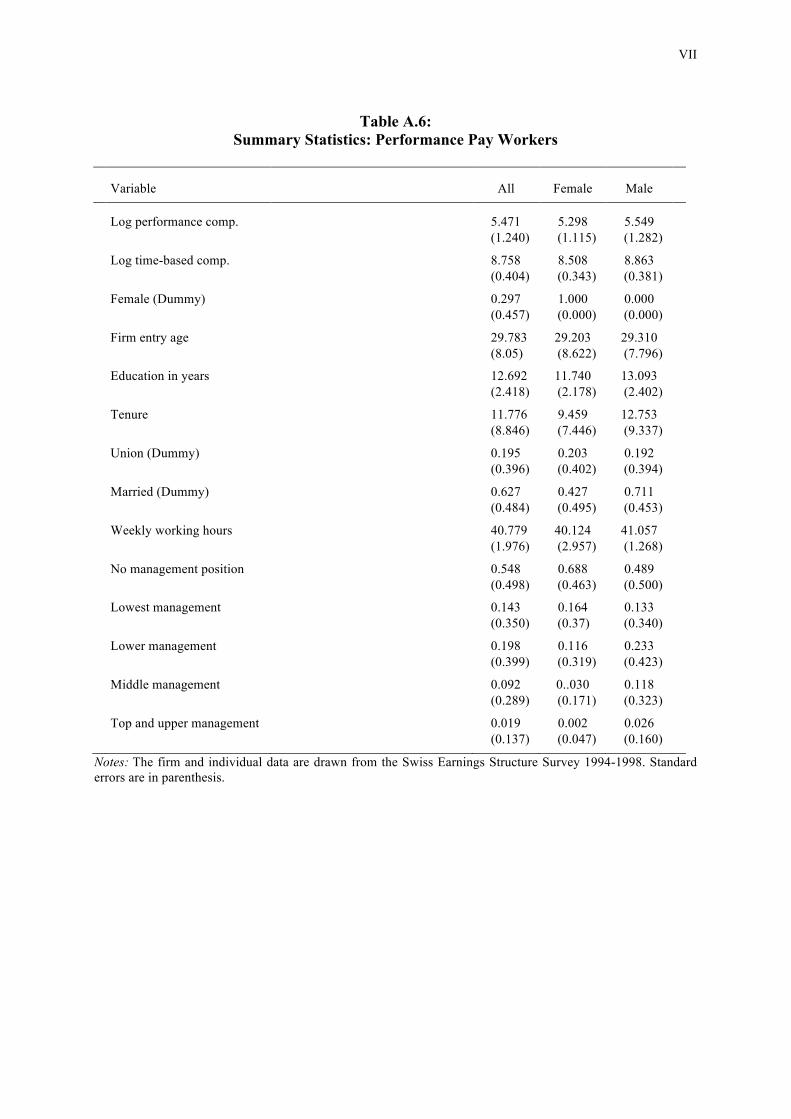
VII
Table A.6:
Summary Statistics: Performance Pay Workers
Variable All Female Male
Log performance comp. 5.471 5.298 5.549 (1.240) (1.115) (1.282) Log time-based comp. 8.758 8.508 8.863 (0.404) (0.343) (0.381) Female (Dummy) 0.297 1.000 0.000 (0.457) (0.000) (0.000) Firm entry age 29.783 29.203 29.310 (8.05) (8.622) (7.796) Education in years 12.692 11.740 13.093 (2.418) (2.178) (2.402) Tenure 11.776 9.459 12.753 (8.846) (7.446) (9.337) Union (Dummy) 0.195 0.203 0.192 (0.396) (0.402) (0.394) Married (Dummy) 0.627 0.427 0.711 (0.484) (0.495) (0.453) Weekly working hours 40.779 40.124 41.057 (1.976) (2.957) (1.268) No management position 0.548 0.688 0.489 (0.498) (0.463) (0.500) Lowest management 0.143 0.164 0.133 (0.350) (0.37) (0.340) Lower management 0.198 0.116 0.233 (0.399) (0.319) (0.423) Middle management 0.092 0..030 0.118 (0.289) (0.171) (0.323) Top and upper management 0.019 0.002 0.026 (0.137) (0.047) (0.160)
Notes: The firm and individual data are drawn from the Swiss Earnings Structure Survey 1994-1998. Standard errors are in parenthesis.