social capital and utilization of health services in
TRANSCRIPT
1
Social capital and utilization of health services in Nagaland, India: an exploratory study Avril Kaplan, Johns Hopkins Bloomberg School of Public Health, Baltimore, Maryland Krishna D. Rao, Johns Hopkins Bloomberg School of Public Health, Baltimore, Maryland Patrick Mullen, World Bank Group, Washington, D.C. Aarushi Bhatnagar, Public Health Foundation of India, New Delhi, India Abstract Over the past fifteen years, the concept of social capital has gained attention among economists and public health practitioners. However, few researchers have examined the role of social capital in health care seeking. Our mixed methods study explores this association in Nagaland, India using household survey data collected from 864 individuals who reported being sick or injured as well as focus group discussions. Through multinomial logistic regression, we find that higher trust increases the likelihood of individuals using public services (relative risk ratio (RRR) = 1.78; 95% confidence interval (CI) [1.15 - 2.75]) and private health services (RRR = 1.81; CI [1.04 - 3.12]) as compared to no or traditional services. Furthermore, higher social participation increases the likelihood of using services in the public sector over the private sector (odds ratio = 2.89; CI [1.37-6.07]). The qualitative data collected through focus group discussions in eight villages indicate that trust within a community may facilitate health service utilization by increasing an individual’s access to financial resources or transportation to service delivery points. Individuals with higher social participation may be more engaged in community-based efforts to improve government health services, and therefore may be more inclined to use them.
2
Introduction Social capital is a highly studied concept in the field of public health. To date, the majority of research focuses on the association between social capital and self-rated health (1-3). One of the proposed mechanisms through which social capital improves health is by increasing access to health services. However, few studies have directly examined this relationship (4). This paper therefore examines the statistical association between social capital and individual use of public and private sector health services in Nagaland, India. We then use qualitative data from focus group discussions (FGDs) to understand the association in greater depth. Nagaland presents a unique setting to study social capital. The state is home to sixteen tribes whose traditions and culture has been protected by the Indian constitution. Today, of the approximately 1.98 million people living in the state, 71.14 percent of people reside in rural villages that are largely homogeneous by tribe (5). Anecdotally, social capital within Naga villages is high because tribal groups share common values and traditions, and place the needs of their community above that of the individual. Furthermore, Naga villages are allegedly safe from crime and have a number of community organizations and associations, indicating the presence of dense social networks and the tight knit nature of the community (6,7) While social capital is reportedly high, it has never been studied within Nagaland. Two schools of thought explain how social capital is a resource for individuals and communities (2). The first school of thought, made popular by Robert Putman, views social capital as the networks and the quality of relationships among people, which is in turn a resource for a community (8). Often coined the ‘social cohesion’ school of thought, this theory proposes that people living in communities where there are dense associations, norms of reciprocity and high trust between people and within institutions have a benefit of being able to work together efficiently. Social capital therefore facilitates coordinated actions, and is a collective attribute of a community that is non-excludable (8). It can serve to bond together people of similar backgrounds, or bridge people of different social classes, cultures or lines of authority (9). The second school of thought, which is more aligned with the work of Pierre Bourdieu, views social capital as the resources made available to individuals through their social networks (10). These resources may include information, money or services. This ‘social network’ school of thought takes a more individualized perspective to social capital (2). Utilization of health services is determined by many factors. Anderson and Davidson’s model of health services use proposes that an individual’s use of health services is determined by predisposing factors, enabling factors and need (11). Predisposing factors are those that make an individual more susceptible to using health services, and may include their demographic characteristics, social relationships and health beliefs. Enabling factors are those that facilitate the use of health services and may include financial and organizational factors. Lastly, need factors refer to an individual’s perceived or evaluated physical, emotional or mental need for health services. Social capital could have an impact on utilization of health services through a variety of mechanisms. Social capital may play a role in an individual’s health beliefs and shape their attitude and knowledge about health and health services. Other studies have proposed that social
3
capital could improve knowledge about health resources or awareness of when treatment is needed (1). Furthermore, resources made available to individuals through their social networks could enable them to pay for private health services or access government provided health services faster than others. Research by Aye et al. supports this theory, as he suggests that social capital becomes increasingly important for people to access health services when their state bureaucracy and market systems are weak (12). In this context, people rely more strongly on their social relationships to access scarce resources rather than social services or their own financial earnings. We also recognize that social capital could have a negative impact on service utilization. For example, people in communities with a high degree of social capital may face stigma from within the community for seeking a specific type of service, or may share a common belief about specific health services that should not be used. Utilization of health services is one determinant of a population’s heath outcomes, and Nagaland has among the lowest service utilization in India. In 2012-13 year, only 9.7 percent of pregnant women received full antenatal care, 35.6 percent of children are fully vaccinated and 23.1 percent of women use a modern method of contraception (13). Understanding social capital provides insight into how social relationships can produce benefits for individuals and communities, and being sensitive to these social structures and dynamics could help interventions be more effective. In this study, we first examine whether social capital is associated with individuals seeking curative care when they are sick. Next, among those who do seek care, we examine if social capital has a differential effect on seeking care at public facilities as compared to private facilities. We examine associations in the public sector as compared to the private sector because the barriers to seeking care in each sector may differ. For example, the majority of health services in Nagaland are delivered through the public sector and are generally free at the point of use. While government services may be financially accessible, other researchers have found that the quality of these services is often low, serving as a barrier to care (14). In comparison to government services, private hospitals and health facilities are more geographically and financially inaccessible because they are concentrated in three of the state’s more urban districts, and require fee for service. To deepen our understanding of these barriers and the process through which social capital may overcome or create them, we complement the quantitative analysis with data collected from focus group discussions with community members in Nagaland.
4
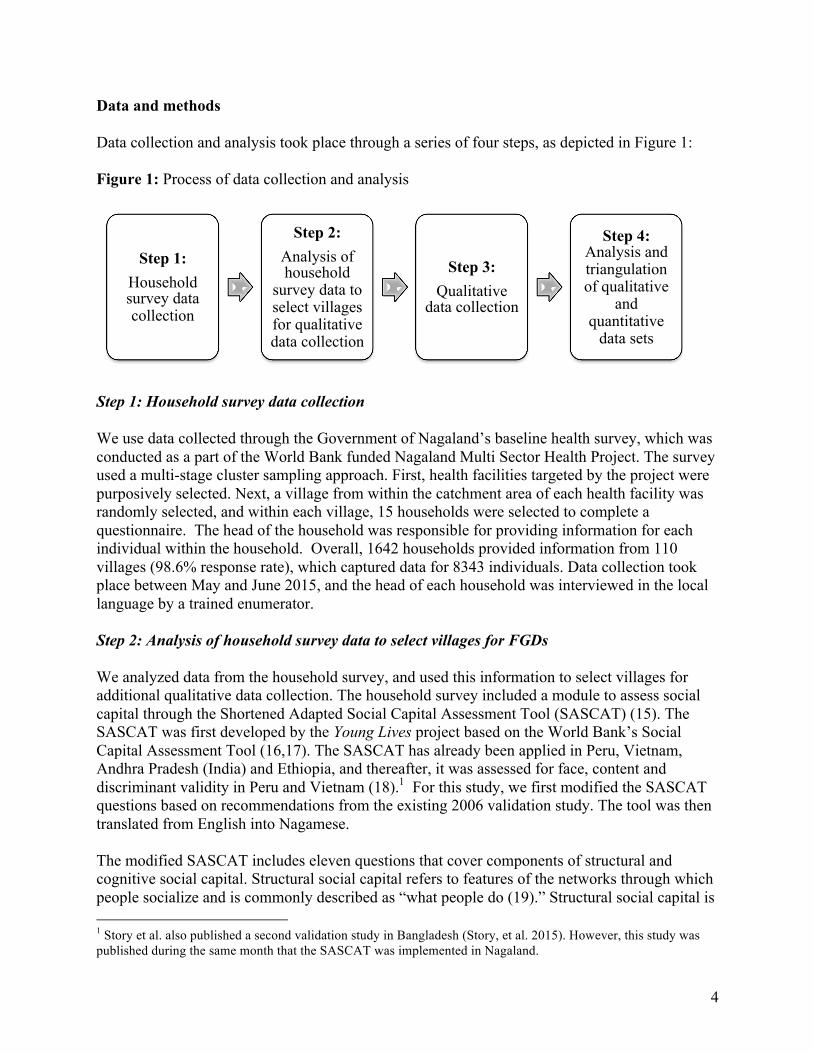
Data and methods Data collection and analysis took place through a series of four steps, as depicted in Figure 1: Figure 1: Process of data collection and analysis
Step 1: Household survey data collection We use data collected through the Government of Nagaland’s baseline health survey, which was conducted as a part of the World Bank funded Nagaland Multi Sector Health Project. The survey used a multi-stage cluster sampling approach. First, health facilities targeted by the project were purposively selected. Next, a village from within the catchment area of each health facility was randomly selected, and within each village, 15 households were selected to complete a questionnaire. The head of the household was responsible for providing information for each individual within the household. Overall, 1642 households provided information from 110 villages (98.6% response rate), which captured data for 8343 individuals. Data collection took place between May and June 2015, and the head of each household was interviewed in the local language by a trained enumerator. Step 2: Analysis of household survey data to select villages for FGDs We analyzed data from the household survey, and used this information to select villages for additional qualitative data collection. The household survey included a module to assess social capital through the Shortened Adapted Social Capital Assessment Tool (SASCAT) (15). The SASCAT was first developed by the Young Lives project based on the World Bank’s Social Capital Assessment Tool (16,17). The SASCAT has already been applied in Peru, Vietnam, Andhra Pradesh (India) and Ethiopia, and thereafter, it was assessed for face, content and discriminant validity in Peru and Vietnam (18).1 For this study, we first modified the SASCAT questions based on recommendations from the existing 2006 validation study. The tool was then translated from English into Nagamese. The modified SASCAT includes eleven questions that cover components of structural and cognitive social capital. Structural social capital refers to features of the networks through which people socialize and is commonly described as “what people do (19).” Structural social capital is 1 Story et al. also published a second validation study in Bangladesh (Story, et al. 2015). However, this study was published during the same month that the SASCAT was implemented in Nagaland.
Step 1: Household survey data collection
Step 2: Analysis of household
survey data to select villages for qualitative data collection
Step 3: Qualitative
data collection
Step 4: Analysis and triangulation of qualitative
and quantitative
data sets
5
objective and can therefore be verified (2). To cover structural social capital, the modified SASCAT asks three questions about citizenship and three questions about social participation. Cognitive social capital refers to the quality and nature of social interactions and can be thought of as “what people feel (19).” Unlike structural social capital, cognitive social capital is subjective (2). To cover cognitive social capital, the modified SASCAT asks three questions about trust and two questions about social cohesion. To ensure that the modified SASCAT captures these four components of social capital, we conduced a confirmatory factor analysis. The results of the CFA are presented in Appendix 1, and indicate that a four-factor solution (trust, social cohesion, citizenship and social participation) appropriately fits the data. We selected villages for additional qualitative data collection based on two criteria: geographic location and overall social capital score. To better understand how communities are working together when confronted with barriers to care, villages were purposively selected from remote districts where people are likely to have more difficulty accessing health services. Villages from the state’s three most urban districts, Dimapur, Kohima and Mokokchung, were therefore excluded. Among the remaining eight districts, we selected villages with a range in social capital scores. Four villages were selected with lower overall social capital scores in a western district of Wokha (average scores per village ranged from 5.00-5.46 out of a possible score of 11) and four villages were selected with higher overall social capital scores in the eastern district of Kiphire (average scores per village ranged from 6.80-7.60 out of a possible score of 11). Four villages were selected in each district to triangulate findings and make comparisons both within and between the districts. Step 3: Qualitative data collection Eligibility criteria to partake in the FGDs included being above the age of 18, able to provide oral consent, and being a resident of the selected village or town. The village leadership helped identify participants for the study. A team of four researchers conducted the FDGs during June 2015. Each data collector was trained as a moderator, and used a semi-structured discussion guide to lead the session. Participants were asked questions about their perceptions of health and health service within their community, barriers to seeking care and equity. They were also asked about the types of organizations and people that community members rely on to improve their health and wellbeing, the sources and type of information community members seek and receive about health and health services, and ways in which the community comes together to advocate for better health services. To facilitate the FDGs, we separated each group based on gender. A female researcher led the female session and a male researcher led the male session. We aimed to include 6 to 10 community members in each group (20). However, in two of our FDGs, we had only five members due to difficulty finding participants. We conducted four focus group discussions (2 men only groups, 2 women only groups) in each village. Hence, there were a total of 16 focus group sessions in Wokha, and 16 focus group sessions in Kiphire. Each focus group discussion was held in a private location within the community, as recommended by the village leaders.
6
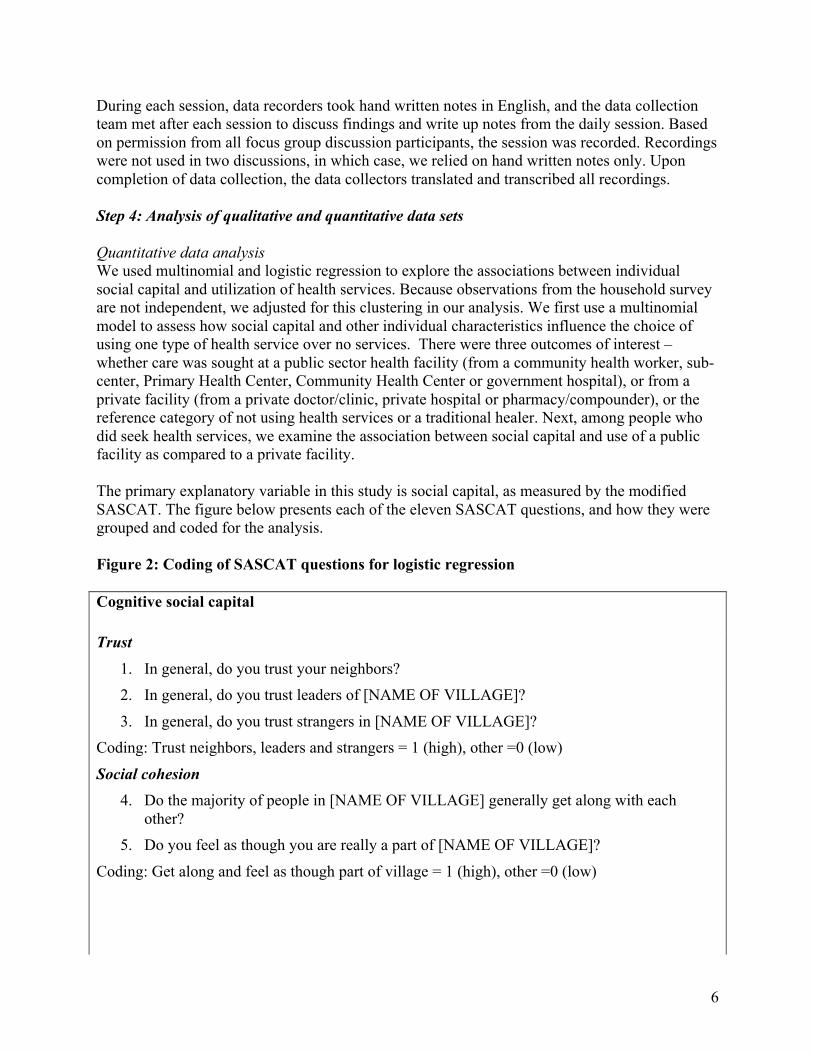
During each session, data recorders took hand written notes in English, and the data collection team met after each session to discuss findings and write up notes from the daily session. Based on permission from all focus group discussion participants, the session was recorded. Recordings were not used in two discussions, in which case, we relied on hand written notes only. Upon completion of data collection, the data collectors translated and transcribed all recordings. Step 4: Analysis of qualitative and quantitative data sets Quantitative data analysis We used multinomial and logistic regression to explore the associations between individual social capital and utilization of health services. Because observations from the household survey are not independent, we adjusted for this clustering in our analysis. We first use a multinomial model to assess how social capital and other individual characteristics influence the choice of using one type of health service over no services. There were three outcomes of interest – whether care was sought at a public sector health facility (from a community health worker, sub-center, Primary Health Center, Community Health Center or government hospital), or from a private facility (from a private doctor/clinic, private hospital or pharmacy/compounder), or the reference category of not using health services or a traditional healer. Next, among people who did seek health services, we examine the association between social capital and use of a public facility as compared to a private facility. The primary explanatory variable in this study is social capital, as measured by the modified SASCAT. The figure below presents each of the eleven SASCAT questions, and how they were grouped and coded for the analysis. Figure 2: Coding of SASCAT questions for logistic regression Cognitive social capital
Trust
1. In general, do you trust your neighbors? 2. In general, do you trust leaders of [NAME OF VILLAGE]?
3. In general, do you trust strangers in [NAME OF VILLAGE]? Coding: Trust neighbors, leaders and strangers = 1 (high), other =0 (low)
Social cohesion 4. Do the majority of people in [NAME OF VILLAGE] generally get along with each
other? 5. Do you feel as though you are really a part of [NAME OF VILLAGE]?
Coding: Get along and feel as though part of village = 1 (high), other =0 (low)
7
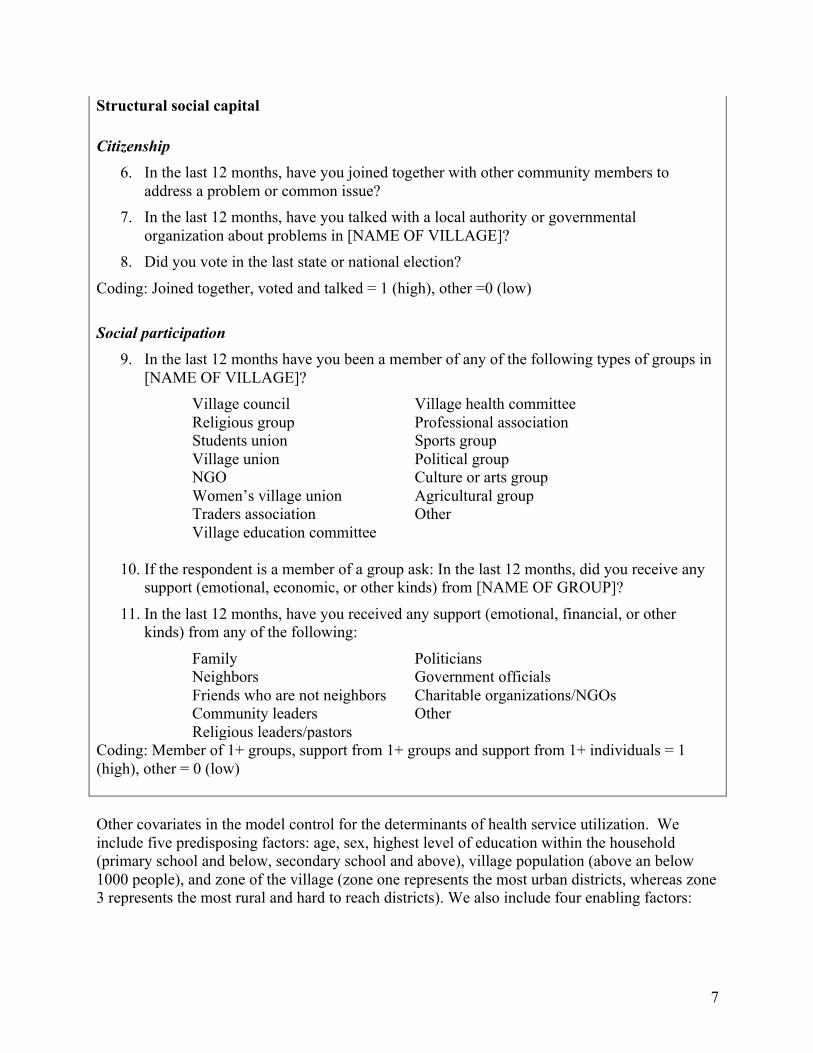
Structural social capital
Citizenship 6. In the last 12 months, have you joined together with other community members to
address a problem or common issue? 7. In the last 12 months, have you talked with a local authority or governmental
organization about problems in [NAME OF VILLAGE]? 8. Did you vote in the last state or national election?
Coding: Joined together, voted and talked = 1 (high), other =0 (low) Social participation
9. In the last 12 months have you been a member of any of the following types of groups in [NAME OF VILLAGE]?
Village council Religious group Students union Village union NGO Women’s village union Traders association Village education committee
Village health committee Professional association Sports group Political group Culture or arts group Agricultural group Other
10. If the respondent is a member of a group ask: In the last 12 months, did you receive any
support (emotional, economic, or other kinds) from [NAME OF GROUP]?
11. In the last 12 months, have you received any support (emotional, financial, or other kinds) from any of the following:
Family Neighbors Friends who are not neighbors Community leaders Religious leaders/pastors
Politicians Government officials Charitable organizations/NGOs Other
Coding: Member of 1+ groups, support from 1+ groups and support from 1+ individuals = 1 (high), other = 0 (low) Other covariates in the model control for the determinants of health service utilization. We include five predisposing factors: age, sex, highest level of education within the household (primary school and below, secondary school and above), village population (above an below 1000 people), and zone of the village (zone one represents the most urban districts, whereas zone 3 represents the most rural and hard to reach districts). We also include four enabling factors:
8
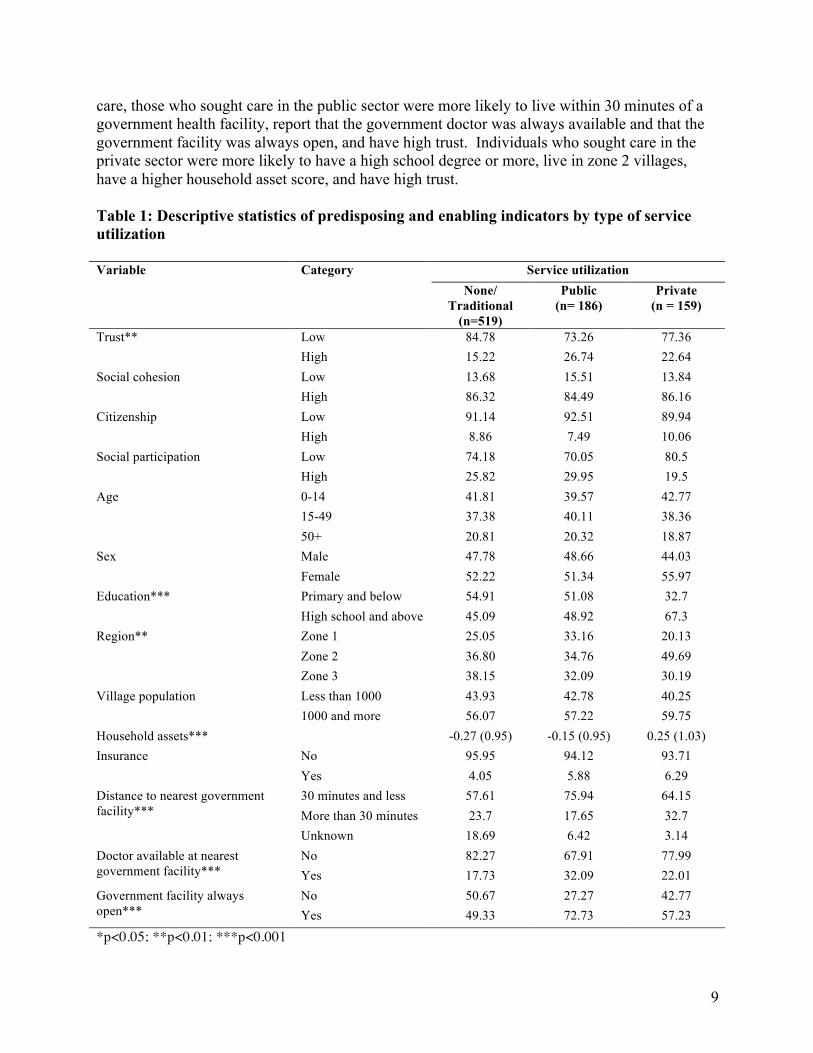
household assets2, whether a household has health insurance (yes/no), time to travel to the nearest government health facility (less than thirty minutes, more than thirty minutes, don’t know), and availability of a doctor at the nearest government health facility (always available, not always available). To capture need, respondents were asked whether they had been sick within the 15 days prior to the survey. If the respondent answered yes, then they were asked to specify where they sought services. We first conducted chi-squared tests and one-way analysis of variance F-tests to examine differences in use of public services, private services and no/traditional health services across the predisposing, enabling and social capital variables. For both the multinomial and logistic regression, we ran three models: the first examines the bivariate relationship between each covariate and dependent variable, the second incorporates all of the predisposing and enabling covariates, and the third incorporates the social capital variables. To assess the goodness of fit for each model, we conducted a Hosmer-Lemeshow test (21).3 In addition, we conducted a seemingly unrelated estimation test (suest) to test the assumption of independence of irrelevant alternatives for our multinomial model (22). Our analysis was conducted in STATA version 13.1. Qualitative data analysis We used the thematic framework method to analyze the qualitative data (23). We first read all transcripts in their entirety. We then used both a deductive and inductive approach to code the data. We began by coding data for one district according to the known structural and cognitive dimensions of social capital. During this process, we also used open coding to examine potential pathways through which social capital could influence health service utilization. The initial framework was then applied to data from the second district. After this initial series of coding, we developed a working analytical framework that was applied to the entire dataset. To triangulate our findings, we examined patterns and themes that emerged within each village, and them compared them across villages from the same district, and finally across villages from both districts. Results Quantitative findings Table 1 presents the descriptive statistics for individuals within the study. A total of 864 people (10.36% of individuals within the sample) report being sick or injured within the 15 days preceding the survey. Among these individuals, 186 people (21.53%) sought care in the public sector and the 159 people (18.40%) sought care in the private sector. The remainder sought no care (58.91%) or traditional services (1.16%). Compared to individuals who sought no/traditional 2 We constructed a household asset index due to the difficulties of collecting accurate data on household income or household expenditures. To construct the asset index, we examined descriptive statistics of various indicators that distinguish the poor from the very poor, or the wealthy from the very wealthy. Consistent with other asset indices, our final index includes variables related to durable assets, access to utilities and infrastructure, and housing characteristics. The asset index was standardized to improve interpretability of the results. 3 For our multinomial model, we conducted Hosmer-Lemeshow test on two separate logistic regression models. The first compared use of government services to no/traditional services, and the second compared use of private services to no/traditional services.
9
care, those who sought care in the public sector were more likely to live within 30 minutes of a government health facility, report that the government doctor was always available and that the government facility was always open, and have high trust. Individuals who sought care in the private sector were more likely to have a high school degree or more, live in zone 2 villages, have a higher household asset score, and have high trust. Table 1: Descriptive statistics of predisposing and enabling indicators by type of service utilization Variable Category Service utilization None/
Traditional (n=519)
Public (n= 186)
Private (n = 159)
Trust** Low 84.78 73.26 77.36 High 15.22 26.74 22.64 Social cohesion Low 13.68 15.51 13.84 High 86.32 84.49 86.16Citizenship Low 91.14 92.51 89.94 High 8.86 7.49 10.06Social participation Low 74.18 70.05 80.5 High 25.82 29.95 19.5Age 0-14 41.81 39.57 42.77 15-49 37.38 40.11 38.36 50+ 20.81 20.32 18.87 Sex Male 47.78 48.66 44.03 Female 52.22 51.34 55.97 Education*** Primary and below 54.91 51.08 32.7 High school and above 45.09 48.92 67.3 Region** Zone 1 25.05 33.16 20.13 Zone 2 36.80 34.76 49.69 Zone 3 38.15 32.09 30.19 Village population Less than 1000 43.93 42.78 40.25 1000 and more 56.07 57.22 59.75 Household assets*** -0.27 (0.95) -0.15 (0.95) 0.25 (1.03) Insurance No 95.95 94.12 93.71 Yes 4.05 5.88 6.29 Distance to nearest government facility***
30 minutes and less 57.61 75.94 64.15 More than 30 minutes 23.7 17.65 32.7
Unknown 18.69 6.42 3.14 Doctor available at nearest government facility***
No 82.27 67.91 77.99 Yes 17.73 32.09 22.01
Government facility always open***
No 50.67 27.27 42.77 Yes 49.33 72.73 57.23
*p<0.05; **p<0.01; ***p<0.001
10
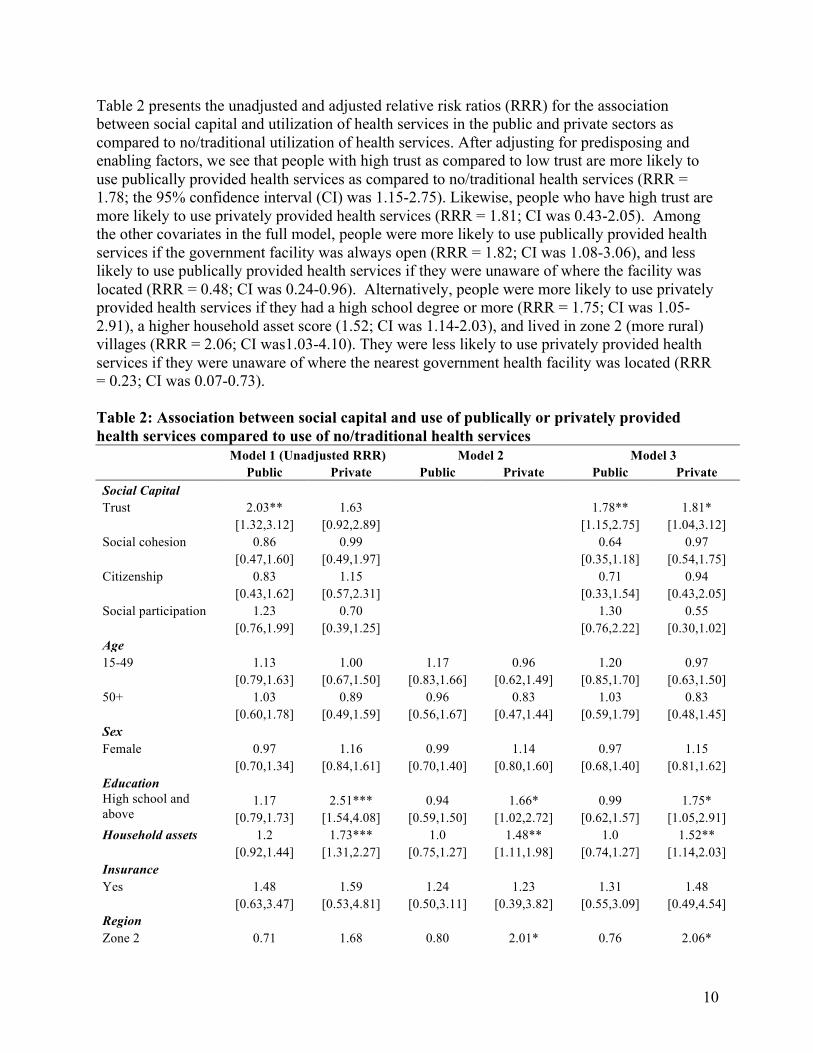
Table 2 presents the unadjusted and adjusted relative risk ratios (RRR) for the association between social capital and utilization of health services in the public and private sectors as compared to no/traditional utilization of health services. After adjusting for predisposing and enabling factors, we see that people with high trust as compared to low trust are more likely to use publically provided health services as compared to no/traditional health services (RRR = 1.78; the 95% confidence interval (CI) was 1.15-2.75). Likewise, people who have high trust are more likely to use privately provided health services (RRR = 1.81; CI was 0.43-2.05). Among the other covariates in the full model, people were more likely to use publically provided health services if the government facility was always open (RRR = 1.82; CI was 1.08-3.06), and less likely to use publically provided health services if they were unaware of where the facility was located (RRR = 0.48; CI was 0.24-0.96). Alternatively, people were more likely to use privately provided health services if they had a high school degree or more (RRR = 1.75; CI was 1.05-2.91), a higher household asset score (1.52; CI was 1.14-2.03), and lived in zone 2 (more rural) villages (RRR = 2.06; CI was1.03-4.10). They were less likely to use privately provided health services if they were unaware of where the nearest government health facility was located (RRR = 0.23; CI was 0.07-0.73). Table 2: Association between social capital and use of publically or privately provided health services compared to use of no/traditional health services
Model 1 (Unadjusted RRR) Model 2 Model 3
Public Private Public Private Public Private
Social Capital Trust 2.03** 1.63 1.78** 1.81*
[1.32,3.12] [0.92,2.89] [1.15,2.75] [1.04,3.12]
Social cohesion 0.86 0.99 0.64 0.97
[0.47,1.60] [0.49,1.97] [0.35,1.18] [0.54,1.75]
Citizenship 0.83 1.15 0.71 0.94 [0.43,1.62] [0.57,2.31] [0.33,1.54] [0.43,2.05] Social participation 1.23 0.70 1.30 0.55 [0.76,1.99] [0.39,1.25] [0.76,2.22] [0.30,1.02] Age 15-49 1.13 1.00 1.17 0.96 1.20 0.97
[0.79,1.63] [0.67,1.50] [0.83,1.66] [0.62,1.49] [0.85,1.70] [0.63,1.50]
50+ 1.03 0.89 0.96 0.83 1.03 0.83
[0.60,1.78] [0.49,1.59] [0.56,1.67] [0.47,1.44] [0.59,1.79] [0.48,1.45]
Sex Female 0.97 1.16 0.99 1.14 0.97 1.15
[0.70,1.34] [0.84,1.61] [0.70,1.40] [0.80,1.60] [0.68,1.40] [0.81,1.62]
Education High school and
above 1.17 2.51*** 0.94 1.66* 0.99 1.75*
[0.79,1.73] [1.54,4.08] [0.59,1.50] [1.02,2.72] [0.62,1.57] [1.05,2.91] Household assets 1.2 1.73*** 1.0 1.48** 1.0 1.52**
[0.92,1.44] [1.31,2.27] [0.75,1.27] [1.11,1.98] [0.74,1.27] [1.14,2.03]
Insurance Yes 1.48 1.59 1.24 1.23 1.31 1.48
[0.63,3.47] [0.53,4.81] [0.50,3.11] [0.39,3.82] [0.55,3.09] [0.49,4.54]
Region Zone 2 0.71 1.68 0.80 2.01* 0.76 2.06*
11
Model 1 (Unadjusted RRR) Model 2 Model 3
Public Private Public Private Public Private
[0.43,1.19] [0.92,3.08] [0.50,1.27] [1.03,3.91] [0.47,1.24] [1.03,4.10]
Zone 3 0.64 0.99 0.83 1.37 0.82 1.52
[0.37,1.10] [0.49,1.98] [0.47,1.48] [0.68,2.78] [0.46,1.48] [0.74,3.13]
Village Population 1000 people and
more 1.05 1.16 0.80 1.17 0.84 1.21
[0.67,1.64] [0.69,1.97] [0.53,1.20] [0.65,2.11] [0.56,1.28] [0.66,2.19] Distance to nearest government facility
30 minutes and more
0.57* 1.24 0.63 1.50 0.67 1.61 [0.33,0.98] [0.75,2.05] [0.36,1.12] [0.85,2.63] [0.38,1.20] [0.91,2.85]
Unknown 0.26*** 0.15*** 0.44* 0.22** 0.48* 0.23*
[0.15,0.47] [0.05,0.44] [0.22,0.88] [0.07,0.69] [0.24,0.96] [0.07,0.73]
Government health facility always open Yes 2.74*** 1.38 1.82* 0.96 1.82* 0.95
[1.79,4.19] [0.85,2.23] [1.08,3.06] [0.55,1.65] [1.08,3.06] [0.55,1.63]
Doctor always present at government facility Yes 2.19** 1.31 1.52 1.03 1.58 0.96
[1.36,3.53] [0.77,2.22] [0.89,2.57] [0.59,1.82] [0.93,2.69] [0.54,1.70]
Constant 0.35** 0.14*** 0.39* 0.13***
[0.18,0.67] [0.06,0.33] [0.17,0.91] [0.05,0.36]
*p<0.05; **p<0.01; ***p<0.001
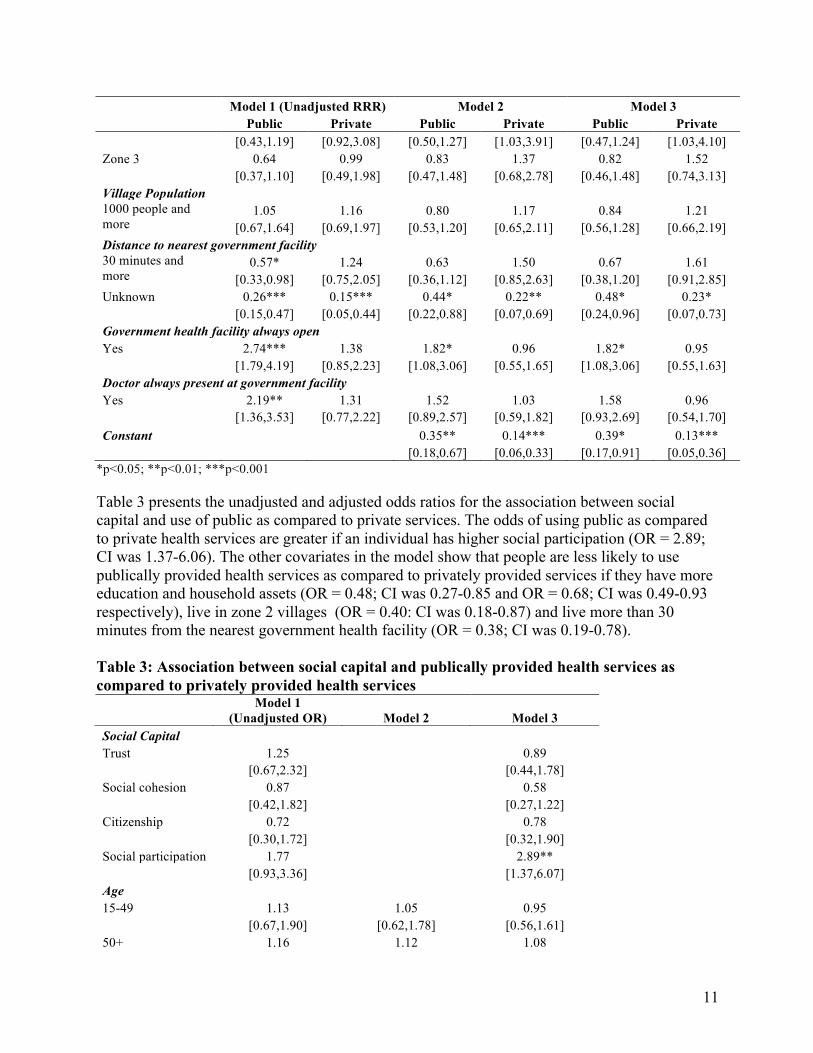
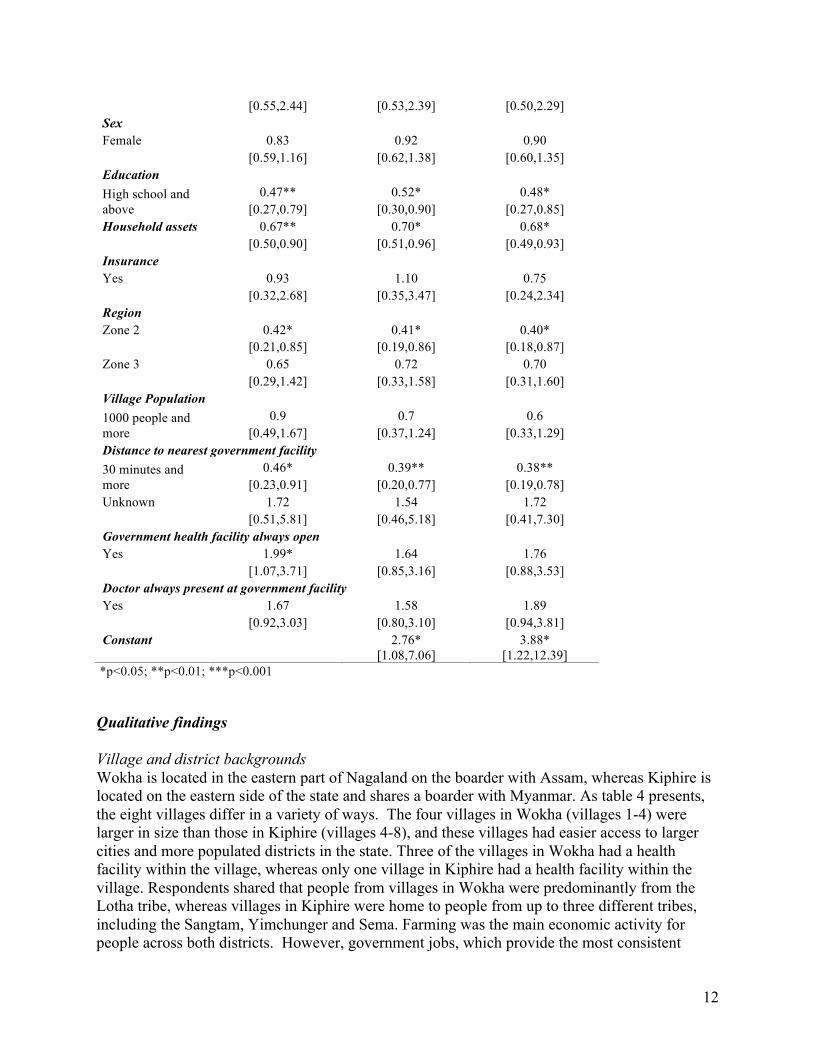
Table 3 presents the unadjusted and adjusted odds ratios for the association between social capital and use of public as compared to private services. The odds of using public as compared to private health services are greater if an individual has higher social participation (OR = 2.89; CI was 1.37-6.06). The other covariates in the model show that people are less likely to use publically provided health services as compared to privately provided services if they have more education and household assets (OR = 0.48; CI was 0.27-0.85 and OR = 0.68; CI was 0.49-0.93 respectively), live in zone 2 villages (OR = 0.40: CI was 0.18-0.87) and live more than 30 minutes from the nearest government health facility (OR = 0.38; CI was 0.19-0.78). Table 3: Association between social capital and publically provided health services as compared to privately provided health services
Social Capital Trust 1.25
0.89
[0.67,2.32]
[0.44,1.78]
Social cohesion 0.87
0.58
[0.42,1.82]
[0.27,1.22]
Citizenship 0.72 0.78 [0.30,1.72] [0.32,1.90] Social participation 1.77 2.89** [0.93,3.36] [1.37,6.07]
Model 1 (Unadjusted OR) Model 2 Model 3
Age 15-49 1.13 1.05 0.95
[0.67,1.90] [0.62,1.78] [0.56,1.61]
50+ 1.16 1.12 1.08
12
*p<0.05; **p<0.01; ***p<0.001
Qualitative findings Village and district backgrounds Wokha is located in the eastern part of Nagaland on the boarder with Assam, whereas Kiphire is located on the eastern side of the state and shares a boarder with Myanmar. As table 4 presents, the eight villages differ in a variety of ways. The four villages in Wokha (villages 1-4) were larger in size than those in Kiphire (villages 4-8), and these villages had easier access to larger cities and more populated districts in the state. Three of the villages in Wokha had a health facility within the village, whereas only one village in Kiphire had a health facility within the village. Respondents shared that people from villages in Wokha were predominantly from the Lotha tribe, whereas villages in Kiphire were home to people from up to three different tribes, including the Sangtam, Yimchunger and Sema. Farming was the main economic activity for people across both districts. However, government jobs, which provide the most consistent
[0.55,2.44] [0.53,2.39] [0.50,2.29]
Sex Female 0.83 0.92 0.90
[0.59,1.16] [0.62,1.38] [0.60,1.35]
Education High school and
above 0.47** 0.52* 0.48*
[0.27,0.79] [0.30,0.90] [0.27,0.85] Household assets 0.67** 0.70* 0.68*
[0.50,0.90] [0.51,0.96] [0.49,0.93]
Insurance Yes 0.93 1.10 0.75
[0.32,2.68] [0.35,3.47] [0.24,2.34]
Region Zone 2 0.42* 0.41* 0.40*
[0.21,0.85] [0.19,0.86] [0.18,0.87]
Zone 3 0.65 0.72 0.70
[0.29,1.42] [0.33,1.58] [0.31,1.60]
Village Population 1000 people and
more 0.9 0.7 0.6
[0.49,1.67] [0.37,1.24] [0.33,1.29] Distance to nearest government facility 30 minutes and more
0.46* 0.39** 0.38** [0.23,0.91] [0.20,0.77] [0.19,0.78]
Unknown 1.72 1.54 1.72
[0.51,5.81] [0.46,5.18] [0.41,7.30]
Government health facility always open Yes 1.99* 1.64 1.76
[1.07,3.71] [0.85,3.16] [0.88,3.53]
Doctor always present at government facility Yes 1.67 1.58 1.89
[0.92,3.03] [0.80,3.10] [0.94,3.81]
Constant
2.76* 3.88*
[1.08,7.06] [1.22,12.39]
13
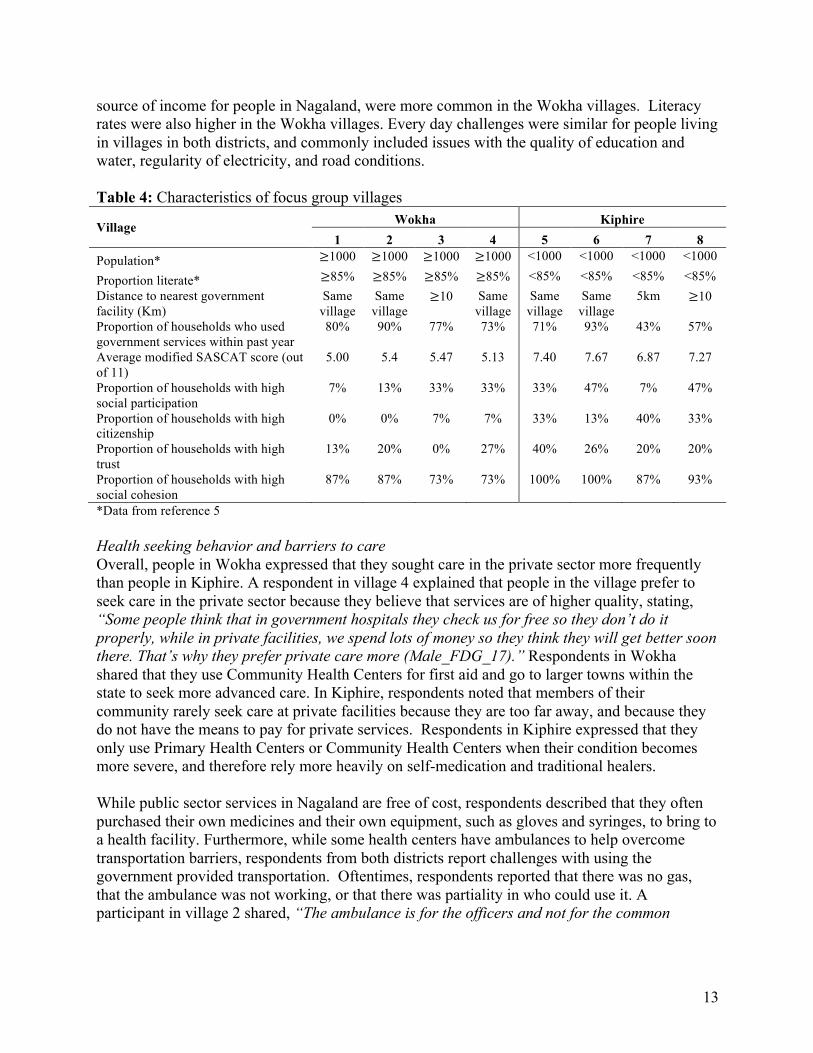
source of income for people in Nagaland, were more common in the Wokha villages. Literacy rates were also higher in the Wokha villages. Every day challenges were similar for people living in villages in both districts, and commonly included issues with the quality of education and water, regularity of electricity, and road conditions. Table 4: Characteristics of focus group villages
Village Wokha Kiphire 1 2 3 4 5 6 7 8
Population* ≥1000 ≥1000 ≥1000 ≥1000 <1000 <1000 <1000 <1000
Proportion literate* ≥85% ≥85% ≥85% ≥85% <85% <85% <85% <85% Distance to nearest government facility (Km)
Same village
Same village
≥10 Same village
Same village
Same village
5km ≥10
Proportion of households who used government services within past year
80% 90% 77% 73% 71% 93% 43% 57%
Average modified SASCAT score (out of 11)
5.00 5.4 5.47 5.13 7.40 7.67 6.87 7.27
Proportion of households with high social participation
7% 13% 33% 33% 33% 47% 7% 47%
Proportion of households with high citizenship
0% 0% 7% 7% 33% 13% 40% 33%
Proportion of households with high trust
13% 20% 0% 27% 40% 26% 20% 20%
Proportion of households with high social cohesion
87% 87% 73% 73% 100% 100% 87% 93%
*Data from reference 5 Health seeking behavior and barriers to care Overall, people in Wokha expressed that they sought care in the private sector more frequently than people in Kiphire. A respondent in village 4 explained that people in the village prefer to seek care in the private sector because they believe that services are of higher quality, stating, “Some people think that in government hospitals they check us for free so they don’t do it properly, while in private facilities, we spend lots of money so they think they will get better soon there. That’s why they prefer private care more (Male_FDG_17).”Respondents in Wokha shared that they use Community Health Centers for first aid and go to larger towns within the state to seek more advanced care. In Kiphire, respondents noted that members of their community rarely seek care at private facilities because they are too far away, and because they do not have the means to pay for private services. Respondents in Kiphire expressed that they only use Primary Health Centers or Community Health Centers when their condition becomes more severe, and therefore rely more heavily on self-medication and traditional healers. While public sector services in Nagaland are free of cost, respondents described that they often purchased their own medicines and their own equipment, such as gloves and syringes, to bring to a health facility. Furthermore, while some health centers have ambulances to help overcome transportation barriers, respondents from both districts report challenges with using the government provided transportation. Oftentimes, respondents reported that there was no gas, that the ambulance was not working, or that there was partiality in who could use it. A participant in village 2 shared, “The ambulance is for the officers and not for the common
14
people. So to say, there is partiality in providing the ambulance. They prefer giving it only to the rich people (Male_FDG_8).” Another common barrier was related to availability of staff. Respondent in several villages expressed that they could not easily reach facilities with a physician, or that a physician was not posted at their nearest Primary Health Center or Community Health Center. A participant in village 6 explained, “We have no doctor in our health center though our village is large in size and has many people.…. All we have in our village is a pharmacist and a nurse, so it becomes difficult for them to treat all the types of sickness (Male_FDG_25).” Staff absenteeism was noted as a barrier to care in some villages. As a participant in village 3 described, “The doctors are available only till 12 noon. After that they are gone. We have to be in the CHC before 12 if we need to visit the doctor (Female_FDG_10).” Trust Respondents shared that financial and transportation barriers prevent people from seeking health services in both the public and private sectors. People rely on others in their network to reach a government or private facility. A participant in village 6 explained that people are not openly willing to provide anyone with transportation to government facilities. Rather, people are only willing to help people they know closely. The respondent shared, “The road is just terrible…Even when there is a serious illness and a patient needs to be transported, only someone with a vehicle familiar or known to the patient or relatives would take the chances of helping with transportation. Otherwise, others would flatly refuse to give their vehicle for hire to avoid damage or accidents (Female_FDG_26).” In nearly every village, participants shared that community members would organize a free will donation for people who could not access health services due to financial constraints. However, some respondents shared that providing financial assistance was challenging because many families were struggling financially. A participant in village 6 described that willingness to make donations may depend on the how the person in need has interacted with others within their community, stating, “If his relation with the people is good then he will be able to access health care. But those who don’t mingle with people in a proper manner then it is hard for him to receive help from the community (Male_FDG_28).” Trust may also play role in the information that people share and seek. In villages from both districts, people expressed that they seek or share information from the people within their social networks with whom they feel most comfortable. According to a participant in village 2, “We always seek advice from those who had experience the specific disease about which we want information on. We ask from their diet, to the medicines, to the doctor, and even the health facility that they have visited. We basically do our own little research (Female_FDG_6).” This is particularly relevant when seeking information about services that are more sensitive. For example, a participant from village 2 stated, “[People] don’t use family planning openly and they don’t even ask the doctors about it because they feel shy, rather people ask to friends about it (Male_FDG_8).”

15
Social cohesion Across the entire sample of households, social cohesion scores were high. However, not all focus group respondents expressed high levels of social cohesion within their village. Participants in village 4 explained that political differences divided people within the community, sharing, “Our villagers have so much interest in politics, so much so that it is divided into four groups, which is why there occur some miscommunication and it is hard to keep up with each other regarding health issues and all (Male_FDG_17).” Village 2 is located near a disputed state boarder, and participants shared that cooperation among people was low. A participant described, “The communication and cooperation among the people is not up to the expectation…because of lack of cooperation and unity among the community, the development in our town is also poor (Male_FDG_7).” When the interviewer probed to understand why cooperation among people was low, the participant responded, “All the people are working class and are gathered from all over our district.…people have different understandings and thoughts so when all these people come together and are living in one place, it becomes difficult for them to click with one another (Male_FDG_7).” Overall, respondents in villages in Kiphire describe that they have high cohesion within their communities. While some villages in Kiphire included people from the same tribe, other villages were home to people from up to three different tribes, as well as people of different religious denominations. Despite this heterogeneity, respondents felt that there was large degree of cohesion and cooperation within their communities. A participant in village 7 shares, “We have two churches, some people from the Baptist church and some from the Catholic Church…the reason why there is unity is that if the Baptist needs help the catholic people help them, and if the catholic church needs help, the Baptist help them out irrespective of the denomination (Female_FDG_23).” People attribute their ability to cooperate due to the strong presence of the church within their community, as well as the work of the Village Council. If issues do arise between people, they take the issue directly to the Village Council to address “so things never get out of control (Male_FDG_32).” Strong social cohesion within Naga villages could have implications on health service utilization if people conform to the behaviors and beliefs of others within their community. Men from a village in Wokha expressed that they had pressure from other members of their community not to seek services, believing that doing so is a sign of weakness. According to a male participant in village 2, “People say that we don’t need to go to hospital for a silly sickness. So that particular word is in the mind of the general people and they feel reluctant to go to the hospital (Male_FDG_7).” Likewise, a participant in village 7 described reasons why people in the village were reluctant to use family planning services stating, “We usually don’t use [condoms] because we usually hear from our community that the condoms that are available to us are used and are being repackaged (Male_FDG_29).” Yet in village 4, a participant shared a changing trend, where people encourage each other to use family planning services in order to have smaller families. The participant stated, “Previous 2-3 generations require more human resources, even our own family is eight of us… Now there are mostly four to five children in a family, or even three. Unless you have enough resources it is difficult to look after even one child…if you produce more children you will not be able to feed them, in that sense we try to educate each other (Male_FDG_16).” A village in Kiphire was unique because of a common belief that evil spirits cause illness. As one community member in village 6 described, “We have a lot of spirits

16
that inflict us with sickness. Especially on the way to the field and from the field the spirits attack us and we get sick. Most of the villagers suffer from spirit inflicted sickness (Female_FDG_27).” Because of this belief, community members advise people who fall ill to go to a traditional healer first to understand whether the sickness is spirit inflicted.
Citizenship Naga villages were traditionally and continue to be governed by Village Councils and Village Development Boards (VDB) consisting of representatives nominated from within the village. The Village Council includes men from within the community and Gaonburas4 who are democratically elected and serve for a period of five years. The Village Council regulates many facets of village life, including matters related to civil and criminal proceedings. The VDB consists of both men and women from within the community, and is responsible for village development. Across villages in both districts, people rarely described instances when they reached out to village authorities to discuss a common problem within their community. Rather, respondents described that they have complete confidence in their village leaders to govern the community and to address challenges related to village development. In Kiphire, respondents expressed having confidence in their council to manage public funds, to sort out disputes over land, and to communicate information received form the state government. In Wokha, people also had confidence in their councils. However, one respondent expressed that since village development was entrusted to the council and VDB, people were entirely dependent on the village leadership to organize initiatives that benefit the entire community. This respondent in village 2 stated, “The leaders are the ones who take all the initiatives. So for example, if there is a cut out in electricity in the town, then the general public is totally dependent on the leaders (Male_FDG_7).” The respondent continued to share that there is such a high degree of confidence in village leadership that people “don’t do anything from their side (Male_FDG_7).” As a result, few participants from any of the villages expressed instances when they reached out to village leadership directly about a village concern, related to health, health services or otherwise. Furthermore, voting was common throughout villages in both districts, and people reported that they joined with the community to conduct social work organized by one of the many community groups. Social participation Villages within both Wokha and Kiphire had several active civil society groups. From women’s groups to student’s unions, self help groups, church groups and business unions, these organizations provide an opportunity for social interaction and support. These groups often provide economic opportunities for women by helping them develop entrepreneurial skills or providing them with a venue to sell agricultural products. The different community groups also serve to monitor alcohol use, which is banned throughout the state of Nagaland, as well as absenteeism of public sector employees. It is also common for the community groups to organize social work within the villages, which often includes village cleanliness drives or initiatives to make repairs to the village roads. In certain communities, these groups were credited with encouraging and enforcing people to build housing for their pigs and chickens, as well as toilet 4 Goanburas are prior Village Council members who can still vote on council issues. They are considered elders within the village.

17
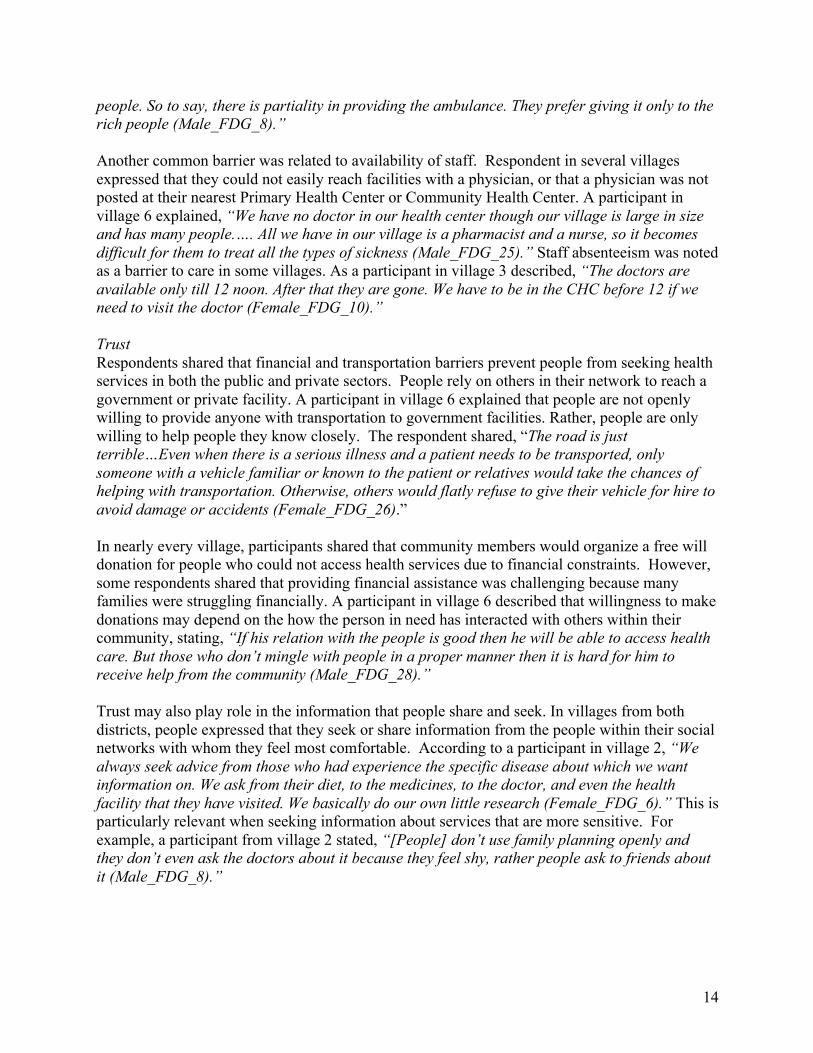
facilities to help improve hygiene and sanitation. Respondents often credited these initiatives for improving public health within their community. In addition to these community groups, as a part of the Government of Nagaland’s 2002 Communitization of Public Institutions and Health Services Act, health committees were established at government run health centers and within villages where a health center is not present. These health committees incorporate community members into the management of health services, and provide them with an opportunity to improve the quality and responsiveness of government health services. The act was specifically designed to leverage social capital within Naga villages to improve government services (24). Knowledge of the communitization initiative was low among respondents in Wokha villages, as the majority of participants were unaware of whether their village had a health committee. In the few instances where participants had heard of the committee, they did not know the committee’s role and had minimal communication with the committee. As a participant in village 1 explained, “They do not know anything about what the Village Health Committee is doing to bring forth changes to the facility in the positive light (Male_FDG_3).” On the other hand, many participants within Kiphire knew about their health committee, with participants in village 5 sharing, “The council, organizations and the general public are in full support with the Village Health Committee to help out with their work for even better development of the health center (Male_FDG_20).” In village 6, participants in one session noted positive changes initiated by the committee stating, “There has been constant supply of medicines unlike the past. There are medicines available for both children and adults (Female_FDG_22).” Discussion The quantitative findings from this study reveal that trust plays a role in the use of health services outside of the home. In addition, we find that social participation plays a role in using publically provided health services over privately provided health services. These findings lead to two key questions. First, why is trust associated with utilization of curative health services in the public and private sectors? The qualitative findings reveal that the quality of health services is a barrier to health service utilization in the public sector, and financial and transportation barriers were common to health service utilization in both sectors, albeit greater barriers in the private sector. People who have a high degree of trust may be more likely to borrow money or seek transport from family, neighbors or the community at large in order to pay for and reach health services. During the focus group sessions, respondents hinted that due to their own financial difficulties and the risks of damaging their personal vehicles while traveling to and from a health facility, they were not willing to help just any member of the community. Rather, they were more apt to assist those they respect and know personally. As Table 5 presents, only 6.93 percent of people who sought curative services outside of the home borrowed money from friends or family, yet those with high trust reported using donations from family or friends more frequently than those with low trust (p=0.055). If high levels of trust are associated with greater access to financial resources, we might expect that trust is more strongly associated with utilization of private sector health services where financial barriers are
18
greater, but this is not the case (RRR = 1.78 for use of public services and 1.81 for use of private services). Future research could assess whether a higher level of trust is associated with increased access to financial resources and ability to physically reach services. If trust is associated with access to financial resources, there may be implications for developing more formal and transparent schemes to pool funds through community-based health insurance, which could increase access to health services for a greater number of people. This is particularly relevant, as researchers in other country settings have found that trust is associated with willingness to join community-based health insurance (25). Table 5: Health service payment mechanism disaggregated by level of trust Payment mechanism Low Trust
% (n) High Trust
% (n) Total %(n)
Own savings/income 81.30 (200) 70.93 (61) 78.61 (261)
Borrowed from relatives/friends/church 4.47 (11) 13.95 (12) 6.93 (23)
Borrowed from bank 1.22 (3) 2.33 (2) 1.51 (5)
Sold land or assets 1.22 (3) 1.16 (1) 1.20 (4)
No payment made 11.38 (28) 11.63 (10) 11.45 (38)
Don’t know 0.41 (1) 0.00 (0) 0.30 (1)
Total 100 (246) 100 (86) 100 (332)
Fisher’s exact test = 0.055 The second question emerging from this research is why higher social participation is associated with greater use of public as compared to private health services? The focus group data reveal that community groups play a role in monitoring village activities, including the absenteeism of public sector employees. Hence, communities with strong civil society organizations may ensure that public sector services are delivered more effectively. To further examine this relationship, in Table 6, we disaggregated the availability of doctors and nurses at public sector facilities by low and high social participation. Without adjusting for any other variables, we find that households with higher social participation report that doctors are less likely to be always available (p=0.076), whereas households with higher social participation report that nurses are more likely to be always available (p=0.179). Table 6: Availability of providers and opening hours of facility disaggregated by level social participation Doctors Nurses
Not always available
% (n)
Always available
% (n)
Total % (n)
Not always available
% (n)
Always available
% (n)
Total % (n)
Low social participation
74.29 (913)
78.64 (324)
75.38 (1237)
77.04 (537)
74.14 (700)
75.38 (1237)
High social participation
25.71 (316)
21.36 (88)
24.62 (412)
22.96 (160)
25.85 (244)
24.62 (404)
Total 100.00 (1,229)
100.00 (412)
100.00 (1,641)
100.00 (697)
100.00 (944)
100.00 (1,641)
Chi squared test = 0.076 Chi squared test = 0.179
19
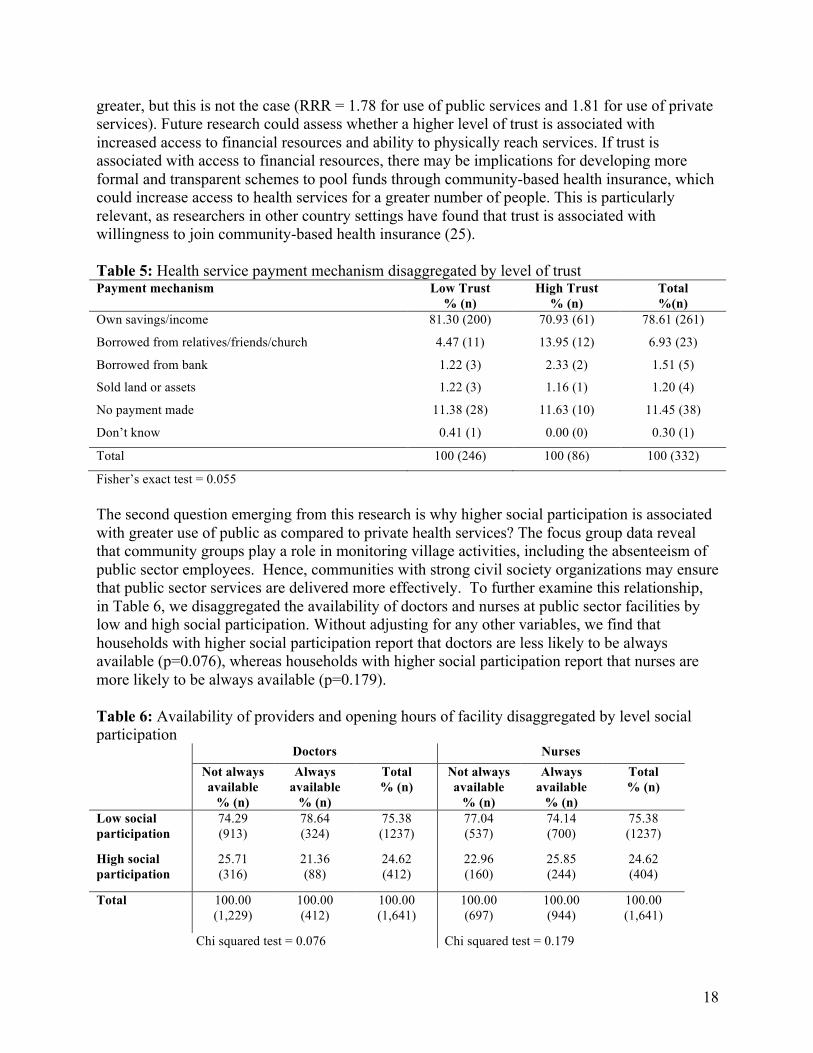
Existing research has confirmed that people are more likely to use services if they are involved in how they are delivered (26,27). In Nagaland, the Communitization of Public Services and Institutions Act provides community members with the opportunity to partake in the delivery of government services. While the focus group data indicates that uptake of the initiative may not be consistent throughout the state, implementation of the Communitization Act may be more effective in communities where there is more participation in community groups, and could ultimately be leading to greater use of publically provided health services. Table 7 shows that households with higher social participation were more likely to know about their local health committee (p=0.000). Furthermore, among people who used health services, 40.11 percent of those who used public services were aware of their health committee, as compared to 31.65 percent of people who used private services (p=0.103). Additional research could examine the association between social participation and effective implementation of the Communitization Act. If higher social participation is associated with effective policy implementation, then continuing to strengthen and empower health committees could have positive implications on the use of government services. Table 7: Household knowledge of health committee disaggregated by level of social participation
Table 8: Type of service sought disaggregated by knowledge of health committee
Aware of committee
% (n)
Not aware of
committee % (n)
Total % (n)
Private % (n)
Public % (n)
Total % (n)
Low social participation
67.28 (364)
79.36 (869)
75.37 (1,233)
Aware of committee
31.65 (50)
40.11 (75)
36.23 (125)
High social participation
32.72 (177)
20.64 (226)
24.63 (403)
Not aware of committee
68.35 (108)
59.89 (112)
63.77 (220)
Total 100.00 (541)
100.00 (1,095)
100.00 (1,636)
Total 100.00 (158)
100.00 (187)
100.00 (345)
Chi-squared = 0.000 Chi-squared = 0.103 Our study finds that there is no association between citizenship or social cohesion and utilization of health services outside of the home, or in selecting one type of service provider over another. In terms of citizenship, the focus group data indicate that very few people are reaching out to community leaders to voice concerns about issues within their village. Respondents had a high level of confidence in their village leaders, and therefore entrusted community decisions to the Village Council or the VDB. Overall, social cohesion was high among most villages in Nagaland. While people in tight knit communities with a high degree of social cohesion may share collective beliefs about health and health services, evidence from the focus group data revealed that the association between social cohesion and health service utilization might be mixed: some community beliefs could encourage the use of public and private health services, whereas other beliefs could discourage utilization. This study has limitations related to the quantitative data collection and analysis. First, given that this study is cross sectional, we can only examine associations between social capital and utilization of government health services, and not causality. The second limitation relates to
20
generalizability of the study. While the quantitative data incorporates villages from all of Nagaland’s eleven districts, the sample is not representative of the state as a whole. The findings therefore cannot be applied to describe the relationship between social capital and utilization of health services in all villages within Nagaland. Third, the survey did not collect information on the severity of illness. Hence, people may not have sought services because their illness was not severe enough, and not because they faced barriers to care. Fourth, only 1.16 percent of people who were ill reported that they used traditional health services. During the qualitative interviews, respondents shared that they commonly used traditional health services, signifying that there may be under reporting of this indicator. This study also has limitations related to the qualitative data collection and analysis. Selection of villages was based on geographic region, as well as social capital score. Since there were only 15 households sampled per each village, a statistical difference in the level of social capital for each village cannot be calculated. Conclusions Anecdotal evidence suggests that social capital in Nagaland is high. This is the first study to examine the role of social capital in Nagaland to help achieve a goal of public interest – expanding utilization of health services. This study provides preliminary insight into how social capital may be working to reach this goal, and suggests that trust is associated with greater use of curative health services outside of the home. To date, the majority of trust research has examined the relationship between trust in a health service provider or in health system institutions and health service utilization. Our study provides initial evidence that trust within the general community is also an important consideration to overcome barriers to seeking health services. In addition, we also find that social participation is associated with use of publically provided health services as compared to privately provided health services. This finding is aligned with existing research, which suggests that people are more likely to use health services if they are involved in how they are delivered. Future research into these associations could help strengthen existing interventions in Nagaland, such as Communitization, or design new community-based initiatives to decrease barriers to care and increase utilization of health services.
21
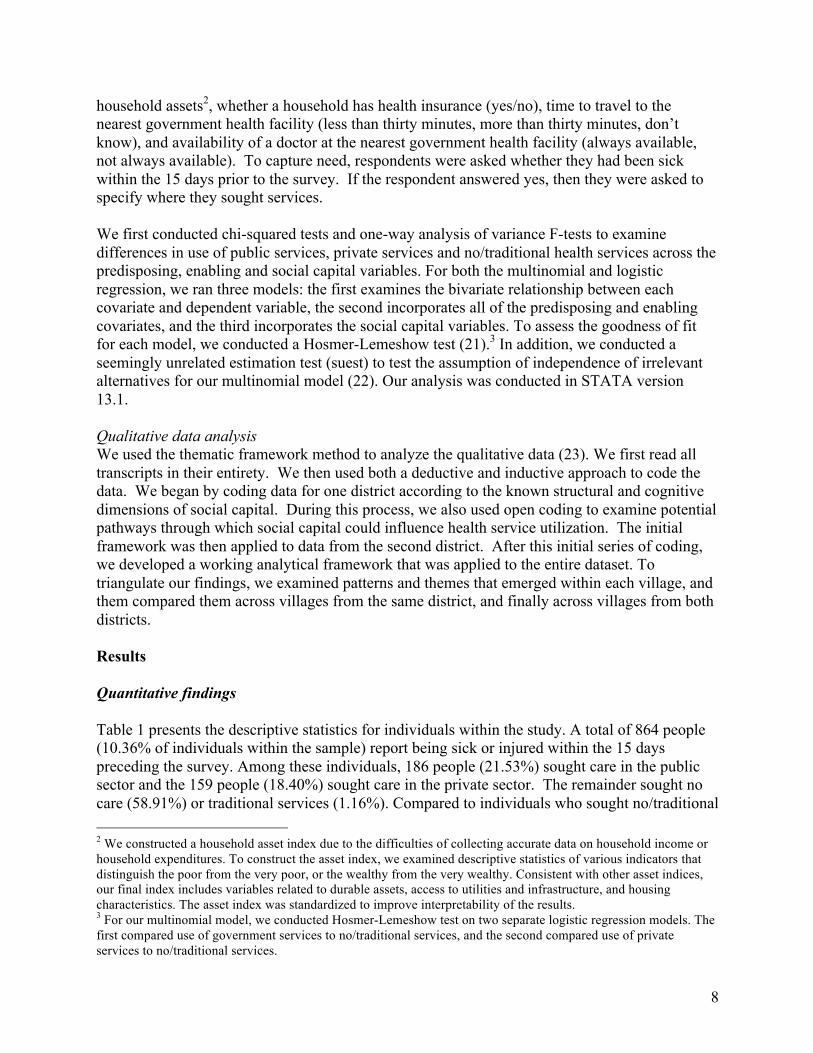
Appendix 1 We completed a confirmatory factor analysis to ensure that the data in our scale appropriately captures the different dimensions of social capital. We estimate a four-factor solution. The first factor is trust (trust). Three indicators aim to assess interpersonal trust, which is based on relationships between people, and generalized trust, which is within the community more broadly. Trust is an important component of social capital, as people who have trustworthy relationships can rely on others to perform specific tasks. As such, the first indicator assesses whether the respondent trusts neighbors (neighbrs), the second assesses trust in leaders (leaders) and the third assesses trust in strangers (stranger). All three indicators had three response options, trust all, trust some, or trust none. The second factor is social cohesion (cohesion), which creates a sense of harmony and solidarity among people living in the same community. This facilitates the sharing of resources and working together to improve access to resources. Two indicators measure social cohesion. The first is whether the respondent feels as though they belong within their village (belong), and the second is whether the respondent thinks that people within the village get along (getalong). These two indicators had binary yes/no response options The third factor is citizenship (citizenship), which aims to capture the extent to which people are willing to intervene for the benefit of their community. Three indicators assess this factor. The first asks whether the respondent has joined together with community members within the past 12 months to address a common issue (join), the second asks whether the individual has talked to a local authority or governmental organization within the past 12 months about a village problem (talk_auth), and the third asks whether the individual has voted in the last state or national election (vote). All three indicators had a binary yes/no response option. The fourth factor (social participation) includes three indicators that aim to measure formal and informal networks. These items are aligned with Bourdieu’s theory that social capital is a product of individual’s social relationships, and the resources that they can obtain through these relationships. The first indicator (ind) asked whether the respondent received economic, social or other support from a select group of individuals. This indicator was dichotomized into a binary indicator, distinguishing if the respondent received support from no individuals versus one or more individuals. Respondents were then asked to specify the type of community groups they are involved with, and then whether the group provides them with any economic, social or other support. Since respondents only answered the second question if they were a member of a community group, these two indicators were combined into a single variable for the confirmatory factor analysis (group). This variable was coded as 0 if the respondent was a member of no groups, 1 if they were a member of one or more groups but did not receive any support from these groups, and 2 if they were a member of one or more groups and received support from at least one of the groups. The CFA analysis was completed in Mplus software version 7. Since the social capital indicators were binary or ordinal, we estimated the model using robust weighted least squares (28). To assess model fit, we examined the model chi-square test, normed comparative fit index (CFI),
22
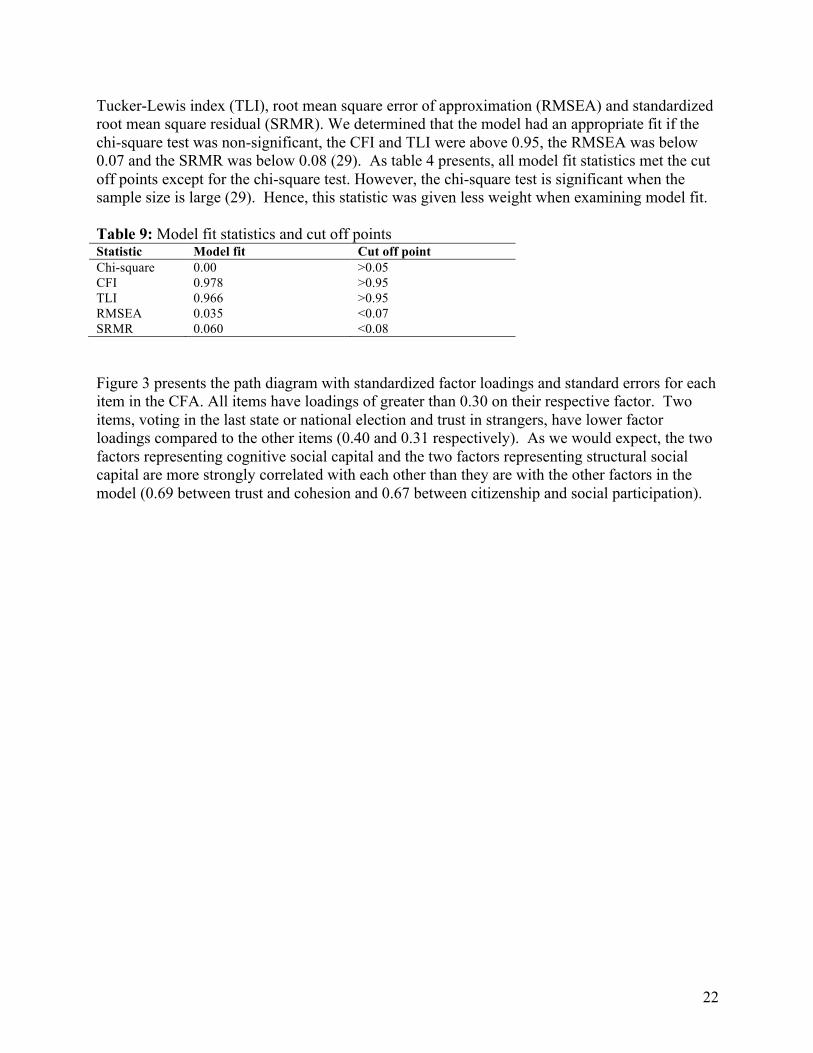
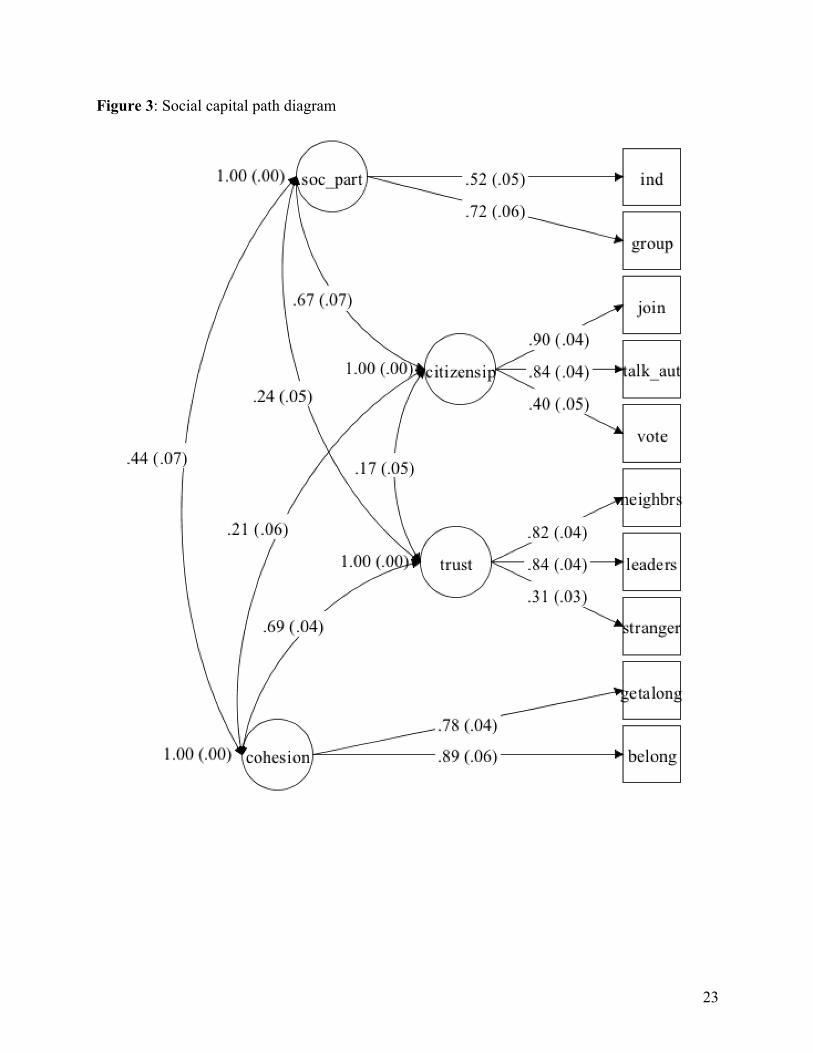
Tucker-Lewis index (TLI), root mean square error of approximation (RMSEA) and standardized root mean square residual (SRMR). We determined that the model had an appropriate fit if the chi-square test was non-significant, the CFI and TLI were above 0.95, the RMSEA was below 0.07 and the SRMR was below 0.08 (29). As table 4 presents, all model fit statistics met the cut off points except for the chi-square test. However, the chi-square test is significant when the sample size is large (29). Hence, this statistic was given less weight when examining model fit. Table 9: Model fit statistics and cut off points Statistic Model fit Cut off point Chi-square 0.00 >0.05 CFI 0.978 >0.95 TLI 0.966 >0.95 RMSEA 0.035 <0.07 SRMR 0.060 <0.08 Figure 3 presents the path diagram with standardized factor loadings and standard errors for each item in the CFA. All items have loadings of greater than 0.30 on their respective factor. Two items, voting in the last state or national election and trust in strangers, have lower factor loadings compared to the other items (0.40 and 0.31 respectively). As we would expect, the two factors representing cognitive social capital and the two factors representing structural social capital are more strongly correlated with each other than they are with the other factors in the model (0.69 between trust and cohesion and 0.67 between citizenship and social participation).
23
Figure 3: Social capital path diagram
24
References:
(1) Derose KP, Varda DM. Social capital and health care access: a systematic review. Med Care Res Rev 2009 Jun;66(3):272-306.
(2) Kawachi I, Subramanian SV, Kim D. Social Capital and Health. New York, NY: Springer Science and Business Media, LLC; 2008.
(3) Story WT. Social capital and health in the least developed countries: a critical review of the literature and implications for a future research agenda. Glob Public Health 2013;8(9):983-999.
(4) Scheffler RM, Brown TT. Social capital, economics, and health: new evidence. Health Econ Policy Law 2008 Oct;3(Pt 4):321-331.
(5) Census 2011. 2015; Available at: http://www.census2011.co.in/census/state/nagaland.html. Accessed October 24, 2016.
(6) Census Organisation of India. Nagaland Population Census Data 2011. 2011; Available at: http://www.census2011.co.in/census/state/nagaland.html. Accessed April 1, 2016, 2016.
(7) Department of Planning & Coordination Government of Nagaland. Nagaland State Development Report. 2004.
(8) Putnam RD. Bowling alone: America's declining social capital. New York, NY: Simon and Schuster Paperbacks; 2000.
(9) Szreter S, Woolcock M. Health by association? Social capital, social theory, and the political economy of public health. Int J Epidemiol 2004 Aug;33(4):650-667.
(10) Bourdieu P. The forms of capital. In: Richardson J, editor. Handbook of Theory and Research for the Sociology of Education New York: Greenwood; 1986. p. 241-258.
(11) Andersen RM, Rice TH, Kominski EF. Improving access to care in America: individual and contextual indicators. . Changing the U.S. health care system: key issues in health services, policy, and management San Francisco, CA: Jossey-Bass; 2001. p. 3–30.
(12) Aye M, Champagne F, Contandriopoulos AP. Economic role of solidarity and social capital in accessing modern health care services in the Ivory Coast. Soc Sci Med 2002 Dec;55(11):1929-1946.
(13) Ministry of Health and Family Welfare, Government of India. District Level Household and Facility Survey 4: State Fact Sheet Nagaland. 2015.
(14) Bali AS, Ramesh M. Health care reforms in India: getting it wrong. Public Policy and Administration 2015;30(3-4):300-19.
25
(15) De Silva MJ, Huttly SR, Harpham T, Kenward MG. Social capital and mental health: a comparative analysis of four low income countries. Soc Sci Med 2007 Jan;64(1):5-20.
(16) Young Lives Project. 2010; Available at: http://www.younglives.org.uk/. Accessed March 7, 2016.
(17) World Bank. Social Capital Assessment Tool. 2011; Available at: http://go.worldbank.org/LHI4AYZEF0. Accessed March 7, 2016.
(18) De Silva MJ, Harpham T, Tuan T, Bartolini R, Penny ME, Huttly SR. Psychometric and cognitive validation of a social capital measurement tool in Peru and Vietnam. Soc Sci Med 2006 Feb;62(4):941-953.
(19) Harpham T, Grant E, Thomas E. Measuring social capital within health surveys: key issues. Health Policy Plan 2002 Mar;17(1):106-111.
(20) Hennick MM. International Focus Group Research: A Handbook for the Health and Social Sciences. 1st ed. Cambridge: Cambridge University Press; 2007.
(21) Hosmer, D.W., Lemeshow, S., Sturdivant RX. Applied Logistic Regression, Third Edition. Hoboken, New Jersey: John Wiley & Sons, Inc.; 2013.
(22) Wessie J. Seemingly unrelated estimation and the cluster-adjusted sandwich estimator. Stata Technical Bulletin 1999;52:34-47.
(23) Ritchie J, Spence L. Qualitative data analysis for applied policy research. In: Bryman A, Burgess RG, editors. Analyzing qualitative data London: Routledge; 1994. p. 173-194.
(24) Government of Nagaland Health and Family Welfare Department. Handbook on Communitisation of Health Centres. 2005.
(25) Zhang L, Wang H, Wang L, Hsiao W. Social capital and farmer's willingness-to-join a newly established community-based health insurance in rural China. Health Policy 2006 Apr;76(2):233-242.
(26) Rifkin SB. Lessons from community participation in health programmes: a review of the post Alma-Ata experience. Int Health 2009 Sep;1(1):31-36.
(27) Bath J, Wakerman J. Impact of community participation in primary health care: what is the evidence? Australian Journal of Primary Health 2013;21(1).
(28) Muthén LK, Muthén BO. MPlus User's Guide. Los Angeles, CA: Muthén & Muthén; 1998-2010.
(29) Hooper D, Coughlan J, Mullen M:. Structural Equation Modeling: Guidelines for determining model fit. Electronic Journal of Business Research Methods 2008;6(1):53-60.