social exclusion and discrimination - isid: …isid.org.in/pdf/wp1206.pdf · 2018-01-22 ·...
TRANSCRIPT

Institute for Studies in Industrial Development4, Institutional Area, Vasant Kunj Phase II, New Delhi - 110 070
Phone: +91 11 2676 4600 / 2689 1111; Fax: +91 11 2612 2448E-mail: [email protected]; Website: http://isid.org.in
About the ISIDThe Institute for Studies in Industrial Development (ISID), successor to the Corporate Studies Group (CSG), is a national-level policy research organization in the public domain and is affiliated to the Indian Council of Social Science Research (ICSSR). Developing on the initial strength of studying India’s industrial regulations, ISID has gained varied expertise in the analysis of the issues thrown up by the changing policy environment. The Institute’s research and academic activities are organized under the following broad thematic areas:
Industrialization: Land acquisition, special economic zones, encroachment of agricultural land, manufacturing sector, changing organized-unorganised sector relationship, rise of service economy in India, training and skill formation etc.;
Corporate Sector: With special emphasis on liberalization-induced changes in the structures of the sector, corporate governance, individual firms/groups, emerging patterns of internationalization, and of business-state interaction;
Trade, Investment and Technology: Trends and patterns of cross-border capital flows of goods and services, mergers & acquisitions, inward and outward FDI etc. and their implications for India’s position in the international division of labour;
Regulatory Mechanism: Study of regulatory authorities in the light of India’s own and international experience, competition issues;
Employment: Trends and patterns in employment growth, non-farm employment, distributional issues, problems of migrant labour and the changes in workforce induced by economic and technological changes;
Public Health: Issues relating to healthcare financing, structure of health expenditure across states, corporatisation of health services, pharmaceutical industry, occupational health, environment, health communication;
Media Studies: Use of modern multimedia techniques for effective, wider and focused dissemination of social science research to promote public debates;
Other Issues: Educational policy and planning, role of civil societies in development processes etc.
ISID has developed databases on various aspects of the Indian economy, particularly concerning industry and the corporate sector. It has created On-line Indexes of 197 Indian Social Science Journals (OLI) and 18 daily English Newspapers. More than one million scanned images of Press Clippings on diverse social science subjects are available online to scholars and researchers. These databases have been widely acclaimed as valuable sources of information for researchers studying India’s socio-economic development.
ISID ISID
ESTIMATION OF PRIVATE INVESTMENT IN MANUFACTURING SECTOR
AND DETERMINANTS IN INDIAN STATES
November 2012
Working PaperNo: 2012/06
Jagannath Mallick

Jagannath Mallick
Institute for Studies in Industrial Development 4, Institutional Area, Vasant Kunj Phase II, New Delhi - 110 070
Phone: +91 11 2676 4600 / 2689 1111; Fax: +91 11 2612 2448
E-mail: [email protected]; Website: http://isid.org.in
November 2012
ISID
WORKING PAPER
2012/06
ESTIMATION OF PRIVATE INVESTMENT
IN MANUFACTURING SECTOR AND
DETERMINANTS IN INDIAN STATES
© Institute for Studies in Industrial Development, 2012
ISID Working Papers are meant to disseminate the tentative results and findings
obtained from the ongoing research activities at the Institute and to attract comments
and suggestions which may kindly be addressed to the author(s).

CONTENTS
Abstract 1
I. Introduction 1
II. Review of Literature 3
III. Estimation of Private Investment in Indian States 7
IV. Trends and Patterns of Private Investment in Indian States 8
V. Determinants of Private Investment at State Level 11
VI. Methodology 14
VII. Data Sources and Measurement of Variables 16
VIII. Infrastructure and Private Investment 17
IX. Empirical Results and Discussions 20
X. Conclusions and Policy Implications 22
Appendix 24
References 27
List of Tables
Table 1 Share of Private Investment (in %) 9
Table 2 Ranking of States in Terms of Share in Private GFCF 10
Table 3 Fisher’s Z test for Equality of Correlation Coefficients 11
Table 4 Descriptive Statistics of Infrastructure Variables 17
Table 5 Results of KMO and Bartlett's Test 17
Table 6 Principal Component Analysis: Eigen values, Proportion Explained 18
Table 7 Rotated Factor Matrixa 18
Table 8 Components of Infrastructure 19
Table 9 Private Investment and Infrastructure 19
Table 10 System GMM Estimation Results 21
Table A1 Information in Block A and B of ASI Unit Level Data 24
Table A2 Information in Block C of ASI Unit Level Data 24
Table A3 Estimates of Private GFCF at Constant Prices (2004–05=100)
in Manufacturing Sector 25
Table A4 Linear Trend of Private Investment 26

Table A5 Private Investment and Infrastructure over the Periods 26
List of Figure
Figure 1 Regional Variation in Private Investment 11

ESTIMATION OF PRIVATE INVESTMENT
IN MANUFACTURING SECTOR
AND DETERMINANTS IN INDIAN STATES
Jagannath Mallick*
[Abstract: This study estimates private investment in the manufacturing sector in Indian states over
the period from 1993–94 to 2007–08 by using the unit-level data of ASI. The results show that though
the variation in private investment across the major states is declining during this period, still it is
high. The empirical analysis shows that private investment in Indian states is explained by its one-year
lag, infrastructure, economic factors, fiscal factors and labour factors. This paper contributes to the
regional development literature by estimating private investment of the manufacturing sector at the
state-level and analysing their patterns and determinants, particularly after the economic reforms.]
I. Introduction
Private investment is identified as a crucial factor for economic growth at both the
national and state levels in Indian economy (see, Everhart and Sumlinski, 2001;
Odedokum, 1997; Khan and Reinhart, 1990; Blejer and Khan, 1984; Alhuwalia, 2002;
Baddeley et al., 2006; Rao et al., 1999; Krishna, 2004; Mallick, 2012). The inflow of private
investment into a state has the potential to generate state income, output, and tax
revenue along with providing employment opportunities to local residents. The direct
tax returns from profitable investment projects (and indirect returns from central
transfers through rising individual incomes within states) have the potential to improve
the fiscal positions of individual states. Growth facilitating private investment is market
oriented and determined by the rate of returns on investment. The introduction of
various economic reform measures in 1991 aggravates the competition for attracting
private investment in a variety of ways. For instance, the abrogation of the Industrial
Licensing Act favours the investors to choose their preferred state among other states as
the investment destination. Further, liberalization measures reduce the degree of control
exercised by the Centre in many areas, leaving much greater scope for state-level
* Assistant Professor at the Institute for Studies in Industrial Development, New Delhi.
E-mail:[email protected]
Acknowledgment: I am thankful to Mr Ramesh Kolli for his valuable suggestions. I also thank Ms
Puja Mehta and Mr Rakesh Kr Gupta for their assistance.

2
initiatives in Indian economy. Further, Bhattacharya et al. (2004) argued that though the
growth rate of GSDP has improved marginally in the post-reform period, at the same
time, regional disparity in SDP has widened more drastically. Industrial states are
growing more rapidly than backward states by attracting investment.
There is rich literature on the patterns and determinants of total private investment at the
national level in the context of Indian economy (see, Mitra, 2006; Atukeren, 2005;
Sundararajan and Thakur, 2005; Pradhan et al., 1990; Wai and Wong, 1992; Serven and
Solimano, 1990 and 1991; Serven, 1998; Rodrik, 1991; Krishnamurty, 1984). Private
investment in India is sourced from both the domestic investors and foreign investors.
The patterns and the determinants of total private investment differs from that of FDI
(Palit, 2007; Sloan-Rossiter, 2008; Chatterjee, 2009; Heshmati and Davis, 2007;
Siddharthan 2009, Vijaykumar etal., 2010; Morris, 2004). Further, the patterns and
determinants of total private investment at the state level are not the same as at the
national level. Reserve Bank of India (RBI) data shows that the share of FDI is about 1 %
and 3 % of gross national product and gross domestic capital formation during the
period 1993–94 to 2004–05 in the Indian economy. Hence, it is expected that the patterns
and determinants of private investment at the state level may not be the same as that for
the national total private investment and FDI at the state level in Indian economy. Each
state of India has its respective role in attracting the private investment into its territory.
Though the federal framework of India causes all states to face certain common
macroeconomic policies such as monetary policy and trade policy, states do retain
extensive control over local administrative regulations, provisioning of infrastructure,
state taxation, and provision of basic social services such as health and education.
Carlberg (1981) and Wilson (1999) argue that the factor prices determine the flow of
capital at the regional level in an economy.
According to Khan and Reinhart (1990) and Khan and Kumar (1997), the elasticity of per
capita income due to per capita private investment is higher than the per capita public
investment in the developing countries, including India. Further, the similar nature of
impact on the income is empirically examined by Mallick (2012) at the sub-national level
in the Indian economy as well. He argued that the marginal productivity of private
capital is more than the public capital at the state level in the Indian market reforms
economy. Hence, the equal distribution of private capital is a policy instrument to
reduce the disparity in economic growth among the states. Barro and Sala-i-Martin (1995)
argued that the imbalanced regional growth can pose a serious threat to economic
development because even small differences in the growth rates, cumulated over a long
period of time, would have a substantial impact on the standard of living of the people.
Similarly, Chowdhury (2003) identified that inequality in any form has a negative effect
on subsequent growth and development and creates economic, social and political

3
tension among the states in India. In fact the flow of private investment is market
oriented and determined by the rate of returns on investment. Further, liberalization has
reduced the degree of control exercised by the Centre in many areas, leaving much
greater scope for state-level initiatives, which facilitates competition among the states in
attracting private investment through various promotional policies and incentives.
Hence, given the role and importance of state level private investment in the post
economic reform years, it is important to examine the patterns and determinants of
investment in manufacturing industries across the states in India. The result of this
analysis will help to design policies to achieve a balanced growth among the states.
Hence, this study seeks to answer the following research questions.
i) How to measure private investment at the state level in Indian economy?
ii) What are the patterns and determinants of private investment among the states in India?
The study comprises six sections. In order to lay the background of the study, Section -I
provides a brief introduction about the study in terms of outlining the emerging issues in
view of the rising growth of private investment and its role in economic growth. In this
context, the study finds out the gaps in the existing literature in the Indian context, and
then tries to fill up the research gaps by setting up clearly defined objectives. Section-II
outlines in detail the conceptual and empirical review of literature, particularly
concerning the measurement and determinants of private investment at the national and
sub-national levels in India. Section-III estimates the private investment for the
manufacturing sector at the state level. Section-IV analyses the trends and patterns of
private investment at the broad industry level, to indicate the strength and weakness
among the states in relation to the inflow of private investment in the manufacturing
sector. Section-V designs the theoretical and empirical framework to explore the
determinant factors of private investment at the state level. Section-VI describes the
methodology and tools for the empirical analysis. Section-VII explains the data sources
and measurement of variables. Section-VIII describes the role of infrastructure in
determining the inflow of private investment into states. Section-IX provides the results
from the empirical analysis to suggest policy for the equitable allocation of private
investment, which will reduce disparities in economic growth across the states. Section-X
summarises the conclusions and policy implications of the study.
II. Review of Literature
The review of literature deals with the measurement of private investment and the
determinants of private investment at the national and sub-national levels, in order to
answer the above research questions. The central statistical organisation (CSO) is the
source for data related to investment and capital stock in India. CSO (1989, 2007) defines

4
investment as the creation of capital or net addition to the stock of capital. Investment is
usually measured by gross capital formation (GCF), which comprises gross fixed capital
formation (GFCF) and change in stocks. CSO estimates capital formation at the national
level through three approaches, i.e. production (or commodity flow), saving (or flow of
funds approach), and expenditure approach. The fluctuating nature of inventories or
change in stocks restricts the researcher to use only GFCF as the measurement of
investment (Khan and Reinhart, 1990; Blejer and Khan, 1984; Wai and Wong, 1982).
Nevertheless, the above national level approaches are not directly applicable at the state
level due to non-availability of data as well. Hence, the Regional Accounts Committee
(RAC) in 1972 recommended compilation of estimates of GFCF only at state level, rather
than compilation of estimates of gross capital formation (GCF)1. Report by National
Statistical Commission headed by Dr C. Rangarajan in August 2001 and High Level
Committee (CSO, 2009) have recommended several measures for improvements in the
state level official estimation of public and private GFCF in India.
CSO (2009), comments that most of the states compile the public GFCF. But, the non-
availability of state-wise details on capital expenditures in private corporate sector and
household sector limits the compilation of estimates of private sector GFCF at the state
level. Although data on GFCF with respect to private corporate sector at national level is
available from the Studies of Company Finances conducted by the RBI, such details
cannot be worked out as companies do not maintain location-wise capital expenditures
in their accounts. In the same way, detailed data on GFCF for the unincorporated
enterprises or household sector is not available, although data for benchmark years for
households is available from the All India Debt and Investment Surveys (AIDIS). In
addition, there are problems with respect to AIDIS results, as investment data from this
survey shows considerable underestimates. Further, at present, the benchmark enterprise
surveys conducted by the CSO/NSSO do not give reliable estimates of GFCF at state
level, due to a variety of reasons.
Generally the state level GFCF is estimated by the directorate of economics and statistics
(DES) of each state viz. Government of Karnataka (2010) and Government of Haryana
(2010) etc. CSO (2009) reviewed the status on the estimation of capital formation at the
state level in India. Both public investment and private investment are estimated in
Andhra Pradesh (AP), Assam (AM), Haryana (HA), Madhya Pradesh (MP), Rajasthan
(RA), Tamil Nadu (TN) and Uttar Pradesh (UP). However, Bihar (BI), Gujarat (GU),
Karnataka (KA), Maharashtra (MR), Odisha (OR) and Punjab (PN) estimate only public
investment. Government of Karnataka (2010) provides the estimates of private
1 An estimation of change in stocks is not conceptually viable or feasible at the state level because
of the open boundaries of the states. The problem is mainly on account of non-availability of
data on goods and services transacted across the state boundaries.

5
investment in aggregate investment across broad sectors from the period 1999–00 to
2008–09. The Karnataka Economic and Political Weekly Research Foundation (EPWRF)
(2003 and 2009) publishes the GFCF at the state level, estimated by DES and others in
India. EPWRF (2003) commented that the details of the actual methods adopted by the
states are not known. Generally, it is believed that the states apply the same broad
methodology as recommended by the sub-group on ‚State Gross Domestic Product and
Expenditure Account‛. But, there are some variations in methods adopted depending
upon the economic structure at a particular point of time and data availability in the
individual states.
The state level private investment in India is estimated by Lakhchaura (2004), CSO
(2009), Mallick (2013) and Rajeswari et al., (2009). Lakhchaura (2004) provides the
estimates of private GFCF from 1993–94 to 1999–2000, CSO (2009) for the year 2004–05
and Rajeswari et al. (2009) for the periods from 1999–2000 to 2005–06 at the current prices.
Mallick (2013) estimates the private GFCF at constant prices (base year 1999–00) over the
periods from 1993–94 to 2004–05. The above estimates cannot be combined with each
other, as they are based on different methodologies, data sets and assumptions.
The existing empirical studies look at the impact of investment on economic growth at
state level and the issue of convergence of per capita income across the states of India
include Baddeley et al. (2006), Rao et al. (1999), Kurian (2000), Aiyer (2001), Marjit and
Mitra (1996), Rao et al. (1999), Dasgupta et al. (2000), Cashin and Sahay (1996), Krishna
(2004) and Nagaraj et al. (2000). These studies provide mixed results on the issue of
convergence of regional growth in India based on different samples of the states over
different time spans. However, due to the unavailability of data on private investment
and public investment, many states used loans extended by financial institutions as
proxy for private investment (Baddeley et al., 2006; Rao et al., 1999), credit from
scheduled commercial banks for private investment (Purfield, 2006), public expenditure
(Rao et al., 1999) and developmental expenditure (Baddeley et al., 2006) for public
investment2. These proxies are poor reflections of the extent of private investment and
public investment at the state level because they exclude loans extended by various non-
financial institutions to private enterprises, foreign investors in the states and public
investment as a part of public expenditure.
Mallick (2011) examines the determinants of aggregate private investment at the state
level by using the fixed effect regression over the period from 1993–94 to 2004–05. He
finds that factors such as income, labour productivity, infrastructure, quality of
2 The status of non-availability of the estimates of private investment at the state level is
highlighted in Lakhchaura (2004), EPWRF (2003 and 2009), Mallick (2008) and Government of
India (2009).

6
governance and economic uncertainty explain the variation in private investment among
the states in India. The use of fixed effect may not be applicable in this context, as private
investment and some of its determinant factors included in the specification have
simultaneous relation. Further, economic uncertainty may not influence the variation of
private investment, as it does not vary much within the Indian economy. Mallick (2012)
examines the impact of private investment on the state level income in India and finds it
to be statistically significant over the periods from 1993–94 to 2004–05. Further, Mallick
(2012) provides the evidence of divergence in per capita income between 1993–94 and
2004–05 across the major Indian states, which does not conform to the prediction of the
neo-classical growth theory. The states with higher initial levels of per capita income
grew faster than states with lower income leading to divergence in per capita income
over time. The findings of the paper corroborates with Rao et al. (1999), who commented
that the divergence in per capita income across Indian states has increased, particularly
since economic liberalisation measures were initiated, which reduced the degree of
control exercised by the Centre in many areas leaving much greater scope for state-level
initiatives and facilitated states to compete with each other in order to attract the market-
determined flow of private investment. Further, without empirical support, they
commented that the regional pattern of allocation of private investment depends upon
resources, institutions, social and economic infrastructure, and policies in Indian
economy. Similarly, Bhattacharya et al. (2004) argued that widening of regional disparity
in the post reform years is due to the inequitable distribution of investment, which is in
turn determined by a variety of reasons, like poor income and infrastructure.
Hence, the estimates of private investment at the state level are limited. The existing
studies provide data on the total private investment (Mallick, 2013; Lakhchaura, 2004;
GOI, 2009; Rajeswari et al., 2009) and agriculture sector (Chand, 2001) at the state level. In
the recent high growth scenario—attributed to the non-agricultural sector in the Indian
economy—we need to estimate the private investment in a prominent sector among the
non-agricultural sectors in the Indian economy. Also, there are few studies that have
dealt with the issue of determinants of private investment at the state level in India, such
as Chand (2001), Purohit and Reddy (1999) and Mallick (2011). Mallick (2011) explains
the determinants of total private investment, whereas others analyse private investment
in the agriculture sector at the state level. Hence, there is need for a state level study on
the estimation of private investment in a prominent sector, and analyse the patterns and
determinants in the Indian economy. The role of manufacturing sector is prominent in
the recent high growth scenario of Indian economy. NAS data shows that the share of
manufacturing industries in total private investment is about to 43 per cent (34 per cent
in the registered manufacturing sector). There is no study on the analysis of private
investment at the state level in Indian economy. Hence, this study chooses the registered

7
manufacturing industries for the detailed analysis to understand the patterns and
determinants of private investment among the Indian states.
In the context of above researchable issues, the objectives of the study are as follows:
i) To estimate the state level private investment in manufacturing sector in the Indian
economy.
ii) To examine the patterns and determinants of state level private investment in
manufacturing sector.
III. Estimation of Private Investment in Indian States
The 20 major states viz. AP, AM, BI, Chhattisgarh (CH), Delhi (DL), GU, HA, Himachal
Pradesh (HP), Jharkhand (JH), KA, Kerala (KE), MP, MR, OR, PN, RA, TN, UP,
Uttaranchal (UTR) and West Bengal (WB) are included in this paper. The time period of
this study starts from 1993–94, as reform policies started influencing the state level
economies from this period. The end of the study period is 2007–08 on the basis of
availability of unit level data of ASI.
The National Accounts Statistics (NAS) of CSO provides data on GFCF at the both
current and constant prices with base year 2004–05 by industry of use. NAS gives data on
GFCF for the entire economy and public sector by industry of use, including the 1-digit
industry code of NIC. The entire manufacturing industry includes the un-registered and
registered sectors. The private investment in the manufacturing industry is the remaining
after deducting the public GFCF from the total GFCF in this sector. The unit level data of
Annual Survey of Industries (ASI) provides the annual data on GFCF in the registered
manufacturing industries by the types of institutions at the current prices. Hence, the
total private GFCF in manufacturing is to be distributed among the states on the basis of
unit level data for the private enterprises, to estimate the private investment in the
manufacturing sector in the Indian states over the period from 1993–94 to 2007–08.
Methodology and Estimates of Private Investment
The study uses the methodology of CSO in defining investment. Investment is measured
as the GFCF, which comprises construction, machinery equipment and computer
software equipment (NAS, 2007, 2010). The study uses both the unit level data of ASI and
the aggregate data of NAS. The indicators related to GFCF in the unit level data are
presented in Appendix Tables A1 and A2. Unit level data of ASI provides the information
on its various blocks. A block provides the PSL No., industry code, description of
industry, state code, district code, sector code (i.e. rural and urban), RO/ SRO code and
the number of units. The PSL No. and industry code are used for the identification of the

8
sample. Block B provides information on the ownership, which categorises all the units
by the ownership. There are 6 types of ownerships, i.e. (1) wholly Central Government,
(2) wholly State and/or Local Govt, (3) Central Government and State and/or Local
Government jointly, (4) joint sector public, (5) joint sector private, (6) wholly private
ownership. The joint sector private and wholly private ownership are considered as
private ownership, while the other four fall in the category of public sector ownership, as
defined by NAS.
The indicators related to GFCF are provided in the C block of unit level data. The
indicators related to the GFCF are presented in Appendix Table A2. Block C provides data
on net value of fixed asset (closing as on), net value of fixed asset (opening as on),
additions during the year due to revaluation and depreciation provided during the year
by types of assets, i.e. land, building, plant & machinery, transport equipment, computer
equipment including software, pollution control equipment and others. As per NAS
(2010), the GFCF is measured as the net fixed capital formation (NFCF) plus the
depreciation. Whereas, NFCF is net value of fixed asset (closing as on) – net value of
fixed asset (opening as on) – addition during the year due to revaluation. Hence, the
GFCF is equal to net value of fixed asset (closing as on) – net value of fixed asset
(opening as on)-addition during the year due to revaluation plus depreciation provided
during the year. Further, except land, all other assets are considered as capital creating
assets (NAS, 2010).
The information in blocks A, B and C are combined over the years from 1993–94 to 2007–
08 to give data on indicators related to GFCF, types of ownerships, types of industries,
states, etc., at the enterprise level. Firstly, private enterprises at the state level are picked
from the data. Then the above methodology is used to estimate the private GFCF for all
the enterprise at the state level. The indicators related to GFCF in the unit level data are
at current prices. Hence, the estimated GFCF is also at current prices. There are various
limitations including the coverage in the unit level data. NAS provides the aggregate of
GFCF for the private sector in India. Hence, the national private GFCF at constant prices
(2004–05=100) is distributed over the states on the basis of their share by using the
estimated private GFCF from the unit level data of ASI. The estimated private GFCF at
constant prices (2004–05=100) is presented in Appendix Table A3.
IV. Trends and Patterns of Private Investment
in Indian States
The states’ share in private investment is presented in Table 1. The entire period of the
study is categorised into two sub periods, i.e. 1993–94 to 1999–00 and 2000–01 to 2007–08.
The first period is considered as the first phase of economic reform, while, the second

9
period is the second phase of economic reform. The table shows the list of top 5 states
that attracted private investment in the first phase: they are MR, GU, TN, UP and KA.
The same group of states remains in the list of top 5 in attracting private investment in
the second phase as well. The list of bottom 5 states in the first phase includes BH, UT,
ASM, CH and DE, while the list of bottom 5 in the second phase includes BH, ASM, DE,
KE and HP. The 4th column of Table 1 presents the state-wise change in rank between the
two periods. The improvement of rank in terms of share of private investment is found in
CH, OD, UT, HA, WB and TN (i.e. from 17th to 9th for CH, from 14th to 8th for OD, from
19th to 15th for UT, from 9th to 7th for HA, 12th to 10th for WB and 4th to 3rd for TN).
However, there is no change in the ranks of MR, GU, KA, AP and BH. The remaining
states experience a decrease in the rank in terms of their share in private investment. The
above results show the indication of structural transformation in terms of private
investment among the Indian states.
Table 1
Share of Private Investment (in %)
State 1993–99 2000–07 Change in rank 1993–2007
MR 22.55 (1) 16.95 (1) 0 18.87 (1)
GU 17.81 (2) 16.88 (2) 0 17.20 (2)
TN 9.26 (4) 12.27 (3) -1 11.24 (3)
UP 9.33 (3) 7.26 (4) +1 7.97 (4)
KA 8.86 (5) 7.11 (5) 0 7.71 (5)
AP 5.40 (6) 5.94 (6) 0 5.75 (6)
HA 3.32 (9) 4.07 (7) -2 3.81 (7)
MP 5.11 (7) 2.46 (13) + 6 3.37 (8)
RA 4.01 (8) 2.80 (11) +3 3.21 (9)
PN 2.07 (10) 2.66 (12) +2 2.46 (10)
WB 1.74 (12) 2.83 (10) -2 2.45 (11)
OD 1.07 (14) 3.14 (8) -6 2.43(12)
CH 0.70 (17) 2.94 (9) -8 2.17 (13)
JH 2.03 (11) 2.05 (14) +3 2.04 (14)
UT 0.17 (19) 1.68 (15) -4 1.16 (15)
HP 1.21 (13) 0.90 (16) +3 1.01 (16)
KE 1.04 (15) 0.84 (17) +2 0.90 (17)
DE 0.91 (16) 0.56 (18) +2 0.68 (18)
ASM 0.33 (18) 0.35 (19) +1 0.34 (19)
BH 0.13 (20) 0.12 (20) 0 0.12 (20)
Major (20) 97.04 93.80 94.91
Source: Author’s calculation
The entire period is categorised into three sub periods of equal length to examine
statistical significance of the structural transformation in private investment among
Indian states. These periods are 1993–94 to 1997–98, 1998–99 to 2002–03 and 2003–04 to

10
2007–08. The descending order ranks of the states in terms of their share in private
investment for the three sub-periods are presented in Table 2. The rank correlation
coefficient between the first period and second period is 0.95, between first period and
third period it declined to 0.85. These correlation coefficients are statistically significant at
1 per cent level of significance. The result indicates that distribution of private investment
among the states in the first period is positively associated with the second period and
third period. However, the degree of association of first period with the second period is
higher than the third period. Fisher’s Z test is used to verify whether the difference in the
degree of association of first with second period and first with third period is statistically
significant. The result of Z test is presented in Table 3. The Z statistics is found to be
statistically significant at 1 per cent level of significance. This indicates that the structural
transformation in private investment across states has taken place and is statistically
significant.
Table 2
Ranking of States in Terms of Share in Private GFCF
State 1993–97 1998–2002 2003–2007
AP 6 7 5
ASM 18 18 19
BH 20 20 20
CH 17 17 8
DE 16 15 18
GU 2 1 2
HA 9 6 7
HP 13 16 16
JH 11 11 15
KA 5 3 6
KE 15 14 17
MP 7 10 12
MR 1 2 1
OD 14 13 9
PN 10 12 11
RA 8 9 10
TN 4 4 3
UP 3 5 4
UT 19 19 14
WB 12 8 13
Note: States are ranked in descending order based on the share in Private GFCF
Sources: Author’s Calculation

11
Table 3
Fisher’s Z test for Equality of Correlation Coefficients
Rank Correlation Coefficients 1993–97
1998–2002 0.953*
2003–2007 0.847*
N 20
Z -2.48*
Note: * indicates statistical significant at 1 per cent level of significance.
Sources: Author’s Calculation using STATA 12.
The above analysis shows that structural transformation in private investment has taken
place among the states in India. Some of the states have improved/deterioted in attracting
the share of private investment during the period from 1993–94 to 2007–08. The
coefficient of variation (CV) measures the scattering of states in terms of their share in
private investment, which is plotted in Figure 1. The CV ranges from 196 to 134 during
this period, which is very high. The trend line analysis shows that there is a negative
trend in CV over the period from 1993–94 to 2007–08. The result indicates that the
scattering of states in terms of share in private investment is very high and decreasing
over this period.
Figure 1
Regional Variation in Private Investment
Source: Author’s Calculation
V. Determinants of Private Investment at State Level
The empirical framework for the analysis of determinants of private investment in
manufacturing sector is based on neoclassical model of inter-regional economic growth
by Carlberg (1981). The model says that inter-regional growth is characterised by free
trade, labour and capital movements. The movement of capital and labour occur through
156
196 177
196 176
153 156 178
214
146
179
150 161
147 134
y = -2.35 * Year + 4875.1
0
50
100
150
200
250
1992 1993 1994 1995 1996 1997 1998 1999 2000 2001 2002 2003 2004 2005 2006 2007
CV Linear (CV)

12
market mechanism by attaining efficiency within the neoclassical framework. Hence, the
movement of capital among the regions of an economy directly varies with the factor
prices across the region. However, due to the diminishing marginal product of capital,
the factor price will be equated across the regions in the long run. The theory is based on
the following assumptions (time subscript ‚t‛ is dropped to simplify the notation):
1) All regions producing a homogenous output (Yi) using two inputs, i.e. capital and labour.
2) A distinct neoclassical technology in each region and spatial diffusion may spread
technological knowledge.
3) Full employment of resources under perfect competition in product and factor markets.
Hence, the regional production function,
),( LKFY iiii (1)
Where, Yi, Ki, Li, and Fi are Aggregate output, stock of capital, labour inputs and neoclassical
technology, respectively, in ‚i‛ region.
Market Allocation
The nation’s endowment in capital K and labour L are given. For simplification, consider
there are two regions in an economy. Then
2
1iiKK and
2
1iiLL . Then, profit
function under perfect competition and full-employment of factor of production for the
region ‚i‛ is:
Qi =Yi – Ki r-Li w (2)
Hence, the first order condition for profit maximization:
r = KY ii and w= LY ii
(3)
Where, KY ii and LY ii
are the marginal product of capital and marginal product
of labour in region ‘i’, respectively. However, the second order condition is satisfied since
neoclassical technology exhibits diminishing return to substitution. The necessary
condition implies that factor prices correspond to marginal products.
Optimal allocation
National output in a two-region economy is ),(2
1 LKF iii iY (4)
Let µ and λ, two lagrangian multipliers, be such that 0≤µ≤1 and 0≤ λ ≤1. Hence, the objective
function is to maximize, Z= ),(2
1 LKF iii i + λ(
2
1iiK -K) +µ(
2
1iiL -L)

13
From the first order condition, rKFKF 2211
(5)
Equation (5) indicates that the market determined rate of return on capital across the
regions maximizes the national optimal output (income) in the long run. In other words,
the market allocation of capital across the regions maximizes or optimises the national
total income, which is efficient. Further, equation (5) indicates that in the long run,
allocation of capital will equate the regions’ marginal product with the factor price.
Hence, higher the factor price or rate of return (r i) in a region, higher will be the capital
inflow into that region.
Hence, it can be written as )(
, rK itif
(6)
The flow of capital depends on the net rate of return which is the rate of return minus the
tax (Wilson, 1999). Wilson (1999) assumes that in an economy using two factors—i.e.
labour and capital for production, while labour is immobile and capital flows from one
region to another—the local governments compete to attract capital into their territories
through tax competition and provision of public goods. The public good (provided to
increase productivity) is financed by imposition of tax on the profit of the capitalist.
Hence, the flow of capital is positively affected by public good and negatively affected by
the imposition of tax. Overall, the flow of capital depends on the after tax rate of return
or net rate of return, which is equalized across the regions in the long run due to the
diminishing marginal product of capital. The firms invest to the point where marginal
product of capital equals the after tax rate of return. In turn, the gross rate of return on
investment depends on the taxation and provision of public goods. The using of taxation
as an instrument to attract private investment is criticised by Kiabel (2003). Kiabel (2003)
argues that the using taxation (i.e. tax incentives and tax cut) as an instrument is not an
efficient strategy to attract private investors. The tax cut and tax incentives may send a
wrong signal to the private investors and make them suspicious of the real intentions of
the host region. Development of infrastructure is a better instrument to encourage
private investors: because it enhances productivity, hence the rate of return on capital.
Particularly, Rao et al. (1999) comment that physical infrastructure is crucial in explaining
the inflow of private investment in Indian states.
Fiscal status of economy influences the inflow of private investors (Kiabel, 2003). The
increase in debt burden or fiscal deficit indicates the increase in tax rate in future, and
reduces the rate of return on private investment. Hence, the fiscal status of the states
negatively affects the inflow of private investment. However, market size is expected to
have a positive influence on the allocation of private investment. The larger the market
size of the host economy, the greater is the possibility of reaping the advantages of the

14
scale economies. This reduces the cost of production and hence increases the rate of
return (Aggrawal, 2005). Further, the availability of finance as the main source of private
investment affects the inflow of private investment positively by increasing the rate of
return on investment through reduced interest rates.
Labour cost is expected to have an adverse impact on the flow of private investment.
High labour cost raises the cost of production. Hence, other things remaining same, it
reduces the rate of return on investment. The unit labour cost is the cost of labour
required to produce one unit of output. It is measured as the ratio of labour
compensation to output from the production process (Erumban, 2009). It indicates that
states with lower unit labour cost are more competitive. Productivity of labour also
explains the variation in private investment across the states. By increasing labour
productivity refers to the entrepreneur’s output will increase while only having the same
number of employees. This causes a lower unit cost per item produced and therefore
greater efficiency. This may allow the entrepreneur to lower the price of its products to
gain more customers and hence enjoy higher profit margins.
The size of the manufacturing sector for the variation in private investment is considered
to be crucial. Manufacturing sector is capital intensive in nature. Hence, higher the
volume of manufacturing sector in a state, higher will be the private investment.
However, the relative share of manufacturing sector to industrial and service sector
presents the structure of economy. That means the structure of economy of a state is also
important in explaining the variation in private investment at state level.
In sum, equation (6) indicates that the inflow of capital depends on the rate of return on
capital. In turn, the rate of return depends on infrastructure, the structure of economy,
tax rate, fiscal status, market size, the labour productivity, labour cost and the availability
of finance (Wilson, 1999; Kiabel, 2003; Aggrawal, 2005; Rao et al., 1999; and Erumban,
2009).
VI. Methodology
The empirical analysis on the determinants of private investment is based on the theory
of Calberg (1981). The analysis includes 20 major states over the period of 1993–94 to
2007–08 by using the panel data model, as it controls the individual heterogeneity of the
States, and has more degree of freedom and efficiency (Baltagi, 2004). This paper uses
GMM estimator, which has been widely employed in recent empirical literatures on
Development Economics due to its advantages3. The methodology of Generalized
3 The GMM panel estimator is good in exploiting the time-series variation in the data, accounting
for unobserved individual specific effects, and therefore providing better control for

15
Method of Moments (GMM) for panel data analysis, proposed by Arellano and Bond
(1991) and further developed by Blundell and Bond (1998), is employed here to control
for endogeneity in our estimations.4 Consider the following model.
itiitit ZXY it
(7)
where, i = 1……………20 and t = 1993–94, 1994–95 ... 2007–08.
Yit is private investment of states, Xit is the vector of strictly exogenous variables, and Zit is
the vector of predetermined and endogenous variables5.
and are the parameters.
i
is the time invariant state specific effect, which captures various characteristics of the
state, which are not observable but have a significant role in inflow of private
investment. itis the error term, with the assumption that
iand it
are
independent for each i over all t, and that there is no autocorrelation in the it.
The Arellano-Bond (1991) and Arellano-Bover (1995)/Blundell-Bond (1998) dynamic
panel estimators are increasingly popular. Both are general estimators designed for
situations with 1) \small T, large N" panels, meaning few time periods and many
individuals; 2) a linear functional relationship; 3) a single left-hand-side variable that is
dynamic, depending on its own past realizations; 4) independent variables that are not
strictly exogenous, meaning correlated with past and possibly current realizations of the
error; 5) fixed individual effects; and 6) heteroskedasticity and autocorrelation within
individuals but not across them. Arellano-Bond estimation starts by transforming all
regressors, usually by differencing, and uses the Generalized Method of Moments
(Hansen, 1982), and so is called Difference GMM. The Arellano-Bover/Blundell-Bond
estimator augments Arellano-Bond by making an additional assumption: that the first
differences of instrument variables are uncorrelated with the fixed effects. This allows the
introduction of more instruments, and can dramatically improve efficiency. It builds a
system of two equations—the original equation as well as the transformed one—and is
known as System GMM. Hence, this study uses the System GMM method for the
empirical analysis.
endogeneity of all the explanatory variables (Beck et al., 2000).
4 For the detailed explanation on the GMM estimator, see, Green (2000, Chapter 11) and
Wooldridge (2002, Chapter 8 and Chapter 14). 5 Predetermined variables and endogenous variables are assumed to be correlated with only past
errors, and both the past and present errors, respectively.

16
VII. Data Sources and Measurement of Variables
The empirical analysis uses private GFCF at constant prices (2004–05=100), as presented
in Appendix Table A3. Following Erumban (2009), productivity of labour is measured as
the output per employed person. Labour productivity is measured as the ratio of gross
value added to the number of persons engaged, sourced from Annual Survey of
Industries (ASI). The values at current prices are deflated using the GSDP deflator of the
manufacturing sector to convert to real prices. Labour cost is sourced from ASI and
converted to constant prices using the GSDP deflator of the manufacturing sector.
Sales tax is used to examine its role in determining the variation in private investment
across the states. The fiscal status of the states is measured by the gross fiscal deficit. The
data on sales tax and gross fiscal deficit are sourced from ‘State Finances: A Budget of
Study’ of RBI. Sales tax and budget at current prices are converted into constant by the
GSDP deflator of economy at the base 2004–05. The state level market size is measured by
the per capita GSDP at constant prices 2004–05, sourced from CSO. The availability of
finance is measured by outstanding credit extended by the scheduled commercial banks
across states, and sourced from ‘Money and Banking’ of CMIE. The current values are
deflated by the GSDP price to convert it into real terms. The structure of economy is
measured by the GSDP in the manufacturing sector at the constant prices 2004–05.
The measurement of physical infrastructure by public and private at the state level is a
difficult task, because of the non-availability of data. Hence, the analysis of this paper
uses total infrastructure, which includes electricity, roadways, railways, telephone
facilities and banks. The status of electricity is broadly measured by the gross generation
of utility electricity and non-utility electricity. The data is sourced from ‘Energy’ of CMIE
(2010 and 2005). Banking infrastructure is measured by the number of the scheduled
commercial banks, which is sourced from ‘Money and Banking’ of CMIE (2010 and 2005).
Road infrastructure for the investor is measured by the urban roads and surfaced roads
in km. The data for road infrastructure indicators are sourced from ‘Infrastructure’ of
CMIE (2010 and 2005). Telecom infrastructure is measured by the number of direct
exchange lines and the number of telephone exchanges. The data for telecom
infrastructure is sourced from ‘Infrastructure’ of CMIE (2010 and 2005). However, the
construction of time series data at the state level is a challenging task, due to the non-
availability of data. Nevertheless, health is the major indicator of social infrastructure.
Hence, the study uses infant mortality rate (IMR) as the measurement of social
infrastructure. Data on IMR is sourced from Ministry of Health and Family Welfare,
Government of India.
17
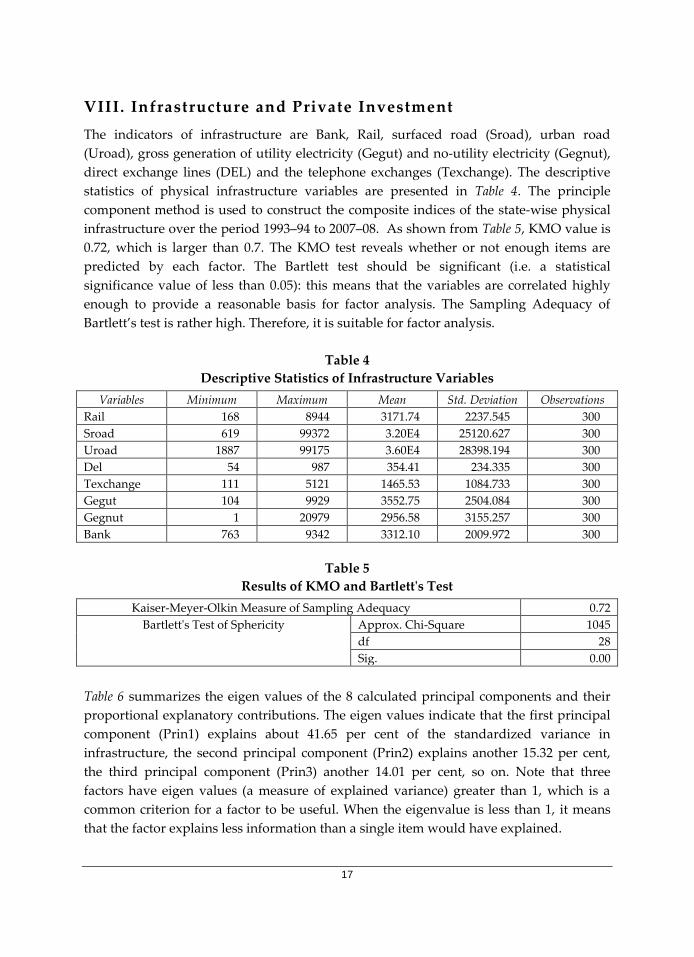
VIII. Infrastructure and Private Investment
The indicators of infrastructure are Bank, Rail, surfaced road (Sroad), urban road
(Uroad), gross generation of utility electricity (Gegut) and no-utility electricity (Gegnut),
direct exchange lines (DEL) and the telephone exchanges (Texchange). The descriptive
statistics of physical infrastructure variables are presented in Table 4. The principle
component method is used to construct the composite indices of the state-wise physical
infrastructure over the period 1993–94 to 2007–08. As shown from Table 5, KMO value is
0.72, which is larger than 0.7. The KMO test reveals whether or not enough items are
predicted by each factor. The Bartlett test should be significant (i.e. a statistical
significance value of less than 0.05): this means that the variables are correlated highly
enough to provide a reasonable basis for factor analysis. The Sampling Adequacy of
Bartlett’s test is rather high. Therefore, it is suitable for factor analysis.
Table 4
Descriptive Statistics of Infrastructure Variables
Variables Minimum Maximum Mean Std. Deviation Observations
Rail 168 8944 3171.74 2237.545 300
Sroad 619 99372 3.20E4 25120.627 300
Uroad 1887 99175 3.60E4 28398.194 300
Del 54 987 354.41 234.335 300
Texchange 111 5121 1465.53 1084.733 300
Gegut 104 9929 3552.75 2504.084 300
Gegnut 1 20979 2956.58 3155.257 300
Bank 763 9342 3312.10 2009.972 300
Table 5
Results of KMO and Bartlett's Test
Kaiser-Meyer-Olkin Measure of Sampling Adequacy 0.72
Bartlett's Test of Sphericity Approx. Chi-Square 1045
df 28
Sig. 0.00
Table 6 summarizes the eigen values of the 8 calculated principal components and their
proportional explanatory contributions. The eigen values indicate that the first principal
component (Prin1) explains about 41.65 per cent of the standardized variance in
infrastructure, the second principal component (Prin2) explains another 15.32 per cent,
the third principal component (Prin3) another 14.01 per cent, so on. Note that three
factors have eigen values (a measure of explained variance) greater than 1, which is a
common criterion for a factor to be useful. When the eigenvalue is less than 1, it means
that the factor explains less information than a single item would have explained.

18
The first three principal components explain about 71 per cent of the standardized variance
in infrastructure. The factor loadings are presented in Table 6. The first principal
component, which explains variations in the value of the dependent variable better than
any other linear combination of explanatory variables, explains 41.65 per cent of variations.
The rotated factor matrix is presented in Table 7. The first factor consists of Bank, Rail,
Telephone exchanges, urban road and gross energy generation (non-utility). The second
factor contains direct exchange lines (DEL) and surfaced road. Finally, the third factor
constitutes gross energy generation (Utility). The first three principal components are used
to construct a single index by using their standardized variance as the weights.
Table 6
Principal Component Analysis: Eigen values, Proportion Explained
Principal Component Initial Eigen values Proportion Explained Cumulative total
Prin1 3.33 41.65 41.65
Prin2 1.23 15.32 56.97
Prin3 1.12 14.01 70.98
Prin4 .88 10.98 81.96
Prin5 .69 8.67 90.63
Prin6 .41 5.08 95.71
Prin7 .23 2.91 98.62
Prin8 .11 1.38 100.00
Table 7
Rotated Factor Matrixa
Variables Prin1 Prin2 Prin3
bank .928 .083 -.066
Rail .919 .125 -.071
Texchange .859 -.002 .194
Uroad .666 .352 -.227
Gegnut .593 -.225 .517
Gegut -.107 .159 .880
DEL .098 .623 .107
Sroad .036 .807 -.027
Extraction Method: Principal Component Analysis.
Rotation Method: Varimax with Kaiser Normalization
a Rotation converged in 6 iterations
Physical infrastructure is the crucial determinant of private investment. The correlation
of private investment with the 8 indicators of infrastructure and infrastructure index is
calculated for the period 1993–94 to 2007–08 across the 20 states. The relationship
between private investment and infrastructure is examined by using panel data, and
presented in Table 8. The correlation of private investment with gross energy generation

19
of utility electricity is found to be highest (0.78), followed by surfaced road (0.69),
telephone exchanges (0.68), direct exchange lines (0.61), and gross energy generation of
non-utility electricity (0.54), bank (0.52), rail (0.45) and others. The correlation of private
investment with the infrastructure index is 0.54.
Table 8
Components of Infrastructure
Rail URoad Sroad DEL Texchange Gegut Gegnut Bank INFRA 0.45 0.01 0.69 0.61 0.68 0.78 0.54 0.52 0.54
However, the nature of relationship of private investment with the infrastructure for the
individual states will be different from the pooled data. The correlation of private
investment with infrastructure is presented in Table 9. For instance, in case of AP,
correlation with urban road is found to be highest (0.85), followed by bank (0.84),
surfaced road (0.83), telephone exchanges (0.72), gross energy generation of utility
electricity (0.66) and others. The development of direct exchange lines and rail could
have raised private investment in AP. Similarly, the development of surfaced road, rail
and telecom infrastructure could have attracted more private investment into Orissa. The
nature of relationship of private investment with infrastructure across states over this
study period is presented in Appendix Table A5.
Table 9
Private Investment and Infrastructure
States Rail URoad Sroad DEL Texchange Gegut Gegnut Bank INFRA
AP 0.35 0.85 0.83 0.32 0.72 0.66 0.07 0.84 -0.13 AM -0.39 0.71 0.76 0.54 0.60 0.03 0.32 0.69 0.30
BI 0.09 0.51 0.59 0.38 0.47 -0.31 0.33 0.78 0.67 Ch 0.18 0.62 0.71 0.63 -0.66 0.30 0.46 0.73 0.54
DE -0.01 0.41 0.01 0.33 0.40 0.36 -0.21 0.45 -0.09 GU 0.15 0.32 0.41 0.29 0.43 0.57 0.66 0.65 0.57
HA 0.13 -0.33 0.84 0.59 0.86 0.83 0.66 0.91 -0.05 HP 0.73 -0.11 0.64 0.21 0.42 0.69 0.13 0.80 0.45
JH 0.51 0.25 0.60 0.42 0.51 0.50 0.11 0.69 0.47 KA 0.17 0.63 0.52 0.47 0.49 0.62 0.51 0.70 -0.48
KE -0.28 0.03 0.64 0.43 0.42 0.60 0.31 0.72 0.14 MP 0.20 0.43 -0.31 0.00 -0.08 0.45 0.28 0.30 0.18 MR 0.72 -0.28 -0.07 0.34 0.29 0.54 0.62 0.68 0.43
OR 0.41 0.48 -0.35 0.53 0.57 0.62 0.83 0.89 0.31 PN 0.42 -0.64 -0.55 0.47 0.62 0.64 0.67 0.88 0.05
RA -0.60 -0.37 0.71 0.28 0.34 0.57 0.63 0.77 -0.44 TN 0.31 -0.39 0.74 0.58 0.69 0.86 0.83 0.94 0.64
UP -0.33 0.36 0.53 0.19 0.32 0.65 0.37 0.78 0.43 UT -0.61 -0.07 0.76 0.45 0.55 0.68 0.72 0.95 0.61
WB 0.22 0.58 0.31 0.66 0.70 0.67 0.64 0.72 0.42

20
IX. Empirical Results and Discussions
Based on the methodology of the GMM estimator, the data on the 20 major states of India
are used to empirically investigate the determinants of private investment (PGFCF) in the
manufacturing sector over the period from 1993–94 to 2007–08. All the determinants are
grouped into infrastructure, economic factors and fiscal factors in the analysis. Economic
factors include market size, the structure of economy (ECST), availability of finance
(AVF), labour cost (LC) and labour productivity (LP). However, infrastructure is
represented through physical infrastructure (INFR) and infant mortality rate (IMR).
While fiscal factor includes the gross fiscal deficit (GFD) and sales tax rate (STR).
However, the market size, measured by the GSDP is determined by private investment.
Hence, there could be simultaneity between private investment and market size in the
regression. Similarly, the inflow of private investment encourages the firms to use
modern labour saving technologies that increase productivity. Therefore, labour
productivity and market size are endogenous in the regressions.
The result of GMM system estimation is presented in Table 10. Firstly, the economic
factors are found to be statistically significant in explaining the variation in private
investment in the manufacturing sector. The estimation shows that the one year lag of
private investment is positive and statistically significant at 1% level in regression. This
suggests that the agglomeration of industries has a positive effect on the inflow of private
investment at the state level in the Indian economy. In our estimation, all economic
factors are found to be statistically significant with the expected signs in regression. The
coefficient of market size is found to be positive and statistically significant at 1% level,
suggesting that states with bigger market size are expected to get higher share of new
investment projects. We find that the availability of finance is statistically significant in
explaining private investment at the state level in Indian economy, which is in line with
the findings at national level studies in Blejer and Khan (1984) and Wai and Wong (1982).
The availability of finance has a positive impact on the inflow of private investment at
the national level. The structure of economy measured by the GSDP of the manufacturing
sector is found to be statistical significant and with the positive signs in the regression.
Therefore, our empirical results show that economic factors are responsible for the
variation in private investment of the manufacturing sector across the Indian states.
Secondly, labour factor, including labour productivity and labour cost, is statistically
significant in explaining private investment in the manufacturing sector across the Indian
states during this period. The coefficient of labour cost is found to be statistically
significant and negative in the estimation result. However, labour productivity is found
to be statistically significant and positive in the regression estimation. Hence, higher the
labour productivity of a state, the higher will be the inflow of private investment into

21
that state. Further, lower the labour cost of a state, the lower will be the inflow of private
investment into that state.
Table 10
System GMM Estimation Results
Independent Variables Dependent Variable: PGFCF
L1. PGFCF 0.42 * (0.05)
Economic Factor
MSZ 0.05* (0.01)
AVF 0.02 *(0.009)
ECST 36262* (6894.8)
Labour Factor
LC -0.000317*** (0.0002)
LP 0.00007* (0.00002)
Infrastructure
PINFR 357.45 (1665.66)
L1. INFR -2194.9 (1879.3)
L2.INFR 2488.5** (1581.38)
IMR -8.65 (33.65)
Fiscal Factor
STR -322.59 (389.05)
GFDR -367.6* (123.92)
Constant -3257.6 (3647.12)
Observation 260
States 20
Instruments 357
Wald chi2(12) 1235.4*
Notes: *, ** and *** indicate statistical significance at 1%, 5% and 10% respectively. The figures in the parentheses are the standard error estimates.
Source: Author’s calculations using STATA 12.
Thirdly, the study includes GFD and STR as the fiscal factors to explain the variation in
private investment in the manufacturing sector across the Indian states over the period
from 1993–94 to 2007–08. The result shows that the coefficient of GFD is negative and
significant at the 1% level in regression, which suggests that private investment is lower
in states with higher GFD and vice versa. Further, the result shows the negative sign of
the sales tax rate and statistically insignificant in determining the private investment in
the manufacturing sector.
Fourthly, infrastructure includes both physical infrastructure and social infrastructure.
Physical infrastructure is found to be positive and significant at 10% level in the
estimation. The states with better infrastructure attract higher private investment in the

22
manufacturing sector than the other states in India. It is important to know that the two
year lag effect of physical infrastructure determines the private investment of the
manufacturing sector across states. The one year lag and the current infrastructure status
do not have any role in the inflow of private investment in the manufacturing sector.
Social infrastructure, represented through the IMR, is found to be statistically
insignificant. The other indicators of social infrastructure could not be used for this study
due to the limited scope for generating the time series data from 1993–94 to 2007–08 for
the major 20 states of India.
In short, agglomeration of industries, economic factor, labour factor, fiscal factor (i.e.
gross fiscal deficit) and infrastructure explain the variation in private investment of the
manufacturing sector in the major Indian states over the period 1993–94 to 2007–08. The
empirical findings of this result are in line with the arguments of Bhattacharya and
Sakthivel (2004) and Ahluwalia (2000). Bhattacharya and Sakthivel (2004) identified
income and infrastructure as the crucial factors for inflow of private investment in the
Indian states. Similarly, Ahluwalia (2000) argued that private investment is potentially
highly mobile across states and is likely to flow to states which have good infrastructure.
X. Conclusions and Policy Implications
This study estimates the private investment of the manufacturing sector at constant
prices (2004–05=100) at the state level by utilising the enterprise level data of ASI with the
national level data and methodology of NAS. The study estimates and analyses private
investment of the manufacturing sector during the period from 1993–94 to 2007–08
covering 20 major states. It is important to note that structural transformation in terms of
private investment across the states occurred during this study period. In other words,
there is increase in the inflow of investment to the poor states during the second phase of
economic reform; as a result, the variation in private investment of the manufacturing
sector across states has a negative trend. Economic factor, labour factor, infrastructure,
fiscal factor and agglomeration are the main determinants of inflow of private investment
in the manufacturing sector at the state level in India. Particularly, one year lag of private
investment, physical Infrastructure, market size, availability of finance, the structure of
economy, labour cost, labour productivity and gross fiscal deficit are statistically
significant in explaining private investment in the manufacturing sector across states in
India. Though the variation in private investment has decreased during this study
period, still it is high to achieve balanced economic growth across the Indian states.
Hence, the policy should be designed by focusing on the above determinant factors to
reduce the inequality in development at the state level in India.

23
APPENDIX
Table A1
Information in Block A and B of ASI Unit Level Data
Block A Block B
1. PSL No. ID
2. Industry Code (5–digit level of NIC–98)
3.Description of Industry Type of ownership (1,2..,6)
Wholly Central Government (1), Wholly State
and/or Local Government (2), Central
Government and State and/or Local
Government jointly (3), Joint Sector Public (4),
Joint Sector Private (5) Wholly Private
Ownership (6)
4.State Code
5. District Code
6.Sector (Rural–1, Urban-2)
7.RO /SRO code
8. No. of Units
Source: Unit level data base of ASI
Table A2
Information in Block C of ASI Unit Level Data
SNo Types of Assets Gross Value (Rs.) Depreciation
(Rs.)
Net Value
(Rs.)
Net Value
(Rs.)
Addition during the year due
to revaluation
Provided during
the year
Opening
as on
Closing as
on
1 Land
2 Building
3 Plant &Machinery
4 Transport equipment
5 Computer equipment
including software
6 Pollution Control
Equipment
7 Others

24
Table A3
Estimates of Private GFCF at Constant Prices (2004–05=100) in Manufacturing Sector
State 1993 1994 1995 1996 1997 1998 1999 2000 2001 2002 2003 2004 2005 2006 2007
AP 5692 3191 6242 6683 8415 8604 6217 4037 2918 7226 7026 9839 15057 23970 24641
AM 455 184 417 386 524 378 404 311 253 527 450 830 730 1489 1031
BI 66 112 126 234 58 157 304 258 131 103 112 133 163 527 545
Ch 616 336 791 705 1627 596 1201 719 382 1149 3360 7455 11450 11708 10600
DE 791 501 990 1049 1618 1505 1102 769 461 1229 787 1402 1366 1329 1510
GU 9375 13308 20468 27870 35594 18352 23546 9018 42142 15541 14728 21485 62224 49879 54140
HA 1599 1774 2559 3715 2953 6050 9048 3705 3725 6575 4634 10141 7866 12241 15994
HP 927 913 1451 1912 2066 1650 1204 759 514 739 952 1119 2908 3552 3887
JH 1038 1748 1967 3660 908 5274 2354 4594 1784 2254 1668 3196 7574 3535 8109
KA 3299 4445 7263 9309 13994 23614 11959 12323 9430 11539 7531 13787 12430 23880 22467
KE 1105 610 1203 1278 1625 1815 1001 761 836 964 1013 1727 1585 2037 4419
MP 4521 2467 5802 5167 11931 7795 4906 2376 1360 2155 2767 5207 5365 7682 12284
MR 13756 19720 27152 41298 34480 25334 26282 14261 9699 18322 34172 37442 38566 56565 61389
OR 1093 230 1130 482 3013 1963 998 1435 3336 1322 1570 2098 13267 8343 18749
PN 1585 1363 2201 2855 2820 3265 3201 1599 1416 5553 2176 5892 5698 8601 11558
RA 2993 2226 3868 4662 5277 4156 10222 2056 2210 2159 3360 5012 6341 7985 15528
TN 7430 6280 9295 13151 7759 16797 16512 12921 5148 13309 18997 27512 30792 34361 52653
UP 9354 4906 9714 10274 12233 24021 7293 5116 5036 6190 11662 12890 19411 21919 33563
UT 191 100 198 210 250 370 125 145 152 569 408 2171 3426 8040 11826
WB 1589 940 1862 1969 2818 2598 2727 4280 10278 2997 2222 4661 5809 6063 8768
Sources: Authors Calculation based on Unit level data of ASI and Aggregate data of NAS

25
Table A4
Linear Trend of Private Investment
State Coefficient of Liner trend Rank
AP 1085.00 4
AM 54.03 18
BI 19.66 20
Ch 799.65 8
DE 34.31 19
GU 2380.00 1
HA 773.49 9
HP 124.33 16
JH 293.10 14
KA 887.38 6
KE 113.44 17
MP 147.46 15
MR 2016.50 3
OR 843.38 7
PN 513.33 11
RA 422.53 12
TN 2376.30 2
UP 1038.80 5
UT 549.89 10
WB 421.63 13
Table A5
Private Investment and Infrastructure over the Periods
Year Rail URoad Sroad DEL Texchange Gegut Gegnut Bank INFRA
1993 0.72 0.16 0.89 0.80 0.78 0.90 0.31 0.77 0.67
1994 0.49 0.03 0.75 0.83 0.67 0.90 0.14 0.54 0.44
1995 0.58 0.15 0.86 0.82 0.74 0.91 0.25 0.61 0.56
1996 0.51 0.09 0.82 0.82 0.72 0.89 0.19 0.55 0.45
1997 0.57 0.02 0.70 0.72 0.74 0.84 0.30 0.56 0.53
1998 0.66 0.07 0.83 0.73 0.82 0.76 0.42 0.78 0.62
1999 0.53 -0.10 0.81 0.77 0.79 0.85 0.31 0.54 0.57
2000 0.47 -0.08 0.76 0.78 0.74 0.79 0.31 0.63 0.56
2001 0.37 -0.14 0.44 0.38 0.49 0.49 0.55 0.28 0.34
2002 0.49 -0.13 0.80 0.81 0.80 0.90 0.49 0.60 0.58
2003 0.52 -0.07 0.83 0.85 0.82 0.81 0.48 0.64 0.68
2004 0.51 -0.18 0.72 0.81 0.78 0.88 0.49 0.61 0.71
2005 0.51 -0.15 0.60 0.55 0.66 0.77 0.84 0.45 0.67
2006 0.55 -0.14 0.72 0.70 0.81 0.92 0.62 0.60 0.71
2007 0.61 -0.14 0.70 0.68 0.78 0.88 0.69 0.64 0.78
Average 0.54 -0.04 0.75 0.74 0.74 0.83 0.43 0.59 0.59

26
References
Ahluwalia, M.S. (2002) ‚Economic performance of states in post reforms period,‛
Economic and Political Weekly, May 6, Pp. 1637–1648.
Aiyer, Shepherd (2001): ‚Growth Theory and Convergence across Indian States: A
Panel Study,‛ Paper 8 in Tim Cullen, Patricia Reynolds and Christopher
Towel,(Eds.) India at the Crossroads: Sustaining Growth and Reducing Poverty,
International Monetary Fund.
Annual Survey of Industries (Various years), Volume-1, Ministry of Statistics and
Programme Implementation, Central Statistical Organisation, Kolkata.
Atukeren, Erdal (2005), ‚Interaction between public and private investment:
evidence from developing countries,‛ Kyklos, Vol. 58, No. 3, Pp. 307–330.
Blejer, Mario I. and Moshin S. Khan (1984), ‚Government Policy and Private
Investment in Developing Countries,‛ IMF Staff Papers, Vol. 31, No. 2, Pp. 379–
403.
Baddeley, M., K. McNay and R. Cassen (2006), ‚Divergence in India: Income
differential at the state level, 1970-97,‛ Journal of Development Studies, Vol. 42, No.
6, Pp. 1000–1022.
Bhattacharya, B.B. and S. Sakhivel (2004), ‚Regional Growth and Disparity in India:
Comparison of Pre-and Post-Reform Decades,‛ Economic and Political Weekly, Vol.
39, No. 10, Pp. 1071–1077.
Baltagi, B.H. (2001) Econometric Analysis of Panel Data, West Sussex PO191UD, John
Wiley & Sons, Ltd., England.
Barro, Robert J. and Xavier Sala-i-Martin (1995), Economic Growth, McGraw-Hill: New
York.
Carlberg, M. (1981), ‚A Neoclassical model of interregional economic growth,‛
Regional Science and Urban Economics, Vol. 11, No. 2, Pp. 191–203.
Chowdhury, Khorshed (2003) ‚Empirics for World Income Distribution: What does
the World Bank Data Reveal?‛, The Journal of Development Areas, Vol. 36, No. 2,,
Pp. 59–83.
CSO (1989; 2007), ‚National Accounts Statistics: Sources and Methods,‛ Ministry of
Statistics and programme implementation, Government of India.
Dasgupta, D., P. Maiti, R. Mukherjee, S. Searcher and S. Chakraverti (2000), ‚Growth
and Interstate Disparities in India,‛ Economic and Political Weekly, July 1, Pp.
2413–2422.
Dollar, D., G. Iarossi and T. Mengistae (2002),‚Investment Climate and Economic
Performance: Some Firm Level Evidence from India,‛ Working Paper No. 143,
Center for Research on Economic Development and Policy Reform, Stanford
University.

27
EPWRF [Economic and Political Weekly Research Foundation] (2003), State Domestic
Products: 1960-61 to 2000-01, Mumbai, India.
Everhart, Stephen S., M A. Sumlinski (2001), ‚Trends in private investment in
developing countries, statistics for 1970-2000 and the impact on private
investment of corruption and the quality of public investment,‛ International
Finance Corporation, Discussion paper No. 44, The World Bank, Washington
DC.
Ferro, M., D. Rosenblatt and N. Stern (2004), ‚Policies for Pro-Poor Growth in India,‛
in Kaushik Basu (Ed.) India’s Emerging Economy,, New Delhi: Oxford University
Press, Pp. 153–183.
Government of Haryana (2009), ‚Estimates of Gross Fixed Capital Formation in
Haryana,‛ Department of Economics and Statistical Analysis.
Government of India (2009), ‚Report of the High Level Committee on Estimation of
Saving and Investment, New Delhi, Pp. 223–232..
Government of Karnataka (2010), ‚Estimation of Public and Private Investments and
Consumption of Goods and Services in Karnataka,‛ Directorate of Economics
and Statistics.
Greene, W.H. (2006), Econometric Analysis, Dorling Kindersley, New Delhi.
Greene, J and D. Villanueva (1991) ‚Private Investment in Developing Countries: An
Empirical Analysis,‛ IMF Staff Papers, Vol. 38, No. 1, Pp. 33–58.
Gujarati, D.N. (1995), Basic Econometrics, Third Edition, McGraw-Hill, International
Editions, Singapore.
Kiabel, B.D. (2003), ‚Corporate tax incentives in Nigeria,‛ American Economic Review,
Vol. 5, No. 1, Pp. 60–70.
Krishna, K.L. (2004), ‚Patterns and determinants of economic growth in Indian
states,‛ Working Paper 144, ICRIER, New Delhi.
Khan, M.S. and M.S. Kumar (1997), ‚Public and Private Investment and The Growth
Process in Developing Countries,‛ Oxford Bulletin of Economics and Statistics, Vol.
59, No. 1, Pp. 69–88.
Krishnamurthy, K. (1984), ‚Inflation and Growth: A Model for India,‛ Indian
Economic Review, Vol. 19, No. 1, reprinted in K. Krishnamurty and V. Pandit,
Macroeconometric Modelling of the Indian Economy, Hindustan Publishing Co.,
1985.
Kurian, N.J. (2000), ‚Widening regional disparities in India; Some indicators,‛
Economic and Political Weekly, February 12, Pp. 538–50.
Lakhchaura,, Prakash (2004), ‚Capital formation at state level,‛ Indian, Ministry of
Statistics and Programme Implementation (mimeo).

28
Mallick, Jagannath (2012), ‚Impact of Private Investment on States Income in India,‛
presented in the 32nd Annual Conference of International Association for
Research on Income and Wealth (IARIW), Boston, USA, August 5–11.
______ (2013), ‚Public expenditure, private Investment and states income in India,‛
forthcoming in the Journal of Development Areas, Vol. 47, No. 2.
______ (2011), ‚Determinants of Private Investment in India: An Application of Panel
Fixed Effect Model,‛ Indian Journal of Economics and Business, Vol. 10 (1).
Marjit, S. and S. Mitra (1996), ‚Convergence in regional Growth Rates: Indian
Research Agenda,‛ Economic and Political Weekly, August 17, Pp. 2239–242.
Mitra, Pritha (2006), ‚Has government investment crowded out private investment
in India?‛ American Economic Review, Vol. 96, No. 2, Pp. 337–341.
Nagaraj, R., A. Varaudakis and M.A. Veganzore (1997), ‚Long Run Growth Trends
and Convergence Across Indian States,‛ Technical Paper, Development Centre
No.131.
Odedokum, M.O. (1997), Relative effects of public versus private investment
spending on economic efficiency and growth in developing countries,‛ Applied
Economics, Vol. 29, No. 10, Pp. 1325–36.
Oshikoya, T.W. (1994), ‚Macroeconomic Determinants of Domestic Private
Investment in Africa: An Empirical Analysis,‛ Economic Development and Cultural
Change, Vol. 42, No. 3, Pp. 573–596.
Pal, P. and J. Ghosh (2007), ‚Inequality in India: A survey of recent trends,‛ Working
Paper Number 45, Department Social and Economic Affairs, United Nations,
New York.
Pradhan, B.K., D.K. Ratha and A. Sarma (1990), ‚Complementarity between public
and private investment in India,‛ Journal of Development Economics, Vol. 33, No. 1,
Pp. 101–16.
Purfield C. (2006), ‚Mind the Gap—Is Economic Growth in India Leaving Some
States Behind?‛ International Monetary Fund, Working Paper No. 103.
Rao, A.S (2004), ‚Inter State Disparities in the Development of Tertiary Sector in
India,‛ Indian Journal of Regional Science, Vol. 36, No. 2, Pp. 93–105.
Rao, M.G., R.T. Shand and K.P. Kalirajan (1999), ‚Convergence of incomes across
Indian states: A divergent view,‛ Economic and Political Weekly, Vol. 34, No. 13,
Pp. 769–778.
Rodrik, D. (1991), ‚Policy uncertainty and private investment in developing countries,‛
Journal of Development Economics, Vol. 36, Pp. 229–243.
Serven, L. and A. Solimano (1990), ‚Private Investment and Macroeconomic
Adjustment in LDCs: Theory, Country experiences and Policy Implications,‛
World Bank No,66, Washington DC.

29
Serven, L. and A. Solimano (1991), ‚Adjustment Policies and Investment
Performance in Developing Countries: Theory, Country Experiences and Policy
Implications," Policy Planning and Research, Working Paper Series 606, World
Bank, Washington DC.
Servén, L. (1998), ‚Macroeconomic Uncertainty and Private Investment in
Developing Countries: An Empirical Investigation,‛ World Bank, WPS 2003,
Washington DC.
Siddharthan, N.S. (2009) “FDI, Determinants, Constraints and impact: India – China
Comparison,‛ in Manmohan Agarwal (Ed.), India’s Economic Future, Social
Science Press, New Delhi, Pp. 71–102.
Sloan-Rossiter, M. (2008), ‚FDI in Three Southern Indian States: Determinants and
Implications for Development,‛ World Outlook: An Undergraduate Journal of
International Affairs, Number 35, Spring.
SIA (1999) Newsletter, Secretariat for Industrial Assistance, Department of Industrial
Policy & Promotion, Ministry of Commerce & Industry, Government of India,
New Delhi, India.
Sundararajan, V. and S. Thakur, (1980), ‚Public investment, Crowding out, and
Growth: A Dynamic Model Applied to India and Korea,‛ IMF, Washington DC,
Vol. 27, No. 3, Pp. 814–55.
Venkatesan, V. and S. Varma (1998), ‚Policy competition among the states in India
for attracting direct investment,‛ NCAER, New Delhi.
Solow, R.M. (1956), ‚A contribution to the theory of economic growth,‛ Quarterly
Journal of Economics, Vol. 38, No. 49, Pp. 5189–5200.
____ (1994), ‚Perspectives on growth theory,‛ Journal of Economic Perspectives, Vol. 8,
No. 1, Pp. 45–54.
Wai, U. Tun. and Chorng-Huey Wong (1982), ‚Determinants of Private Investment
in Developing Countries,‛ The Journal of Development Studies, Vol. 19, No. 1, Pp.
19–36.
Wilson, J.D. (1999), ‚Theories of Tax Competition,‛ National Tax Journal, Vol. 52, Pp.
269–304.

30
List of ISID Working Papers
WP2012/05 Regional Disparities in Growth and Human Development in India, Satyaki Roy
WP2012/04 Social Exclusion and Discrimination in the Labour Market, T.S. Papola
WP2012/03 Changing Factor Incomes in Industries and Occupations: Review of Long Term
Trends, Satyaki Roy
WP2012/02 Structural Changes in the Indian Economy: Emerging Patterns and Implications,
T.S. Papola
WP2012/01 Managing Global Financial Flows at the Cost of National Autonomy: China and
India, Sunanda Sen
WP2011/04 Trends and Patterns in Consumption Expenditure: A Review of Class and Rural-
Urban Disparities, Satyaki Roy
WP2011/03 The Global Crisis and the Remedial Actions: A Non-Mainstream Perspective
Sunanda Sen
WP2011/02 Spatial Organization of Production in India: Contesting Themes and Conflicting
Evidence, Satyaki Roy.
WP2011/01 India’s FDI Inflows: Trends and Concepts, K.S. Chalapati Rao & Biswajit Dhar.
WP2010/12 On the Sustainability of India’s Non-Inclusive High Growth, Surajit Mazumdar
WP2010/11 Operation of FDI Caps in India and Corporate Control Mechanisms, K.S.
Chalapati Rao & Biswajit Dhar.
WP2010/10 Indian Capitalism: A Case That Doesn’t Fit? Surajit Mazumdar.
WP2010/09 Big Business and Economic Nationalism in India, Surajit Mazumdar
WP2010/08 Aligning with both the Soviet Union and with the Pharmaceutical
Transnational’s: Dilemmas attendant on initiating Drug Production in India,
Nasir Tyabji.
WP2010/07 The Arduous Route to ensuring some Minimum Public Shareholding in Listed
Companies, K.S. Chalapati Rao.
WP2010/06 Managing Finance in Emerging Economies: The Case of India, Sunanda Sen.
WP2010/05 Social Science Research in Globalising India: Historical Development and Recent
Trends, T.S. Papola.
WP2010/04 Private Industry and the Second Five Year Plan: The Mundhra Episode as
exemplar of Capitalist Myopia, Nasir Tyabji.
WP2010/03 Trading in India’s Commodity Future Markets, Sunanda Sen and Mahua Paul.
WP2010/02 Industry and Services in Growth and Structural Change in India: Some
Unexplored Features, Surajit Mazumdar.
WP2010/01 Does the Current Global Crisis remind us of the Great Depression? Sunanda Sen.
WP2009/02 Footwear Cluster in Kolkata: A Case of Self-exploitative Fragmentation, Satyaki
Roy.
WP2009/01 Garments Industry in India: Lessons from Two Clusters, Satyaki Roy.
* Already Published. Most of the working papers are downloadable from the institute’s website: http://isidev.nic.in/ or http://isid.org.in/

Institute for Studies in Industrial Development4, Institutional Area, Vasant Kunj Phase II, New Delhi - 110 070
Phone: +91 11 2676 4600 / 2689 1111; Fax: +91 11 2612 2448E-mail: [email protected]; Website: http://isid.org.in
About the ISIDThe Institute for Studies in Industrial Development (ISID), successor to the Corporate Studies Group (CSG), is a national-level policy research organization in the public domain and is affi liated to the Indian Council of Social Science Research (ICSSR). Developing on the initial strength of studying India’s industrial regulations, ISID has gained varied expertise in the analysis of the issues thrown up by the changing policy environment. The Institute’s research and academic activities are organized under the following broad thematic areas:
Industrialization: Land acquisition, special economic zones, encroachment of agricultural land, manufacturing sector, changing organized-unorganised sector relationship, rise of service economy in India, training and skill formation etc.;
Corporate Sector: With special emphasis on liberalization-induced changes in the structures of the sector, corporate governance, individual firms/groups, emerging patterns of internationalization, and of business-state interaction;
Trade, Investment and Technology: Trends and patterns of cross-border capital fl ows of goods and services, mergers & acquisitions, inward and outward FDI etc. and their implications for India’s position in the international division of labour;
Regulatory Mechanism: Study of regulatory authorities in the light of India’s own and international experience, competition issues;
Employment: Trends and patterns in employment growth, non-farm employment, distributional issues, problems of migrant labour and the changes in workforce induced by economic and technological changes;
Public Health: Issues relating to healthcare fi nancing, structure of health expenditure across states, corporatisation of health services, pharmaceutical industry, occupational health, environment, health communication;
Media Studies: Use of modern multimedia techniques for effective, wider and focused dissemination of social science research to promote public debates;
Other Issues: Educational policy and planning, role of civil societies in development processes etc.
ISID has developed databases on various aspects of the Indian economy, particularly concerning industry and the corporate sector. It has created On-line Indexes of 197 Indian Social Science Journals (OLI) and 18 daily English Newspapers. More than one million scanned images of Press Clippings on diverse social science subjects are available online to scholars and researchers. These databases have been widely acclaimed as valuable sources of information for researchers studying India’s socio-economic development.
ISID ISID
CHANGING FACTOR INCOMES IN INDUSTRIES AND OCCUPATIONS
Review of Long Term Trends
July 2012
Working PaperNo: 2012/03
Satyaki Roy
(1,1) -3- WP2012cvr.indd 04/10/2012 14:50:58(1,1) -3- WP2012cvr.indd 04/10/2012 14:50:58