social interactions and returns to farm inputs in
TRANSCRIPT

European Scientific Journal July edition vol. 8, No.15 ISSN: 1857 – 7881 (Print) e - ISSN 1857- 7431
180
SOCIAL INTERACTIONS AND RETURNS TO FARM INPUTS
IN SMALLHOLDER AGRICULTURE IN KENYA
Kamau Gathiaka, PhD
University of Nairobi, School of Economics
Abstract
In this paper, we use OLS, IV-2SLS and Control Function regression methods on cross-sectional
data to analyze effects of social interactions among smallholder farmers in rural Kenya on
demand for fertilizers and on farm yields. The main finding is that social interactions have large
effects on demand for fertilizer and on its return. The interactions are also found to significantly
influence returns to basic farm inputs, notably land, farm equipment, and labor.
Keywords: Smallholder agriculture, social interactions, returns to farm inputs
1.0 Introduction
In smallholder agriculture, farmers do not always possess full information when making
decisions. They partially overcome this problem of information asymmetry by learning from
neighbors, peers or extension officers. The learning takes place during social interactions or from
inferences made from observing other farmers’ production activities. Through such interactions,
a farmer may gather new ideas on farming (Munshi, 2004). This process is known as learning
through word-of-mouth.
In the absence of a local extension agent or an informed farmer to provide precise and
unbiased estimates of expected crop yield, a smallholder farmer may observe his neighbor’s
activities regarding usage of inputs and production of farm produce and form opinions about
particular aspects of farming (Conley and Udry, 2001; Munshi, 2004; Eisenkopf, 2010). Past
observations of a neighbor’s actions regarding inputs usage, e.g., the acreage planted or the

European Scientific Journal July edition vol. 8, No.15 ISSN: 1857 – 7881 (Print) e - ISSN 1857- 7431
181
amount of fertilizer applied and the outcome thereof may provide insights from which current
input decisions can be made. A neighbor’s previous input usage and plot-level outcomes when
observed properly and repeatedly may provide credible basis for social learning by observation
(Munshi, 2004). Thus, neighbors’ experiences with inputs can importantly influence a farmer’s
decision-making process.
In an extreme case, a farmer may make decisions solely on information learnt from
neighbors and completely ignore his own experience or private information (Banerjee, 1992).
Were this to happen, the neighbors’ and the farmer’s own experiences would be perfect
substitutes in the process of making decisions about technology choice.
However, there are cases when a neighbor’s experiences may not be useful to an observing
farmer even though observed. If the neighbors’ decisions are functions of unobserved
characteristics peculiar to him, social learning breaks down because such characteristics are not
available to an observing farmer.
Ellison and Fudenburg (1995) propose a rule of thumb that individuals only learn
gainfully from neighbors with characteristics similar to theirs. If that is the case, then farmers
only learn from peers. Peer farmers are neighbors that a given farmer interacts with. To that
extent, individual characteristics of interacting neighbors are important determinants of an
individual farmer’s knowledge in agriculture and his crop yields (Munshi, 2004).
A farmer may also take into account average village level yields in the past to make
current decisions on input usage on his own plot as well as in updating his own estimates of
expected yields. Thus, neighbors’ experiences with inputs can importantly influence a farmer’s
decision-making process. Their previous decisions and plot-level outcomes may provide credible
basis for social learning when observed properly and repeatedly by a farmer.
In the absence of social learning, a farmer will tend to experiment on his plot in a bid to
generate information that he desires. Social learning, therefore, saves on costs of experimenting.
The disadvantage of social learning is that it curtails generation of new information that could
emerge from further field trials (Munshi, 2004).
In certain situations, a farmer may adopt a new technology, e.g., growing a new maize
variety, just because his neighbors are growing the variety. The farmer is influenced by the
adoption rate in the surrounding area. This behavior is characteristic of social influence (Hogset
and Barret, 2010). Social influence does not entail social learning since the influenced farmer

European Scientific Journal July edition vol. 8, No.15 ISSN: 1857 – 7881 (Print) e - ISSN 1857- 7431
182
lacks details of the technology, and his adoption behavior is based on general perceptions (Foster
and Rosenzweig, 1996).
For social interactions with neighbors to result in social learning, there must be
distinguishable change in a farmer’s productivity (Foster and Rosenzweig, 1996). Social learning
provides positive information externalities that should be reflected in an increase in a farmer’s
productivity. Social interactions occur whenever one farmer in a network affects other farmers’
choices directly without the intermediation of the market (Hartmann et al., 2008). They lead to
social effects on members of a defined group. A reference group in smallholder farming would
be that set of other farmers whose behavior affects the focal farmer. At a micro level, a reference
group could be a neighborhood or a village (Ellison and Fudenburg, 1995).
Foster and Rosenzweig (1995), Conley and Udry (2001), Munshi (2004) and Bandiera
and Rasul (2006) show that a farmer’s initial decision to adopt a new technology is influenced by
decisions taken by others in his or her social network of relatives, friends and neighbors. These
are the individuals with whom a farmer holds strong ties with, and is likely to exchange
information and learn from. The average cumulative experiences of neighbors provide positive
learning externalities or spillovers that impact positively on profit growth in an individual
smallholder farm (Foster and Rosenzweig, 1985).
Although social effects are important in decisions and actions of smallholder farmers
(Gathiaka, 2010), literature on the subject is scant. In addition, many studies fail to control for
social effects when estimating production functions or when calculating returns to farm inputs.
This can introduce bias in the estimated returns (Kimenyi et al., 2006). Estimates of returns to
farming have conventionally measured the marginal value product of an input (Randrianarisoa
and Minten, 2001) and monetary returns for money invested (Farquharson, 2006). While these
conventional measures are by all means useful, they may be biased because they ignore social
interactions and externalities. For example, Farquharson (2006) in simulating wheat production
response to fertilizer does not consider that fertilizer demand may be influenced by social
interactions among farmers.
Previous studies in Kenya have not taken into account the effect of social interactions in
smallholder agricultural production (see for example, Nyangena and Kohlin, 2008; Kabubo-
Mariara, 2010; Kabubo-Mariara et al., 2010). There is need to investigate how input demand and

European Scientific Journal July edition vol. 8, No.15 ISSN: 1857 – 7881 (Print) e - ISSN 1857- 7431
183
returns to farming behave in the presence of social interactions because these social phenomena
are common in farm environments.
This paper builds on available literature by focusing on a sample of smallholder farms in
Kenya with regard to input demands and the returns to the inputs while paying due attention to
social effects. The paper estimates parameters of input demand functions controlling for social
interactions. Social interactions are proxied by average neighborhood variables of fertilizer
usage, animal feeds usage, conservation efforts, soil ridging practices, grass stripping efforts and
property rights bundles.
The rest of the paper is organized as follows. The next section discusses materials and
methods employed in the paper. It also shows the empirical model followed in this paper to
estimate demand for farm inputs and returns to the inputs in smallholder farms while controlling
for social interactions. Part three presents and discusses the estimation results. The last part
summarizes the paper and draws policy conclusions.
2.0 Materials and Methods
The data for this paper were collected from Nyeri County in Central Province of Kenya
between July and September 2007. This County was purposively selected because it has
smallholder farming as the dominant land use activity (Republic of Kenya, 1997; 2002). The unit
of analysis was the household and the data were collected in face-to-face interviews with
farmers. The questionnaire that was used asked questions on farm activities, inputs and their
usage, land tenure, farm output, marketing, infrastructure, and soil conservation practices.
Sample selection was guided by the National Sample Survey and Evaluation Program
(NASSEP) of the Kenya National Bureau of Statistics (KNBS). NASSEP maps the whole
country into enumeration areas (EAs) first, and then classifies them into clusters based on
population density. A cluster contains between 50 and 150 households. Nyeri has three
enumeration areas with 34 clusters, of which 24 are rural and 10 urban. One of the 10 urban
clusters is classified as peri-urban because of its agricultural activities. The sample was drawn
from the 24 rural clusters and from the single peri-urban cluster so that the sampled households
were spread across 25 clusters. The sampling frame was the households list. In each cluster, a
sample of 17 households was systematically selected but in a random fashion to arrive at the
desired sample size of 425 households, consistent with Yamane’s (1967) sample size formula.

European Scientific Journal July edition vol. 8, No.15 ISSN: 1857 – 7881 (Print) e - ISSN 1857- 7431
184
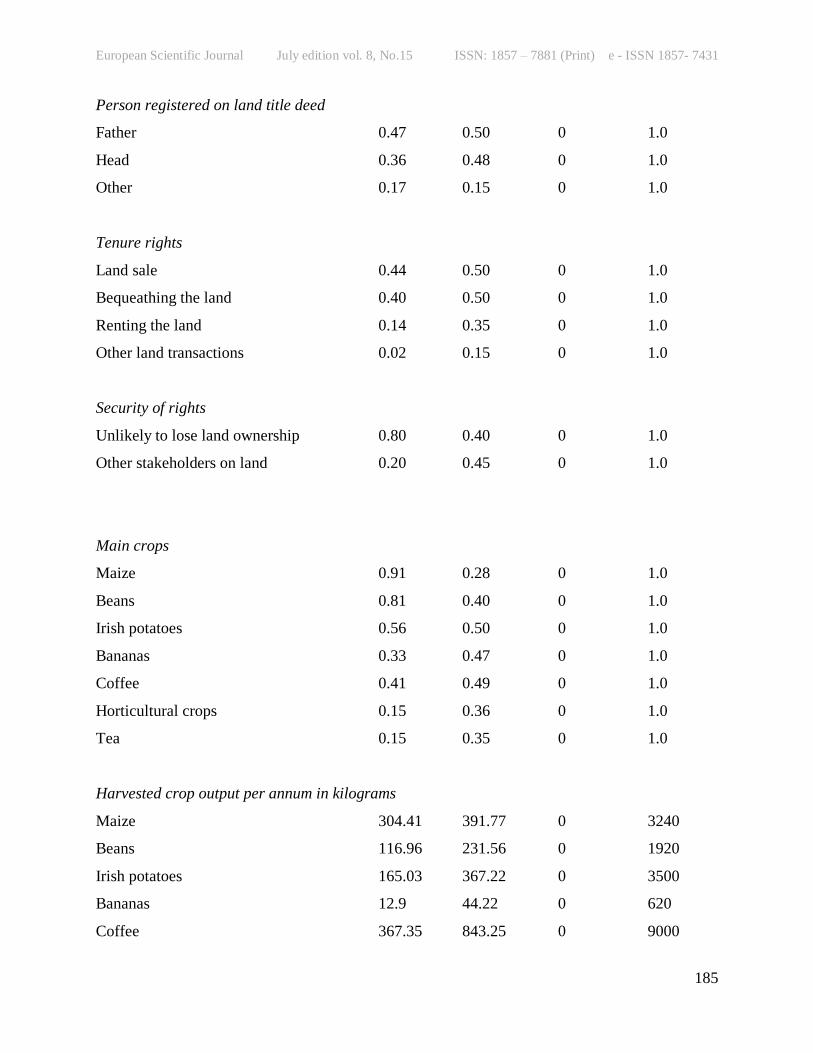
2.1 Descriptive Statistics
Table 1: Characteristics of Smallholder Households and Farms in Nyeri
Variable Mean Std. Dev Min. Max.
Head is male 0.76 0.43 0 1.0
Age of household head 51.00 13.90 16 90
Household size 4.30 1.75 1.0 9.0
Highest level of education of head
No education 0.13 0.34 0 1.0
Primary 0.50 0.50 0 1.0
Secondary 0.31 0.47 0 1.0
Post-secondary 0.05 0.21 0 1.0
Other 0.01 0.08 0 1.0
HH head trained in agriculture 0.15 0.35 0 1.0
Main occupation
Farmer 0.59 0.49 0 1.0
Casual employment 0.13 0.34 0 1.0
General business 0.11 0.31 0 1.0
Formal employment 0.08 0.26 0 1.0
Other 0.04 0.20 0 1.0
None 0.05 0.23 0 1.0
Land ownership and mode of acquisition
Average land holding per head 2.28 3.01 0.08 23
Purchased 0.10 0.30 0 1.0
Inherited 0.80 0.38 0 1.0
Rented 0.01 0.07 0 1.0
Other 0.07 0.26 0 1.0
European Scientific Journal July edition vol. 8, No.15 ISSN: 1857 – 7881 (Print) e - ISSN 1857- 7431
185
Person registered on land title deed
Father 0.47 0.50 0 1.0
Head 0.36 0.48 0 1.0
Other 0.17 0.15 0 1.0
Tenure rights
Land sale 0.44 0.50 0 1.0
Bequeathing the land 0.40 0.50 0 1.0
Renting the land 0.14 0.35 0 1.0
Other land transactions 0.02 0.15 0 1.0
Security of rights
Unlikely to lose land ownership 0.80 0.40 0 1.0
Other stakeholders on land 0.20 0.45 0 1.0
Main crops
Maize 0.91 0.28 0 1.0
Beans 0.81 0.40 0 1.0
Irish potatoes 0.56 0.50 0 1.0
Bananas 0.33 0.47 0 1.0
Coffee 0.41 0.49 0 1.0
Horticultural crops 0.15 0.36 0 1.0
Tea 0.15 0.35 0 1.0
Harvested crop output per annum in kilograms
Maize 304.41 391.77 0 3240
Beans 116.96 231.56 0 1920
Irish potatoes 165.03 367.22 0 3500
Bananas 12.9 44.22 0 620
Coffee 367.35 843.25 0 9000

European Scientific Journal July edition vol. 8, No.15 ISSN: 1857 – 7881 (Print) e - ISSN 1857- 7431
186
Horticultural crops 620.00 3018.08 0 40000
Tea 694.68 7506.33 0 150000
Quantity of selected farm inputs
Family labor, person-days 137 154 0 954
Hired labor, person-days 22.5 64.3 0 587
Manure, kilograms 1,597 2,530 0 21,000
Fertilizer, kilograms 45.9 72.6 0 600
Erosion control practices
Plot with some conservation 0.60 0.49 0 1.0
Terraces 0.18 0.39 0 1.0
Planted trees 0.03 0.17 0 1.0
Ridging 0.20 0.39 0 1.0
Grass strips 0.30 0.45 0 1.0
Other practices
(e.g., mulch, fallow, etc.)
0.07 0.25 0 1.0
Nature of the practices
Short term investments 0.46 0.50 0 1.0
Long term investments 0.54 0.50 0 1.0
Mineral addition practices
Fertilizer use 0.17 0.37 0 1.0
Manure use 0.17 0.38 0 1.0

European Scientific Journal July edition vol. 8, No.15 ISSN: 1857 – 7881 (Print) e - ISSN 1857- 7431
187
Neighborhood variables
Mean fertilizer usage in a village,
kilograms
46.0 27.45 2.31 130.06
Mean of grass stripping practices at the
village (1=stripping)
0.287 0.157 0 0.5
Mean of soil ridging practices at the
village (1= ridging)
0.185 0.145 0 0.5
Common property rights regime in a
village (1,2…n), where n = private
2.955 0.537 1.438 4.2
Distance to the nearest infrastructure in kilometers
Market centre 3.0 2.44 .01 16
All-weather road 1.67 2.20 0 15
Tarmac road 4.18 4.89 .01 30
Cooperative society 5.4 7.62 .01 60
2.2 Empirical model
In farm production, observable as well as unobservable inputs determine output level.
While observable inputs are clearly understood and have a market value, unobservable inputs are
not. Unobservable inputs may relate to a farmer’s own characteristics or to neighborhood
behavior (with regard to production choices), exogenous attributes of the neighborhood and to
personal characteristics of the neighbors. The linear-in-means model can capture the effect of
observable as well as unobservable inputs in a production function.
2.3 The linear-in-means model
Following Halliday and Kwak (2007), Gaviria and Raphael (2001) and Fletcher (2010),
the linear-in-means model was modified to show the crop output of farmer i in village s as
follows:
Yis = a0 + a1Xi + a2 is + a4Fi + a4Wi + a5Vi i……………………… (1)
where,
European Scientific Journal July edition vol. 8, No.15 ISSN: 1857 – 7881 (Print) e - ISSN 1857- 7431
188
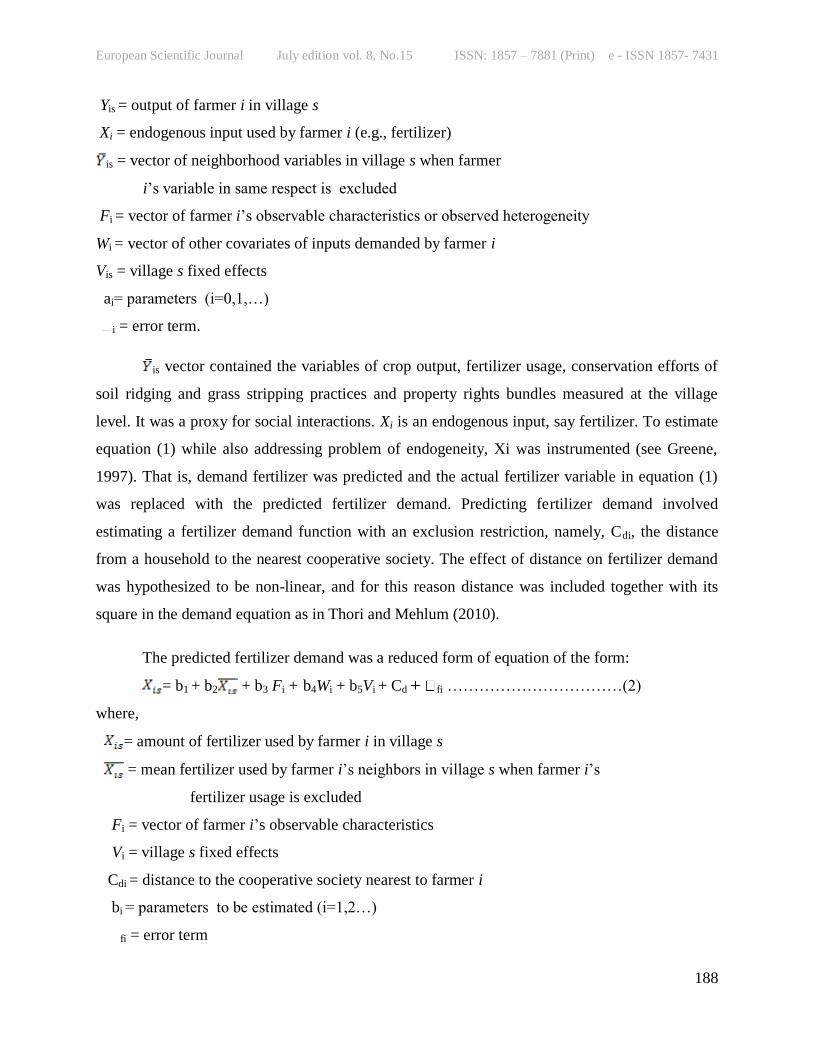
Yis = output of farmer i in village s
Xi = endogenous input used by farmer i (e.g., fertilizer)
is = vector of neighborhood variables in village s when farmer
i’s variable in same respect is excluded
Fi = vector of farmer i’s observable characteristics or observed heterogeneity
Wi = vector of other covariates of inputs demanded by farmer i
Vis = village s fixed effects
ai= parameters (i=0,1,…)
i = error term.
is vector contained the variables of crop output, fertilizer usage, conservation efforts of
soil ridging and grass stripping practices and property rights bundles measured at the village
level. It was a proxy for social interactions. Xi is an endogenous input, say fertilizer. To estimate
equation (1) while also addressing problem of endogeneity, Xi was instrumented (see Greene,
1997). That is, demand fertilizer was predicted and the actual fertilizer variable in equation (1)
was replaced with the predicted fertilizer demand. Predicting fertilizer demand involved
estimating a fertilizer demand function with an exclusion restriction, namely, Cdi, the distance
from a household to the nearest cooperative society. The effect of distance on fertilizer demand
was hypothesized to be non-linear, and for this reason distance was included together with its
square in the demand equation as in Thori and Mehlum (2010).
The predicted fertilizer demand was a reduced form of equation of the form:
= b1 + b2 + b3 Fi + b4Wi + b5Vi + Cd fi ……………………………(2)
where,
= amount of fertilizer used by farmer i in village s
= mean fertilizer used by farmer i’s neighbors in village s when farmer i’s
fertilizer usage is excluded
Fi = vector of farmer i’s observable characteristics
Vi = village s fixed effects
Cdi = distance to the cooperative society nearest to farmer i
bi = parameters to be estimated (i=1,2…)
fi = error term
European Scientific Journal July edition vol. 8, No.15 ISSN: 1857 – 7881 (Print) e - ISSN 1857- 7431
189
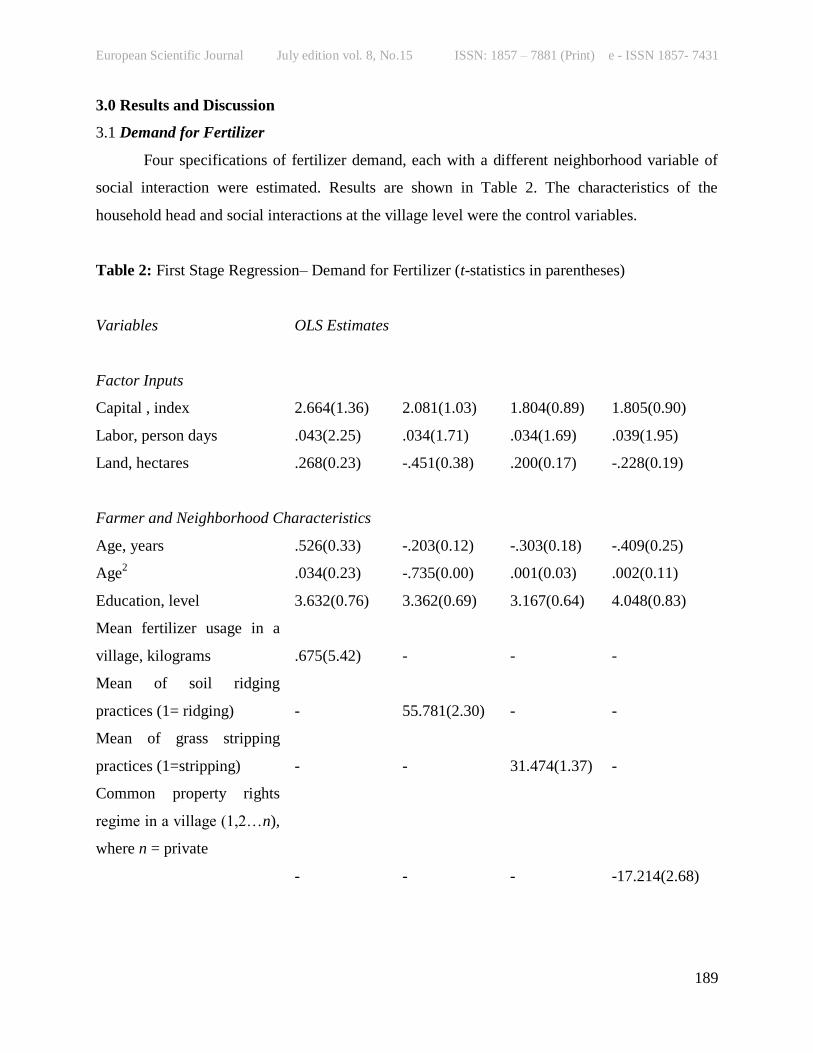
3.0 Results and Discussion
3.1 Demand for Fertilizer
Four specifications of fertilizer demand, each with a different neighborhood variable of
social interaction were estimated. Results are shown in Table 2. The characteristics of the
household head and social interactions at the village level were the control variables.
Table 2: First Stage Regression– Demand for Fertilizer (t-statistics in parentheses)
Variables OLS Estimates
Factor Inputs
Capital , index 2.664(1.36) 2.081(1.03) 1.804(0.89) 1.805(0.90)
Labor, person days .043(2.25) .034(1.71) .034(1.69) .039(1.95)
Land, hectares .268(0.23) -.451(0.38) .200(0.17) -.228(0.19)
Farmer and Neighborhood Characteristics
Age, years .526(0.33) -.203(0.12) -.303(0.18) -.409(0.25)
Age2 .034(0.23) -.735(0.00) .001(0.03) .002(0.11)
Education, level 3.632(0.76) 3.362(0.69) 3.167(0.64) 4.048(0.83)
Mean fertilizer usage in a
village, kilograms
.675(5.42)
-
-
-
Mean of soil ridging
practices (1= ridging)
-
55.781(2.30)
-
-
Mean of grass stripping
practices (1=stripping)
-
-
31.474(1.37)
-
Common property rights
regime in a village (1,2…n),
where n = private
-
-
-
-17.214(2.68)

European Scientific Journal July edition vol. 8, No.15 ISSN: 1857 – 7881 (Print) e - ISSN 1857- 7431
190
Exclusion Restrictions
Distance to a cooperative
society
-3.603(3.75)
-3.396(3.41)
-3.570(3.58)
-3.510(3.55)
Distance to a cooperative
society squared
.097(4.55)
.095(4.35)
.098(4.45)
.093(4.23)
Constant
28.389(0.67)
45.529(1.04)
50.896(1.16)
111.047(2.35)
R2 .125 0.0739 0.066 0.079
F-statistic [p-value] 6.550[0.000] 3.65[0.000] 3.25[0.001] 3.93[0.000]
Root MSE 68.619 70.644 70.933 70.404
Observations 423 423 423 423
The estimation results show that fertilizer demand is positively associated with labor and
neighborhood variables, proxied by the means of fertilizer usage, soil conservation efforts and
property rights within a village. An increase in labor endowment at the household by one person-
day is associated with an increase in fertilizer application on a plot of 0.043 kilograms. The
social effects of fertilizer usage and soil ridging are positive. A rise in the mean fertilizer usage at
the village level by one kilogram encourages an observing farmer within the village to increase
his own fertilizer usage by close to 0.7 of a kilogram. This finding is suggestive of social
learning among farmers and of positive social information externalities within the village.
An increase in distance to the nearest cooperative society reduces demand for fertilizer.
For every kilometer increase in distance to a cooperative society, a farmer reduces the annual
demand for fertilizer by 3 kilograms. Long distances to cooperative societies which are the main
sources for farm inputs in rural areas discourage fertilizer usage.
A unit change in the property rights regime in the direction of private ownership reduces
fertilizer demand by 17 kilograms. In smallholder agriculture farmers often use organic manure
rather than inorganic fertilizer when they are certain of using a plot for a long period of time. Use
of manure is advantageous in that soil fertility and water retention lasted for a longer period. The
results suggested that private rights regimes reduced plot level application of fertilizers.

European Scientific Journal July edition vol. 8, No.15 ISSN: 1857 – 7881 (Print) e - ISSN 1857- 7431
191
The same analysis was performed as in Table 2, but entering the basic farm inputs into
the fertilizer demand equation separately in an attempt to control for any multicollinearity among
them. The results were the same as in Table 2 showing that multicollinearity was not a problem
in this specification.
Characteristics of household heads did not influence demand for fertilizer in any
systematic way. The result was consistent with Akwasi’s (2010) finding that household
characteristics, including basic education do not affect fertilizer demand.
3.2 Returns to farm inputs
In crop production, some inputs are basic to all farmers while others are not. Every
farmer uses some form of farm equipment, labor and land in production so that these factors are
basic farm inputs. In contrast, only some of farmers use fertilizers.
Table 3 presents estimated returns to farm inputs. The dependent variable is log of crop
output in kilograms.

European Scientific Journal July edition vol. 8, No.15 ISSN: 1857 – 7881 (Print) e - ISSN 1857- 7431
192
Table 1: Parameter Estimates of Crop Production Function (fertilizer is the endogenous input)
Variables
Dependent Variable is Log Crop Output
OLS Estimates
IV-2SLS
Estimates
Control Function
Estimates
Factor Inputs
Fam equipment, capital .056(3.21) .046(2.39) .046(2.55)
Labor*10-1
.004(2.09) .002(1.00) .002(1.18)
Land .024(2.39) .022(2.04) .023(2.26)
Fertilizer*10-1
.006(1.38) .040(1.93) .045(2.27)
Farmer and Neighborhood Characteristics
Age -.012(0.82) -.010(0.65) -.009(0.67)
Age2*10
-1 .001(0.85) .001(0.71) .001(0.73)
Education .013(0.31) -.006(0.13) -.008(0.19)
Mean fertilizer used by neighbors
within a village
.005(4.54)
.003(2.00)
.003(1.68)
Controls for Unobservables
Reduced-form fertilizer residual - - -.004(1.75)
Fertilizer*reduced-form residual*10-3
- - -.003(1.02)
Constant 9.061(24.39) 9.017(22.53) 8.996(24.20)
R2 0.1152 . 0.1244
F-statistic
[p-value]
6.74
[0.000]
6.09
[0.000]
5.86
[0.000]
Root MSE .607 .652 .605
Observations 423 423 423
(Absolute t Statistics in Parentheses)
European Scientific Journal July edition vol. 8, No.15 ISSN: 1857 – 7881 (Print) e - ISSN 1857- 7431
193
The OLS estimates show that controlling for neighborhood effects in fertilizer usage,
returns to factor inputs with the exception of returns to fertilizer are statistically significant at the
5 percent level. In IV-2SLS estimation, capital, land, fertilizer and mean fertilizer usage are the
most important determinants of crop production. The latter results are more credible and indicate
that controlling for endogeneity matters in estimations of returns to farm inputs. When
endogeneity and the effects of village level fertilizer are accounted for, returns to fertilizer are
estimated at 0.4 percent. The coefficient on reduced-form residual is statistically significant
confirming that fertilizer is indeed endogenous to crop production.
Since the coefficient on the reduced form fertilizer residual interacted with fertilizer
variable is not statistically significant, heterogeneity is not a problem and thus, the control
function estimates were not an improvement over the IV estimates. Multicollinearity among
basic farm inputs is also not a problem in this specification.
Fertilizer usage at the village influences individual farmer’s demand for fertilizer and this
in turn influences crop yields. Table 4 shows additional estimation results.

European Scientific Journal July edition vol. 8, No.15 ISSN: 1857 – 7881 (Print) e - ISSN 1857- 7431
194
Table 4 Production effects of soil conservation and property rights (t- statistics in parentheses)
Variables
Dependent Variable is Log Crop Output
Soil ridging Grass strips Property rights
Factor Inputs
Capital .046(2.40) .038(2.12) .040(2.09)
Labor*10-2
.016(0.84) .028(1.50) .013(0.69)
Land .019(1.78) .013(1.23) .018(1.66)
Fertilizer*10-1
.039(1.90) .029(1.53) .044(2.01)
Farmer and Neighborhood Characteristics
Age -.008(0.55) -.009(0.60) -.008(0.50)
Age2*10
-3 .083(0.59) .097(0.73) .079(0.56)
Education -.008(0.18) .008(0.19) -.014(0.30)
Mean of soil ridging
effort by neighbors
within a village (1=soil
ridging)
.431(1.74)
-
-
Mean of grass stripping
efforts by neighbors
within a village
-
-.958(4.78)
-
Property rights held by
neighbors in a village
-
-
.176(2.40)
Constant 9.059(22.43) 9.407(24.43) 8.586(17.35)
R2 . 0.080 .
F-statistic [p-value] 4.380[0.000] 6.080[0. 000] 3.59[0.001]
Root MSE .652 .619 .661
Observations 423 423 423
Village level soil conservation efforts have mixed effects on returns. While average soil
ridging in a village has a positive effect on returns, grass stripping has a negative effect. In either
case, the coefficients on social interaction variables are significant indicating evidence of social

European Scientific Journal July edition vol. 8, No.15 ISSN: 1857 – 7881 (Print) e - ISSN 1857- 7431
195
effects. Soil ridging efforts in a village are positively associated with higher levels of crop
production. A 10 percentage increase in the proportion of farmers engaged in this practice is
associated with an increase in crop output of 4.31 percent. The result suggests that there are
positive production social effects in a village stemming from farmers that practice soil ridging.
This finding contrasts with the case of grass stripping, where estimates show that when grass
stripping by neighbors increases, crop output on individual plots declines.
Soil ridging by neighbor farmers effectively checks soil erosion leading to positive
externalities to non-conserving farmers and raising plot level productivity. In contrast, depending
on how they are constructed, grass strips may not be effective in controlling soil erosion, and
erosion downstream during heavy rains may occur in spite of their presence. This may lower
productivity in the eroded farms.
Further, if a farmer observes his neighbors’ grass strips and plants the same in his farm,
the strips may compete for space with crops and reduce yields. This however might be a short-
run result because in the long run, the grass strips control erosion and crop output may increase.
Existing studies show that soil conservation is a boost to crop production (Kabubo-Mariara,
2010; Kabubo-Mariara et al., 2010)
The property rights held by neighbors tended to private ownership of land. Private
ownership bestowed on plot owners “full” or “complete” land rights bundle, i.e., right of access,
right of withdrawal, right of management, right of exclusion and right of alienation (Demsetz,
1967). The social effect of these property rights on demand for fertilizer was negative but
positive in the case of crop production. As already noted farmers tended to apply manure in plots
that they were sure to cultivate for a long time and this had several benefits that increased yields.
Secure property rights have been observed to encourage more investments by way of inputs thus
affecting yields (Kabubo-Mariara, 2007; 2010; Kabubo-Mariara et al., 2010).
If the prevalent land tenure in a neighborhood is private property, it may, under certain
assumptions suggest that most farmers have the incentive to practice good farming techniques
and to invest in conservation (Fenske, 2011). A farmer in a neighborhood no matter his tenure
system receives spillover benefits in form of demonstration effects. For a given level of inputs,
productivity can be expected to be higher due to demonstration effects of good farming practices.
A private land tenure system creates positive social effects while common property and poorly
defined regimes may be associated with negative social effects.

European Scientific Journal July edition vol. 8, No.15 ISSN: 1857 – 7881 (Print) e - ISSN 1857- 7431
196
Information on responsiveness of crop output to changes in factor inputs is important in
policy formulation. It is useful in making decisions regarding optimal factor inputs. The section
that follows looks at the issue of the elasticity of crop output with respect to factor inputs,
highlighting the policy value of the relationship.
3.3 Crop output elasticities
Table 5 presents estimates of the responsiveness of crop output to changes in factor
inputs and to neighborhood variables based on results reported in Tables 3 and 4.
Table 0 Elasticities of Crop Output
Variable Elasticity
Farm equipment 0.081
Labor 0.048
Land 0.060
Fertilizer usage, own farm 0.206
Fertilizer usage by neighbors 0.131
Grass stripping by neighbors 0.272
Soil ridging by neighbors 0.078
Property rights 0.508
Crop output is inelastic with respect to changes in the factor inputs and to variations in
neighborhood variables. This is a pointer to low demand for inputs at the farm level. With regard
to land, the results suggest that soils are over cultivated without adequately replenishing lost soil
nutrients. Thus, an increase in cultivated area does not automatically translate to higher crop
yields.
The poor response of crop output to changes in fertilizer suggests that the amounts of
fertilizer used in the farms are too low such that any increases in the amount used do not reach
the threshold of nutrients required for healthy plant growth. This is consistent with the findings
of Kelly (1995) in a study of fertilizer application in smallholder farms in sub-Saharan Africa,
and those of Jha and Hojjati (1993) with regard to the same in Zambia.
European Scientific Journal July edition vol. 8, No.15 ISSN: 1857 – 7881 (Print) e - ISSN 1857- 7431
197
The capital equipments in the smallholder farms studied are rudimentary and any change
in their demand could not make any change on crop yield. Without proper complementary
inputs, any change in labor demand could also not change crop yield.
In smallholder agriculture in the studied area family labor, traditional seeds and farming
methods (e.g., hand digging) dominate. Timely land preparation and weeding using a hand hoe is
difficult. The quantities of fertilizer used particularly on food crops are quite low or none at all as
was observed in most of the farms. Agriculture in these smallholder farms was largely rain-
dependent and crop response was bound to be poor in the cases of rain failure.
Due to low response of output to changes in inputs, a decline in, say, wage rate relative to
crop output price cannot attract significant labor on the farm (Hayami, 1969). Low crop response
discourages increased input usage at the farm level.
In smallholder agriculture, as land becomes scarce, and as the price of fertilizer relative to
price of land continues to decline, the use of fertilizer and of fertilizer-responsive crops
particularly the high breed varieties can be expected to increase. Factor substitution can be
encouraged along the isoquant of a meta-production function as happened in Japan (Hayami,
1969).
With a fixed supply of land, opportunities for higher yields from land lie in combining it
with factors that push up crop production functions, such as fertilizer. This is a prudent farming
strategy because crop elasticity with respect to land is 0.06, compared with a fertilizer elasticity
of 0.206 percent. Crop increments are highest for investments in grass strips, but their
productivity benefits seem to lie in the future. Crop expansion also responds strongly to property
rights that give farmers complete control of their plots.

European Scientific Journal July edition vol. 8, No.15 ISSN: 1857 – 7881 (Print) e - ISSN 1857- 7431
198
4.0 Conclusion
This paper has investigated the extent to which village-level variables influence farm
decisions regarding inputs usage, and how social interactions affect returns to inputs in
smallholder agriculture in Kenya. Towards this end, parameters of farm input demand functions
and farm production functions were estimated controlling for the effects of social interactions.
Smallholder farmers operate in a social context. Using fertilizer as special case of more
general situations, the paper shows that social interactions matter in smallholder agriculture.
Beegle and Dercon (2007) found similar results in their study of banana growing in Tanzania.
Social interactions directly influence demand for inputs and have large impacts on returns to
inputs at the plot level. The effect of the social interactions on an individual farmer (through
social learning and peer pressure) is evident, but the paper was unable to separate out the the two
effects. Usage of farm inputs is correlated with property rights regime at the village level. The
dominant property rights regime in a village and soil conservation significantly influences crop
production.
The property rights that give farmers ownership of their plots are associated with
increases in crop production. Although property rights go beyond mere possession of title deeds,
these documents may be necessary for long-term investments in soil conservation. Easing the
legal and regulatory framework to enable households acquire property rights would improve soil
conservation practices and raise farm output.
Farm output in smallholder agriculture is inelastic with respect to changes in farm inputs.
This finding suggests that farm inputs would have to increase considerably before appreciable
increases in farm output can be noticed. With declining land holdings and productivity in
smallholder agriculture, farmers can gain a lot by using inputs that are known to raise output, the
prime examples being fertilizers and improved land husbandry practices.
References:
Akwasi, M. (2010). Price and Non-price Determinants of Farm Household Demand for
Purchased Inputs: Evidence from Northern Ghana. Journal of Development and Agricultural
Economics, 2,22,054-064.
Banerjee, A.V. (1992). A Simple Model of Herd Behavior. The Quarterly Journal of Economics,
117,3,797-817.

European Scientific Journal July edition vol. 8, No.15 ISSN: 1857 – 7881 (Print) e - ISSN 1857- 7431
199
Bandiera, O. and Rasul, I. (2006. Social Networks and Technology Adoption in Northern
Mozambique. Economic Journal, 116, October,869-902.
Conley, T. and Udry, C. (2001). Social Learning through Networks: The Adoption on New
Agricultural Technologies in Ghana. American Journal of Agricultural Economics, 83,3,668-
673.
Demsetz, H. (1967). Towards a Theory of Property Rights. American Economic Review, Papers
and Proceedings, 57, 2,347-359.
Eisenkopf, G. (2010). Peer Effects, Motivation, and Learning. Economics of Education Review,
29,364-374.
Ellison, G. and Fudenberg, D. (1995). Rules of Thumb of Social Learning. Quarterly Journal of
Economics, 110, 93-125.
Farquharson, R. J. (2006). Production Response and Input Demand in Decision Making:
Nitrogen Fertilizer and Wheat growers. Australasia Agribusiness Review 14, 5,
http://www.agrifood.info/review/.
Fenske, J. (2011). Land Tenure and Investment Incentives: Evidence from West Africa. Journal
of Development Economics, 95, 2,137-156.
Fletcher, J. (2010). Social Interactions in Smoking: Evidence using Multiple Student Cohorts,
Instrumental Variables, and School Fixed Effects. Health Economics, 19, April, 466-484.
Foster, A. D. and Rosenzweig, M. R. (1995). Learning by Doing and Learning form Others:
Human Capital and Technical Change in Agriculture. Journal of Political Economy, 103, 6,1176-
1209.
Gathiaka, J. K. (2010). Social Interactions in Agriculture. Concepts, Measurement and
Application. Berlin: VDM Verlag.
Gaviria, A. and Raphael, S. (2001). School-based Peer Effects and Juvenile Behavior. The
Review of Economics and Statistics, 83, 2,257-268.
Greene, W. H. (1997). Econometric Analysis. New Delhi: Prentice-Hall Inc.
Halliday, T. J. and Kwak, S. (2007). Bad Apples, Goody Two Shoes and Average Joes: The Role
of Peer Group Definitions in Estimation of Peer Groups. Journal of Economic Literature, I, 12-
120.

European Scientific Journal July edition vol. 8, No.15 ISSN: 1857 – 7881 (Print) e - ISSN 1857- 7431
200
Hartmann, W. R., Manchanda, P., Nair, H., Bothner, M., Dodds, P., Godes, D. and Hosanagar,
K. (2008). Modeling Social Interactions: Identification, Empirical Methods and Policy
Implications. Market Lett, 19,287-304.
Hayami, Y. (1969). Resource Endowments and Technological Change in Agriculture: United
States and Japanese Experiences in International Perspectives. American Journal of Agricultural
Economics, 51, 5,1293-1303.
Hogset, H. and Barrett, C. B. ( 2010). Social Learning, Social Influence and Projection
Bias: A Caution on Inferences Based on Proxy-Reporting of Peer Behavior. Economic
Development and Cultural Change, 58, 563-89.
Jha, D. and Hojjati, B. (1993). Fertilizer Use on Smallholder Farms in Eastern Province, Zambia.
Research Report 94, Washington: IFPRI.
Kabubo-Mariara, J. (2007). Land Conservation and Tenure Security in Kenya: Boserup’s
Hypothesis Revisited. Ecological Economics, 64, 25-35.
Kabubo-Mariara, J. (2010). Agricultural Productivity and Environmental Conservation in Kenya.
Implications for Poverty Reduction. Berlin: VDM-Verlag.
Kabubo-Mariara, J., Linderhof, V., Kruseman, G., Atieno, R. and Mwabu, G. (2010). Poverty-
Environmental Links: The Impact of Soil and Water Conservation and Tenure Security on
Household Welfare in Kenya. Journal of Development and Agricultural Economics, 2, 1,041-
053.
Katleen, B. and Dercon, S. (2007). Social Interactions in Growing Bananas: Evidence from a
Tanzanian Village. CSAE WPS/2007-05.
Kelly, V. A. (2005). Fertilizer Demand in Sub-Saharan Africa: Realizing the Potential. Policy
Synthesis for Cooperating USAID Offices and Country Missions, No.77.
Kimenyi, M. S., Mwabu, G. and Manda, D. K. (2006). Human Capital Externalities and Private
Returns to Education in Kenya. Eastern Economic Journal, 32, 3,1-21.
Manski, C. (2000). Economic Analysis of Social Interactions. Journal of Economic Perspectives
14, 3,115-136.
Munshi, K. (2004). Social Learning in a Heterogeneous Population: Technology Diffusion in the
Indian Green Revolution. Journal of Development Economics, 73, 2,185-213.

European Scientific Journal July edition vol. 8, No.15 ISSN: 1857 – 7881 (Print) e - ISSN 1857- 7431
201
Nyangena, W. and Kohlin, G. (2008). Estimating Returns to Water and Soil Conservation
Investments. An Application to Crop Yield in Kenya. Environment for Development Discussion
Paper 08-32.
Republic of Kenya, (1997). Nyeri District Development Plan, 1997-2001. Nairobi: Government
Printers.(2002). Nyeri District Development Plan 2002-08. Nairobi: Government Printers.
Thori, L. J. and Mehlum, H. (2010). With or Without U? The Appropriate Test for a U-Shaped
Relationship. Oxford Bulletin of Economics and Statistics, 72, 1,109-119.