social media analytics, part 1: how to determine which ...€¦ · capability mobility we want to...
TRANSCRIPT

Social Media Analytics, Part 1:
How to Determine Which Data to
Pull and Analyze
Johna Burke
BurrellesLuce, EVP
Twitter: @gojohnab

Seven Barcelona Principles
• Importance of Goal Setting and
Measurement
• Measuring the Effect on Outcomes is
Preferred to Measuring Outputs
• The Effect on Business Results Can and
Should Be Measured Where Possible
• Media Measurement Requires Quantity and
Quality
• AVEs are not the Value of Public Relations
• Social Media Can and Should be Measured
• Transparency and Replicability are
Paramount to Sound Measurement
#powerofPR @gojohnab

Principle 1: Goal Setting and Measurement are
Fundamental to Communication and Public Relations
Measurement and evaluation against defined
goals and SMART (i.e. specific, measurable,
attainable, relevant and time-bound)
objectives are fundamental to good
communication and PR programs. They are
critical to any communication program,
whether it be a single campaign or an on-
going effort where the results are incremental
over time.
#powerofPR @gojohnab

Awareness Interest/
Knowledge Consideration Action
Enterprise Currently not many
people know about our
B2C enterprise offering.
Thus one of the aims is
to increase awareness of
our offerings
While we are known in B2B
circles for Enterprise
solutions, our complete
range is not understood
well. Not many people know
about our unique products
and End to End solutions
capability
Mobility We want to increase our
visibility and our brand
awareness vis a vis our
competitors
We want to highlight our
innovation and customer
centricity
Customer centricity
being our biggest
strength, we want to
leverage this to grow our
business
Corporate We do not comment on
policy or share
subscriber numbers, we
want to use other
initiatives to drive
coverage
Our Communication Objectives

Principle 2: Measuring Communication Outcomes
is Recommended Versus Only Measuring
Outputs
Outcomes include shifts in awareness, comprehension,
attitude, behavior and advocacy related to purchase,
donations, brand equity, corporate reputation, employee
engagement, public policy, investment decisions, and
other shifts in stakeholders regarding a company, NGO,
government or other type of organization.
Practices for measuring the effect on outcomes should
be tailored to the objectives of the communication
program. Both quantitative and qualitative methods
should be used as appropriate.
#powerofPR @gojohnab

Awareness Knowledge Interest Support/
Preference Action
Public
Relations
Activity
• Content creation
• Traditional media engagement
• Social media engagement
• Influencer engagement
• Stakeholder engagement
• Events/speeches
Intermediary
Effect
• Number of
articles
• Coverage
break-up: Print
vs. Online
• Prominence
• Audience reach
[traditional
media]
• Front Page
Exposure
[traditional
media]
• Key
Spokespeople
• Target Media
• Key message
alignment
• Key Focus
Areas
• Frequency of
(positive)
mentions
• Endorsement
by journalists
or influencers
• Expressed
opinions of
support or
preference
Target
Audience
Effect
• Unaided
awareness
• Aided
awareness
• Knowledge of
company
profile and
offer
• Relevance of
company (to
stakeholder)
• Visitors to
website
• Click-thru to
site
• Time spent on
site
• Downloads
from site
• Calls
• Event/meeting
attendance
• Attitude
change
• Uplift in
reputation
drivers e.g.
Trust,
Admiration
• Endorsement
• Belief in
corporate
brand
• Links to site
• Enhanced
relationships
with key
stakeholders
Reputation Building
• Sales
• Market share
• Share price
• Talent retention and
recruitment
• Cost savings
• Customer loyalty
• Legislation/regulation
passed or blocked

Principle 3: The Effect on Organizational Performance
Can and Should Be Measured Where Possible
To measure results from communication for an organization, models
that determine the effects of the quantity and quality of communication
outputs on organizational metrics, while accounting for other variables,
are a preferred choice.
Related points are:
• Practitioners need to understand the value and implications of
integrated marketing and communication models for accurate
evaluation of each channel including PR. There exists an ongoing
need to develop PR measures that can provide reliable input into
integrated marketing and communication models.
• Survey research can also be used to isolate the change in
purchasing, purchase preference, engagement, recommendation
or attitude shift resulting from exposure to communication
initiatives versus other channels.
#powerofPR @gojohnab

Coverage by Volume
Prominence Target Media Penetration
Key Highlights
▪ In June, COMPANY 1 received much lower coverage (compared to May) with articles across all publications in the print media.
▪ More than half (68%) of the coverage on the company mentioned AT&T prominently.
▪ Key news drivers for COMPANY 1: • XYZ’s plan to make COMPANY 1 more prominent. • ABC appointed as its global creative agency
• Net profit increased by 9% for the fourth quarter of FY15
▪ 29% of Target Media was touched this month, which included The Financial Times, Wall Street Journal, USAToday, NY Times and Dallas Morning News.
▪ So far, COMPANY 1 has not received any coverage in just one Target Media: Barron’s
* Number of articles
# Target Media Penetration is based on the number of publications that carried coverage on AT&T.
343
464
536
437 439
357
425
241
322
445 455
522
232
336
222 220
131
242
312
126 115
327 334
412
Jul'14 Sep'14 Nov'14 Jan'15 Mar'15 May'15
All Media Target Media
33900%
1500%
26100%
700%
YTD
June
Prominent Passing
(56%) (44%)
(68%) (32%)
2700%
800%
100%
2000%
YTD
June
Touched Untouched
(96%) (4%)
(29%) (71%)
Awareness of Enterprise Business

Corporate Issue Volume Positive (%) Neutral (%) Negative (%)
Tech / IT 154 56 34 10
CSR / Sustainability 34 50 45 5
Human Resource 78 40 48 12
Brand + Social + CRM 189 67 16 17
Corporate Tariff 47 65 25 10
Corporate Awareness

Principle 4: Measurement and Evaluation Require
Both Qualitative and Quantitative Methods
• Tracking surveys can do a good job in measuring quantitative change in
outcomes. Qualitative methods can often add a needed dimension to
better explain the quantitative, and may in some cases be preferable to
measuring overall results.
• Specific to the measurement of media resulting from public relations
programs, overall clip counts and general impressions are generally
meaningless. Instead, media measurement, whether in traditional or
online channels, should account for:
• Impressions among the stakeholder or target audience
• Quality of the media coverage including, but not limited to:
Tone, Credibility and Relevance of the Medium to the Stakeholder
or Audience, Message Delivery. Inclusion of a 3rd party or company
spokesperson, Prominence as Relevant to the Medium
• Quality can be negative, positive, or neutral; the assumption should never
be made that the results of a communication or public relations campaign
or program are always positive or successful. Good measurement and
evaluation allows for the possibility of negative or poor results from a
campaign or program.
#powerofPR @gojohnab
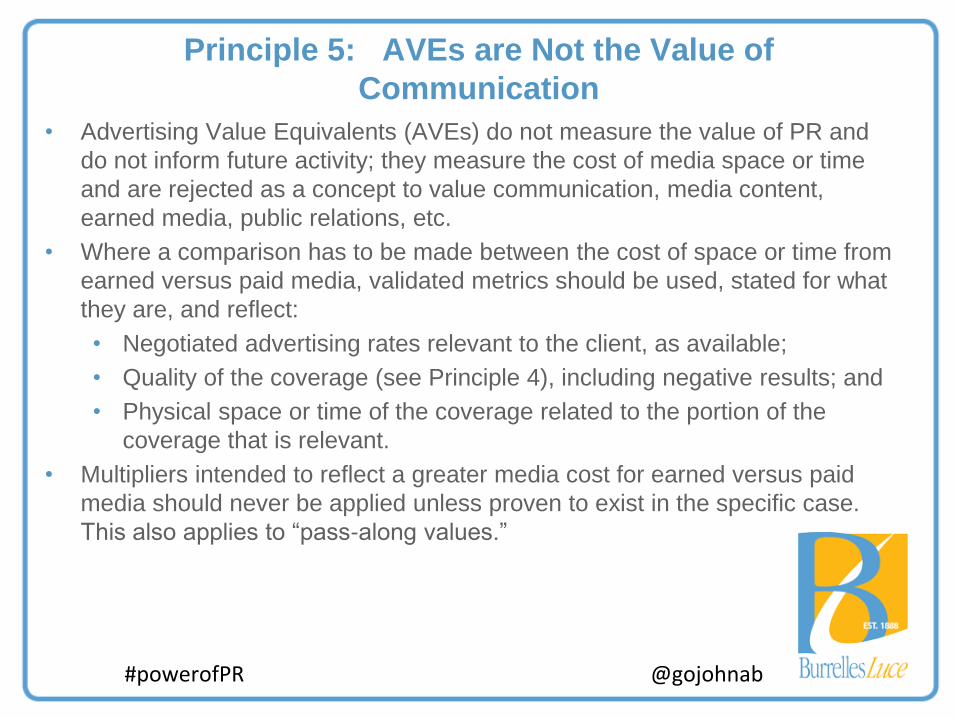
Principle 5: AVEs are Not the Value of
Communication
• Advertising Value Equivalents (AVEs) do not measure the value of PR and
do not inform future activity; they measure the cost of media space or time
and are rejected as a concept to value communication, media content,
earned media, public relations, etc.
• Where a comparison has to be made between the cost of space or time from
earned versus paid media, validated metrics should be used, stated for what
they are, and reflect:
• Negotiated advertising rates relevant to the client, as available;
• Quality of the coverage (see Principle 4), including negative results; and
• Physical space or time of the coverage related to the portion of the
coverage that is relevant.
• Multipliers intended to reflect a greater media cost for earned versus paid
media should never be applied unless proven to exist in the specific case.
This also applies to “pass-along values.”
#powerofPR @gojohnab

Awareness Interest/
Knowledge Consideration Action
Enterprise Currently not many
people know about our
B2C enterprise offering.
Thus one of the aims is
to increase awareness of
our offerings
While we are known in B2B
circles for Enterprise
solutions, our complete
range is not understood
well. Not many people know
about our unique products
and End to End solutions
capability
Mobility We want to increase our
visibility and our brand
awareness vis a vis our
competitors
We want to highlight our
innovation and customer
centricity
Customer centricity
being our biggest
strength, we want to
leverage this to grow our
business
Corporate We do not comment on
policy or share
subscriber numbers, we
want to use other
initiatives to drive
coverage
Our Communication Objectives

Awareness Interest/
Knowledge Consideration Action
Enterprise • # of Articles on
Enterprise business
• Target Media
Penetration
• Key message success
rate
Business
Unit
• Share of Voice
• Prominent coverage
• Target Media
Penetration
• Key message success rate • Sentiment
• # of Endorsements
Corporate • Volume of coverage
with Corporate focus
on IT; CRM; CSR; HR
Suggested Metrics
• Sentiment

Period: June, 2015
567 articles mentioned COMPANY
Print – 221 articles (39%) Online – 346 articles (61%)
articles appeared in Target Media
Print – 289 articles Online – 100 articles
389 78 (21% of total coverage)
Key messages delivered
Dashboard - Overall
* Number of articles
55% 32%
13%
Sentiment
Positive NeutralNegative
50%
33%
17%
Business Type
MobilityEnterprisesBrand & Distribution
15%
20%
30%
35%
Region
North EastSouth West
543
364
536
637
439 457
325
441 522 545
455 522
Jul'14 Aug'14 Sep'14 Oct'14 Nov'14 Dec'14 Jan'15 Feb'15 Mar'15 Apr'15 May'15 Jun'15
Trend Chart
comments Scomments comments
Principle 6: Social Media Can and Should be
Measured Consistently with Other Media
Channels
• Organizations need clearly defined goals and outcomes for social
media.
• Media content analysis should be supplemented by web and
search analytics, sales and CRM data, survey data and other
methods.
• Evaluating quality and quantity is critical, just as it is with
conventional media.
• Measurement must focus on engagement, “conversation” and
“communities” not just “coverage” or vanity metrics such as
“likes”.
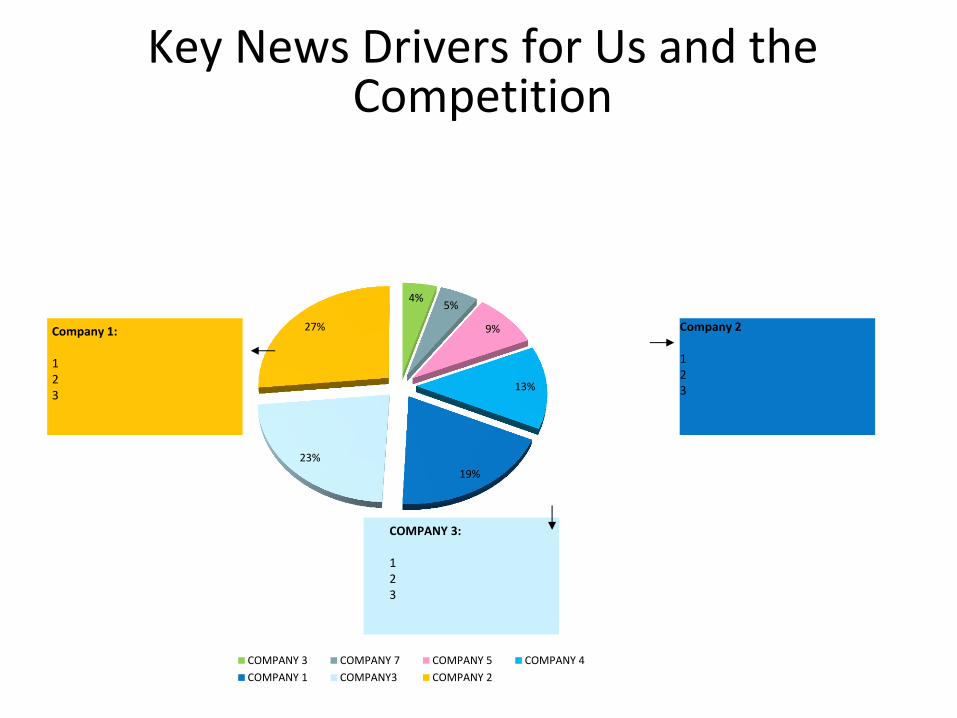
4% 5%
9%
13%
19%
23%
27%
COMPANY 3 COMPANY 7 COMPANY 5 COMPANY 4
COMPANY 1 COMPANY3 COMPANY 2
Company 2
1
2
3
COMPANY 3: 1 2 3
Company 1: 1 2 3
Key News Drivers for Us and the Competition

Key Message Delivery
7
5
4
Great Customization
End to End Solutions (E2E)
Unique Products
Coverage by Key Message
* Number of articles
33%
67%
33%
47% 53%
41%
26% 19%
12% 10%
23% 20%
53%
27% 30%
40%
42%
18%
Sentiment
Positive NeutralNegative
Target
Media
Other
Media
Knowledge of Enterprise Business

Principle 7: Measurement and Evaluation Should
be Transparent, Consistent and Valid
• All measurement should use valid methods and be reliable and
replicable in the case of quantitative methods and trustworthy in the case
of qualitative methods.
• The concepts of integrity, honesty, openness and ethics are critical to
this Principle. There are a number of organizations that have set relevant
standards. These include, but are not limited to nor intended to be a
complete list:
• Media Measurement:
• Source of the content (print, broadcast, internet, consumer
generated media) along with criteria used for collection.
• Analysis methodology – for example, whether human or automated,
tone scale, reach to target, content analysis parameters.
• Primary Research:
• Methodology –sampling frame and size, response rates margin of error,
probability or non-probability, screening criteria.
• Questions – all should be released as asked (wording and order).
• Statistical methodology- how specific metrics are calculated.
• Identification of any potential biasing effects in the research itself or
taking place in the broader societal context.
#powerofPR @gojohnab

Coverage by Volume
Prominence Target Media Penetration
(June’15)
* Number of articles
# Target Media Penetration is based on the number of publications that carried coverage on Tata Teleservices.
43
64
36 37 39
57
25
41
22
45
55
22
32 36
22 20
31
42
12
26
15
27
34
12
Jul'14 Sep'14 Nov'14 Jan'15 Mar'15 May'15
All Media Target Media
(74%)
(48%)
(63%)
(68%)
(62%)
(55% #)
(74%) (56%)
(61%) (60%) (54%)
(79%)
33900%
1500%
26100%
700%
YTD
June
Prominent Passing
(56%) (44%)
(68%) (32%)
2700%
800%
100%
2000%
YTD
June
Touched Untouched
(96%) (4%)
(29%) (71%)
Share of all news on client and competition
REGION COMPANY 1
Leader Share Industry Volume
Target Media Hit Rate (10%)
North 25 COMPANY 1 40% 300 10
Northeast 5 COMPANY 2 35% 550 55
South 10 COMPANY 2 50% 400 25
Southeast 5 COMPANY 3 30% 315 12
Southwest 10 COMPANY 1 45% 289 45
West 8 COMPANY 2 37% 276 55
Northwest 5 COMPANY 2 30% 234 15
Business Unit Awareness
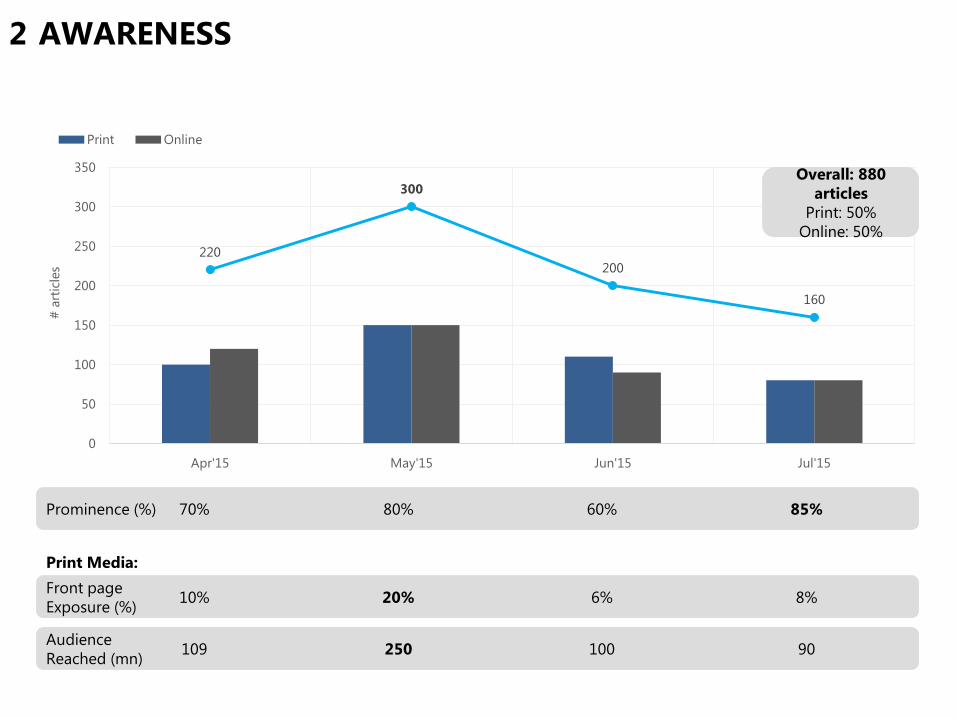
220
300
200
160
0
50
100
150
200
250
300
350
Apr'15 May'15 Jun'15 Jul'15
# a
rtic
les
Print Online
AWARENESS 2
70% 80% 60% 85% Prominence (%)
10% 20% 6% 8% Front page
Exposure (%)
109 250 100 90 Audience
Reached (mn)
Print Media:
Overall: 880
articles
Print: 50%
Online: 50%

CONT…
55% 50%
35% 30%
45% 50%
65% 70%
Apr'15 May'15 Jun'15 Jul'15
Message Not Delivered (42%)
20
40
60
65
80
Message
5
Message
4
Message
3
Message
2
Message
1
Key Messages: Jul’15 % of articles carried Key Messages

PREFERENCE/SUPPORT 5
80% of them wrote favorable stories
on the company
50 Number of
journalists
Key
Journalists # articles Favorable Unfavorable
Journalist_1 10 9 1
Journalist_2 5 5 0
Journalist_3 4 3 1
Journalist_4 4 4 0
Journalist_5 3 3 0
Journalist_6 3 2 1
Journalist_7 2 2 0
Journalist_8 2 2 0
Journalist_9 2 2 0
Journalist_10 2 1 1
60% of them quoted in favor
of the company
40 Number of
analysts/experts
Analysts/Experts # articles Favorable Unfavorable
Analyst_1 4 3 1
Analyst_2 3 3 0
Analyst_3 2 2 0
Analyst_4 2 2 0
Analyst_5 2 2 0
Analyst_6 2 2 0
Analyst_7 2 2 0
Analyst_8 2 2 0
Analyst_9 2 2 0
Analyst_10 2 1 1
Period:
September’15

TAKEAWAYS
• You must have goals in place in order to
make any measurement reporting valuable.
• Priority tiers can help you focus on the most
important channels.
• Data first and output second.
• HAVE FUN!
#powerofPR @gojohnab