social media as a tool of corporate communications in
TRANSCRIPT

SOCIAL MEDIA AS A TOOL OF CORPORATE COMMUNICATIONS IN
INSTITUTIONS OF HIGHER LEARNING: A CASE STUDY OF THE
UNIVERSITY OF NAIROBI
FRANKLINE OMONDI SEWE
A RESERCH PROJECT REPORT SUBMITTED IN PARTIAL
FULLFILMENT FOR THE AWARD OF THE DEGREE OF MASTER OF
ARTS IN COMMUNICATION STUDIES OF THE UNIVERSITY OF
NAIROBI
2014

ii
©2014
FRANKLINE OMONDI SEWE
ALL RIGHTS RESERVED

iii
DECLARATION
This is my original work and has not been presented for the award of a degree in any other
university or any other institution of higher learning for examination.
Signed……………………………Date…………………………………………………..
FRANKLINE OMONDI SEWE REG NO: K50/81503/2012
This research report has been submitted for examination with my approval as the University
Supervisor.
Signature…………………………………… Date……………………………………….
Dr Sam Kamau
School of Journalism
University of Nairobi

iv
ACKNOWLEDGEMENTS
I would like to sincerely thank my academic supervisor and advisor, Dr Sam Kamau for his
immense guidance and support throughout this research project. I would also like to thank the
School of Journalism, especially members of my masters‘ defense panel for their input, valuable
discussions and accessibility. Finally, I would like to thank fellow school of journalism students
at the University of Nairobi as well as all the lecturers who taught me throughout the entire
course.
v
ABSTRACT
The main objective of this study is to investigate the use of social media as a tool of corporate
communications in institutions of higher learning with a case study of the University of Nairobi.
The study applied mixed methodologies in data collection with a key informant interview being
conducted with the Web Communications Officer of the University of Nairobi. A survey of 150
students from the College of Humanities and Social Sciences was also conducted. The findings
indicated that despite remarkable efforts in the use of social media to communicate with key
stakeholders, institutions of higher learning have failed to fully utilize the potential of social
media in advancing their corporate communications efforts. Institutions of higher learning are
advised to initiate and enhance dialogue with their stakeholders on social media, create
interesting and engaging content as well as monitor and evaluate the performance of their social
media activities. This study adds much to the existing academic literature in the use of social as
a tool of corporate communications and corporate brand building in the higher education sector.
vi
TABLE OF CONTENTS
DECLARATION ......................................................................................................... iii
ACKNOWLEDGEMENTS ........................................................................................... iv
ABSTRACT .................................................................................................................. v
TABLE OF CONTENTS ............................................................................................... vi
CHAPTER ONE: INTRODUCTION .................................................................... 1
1.1: Background of the Study ........................................................................................... 1
1.2 Statement of the problem ............................................................................................ 4
1.3Objectives of the Study ............................................................................................... 6
1.4 Research Questions ................................................................................................... 6
1.5 Justification of the study ............................................................................................. 7
1.6 Scope of the study ..................................................................................................... 7
1.7 Limitations of the study .............................................................................................. 8
CHAPTER TWO: LITERATURE REVIEW ....................................................... 9
2.0 Introduction .............................................................................................................. 9
2.1 Theoretical Review .................................................................................................... 9
2.1.1 History of Social Media ........................................................................................... 9
2.1.2 Classification of Social Media ................................................................................11
2.1.3 Benefits of Social Media to Public Relations .............................................................13

vii
2.1.4 About the University of Nairobi ..............................................................................15
2.1.5 University of Nairobi‘s Social Media Background .....................................................16
2.2 Empirical Review ....................................................................................................17
2.2.1 Overview Social Media in Higher Learning Institutions ..............................................17
2.2.2 Social Media Engagement Strategies .......................................................................21
2.2.3 Emerging Gaps.....................................................................................................26
2.3 Theoretical Framework ............................................................................................27
2.3.1 Adaptive Structuration Theory (AST) ......................................................................27
2.3.2 Technological Acceptance Model (TAM) .................................................................31
CHAPTER THREE: RESEARCH METHODOLOGY ....................................34
3.0 Introduction ............................................................................................................34
3.1 Research site ..........................................................................................................34
3.2 Research Design .....................................................................................................34
3.3 Study Population .....................................................................................................35
3.4 Pilot Study .............................................................................................................35
3.5 Sample size and Sampling Technique .........................................................................36
3.6 Sample size ............................................................................................................36
3.7 Sampling Technique ................................................................................................36
3.8 Data Collection Methods ..........................................................................................37

viii
3.9 Data Analysis and Presentation .................................................................................37
CHAPTER FOUR: DATA ANALYSIS, INTERPRETATION AND
DISCUSSION .........................................................................................................38
4.1 Introduction ............................................................................................................38
4.2 How the University of Nairobi Uses Social Media to communicate with its Publics ..........38
4.3 Questionnaires Return Rate .......................................................................................44
4.4 Composition of Respondents by Gender .....................................................................44
4.5 Composition of Respondents by Level of Education ....................................................45
4.6 Do you own Social Media Account ...........................................................................46
4.7 Respondents‘ Usage of Facebook ..............................................................................47
4.8: Respondents Usage of Twitter ..................................................................................48
4.9 Respondents Usage of YouTube ................................................................................49
4.10: Respondents Usage of Blogs ..................................................................................50
4.11: Respondents Usage of Text Messaging ....................................................................51
4. 13 Respondents Usage of LinkedIn ..............................................................................53
4.14 How respondents frequently posted statuses on Facebook ............................................54
4.15: How respondents frequently posted photos on public photo sites .................................55
4.16:How often respondents commented on a Blog ............................................................56
4.17: How often the respondents tweeted on Tweeter .........................................................57

ix
4.18: How often respondents subscribed to RSS feeds ........................................................58
4.19: How often respondents posted videos on public video sites .........................................59
4.20: How often respondents created or edited wiki entries .................................................60
4.21 Respondents Overall Perception on Social Media .......................................................61
4.22: Whether respondents had ever visited the University of Nairobi‘s Social media pages ....62
4.23: How often the respondents visited the University of Nairobi‘s social media pages ..........63
4.25: How respondents rate the information shared on the University‘s social media sites .......66
4.26: How often respondents responded to information on the University‘s social media pages 68
4.27:Whether the University‘s social media pages were interactive ......................................69
4.28: Whether the University‘s social media pages are frequently updated ............................70
4.29: Whether the content posted on the university‘s social media pages was interesting .........70
4.30: Whether the University provided feedback when asked a question on social media pages 71
4.31: Whether Social media was a good platform for the University to link up with its publics .72
4.32: Whether the respondents‘ would recommend someone to the university‘s social media
pages if asked a question. ..............................................................................................73
4.33: Whether the University of Nairobi‘s image was enhanced through social media .............74
4.34: Whether the respondents encountered any challenges while communicating with the
University on social media .............................................................................................75
x
CHAPTER FIVE: SUMMARY, CONCLUSIONS AND
RECOMMENDATIONS .......................................................................................77
5.1 Introduction ............................................................................................................77
5.2 Summary of the findings ..........................................................................................77
5.3 Conclusions ............................................................................................................79
5.4 Recommendations ...................................................................................................80
5.5 Suggestions for Further Research ...............................................................................82
REFERENCES .......................................................................................................83
APPENDICES ........................................................................................................89
Appendix 1: Letter of Transmittal ...................................................................................89
APPENDIX2: Questionnaire for Students ........................................................................90
APPENDIX3: Questionnaire for Web Champions .............................................................94
APPENDIX 4: Key Informant Interview Guide for the Communications Officer of the
University of Nairobi ..................................................................................................100
1
CHAPTER ONE: INTRODUCTION
1.1: Background of the Study
Social Media refers to web based and mobile applications that allow individuals and
organizations to create, engage and share new user-generated or existing content in digital
environments through multi-way communication (Davis et al, 2013).The development of
electronic media in 1960s and the advent of the internet brought about tremendous revolution in
the way the way the society lived and operated. Marshall McLuhan‘s view of the world being a
―global village‖ is best substantiated by the social media. Courtesy of the new media, McLuhan
said, ―We have become global wanderers, information gatherers rather than food gatherers.‖ In
today‘s digital world, people can communicate with strangers from other parts of the world
through the internet. Through Social Networking Sites (SNS) such as Facebook, Twitter and
MySpace among others, one can be informed in real time about some far away disaster or other
breaking news. Research studies have indicated that many people in the world today rely on the
social media for all kinds of information.
The 2013 Pew Research Global Attitudes Project revealed that 76% of internet users in Kenya
use Social Networking sites and that most of the users are young people. The report further
revealed that 62% of internet users access the internet on a daily basis. The study also found out
that many people used Social Networking sites (SNS) to stay in touch with friends and family as
well as share their views on an array of topics including popular culture, religion and politics.
These statistics exponentially reveal the immense power of social media and it can therefore be

2
argued that social media has indeed become part and parcel of the modern society‘s lifestyle and
culture.
Kenya‘s vision 2030 economic blueprint spells out the use of science and technology in order to
raise productivity and efficiency across all sectors of the economy. Essentially, Information and
Communications Technology (ICT) is seen as being the major force and backbone of the Kenyan
economy going forward. Social media as an emerging and high rising technology has been
embraced by a number of sectors in the country including, the agricultural sector, government,
education, manufacturing, private sector and civic society among many others.
An increasing number of studies suggest that corporate interest in social media domain keeps
growing and more firms are introducing different forms of social media into their daily business
routines as well as into their marketing strategies (Cymfony, 2006). Social media has become a
new pathway to information and corporate bodies and organizations are essentially using social
media to reach out to their clients. Social media platforms has obviously provided a new and
interactive platform for organizations to be able to reach out to clients, solve their problems and
understand issues affecting them in a more personal way reminiscent of face to face
communication. The entire range of social media applications share the innate ability to enable
social behavior through dialogue thus providing an opportunity to discover and share new
information (Solis,2008).
The higher education sector is an integral part of any progressive economy. Universities and
colleges have for decades played significant roles in enhancing research, teaching and
innovations. The education sector has advanced human knowledge and promoted understanding.

3
The sector also contributes directly to national economies through foreign earnings and creation
of employment opportunities. By supplying highly qualified graduates to the national workforce,
the higher education has also maintained national economic development. Given the obvious
benefits of higher education on the society, economy and national culture, it is important for the
sector to be given all kinds of support necessary for growth and development. In this context, it
is prudent to investigate and understand the size and shape of higher education as it develops. It
is also very important to showcase how higher learning institutions have been adapting to various
dynamic changes in the external environment.
One of the changes that have affected higher learning institutions is rapid technological
development. According to a 2012 report by Universities UK, changes in technology are having
significant impact on attitudes to web usage and that the cohorts of students arriving at
universities now and in future are going to be increasingly socialized towards web-based
communications. Prensky (2001) argued that a new generation of students; the ―digital natives‖
coming into universities was fundamentally different from any that educators had seen before
and that digital natives had spent their entire lives surrounded by and using computers,
videogames, digital music players, video cameras, cell phones and all other tools of the digital
age. Digital natives also referred to as generation Y are said to prefer receiving information
quickly; adept at processing information rapidly; prefer multi-tasking and non-linear access to
information, prefer active rather than passive learning and heavily rely on communication
technology to access information and to carry out social and professional
interaction(Olinger,2003,Gros,2003,Frand 2000).

4
The ―new‖ digital student with a nose and eye for new media and internet communication poses
a great challenge to university administrators, faculty, Public Relations offices and university
departments. The main interest of this research project therefore is to investigate the use of social
media as a tool of corporate communications in institutions of higher learning. The study will
also attempt to measure the impact of social media interaction between students and higher
learning institutions as well as measure the effectiveness of social media interaction between
higher learning institutions and students.
This research will be based on a case study of the University of Nairobi. According to the 2014
editions of Webometrics ranking of world universities, the University of Nairobi was ranked as
first in East Africa and ninth in Africa. The University of Nairobi is also the oldest and largest
public university in Kenya. It has a multicultural and cosmopolitan population of students
including international students thus providing a perfect avenue for a case study of this nature
that will be able to reflect trends in social media usage in other institutions of higher learning in
Kenya. A university is a particularly interesting context in which to examine how social media is
used because unlike other industries, institutions of higher education have unique and diverse
segmented audiences including prospective students, current students and alumni and the
generational differences, styles and needs of each group tend to be very different(Stageman&
Berg, 2013)
1.2 Statement of the problem
According to a 2012 report by Universities UK, changes in technology are having significant
impact on attitudes to web usage and that the cohorts of students arriving at universities now and
5
in future are going to be increasingly socialized towards web-based communications. Previous
studies have indicated that many young people have significantly embraced social media in their
daily routines. Prensky (2001) argued that a new generation of students; the ―digital natives‖
coming into universities was fundamentally different from any that educators had seen before
and that digital natives had spent their entire lives surrounded by and using computers,
videogames, digital music players, video cameras, cell phones and all other tools of the digital
age. Digital natives also referred to as generation Y are said to prefer receiving information
quickly; adept at processing information rapidly; prefer multi-tasking and non-linear access to
information, prefer active rather than passive learning and heavily rely on communication
technology to access information and to carry out social and professional
interaction(Olinger,2003,Gros,2003,Frand 2000).
However, Roblyer et al (2010) argues that higher education has a well established trend of non-
adoption of new technologies. Failure or slow adoption of new technological changes means
that higher learning institutions will not be able to understand and mutually communicate with
the new ―digital student‖ coming into their institutions. It also means that the institutions will not
adequately inform and solve problems affecting the students due to the digital disconnect.
Although higher learning institutions have made an effort to set up social media accounts, a
casual observation of their usage reveals that many of the institutions are not proactively utilizing
the power of social media to connect with students and further enhance positive images of the
respective institutions. Some institutions rarely post information on social media pages for their
students while others have dull or inactive social media pages. At the same time other
institutions, post information on social media pages but fail to interact or initiate and promote

6
dialogue with the students on current affairs, institutional affairs and student welfare among
other matters of interest. The goal of this work is to investigate the use of social media as a tool
of corporate communications in institutions of higher learning.
1.3Objectives of the Study
General Objective
To investigate the use of social media as a tool of corporate communications in institutions of
higher learning
Specific Objectives
1. To investigate how students use social media to interact with institutions
2. To examine the effectiveness of social media interaction between students and
institutions of higher learning
3. To examine how institutions of higher learning use social media to communicate with
students
1.4 Research Questions
The following research questions aim to interrogate the use of social media as a tool of corporate
communications in institutions of higher learning. These research questions will be based on a
content analysis of higher learning institutions‘ social media pages. The questions will also be
based on a study conducted among students who will be surveyed.
RQ1: How do institutions of higher learning use social media to communicate with its key
publics?

7
RQ2: How do students use social media to interact with institutions of higher learning?
RQ3: What is the effectiveness of social media interaction between students and institutions of
higher learning?
1.5 Justification of the study
Given the absence of sufficient research on the use of social media in higher learning institutions,
this research study will be very important in filling the academic lacuna. The study will also be
able to provide a set of frameworks to support critical thinking and applications of new media
technologies in promoting efficient and effective communications in institutions of higher
learning. This will enable universities and colleges to lead in innovations and use of new
technologies and thus be able to remain relevant and compete with other global higher learning
institutions. In essence, this study will be very helpful to higher education marketers,
administrators, faculty, education policy makers and students among others.
1.6 Scope of the study
The main purpose of this research is to investigate the use of social media as a tool of corporate
communications in institutions of higher learning. The study also aims to interrogate how
students use social media to interact with their institutions and also determine the effectiveness
of social media interaction between students and institutions of higher learning. The study is
also designed to measure the impact of social media interaction between students and higher
learning institutions. In order to achieve desired results, this study will be based on a case study
of the University of Nairobi. The sample of this study will be undergraduate and post graduate
8
students of the University of Nairobi as well as managers of the corporate website and social
media sites of the University.
1.7 Limitations of the study
The decision of limiting the survey to the College of Humanities and Social Sciences (CHSS) in
main campus could possibly have left out potential valuable information from students from
other campuses of the University of Nairobi who are actively engaged in social media interaction
with the university. The limited timeframe of conducting this study may have limited the depth
of the study. Social networking as a tool of corporate communications in institutions of higher
learning is also relatively a new area of study and there was less relevant scholarly literature to
review.
9
CHAPTER TWO: LITERATURE REVIEW
2.0 Introduction
The main focus of this chapter is to review previous research studies that are relevant to this
topic. This review will examine the history of social media and the use of social media in
advancing corporate communications in various fields and particularly in higher learning
institutions. The review will also be able to identify emerging gaps that need to be addressed.
The theories as applied in the theoretical framework will be able to explain and provide possible
answers to this study‘s research questions.
2.1 Theoretical Review
2.1.1 History of Social Media
The term social media was coined to describe new platforms of digital communication that
continually appear in interactive electronic environment, underlining their participative and
collaborative social characteristics (Vernuccio, 2014). Commonly, the phrase, ―Social
networking sites‖ is used as an umbrella term for all social media and computer mediated
communication including but not limited to Facebook, Twitter, LinkedIn and MySpace as well
as the inaugural social networking sites of Cyworld, Bebo and Friendster(Davis, et al,2013).
Social network sites are defined as web-based services that allow individuals to (1) construct a
public or semi-public profile within a bounded system, (2) articulate a list of other users with
whom they share a connection, and (3) view and traverse their list of connections and those made
by others within the system (Ellison &Boyd, 2010).
10
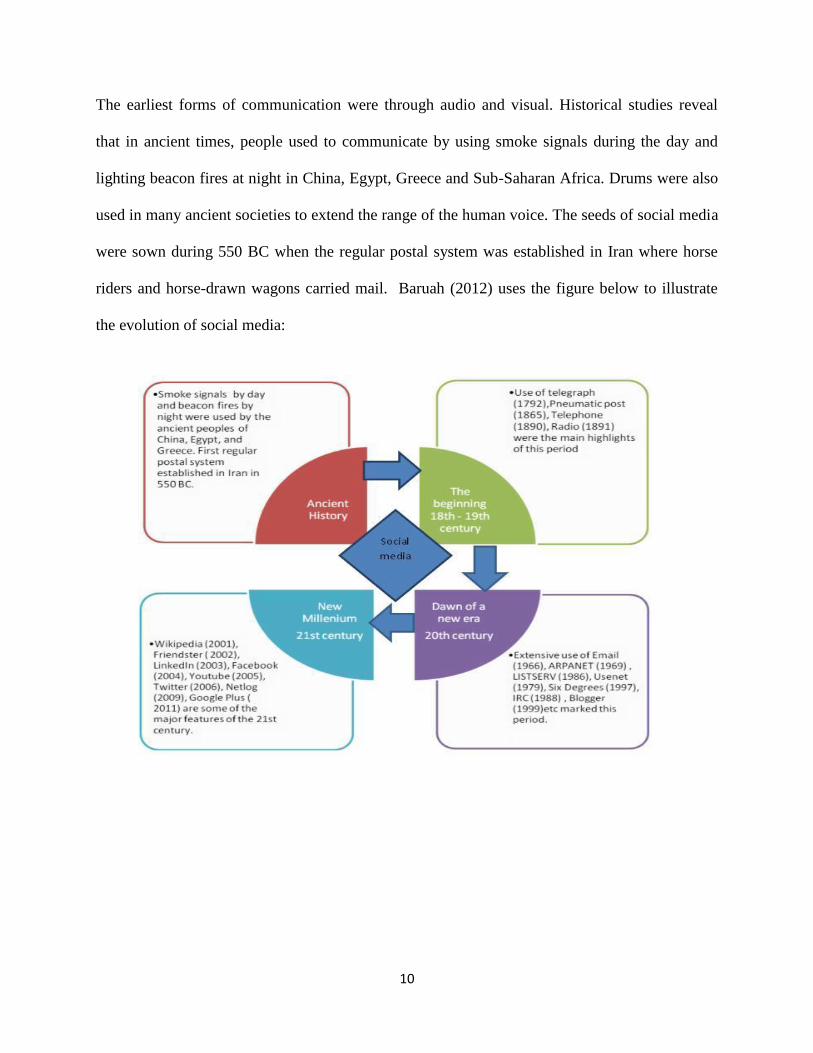
The earliest forms of communication were through audio and visual. Historical studies reveal
that in ancient times, people used to communicate by using smoke signals during the day and
lighting beacon fires at night in China, Egypt, Greece and Sub-Saharan Africa. Drums were also
used in many ancient societies to extend the range of the human voice. The seeds of social media
were sown during 550 BC when the regular postal system was established in Iran where horse
riders and horse-drawn wagons carried mail. Baruah (2012) uses the figure below to illustrate
the evolution of social media:

11
The 18th
and 19th
centuries were significant in the development of communications technologies
with the inventions of telegraphs, telephones and radios. This meant that for once in history
people were able to send and receive messages over long distances. The 20th
century is
highlighted by the advent and development of the internet. The advent of the internet completely
changed the communications landscape because people were now able to exchange messages
from one person to another through the web or digitally. As illustrated on the figure above,
internet based communications involved the use of Email, ARPANET, USENET and Bulletin
Board System (BBS).
The internet also provided an array of social networking sites including, LiveJournal, Blogger,
Six Degrees, Napster, Lister and Internet relay chat. The 21st century experienced a significant
growth of social networking sites following the launch of; Facebook, Twitter, Photobucket,
Orkut, Youtube, Friendstar, Fotolog,Google plus, Digg, Netlog, Ning and Myspace among
others.
Social media has become a convention of the online landscape and major social networks and
social media websites make changes and improvements on a fairly regular basis, so it‗s sure to
keep evolving in coming years (Baruah, 2012).
2.1.2 Classification of Social Media
Social media scholars classified social media into four main categories including, Social
Networking sites (SNS), blogs, content generating and sharing sites as well as user appraisal
sites.
12
Social Networking Sites (SNS): They provide web based platforms for building social networks
or social relations amongst people for example shared interests or activities. SNS provides a
platform for people to interact via the internet, email and mobile phones. According to Baruah
(2012) the most popular websites offering social networking currently are MySpace (started in
2003), LinkedIn (started in 2003) and Facebook (started in 2006).A social network allows a user
to create profiles or personal homepages online and set up a social network. What makes social
network sites unique is not that they allow individuals to meet strangers, but rather that they
enable users to articulate and make visible their social networks(Ellison &Boyd, 2010).This can
result in connections between individuals that would not otherwise be made, but that is often not
the goal, and these meetings are frequently between "latent ties(Haythornthwaite, 2005).
Blogs: A blog is an online journal where an individual, group, or corporation presents a record of
activities, thoughts or beliefs. For one to set up a blog, one has to choose the available blogging
platforms that include Wordpress.com, blogger.com and wordpress.org among others.
Blogger.com and Wordpress.com offer free blogging platforms thus anyone can set up an
account. A popular sub category of blogs is microblogging. A microblogging site is basically
like any other blog except for the fact that it limits the number of words that once can publish in
one message. Twitter.com is an example of a microblogging site. Twitter has a word limit of
140 characters.
Content generating and sharing sites: These sites function as sources of information for
various topics. For example, there are photo sharing sites like Flicker.com, Picasaweb.goole.com
as well as video sharing sites like Youtube.com. There are also slide sharing sites like

13
slideshare.com where one can share PowerPoint presentations and document sharing sites like
docstoc.com among others. Generally, these sites provide free content for all internet users thus
people can search for various kinds of content, download and use the content available to without
being charged a fee for accessing the content. The sites also provide a platform for users to
generate and share content with others. This is mainly useful to people who are unable to access
enough educational resources.
User appraisal sites: These serve as a platform for appraisals of various products and services.
Sites such as www.pagalguy.com enable consumers to write reviews on various products and
services. User appraisal sites provide a platform for a consumer to make appropriate decisions
before buying a product or paying for a service.
2.1.3 Benefits of Social Media to Public Relations
One of the coolest things about the web is that when an idea takes off it can propel a brand or a
company to seemingly instant fame and fortune (Scott, 2008 cited in Wright & Hinson, 2008).
Scott however laments the fact that although communicating via the web is usually free as
opposed to purchasing space through traditional advertising, only a small number of public
relations practitioners are effectively using blogs and other social media when communicating
with their strategic publics. Scott argues that the challenge to public relations and marketing
people is, ―to harness the amazing power of social media-having other people tell your story
drives action by having one person sending it to another, then that person sends it to yet another
and on and on.‖

14
Wright & Hinson (2007) examined the impact of new technologies on public relations and
discovered that the phenomenon of social media have the potential to bring dramatic changes to
many aspects of public relations. Wright and Hinson claimed that new technologies have
significantly empowered a wide variety of strategic publics by giving them dynamic new media
many are using to communicate effectively with a variety of internal and external audiences. The
communications world is dramatically moving in a digital direction and those who understand
this transformation will communicate much more effectively than those who do not (Weber,
2007). Public relations in the digital age requires understanding how your key constituents are
gathering and sharing information and then influencing them at key points-doing so requires
strategies that embrace the digital age (Key, 2005).
The 2005 PR Week/Burson-Marsteller CEO Survey report that, ―59 % of CEOs rate blogs as a
good, very good, or excellent corporate communications tool for internal audiences.‖ A study
conducted by Wright & Hinson (2008) revealed that the emergence of social media has
dramatically reduced the turn-around time when organizations are communicating with certain
target publics. The study also revealed that social media has provided an opportunity to truly put
the public back into public relations by providing a mechanism for organizations to engage in
real-time, one-to-one conversations with stakeholders. According to Jones et al. (2008),
organizations that use social media tools appear more reputable and more innovative than their
competitors. This means that, the more an organization uses social media, the more it attracts and
retains customers to its brand. Accessing social networking sites and social media tools enables a
company to directly connect with customers and get a clear idea on what they want, where they
are and what makes them tick. Additionally, Social media has the ability to save companies a lot
15
of money and time through enhancing traditional and online campaigns thus yielding more
response rates to pitches (Swallow, 2010). However, corporate social media channels should
provide relevant updates and news address customer issues or answer questions regarding the
company or brand- companies which fail to address or ignore customer concerns online are
damaging not only their online reputation but bottom-line sales as well( Tabellini& Yip,2013)
Freburg (2010) summarizes the main uses of social media as follows; (1) Establishing online
identity. (2) Conducting research (3) Launching events and creating awareness of an issue (4)
Using media relations practices in reaching both traditional and non-traditional media. (5)
Engaging with customers in dialogue (6) Creating new online partnerships (7) Communications
with External and Internal audiences (8) Crisis Communications and crisis management (9)
Reputation management (Corporate and individual)
2.1.4 About the University of Nairobi
The University of Nairobi is the oldest higher learning institution in Kenya. It is located in the
capital city, Nairobi. The inception of the University of Nairobi is traced back to the year 1956
following the establishment of the Royal Technical College which admitted its first lot of A-level
graduates for technical courses in April 1956. The Royal Technical College was transformed
into the second university college in East Africa in 1961 under the name of Royal College
Nairobi and was admitted into special relations with the University of London. The Royal
College Nairobi was renamed University College Nairobi and made a constituent college of the
Federal University of East Africa. The University College Nairobi became the first national
university in Kenya in 1970 and consequently renamed the University of Nairobi.
16
The University of Nairobi has six colleges including the; College of Architecture and
Engineering, College of Agriculture and Veterinary Sciences, College of Biological and Physical
Sciences, College of Education and External Studies, College of Health Sciences and College of
Humanities and Social Sciences. The University of Nairobi has an overall student population of
slightly over 68000 and 5000 teaching and non teaching members of staff.
The vision of the University of Nairobi is to be a world-class university committed to scholarly
excellence and its mission is to provide quality university education and training and to embody
the aspirations of the Kenyan people and the global community through creation, preservation,
integration, transmission and utilization of knowledge. On the university‘s website, the Vice
Chancellor, Prof. George Magoha describes the university of Nairobi as, ―one of the greatest
inventions of our time.‖ and that, ―It remains one of the glories of human aspirations and one of
the triumphs of the power of imagination.‖
2.1.5 University of Nairobi’s Social Media Background
In its 2014 communications policy document, the University of Nairobi notes that, ―There have
been changes in the handling of corporate communication all over the world, with an implication
that if an organization has to survive and thrive, then it must communicate effectively with all its
stakeholders.‖ The policy document also points out that, ―A major challenge facing the
university is updating the content of information and presenting it in appropriate forms to its
diverse audiences. The range of audiences makes it imperative that the university develops
appropriate approaches to sharing information and to gauging feedback.‖ In the communications
17
policy, the university‘s corporate communications is spearheaded by the Public Relations Office
which was set up in 2005.
The office is comprised of the Public Relations Manager, Web Communications Officer and a
Secretary. The policy states that one of the responsibilities of the public relations office is to
―give updates through websites and social media.‖ This is seen as a powerful tool for
communicating with the university‘s key audiences who include current students, prospective
students and employees of the university among other stakeholders.
The University of Nairobi maintains several social media accounts including; one Twitter
account, one official Facebook page, one YouTube channel and two Google+ accounts. A casual
observation reveals a considerable amount of online participation with the following figures. The
main Twitter account, @uonbi, has more than 5300 followers; the University of Nairobi’s
YouTube Channel has received more than 2800 video views and 72 unique subscribers, the
university‘s Facebook fan page has more than 20,200 likes while the Google accounts have 4630
views and 356 followers. It is important to note that the figures stated only represent university
wide accounts at corporate level and do not include social media accounts that are managed at
college, schools and departmental levels.
2.2 Empirical Review
2.2.1 Overview Social Media in Higher Learning Institutions
Today‘s students are relying on mainstream technologies; computers, mobile phones and the
internet for fast communication and convenient access to information and services (Kennedy et
al, 2008). This may have particular implications for the administrative services provided by

18
universities-general student services, teaching and learning services (Caries& Kraviks, 2005).In
their 2004 study, ―Virtual Community Attraction: Why People Hangout Online,‖
(Ridings&Gefen,2004 cited in Hayes, Ruschman &Walker, 2009)state four principle reasons for
the publics‘ participation in online communities. They are the following:
1. Information exchange: the most frequently cited reason.
2. Social Support Exchange: The degree to which a person‘s basic social needs are gratified
through interaction with others.
3. Friendship: A way for individuals to search for and communicate withothers for the
purpose of establishing and continuing friendships.
4. Recreation: Internet as a form of recreation, like television, and newforms of online
gaming.
According to a 2009 report by Pew Internet and American Life Project, 73% of American teens
use social networking sites and 65% of the teens use the social networking sites on a daily basis
to send messages privately. The report also indicates that older teens are more like to use Twitter
compared to the younger ones and that Facebook had a large number of profiles by teenagers.
Nielson 2012 report on the state of social media revealed that on average, 47% of social media
users engage on social care. According to the report, social care may refer to customer service
via social media and that it has become an immediate imperative for global brands. The report
also indicated that consumers turn to a wide variety of social media platforms for social care.
19
The report states that, ―Social media users are most likely to comment on or ask a question about
a company‘s product or service on Facebook, both on the company‘s page (29%) and on their
personal page (28%).‖ At the same time, others will use Twitter and Youtube to express their
feelings about a product or service.
A survey conducted in 26 countries across Europe, Asia, Latin America, North America and
Africa in 2013 by QS global universities stated that and discovered that, ―In every region, more
than 50% of respondents say they use five key networks (Facebook, Twitter, YouTube, LinkedIn
and Pinterest)‗all the time.‘ The survey also revealed that ―Younger respondents were more
likely to report high usage of YouTube and Pinterest, while older respondents more likely to
report frequent use of LinkedIn.‖ At the same time, ―African respondents generally report lower
levels of social network usage compared to other regions – with exception of Facebook.‖ The
main motivation for social network usage in all regions was ‗keeping up to date‘, except Latin
America where ‗interest‘ is key driver‖ Respondents in Asia and Africa most likely to value
chance to ‗Have a say‘.
Another 2013 survey conducted by the Consumer Network in Kenya revealed that 87% of
Kenyan youth use the internet to access social media while 57% use the internet to download
music and 55% to send email. Higher education institutions are already experimenting with
social media marketing. However, the number of studies on social media marketing and their
effectiveness is still limited, and very little is known about the suitability of the social media as
tools for higher education marketing (Constantinides & Stagno, 2011).The lack of suitable higher
education social media platform can be a reason for the low availability of contributed content.
20
This leads to the question how do university marketers energize present students and future
students to contribute more content, preferably content that is also beneficial to their
institution?‖(Constantinides & Stagno, 2011). ―We argue that university marketers should
approach social media in a proactive way because the simple presence in the social media space
is not enough for successful higher education marketing.‖ (Shah, 2014).
In July 2008 higher education Web, marketing, and communication professionals subscribed to
the Uweb, HighEdWeb, and SUNY CUADnetlistservs were asked to complete a survey
abouttheir university‘s use of social media (Reuben, 2008 cited in Kowalik, 2013).
The 148 unique responses from 4 different countries: the United States, Australia, Canada, and
New Zealand, shed some light on the social media landscape in higher education.
• Over half (53.79%) of the institutions reported having an official Facebook page for their
campus, and 20 of them have developed a custom application for Facebook.
• Only 21.9% report having an official presence on MySpace, with only one responder
indicating they created a custom application for MySpace.
• Nearly 67% did not have an official Twitter account for their campus, and about 64% did
not have an official Flickr account. • Just over half had an official presence on YouTube
and nearly 60% had some form of blogs on their site.
• Only 17% reported using delicious, a community bookmark website in which users can
save Web pages they find and share them with other users.
The survey also asked for input on staff time for managing these social media endeavors and
what the intended purposes of these activities were. Respondents reported the overwhelming
21
majority of these tools were maintained by one or more individuals in their marketing,
communications, or public relations office. Communication with current students and alumni
was the most widely reported use and most organizations spent 1–4h a week updating their
Facebook. Those respondents that reported having an official Flickr account, nearly 43% said
their marketing, communications, or public relations office maintained their presence and use
was split pretty evenly between sharing photos with current students, faculty, staff, and alumni.
The majority of respondents reported spending1–4 h a week adding photos to Flickr. YouTube
appeared to be used primarily for recruitment purposes (29.50%), with some using it to share
videos with current students and alumni. Most reported spending 1–4h a week adding videos to
their channel. Despite the survey results showing an active push in higher education to utilize
social media for marketing and engagement, some may still be skeptical or skittish of investing
time and resources into social media (Kowalik, 2013).
Surveys show, however, that more and more prospective students and younger alumni are
joining social networks. More than half of America‘s teens and young adults use social
networking sites, and more than one- third of all Internet users engage in social networking
(Jones & Fox, 2009).
2.2.2 Social Media Engagement Strategies
Given the strategically important position they occupy in society, universities owe it to
themselves to implement a communications system that is "up to scratch-one that is professional
and in step with the times. In such a competitive context, managing the brand of an institution
22
and communicating its strategy requires very sophisticated management (Canals, 2013).Directors
of Communications must devise the communications policy of the university or school and be
involved in the creation of its brand, they must also be constantly aware of what's going on; as
informed about the activities of students and faculty as they are about what the competition is up
to; they must know as much about new communications trends as they do about the buzz
surrounding the institution (Canals, 2013).The Web opened up new frontiers for universities and
colleges, giving them much more extensive options than they had before. But, at the same time,
it has had a profound effect on the way they communicate (Jelassi, 2013).Social networks and
diverse "communities" on the Web in particular will experience considerable growth.
It is reasonable to imagine that tomorrow; students all over the world will be linked through
multiple networks. So higher education must prepare itself to accept that communications will
no longer come from a single source and be disseminated from the top down, but that
information will be produced by the recipients themselves (especially students) – and, if
possible, with them. It will be co-created.‖ (Danos, 2013).
Beginning in 2007 academic institutions started to build a presence on social media as a strategy
to connect with current students and to reach prospective students (Stageman & Berg, 2013). In
November 2007, Facebook created ―the fan pages concept,‖ which allows users to become a fan
of any type of organization or course, and ―many universities jumped at the opportunity to create
an official Facebook presence for their university.‖ (Reuben, 2007 cited in Stageman& Berg
2013). Participation in two-way dialogue is one of the distinct features that differentiate social
media sites from more traditional media. When social media content is successful, open dialogue
23
between the university and current or prospective students is often the result (Kent, Taylor &
White, 2003; Mersham et al.2009).In their case study of Marquette University‘s use of social
media to engage with key stakeholders, Stageman& Berg (2013) report that it made sense for
Marquette University to be involved with social media because:
Good communication practice dictates that all methods are used to engage the
universities‘ audiences wherever they are.
There are already conversations about Marquette in social media, and their participation
allows the university to lead the discussion that defines their brand.
Social media was an innovative communication channel and allowed the communications
office to position the university as an innovator among their peers.
Social media gave the university the ability to interact directly with their audience and
connect the audience with each other, which is key to building engagement.
Social media allowed Marquette university to drive and harness the power of word of
mouth—the buzz factor—which is perceived as more credible and authentic than
traditional marketing materials.
Stageman and Berg, interviewed Marquette University‘s Tom Pionek, Director of Interactive
Marketing & Digital strategy and it was revealed that the initial goal of the University‘s social
media strategy was to ―be an active player in it and build a sense of community, characterizing
more broadly what the Office of Marketing and Communication was about, with social media as
an extension of that.‖(Personal communication, September 16, 2010). However, this broad goal
quickly evolved into a specific, measurable objective: to achieve interaction with five percent of
the audience within a given channel in any month and to reach 35,000 people on all University
24
accounts. Since the social media initiatives were very recent and no prior baseline existed, the
social media team created its own baseline and believed the five percent interaction was a
reasonable goal. In executing the social media strategies, Marquette University used social media
as an extension of what they were already doing in terms of marketing and communication. For
example, when Marquette sponsored its annual ―National Marquette Day‖ in January, social
media tactics, such as a Marquette pride photo competition on Flickr, were incorporated into an
integrated campaign that used many different branches of promotion. Although social media was
incorporated in the promotion of National Marquette Day, there were also many traditional
tactics, such as costume contests, games, reunions and prize giveaways around campus.
The combination of both online and traditional promotions helped to create a university event
that engaged alumni and current students, as well as helped prospective students have interaction
with Marquette University. According to Theunissen and Wan Noordin (2012), ―Ideally,
organizations should foster greater public interaction using the mass and new media, and have a
procedural approach to dialogue by establishing practices that facilitate the organization-
stakeholder dialogue‖
Stageman & Berg (2013) stated that, ―Not only did the marketing and communication team at
Marquette University seek to create relevant and interesting content that the target audience
could respond to; they also discussed the importance of creating dialogue. Whether the target
audience is reacting to posted content or reaching out to the school on their own, allowing the
opportunity for open dialogue was another important issue for the marketing and communication
team.‖Henderson and Bowley (2010), and Li (2010) have all emphasized the importance of
25
fostering dialogue in social media efforts, as dialogue ―has become ubiquitous in public relations
writing and scholarship, and even more so in the light of the ever-evolving Internet and its social
media application.‖ In the interview with Marquette University‘s director of marketing and
Communications, it was revealed that the university created and fostered dialogue through the
use of viral videos, ―The marketing team occasionally produces content that is directly for social
media, like remixed reactions from social media into a video—which I think is just brilliant on
extending the dialogue. You have an event, such as Father Wild retiring, when the school makes
the announcement, we post the video of the speech.
When people react online, [a marketing and communication team member] takes the reactions
and makes a video, posts [that video], and people react again. It‘s a great dialogue. (Personal
communication, April 9, 2010 cited in Stageman& Berg, 2013).Additionally, it was noted that
Marquette used Twitter to foster dialogue and connect people within the Marquette community.
To determine how successful the university was, the marketing and communications team
measured effectiveness based on the level of engagement, or interaction rates from each post on
all social media accounts. The university also used an application called Sprout Social to track
quantitative metrics. Sprout Social helps organizations manage their interactions with customers
on social networks. Measurement expert Paine (2009) argues that the only way to effectively
measure engagement is not by analyzing the number of stories, posts, tweets or videos that the
organization publishes online, but rather how people react to that content. Thus, engagement
should be tracked by number of comments, shares, mentions, ratings, followers, and fans.
Grunig, (2009 cited in Stageman& Berg, 2013) cautioned about the use of new media saying,
―many practitioners are using the new media in the same ways they used the old—as a means of
26
dumping messages on the general population rather than as a strategic means of interacting with
publics and bringing information from the environment into organizational decision-making.‖
Although social media was effectively helping Marquette University to engage with key
stakeholders, it was also revealed that not everything was successful because sometimes some
posts on pages elicited low response rates.
2.2.3 Emerging Gaps
The findings of other scholars as depicted in the literature review reveals that the rapid changes
in technology are having significant impact on the way the internet is used. In particular, the
study reveals that the technological changes will require higher learning institutions to
continually review their corporate communications strategies especially in the way they engage
with students. The literature also reveals that less research has been done in regard to the use of
social media as a tool of engaging students in higher learning institutions.
It is also noted that although social networking sites were continually evolving and becoming
part and parcel of the modern teenagers‘ lifestyle, institutions of higher learning still lag behind
in terms of adopting new media technologies that would help them better understand and
communicate with the modern students. Additionally, it is indicated that although some
institutions do have social media accounts, they lack appropriate social media strategies that
would help them succeed in their social media engagements.
27
2.3 Theoretical Framework
This study is mainly be guided by two theories- Adaptive Structuration theory (AST) and
Technological Acceptance Model (TAM).
2.3.1 Adaptive Structuration Theory (AST)
Adaptive structuration theory is derived from Antony Giddens‘ Structuration theory. Giddens
(1984) asserts that social actions are not random but rather are influenced by external and
internal forces within a social system or social structure. Giddens (1984) defines ―Structure‖ as
social rules and norms that are utilized in the creation or recreation of social systems as they
occur routinely. DeSanctis and Poole expand on this thought by examining this process in
regards to implementation of technology hypothesizing that individuals may use technology as it
was intended by design or alter its use in relation to their environment. Repetitive use of these
social rules can also restrict the extent of the technology use or cause a value judgment of the
technology (DeSanctis& Poole, 1994).
DeSanctis and Poole proposed adaptive structuration theory (AST) as a viable approach for
studying the role of advanced information technologies in organizational change. A major
strength of AST is that it expounds the nature of social structures within advanced information
technologies and the key interaction processes that figure in their use. AST examines the change
process from two vintage points (1) the types of structures that are provided by advanced
technologies and (2) the structures that actually emerge in human action as people interact with
these technologies (DeSanctis& Poole, 1994). According to Calloway (2013) researchers believe
that the effects of advancing technologies have more to do with how people use the technologies

28
than about the technologies themselves. For this reason, the human interaction often differs
somewhat from the intended impact of the technologies. Adaptive structuration theory is a
framework for studying the variations that exist within organizations as they occur from the
implementation of advancing technologies. According to AST, adaptation of technology
structures by organizational actors is a key factor in organizational change (Orlikowski, 1992).
There are two primary schools of thought that have advanced the study of information
technology and what drives organizational change and these two schools are(1) the decision
making school, which has its origin in the positivist tradition of research and presumes that
decision making is the ―primordial organizational act‖ (DeSanctis&Poole,1994) as cited in
(Colloway,2013) and the position that the technology should consist of structures(that is to say,
data and decision models) that have as the basis for their design to overcome human weaknesses
and once applied, these technologies should bring forth, efficiency, productivity, and overall
satisfaction to individuals and organizations(DeSanctis& Poole, 1994 in citing Rice,1984); and
(2) the institutional school, which advocates that the adaptation of technology is an opportunity
for change rather than a causal agent of change.
The focus of the latter school of thought for the institutionalists is less of a concern for the
structures within advancing technology and more on the social evolution within human
institutions (Calloway, 2013). These two schools of thought however have a common consensus
in the sense that the studies of technology and organizational change must focus on interaction
and encapsulate the historical processes as social practices evolve.

29
Maznevski (2000) conducted a study of global virtual teams using AST to guide their research.
Global virtual teams are defined as internationally distributed groups of individuals or teams
with a charter to make decisions for the organizations and to implement these decisions with
international components and implications. (Maznevski, 2000). These teams rarely meet in
person but rather make extended use of information and communications technology as the
means through which to conduct their business.
Maznevski studied three global virtual teams over a 21-month period utilizing multiple
methodologies to collect data including both qualitative and quantitative to develop a theory of
global virtual team dynamics and their effectiveness. Maznevski(in citing DeSanctis& Jackson,
1994) showed that the benefits from using more complex information and communication
technologies increased as the tasks became more complex. This study, combined with others
cited in Maznevski agree that the global virtual teams most effective use of communications
technologies are shaped by the teams tasks and its context and that the team organization
changed as a result of the advancing of the information and communication
technologies(Calloway,2013).
Within the Maznevskistudy, AST demonstrated the role of advanced information and
communications technology and its appropriation by members of the team as they worked
together. The theory also described how the inherent structural characteristics shaped the
interaction patterns without determining the interaction in a specific manner. From Maznevski‘s
study, AST is proven to be more associated with the study of organizational effectiveness in
technology use than any other theories.
30
Relevance of AST to the study
The adaptive structuration theory as discussed mainly implies that:
(1)Social or organizational interactions are influenced through the implementation of technology.
(2)People‘s experiences, environment or opinions about technology influence its use.
(3) These influences alter the way technology is used either reinforcing its intended use or
creating new frameworks for use.
(4) Repetitive use within these new frameworks can result in changes in social or organizational
structures or even technological designs.
As mentioned in the previous chapter, the main objective of this study is to investigate the use of
social media as a tool of corporate communications in institutions of higher learning. Previous
research indicates that the importance of social media as a platform for social interaction,
communication and marketing is growing and many businesses including higher learning
institutions have already integrated or plan to integrate social media applications into their
communication strategies. On the basis of AST, social media networks were created to provide
interpersonal connectivity to its users. The users began using the technology to drive trends
through sharing experiences with products and services or rallying behind a course. Large
organizations began following these trends and implemented the technology use for themselves
despite the use being outside the scope of the technologies‘ original design.
Initially, social media sites such as Facebook and Twitter were created for a single user who was
to connect with friends. However, the alteration of the technologies by large organizations
including higher learning institutions resulted in social networking sites adjusting their designs to

31
meet the needs of organizations to connect with their consumers. The AST will guide this study
by interrogating how institutions of higher learning use social networking sites to connect with
students and at the same time counteract negative feedback. Although individuals began using
social media to connect with one another, organizations saw the impressive abilities of social
networking and decided to utilize the system for their own benefit and as a result social media
pages have adjusted themselves and their designs to meet the new needs of the organizations. In
a nutshell, the AST is relevant for this study because it helps provide an understanding of how
the use of social media as a tool of corporate communications in institutions of higher learning
helps to establish and promote a mutual interaction between students and institutions.
2.3.2 Technological Acceptance Model (TAM)
The Technological Acceptance Model (TAM) is an information systems theory that models how
users accept and use a technology. The TAM was adopted from another popular theory called
theory of reasoned action (TRA; Fishbein and Ajzen, 1975) from field of social psychology
which explains a person‘s behavior through their intentions. Intention in turn is determined by
two constructs: individual attitudes toward the behavior and social norms or the belief that
specific individuals or a specific group would approve or disprove of the behavior (Rauniar et
al.,2013).
Since TAM‘s inception in 1989, it has become the most popular theoretical model used in the
information systems field worldwide to describe users‘ acceptance or rejection of information
systems (Lee et al., 2003, cited in Munguatosha, Muyinda&Lubega, 2011). The adoption and use
of social media by higher learning institutions to engage students can also be understood through

32
the application of TAM. According to Davis et al. (1989), ―Perceived usefulness of the system‖
and Perceived ease of use of the system‖ are the key determinant factors towards ―user intention
to use the system.‖ TAM identifies causal relationships between system design variables,
perceived usefulness of the system, perceived ease of use of the system, individual‘s attitudes
towards the use of the system and actual behavior (Munguatosha, Muyinda &Lubega, 2011).
According to Davis et al. (1989) The main idea behind TAM is that people tend to accept or
reject technology to the extent they believe it is helpful in performing their job better (perceived
usefulness) and if a user believes that learning to use that technology in place is free effort (ease
of use). Generally perceived ease of use (PEOU) of the system, perceived system usefulness
(PSU), user intention to use the system (UIUS) and user subjective norms (USN) towards the
system in place are the key factors in building technology utilization models (Davis et al., 1989;
Venkatesh et al., 2003).
TAM has been revised in many studies to fit a particular context of technology being
investigated. One important and well-received revision of TAM has been the inclusion of social
influence processes in predicting the usage behavior of a new technology by its users
(Venkatatesh and Davis, 2000).One benefit of using TAM to understand acceptance and usage of
information technology is that it provides a framework to investigate the effects of external
variables on system usage (Hong et al, 2001 cited in Nasri & Charfeddine, 2012).
Despite its wide usage and benefits, TAM has also been widely criticized for its limited
explanatory and predictive power. TAM has diverted researchers‘ attention away from other

33
important research issues and has created an illusion of progress in knowledge accumulation
(Chuttur, 2009). Additionally, the independent attempts by several researchers to expand TAM
in order to adapt to the constantly changing IT environment has led to a state of theoretical chaos
and confusion (Benbasat&Barki, 2007). According to Baggozzi (2007) TAM focuses on the
individual ―user‖ of a computer, with the concept of ―perceived usefulness,‖ with extension to
bring in more and more factors to explain how a user ―perceives‖ ―usefulness,‖ and ignores the
essentially social processes of information systems development and implementation. Perceived
ease of use is less likely to be a determinant of attitude and usage intention according to studies
of telemedicine (Hu et al. 1999).
The application of TAM in this study is relevant in explaining the acceptance and usage of social
media as a tool of corporate communications in higher learning institutions. More specifically,
TAM will provide an insight into the perceived usefulness of social media as well as explain the
ease of applying social media technologies by higher learning institutions in their routine
engagement with students.
34
CHAPTER THREE: RESEARCH METHODOLOGY
3.0 Introduction
The purpose of this chapter is to present research strategies and the empirical techniques that
were applied in this study.
3.1 Research site
As mentioned in the title and previous chapters, this research is based on a case study of the
University of Nairobi. Therefore, it was logical to have the University of Nairobi as the research
site. In particular, the main campus of the university located in the Central Business District
(CBD) of Nairobi city was the main site. The main campus is one of the biggest campuses of the
University of Nairobi and it is also the main administrative centre of the entire university.
Additionally, the main campus has the largest population of students and it also accommodates
the university‘s public relations office which primarily discharges corporate communications
functions that are of interest to this study.
3.2 Research Design
Burns and Grove (2003:195) define a research design as ―a blueprint for conducting a study with
maximum control over factors that may interfere with the validity of the findings‖. Polit et al
(2001:167) define a research design as ―the researcher‘s overall for answering the research
question or testing the research hypothesis‖. A research design is as a plan that describes how,
when and where data are to be collected and analysed (Parahoo, 1997).
35
This study is a case study research. Yin (1994) defines a case study research method as an
empirical inquiry that investigates a contemporary phenomenon within its real-life context; when
the boundaries between phenomenon and context are not clearly evident; and in which multiple
sources of evidence are used. Soy (1997) argues that a key strength of the case study method is
the fact that it involves using multiple sources and techniques in the data gathering process and
that the researcher is able to determine in advance what evidence to gather and what analysis
techniques to use with the data to answer the research questions. The case study strategy has
been argued to be particularly useful for practice-based problems where the experience of the
actors is important and the context of action is critical (Lee, 1989; Galliers, 1991).Farhoomand
(1992) shows that from 1977 to 1985 the case study was one of the most popular research
methods (25.4%) from 636 papers surveyed from journals focused on or related to information
systems.‖
3.3 Study Population
The target population of this study consists of undergraduate and postgraduate students of the
University of Nairobi.
3.4 Pilot Study
A feasibility study was conducted at the University of Nairobi, Main Campus. The purpose of
the study was to discover the levels of social media engagement between the University and the
students. The study included a survey of five students from the College of Humanities and Social
Sciences (CHSS).

36
3.5 Sample size and Sampling Technique
This section consists of the sample size and sampling techniques that will be applied in this study
3.6 Sample size
The sample size for this study was 150 students.
3.7 Sampling Technique
In order to get a correct and most representative sample size, the stratified random sampling
technique will be applied in this study. Stratified random sampling is a technique which attempts
to restrict the possible samples to those which are ―less extreme‖ by ensuring that all parts of the
population are represented in the sample in order to increase the efficiency (That is to decrease
the error in the estimation). The technique may also be defined as a random sample of a
population in which the population is first divided into distinct subpopulations, or strata and
random samples are then taken separately from each stratum.
The target population of this study will mainly be sub-divided on the basis of gender, levels of
study (undergraduate and post-graduate), as well as colleges, schools and faculties. The sample
for the study will therefore be drawn from the College of Humanities and Social Sciences located
in Main campus and in particular, the school of Economics, school of Journalism and the
Institute of Diplomacy and International Studies.

37
3.8 Data Collection Methods
In order to understand how the University of Nairobi uses social media to communicate with its
key clients, a key informant interview was conducted with a communications professional who is
responsible for the management of the University‘s corporate social media accounts. Data was
also collected through a survey of 150 students from the College of Humanities and Social
Sciences. Written questionnaires were distributed to five Web Champions from the College of
Humanities and Social Sciences. Web champions at the University of Nairobi are mainly charged
with the responsibility of managing websites and social media accounts of respective schools and
colleges. Therefore, the Web Champions are reliable professionals who have firsthand
knowledge and experience with social media at college and departmental levels.
3.9 Data Analysis and Presentation
The feedback presented from the respondents‘ questionnaires were analyzed and interpreted with
the help of Statistical Package for Social Sciences (SPSS) software. Findings from the Key
Informant interview were presented through descriptions. The data was presented in form of
tables, percentages pie charts and bar graphs.

38
CHAPTER FOUR: DATA ANALYSIS, INTERPRETATION AND
DISCUSSION
4.1 Introduction
This chapter presents the data analysis, presentation and interpretation of findings on the data
collected from a key informant interview with the Web Communications Officer of the
University of Nairobi, as regards to how the university uses social media to communicate with its
publics. This chapter will also present findings from a survey of sampled 150 students drawn
from the College of Humanities and Social Sciences (main campus). Five Web Champions from
the College of Humanities and Social Sciences were also surveyed. The data was interpreted as
per the research questions of the study. The analysis was done through descriptive and inferential
statistics. The findings of the study were presented in the form of frequency tables and
percentages.
4.2 How the University of Nairobi Uses Social Media to communicate with its Publics
The researcher conducted a 35 minutes key informant interview with the Web Communications
Officer of the University of Nairobi. One of the responsibilities of the Web Communications
Officer is to initiate and develop the university‘s social media communications initiatives within
and outside the university. As such, the Web Communications Officer has firsthand knowledge
and experience with the use of social media at the University of Nairobi. The interview was
done with the possibility of follow up emails on issues that needed further clarifications.
39
This study reveals that the University of Nairobi viewed social media as a progressive
communications technology and a way to connect with current and prospective students who
were already using social media to communicate. In a similar study, Stageman & Berg (2013)
discovered that beginning 2007 academic institutions started to build a presence on social media
sites as a strategy to connect with current students and to reach prospective students. (p.3) Solis
(2008) observed that social media gives us the opportunity to humanize stories of students and
alumni of our institutions which can create loyalty and earn future business (students), and
ultimately their respect. As social media continues to gain popularity, especially with the
younger generations, it is important that institutions are keeping up with these trends (Kelly,
2014).
The study also revealed that the University of Nairobi mainly used Twitter and Facebook as its
social media channels of communication. Vasquez & Velez (2011) found that Facebook was the
social media platform most used by Puerto Rican Companies with Twitter coming second. In
another study in Georgia, Kelly (2014) found that Facebook is the most commonly used social
media platform by institutions with a 100% usage rate reported. YouTube was the next most
popular platform and 91.7% of respondents reported using this site to communicate with
stakeholders. The third most popular outlet is Twitter with 87.5% of respondents having an
account for their institution. (p.6). However, the University of Nairobi still maintained other
social media channels including Google+, YouTube and blogs.
40
During the interview, the Web Communications Officer said that the University of Nairobi was
very strategic in the way it packaged information for various social media audiences and that this
always guaranteed immediate success in the university‘s communications efforts:
“We normally simplify and package our information depending on our
target audience. For example, information on scholarships and
achievements by individual students in respective areas attracts a lot of
shares and interaction on our social media platforms by currents and
prospective students while information on available job opportunities and
requirements is able to draw a lot of attraction and reactions from the
alumni.”(Research data, 2014)
In their study of Marquette University‘s social media strategy, Stageman & Berg (2013) found
that Marquette University‘s social media strategy was designed to appeal to each group of
stakeholders, including prospective students, current students, and alumni and as a result the
university has shaped social media around the unique needs of each group. This is able to
cultivate a deep relationship between universities and its stakeholders.
The University of Nairobi used social media to inform its stakeholders of key events taking place
in the university such as exam dates, new semester dates, public lectures, and corporate social
responsibility initiatives among others.
The Web Communications Officer also said that the university used social media to manage
crises:

41
“There was an incidence where someone was sending scandalous text
messages to students that the university was closed down because of a
student strike as a result of fee increment and we quickly countered that
through our social media pages thus normal operations within the
university were not interfered with.”(Research data, 2014)
Vasquez and Velez (2011) found that social media was not employed for communicating
important company messages such as corporate news, annual reports, corporate social
responsibility and philanthropy initiatives among others and that social media platform were
neither used to provide feedback nor to promote conversations with stakeholders. This means
that the University of Nairobi unlike companies in Puerto Rico utilizes the potential of social
media as both a communications tool and a marketing tool.
This study also found that the University of Nairobi uses social networking sites to compliment
other modes of communications such as the websites, newsletters, notice boards, radio and
television:
“This is because not all the students are following us on social media and
they still rely on the other channels of communication to get information
from the university. At the same time, there are others who may not get the
information from the Newspapers or other channels but will still get us on
social media because they do follow us on our official social media pages.
So strategically, this is a win-win situation for the university in terms of
communication with our customers.”(Research data, 2014)

42
Theunissen and Wan Noordin (2012) supported this idea by stating that ideally, organizations
should foster greater public interaction using the mass and new media, and have a procedural
approach to dialogue by establishing practices that facilitate stakeholder dialogue. (p.10)
The study also revealed that the University of Nairobi has strategically adopted social media in
its official communications policy. It is emphasized that social media must always be used in
communicating at not only the corporate level but also at college, faculty, schools and
departmental levels. According to the Web Communications Officer, Social media
communications is in fact an element that counts when negotiating performance contracts within
various units in the university.
“The University of Nairobi looks at social media as an innovative way of serving
its customers in an instant. “In our social media pages, we receive messages,
reactions and customer queries about our products and services and we are
always ready to respond to their needs immediately” (Research data, 2014).
The interview also revealed that social media is also used for marketing the university‘s products
and services. The university has income generating units which apart from advertising in the
mainstream media find it useful to use social media to market their products and services to the
target audience. Social media essentially helps the university save a lot of advertising costs.
Vasquez & Velez (2011) found that the aim of using social media channels for the few Puerto
Rican companies with a presence in social media was basically for marketing intentions and that
companies were doing efforts in informing about their products and services especially through
Facebook.

43
During the interview, it was also revealed that the University of Nairobi‘s Public Relations office
understands the fact that social media can build or destroy a brand and thus when handling
complains or negative feedback on social media, they do it responsibly with the image of the
university at the forefront. In consultation with relevant departments, the Web Communications
Officer is able to solve relevant customer complains presented through the social media pages.
How people feel about a specific organization or brand influences how they voice opinions
online, and ―their willingness to share content with others is extremely useful in increasing brand
engagement and relevance‖ (Shu-Chan & Yoojung, 2011, p.50).
In their study of Marquette University, Stageman & Berg (2013) observed that whether the target
audience was reacting to posted content or reaching out to the school on their own, allowing the
opportunity for open dialogue was an important issue for the marketing and communication
team. Mersey, Malthouse and Calder (2010) underscored the importance of an organizations
understanding of engagement as a way to create value for consumers and set its brand and social
content apart from others.
When asked how the University of Nairobi measured and evaluated their social media activities,
the Web Communications officer said that the Public Relations office conducted a monthly
evaluation of the University‘s social media activities. The evaluation was usually done
manually. However, the evaluation task was made easier due to the user friendly social media
features:
“Facebook and Twitter are well customized and we are able to see how
many shares likes and comments we had on a single post on our pages. An
44
evaluation of our social media activities helps us devise new ways of
improving our online presence.”(Research data, 2014).
According to Burson-Masteller (2012), companies must monitor their own social media
presence to ensure a consistent brand message and to measure the impact of their social media
engagement. However, rather than manually evaluating the social media sites, the University of
Nairobi can take advantage of free social media monitoring tools available online such as;Klout,
TweetReach, Hootsuite,Socialmention, Twazzup and TweetDeck among others. The only way to
effectively measure engagement is not by analyzing the number of stories, post, tweets or videos
that the organization publishes online, but rather how people react.(Paine, 2009) as cited in
(Stageman &Berg, 2013). Thus, comments can be measured in terms of shares, comments,
ratings, fans, followers and ratings.
4.3 Questionnaires Return Rate
In the study, 150 questionnaires were distributed. Out of these 120 of them were returned and
they were completely answered. The number of the questionnaires returned represents 80 % of
the expected sample size. A 100 % of the questionnaires that were returned were completely
filled implying that there were no spoilt ones.
4.4 Composition of Respondents by Gender
In the study, respondents were sampled in regard to their gender; consider male students and
female students.
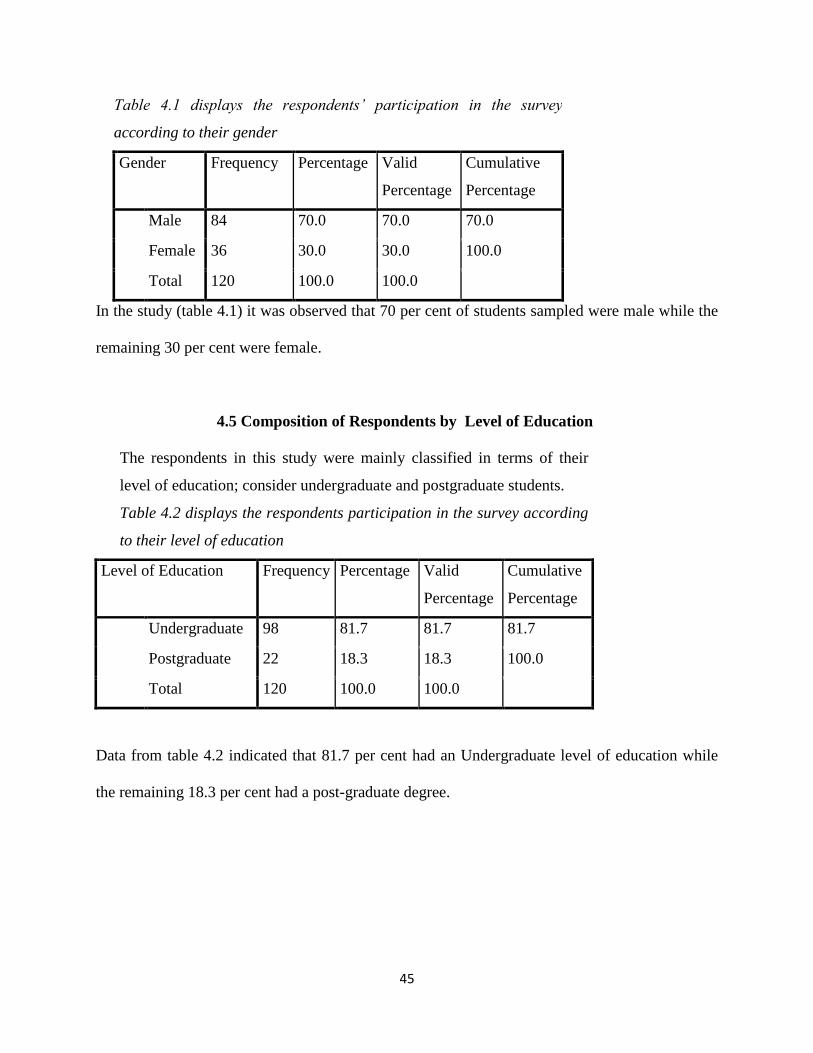
45
Table 4.1 displays the respondents’ participation in the survey
according to their gender
Gender Frequency Percentage Valid
Percentage
Cumulative
Percentage
Male 84 70.0 70.0 70.0
Female 36 30.0 30.0 100.0
Total 120 100.0 100.0
In the study (table 4.1) it was observed that 70 per cent of students sampled were male while the
remaining 30 per cent were female.
4.5 Composition of Respondents by Level of Education
The respondents in this study were mainly classified in terms of their
level of education; consider undergraduate and postgraduate students.
Table 4.2 displays the respondents participation in the survey according
to their level of education
Level of Education Frequency Percentage Valid
Percentage
Cumulative
Percentage
Undergraduate 98 81.7 81.7 81.7
Postgraduate 22 18.3 18.3 100.0
Total 120 100.0 100.0
Data from table 4.2 indicated that 81.7 per cent had an Undergraduate level of education while
the remaining 18.3 per cent had a post-graduate degree.
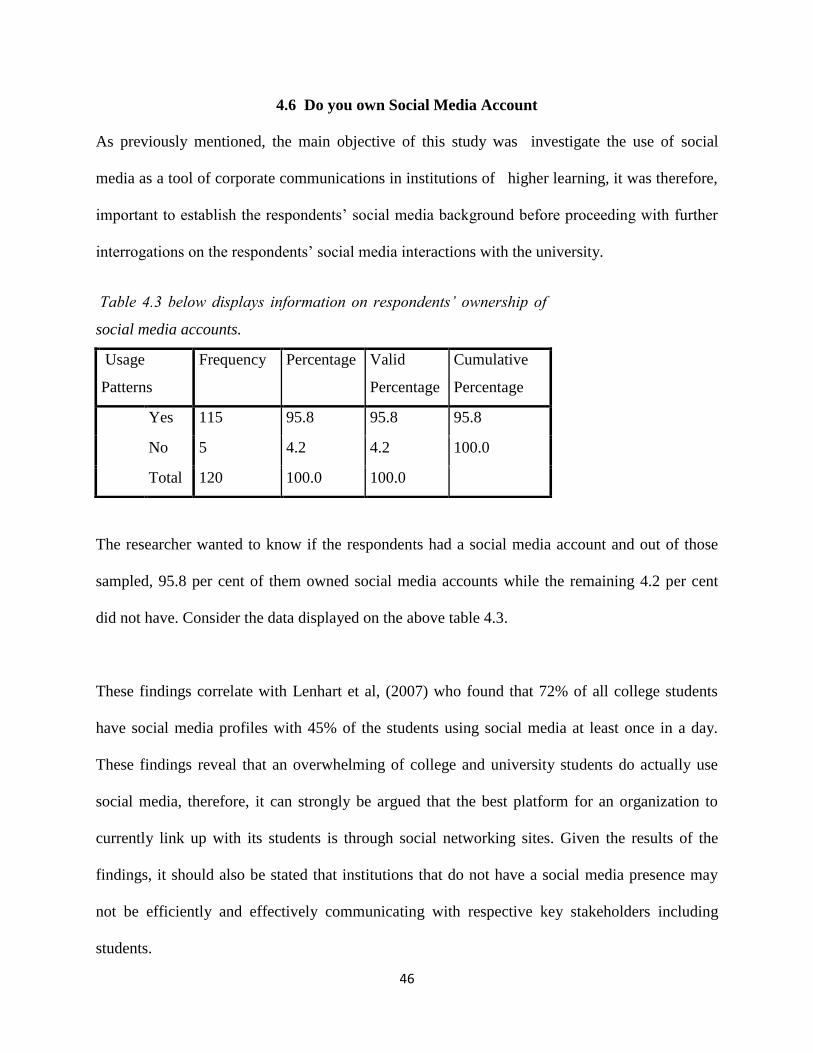
46
4.6 Do you own Social Media Account
As previously mentioned, the main objective of this study was investigate the use of social
media as a tool of corporate communications in institutions of higher learning, it was therefore,
important to establish the respondents‘ social media background before proceeding with further
interrogations on the respondents‘ social media interactions with the university.
The researcher wanted to know if the respondents had a social media account and out of those
sampled, 95.8 per cent of them owned social media accounts while the remaining 4.2 per cent
did not have. Consider the data displayed on the above table 4.3.
These findings correlate with Lenhart et al, (2007) who found that 72% of all college students
have social media profiles with 45% of the students using social media at least once in a day.
These findings reveal that an overwhelming of college and university students do actually use
social media, therefore, it can strongly be argued that the best platform for an organization to
currently link up with its students is through social networking sites. Given the results of the
findings, it should also be stated that institutions that do not have a social media presence may
not be efficiently and effectively communicating with respective key stakeholders including
students.
Table 4.3 below displays information on respondents’ ownership of
social media accounts.
Usage
Patterns
Frequency Percentage Valid
Percentage
Cumulative
Percentage
Yes 115 95.8 95.8 95.8
No 5 4.2 4.2 100.0
Total 120 100.0 100.0

47
4.7 Respondents’ Usage of Facebook
Table 4.4 below displays respondents’ usage patterns of Facebook
Usage Patterns Frequency Percentage Valid
Percentage
Cumulative
Percentage
Constant User 50 41.7 41.7 41.7
Regular User 40 33.3 33.3 75.0
Occasional User 25 20.8 20.8 95.8
Past User 3 2.5 2.5 98.3
Never Used it 2 1.7 1.7 100.0
Total 120 100.0 100.0
The respondents were asked their current usage of social media platforms and the following
observations were made:
41.7 per cent of them are constant users
33.3 per cent were Regular users
20.8 per cent were Occasional users
2.5 per cent indicated that they were Past users
The remaining 1.7 percent reported that they had never owned a face book account
In their study, Hassan et al, (2012) found that the most popular online network was Facebook,
with 96% of all university students saying they use it on a typical day. From the findings of this
study, it therefore can be argued that Facebook is a very popular tool of communication among
university students with majority saying that they constantly use Facebook while a big number
said they used it on a regular basis. It can therefore be argued that institutions which have a
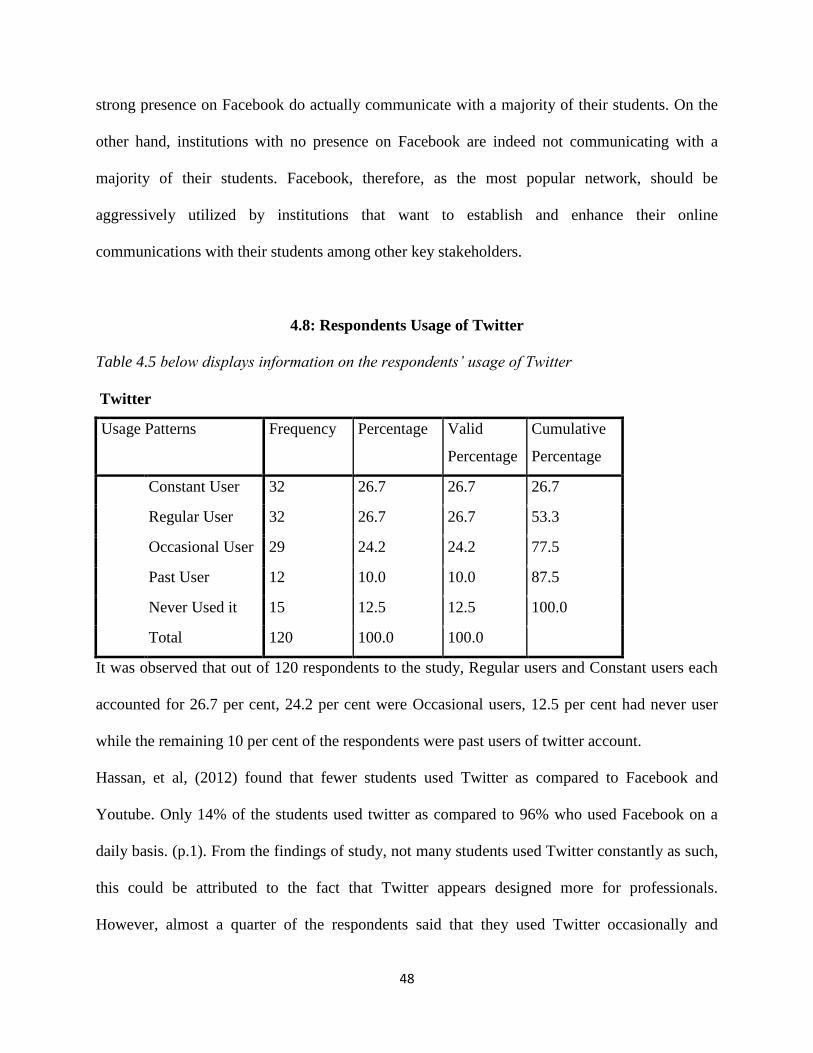
48
strong presence on Facebook do actually communicate with a majority of their students. On the
other hand, institutions with no presence on Facebook are indeed not communicating with a
majority of their students. Facebook, therefore, as the most popular network, should be
aggressively utilized by institutions that want to establish and enhance their online
communications with their students among other key stakeholders.
4.8: Respondents Usage of Twitter
Table 4.5 below displays information on the respondents’ usage of Twitter
Usage Patterns Frequency Percentage Valid
Percentage
Cumulative
Percentage
Constant User 32 26.7 26.7 26.7
Regular User 32 26.7 26.7 53.3
Occasional User 29 24.2 24.2 77.5
Past User 12 10.0 10.0 87.5
Never Used it 15 12.5 12.5 100.0
Total 120 100.0 100.0
It was observed that out of 120 respondents to the study, Regular users and Constant users each
accounted for 26.7 per cent, 24.2 per cent were Occasional users, 12.5 per cent had never user
while the remaining 10 per cent of the respondents were past users of twitter account.
Hassan, et al, (2012) found that fewer students used Twitter as compared to Facebook and
Youtube. Only 14% of the students used twitter as compared to 96% who used Facebook on a
daily basis. (p.1). From the findings of study, not many students used Twitter constantly as such,
this could be attributed to the fact that Twitter appears designed more for professionals.
However, almost a quarter of the respondents said that they used Twitter occasionally and

49
regularly. Institutions therefore, should also use Twitter aggressively in order to communicate
effectively and efficiently with the more than a quarter of the key stakeholders using Twitter to
communicate either regularly or occasionally.
4.9 Respondents Usage of YouTube
Table 4.6 below displays information on the respondents’ usage of Youtube
YouTube
Usage Patterns Frequency Percentage Valid
Percentage
Cumulative
Percentage
Constant User 25 20.8 21.0 21.0
Regular User 30 25.0 25.2 46.2
Occasional User 42 35.0 35.3 81.5
Past User 8 6.7 6.7 88.2
Never Used it 14 11.7 11.8 100.0
Total 120 100.0 100.0
Total 120 100.0
In the study, it was observed that out of 120 respondents 20.8 per cent of the respondents are
constant users of YouTube, 25 per cent were Regular Users of you tube , 35 per cent were
occasional users,6.7 per cent were past users while the remaining 11.7 per cent of them had
never used you tube.
In their study, Hassan et al, (2012) found that 84% of the students used YouTube. Although an
overwhelming number of students used YouTube, this could be similar to the findings of this
study since almost half of the respondents use YouTube to communicate. (p.1).
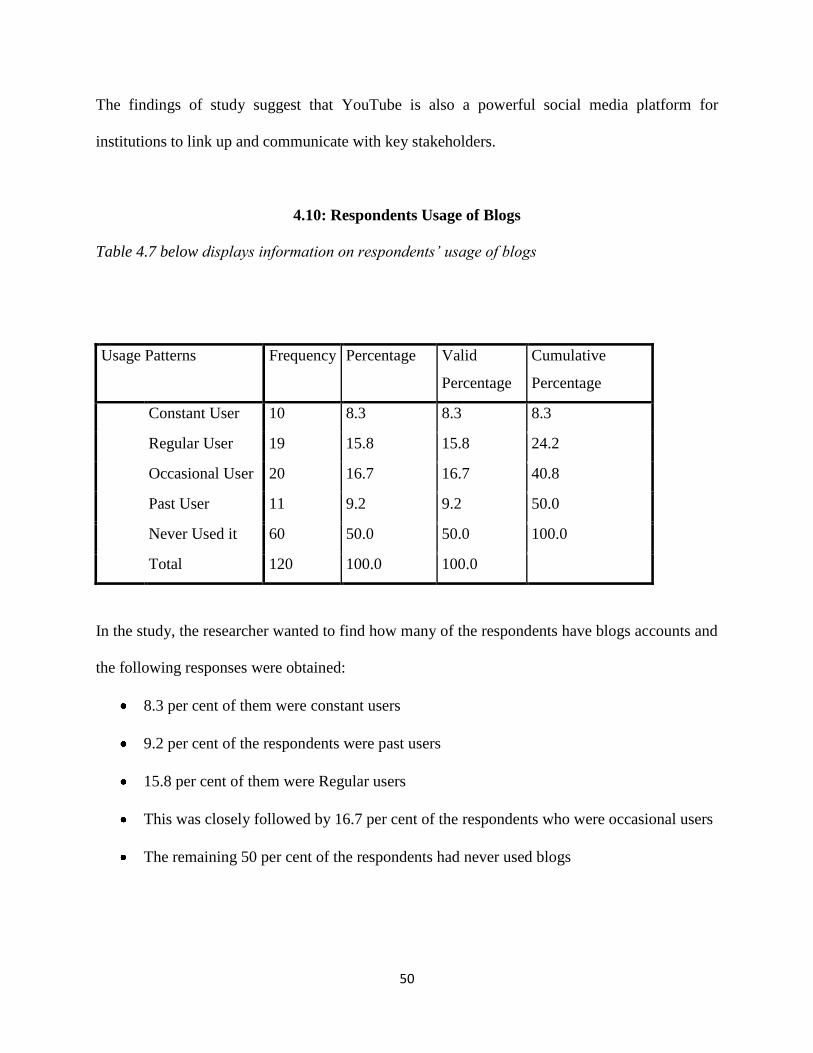
50
The findings of study suggest that YouTube is also a powerful social media platform for
institutions to link up and communicate with key stakeholders.
4.10: Respondents Usage of Blogs
Table 4.7 below displays information on respondents’ usage of blogs
Usage Patterns Frequency Percentage Valid
Percentage
Cumulative
Percentage
Constant User 10 8.3 8.3 8.3
Regular User 19 15.8 15.8 24.2
Occasional User 20 16.7 16.7 40.8
Past User 11 9.2 9.2 50.0
Never Used it 60 50.0 50.0 100.0
Total 120 100.0 100.0
In the study, the researcher wanted to find how many of the respondents have blogs accounts and
the following responses were obtained:
8.3 per cent of them were constant users
9.2 per cent of the respondents were past users
15.8 per cent of them were Regular users
This was closely followed by 16.7 per cent of the respondents who were occasional users
The remaining 50 per cent of the respondents had never used blogs
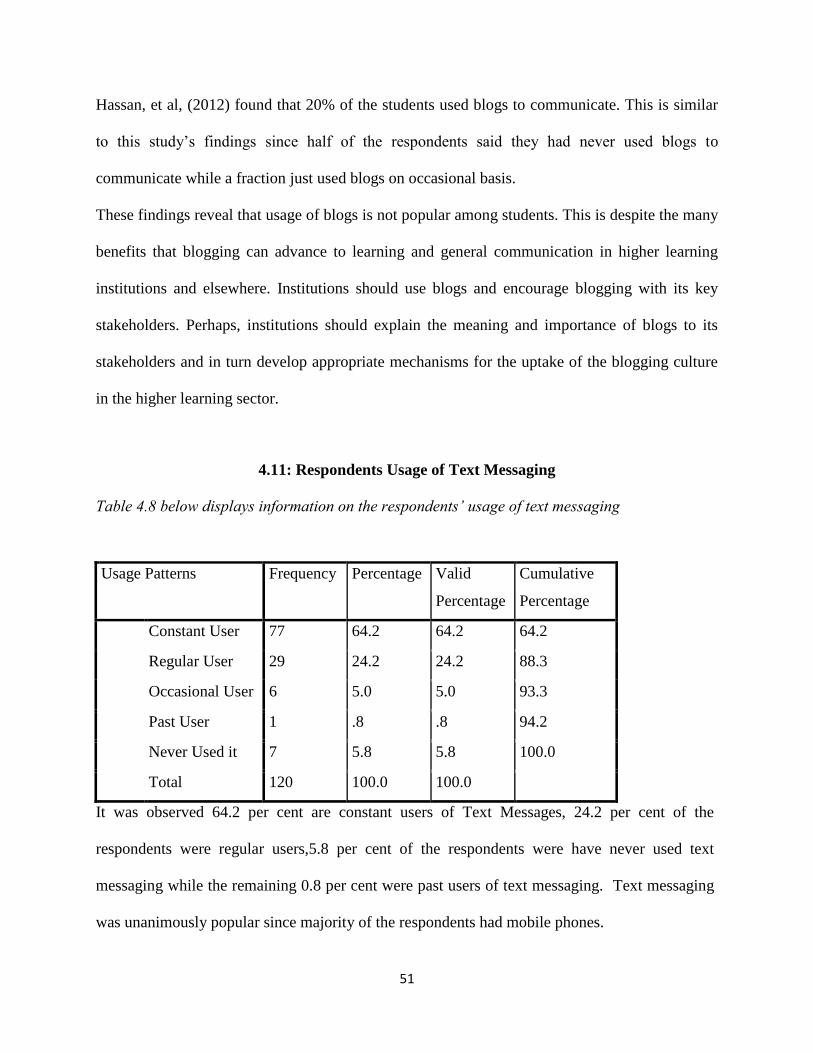
51
Hassan, et al, (2012) found that 20% of the students used blogs to communicate. This is similar
to this study‘s findings since half of the respondents said they had never used blogs to
communicate while a fraction just used blogs on occasional basis.
These findings reveal that usage of blogs is not popular among students. This is despite the many
benefits that blogging can advance to learning and general communication in higher learning
institutions and elsewhere. Institutions should use blogs and encourage blogging with its key
stakeholders. Perhaps, institutions should explain the meaning and importance of blogs to its
stakeholders and in turn develop appropriate mechanisms for the uptake of the blogging culture
in the higher learning sector.
4.11: Respondents Usage of Text Messaging
Table 4.8 below displays information on the respondents’ usage of text messaging
Usage Patterns Frequency Percentage Valid
Percentage
Cumulative
Percentage
Constant User 77 64.2 64.2 64.2
Regular User 29 24.2 24.2 88.3
Occasional User 6 5.0 5.0 93.3
Past User 1 .8 .8 94.2
Never Used it 7 5.8 5.8 100.0
Total 120 100.0 100.0
It was observed 64.2 per cent are constant users of Text Messages, 24.2 per cent of the
respondents were regular users,5.8 per cent of the respondents were have never used text
messaging while the remaining 0.8 per cent were past users of text messaging. Text messaging
was unanimously popular since majority of the respondents had mobile phones.

52
The findings suggest that institutions can take advantage of the popular text messaging platform
to effectively reach and communicate with students. A flexible chat forum or an interactive
phone number would be appropriate in this case. The implication for this would be a healthy
discussion and an understanding between institutions and its key stakeholders.
4.12:Respondents Usage of Flickr
Table 4.9 below displays information on the respondents‘ usage of Flickr
Period Frequency Percentage Valid
Percentage
Cumulative
Percentage
Constant User 5 4.2 4.2 4.2
Regular User 8 6.7 6.7 10.8
Occasional User 19 15.8 15.8 26.7
Past User 8 6.7 6.7 33.3
Never Used it 80 66.7 66.7 100.0
Total 120 100.0 100.0
When asked if they were registered on Flickr, it was observed that 66.7 percent of the
respondents had never used it, Regular and Past users each accounted for 6.7 percent of the
respondents, 4.2 percent of them were Constant users while the remaining 15.8 percent of them
were Occasional users
Hassan et al, (2012) found that LinkedIn Flickr were the least used social media platforms
among university students. This is similar to the findings of this study which reveal that an
overwhelming majority have never used Flickr.
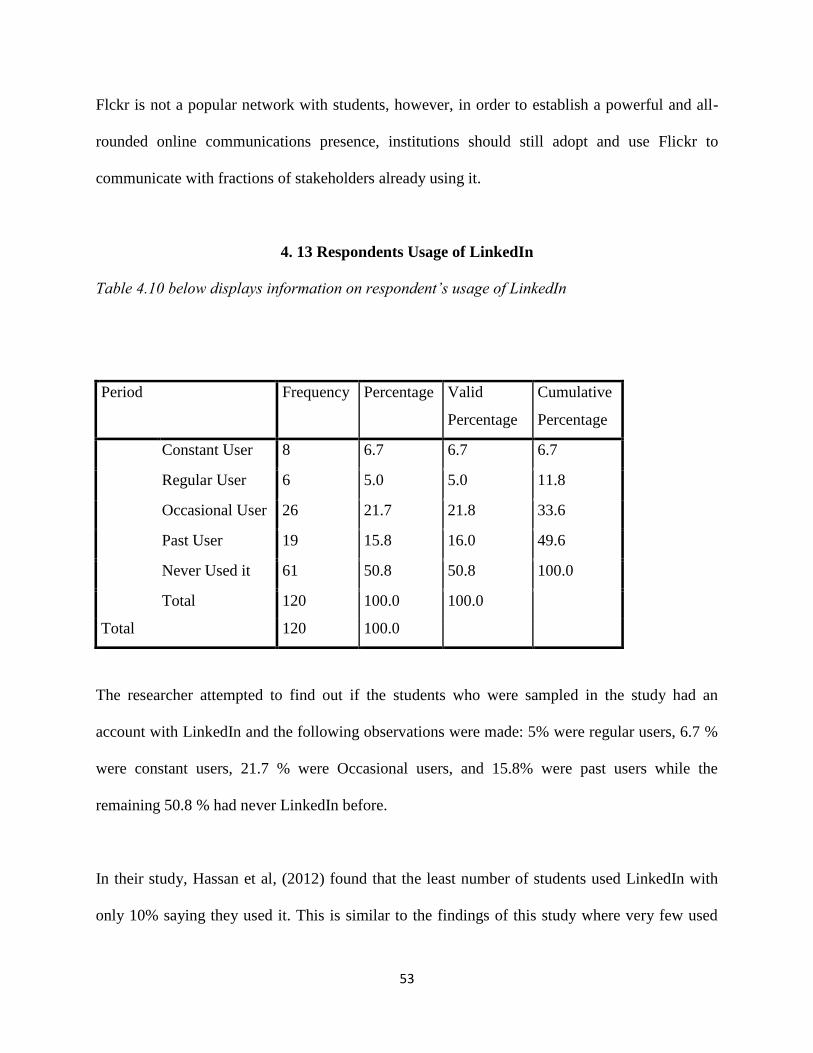
53
Flckr is not a popular network with students, however, in order to establish a powerful and all-
rounded online communications presence, institutions should still adopt and use Flickr to
communicate with fractions of stakeholders already using it.
4. 13 Respondents Usage of LinkedIn
Table 4.10 below displays information on respondent’s usage of LinkedIn
Period Frequency Percentage Valid
Percentage
Cumulative
Percentage
Constant User 8 6.7 6.7 6.7
Regular User 6 5.0 5.0 11.8
Occasional User 26 21.7 21.8 33.6
Past User 19 15.8 16.0 49.6
Never Used it 61 50.8 50.8 100.0
Total 120 100.0 100.0
Total 120 100.0
The researcher attempted to find out if the students who were sampled in the study had an
account with LinkedIn and the following observations were made: 5% were regular users, 6.7 %
were constant users, 21.7 % were Occasional users, and 15.8% were past users while the
remaining 50.8 % had never LinkedIn before.
In their study, Hassan et al, (2012) found that the least number of students used LinkedIn with
only 10% saying they used it. This is similar to the findings of this study where very few used
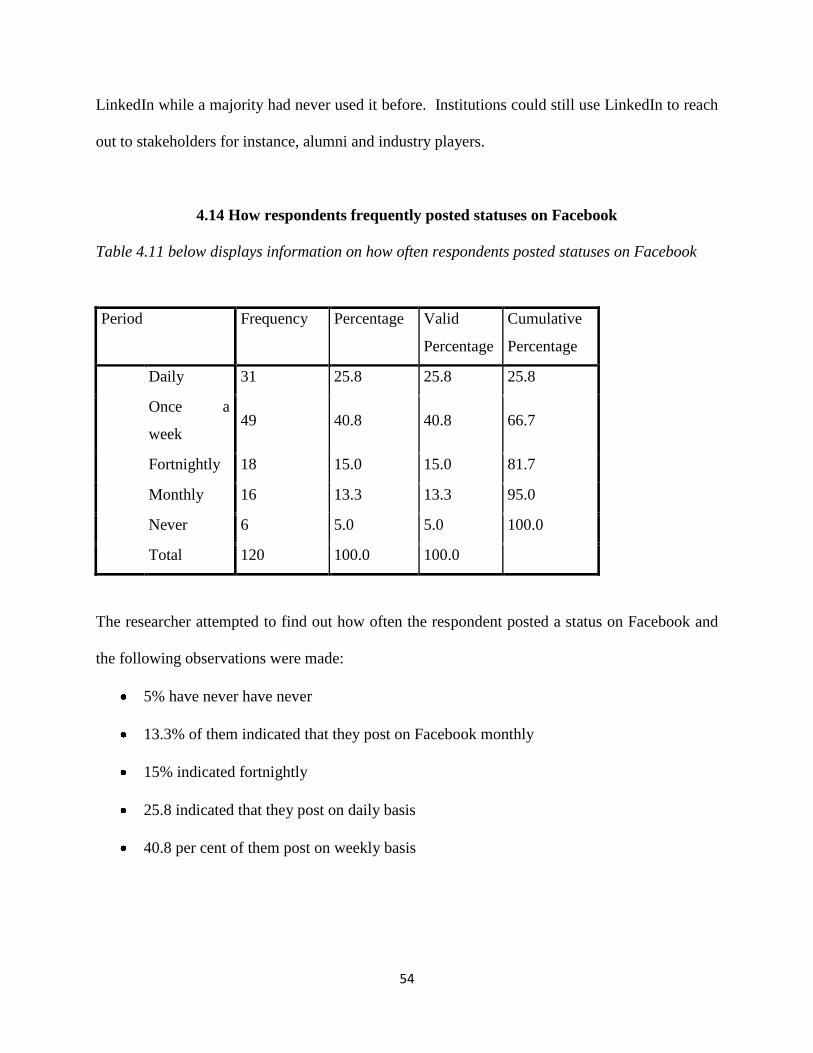
54
LinkedIn while a majority had never used it before. Institutions could still use LinkedIn to reach
out to stakeholders for instance, alumni and industry players.
4.14 How respondents frequently posted statuses on Facebook
Table 4.11 below displays information on how often respondents posted statuses on Facebook
Period Frequency Percentage Valid
Percentage
Cumulative
Percentage
Daily 31 25.8 25.8 25.8
Once a
week 49 40.8 40.8 66.7
Fortnightly 18 15.0 15.0 81.7
Monthly 16 13.3 13.3 95.0
Never 6 5.0 5.0 100.0
Total 120 100.0 100.0
The researcher attempted to find out how often the respondent posted a status on Facebook and
the following observations were made:
5% have never have never
13.3% of them indicated that they post on Facebook monthly
15% indicated fortnightly
25.8 indicated that they post on daily basis
40.8 per cent of them post on weekly basis
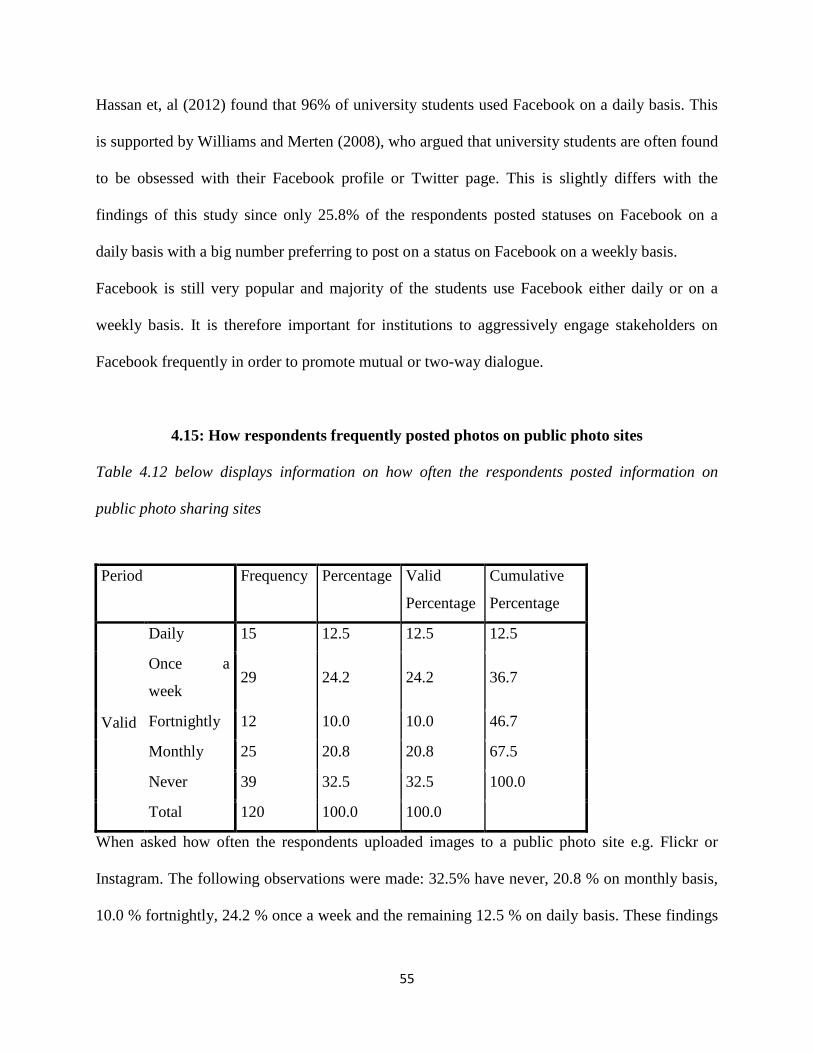
55
Hassan et, al (2012) found that 96% of university students used Facebook on a daily basis. This
is supported by Williams and Merten (2008), who argued that university students are often found
to be obsessed with their Facebook profile or Twitter page. This is slightly differs with the
findings of this study since only 25.8% of the respondents posted statuses on Facebook on a
daily basis with a big number preferring to post on a status on Facebook on a weekly basis.
Facebook is still very popular and majority of the students use Facebook either daily or on a
weekly basis. It is therefore important for institutions to aggressively engage stakeholders on
Facebook frequently in order to promote mutual or two-way dialogue.
4.15: How respondents frequently posted photos on public photo sites
Table 4.12 below displays information on how often the respondents posted information on
public photo sharing sites
Period Frequency Percentage Valid
Percentage
Cumulative
Percentage
Valid
Daily 15 12.5 12.5 12.5
Once a
week 29 24.2 24.2 36.7
Fortnightly 12 10.0 10.0 46.7
Monthly 25 20.8 20.8 67.5
Never 39 32.5 32.5 100.0
Total 120 100.0 100.0
When asked how often the respondents uploaded images to a public photo site e.g. Flickr or
Instagram. The following observations were made: 32.5% have never, 20.8 % on monthly basis,
10.0 % fortnightly, 24.2 % once a week and the remaining 12.5 % on daily basis. These findings
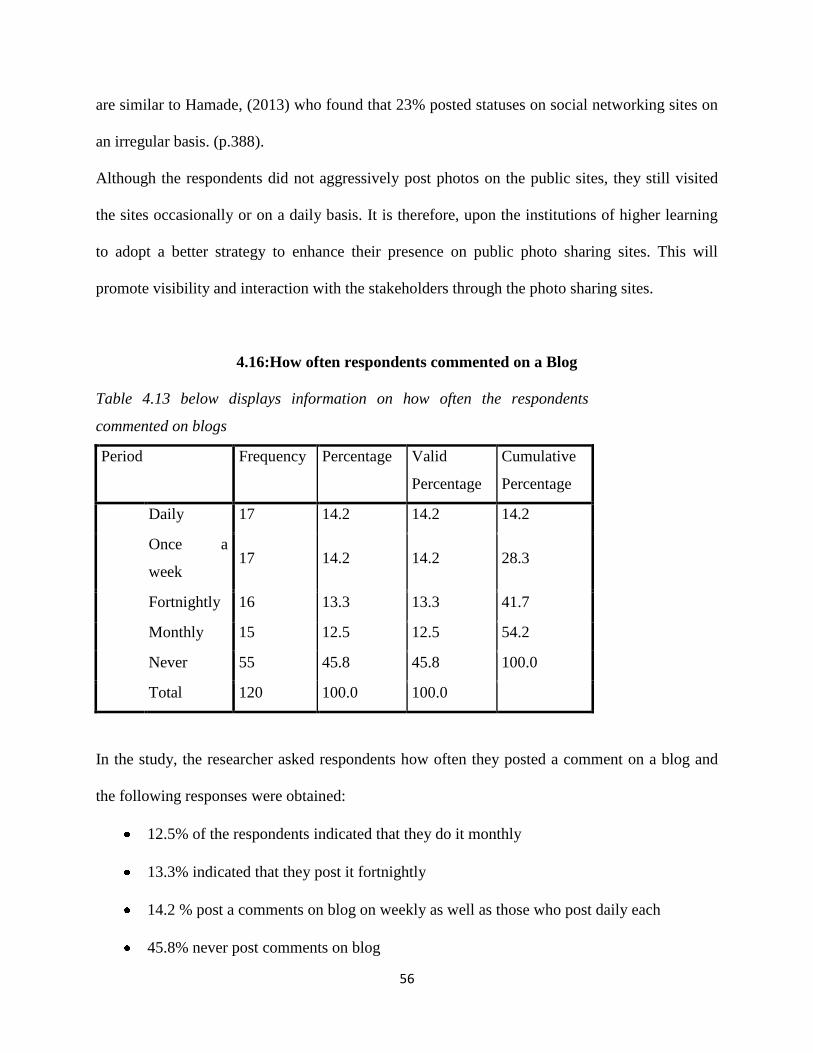
56
are similar to Hamade, (2013) who found that 23% posted statuses on social networking sites on
an irregular basis. (p.388).
Although the respondents did not aggressively post photos on the public sites, they still visited
the sites occasionally or on a daily basis. It is therefore, upon the institutions of higher learning
to adopt a better strategy to enhance their presence on public photo sharing sites. This will
promote visibility and interaction with the stakeholders through the photo sharing sites.
4.16:How often respondents commented on a Blog
Table 4.13 below displays information on how often the respondents
commented on blogs
Period Frequency Percentage Valid
Percentage
Cumulative
Percentage
Daily 17 14.2 14.2 14.2
Once a
week 17 14.2 14.2 28.3
Fortnightly 16 13.3 13.3 41.7
Monthly 15 12.5 12.5 54.2
Never 55 45.8 45.8 100.0
Total 120 100.0 100.0
In the study, the researcher asked respondents how often they posted a comment on a blog and
the following responses were obtained:
12.5% of the respondents indicated that they do it monthly
13.3% indicated that they post it fortnightly
14.2 % post a comments on blog on weekly as well as those who post daily each
45.8% never post comments on blog

57
Hamade,(2013) found that 33% of students posted comments more than once a day while 13 %
posted once a day. This is in sharp contrast with the findings of this study since almost half of
respondents said they never posted comments on blogs. (p.392).
Blogs were not popular with students. Institutions of higher learning need to be proactive while
using blogs as an alternative platform. There is need to create very engaging blogs and actively
marshal stakeholders to use and provide feedback on blogs.
4.17: How often the respondents tweeted on Tweeter
Table 4.14 below displays information on how often respondents tweeted on Tweeter
Period Frequency Percentage Valid
Percentage
Cumulative
Percentage
Valid
Daily 18 15.0 15.0 15.0
Once a
week 25 20.8 20.8 35.8
Fortnightly 19 15.8 15.8 51.7
Monthly 21 17.5 17.5 69.2
Never 37 30.8 30.8 100.0
Total 120 100.0 100.0
When asked how often they tweeted on Tweeter, it was observed that 15% were for daily, this
was closely followed by those who tweet fortnightly at 15.8%,17.5% of them tweet monthly ,
30% of the respondents have never tweeted while 20.8 % tweet on daily basis.
Although Williams and Merten (2008) postulated that university students are often found to be
obsessed with their Facebook profile or Twitter page. This is not the case in the findings of this
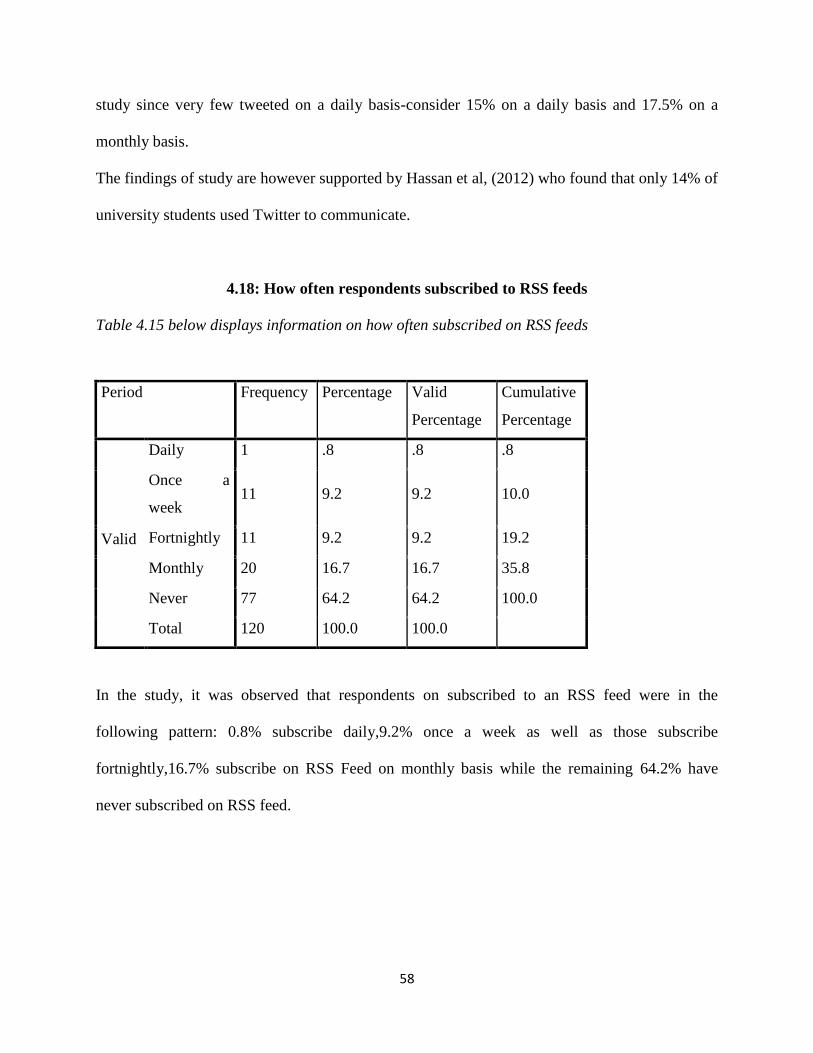
58
study since very few tweeted on a daily basis-consider 15% on a daily basis and 17.5% on a
monthly basis.
The findings of study are however supported by Hassan et al, (2012) who found that only 14% of
university students used Twitter to communicate.
4.18: How often respondents subscribed to RSS feeds
Table 4.15 below displays information on how often subscribed on RSS feeds
Period Frequency Percentage Valid
Percentage
Cumulative
Percentage
Valid
Daily 1 .8 .8 .8
Once a
week 11 9.2 9.2 10.0
Fortnightly 11 9.2 9.2 19.2
Monthly 20 16.7 16.7 35.8
Never 77 64.2 64.2 100.0
Total 120 100.0 100.0
In the study, it was observed that respondents on subscribed to an RSS feed were in the
following pattern: 0.8% subscribe daily,9.2% once a week as well as those subscribe
fortnightly,16.7% subscribe on RSS Feed on monthly basis while the remaining 64.2% have
never subscribed on RSS feed.
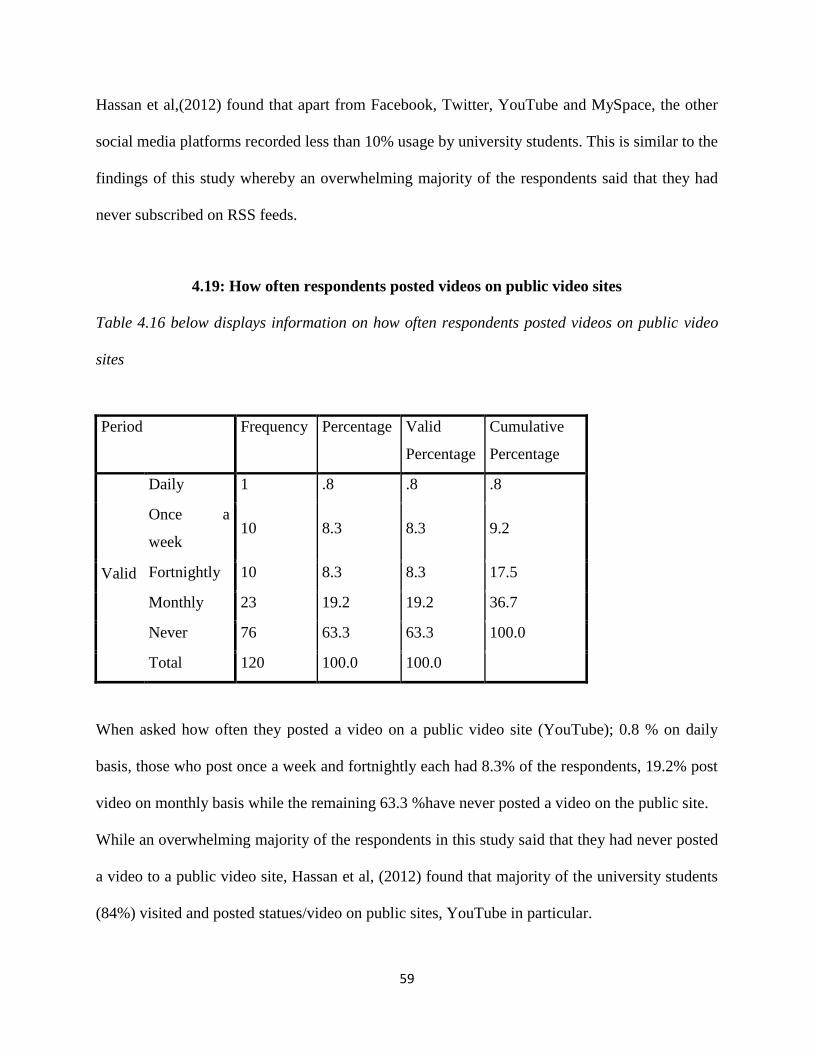
59
Hassan et al,(2012) found that apart from Facebook, Twitter, YouTube and MySpace, the other
social media platforms recorded less than 10% usage by university students. This is similar to the
findings of this study whereby an overwhelming majority of the respondents said that they had
never subscribed on RSS feeds.
4.19: How often respondents posted videos on public video sites
Table 4.16 below displays information on how often respondents posted videos on public video
sites
Period Frequency Percentage Valid
Percentage
Cumulative
Percentage
Valid
Daily 1 .8 .8 .8
Once a
week 10 8.3 8.3 9.2
Fortnightly 10 8.3 8.3 17.5
Monthly 23 19.2 19.2 36.7
Never 76 63.3 63.3 100.0
Total 120 100.0 100.0
When asked how often they posted a video on a public video site (YouTube); 0.8 % on daily
basis, those who post once a week and fortnightly each had 8.3% of the respondents, 19.2% post
video on monthly basis while the remaining 63.3 %have never posted a video on the public site.
While an overwhelming majority of the respondents in this study said that they had never posted
a video to a public video site, Hassan et al, (2012) found that majority of the university students
(84%) visited and posted statues/video on public sites, YouTube in particular.
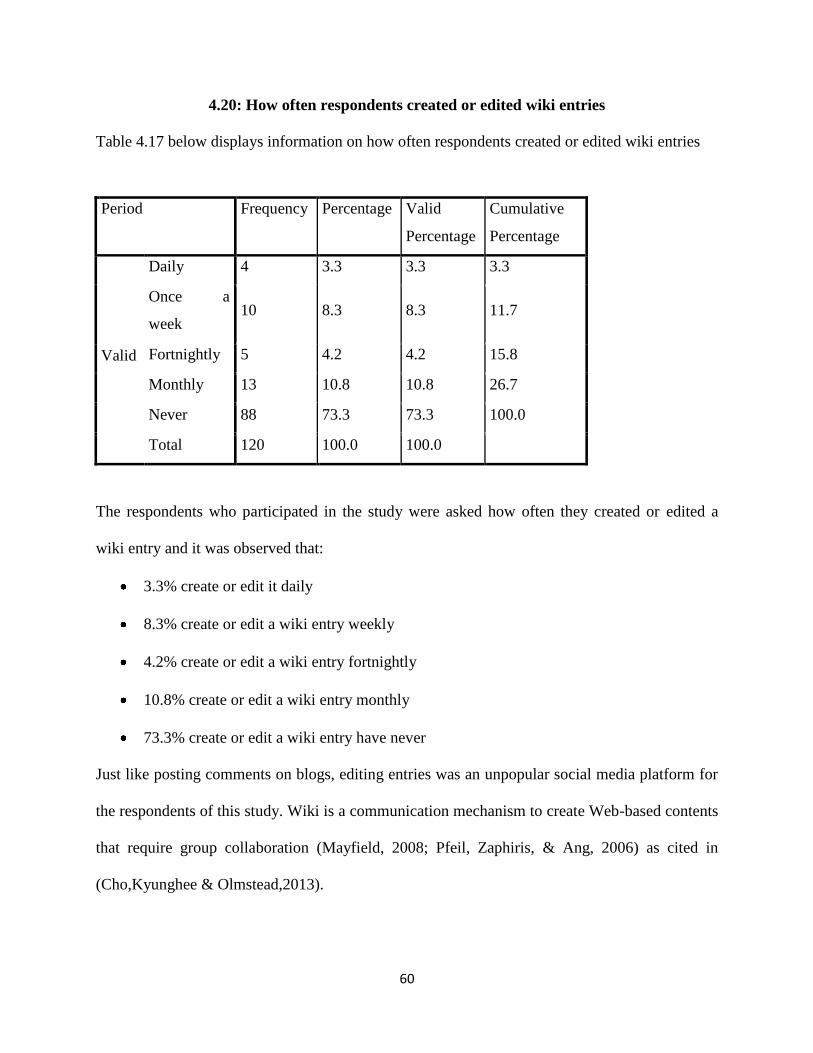
60
4.20: How often respondents created or edited wiki entries
Table 4.17 below displays information on how often respondents created or edited wiki entries
Period Frequency Percentage Valid
Percentage
Cumulative
Percentage
Valid
Daily 4 3.3 3.3 3.3
Once a
week 10 8.3 8.3 11.7
Fortnightly 5 4.2 4.2 15.8
Monthly 13 10.8 10.8 26.7
Never 88 73.3 73.3 100.0
Total 120 100.0 100.0
The respondents who participated in the study were asked how often they created or edited a
wiki entry and it was observed that:
3.3% create or edit it daily
8.3% create or edit a wiki entry weekly
4.2% create or edit a wiki entry fortnightly
10.8% create or edit a wiki entry monthly
73.3% create or edit a wiki entry have never
Just like posting comments on blogs, editing entries was an unpopular social media platform for
the respondents of this study. Wiki is a communication mechanism to create Web-based contents
that require group collaboration (Mayfield, 2008; Pfeil, Zaphiris, & Ang, 2006) as cited in
(Cho,Kyunghee & Olmstead,2013).

61
4.21 Respondents Overall Perception on Social Media
Table 4.18 below displays information on the respondents overall perception on social media
Overall Perception on Social
Media
Frequency Percentage Valid
Percentage
Cumulative
Percentage
They are here to stay 37 30.8 30.8 30.8
They are powerful
communication tools 64 53.3 53.3 84.2
They are interesting but
mostly for personal use
not organizational use
15 12.5 12.5 96.7
They will fade with
time 4 3.3 3.3 100.0
Total 120 100.0 100.0
When the respondents were asked to choose the best statemement that summed up their overall
perceptionof social media, it was observed that:
30.8% indicated that social media is here to stay
53.3% indicated that social media is a powerful tool for communication,
12.5% believed that social media are interesting but mostly for personal use not
organizational use
While the remaining 3.3 % were of the opinion that they will fade with time
These findings indicate that an overwhelming majority of the respondents believed that social
media social was there for the long-term or social media was simply a powerful tool of
communication. The way we communicate through the internet has changed and social media
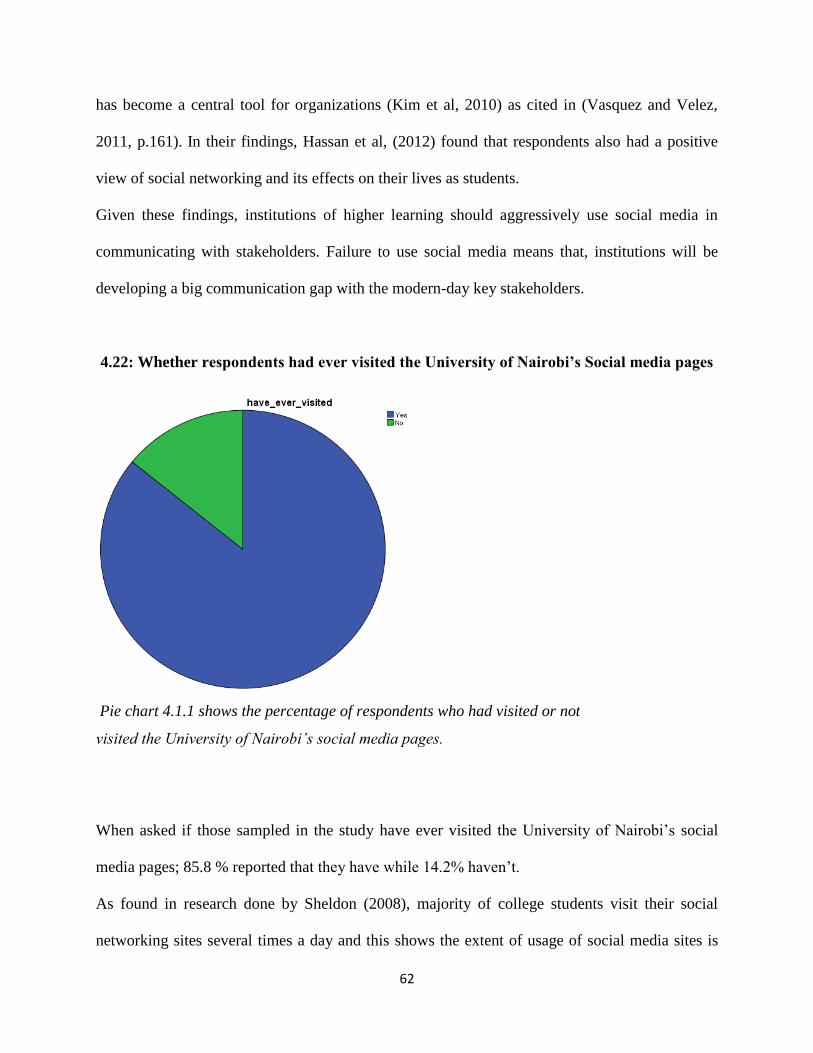
62
has become a central tool for organizations (Kim et al, 2010) as cited in (Vasquez and Velez,
2011, p.161). In their findings, Hassan et al, (2012) found that respondents also had a positive
view of social networking and its effects on their lives as students.
Given these findings, institutions of higher learning should aggressively use social media in
communicating with stakeholders. Failure to use social media means that, institutions will be
developing a big communication gap with the modern-day key stakeholders.
4.22: Whether respondents had ever visited the University of Nairobi’s Social media pages
Pie chart 4.1.1 shows the percentage of respondents who had visited or not
visited the University of Nairobi’s social media pages.
When asked if those sampled in the study have ever visited the University of Nairobi‘s social
media pages; 85.8 % reported that they have while 14.2% haven‘t.
As found in research done by Sheldon (2008), majority of college students visit their social
networking sites several times a day and this shows the extent of usage of social media sites is
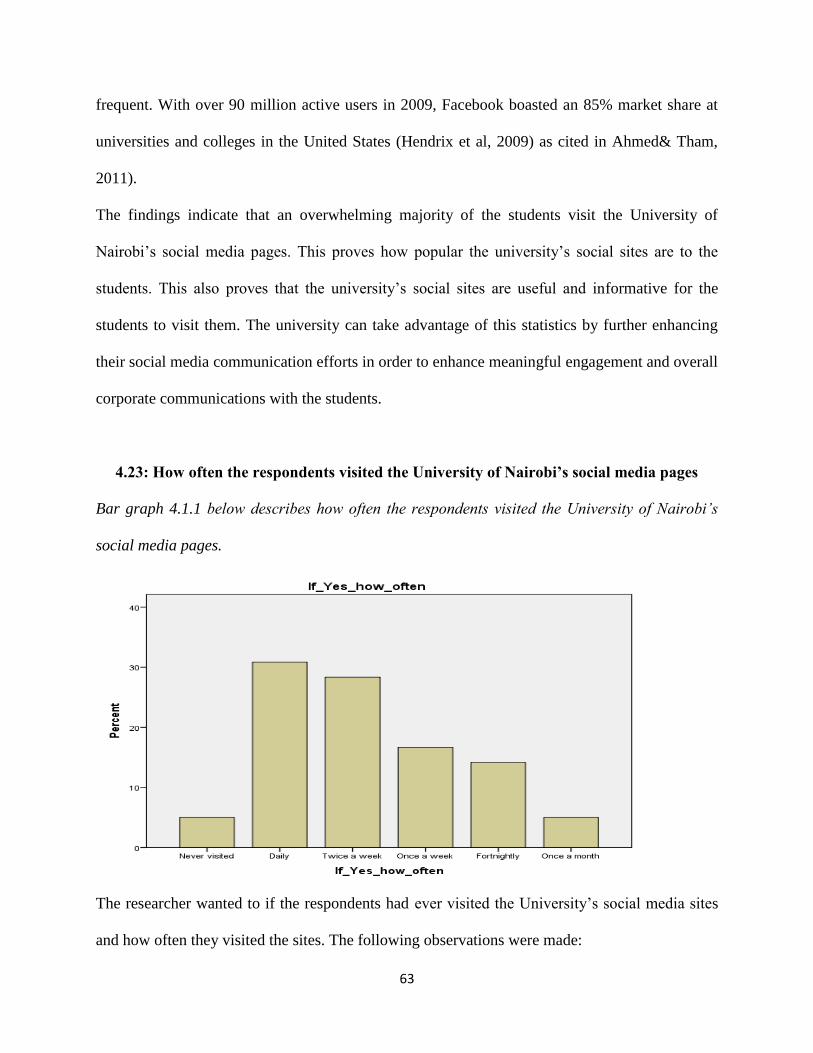
63
frequent. With over 90 million active users in 2009, Facebook boasted an 85% market share at
universities and colleges in the United States (Hendrix et al, 2009) as cited in Ahmed& Tham,
2011).
The findings indicate that an overwhelming majority of the students visit the University of
Nairobi‘s social media pages. This proves how popular the university‘s social sites are to the
students. This also proves that the university‘s social sites are useful and informative for the
students to visit them. The university can take advantage of this statistics by further enhancing
their social media communication efforts in order to enhance meaningful engagement and overall
corporate communications with the students.
4.23: How often the respondents visited the University of Nairobi’s social media pages
Bar graph 4.1.1 below describes how often the respondents visited the University of Nairobi’s
social media pages.
The researcher wanted to if the respondents had ever visited the University‘s social media sites
and how often they visited the sites. The following observations were made:
64
5% do not visit the university‘s social sites
30.8% daily basis
28.3% twice a week
16.7% once a week
14.2% fortnightly
5.0 once a month
Young (2010) found that majority of students visited social networking sites several times a day
thus showed the frequent use of social media sites. In this study, although students visited social
networking sites only 30.8% visited the University‘s social media sites on a daily basis.
These findings indicate that majority of the students frequently visit the university‘s social media
sites. First, this proves that the sites are helpful. Secondly, the sites are frequently updated with
information so that the expectation among students is, ―There might be something new on the
university‘s social media sites to warrant another visit.‖ The challenge for the university
therefore is to make maximum use of its social networking sites to encourage dialogue and
mutually communicate with the students on a frequent basis. This will be able to translate into
massive success in both the institution‘s corporate communications efforts and the students‘
general wellbeing in the university.

65
4.24: The main purpose for visiting the University’s social media sites
Pie chart 4.1.2 below displays information on the main purpose for the respondents’ visits to the
university’s social media sites.
The main purpose for visiting University website for students is to:
To post enquiries as indicated by 25% of the respondents
To express compliments as reported by 1.7 % of those sampled
To express complaints as reported by 11.7% of those who participated in the study
To read information /News as indicated by 52.5% of the respondents
8.3 % of the respondents were of the opinion that they visit the website to share
suggestions and new ideas.
More than half of the respondents visited the university‘s social sites mainly to read news and
information on what was taking place in the university. Communicating corporate messages and
issues through social media is important and necessary in order to improve and promote
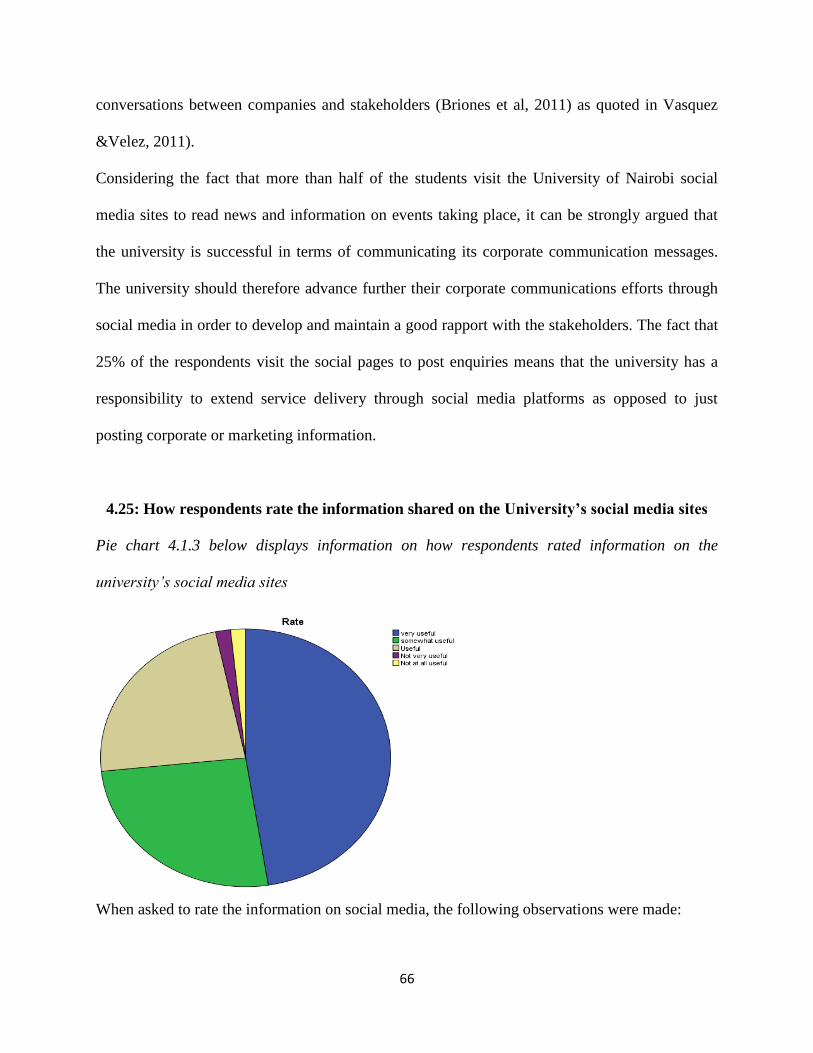
66
conversations between companies and stakeholders (Briones et al, 2011) as quoted in Vasquez
&Velez, 2011).
Considering the fact that more than half of the students visit the University of Nairobi social
media sites to read news and information on events taking place, it can be strongly argued that
the university is successful in terms of communicating its corporate communication messages.
The university should therefore advance further their corporate communications efforts through
social media in order to develop and maintain a good rapport with the stakeholders. The fact that
25% of the respondents visit the social pages to post enquiries means that the university has a
responsibility to extend service delivery through social media platforms as opposed to just
posting corporate or marketing information.
4.25: How respondents rate the information shared on the University’s social media sites
Pie chart 4.1.3 below displays information on how respondents rated information on the
university’s social media sites
When asked to rate the information on social media, the following observations were made:

67
1.7% felt the information was not very useful as well as those who indicated that it was
not at all useful
23.3% felt it was useful
25.8% felt somewhat useful
The remaining 47.5% felt the information on the social media sites was very useful
An overwhelming majority of the respondents rated the information shared on the university‘s
social media sites as being useful. In their study, Vasquez & Velez, (2011) found that Puerto
Rican companies were more concerned in broadcasting information than having real
conversations with their funs and followers. These pointed to a lack of participation by
stakeholders which could lead to lack of meaningful discussion between companies and
stakeholders.
The findings suggest that information posted on the university‘s social media pages is helpful to
the stakeholders. This means that most of the information shared on the social networking sites
address the needs of the stakeholders and provides solutions to the issues at hand. However, a
small number felt that the information was not helpful; the challenge then for the university is to
ensure that their social media activities are useful to all. Perhaps audience needs analysis within
the stakeholders will able to help institutions to better represent the needs of all the stakeholders.
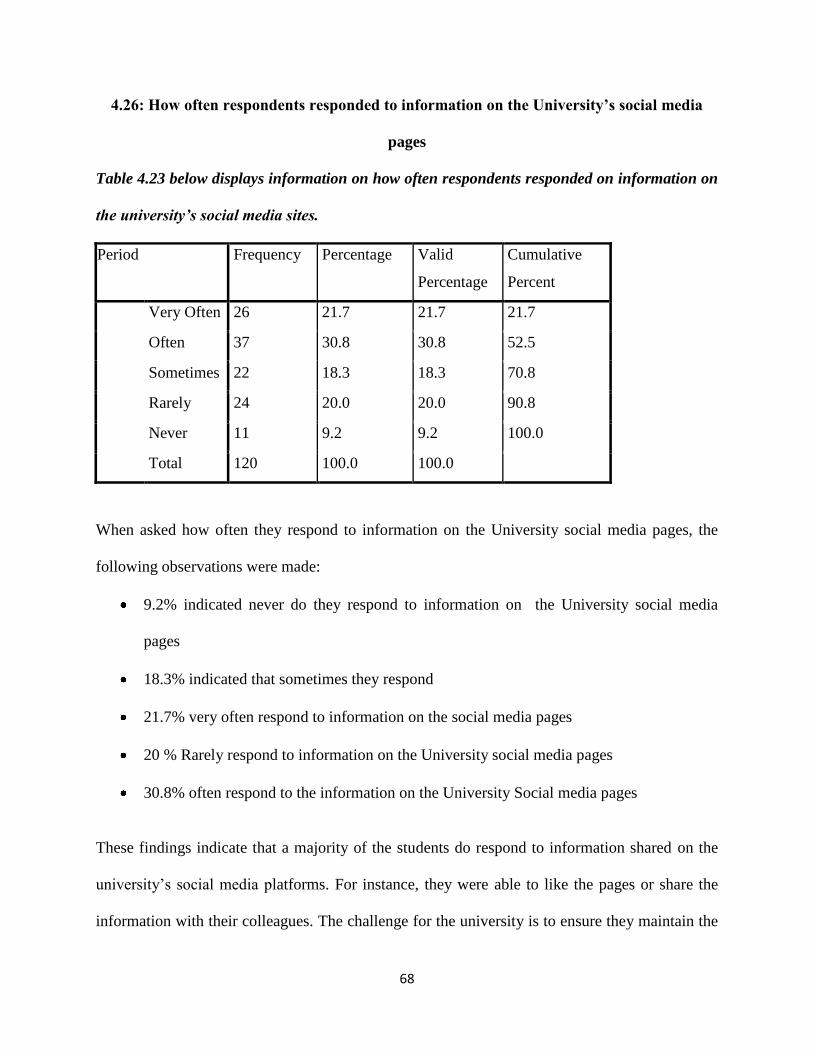
68
4.26: How often respondents responded to information on the University’s social media
pages
Table 4.23 below displays information on how often respondents responded on information on
the university’s social media sites.
Period Frequency Percentage Valid
Percentage
Cumulative
Percent
Very Often 26 21.7 21.7 21.7
Often 37 30.8 30.8 52.5
Sometimes 22 18.3 18.3 70.8
Rarely 24 20.0 20.0 90.8
Never 11 9.2 9.2 100.0
Total 120 100.0 100.0
When asked how often they respond to information on the University social media pages, the
following observations were made:
9.2% indicated never do they respond to information on the University social media
pages
18.3% indicated that sometimes they respond
21.7% very often respond to information on the social media pages
20 % Rarely respond to information on the University social media pages
30.8% often respond to the information on the University Social media pages
These findings indicate that a majority of the students do respond to information shared on the
university‘s social media platforms. For instance, they were able to like the pages or share the
information with their colleagues. The challenge for the university is to ensure they maintain the

69
dialogue as well as reach out to the fractions who do not respond to the university‘s social media
information. An elaborate social media strategy will be helpful in this case; consider,
consistency in posting the messages and clarifications when prompted by the stakeholders or
simply being creative and informal in the social media arena in order to better connect with the
students.
4.27:Whether the University’s social media pages were interactive
Table 4.24 below displays information on whether the university’s social media pages were
found to be interactive by respondents or not.
Response Frequency Percentage Valid
Percentage
Cumulative
Percentage
Valid
Agree 83 69.2 69.2 69.2
Disagree 37 30.8 30.8 100.0
Total 120 100.0 100.0
69.2 % agreed that social media pages are very interactive while the remaining 30.8 disagreed to
this statement
The findings suggest that the university enhanced a two-way communication between the
institution and the students. For this, the respondents felt a sense of belonging and understanding.
However, a fraction of respondents said the social sites were not interactive. The challenge for
the university in this case is to ensure that they enhance dialogue and strive to engage all the
stakeholders because that is the essence of being in social media.
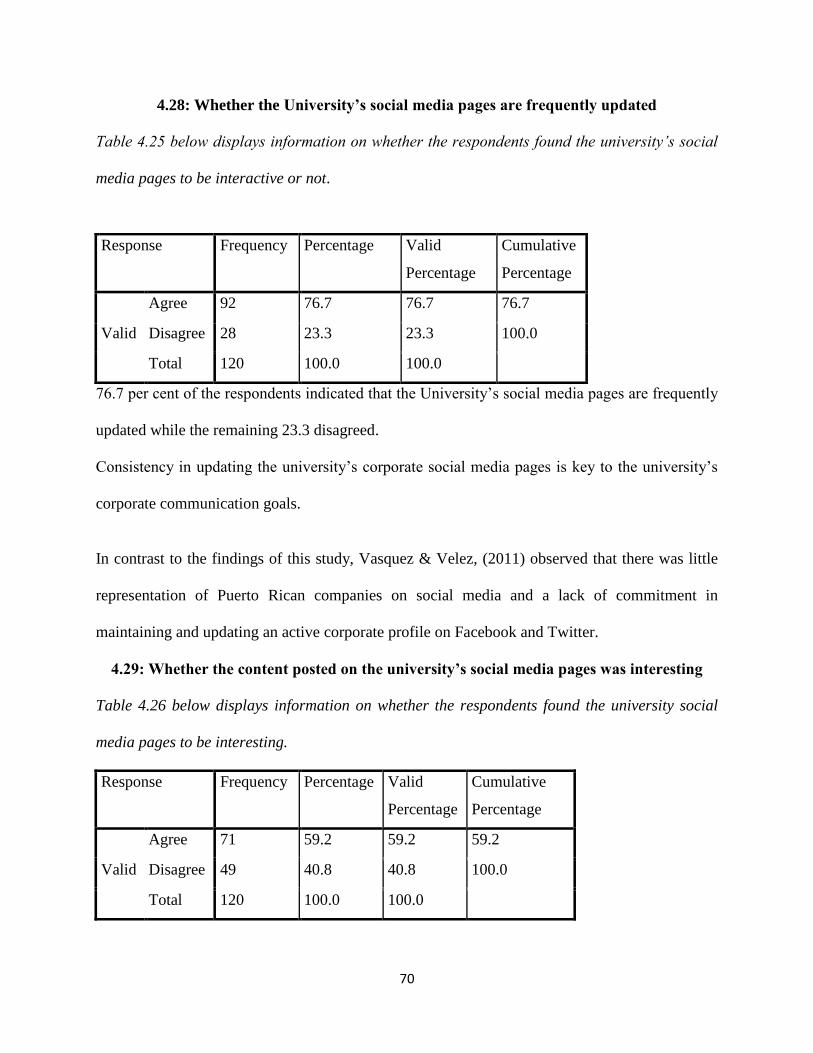
70
4.28: Whether the University’s social media pages are frequently updated
Table 4.25 below displays information on whether the respondents found the university’s social
media pages to be interactive or not.
Response Frequency Percentage Valid
Percentage
Cumulative
Percentage
Valid
Agree 92 76.7 76.7 76.7
Disagree 28 23.3 23.3 100.0
Total 120 100.0 100.0
76.7 per cent of the respondents indicated that the University‘s social media pages are frequently
updated while the remaining 23.3 disagreed.
Consistency in updating the university‘s corporate social media pages is key to the university‘s
corporate communication goals.
In contrast to the findings of this study, Vasquez & Velez, (2011) observed that there was little
representation of Puerto Rican companies on social media and a lack of commitment in
maintaining and updating an active corporate profile on Facebook and Twitter.
4.29: Whether the content posted on the university’s social media pages was interesting
Table 4.26 below displays information on whether the respondents found the university social
media pages to be interesting.
Response Frequency Percentage Valid
Percentage
Cumulative
Percentage
Valid
Agree 71 59.2 59.2 59.2
Disagree 49 40.8 40.8 100.0
Total 120 100.0 100.0

71
59.2 per cent of the respondents agreed that the content of University‘s social media pages are
very interesting while the remaining 40.8 % disagreed.
While a majority said the university‘s social media pages were interesting, almost half of the
respondents disagreed. The argument was that the university‘s social sites indeed had useful
information but not necessarily interesting.
Interesting content is key to the success of social media activities, it is therefore important for the
university to creatively package content in an interesting way in order to attract and retain the
attention of their social media followers.
4.30: Whether the University provided feedback when asked a question on social media
pages
Table 4.27 shows information on whether the university’s provided feedback on its social media
pages or not.
Response Frequency Percentage Valid
Percentage
Cumulative
Percentage
Valid
Agree 61 50.8 50.8 50.8
Disagree 59 49.2 49.2 100.0
Total 120 100.0 100.0
50.8 % agreed that when asked a question on social media, the University provides feedback
while 49.2% disagreed with the idea
The findings indicate that half of the respondents said the university provided feedback while
half said the university never provided feedback on social media platforms. Feedback is an
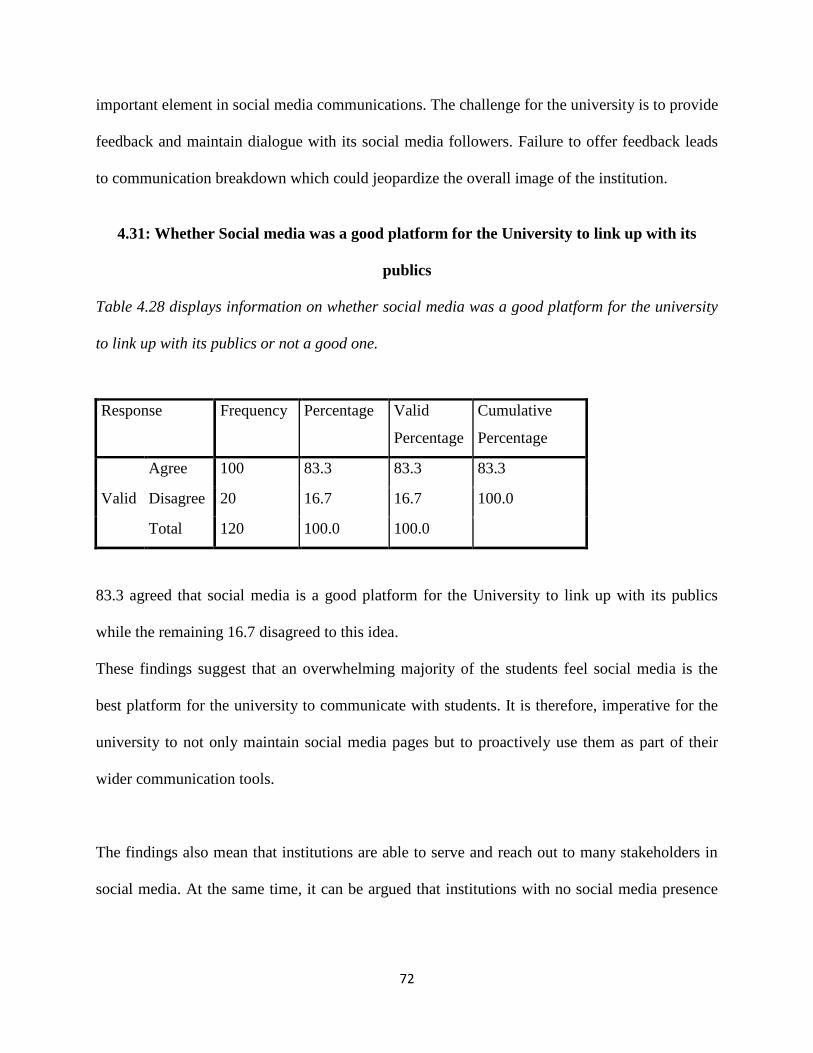
72
important element in social media communications. The challenge for the university is to provide
feedback and maintain dialogue with its social media followers. Failure to offer feedback leads
to communication breakdown which could jeopardize the overall image of the institution.
4.31: Whether Social media was a good platform for the University to link up with its
publics
Table 4.28 displays information on whether social media was a good platform for the university
to link up with its publics or not a good one.
Response Frequency Percentage Valid
Percentage
Cumulative
Percentage
Valid
Agree 100 83.3 83.3 83.3
Disagree 20 16.7 16.7 100.0
Total 120 100.0 100.0
83.3 agreed that social media is a good platform for the University to link up with its publics
while the remaining 16.7 disagreed to this idea.
These findings suggest that an overwhelming majority of the students feel social media is the
best platform for the university to communicate with students. It is therefore, imperative for the
university to not only maintain social media pages but to proactively use them as part of their
wider communication tools.
The findings also mean that institutions are able to serve and reach out to many stakeholders in
social media. At the same time, it can be argued that institutions with no social media presence
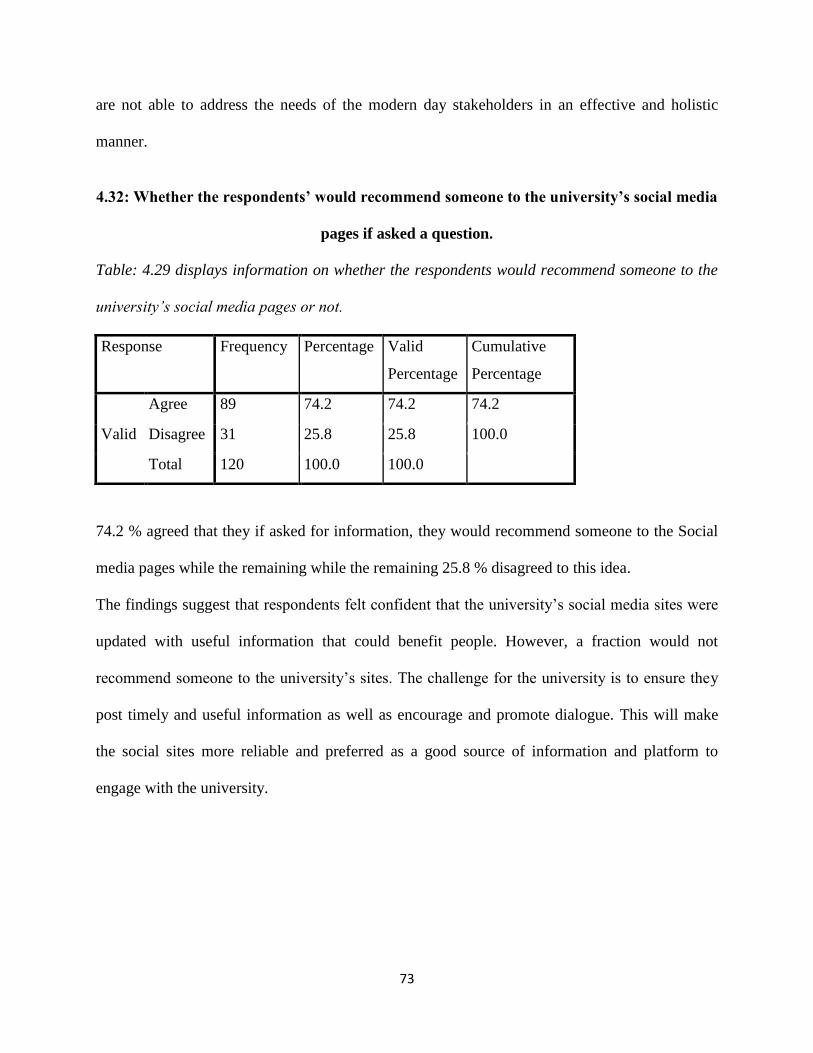
73
are not able to address the needs of the modern day stakeholders in an effective and holistic
manner.
4.32: Whether the respondents’ would recommend someone to the university’s social media
pages if asked a question.
Table: 4.29 displays information on whether the respondents would recommend someone to the
university’s social media pages or not.
Response Frequency Percentage Valid
Percentage
Cumulative
Percentage
Valid
Agree 89 74.2 74.2 74.2
Disagree 31 25.8 25.8 100.0
Total 120 100.0 100.0
74.2 % agreed that they if asked for information, they would recommend someone to the Social
media pages while the remaining while the remaining 25.8 % disagreed to this idea.
The findings suggest that respondents felt confident that the university‘s social media sites were
updated with useful information that could benefit people. However, a fraction would not
recommend someone to the university‘s sites. The challenge for the university is to ensure they
post timely and useful information as well as encourage and promote dialogue. This will make
the social sites more reliable and preferred as a good source of information and platform to
engage with the university.
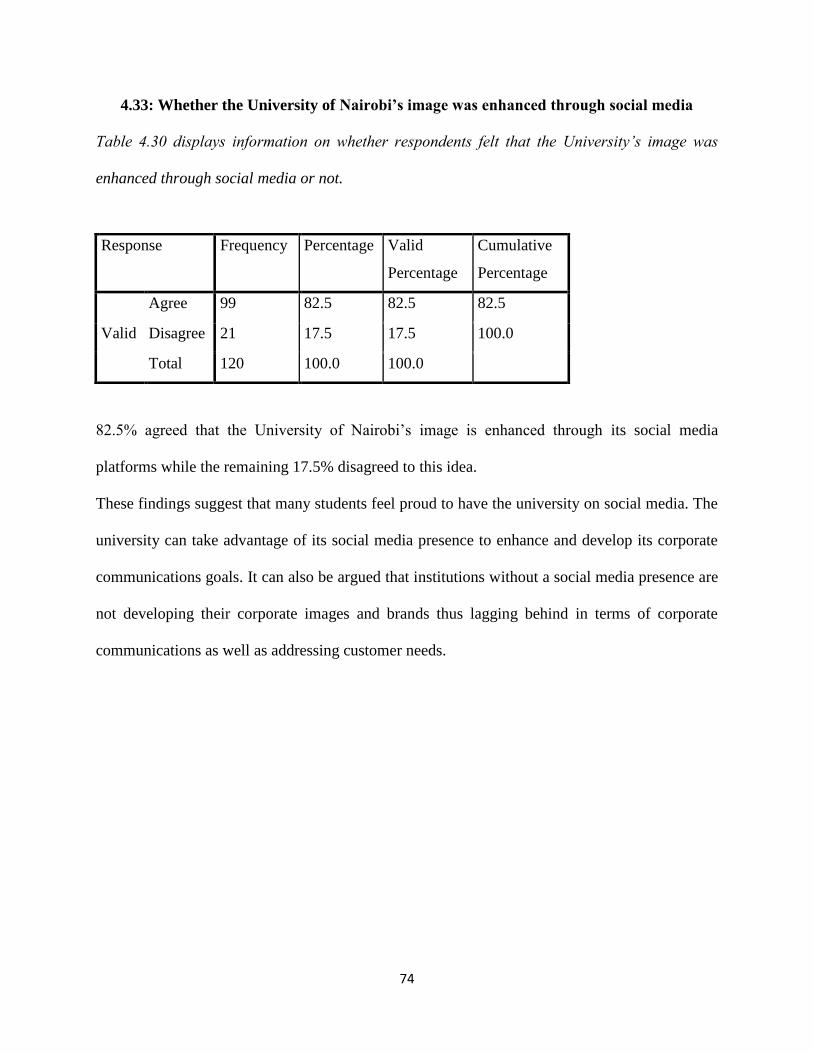
74
4.33: Whether the University of Nairobi’s image was enhanced through social media
Table 4.30 displays information on whether respondents felt that the University’s image was
enhanced through social media or not.
Response Frequency Percentage Valid
Percentage
Cumulative
Percentage
Valid
Agree 99 82.5 82.5 82.5
Disagree 21 17.5 17.5 100.0
Total 120 100.0 100.0
82.5% agreed that the University of Nairobi‘s image is enhanced through its social media
platforms while the remaining 17.5% disagreed to this idea.
These findings suggest that many students feel proud to have the university on social media. The
university can take advantage of its social media presence to enhance and develop its corporate
communications goals. It can also be argued that institutions without a social media presence are
not developing their corporate images and brands thus lagging behind in terms of corporate
communications as well as addressing customer needs.
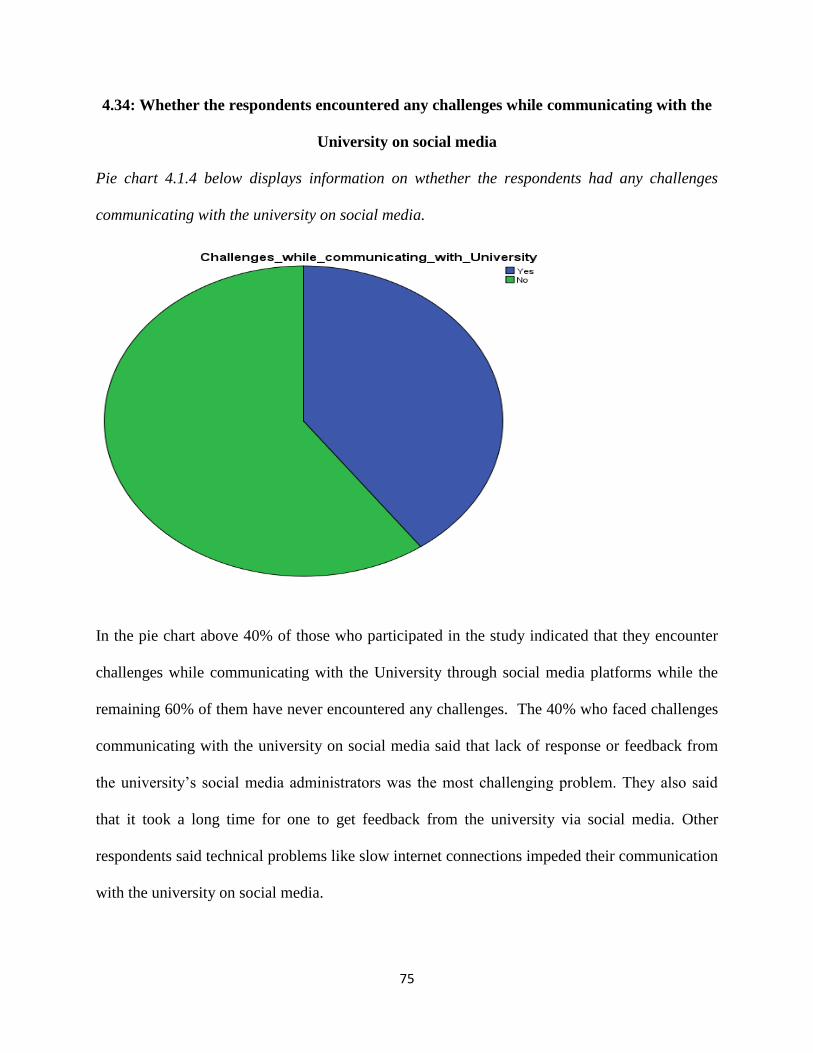
75
4.34: Whether the respondents encountered any challenges while communicating with the
University on social media
Pie chart 4.1.4 below displays information on wthether the respondents had any challenges
communicating with the university on social media.
In the pie chart above 40% of those who participated in the study indicated that they encounter
challenges while communicating with the University through social media platforms while the
remaining 60% of them have never encountered any challenges. The 40% who faced challenges
communicating with the university on social media said that lack of response or feedback from
the university‘s social media administrators was the most challenging problem. They also said
that it took a long time for one to get feedback from the university via social media. Other
respondents said technical problems like slow internet connections impeded their communication
with the university on social media.
76
When asked to state their opinions on how best the university could connect with students and
other stakeholders on social media, majority of the respondents said that the university must be
ready to provide feedback on social media as well as post new information on a regular basis.
The respondents also stated that it was important for university create awareness of the existence
of their social media pages so that new students and prospective students can easily connect with
the university.
77
CHAPTER FIVE: SUMMARY, CONCLUSIONS AND
RECOMMENDATIONS
5.1 Introduction
This chapter presents a summary of the findings, conclusions and recommendations of the study.
As discussed in the literature review section, social media is argued to be a strong tool of
communication not only in institutions of higher learning but also other sectors that touch on
social, economic and political welfares of the society. This study set out to investigate the use of
social media as a tool of corporate communications in institutions of higher learning. The study
also set to out to investigate how students use social media to interact with institutions as well as
examine the effectiveness of social media interaction between students and institutions of higher
learning. The other objective of this study was to examine how institutions of higher learning
were using social media to communicate with students.
5.2 Summary of the findings
On the basis of feedback given by the respondents, the researcher came up with findings which
were used to draw conclusions and make recommendations. The main findings are based on the
results of data analysis presented in chapter four. Consider table 5.1

78
Table 5.1 Summary of the findings
Objectives Findings
1. To investigate the use of social
media as a tool of corporate
communications in institutions
of higher learning.
Institutions of higher learning mostly use Facebook
and Twitter to communicate with its clienteles.
Institutions of higher learning use social media to
manage crisis and safeguard their brands.
Social media is used to compliment other channels of
communications like websites, newsletters, newspapers
and broadcast.
Social media is used to quickly serve clients and
address customer issues.
Social media is used to market an institution‘s products
and services and this helps in cost saving of
advertisement fees
Social media is used to share news and information on
events taking place in the institutions.
2. To investigate how students use
social media to interact with
institutions.
Majority of the students (52%) use social media to read
news and information on what is taking place in the
institutions.
25% of the students use social media to seek assistance
by posting inquiries on various issues in the
institutions.
11.7% use social media to complain or express their
dissatisfaction on certain services or products offered
by the university while 8.3% use social media to
suggest or share new ideas.
79
3. To examine the effectiveness of
social media interaction
between students and
institutions of higher learning.
Social media is used to counter bad publicity in
institutions in an instant.
Majority of the students (82.5%) believe that the image
of university is enhanced through social media while
74.2% said that they would recommend someone to the
institutions social media pages if asked for
information.
47.5% of the respondents felt that the information
posted on the university‘s social media pages was very
useful while 23.7% said it was just useful.
However, 50.8% said that when asked a question on
social media, the university never provided feedback.
30.8% of the respondents never responded to
information posted on the university‘s social media
pages.
4. To examine how institutions of
higher learning use social
media to communicate with
students.
The university uses social media to enlighten students
on what is happening.
The university uses social media to call upon the
students to rally upon an idea or support an action.
5.3 Conclusions
The findings of study indicate that institutions of higher learning have incorporated social media
as a strategic tool of corporate communications with stakeholders. On their part, stakeholders
view social media as a powerful platform to connect and communicate with their institutions.
Results also indicated that institutions of higher learning had set social media structures and
mechanisms to help them achieve on their set corporate communications goals. For instance, the
university not only used the social media platforms to market their products and services but also
used it to inform its stakeholders on activities and events taking place at the institution. At the
80
same time, the university monitored and evaluated its social media activities at the corporate
level. However, social media engagement activities at faculty, schools and departmental levels
were not measured and evaluated. As a result of this, it is evidently hard to measure the
effectiveness and success levels of the smaller units‘ social media activities.
Although institutions of higher learning had established their presence on social media, majority
of the respondents felt that institutions did not provide feedback when prompted by stakeholders
and that if they did, then it would take time before one got response from the university. Burston-
Marsteller, (2010:2) observed that the value of social media was that users are highly engaged
and wanted to be heard. Quoted in, (Vasquez & Velez, 2011).
At this point therefore,. it can be concluded that institutions of higher learning have not fully
utilized the potential of social media in their corporate communications efforts
5.4 Recommendations
Following the findings of this study, the researcher came up with several recommendations that
could shade light on best practices in using social media as a corporate communications tool.
To begin with, there is need for institutions of higher learning to provide feedback on social
media whenever prompted by stakeholders. From the findings of study, almost half of the
respondents said that the university never provided feedback when students posted comments or
asked questions on the social media platforms. Universities should strive to encourage
stakeholders to participate in a two-way communication. According to Vasquez & Velez, (2011),
Consumers are a powerful stakeholder group for creating real dialogues through social media
sites. Failure to respond to customer questions and concerns raised online leads to
misunderstandings and breakdown in communication (p.169).
81
Secondly, institutions of higher learning need to create interesting and engaging content that
could attract traffic from stakeholders on the social media platforms. From the finding of study,
40% of the respondents felt that the content posted on the university‘s social sites were not
interesting at all. According to Mansfield, (2009), institutions should save the traditional
marketing and development content for websites, print and e-magazines while the social
networks should be all about ―personality inspiring conversation and building an online
community.
Thirdly, institutions of higher learning need to monitor and evaluate the performance of their
social media activities. Although, the university‘s social media activities were monitored at the
corporate level, they were not evaluated at schools‘, faculty and departmental levels by the web
champions. This leaves a gap in measuring the effectiveness of the institution‘s social media
activities. Ideally, there should be a synergy between the social media activities at the corporate
level down to individual units and departments. Burson-Masteller, (2012) argued that companies
must monitor their own social media presence to ensure a consistent brand message and to
measure the impact of their social media engagement.
Fourthly, institutions of higher learning need to diversify their activities across multiple social
media platforms. From the findings, Twitter and Facebook are the most used social media sites
in institutions of higher learning. Rather than having inactive social media accounts on platforms
such as LinkedIn, YouTube, blogs and Google+ among other, the university should create
awareness of the existence such social media sites among its key stakeholders.
82
On the stakeholders‘ part, there is need for students to frequently visit their institutions social
media sites. From the findings of this study, an overwhelming majority of the respondents said
that the information posted on the university‘s social sites were very useful yet only a fraction
(30%) visited the institution‘s social media sites on a daily basis. At the same time, the
stakeholders need to be actively engaged with the university on social media platforms rather
than being passive consumers of the university‘s social media messages. This will lead to fruitful
mutual engagement between students and institutions. Sweetser, (2010) argues that for
stakeholders, social media also brings opportunities because it is easier for them to be watchdogs
and track companies with unethical communication behaviors. Cited in (Vasquez &Velez, 2011,
p.163).
5.5 Suggestions for Further Research
This research study had a limited scope as stated in the previous chapters. There is a lot of
research that needs to be done in order to understand the uses of social media in institutions of
higher learning. In conclusion therefore, possibilities for future have been stated as follows:
I. Future research in social media as a corporate communications tool could include more
institutions of higher learning as opposed to a case study of one institution.
II. Further studies could also focus on how stakeholders evaluate the performance of higher
learning institutions in social media.
83
REFERENCES
Anastas,(1999).Flexible methods: Case study design. In Research design for social work and the
human services. (2nd
ed.).New York, USA: Columbia university press.
Imereplace (Jean,1999)
Bagozzi,R.P.(2007). The legacy of technology acceptance model and a proposal for paradigm
shift. Journal of the association for information systems, 8(4), 244-254
Barnes, N. G., & Mattson, E. (2009). Social media and college admissions: The first longitudinal
study. Center for Marketing Research. Retrieved from
https://www.umassd.edu/media/umassdartmouth/cmr/studiesandresearch/socialmediaadm
issions.pdf
Benbasat, I, & Barki, H.(2007). Quo Vadis TAM?Journal of the AIS, 8(3), 211-218.
Blumer, J.G & Katz, E.(1974).The uses of mass communications: Current perspectives on
gratifications research. Beverly Hills, CA: Sage
Boyd,D.(2007).Why youth(heart) social network sites: The role of networked publics in teenage
social life. MacArthur foundation series on digital learning-Youth, identity and digital
media volume(ed.David Buckingham).Cambridge, Ma: MIT press
Boyd, D.M., & Ellison, N.B. (2007). Social network sites: Definition, history, and
scholarship. Journal of computer mediated communication,13(1),210-
230,doi:10.1111/j.1083-6101.2007.00393.x
Burson-Masteller (2012).Global social media check-up. Retrieved from
http://www.burson-marsteller.com/what-we-do/our-thinking/burson-marsteller-global-
social-media-check-up-2012/

84
Canals,J.(2013).Communications and strategy. In NoirSurBlanc, Higher education and the
challenges of communication (pp. 13-21). Retrieved from http://www.case.org
Constantinides, E. & Stagno, M. Z(2011).Potential of the social media as instruments of higher
education marketing: a segmentation study. Journal of marketing for higher education, 21
(1). pp. 7-24. ISSN 0884-1241
Contreras, R.(2014,July 20) Adaptive structuration theory[video file].Retrieved from
https://www.youtube.com/watch?v=StF3GOHk4vc
Cymfony, (2006). Making the case for a social media strategy. Retrieved from
http://www.nedma.com/pdfs/making%20the%20case%20for%20social%20media%2020
07.pdf
Danos,P.(2013). Tomorrow‘s communications. In NoirSurBlanc, Higher education and the
challenges of communication (pp. 52-55) Retrieved from http://www.case.org
Desanctis, G. & Poole, M. S. (1994). Capturing the complexity in advanced technology use:
Adaptive structuration theory. Organization science. 5, 121-147
Evans,L.(2010) Social Media Marketing: Strategies for engaging in facebook, twitter & other
social Media. Que, NewYork.
Farhoomand, A.F (1992) "Scientific Progress of Management Information Systems" in R.D.
Galliers(ed.) Information Systems Research: Issues, Methods and Practical
Guidelines,93-111,Blackwell Scientific, Oxford
Fishbein, M. and Ajzen, I (1975). Belief, attitude, intention and behavior. Reading, MA:
Addison-Wesley

85
Gibbs, P.(2002).From the invincible hand to the invisible handshake: Marketing higher
education. Research in post-compulsory education, 7(3), 325-338, doi,
10.1080/135967402002134
Giddens, A. (1984). The Constitution of Society: Outline of the theory of structuration,
Cambridge: Polity Press
Gomez Vasquez, L. M., & Soto Velez, I. (2011).Social media as a strategic tool for corporate
communication. Revista Internacional de Relaciones Públicas, 1(2 (jul-dic)), 157-174.
Government of Kenya, Ministry of Planning and National Development, (2007): Kenya Vision
2030. Retrieved from http://www.vision2030.go.ke
Hayes, J.T., Ruschman, D. & Walker, M. M(2009).Social networking as an admissions tool: A
case study in success. Journal of marketing for higher education,19:2, 109-124, DOI:
10.1080/08841240903423042
Haythornthwaite, C. (2005). Social networks and Internet connectivity effects. Information,
Communication, & Society, 8(2), 125–147.
Henderson, A. & Bowley, R.(2010)Authentic dialogue? The role of friendship in a social media
recruitment campaign. Journal of communication management, 14(3).
Jelassi, T.(2013).Web 2.0 and audiovisual media. In NoirSurBlanc, Higher education and the
challenges of communication.(pp.42-51) .Retrieved from http://www.case.org
Kent,M.I, Taylor,M. & White,W.(2003). The relationship between Web site design and
organizational responsiveness to stakeholders. Public relations review, 29, 66-77.
Lenhart, A., Madden, M., Macgill, A. R., & Smith, A. (2007). The use of social media gains a
greater foothold in teen life as they embrace the conversational nature of interactive
online media. Retrieved, from http://www.pewinternet.org/pdfs/PIP_Teens_Social_
Media_Final.pdf
86
Magoha,G.A.O.(2014,July,20). From the vc’s desk. Retrieved from the University of Nairobi‘s
website: http://www.uonbi.ac.ke/about/vc
Mansfield, H. 2009. 10 Twitter tips for higher education: Making a home in the Twitterverse,
one tweet at a time. Universitybusiness.com, May: 27–28.
Mersey, Malthouse & Calder (2010). "Engagement with Online Media," Accepted for
publication, Journal of Media Business Studies, 7(2), pp. 37-56.
Mersham,G.,Theunissen,P.,& Heart,J.(2009). Public relations and communication management:
An Aoteroa/New Zealand perspective. Auckland: Pearson
McLuhan. (1970). “Views,‖ in The listener 84.2167(October 8), pp.475-6.
Munguatosha, G. M., Muyinda, P. B. & Lubega, J. T. (2011): A social networked learning
adoption model for higher education institutions in developing countries, On the horizon:
Emerald Journal, 19(4),307-320 ISSN: 1074-8121
Nambisan, S. & Nambisan,P.(2008). How to profit from a better virtual customer environment.
MIT sloan management review, 49(3), 53.
Olmstead, S.N., Cho, M., Kyunghee, S.L. (2013).Users perception of social media: A
comparative study of perceived characteristics and user profiles by social media. Online
journal of communication and media technologies,3(4), 149-178.
O’Reilly,T.(2005). What is Web 2.0? Retrieved July, 2014, from http://www.oreillynet.
com/pub/a/oreilly/tim/news/2005/09/30/what-is-web-20.html
Parahoo, K. (1997).Nursing research:Principles,process,issues. London: Macmillan
Pew Internet & American Life Project (2012) Emerging nations embrace technology. Retrieved
from http://www.pewglobal.org/files/2014/02/Pew-Research-Center-Global-Attitudes-
Project-Technology-Report-FINAL-February-13-20146.pdf
87
Pew Internet & American Life Project (2009).Generations online in 2009. Retrieved from
http://www.pewinternet.org/2009/01/28/generations-online-in-2009/
Prensky, M. (2001).Digital natives,digital immigrants. On the horizon (MCB university
press),9(5).Retrieved from http://www.marcprensky.com
QS World university survey (2013) Retrieved from http://www.topuniversities.com
Robbert,E.(1995).The art of case study research. Thousand oaks, CA:Sage.
Solis, B. (2008). The essential guide to social media. Retrieved from https://www.scribd.com
Soy,S.K.(1997). The case study as a research method. Unpublished paper, University Texas at
Austin. Retrieved from https://www.ischool.utexas.edu/~ssoy/usesusers/l391d1b.htm
Stageman,A. & Berg,K.(2013). Friends, fans, and followers: A case study of Marquette
University‘s use of social media to engage with key stakeholders: Case studies in
Strategic Communication, 2(2). Retrieved from:
http://cssc.uscannenberg.org/cases/v2/v2art2
Swallow,E.(2010).The future of public relations and social media. International journal of
scientific and research publications, 2(5). Retrieved from
http://mashable.com/2010/08/16/pr-social-media-future
Sweetser, K. (2010). A losing strategy: The impact of nondisclosure in social media on
relationships. Journal of public relations research, 22(3), 288-312.
Tabellini,G. & Yip,G.(2013).Why publish a white paper on communications in higher
education? In NoirSurBlanc, Higher education and the challenges of communication. (pp. 5-7)
Retrieved from http://www.case.org
Tapie,P.(2013). The new face of higher education. In NoirSurBlanc, Higher education and the
challenges of communication. (pp. 8-12) Retrieved from http://www.case.org
Tham,J. & Ahmed, N.(2011).The usage and implications of social networking sites: A survey of
88
college students. Journal of interpersonal, intercultural and mass communication,2 (1),
1-11. Retrieved from http://www.scientificjournals.org/Journals2011/articles/1508.pdf
Theunissen, P. & Noordin, W.N.W.(2012) Revising the concept ―dialogue‖ in public relations.
Public relations review, 38(1), 5-13. DOI: 10.1016/j.pubrev.2011.09.006
University of Nairobi Communications policy (2014). Retrieved from
https://intranet.uonbi.ac.ke/policy_documents
Universities UK (2012).Higher education, meeting the challenges of the 21st century. Retrieved
from
http://www.universitiesuk.ac.uk/highereducation/Documents/2012/FuturesForHigherEdu
cation.pdf
Venkatesh, V., Morris, M.G., Davis, G.B, Davis, F.D. (2003). User acceptance of information
technology:Towards unified view. Mis quarterly, 12(3), 425-478
Vernuccio, M. (2014, March 31). Communicating corporate brands through social media: An
exploratory study. Retrieved April 10, 2014, from http://job.sagepub.com/
Webometrics,(2014).Ranking web of universities. Retrieved from
http://www.webometrics.info/en/Africa
Williams, A.L & Merten, M.J. (2008).A review of online social networking profiles by
adolescents: Implications for future research and intervention. Adolescence, 43(170),
253-274.
Wright, D.K. & Hinson, M.D. (2008).How blogs and social media are changing public relations and the
way it is practiced. Public relations journal 2(2) Retrieved from http://www.instituteforpr.org
YiN, R.K. (1984).Case study research: Design and method. Newbury Park, CA: Sage
89
APPENDICES
Appendix 1: Letter of Transmittal
FRANKLINE SEWE
P.O.BOX 30197,
Nairobi.
Dear Respondent,
I am a student pursuing a Masters of Arts degree in Communications Studies at the University of
Nairobi‘s School of Journalism. As part of my course requirement, I‘m conducting an academic research
project titled ―Social Media as a Tool of Corporate Communications in Institutions of Higher Learning: A
Case Study of the University of Nairobi.‖ With regard to this, you are hereby requested to support this
research by providing feedback to the questions below.
Please note that your responses will be treated with the highest level of confidentiality. Your effort to
answer all the questions comprehensively and to the best of your knowledge will be highly appreciated.
Thank your time and cooperation
Yours faithfully,
Frankline Sewe
Email:[email protected]
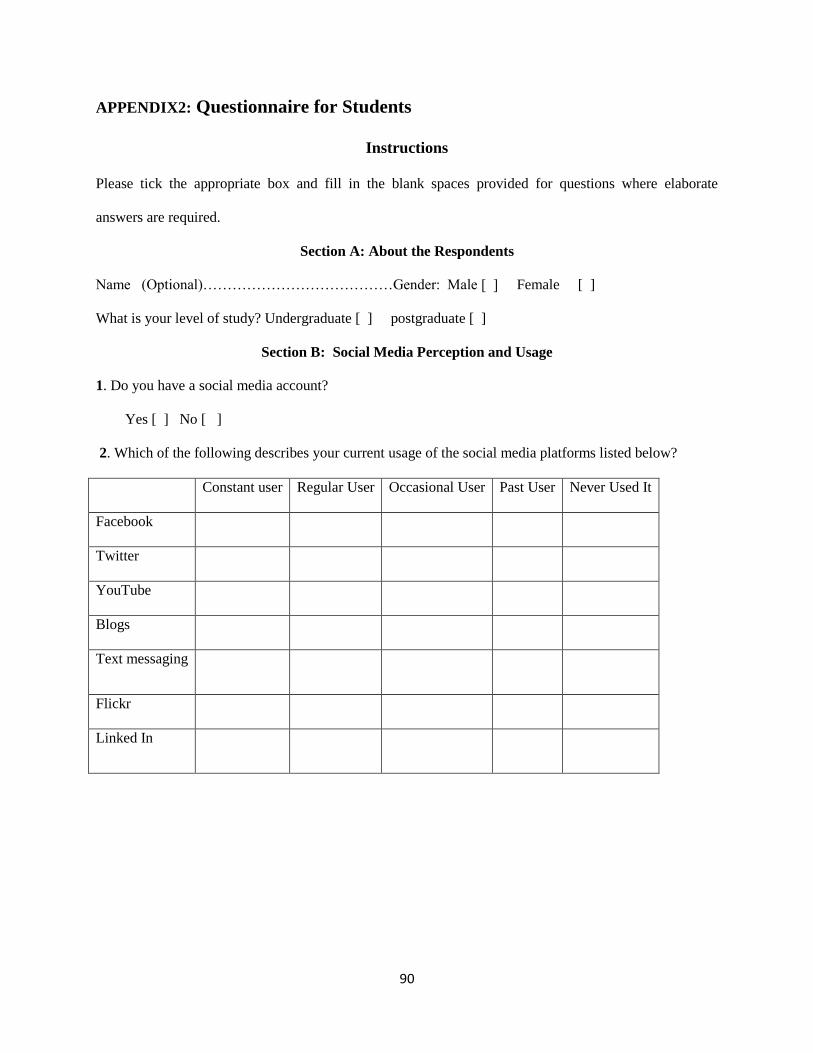
90
APPENDIX2: Questionnaire for Students
Instructions
Please tick the appropriate box and fill in the blank spaces provided for questions where elaborate
answers are required.
Section A: About the Respondents
Name (Optional)…………………………………Gender: Male [ ] Female [ ]
What is your level of study? Undergraduate [ ] postgraduate [ ]
Section B: Social Media Perception and Usage
1. Do you have a social media account?
Yes [ ] No [ ]
2. Which of the following describes your current usage of the social media platforms listed below?
Constant user Regular User Occasional User Past User Never Used It
YouTube
Blogs
Text messaging
Flickr
Linked In
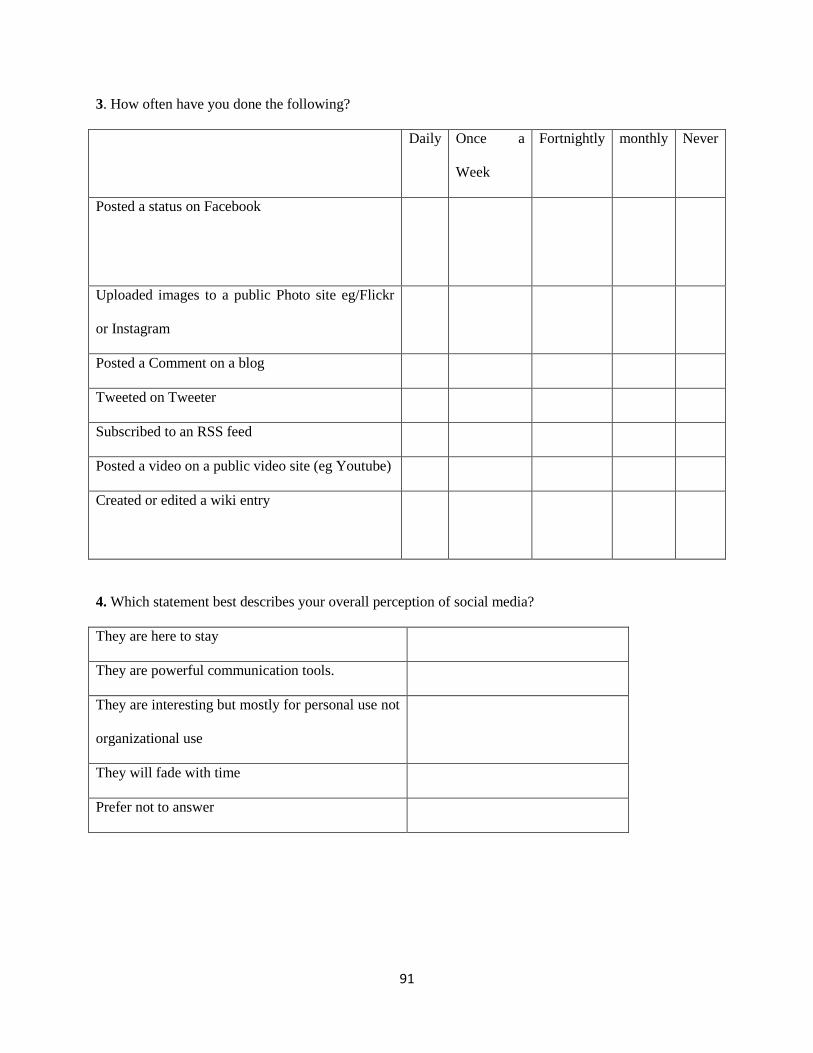
91
3. How often have you done the following?
Daily Once a
Week
Fortnightly monthly Never
Posted a status on Facebook
Uploaded images to a public Photo site eg/Flickr
or Instagram
Posted a Comment on a blog
Tweeted on Tweeter
Subscribed to an RSS feed
Posted a video on a public video site (eg Youtube)
Created or edited a wiki entry
4. Which statement best describes your overall perception of social media?
They are here to stay
They are powerful communication tools.
They are interesting but mostly for personal use not
organizational use
They will fade with time
Prefer not to answer
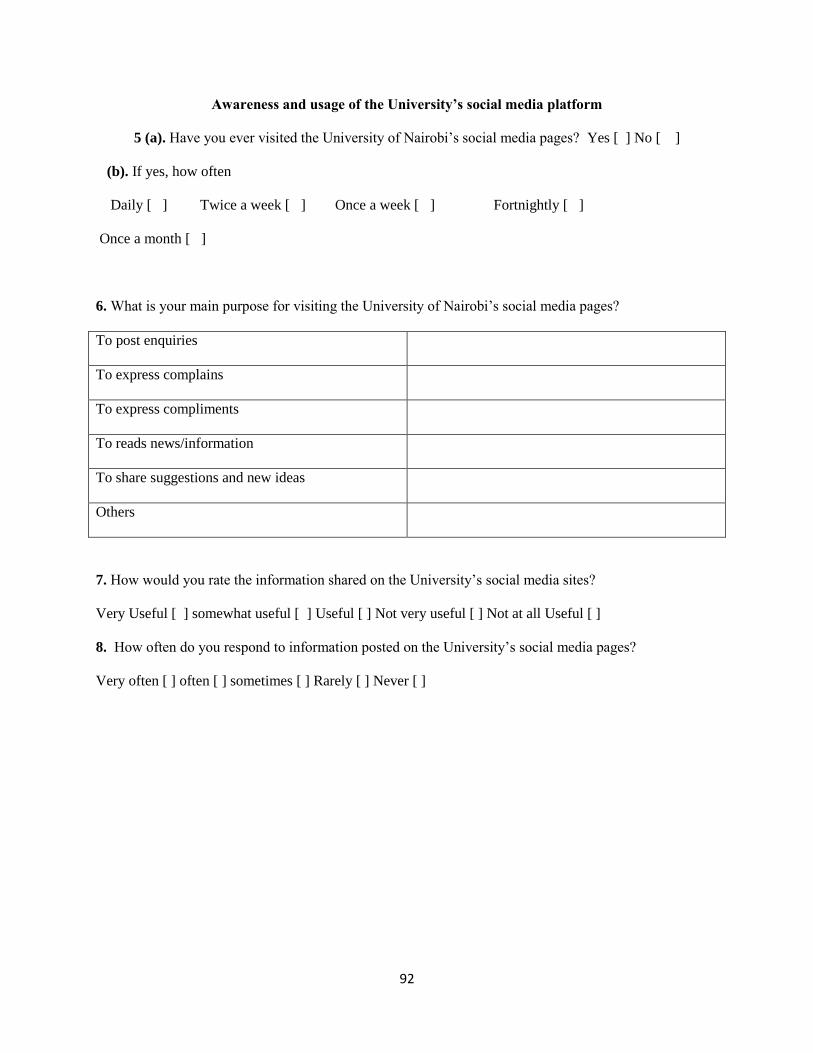
92
Awareness and usage of the University’s social media platform
5 (a). Have you ever visited the University of Nairobi‘s social media pages? Yes [ ] No [ ]
(b). If yes, how often
Daily [ ] Twice a week [ ] Once a week [ ] Fortnightly [ ]
Once a month [ ]
6. What is your main purpose for visiting the University of Nairobi‘s social media pages?
To post enquiries
To express complains
To express compliments
To reads news/information
To share suggestions and new ideas
Others
7. How would you rate the information shared on the University‘s social media sites?
Very Useful [ ] somewhat useful [ ] Useful [ ] Not very useful [ ] Not at all Useful [ ]
8. How often do you respond to information posted on the University‘s social media pages?
Very often [ ] often [ ] sometimes [ ] Rarely [ ] Never [ ]
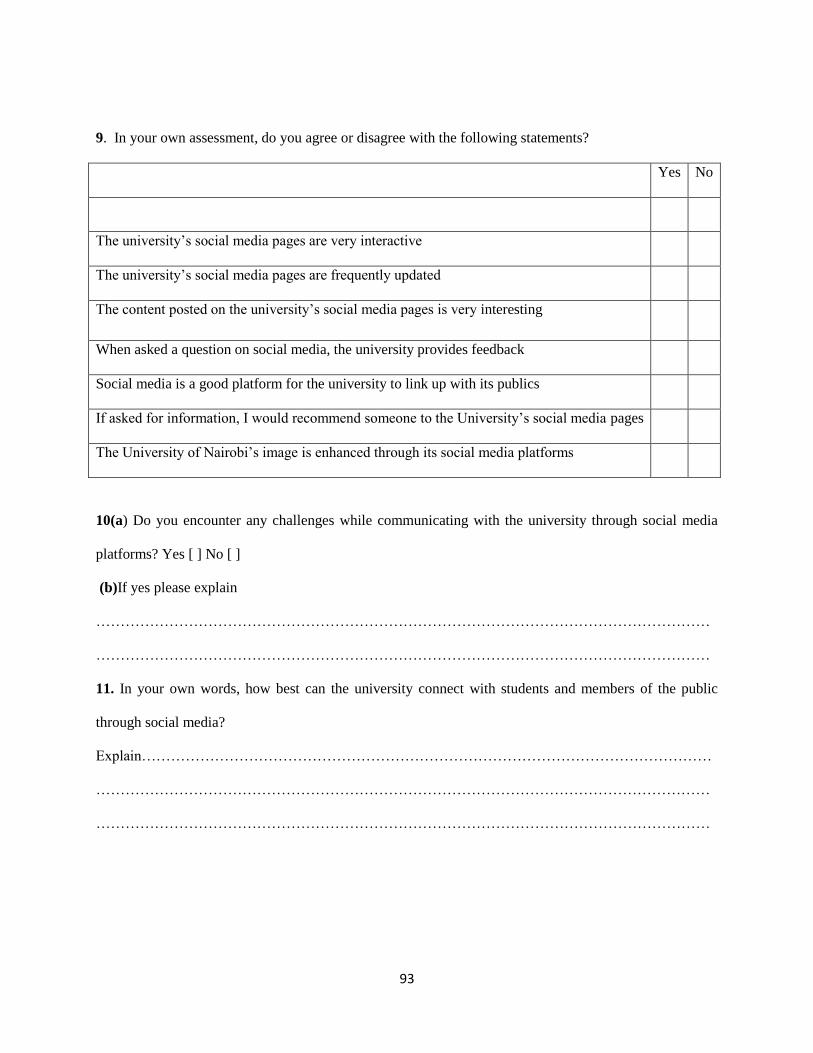
93
9. In your own assessment, do you agree or disagree with the following statements?
Yes No
The university‘s social media pages are very interactive
The university‘s social media pages are frequently updated
The content posted on the university‘s social media pages is very interesting
When asked a question on social media, the university provides feedback
Social media is a good platform for the university to link up with its publics
If asked for information, I would recommend someone to the University‘s social media pages
The University of Nairobi‘s image is enhanced through its social media platforms
10(a) Do you encounter any challenges while communicating with the university through social media
platforms? Yes [ ] No [ ]
(b)If yes please explain
………………………………………………………………………………………………………………
………………………………………………………………………………………………………………
11. In your own words, how best can the university connect with students and members of the public
through social media?
Explain………………………………………………………………………………………………………
………………………………………………………………………………………………………………
………………………………………………………………………………………………………………

94
APPENDIX3: Questionnaire for Web Champions
Instructions
Please tick the appropriate box and fill in the blank spaces provided for questions where
elaborate answers are required.
Section A: Personal Information
Name (Optional)…………………………………
Gender Male [ ] Female [ ]
Section B: Social Media Usage and Perception
1. Does your faculty/school/department have any active social media account?
Yes [ ] No [ ] Not aware [ ]
2. (a) Do you manage a professional social media account for your faculty/department or
school? Yes [ ] No [ ]
(b)If Yes; Which Social Media platforms do you use to share faculty information
with students? Facebook [ ] Twitter [ ] MySpace [ ] YouTube [ ] Blogs [ ]
LinkedIn [ ] Instagram [ ] Other [ ]
(c)If No, who manages your faculty‘s social media accounts?
Explain……………………………………………………………………………
95
3. Which statement best describes your overall perception of social media?
They are here to stay and my faculty/school/department has strategy/needs a strategy/is
developing a strategy for using them.
They have a powerful potential in communication but I am not sure how it can be applied in
faculty/school/department
They are interesting but mostly for personal use not for faculty/department/school‘s use
They will fade with time
Prefer not to answer
4. Which of the following describes your current usage of the electronic communications listed
below?
Constant user Regular User Occasional User Past User Never Used It
YouTube
Blogs
Text messaging
Flickr
Linked In
96
5. How often have you done the following on the faculty‘s/department‘s/school‘s social media pages?
Daily Once a
Week
Fortnightly monthly Never
Posted a status on Facebook
Uploaded images to a public Photo site eg/Flickr
or Instagram
Posted /responded to a Comment on a blog
Tweeted on Tweeter
Subscribed to an RSS feed
Posted a video on a public video site (eg Youtube)
Created or edited a wiki entry
6. Do you use each of the following social media for personal use or the
faculty‘s/department‘s/school‘s use or both?
Personal Use Only Faculty Use Only Both I don‘t use it
Linked In
Blogs
Youtube
Youtube
97
7. To the best of your knowledge, how often does your faculty/department/school use each of the
following forms of electronic communication?
a)To communicate with staff and current students
Regularly Occasionally Seldom Never I have no Idea
Youtube
Linked In
Blogs
Flickr
Text Messaging
98
b) To communicate with people outside the university (prospective students, alumni, donors,
partners)
Regularly Occasionally Seldom Never I have no Idea
Youtube
Linked In
Blogs
Flickr
Text Messaging
8. What kinds of information do you post for/share with students, alumni, staff and members of
the public on the faculty‘s/schools/department‘s social media accounts?
News/events updates [ ] photographs [ ] videos [ ] other [ ]
9. What kinds of information do students and members of the public post on your social media
pages?
Inquiries [ ] complains [ ] compliments [ ] suggestions [ ] other [ ]
99
10. Do you encounter any challenges while engaging students, staff and members of the public
on social media?
Yes [ ] No [ ]
If yes, please explain the challenges in brief…………………………………………..
11. How do you respond to remarks posted on your faculty‘s social media pages by students,
staff and members of the public if you do not have an immediate answer? Please
explain………………………………………………………………………………………………
………………………………………………………………………………………………………
12. Do you monitor/evaluate the success levels of your faculty/department/school‘s social media
communication with students, and members of the public?
Yes [ ] No [ ]
If yes, please explain how and when you evaluate your success?
………………………………………………………………………………………………………
………………………………………………………………………………………………………
100
APPENDIX 4: Key Informant Interview Guide for the Communications Officer of the
University of Nairobi
I. As the communications professional of the University of Nairobi, why did you decide to engage
students on social media? What was the main idea behind it?
II. As the social media coordinator, how do you ensure that the University‘s social media brand
succeeds? What type of content do you share and how do you create it to ensure that your social
media brand becomes and remains a popular communication alternative for your stakeholders?
III. Does it make strategic sense for the University of Nairobi to be involved with social media? How
do social media enhance your communication with publics?
IV. What is the main goal of the University of Nairobi‘s social media strategy? Have you set a
measurable objective as far as your social media interaction with students is concerned?
V. Is the University‘s social media (communications) separate from your other forms of
communications or it is a reflection of the messages from other communications platforms? Any
examples?
VI. How do you evaluate the levels of the university‘s social media engagement with students?
Specifically for your posts-how do you monitor shares, comments, social tags? Do you use a
special tool for this?
VII. What type of content receives higher rates of interaction when posted on the University‘s social
media pages?
VIII. How have you incorporated social media policy into the university‘s entire marketing and
communications policy?
IX. What are some of the challenges you encounter when using social media to communicate with
students?