social network analysis of stakeholder groups implementing
TRANSCRIPT
UNIVERSITY OF HOHENHEIM
FACULTY OF AGRICULTUTRAL SCIENCES
INSTITUTE OF AGRICULTURAL ECONOMICS AND SOCIAL
SCIENCES IN THE TROPICS AND SUBTROPICS
Master Thesis Submitted in Partial Fulfillment of the Requirement for the Award of
Master of Science Degree in Agricultural Sciences in the Tropics and Subtropics
By
Ernestine Mefor Halle (619695)
Supervised by: Professor Dr. Regina Birner
Dr. Frieder Graef
Dr. Barbara Schröter
Stuttgart-Hohenheim
May, 2017
Study funded through the Research for the Global Food Supply (GlobE) initiative of the
German Federal Ministry of Education and Research (BMBF)
Social network analysis of stakeholder groups implementing
upgrading strategies to enhance food security in rural regions of
Tanzania
i
Declaration
I, Ernestine Mefor Halle hereby declare that this Master‘s thesis has been prepared entirely by
me. The thesis has been prepared exclusively with the enumerated literature bibliographies.
The thesis has not been submitted anywhere else for the award of a degree.
I hereby affirm, here within, that I have conveyed the final electronic manuscript (in one of
the formats *.doc, *.docx, *.odt, *.pdf, *.rtf) to my supervisor which corresponds exactly to
the contents and wording of the printed copy. I am also conscious that the final digital copy of
my thesis will be verified for plagiarism by software analysis.
Signature Date
………………………………………….. ………………………

ii
Acknowledgements
I wish to thank God for guidance through this stage of my life. Special thanks and gratitude to
my supervisors; Professor Dr. Regina Birner, Dr. Frieder Graef and Dr. Barbara Schröter for
their professional guidance, encouragement, unwavering support and useful critiques
throughout the undertaking of this research.
Special thanks and gratitude to the Leibniz Centre for Agricultural Landscape Research
(ZALF) for allowing me carry out my research work and internship with them.
I also wish to thank my fiancé (Julius). Your input and comments on my work were always
profitable. I am indebted to my wonderful family and friends for prayers and inspiration
during the process.
I am greatly thankful to Estephania Jaime for her patience, generosity and captivating
enthusiasm during our field work and writing process. Phanny, thanks for all our little chats.
Special thanks to Enrique Hernandez for helping me with SPSS analysis.
I am greatly thankful to Nyika Laizer and Jackson Chamushala for assisting during the field
work. Special thanks to the lecturers of Sokoine University of Agriculture, Irene Kaguna,
Devotha Mchau, Paul Saidi, Emmanuel Chilagane, Obedy, Rashidi Ally, Boniface and the
farmers in the Morogoro and Dodoma region, Tanzania for their time and patience during the
interviews and Net-Map sessions.
Special thanks to the coordinators of the AgriTropics and EnviroFood master‘s program at the
University of Hohenheim: Katrin Winkler and Kerstin Hoffbauer respectively for making me
feel at home. Thanks for your care, love and support. A special thanks to all AgriTropics
students and lecturers for all the support rendered.
Special appreciation and gratitude to the Research for the Global Food Supply (GlobE)
initiative of the German Federal Ministry of Education and Research (BMBF) for funding this
thesis. I thank the Velbinger family for financial assistance during my second year study in
Hohenheim through the Gert Volker Dill Foundation scholarship. Special thanks and gratitude
to the Catholic Church of the University of Hohenheim for their financial assistance during
the last six months of the thesis writing process.
Lastly and certainly not the least, people, who made my life in Germany so wonderfully
colorful, thank you a lot. I am proud and happy to have people like you in my life!
iii
Abstract
Improving food security is essential for most rural Tanzanian households where the
nutritional status of the country‘s population is low. Given the challenges of rising food
demand it is highly recommended to upgrade existing smallholder food systems in order to
escalate the system‘s flexibility against upcoming vulnerabilities. Food securing upgrading
strategies are decent practices safeguarding food at the local to regional scale. The aim of this
study was to assess and apprehend the role of actors and the interlinkages among the UPS
groups; to determine the relationship within these UPS group actors; to recognize the
differences between the different UPS groups and other actors; and to define possible success
factors for UPS group performance. The study was piloted in the framework of a multi-
disciplinary Trans-SEC project in Tanzania, designed to enhance food security for rural poor
households by employing food securing UPS along the food value chain. Our specific focus
was on five UPS, namely a) kitchen gardens, b) tied ridges and fertilizer micro dosing, c)
optimized market-oriented grain storage d) improved wood supply and e) mobile integrated
market access system.
Research methods included individual interviews using the social network analysis tool Net-
Map and focus group discussions. Net-Map a participatory interview-based research tool
enabled visualizing and understanding the power relations, interlinkages among the UPS
groups, and stakeholder goals, all of which facilitate knowledge transfer and material flow.
The results show that most UPS in the sub-humid region (Changarawe and Ilakala) had
slightly higher knowledge network densities in contrast to those in the semi-arid region (Ilolo
and Idifu). The study in turn revealed high levels of degree centrality of group participants
especially in the UPS – kitchen gardens, tied ridges, improved wood supply and improved
storage. The knowledge, money and material flows were similar among different groups.
Motivations for participating in a UPS group differ to some extent between UPS groups and
all types of actors whereby enhancing food availability, more joy, more income, more
knowledge, better reputation and better social relations were most frequently mentioned. The
results show that an actor may be powerful without necessarily occupying an influential spot.
The results provide understanding of the different UPS stakeholder group‘s performances by
showing attributes of stakeholders and then relating them to their goals and perceived
influence. The results further provide the basis for future strategic planning to further enhance
participation and up-scaling. This study suggests that improved performance along the food
value chain is needed, investments in policies, capacity building for farmers and social
iv
learning in terms of collective action and collaboration. The thesis serves as a landmark for
understanding stakeholders‘ roles and their influence in implementing upgrading strategies.
Key words: Net-Map, upgrading strategy, food security, Tanzania, stakeholders, degree
centrality, motivations, food value chain, social network analysis
1
Table of Contents Declaration ........................................................................................................................................ i
Acknowledgements .......................................................................................................................... ii
Abstract ........................................................................................................................................... iii
List of tables ..................................................................................................................................... 1
List of figures ................................................................................................................................... 2
Abbreviations and Acronyms ........................................................................................................... 4
1. Introduction .................................................................................................................................. 6
1.1 Background information and problem statement ................................................................... 6
1.2 Research questions ................................................................................................................. 9
1.3 Study objectives ...................................................................................................................... 9
1.3.1 Specific Objectives .......................................................................................................... 9
1.4 Justification of the Study ........................................................................................................ 9
1.5 Scope and Limitations .......................................................................................................... 12
1.6 Definition of main terms....................................................................................................... 12
1.7 Outline of the structure of the thesis ..................................................................................... 14
2. A review of related literature ...................................................................................................... 15
2.1 Introduction .......................................................................................................................... 15
2.1.2 Food Security ................................................................................................................. 15
2.1.3 Reasons for food insecurity ........................................................................................... 16
2.1.4 Food security in Sub-Saharan Africa (SSA) .................................................................. 17
2.1.5 Possible solutions in Sub-Saharan Africa ...................................................................... 20
2.2 Upgrading strategies (UPS) .................................................................................................. 22
2.3 The theory of diffusion of innovations ................................................................................. 31
2.3.1 Social network analysis of stakeholder groups and performance in the adoption of
innovations .............................................................................................................................. 33
3. The conceptual framework: Sustainable Livelihoods Framework ............................................. 36
3.1 Livelihoods and vulnerability context .................................................................................. 38
3.2 Transforming structures and processes ................................................................................. 39
3.3 Livelihood strategies and outcomes ..................................................................................... 40
4. Methodology .............................................................................................................................. 42
4.1 Study area ............................................................................................................................. 42
4.1.1 Region and case study sites (CSS) ................................................................................. 42
4.1.1.1 Semi-arid Dodoma ...................................................................................................... 42
4.1.1.2 Sub-humid Morogoro ................................................................................................. 43
4.2 Research Design ................................................................................................................... 44
2
4.2.1 Individual interviews ..................................................................................................... 44
4.2.2 Net-Map tool .................................................................................................................. 45
4.2.3 Focus Group Discussions (FGDs) ................................................................................. 48
4.2.4 Data collection and analysis .......................................................................................... 51
5. Results ........................................................................................................................................ 53
5.1 Overview of important actors involved in the different UPS groups ................................... 53
5.2. Networks‘ oversight attributes ............................................................................................. 53
5.2.1 Network of knowledge cohesion attributes ................................................................... 53
5.2.2 Network of money cohesion attributes .......................................................................... 55
5.2.3 Network of material cohesion attributes ........................................................................ 56
5.3. Networks centrality measures .............................................................................................. 57
5.3.1 Network of knowledge................................................................................................... 57
5.3.2 Network of money ......................................................................................................... 60
5.3.3 Network of material ....................................................................................................... 63
5.4. Motivations for actors for the upgrading strategy ............................................................... 64
5.5. In-depth comparison of kitchen gardens: both regional and village level ........................... 67
5.5.1 Network of knowledge for the kitchen garden UPS ...................................................... 67
5.5.2 Network of money for the kitchen garden UPS ............................................................. 70
5.5.3 Network of materials for the kitchen garden UPS ......................................................... 72
5.5.4 Towers for the kitchen garden upgrading strategy ........................................................ 74
5.5.4.2 Influence of actors for all kitchen garden implementation ......................................... 75
5.5.5 Motivations for actors for the kitchen garden upgrading strategy ................................. 79
5.6 In-depth comparison of tied ridges and fertilizer micro dosing: both regional and village
level ............................................................................................................................................ 82
5.6.1 Network of knowledge for the tied ridges and fertilizer micro dosing UPS ................. 82
5.6.2 Network of money for the tied ridges and fertilizer micro dosing UPS ........................ 85
5.6.3 Network of material for the tied ridges and fertilizer micro dosing UPS ...................... 86
5.6.4 Influence of actors for the tied ridges and fertilizer micro dosing implementation ....... 87
5.6.5 Motivations for actors for the tied ridges and fertilizer micro dosing UPS ................... 91
5.7 In-depth comparison of improved grain storage and improved wood supply UPS: both
regional and village level ............................................................................................................ 95
5.7.1 Network of knowledge for the improved grain storage and improved wood supply UPS
................................................................................................................................................ 95
5.7.2 Network of money for the improved grain storage and improved wood supply UPS ... 98
5.7.3 Network of material for the improved gran storage and improved wood supply UPS 100
3
5.7.4 Influence of actors for the improved grain storage and improved wood supply
implementation ..................................................................................................................... 101
5.7.5 Motivations for actors for the improved grain storage and improved wood supply UPS
.............................................................................................................................................. 105
5.8. Comparison of actors between different UPS groups ........................................................... 110
5.8.1 Motivations for actors between different UPS groups .................................................... 110
5.8.2 Influence categories of actors between different UPS groups ......................................... 110
5.9. Comparison of actors in one specific UPS group .................................................................. 111
5.9.1 Influence categories of actors in one specific UPS groups.............................................. 111
5.9.2 Motivations for actors in one specific UPS group ........................................................... 111
6. Discussion ................................................................................................................................ 114
6.1 Impact of social network structure on UPS implementation .............................................. 114
6.2 Roles and structural positions in the UPS implementation ................................................ 118
6.3 Motivations and influence categories between different UPS and actors .......................... 120
6.4 Methodological features and implications .......................................................................... 123
6.5 Possible impacts of the upgrading strategies on livelihoods and food security ................. 126
7. Conclusions .............................................................................................................................. 128
8. Recommendations .................................................................................................................... 131
Bibliography ................................................................................................................................. 132
Annex ........................................................................................................................................... 149
Annex A: Actors involved in the UPS implementation ........................................................... 149
Annex B: Centrality measures of the material networks for the KG, TR-FMD, OMOS and IWS
.................................................................................................................................................. 151
Annex C: Kitchen garden (KG) material network map across four villages ............................ 152
Annex D: Tied ridges and fertilizer micro dosing money network map across four villages .. 153
Annex E: Tied ridges and fertilizer micro dosing material network map across four villages 154
Annex F: Money network map for improved grain storage and improved wood supply ......... 155
Annex G: Material network map for improved grain storage and improved wood supply ...... 156
Annex H: Individual interviews and Focus Group Discussion plans ....................................... 157
Consent form ........................................................................................................................ 158
Questions .............................................................................................................................. 159
Annex I: Interview Protocol ..................................................................................................... 162
1
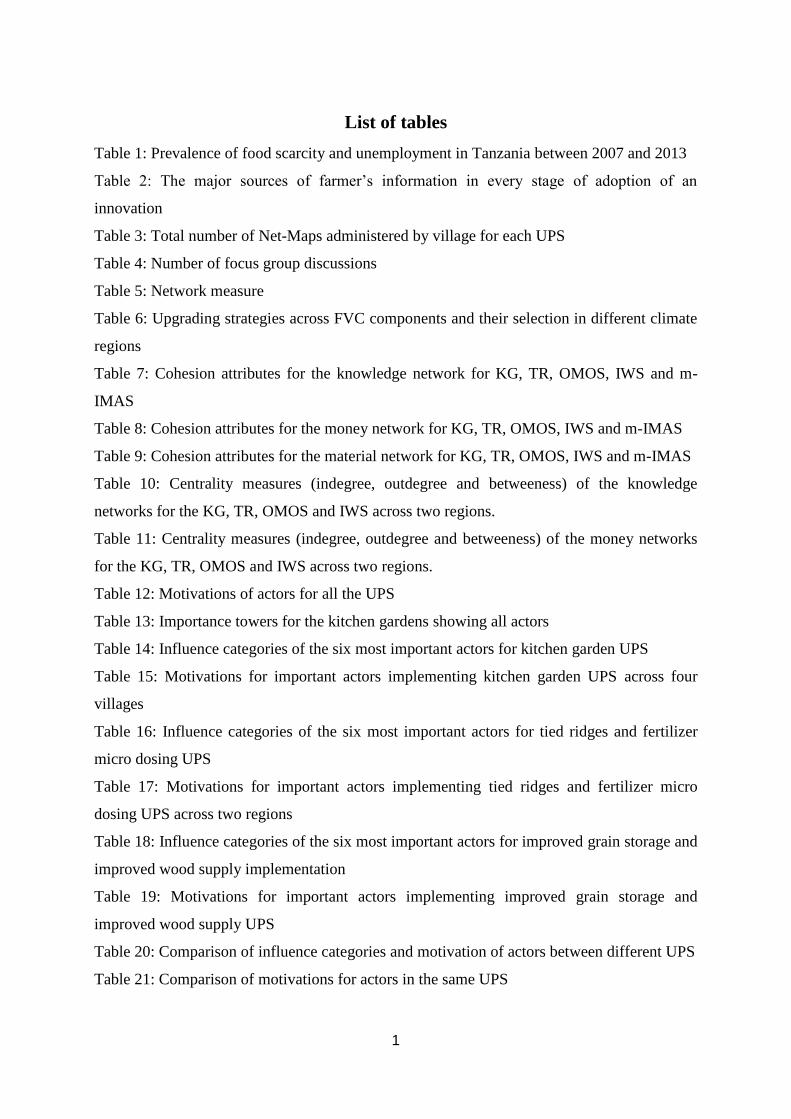
List of tables
Table 1: Prevalence of food scarcity and unemployment in Tanzania between 2007 and 2013
Table 2: The major sources of farmer‘s information in every stage of adoption of an
innovation
Table 3: Total number of Net-Maps administered by village for each UPS
Table 4: Number of focus group discussions
Table 5: Network measure
Table 6: Upgrading strategies across FVC components and their selection in different climate
regions
Table 7: Cohesion attributes for the knowledge network for KG, TR, OMOS, IWS and m-
IMAS
Table 8: Cohesion attributes for the money network for KG, TR, OMOS, IWS and m-IMAS
Table 9: Cohesion attributes for the material network for KG, TR, OMOS, IWS and m-IMAS
Table 10: Centrality measures (indegree, outdegree and betweeness) of the knowledge
networks for the KG, TR, OMOS and IWS across two regions.
Table 11: Centrality measures (indegree, outdegree and betweeness) of the money networks
for the KG, TR, OMOS and IWS across two regions.
Table 12: Motivations of actors for all the UPS
Table 13: Importance towers for the kitchen gardens showing all actors
Table 14: Influence categories of the six most important actors for kitchen garden UPS
Table 15: Motivations for important actors implementing kitchen garden UPS across four
villages
Table 16: Influence categories of the six most important actors for tied ridges and fertilizer
micro dosing UPS
Table 17: Motivations for important actors implementing tied ridges and fertilizer micro
dosing UPS across two regions
Table 18: Influence categories of the six most important actors for improved grain storage and
improved wood supply implementation
Table 19: Motivations for important actors implementing improved grain storage and
improved wood supply UPS
Table 20: Comparison of influence categories and motivation of actors between different UPS
Table 21: Comparison of motivations for actors in the same UPS
2
List of figures
Figure 1: Post-harvest chains of activities of maize displaying various phases of grain damage
as a result of diverse causal agents.
Figure 2: Innovation attributes leading to adoption and possible re-invention
Figure 3: Conceptual framework for understanding the Sustainable Livelihoods Framework
Figure 4: Map of the CSS: Morogoro and Dodoma region
Figure 5: Net-Map of power relationships and influence among important actors
Figure 6: Focus group sessions at Ilolo for the kitchen garden (a) & improved wood supply
(b)
Figure 7: Kitchen garden (KG) knowledge network map across four villages
Figure 8: Indegree, outdegree and betweeness centrality of actors with respect to knowledge
flows for the kitchen garden across four villages
Figure 9: Kitchen garden (KG) money network map across four villages
Figure 10: Indegree, outdegree and betweeness centrality of actors with respect to money
flows for the kitchen garden across four villages
Figure 11: Betweeness centrality of actors with respect to material flows for the kitchen
garden across four villages
Figure 12: Illustration of a typical kitchen garden of a farmer growing sukuma wiki at Ilolo
(a) and Changarawe (b) village in the semi-arid and sub-humid region respectively
Figure 13: Tied ridges and fertilizer micro dosing knowledge network map across four
villages
Figure 14: Indegree centrality of actors with respect to knowledge flows for the tied ridges
and fertilizer micro dosing across four villages.
Figure 15: Indegree centrality of actors with respect to money flows for the tied ridges and
fertilizer micro dosing across four villages.
Figure 16: Betweenesse centrality of actors with respect to material flows for the tied ridges
and fertilizer micro dosing across four villages.
Figure 17: Illustration of tied ridges in a field at Changarawe village with maize
Figure 18: Maize grown in a field at Ilakala village using tied ridges technology
Figure 19: Knowledge network map for improved grain storage and improved wood supply
Figure 20: Indegree centrality of actors with respect to knowledge flows for the improved
grain storage UPS.
Figure 21: Degree centrality of actors with respect to knowledge flows for the improved wood
supply UPS.
3
Figure 22: Indegree centrality of actors with respect to money flows for the improved grain
storage UPS.
Figure 23: Degree centrality of actors with respect to money flows for the improved wood
supply UPS.
Figure 24: Betweeness centrality of actors with respect to material flows for the improved
grain storage UPS.
Figure 25: Degree centrality of actors with respect to material flows for the improved wood
supply UPS.
Figure 26: Improved storage of maize grain using the improved storage bag at Changarawe
village
Figure 27: Illustration of a Melea azedirachta tree planted in a farm at Ilolo village.
4
Abbreviations and Acronyms
AIDS Acquired Immunodeficiency Syndrome
BMBF German Federal Ministry of Education and Research
DFID UK Department for International Development
FAO Food and Agricultural Organization
FAOStat Food and Agriculture Organization Statistics
FARMAfrica Food and Agriculture Research Management
FGDs Focus Group Discussions
FVC Food Value Chain
GDP Gross Domestic Product
GlobE Research for the Global Food Supply
HIV Human Immunodeficiency Virus
ICT Information and communication technologies
ICRAF The World Agroforestry Centre
IRRI International Institute of Tropical Agriculture
IT Information Technology
IWS Improved wood supply
KG Kitchen garden
m-IMAS Mobile integrated market access system
MoHSW Ministry of Health and Social Welfare
MVIWATA Mtandao wa Vikundi vya Wakulima Tanzania
NBS National Bureau of Statistics
NGOs Non-Governmental Organisations
OMOS Optimized market-oriented grain storage
PHDR Poverty and Human Development Report
PICS Purdue Improved Cowpeas Storage or Purdue Improved
Crop Storage
RWH Rainwater harvesting
SMS Short Message Services
SPSS Statistical Package for Social Studies
SSA Sub-Saharan Africa
SUA Sokoine University of Agriculture
SWOT Strengths, Weaknesses, Opportunities, and Threats

5
TFNC Tanzania Food and Nutrition Centre
TR Tied ridges
TR-FMD Tied ridges and fertilizer micro dosing
Trans-SEC Innovating Strategies to safeguard Food Security using
Technology and Knowledge Transfer: A people-centred
Approach
UN United Nations
UNAIDS The Joint United Nations Programme on HIV/AIDS
UNICEF United Nations Children‘s Fund
UPS Upgrading strategy
USAID United States Agency for International Development
USDAERS United States Department of Agriculture‘s Economic
Research Service
WFP World Food Programme
WFS World Food Summit
WHO World Health Organization
ZALF Leibniz Centre for Agricultural Landscape Research
6
1. Introduction
1.1 Background information and problem statement
Worldwide, about one in eight people suffer from hunger. This figure doubles that for
victim‘s suffering from hidden hunger1 (IFPRI 2014). Nowadays, more than one in seven
people lack access to adequate energy and protein with more suffering from micronutrient
deficiency (FAO 2009). Kitchen gardens may serve as an alternate solution to the above
problem.
Sub-Saharan African (SSA) countries are undergoing the fastest global population growth
rates (World Bank 2015) and are currently facing the challenges of food accessibility and
production (FAO 2014). Health is affected when there is food insecurity. In infants and
children, prolonged hunger is more damaging than for adults because it can lead to
overwhelming emotional, mental and physical impairment (Binagwaho et al., 2011).
Climate change has of late appeared as a topic of real concern for many stakeholders. This is
very much related to water resource issues. Climate change (Kangalawe and Lyimo 2013) is
one example for pressures on natural production resources (Shemdoe 2011b) that affects food
security. Similarly, negative effects of globalization, population growth and policy processes
(Riisgaard et al., 2010) reduce food crop productivity and land available per capita. Food
security is commonly affected by processes occurring at different temporal and/or spatial
scales. This explains why developing food securing upgrading strategies (UPS) requires
region- and site-specific approaches (Graef et al., 2015).
Smallholder farmers in Tanzania are more and more threatened with environmental
instabilities resulting in increased food insecurity (Foley 2011). Given the challenges of
poverty, rising demand for food and unpredictable climate, resilience is needed to upgrade
small-scale agricultural structures resulting in enhanced livelihoods and production increase
against forthcoming threats.
Upgrading smallholder production systems can be done, for instance, by reducing post-
harvest losses often linked to poor management, technical and financial shortcomings in
1 According to the FAO, IFAD and WFP (2013), hidden hunger occurs when food is deficient
in micronutrients for instance minerals and vitamins. This affects the biological activity of
individuals as the quality of food intake does not meet nutrient requirements.
7
cooling facilities, storage, infrastructure, harvesting techniques, packaging and marketing
systems in developing countries. Apparently, for food security to be strengthened, it is highly
recommended to reduce food losses and wastes for instance with storage bags such as the
actellic super bags and super grain bags. The super grain bags have been highly effective in
rice storage as well as other cereal crops. The hermitic technology governs the functioning of
these bags. When no air is present inside the container, pests are killed and some are
suffocated. Improving post-harvest efficiency can be accomplished with improved storage
bags.
Kenya, Swaziland, Ethiopia and Zimbabwe introduced rainwater harvesting using the
techniques of tied ridging, infiltration pits and terracing (Reij et al., 2013). Infiltration pits
have been reported by Bainbridge (1998) to increase water penetration and retention, reduce
evaporation and enhance surface storage. Tied ridging was a success in Tanzania, providing a
greater maize yield in high rainfall areas (Macartney et al., 1971). Likewise, El-Swaify et al.
(1985) reported that tied ridges has been successful in reducing evapotranspiration and
surface run-off.
Similarly, strategies have been put in place to look at the constraints of poverty and food
insecurity. Persistent utilization of fast growing tree species for cooking energy have resulted
in an overall decrease in soil fertility. A rising interest is now being placed on building a
supporting environment to help enhance agricultural productivity and people‘s livelihood
while preventing land degradation (Kpadonou et al., 2017) and cooking energy problems.
Integrating fast growing tree species to improve soil fertility and provide wood supply may
lead to higher agricultural productivity and social economic returns.
In Tanzania, farmers face problems of lack of market information for marketing their produce.
Likewise, there is lack of linkage between the marketers and producers (Trans-SEC 2016).
Research done shows the reliance of farmers on tacit knowledge in regards to market
information, decision making, business management and vulnerability to middlemen fraud.
Such constraints can be resolved with the use of technology. Achieving this potential requires
that more attention is given to the most limiting factors for increased access to market
information in these regions. A solution is the use of the mobile integrated market access
system (m-IMAS) which strongly integrates food market access for farmers to enable them
better market their produce, thus helping alleviate poverty (Mwakaje 2010). The use of
mobile phones by farmers saves time, markets for informed decisions, and reduces transport
8
costs leading to better marketing, better planning, improved production, food security and
livelihoods (Masuka et al., 2016).
The aforementioned kitchen gardens, tied ridges and fertilizer micro dosing, improved storage
bags, improved wood supply and mobile integrated market access system are so-called
upgrading strategies (UPS), in this framework outlined as good mechanisms securing food at
the local to regional level. For such strategies to fit into existing local and regional food value
chains (FVCs), they should be designed to (i) enhance post-harvest processing of food and
end products and/or reduce post-harvest losses (Leuenberger and Wohlgemuth 2006), (ii)
raise the sustainability of agricultural productivity (Foley et al., 2011), and (iii) enhance the
economy and institutions (FAO 2012a).
Implementing UPS was the focus of the Trans-SEC project in Tanzania, on which the current
research builds. The large multi-disciplinary project in Tanzania is designed to proliferate the
food condition of the poor by securing food upgrading practices along regional and local food
value chains. The UPS are tested and adjusted together with the local stakeholders to site-
specific, sustainable settings and tailored for local outreach (Graef et al., 2014). The activities
are carried out applying an action research approach.
The selection of the UPS for implementation in each village was highly participative,
including small farmers and key stakeholders. The steps for the pre-selection were: (i)
Stakeholder mapping across the food value chain, (ii) Inventorying FVC‘s constraints and
strategies, (iii) Identification of the food security criteria through available literature, focus
groups and panel discussions (iv) Identification of 3-5 groups per FVC component (Mwinuka
et al., 2015). The final selection and prioritization of the UPS for implementation was done
through a participative focus group discussion, in groups of 9-13 stakeholders with different
backgrounds and knowledge.
For these UPS to be successful, a strong connection among local actors and also between
extensionists and/or scientists is crucial to achieve tailored, site-specific, long-term solutions
and ultimately enhance food security. Efficient and effective communication among actors
requires efficient and effective communication channels in all phases of the value chain (input
supply, production, delivery of outputs to consumers). Stakeholder analysis can be used by
diverse interest groups around a policy issue to bring transparency to the process.
9
1.2 Research questions
This study sought to answer the ensuing research questions:
1. Who are the important actors in the different UPS groups?
2. What is the linkage between the different UPS actors and beyond?
3. What are the motivations and influence factors of the different actors within a UPS
group?
4. How do the UPS actors manage and facilitate themselves in order to reach their goals?
1.3 Study objectives
The general objective is to assess and understand the role of actors and the interlinkages
among the UPS groups implementing the UPS. It is vital to deeply apprehend the
relationships which will enable assessment of the long-term sustainable potential of the
upgrading strategies that are being implemented.
1.3.1 Specific Objectives
The goal of this study will be realized by looking at the ensuing specific objectives:
1. To get a general idea of the actors involved in the different UPS groups
2. To determine the relationship (linkage) within the UPS group actors, between the
different UPS groups and other actors.
3. To define the key factors (motivations and influence categories) that determine the
performance of an UPS group.
4. To determine the activities (joint and individual activities such as regular
meetings, trainings etc.) that enhance the proper functioning of the UPS groups
and the implementation of the UPS.
1.4 Justification of the Study
1.4.1 Kitchen gardens
In Tanzania, the kitchen garden is an area which is currently under research. Kitchen gardens
provide labour and land for cultivation of horticultural crops (for instance fruits, vegetables,
medicinal plants). Kitchen gardens have caught the attention of development agencies when
combined with organic practices (Nordin and Nordin 2005).
10
Gardens help households to better manage scarce capital leading to enhanced livelihoods and
food security. Gardens close to the home help minimize transport especially to women
cultivating staple foods, medicinal plants and extra products for sell (ibid).
Availability of vegetables and fruits in a kitchen garden increases consumption leading to
lower rates of malnutrition. Furthermore, vegetables and fruit gardening provide aesthetic and
therapeutic exercise that help relieve stress, enhance local environments, improve food
security and nutritional status.
Nowadays, iron deficiency affects about two thirds of the world population (Wanjek 2005).
Vitamin and mineral deficiency rates in Tanzania are high. There is high proportion of
children below five years who are vitamin A (about 34%) and iron (about 59%) deficient. In
rural areas, a lot of people rely on staple foods which increases risk of inadequate
micronutrients intake (ICF-Macro and NBS 2011).
Barriers that limit fruits and vegetables consumption include accessibility, acceptance and
costs. According to Dibsdall (2011), in order for this potential to be achieved, the cost of
production needs to be as low as possible to enable contributors invest in land, labor and
organic fertilizer.
1.4.2 Tied ridges and fertilizer micro dosing
In different areas (sub-humid and semi-arid) around the world soil moisture is a main
challenge facing production of crops as a result of low amounts of rainfall. For the semi-area
areas, the rate of evapotranspiration is higher than precipitation. A common farm practice in
this area is flat cultivation which results in poor soil water management, low crop production
and runoff. Given the failure of the past attempts to successfully address these challenges, tied
ridges help conserve soil moisture especially during the short drought periods. This usually
range from one to three weeks. Likewise, fertilizer micro dosing and in-situ rainwater
harvesting are alternatives to help increase food security of rural poor farmers.
Elsewhere including Tanzania, rainwater harvesting (RWH) technologies have helped
renovate farming populations in dry regions from food insecure to food secure through
increase yields.
In Rwanda, maize yields improved from 1 593 kg-1
ha using level planting to 3 233 kg-1
ha
when tied ridges technology was applied (Mudatenguha et al., 2014). Similar field studies

11
done in Tanzania by Kabanza and Rwehumbiza (2007) using tied ridges on soil moisture
management practices showed increase yields of sorghum. Likewise, studies by Mahoo et al.
(2012) showed high rates of adoption of micro-catchment rainwater harvesting in the
Kilimanjaro region. In the Lake Victoria regions of Mwanaza, Tabora and Shinyanga, similar
success stories of the Majaluba system of rainwater harvesting have been reported using rice.
Given that Tanzania's national gross domestic product is mainly based on agriculture there is
need to enhance and increase farmers‘ knowledge on tied ridging and fertilizer micro dosing
technologies for better soil moisture conservation in order to reduce soil erosion and runoff
for sustainable crop productivity and soil fertility management.
1.4.3 Optimized market-oriented grain storage
A major challenge improving food security in SSA includes poor management of post-harvest
of grains and pulses. According to the FAO (2010) estimated losses are between 20-30%,
amounting to almost US$4 billion yearly. With increasing human population, growth rates
result in widening gaps between food demand and supply.
Maize is a major cash crop for millions of rural farm families in SSA with grain yields of less
than 1.0 t/ha (Cairns et al., 2013). Research studies have shown that about 10-88% of the total
maize produced in SSA during each season is lost as a result of field and storage pests (Ojo
and Omoloye 2012). This threatens household food security pushing farmers to look for
alternative methods to protect their grain during storage. Sometimes, these losses push
farmers to market their grains quickly at low costs to minimize losses during storage. A
decrease in food loss has substantial impact on livelihoods thus, groundbreaking techniques
are required to ensure food is produced and stored sustainably (Nellemann 2009).
1.4.4 Improved Wood supply
Recently, researchers, policy makers and farmers have become interested in fast growing
species for their ability to contribute to deficits in trees and agricultural products with
environmental and socio-economic benefits. Fast growing trees ensure livelihood security
through employment and rural income generation which may solve the problem of food
insecurity (Singh and Pandey 2011).
Fast growing trees when incorporated into agricultural systems can increase crop productivity.
The income of small scale farmers is also increased through diverse products (such as fodder
12
and fruits). They offer on-farm benefits such as enhanced biomass productivity, nutrient
cycling, improve soil fertility, carbon sequestration, bioenergy and many more.
Rising human population and periodic degradation of resources are the major drivers of food
insecurity. Livestock and human population increase creates pressures on natural resources
which limits availability of cropping systems. This has led to challenges in increasing crop
productivity required to meet increasing food requirements. Fast growing trees are vital for
soil fertility as well as essential constituents of land use systems helping increase soil
nutrients through efficient soil cycling (Sarvade et al., 2014).
1.4.5 Mobile integrated market access system
An important challenge threatening agriculture in Africa is farmer‘s access to advisory
services and market information for both inputs and produce. Nowadays, the use of
information technology (IT) plays an important role for information profusion and influx.
Information technology helps extensionists and farmer groups to coordinate meetings, seek
opinions of members who are not present during a meeting (Martin and Abbott 2008). The
efficient circulation of information enables farmers to make better decisions, plan and produce
better, get better markets and prices for their products.
1.5 Scope and Limitations
The study was piloted in four villages in Tanzania comprising the sub-humid and semi-arid
regions of Morogoro and Dodoma respectively. These regions are characterized by different
climatic conditions. The study focused on the impact of kitchen gardens, tied ridges and
fertilizer micro dosing, optimized market-oriented grain storage, improved wood supply and
mobile integrated market access system for food security. Since the study was done in regions
that were peri-urban, the results may not be applicable to urban areas. However, they may be
true for other parts of Tanzania that bear similar characteristics.
1.6 Definition of main terms
1.6.1 Kitchen gardens
The kitchen garden is a garden where vegetables are grown for one's own consumption. The
garden supplies supplements and helps generate direct or indirect income (Ninez 1984) for
households.
13
1.6.2 Food security
The study has adopted the 1996 World Food Summit underlying principle of food security
―when all people, at all times, have physical and economic access to sufficient, safe and
nutritious food that meets their dietary needs and food preferences for an active and healthy
life‖ (WFS 1996; WHO 2013).
The definition can be further broken down to food accessibility, food availability, food
utilization and food stability. Access here has to do with physical and economic factors that
enable people to obtain essential quantities of food to meet dietary preferences and needs.
Availability here has to do with sufficient quantities of food existing. Utilization here refers to
appropriate hygiene and nutrition to meet physiological needs of people. Stability refers to
adequate food at all times for a population, household or individual. Food security in
Tanzania has been tackled differently by trying to control the units of production mainly land
and water.
1.6.3 Tied ridges
In different areas around the world, the opening of soils in between by ridging results in the
creation of furrows (Lal 1990). Furrows created by ridging in erratic and low rainfall areas
can either be left sealed or exposed at steady intervals which help capture water and facilitate
infiltration. Earth ties used to block the furrows at permanent intervals characterize tied
ridging (Wiyo et al., 1999). The distance between the cross-tied furrows is 2 m or more. The
soil is ridged to heights of 15-25 cm before or after planting (Elwell and Norton 1988).
Planting of the crop is either in the furrow or on the ridge.
14
1.7 Outline of the structure of the thesis
The thesis is made up of seven main chapters.
The background of the study, study objectives and rationale for choosing to conduct a
participatory action field research on the topic of upgrading strategies in rural Tanzania is
explained in the first chapter.
In chapter two, the literature review on upgrading strategies, food security in Tanzania, social
networks, flow of innovations is explained. The conceptual framework (Sustainable
Livelihoods Framework) for the study is also illustrated.
The third chapter gives details about the methodology with the techniques utilized in the
collection of data and analysis.
The results for all upgrading strategies (UPS), description of actors involved in the UPS,
networks centrality measures, motivations and influence factors of actors is elaborated in
chapter four.
Next, the results are discussed in chapter five based on; impact of social network structures on
UPS implementation, roles and structural positions in the UPS implementation, motivations
and influence factors between different UPS and actors, methodological features and
implications, possible impacts of the UPS on livelihoods and food security.
Lastly, chapter six and seven presents the conclusion and recommendations of the study
respectively.

15
2. A review of related literature
2.1 Introduction
An extensive review of literature on upgrading strategies, food security, the situation in Sub-
Saharan Africa, possible solutions to food insecurity in SSA and Tanzania, flow of
innovations, and social network analysis (SNA) in understanding and enhancing the UPS
performance is presented in this chapter. Additionally, the UPS are also presented with a
focus on Tanzania; to reduce food insecurity and ensure farmers have sufficient food, the need
for UPS is justified and designed to be feasible for farmers. Finally, a conceptual framework
for the study is presented.
2.1.2 Food Security
Food security is attained once all individuals benefit from nontoxic, nutritive food to sustain a
fit and energetic lifespan (WHO 2013). The rise in population, soil degradation, urbanization,
soil infertility, climate change, industrial development, changing market conditions,
governance factors and droughts affect food security at different spatial scales (Graef et al.,
2014).
According to estimates, by 2030 a higher quota of the world‘s impoverished will be
concentrated in conflict-affected and vulnerable regions as well as natural resources–based
economies (World Bank 2016). This proportion is estimated to be greater in SSA. In certain
zones in Sub-Saharan Africa, by 2050 crop yields are likely to reduce by 10-20% due to
decreasing precipitation and increasing temperature (Jones and Thornton 2009).
Small-scale livestock production systems play critical roles in the livelihoods of rural
populations (Thornton et al., 2009). Battisti and Naylor (2009) reported that climate change is
expected to be more severe for populations most dependent on livestock and crop production.
The human population in SSA by 2050 is expected to double 2.4 billion (UN 2015) with
expected high demand for animal products. According to the UN‘s FAO (2013), there is need
to significantly increase the global food supply, raise awareness and mitigate climate change.
Recently, different areas around the world have witnessed significant decline in investments
in infrastructure and research in crop cultivation. Other drivers affecting food security
include; rising water scarcity, HIV and AIDS. At the end of 2002, about 42 million cases of
HIV and AIDS were reported worldwide with 95% in the developing world (UNAIDS 2003).
16
It affected health, social and economic impacts as well as nutrition and food security. When a
population is affected by such a disease, adult labour in households is often impacted with
less ability to produce food resulting in reduction of assets for medical costs (FAO 2001).
Likewise, the knowledge base on agriculture is also affected as individuals with experience in
farming are lost due to the disease (Haddad and Gillespie 2001).
Studies have indeed shown that the use of agroecological techniques may provide novel
procedures for improving yields. Elsewhere in the less developed countries, increased
investment and policy reforms will help improve food security (Rosegrant and Cline 2003).
These authors reported that, for food security to be achieved there is need for investment and
policy reforms in human resources, research in agriculture both at the farm and communal
level, and natural resources management.
An estimated 5 million people in Tanzania were reported to be food insecure in 2014 by the
USDAERS (United States Department of Agriculture‘s Economic Research Service). The
World Food Program (WFP) estimates 40% of the population to be malnourished (WFP
2010). Likewise, Rosen et al. (2014) said the number was projected to increase to 14 million
by 2024. According to UNICEF, an estimated 42% of Tanzanian children are underdeveloped
(UN 2013).
2.1.3 Reasons for food insecurity
Food insecurity occurs when people lack enough to eat and hunger or malnutrition is
everyday reality. Malnutrition and hunger usually occurs when people lack appropriate land to
grow food or are too poor to buy enough food. Food and Agriculture Organization (FAO)
projected a billion people are malnourished with a large increase in the number seen in 2005
(Wegren 2013).
Undernutrition has led to increase mortality rate worldwide with an estimated 35% in children
below the age of five years (Black et al., 2008). Reports from UNICEF (2009) shows the
death rate of children under-five is 41% (Jones and Thornton 2009) with estimated 40% of
these children under-five being stunted and 13% wasted. Human Dimensions of food
insecurity include starvation, wasting, stunting, chronic hunger and malnutrition (Barrett
2010). Prolong impact of hunger on kids and infants is much severe than on adults. This
causes emotional, physical and mental damage (Binagwaho et al., 2011).
17
Climate change (Kangalawe and Lyimo 2013) and pressures on natural production resources
(Shemdoe 2011a) affect food security resulting in reduce crop productivity and land available
per capita. Likewise, similar processes for instance urbanization, soil infertility, droughts,
population growth also affect food security.
The effects of climate change are likely to have a marked effect in Sub-Saharan Africa
leading to significant increase of malnourished and undernourished people (Wheeler and
Braun 2013). Food prices have increased three-fold since the 2007-2008 commodity price
crisis causing major proliferations in food insecurity and poverty (FAO 2011). Likewise,
climate change is expected to lower rice, wheat and maize production over the next decades
(World Bank 2011; IPCC 2013).
Research carried out shows that diverse drivers such as market shocks (D'souza and Jolliffe
2014), household income (Holden and Otsuka 2014); social capital (Gundersen et al., 2011),
human capital (Seligman et al., 2010), natural capital (Sasson 2012) play vital roles in
predicting the aftermath of food security and health. Every culture is gifted with diverse
blends of resources making it difficult to find shared features effective in achieving food
security (Wheeler and Braun 2013). There is need to identify policy instruments relevant to
enhance food security at different settings.
2.1.4 Food security in Sub-Saharan Africa (SSA)
Locally produced goods in developing countries are usually consumed locally. Decline in
population with rise in local production remains a focal point for issues relating to food
security (Schmidhuber and Tubiello 2007). Actually, there are various factors that lead to
price volatility and high global food prices which include biofuels, increase in energy price
and food scarcity. Farmers tend to benefit from high priced commodities when there is high
investment in agriculture resulting to production increase.
In Zimbabwe, there is high reliance of the rural population on agriculture as agricultural
workers for food security (FAO 2006). In the year 2010, agriculture contributed about 16%
towards the gross domestic product in the economy of Zimbabwe (FAO 2010). Similarly, in
2014 agriculture contributed 14% towards its gross domestic product (World Bank 2015) with
78% of the population living involved in smallholder farming for livelihood and food security
(FAO 2015).
18
The food security of Tanzanians relies greatly on agriculture and its socio-economic
development. In the rural areas, about 87% of the population is involved in agriculture for
livelihood and food security (URT 2005). According to FAOStat (2014), about 9.3 million
women and 7.7 million men are active in agriculture in Tanzania. The low-income households
rely greatly on it as it alleviates poverty and improves economic growth. It coffers about half
of the national gross domestic product (URT 2005). In the third quarter of 2015, growth in the
agricultural sector slowed down as a result of insufficient rains in the 2014/2015 crop season
which hindered crop production (ICF-Macro and NBS 2011).
A major driver for food insecurity in Tanzania is poverty (World Bank 2015). In rural areas,
poverty remains devastatingly high among households with high dependence on agriculture.
The Poverty and Human Development Report (PHDR) for 2005 revealed no significant
nutritional status improvement was made for under-five year old children in Tanzania.
Likewise, malnutrition still remains a problem.
Every year, about 130,000 deaths in children under-five occur due to poor feeding practices
(MoHSW 2004). In 2010, ICF-Macro and NBS (2011) reported about 35% of Tanzanian
children below the age of five as undersized, 21% malnourished and 59% were anaemic.
Food insecurity in Tanzania is both chronic and drought prone in nature. Instability of food
production, household income results in transitory food insecurity (Chung 1997). This occurs
mostly in the central and northern parts of Tabora, Dodoma, Shinyanga, Singida, Arusha,
Manyara and Kilimanjaro (WFP 2007). Immediately after harvest, households usually sell the
surplus. Later in the year (six to nine months later), many lack cash to buy food or own a
crop. The calorie needs in the rainy season are quite high as a result of high work load in the
farm and market prices are high making it more severe. Fluctuations in market prices in urban
areas cause food insecurity. Likewise, overselling and inadequate post-harvest management is
also a contributing factor to food insecurity. This results in people changing their eating habits
and patterns which is often detrimental to their nutritional well-being (Mallick and Rafi
2010). The urban poor households, resource poor small-scale farmers, landless and
pastoralists often face problems of chronic food insecurity.
Despite great strides being made by Tanzania to reduce malnutrition, it still has a high rate of
malnourished people with about 42% of its children malnourished (CARE 2013). The years
2000 and 2016 showed a rise in undernourished individuals (three million people between
19
2000 to 16.8 million people between 2016) in Tanzania (FAOStat 2016). This could be
attributed to increase population growth rate and inadequate calories and energy protein
intake.
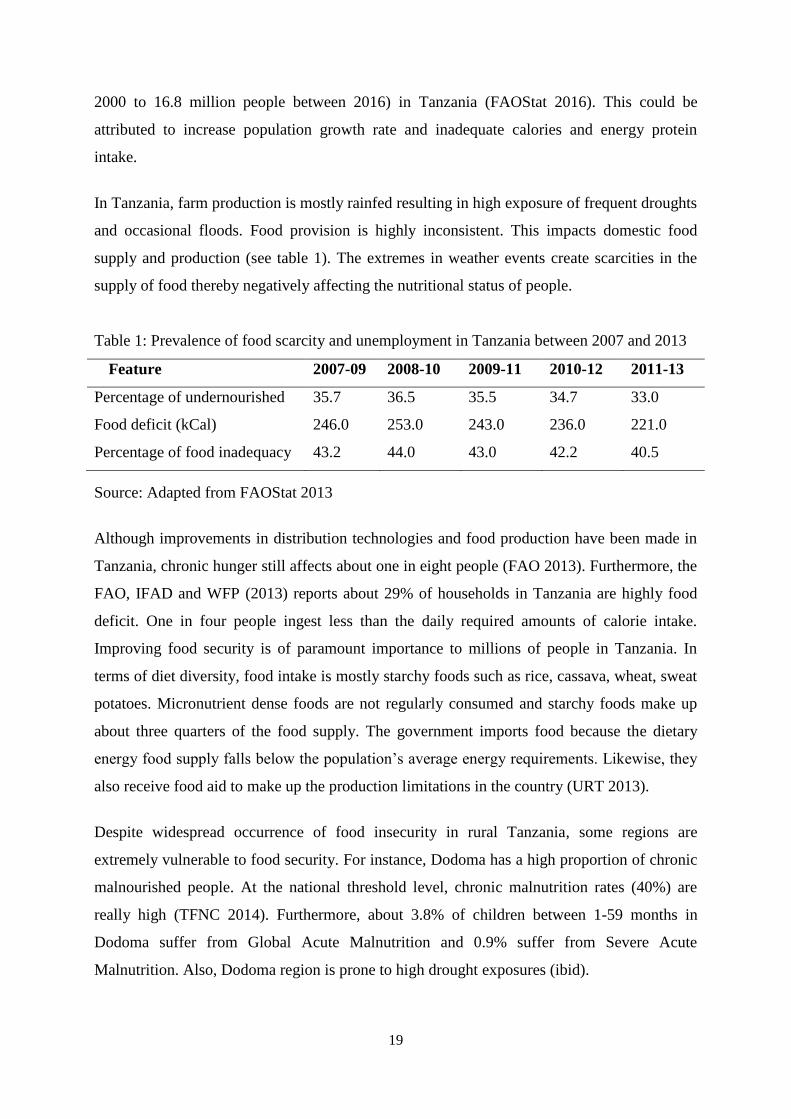
In Tanzania, farm production is mostly rainfed resulting in high exposure of frequent droughts
and occasional floods. Food provision is highly inconsistent. This impacts domestic food
supply and production (see table 1). The extremes in weather events create scarcities in the
supply of food thereby negatively affecting the nutritional status of people.
Table 1: Prevalence of food scarcity and unemployment in Tanzania between 2007 and 2013
Feature
2007-09 2008-10 2009-11 2010-12 2011-13
Percentage of undernourished 35.7 36.5 35.5 34.7 33.0
Food deficit (kCal) 246.0 253.0 243.0 236.0 221.0
Percentage of food inadequacy 43.2 44.0 43.0 42.2 40.5
Source: Adapted from FAOStat 2013
Although improvements in distribution technologies and food production have been made in
Tanzania, chronic hunger still affects about one in eight people (FAO 2013). Furthermore, the
FAO, IFAD and WFP (2013) reports about 29% of households in Tanzania are highly food
deficit. One in four people ingest less than the daily required amounts of calorie intake.
Improving food security is of paramount importance to millions of people in Tanzania. In
terms of diet diversity, food intake is mostly starchy foods such as rice, cassava, wheat, sweat
potatoes. Micronutrient dense foods are not regularly consumed and starchy foods make up
about three quarters of the food supply. The government imports food because the dietary
energy food supply falls below the population‘s average energy requirements. Likewise, they
also receive food aid to make up the production limitations in the country (URT 2013).
Despite widespread occurrence of food insecurity in rural Tanzania, some regions are
extremely vulnerable to food security. For instance, Dodoma has a high proportion of chronic
malnourished people. At the national threshold level, chronic malnutrition rates (40%) are
really high (TFNC 2014). Furthermore, about 3.8% of children between 1-59 months in
Dodoma suffer from Global Acute Malnutrition and 0.9% suffer from Severe Acute
Malnutrition. Also, Dodoma region is prone to high drought exposures (ibid).
20
Misaki et al. (2015) said over 75% of workers in Tanzania work in the agriculture sector
which contributes 30% of export earnings, 24.1% of the Gross Domestic Product, and about
65% of materials needed for industries. Land ownership characterizes small-scale farming
(Chamberlin 2008). In rural areas, small-scale farmers are the largest group in the agricultural
sector. Despite the rise in innovation practices in Tanzania, UPS like kitchen gardens, tied
ridges and fertilizer micro dosing, improved storage bags, agroforestry, mobile phone use by
small-scale farmers for agriculture is still rare (Misaki et al., 2015).
2.1.5 Possible solutions in Sub-Saharan Africa
Improvements on forage quality, livestock breeds, diet supplementation have high potential to
address poor livestock performance (FAO 2014). According to authors Thornton et al. (2009),
it is also highly recommended to improve feedstuff, breed and genes, health and environment
with diverse combinations for different livestock systems in developing countries.
Climate-smart livestock management is also recommended for increasing productivity,
mitigating climate change via reduction of green-house gases (FAO 2013). Also, due to
changing ecological and human framework (Müller 2011), there is urgent need for improved
integrated food systems and well developed region-specific and innovative strategies.
A number of agroecological approaches are promising as ways to improve agricultural
productivity. The use of these approaches in 17 African countries have shown improvements
on cereal yields of 50 to 100% (Pretty 1999). These approaches help reduce pollution,
enhance habitat restoration, and create biodiversity reserves.
At the local level, collective action is vital for proper implementation of agricultural
innovations. According to Pretty (1995), conservation and rainwater harvesting techniques
have been promising. In dry parts, participatory plant breeding programs have been
successfully used to increase yield in rainfed ecosystems. Participation by farmers in such
programs is helpful in finding crops suitable for diverse environments and farmer preferences
(Ceccarelli and Grando 2009).
Investment in people through education is needed to improve food security. Education enables
farmers to adopt crop management and advanced technologies needed for increasing
household income. High investment in women‘s education is highly recommended in order to

21
help reduce fertility rates and also improve environmental management and productivity
(World Bank 1996).
Agricultural products from commercial farming systems makes available food for a country,
materials required for industries resulting in better food security and economics of scale for a
nation. Furthermore, agriculture provides employment to the rural population and secondary
agriculture industries. Therefore, access to advisory service and market information is
required by farmers for informed decision making (Tadesse and Bahiigwa 2015). Likewise,
raising awareness and promoting ICT‘s among small-scale farmers to keep them up to date on
weather conditions, farming advice, better planning and improved production.
There is need to escalate efforts to alleviate poverty and increase food security in Tanzania
(MAFAP 2013) with improvements in farm level production, arable land expansion, yield
improvements and crop intensity. In Tanzania, enhancing the Food Value Chain (FVC) is of
crucial importance for increasing food security (Gómez et al., 2011). Likewise, a participatory
approach is needed to link global food recipients to actors locally. For instance, a poor people-
centered approach is highly required for it to be effective (Graef et al., 2014).
In rural areas, smallholder famers face problems of decision making all year round (for
instance; harvesting period, post-harvest, pre-harvest, land preparation and cultivation). The
use of information technology among farmers is lacking despite an increase in innovation
projects (Misaki et al., 2015). These factors constitute the need to enhance farmer‘s
technological knowledge and increase farmers‘ self-sufficiency.
Rainfed agriculture needs to be exploited which requires investment in extension services,
crop breeding, rainwater harvesting technologies and markets. Research done in Niger,
Tanzania, Burkina Faso and Kenya using rainwater harvesting showed high yield increase
(FAO 2000).
The Trans-SEC research project has been able to identify possible UPS as being promising
and feasible with great potential for scaling up. Trans-SEC UPS include; rainwater harvesting,
conservation agriculture, tied ridges, agroforestry and many more. The selection of the
different UPS was based on a set of both project and food security-oriented criteria (FAO et
al., 2013) and existing expertise and information (Kimenye and Bombom 2009) They were:
(i) anticipated to influence food security, (ii) previous information and data accessibility, (iii)
22
feasibility of analyses/testing in project lifetime, (iv) wide applicability and/or scale-up
potential, and (v) environmental sustainability. An overview of these UPS is listed below.
2.2 Upgrading strategies (UPS)
2.2.1 Kitchen garden (KG)
Dietary diversity in Tanzania remains low in households with high dependence of maize-
based diets with limited consumption of meat and vegetables that provide required vitamins to
meet daily food calorie intake requirements. Studies in Tanzania, Rwanda and Uganda by
Ecker et al. (2010) revealed 70% of calorie intake of farmers was from staples. A similar
study by Cochrane and D‘souza (2015) showed maize consumption in Tanzania to be
240 g day−1
person−1
(7.19 kg month−1
).
The marketing and production of vegetables in SSA and Tanzania is constrained by deed
quality, appropriate market information and high post-harvest losses. Additional research is
needed to understand forthcoming opportunities and alleged hitches encountered by small-
scale farmers on what to cultivate in terms of vegetables.
It is essential to diversify diets and improve nutrient intake with vegetables in order to
eliminate micronutrient deficiencies and associated health problems. Vegetables are vital
bases for fiber, micronutrients, vitamins and minerals. They provide low cost quality nutrition
to a population (Chweya 1999). Vegetables are equally rich phytochemicals and complement
staple foods helping improve nutritional quality of diets (Agong et al., 2013).
According to Thomasson (1994), kitchen gardens are a developed survival approach for
smallholder farmers. They are environmentally sustainable and require minimal inputs and
structure; provide balance diet for households, important sources of direct or indirect income
(Ninez 1984) for rural households. Furthermore, kitchen gardens help increase local
opportunities for people to eat better (Hale et al., 2011); provide year around access,
availability and consumption of sufficient amounts of vegetables ensuring adequate supply of
calorific demands of micronutrients for the resource poor.
Investment in traditional vegetable production by small-scale farmers in contrast to other
crops can offer nutritional and health benefits (Afari et al., 2016). This can be done as
promotion campaigns through nutritional programs in schools, markets, hospitals to help
increase vegetable consumption. For instance, in East Africa, promotion activities were
23
carried out by non-governmental organizations and research institutes on the African
nightshade in urban and supermarkets, hotels, retail markets (Agong et al., 2013). This helped
increase demand for the vegetables.
Some shortcomings associated with home gardens include; occurrence of diseases and pests,
weeds, inadequate capital, labour shortages, access to extension/advisory services and
information. The adoption of innovations is sometimes discontinued by those taking part in it
especially when a project comes to an end. For instance, due to low returns to labour.
However, vegetables grown in kitchen gardens make the most of limited water requirements
compared to crops (for instance maize) which require more (Tenkouano 2011). These
vegetables provide yields in a short growth period with less labour requirements. Another
study by Ochse and Terra (1937) illustrates labour input in home gardens (7 %), dry fields (34
%) and rice fields (59 %). The low returns to labour for home gardens reveals their nearness
to living areas, low erosion rates, low occurrence of diseases and pests, which provide
strategies to preserve soil fertility.
2.2.2 Tied ridges and fertilizer micro dosing (TR-FMD)
Semi-arid and sub-humid areas face problems of low rainfall with rates of evapotranspiration
higher than precipitation. This has led to practices such as flat cultivation which usually
results in runoff, low crop production, poor soil management and poor land husbandary. Also,
continuous farming without the use of fertilizer has led to low crop production and decrease
soil fertility. Small-scale farmers are unable to afford high cost fertilizers leading to poor crop
production and less improvement in soil fertility. The situation is even more severe in semi-
arid areas and dry lands leading to greater risk of crop failures.
Low erratic rainfall is a major characteristic of most developing countries resulting in regular
food insecurity, high drought threats and intra-seasonal dry spells (Ngigi 2003). Worldwide,
access to portable water is a main challenge especially in rural regions. An alternative solution
is the use of rainwater harvesting techniques.
Rainwater harvesting approaches are: terracing (locally known as ―fanya juu‖), tied ridges and
infiltration pits with overall goal to achieve sustainable agriculture and in-situ technologies
include; tied ridges, micro-basins, infiltration pits, mulching, deep tillage and ripping.
Rainwater harvesting has proven to be a potential practice for capturing and storing water. For
instance; in Kenya (Hartung 2007), Uganda and southern Zimbabwe (Hartung 2006).

24
In Tanzania efforts have been made to promote this technology. According to URT (2001),
rainwater harvesting has turned out to be an integral element of the Agricultural Sector
Development Strategy of Tanzania. Agricultural yields in semi-arid regions have been
elevated by using rainwater harvesting techniques (Falkenmark et al., 2001).
Elsewhere in Africa, research carried out in Kenya, Ethiopia, Sudan and Swaziland using the
techniques of tied ridges, terracing and infiltration pits (Reij et al., 2013) showed infiltration
pits enhanced water penetration, reduced evaporation and water holding capacity (Bainbridge
1998). Likewise, pitting has also shown to reduce surface runoff and evapotranspiration
(Stern et al., 1992). In the years 1983-84, terracing was introduced in Ethiopia as moisture and
soil management approach. In Kenya, it failed due to lack of resources (for instance money,
tools, labour) by poor people (Critchley and Graham 1991). Farmers recognized the profits of
rainwater harvesting but felt discouraged practicing it. This was attributed to lack of
knowledge on the technology.
For several decades now, scientists have illustrated the use of tied ridging to enhance root
density and root penetration of maize (Hulugalle 1988d) and cowpea especially in dry seasons
(Hulugalle 1987), cotton (Hulugalle 1986) and millet in the rainy and dry seasons (Hulugalle
1988b). It was equally found that for root growth to be stimulated there was need to increase
the soil water content for greater water retention (Taylor 1983). The indirect method reduces
soil strength (ibid). Likewise, when the water table is high, tied ridges had no major effect on
the root growth on the subsoil (Hulugalle 1986). However, data on the root growth response
of groundnut and sorghum using the technique of tied ridges is not available.
It was found that in semi-arid and arid regions, tied ridges have significant effects improving
crop productivity and water holding capacity (Motsi et al., 2004). Similarly, Jensen et al.
(2003) demonstrated that it may also result in waterlogging resulting in negative effect on
crop earnings.
Similar studies in the semi-arid and arid regions of SSA revealed increased crop yields of up
to 50% when water conservation strategies were employed (Araya and Stroosnijder 2010).
Furthermore, Coleman-Jensen et al. (2013) reported that when tied ridges were used in fusion
with nutrient inputs there was a two to six-fold yield increase compared to local farming
practices with no use of fertilizer.
25
Reports by ICRISAT (1983) and Ohm et al. (1985b) showed that when tied ridges and
fertilizers were used together, there was substantial rise in the yield of cereal. This significant
increase in grain yield only happens when they are both used together.
High labour input for TR in the first year poses potential bottlenecks for adoption of such a
technology. This is in line with Nyagumbo (1993) who reported a study in North Zimbabwe.
He identified that regardless of draught power stashes and labour in preceding years, labour
requirements for such a system is usually high at the early implementation stages. This may
hinder adoption of the technology for small farmers when a project eventually comes to end.
2.2.3 Optimized market-oriented grain storage (OMOS)
In Africa, the major constituent of crop production for smallholder farmers is the grain (World
Bank 2011). Resource poor farmers rely a lot on maize as cash crops, for income and food to
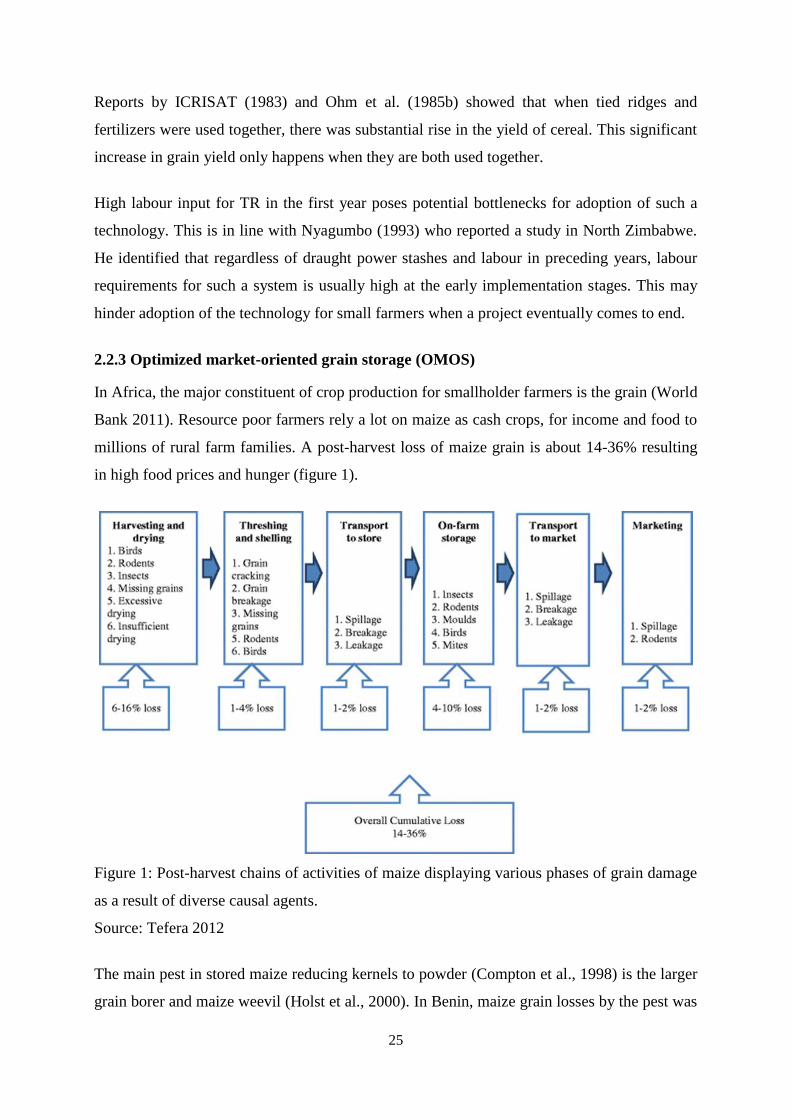
millions of rural farm families. A post-harvest loss of maize grain is about 14-36% resulting
in high food prices and hunger (figure 1).
Figure 1: Post-harvest chains of activities of maize displaying various phases of grain damage
as a result of diverse causal agents.
Source: Tefera 2012
The main pest in stored maize reducing kernels to powder (Compton et al., 1998) is the larger
grain borer and maize weevil (Holst et al., 2000). In Benin, maize grain losses by the pest was
26
around 23% after six months of storage (Meikle et al., 2002). In Togo, losses of up to 30.2%
were recorded with the larger grain borer after six months (Pantenius 1988). In Tanzania,
losses of up to 34% were reported by farmers and in severe cases 70-80% of the maize grain
was damaged (Boxall 2002) .
Likewise, in cassava and other crops the larger grain borer is the main insect pest
(Gnonlonfin et al., 2008). Wright et al. (1993) reported major losses for dried cassava in
Togo. These losses were as high as 30%.
After harvest farmers often face problems of lack of storage infrastructure. This leads to
higher logistic costs thus, influencing farmers‘ harvest timing decisions as well as post-
harvest losses. When this happens farmers encounter problems selling their produce
especially when prices are low. Post-harvest losses in SSA often pose a threat to household
food security pushing farmers to look for alternative measures for protecting their grain after
harvest (Stathers et al., 2008).
In the rural areas of Mozambique, farmers use raffia bags for rice storage. These bags are
highly permeable and do not inhibit pest buildup under high temperatures and humidity. Grain
losses impact both the quantity and quality (Hayma 2003) of the produce. According to
Fujisaka et al. (1996), despite low rice production in Mozambique, post-harvest losses are
also incurred resulting in less interest of the crop to smallholder farmers.
Efforts made to alleviate ravages caused by field pests include a wide range of techniques:
hermitic bags, metal silos, plastic drums, cocoons. Present storage methods with woven
polypropylene and maize cribs are ineffective against rodents and insects. Novel technologies
for storage include; super grain bags, actellic super and metal silos. Farrell and Schulten
(2002) reported that the actellic super bags are highly efficient against the larger grain borer in
combination with instant treating and shelling of the crop. In Central America, the metal silo
is widely used which is a cylindrical metal container used for on-farm grain storage.
Promotions by NGOs and FAO using the metal silos have been done in Malawi, Kenya and
Swaziland (FAO 2008).
Airtight storage techniques include: Purdue Improved Cowpea Storage bags and the
International Institute of Tropical Agriculture (IRRI) super grain bags. The super grain bags
also referred to as the IRRI super bag usually fit as lining in existing storage bags. They are
suitable for cereal crops like rice, wheat and sorghum. The IRRI super bags have been used to
27
manage post-harvest rice glitches in Asia (Rickman and Aquino 2007). In the IRRI super
bags, when the grain moisture content is low with corresponding inter-granular humidity, the
mortality rate is higher as a result of dehydration (Navarro 1978).
Ben et al. (2006) carried out a study in Vietnam using the IRRI super bags. Results showed
that the moisture content of the stored rice had not changed even though there was a decline
live insects to 1 per kg .They compared this to the traditional storage system and found an
increase in the live insects to an average of 53 per kg.
The Purdue Improved Cowpea Storage system also referred to as the Purdue Improved Crop
Storage (PICS) is used by farmers for pest management of stored cowpeas (Murdock et al.,
2012) and other grains which help reduce losses caused by insects (Moussa et al., 2011). The
PICS are triple layered with an added advantage as they prevent moisture and gas exchange of
the stored product and insects when hermetically sealed (that is, oxygen is reduced and carbon
dioxide is increased to levels that are insecticidal). This helps create an unsuitable atmosphere
for the growth of fungi and insect development.
Research with the PICS have shown their effectiveness in protecting stored maize from the
larger grain borer (Njoroge et al., 2014). These bags are more effective in contrast to the
standard polypropylene woven bags. The PICS bags provide an inexpensive management
solution for grain quality preservation and limits dependence on post-harvest insecticide
applications. Researchers (Rickman and Aquino 2007) have reported that the PICS are highly
effective in the control of rice pests in Asia.
Few farmers have implemented the above mentioned storage technologies. It is vital for
farmers to have knowledge on appropriate storage techniques that would profit them. Thus,
minimizing post-harvest losses instigated by pests and benefit farmers in the long term. It is
therefore important to moderate post-harvest losses in order to increase food availability.
2.2.4 Improved wood supply
In rural households in Tanzania, more than 90% depend on biomass for cooking and heating
(Munslow et al., 2013). Increasing livestock production and population explosion creates
pressures on natural resources which results in decreasing farm productivity. In the semi-arid
areas, there is shortage of cooking energy. Sources of energy include; livestock manure and
crop residues used by farmers to cope with this problem. This often leads to land degradation
28
and soil nutrient depletion. The improved wood supply upgrading strategy in the Trans-SEC
project was initiated to take care of land degradation and cooking energy difficulties. This was
done in order to integrate multipurpose trees to supply wood and enrich the soil. Trees species
selected by farmers to enrich the soil and provide fodder include; Gliricidia sepium and Melea
azedirachta; for wood supply Cardia sinensis and Senna siamea; and timber supply (Afzelia
quannzesis).
Agroforestry technologies (such as rotational woodlot, intercropping and boundary trees)
were discovered by ICRAF and SUA to be highly effective in both the sub-humid and semi-
arid regions (Kimaro et al., 2007). Orwa et al. (2009) stated that fast growing agroforestry tree
species regenerate quickly providing fuelwood and other products especially in rotations of 10
to 20 years with yearly bulk increase of 5 to 15 cubic m/ha.
High deforestation in the western parts of Tanzania through constant cropping, forest clearing
and great flux of grazing (Nyadzi et al., 2003) have led to the introduction of rotational
woodlot scheme to cater fuelwood shortages. It has also been found that maize cultivation
from rotational woodlot scheme is greater compared to continuous cropping as a result of
accumulation of soil nutrients (Nyadzi et al., 2003).
Actually, there is wide range of studies using the boundary tree planting. When a crop is
planted 3 m away from the tree rows it helps reduce rivalry (Kimaro et al., 2014). In Dodoma
region of Ilolo, Gliricidia sepium Jacq. is the lone multipurpose species being intercropped
with cereal due to its compatibility with other crops in the semi-arid regions. It is used by
farmers for poles, firewood, fodder, bee forage and fencing (Hughes 1987). The regular
pruning of leaves makes available manure for a cropping season (Makumba et al., 2006).
Other researcher (Lott et al., 2000) have equally reported that millet, maize, sorghum and sun
flower can be intercropped with agroforestry species.
In Tanzania, multipurpose fast growing tree species like the Cham and Cupressus lusitanica
provide yields of about 25 to 35 m3 ha/yr of wood in contrast to natural woodlands which
produce about 4.35 m3 ha/yr (Ek 1994). This requires sufficient supply of nutrients and
growth resources to ensure that they don‘t deplete fast. For the replenishment of soil fertility,
there is need for technological developments. Fast growing tree species are some approaches
that have been used to meet these challenges.
29
2.2.5 Mobile integrated market access system (m-IMAS)
Small-scale farmers are main contributors of agricultural products. Avoiding market ‗floods‘
and meeting market demand is a challenge in rural areas which leads to post-harvest losses.
This is usually due to uninformed decisions and lack of information. In order to accelerate
development in the developing countries, information communication technologies (ICTs) are
required. Mobile phones offer farmers opportunities to share information, get weather
updates, and markets for informed decisions (Tadesse and Bahiigwa 2015). Mobile phones
have been shown to help farmers consult with veterinary consultants and advisory services in
cases where a livestock is sick (Martin and Abbott 2008).
In Tanzania, some organizations have made use of the IT to access information on agriculture.
These organizations include; Tigo-Technoserve Agriculture Information System and
MVIWATA (Kadigi et al., 2013). Mobile phone use and a centralized database was
introduced by the Trans-SEC project in rural Tanzania to provide a blueprint to farmers to
easily market their products. The technology (m-IMAS) is a unique one as it helps integrate
food market access to farmers in rural villages. Farmers using ICT‘s to access markets are
those producing enormous quantities of in-demand crops, retailing more and receiving good
prices which is a way forward to alleviate poverty (Mwakaje 2010).
Source and reliability of farming information usually vary for farmers. Research in the Runge
district of Tanzania revealed that source of market information for farmers was from relatives
and traders whereas 23% obtained market information from information technology
(Mwakaje 2010).
According to the Food and Agriculture Research Management (FARMAfrica), mobile
telephony can help in the identification and management of livestock diseases in Kenya
(FARM-Africa 2007). It was found that mobiles reduced the cost of transportation for farmers
resulting in greater access to group support and information (Karamagi and Nalumansi 2009).
Also, a similar study in Bugerere district in Uganda showed that dairy farmers were able to
use mobiles to connect to FoodNet which resulted in the reduction of their transportation costs
to markets. FoodNet helps supply up-to-date price information for agricultural products. It
also provides contact details via SMS for interested buyers.
According to Muto and Yamano (2009), in rural areas market participation is enhanced by
mobile network expansion especially for those farmers cultivating perishable crops.

30
Despite all mentioned above opportunities, mobile phones do come with prerequisites. The
effectiveness of a rural mobile-based market information service (Islam and Grönlund 2011)
relies on; how adaptable the technology is within a given infrastructure; how the individual
needs are met with the pattern and provision of the service; how the business model is more
sustainable with low cost service; responsiveness communication with community.
2.2.5.1 Social networks and mobile phones
According to Castells (1996), when there is a shift to a network society it enables information
and communication technologies to work better. Scholars and researchers (Chen 2013; Stern
and Adams 2010) agree that there is a positive link between social interactions, ICTs and
community engagement.
Nevertheless, does the adoption of mobile telephony enlarge an individual‘s social network or
simply reinforce its current relations or associations? According to scholars (Hampton et al.,
2011), information and communication technologies help diversify social bonds by enabling
involvement in rural surroundings for instance public spaces, voluntary groups, religious
institutions. Mobile telephony provides great choice in deciding who to associate with. By so
doing, individuals can separate themselves from outsiders, come up with novel methods to
increase social relations to fit an individual‘s needs (Fortunati 2000). Geser (2006) contradicts
this theory by saying that, mobiles enable network cessation and intensifies a focus on known
relations.
According to Gergen (2002), mobiles enable micro-social creatures to live in the nonexistence
of spatial separation which enhances primary bonds. Ling (2008) reported that when the
interaction in a closed circle of ties is highly concentrated, it deepens relationships rather than
novel communicative associates. Other findings by Campbell and Kwak (2010) revealed that
the use of mobiles usually overlap with activities in our daily life such as being active in
groups and associations, spending time with loved ones.
Mobile phones have the ability to produce, store and transfer data making it a prospective
instrument to help in the diffusion of agricultural approaches (Hudson 2006). Deep
understanding of the formal and informal institutional and organizational processes to uncover
conditions that assist diffusion of innovations is essential.
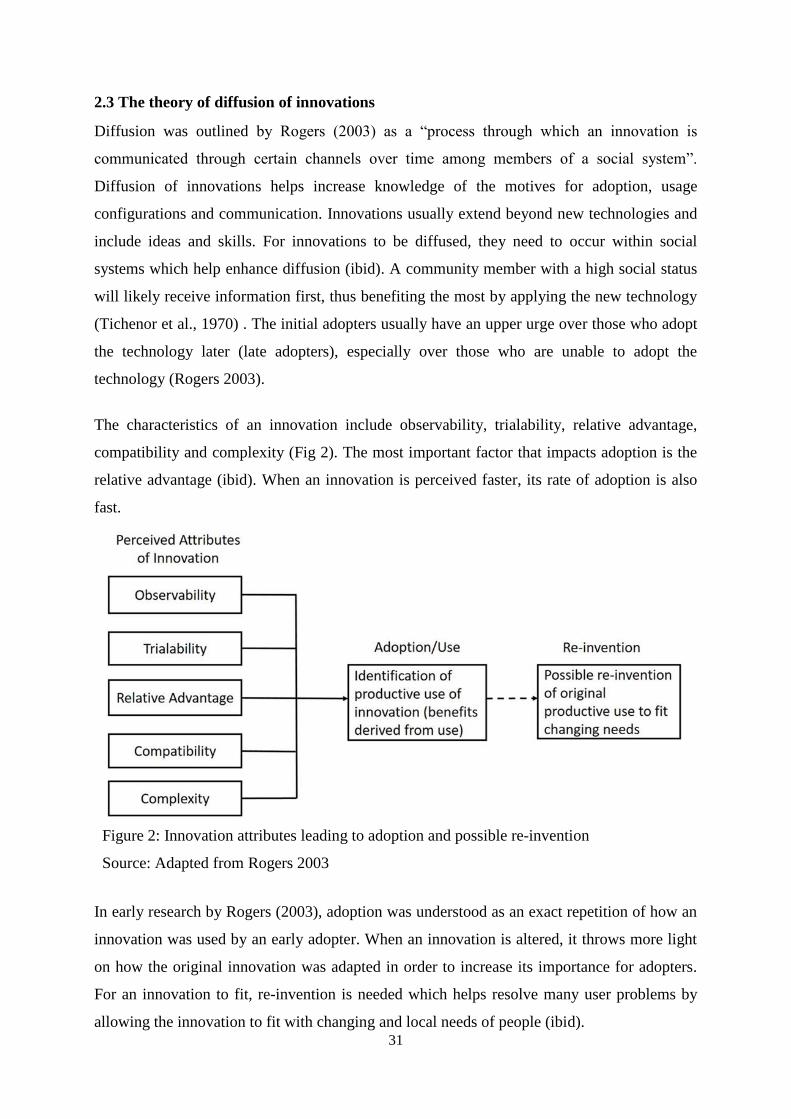
31
2.3 The theory of diffusion of innovations
Diffusion was outlined by Rogers (2003) as a ―process through which an innovation is
communicated through certain channels over time among members of a social system‖.
Diffusion of innovations helps increase knowledge of the motives for adoption, usage
configurations and communication. Innovations usually extend beyond new technologies and
include ideas and skills. For innovations to be diffused, they need to occur within social
systems which help enhance diffusion (ibid). A community member with a high social status
will likely receive information first, thus benefiting the most by applying the new technology
(Tichenor et al., 1970) . The initial adopters usually have an upper urge over those who adopt
the technology later (late adopters), especially over those who are unable to adopt the
technology (Rogers 2003).
The characteristics of an innovation include observability, trialability, relative advantage,
compatibility and complexity (Fig 2). The most important factor that impacts adoption is the
relative advantage (ibid). When an innovation is perceived faster, its rate of adoption is also
fast.
Figure 2: Innovation attributes leading to adoption and possible re-invention
Source: Adapted from Rogers 2003
In early research by Rogers (2003), adoption was understood as an exact repetition of how an
innovation was used by an early adopter. When an innovation is altered, it throws more light
on how the original innovation was adapted in order to increase its importance for adopters.
For an innovation to fit, re-invention is needed which helps resolve many user problems by
allowing the innovation to fit with changing and local needs of people (ibid).
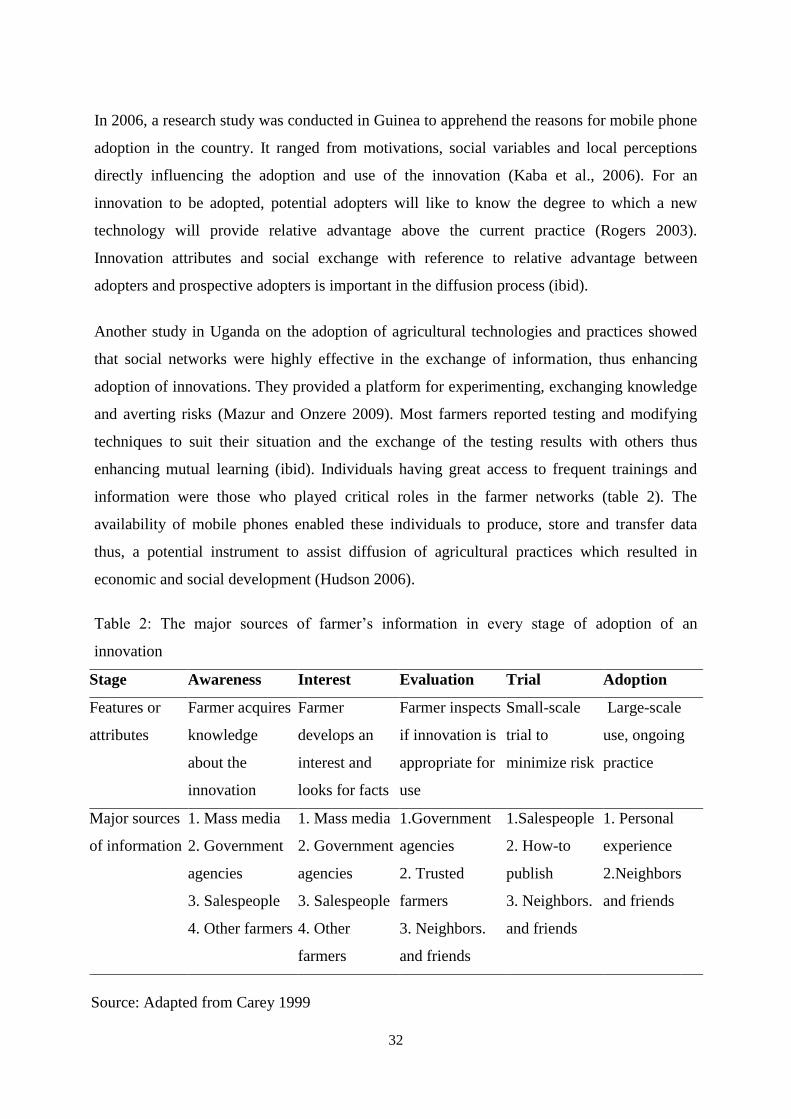
32
In 2006, a research study was conducted in Guinea to apprehend the reasons for mobile phone
adoption in the country. It ranged from motivations, social variables and local perceptions
directly influencing the adoption and use of the innovation (Kaba et al., 2006). For an
innovation to be adopted, potential adopters will like to know the degree to which a new
technology will provide relative advantage above the current practice (Rogers 2003).
Innovation attributes and social exchange with reference to relative advantage between
adopters and prospective adopters is important in the diffusion process (ibid).
Another study in Uganda on the adoption of agricultural technologies and practices showed
that social networks were highly effective in the exchange of information, thus enhancing
adoption of innovations. They provided a platform for experimenting, exchanging knowledge
and averting risks (Mazur and Onzere 2009). Most farmers reported testing and modifying
techniques to suit their situation and the exchange of the testing results with others thus
enhancing mutual learning (ibid). Individuals having great access to frequent trainings and
information were those who played critical roles in the farmer networks (table 2). The
availability of mobile phones enabled these individuals to produce, store and transfer data
thus, a potential instrument to assist diffusion of agricultural practices which resulted in
economic and social development (Hudson 2006).
Table 2: The major sources of farmer‘s information in every stage of adoption of an
innovation
Stage Awareness Interest Evaluation Trial Adoption
Features or
attributes
Farmer acquires
knowledge
about the
innovation
Farmer
develops an
interest and
looks for facts
Farmer inspects
if innovation is
appropriate for
use
Small-scale
trial to
minimize risk
Large-scale
use, ongoing
practice
Major sources
of information
1. Mass media
2. Government
agencies
3. Salespeople
4. Other farmers
1. Mass media
2. Government
agencies
3. Salespeople
4. Other
farmers
1.Government
agencies
2. Trusted
farmers
3. Neighbors.
and friends
1.Salespeople
2. How-to
publish
3. Neighbors.
and friends
1. Personal
experience
2.Neighbors
and friends
Source: Adapted from Carey 1999
33
2.3.1 Social network analysis of stakeholder groups and performance in the adoption of
innovations
Social network analysis is centered on the theory that relations among networking entities are
vital (Wasserman and Faust 1994). It takes into account relations between common actors and
the fixed forms of social arrangements. It comprises models, theories and applications
articulated in interactive theories (ibid). Social network analysis usually focus on structural
designs amongst actors when applied in policy analysis. Network analysis takes into
consideration human actors taking part in a social structure. The actors in the system function
as a point of reference for each other‘s decision making.
Social network analysis helps explain the existence of formal and informal ties across actors.
It looks at the linkage structure between actors, individual actor‘s achievement, improvements
inside a group of people and organizations. Social network analysis pays attention on the actor
networks to help identify information pathways, gatekeepers and brokers. It also makes
provisions for knowledge sharing between and within organizations.
Factors that influence the success of adoption of innovations include: household or farmer
characteristic (education, age, wealth, gender, labour availability), resource access (social
networks, information), farming system characteristics (slope access to irrigation, livestock
and land holdings), properties of the innovation (labour and capital investments) and farmers
access to social networks (Perz 2003).
Agriculture innovations create the base to improve livelihoods and develop agriculture of
smallholder farmers (Sanginga et al., 2004). For farmers, social networks enhance and nurture
innovations by providing space where testing, knowledge exchange and risk aversion is
rooted (Rogers 2003).
Diverse studies reveal how useful social networks are in the adoption of innovations in
agriculture. However, what is not so obvious is that a gap still exists understanding how
adoption of agricultural innovations and practices affect structural elements of social networks
(German et al., 2006). However, achieving this potential requires that more attention is given
to the identification of significant features to enable wide-spread profits from technologies;
enhance understanding of farm systems and social niches in which some technologies fit best
and finally identify bottlenecks which hinder proper functioning of individuals and social
groups (Mazur and Onzere 2009).
34
The diffusion of innovations is affected by social networks through joint evaluation, collective
action methods, social influence and learning (Hogset 2005). When innovations are risky,
network members usually moderate them to make them more genuine and significant through
joint evaluation. People are able to learn about the existence of innovations in order to lower
uncertainties related to the adoption of an innovation through social learning. The social
influence takes into account the execution of shared rules and individual‘s behavior and
preference (Degenne and Forsé 1999). Lastly, networks function as points for solving
conflicts and collective action coordination for problems.
The effect of network structure on attitude agreement can be produced using models in SNA.
This includes; cohesion, equivalence, bridges and brokers, prestige and spatial proximity.
Different levels of structural analysis can be used to understand the networks effect on
behavior (adoption) and attitude. Parameters are those at the node level (individual), network
levels, dyad, triad and subgroups (Contractor et al., 2006).
The early adopters of innovations are the opinion leaders located on the nodes with high
centrality measures (Becker 1970). Opinion leaders have access to external contacts and mass
media information (Rogers 2003). Likewise, ―are more innovative, have great contact with
change agents, high social status and social participation‖. They are used as representatives in
the adoption of innovations, resulting in enhanced efficiency of innovation diffusion at the
economic and social level. The centralized structure which is made up of the high centrality
parameters tend to speed up rate of diffusion. This is even made faster when diffusion
elements (knowledge, information) reach main actors (such as opinion leaders) in the network
(Rogers 2003). The effects of aggregate network structure made possible by SNA helps assess
regional differences in diffusion of innovations (Doss 2006).
According to research of Isham (2001) and Rogers (1995), for diffusion of innovations to be
rapid, the social structure needs; a) to be homogenous in the group which is the degree of
resemblance in some characteristics and views amongst persons leading to better promotion
of information sharing. For instance, in Bangladesh when information is spread among
households with similar religious relationships, it encourages uptake of better contraception
approaches (Munshi and Myaux 1998) b) social norms which is the extent to which
communication is promoted through local customs leading to fast diffusion of innovations.
For instance, in villages in Brazil, innovations were more rapidly accepted with values that
35
stimulated participatory policy making (Herzog et al., 1968) and c) leadership heterogeneity
which describes the extent to which leaders vary in economic and social qualities in the
network hence enhances acceleration of adoption of innovation. For instance, when a leader is
of higher socioeconomic status and diverse profession compared to another leader, this makes
available information linkage amongst them. These links are important when it comes to
information sharing across the groups in terms of innovations (Granovetter 1973).
Studies using SNA utilise mathematical methods to predict centrality measures (betweeness,
degree, closeness and centrality) enable proper examination of actor‘s perceived influence
(Freeman 1979). Sometimes, these measures are non-consistent and confusing (ibid).
According to Mizruchi and Potts (1998), the socially determined behaviors, resolutions and
interests of actors is not accounted for in SNA.
An advantage of SNA is provision of mathematical and visual understanding of social
relationships, network flows such as knowledge, resources and information. In the network,
the graphical maps offer rapid visual assessment of fragile and non-existing connections
amongst actors.
According to Helms et al. (2010), a shortcoming of SNA is the absence of data on whether
information exchange between actors is working or not. It does not explain actor‘s motivation
to create links, distribute or not to distribute information with other actors inside the network
(Tzatha and Schepers 2009). Furthermore, it does not identify glitches existing in exchange of
information between actors.
Another approach for analyzing exchange of information and mapping interactions is the tool
Net-Map. Net-Map is a research tool that uses power mapping and social network analysis to
help deliberate, envision, investigate and advance circumstances in which many diverse actors
have an influence (Schiffer and Peakes 2009). It builds and enlarges upon current social-
networking techniques.
36
3. The conceptual framework: Sustainable Livelihoods Framework
The conceptual framework for this study is presented in this section. It will help understand
the different kinds of capital, vulnerability context of rural poor farmers, livelihood strategies,
policies and institutions and finally the livelihood outcomes using the Sustainable Livelihoods
Framework (SLF).
The framework embodies combined concepts relevant to the contribution of the various UPS
(kitchen gardens, tied ridges and fertilizer micro dosing, optimized market-oriented grain
storage, improved wood supply and mobile integrated market access system) to food security
and livelihoods of households. Given the food security context, different kinds of capital (for
instance natural, physical, social, financial, human capital) will result in different
combinations and outcomes of livelihood strategies. The interview outcome of the fieldwork
will be clustered in order to recognize the diverse kinds of capital needed for the
implementation of the diverse UPS.
Through the SLF (figure 3), the significance of the social capital (social networks) in the
implementation of the UPS will be assessed. Livelihood assessment based on income or food
consumption levels will be assessed to better understand the UPS influence on poverty
reduction. The conceptual framework shows it is imperative to comprehend the well-being
and capabilities of people through different factors like security, power, happiness, exclusion,
weaknesses, self-esteem as well as conventional measured material concern.

37
Figure 3: Conceptual framework for understanding the Sustainable Livelihoods Framework
Source: Adapted from DFID (Department for International Development) 2000
38
3.1 Livelihoods and vulnerability context
The framework shows that improvement of livelihood outcomes is through a combination of
different assets such as; physical, natural, social, human and financial assets. Gaining entry to
these assets is directly influenced by the wider context of employment opportunities and
subsistence support. The small-scale farmers in the food-insecure regions in Dodoma and
Morogoro are those carrying out these interventions. Some of these communities are prone to
droughts, floods making them highly dependent on rainfed agriculture. For these small-scale
farmers to have a positive livelihood outcome, they require access to different assets. These
assets include:
i) Physical capital which is man-made and comprise pocket bags used as kitchen gardens for the
gardening of diverse indigenous vegetables; improved storage bags to store produce and sell
during the off-season; agroforestry tree species to improve wood supply; variety of crop seeds
for the tied ridges; use of mobile phones to make informed decisions and market crops. This
capital helps farmers turn natural resources into finished products.
ii) Natural capital which comprises the natural climate, soil and natural resources (water, land).
The livelihoods of these subsistence farmers highly depends on natural capital for food
production.
iii) Human capital embodies acquisition of new skills (for instance learning how to construct a
tied ridge, how to use improved storage bags, use of pocket bags for growing diverse
vegetables); knowledge (how to market products using m-IMAS); nutritional education (through
trainings and workshops). The decision to adopt an innovation is often influenced by
community-based organizations (Non-Governmental Organizations and extension service
providers) and community members. Given the complex nature of handling innovations, it
requires skills which most rural farmers do not have and technical support from researchers and
service providers.
iv) Financial capital from credit/debt (formal, informal) savings. When farmers are able to
produce more, they are able to feed their families and sell the surplus. The income can also be
derived from non-farm, off-farm, and farm activities. Access to loans and credits is also very
important. Some UPS groups (for example OMOS, IWS) have plans of doing joint projects in
future. In the coming months, each member is expected to do a monthly contribution for these
39
upcoming projects. They have also realized that through group savings they can easily get loans
in times of needs.
v) Social capital which comprises the group structure, social organization of group meetings
(mutual sanctions and rules in the group), knowledge exchange with UPS members for mutual
support. Also, the social capital comprises the institutions which is associated to trust and
networks. This is very much linked to poverty and can enhance identity, a sense of belonging and
recognition. This can be seen as a motivation (more income, enhancing food availability, more
knowledge, better social relations, preventing shocks, more joy etc) for some farmers to take part
in the UPS. Trust is highly needed for proper functioning of a group to ensure sustainability.
3.2 Transforming structures and processes
The assets mentioned above are transformed into favourable livelihood outcomes. They are
influenced through targeted links of the food value chain resulting in reduced vulnerabilities to
food insecurity thus, ensuring sustainably use of natural resources (DFID 1999). Assets are
created through transforming processes and structures (for instance government, civil
organizations and the private sector). These structures provide capital needed for implementing
projects. According to North (1990), institutions play an essential role in reducing uncertainties
by creating steady structures for human collaboration. Institutions are usually of concern when
they are linked to outcomes and household livelihood strategies. For instance: source of income,
providing access to assets, external shocks and reducing vulnerabilities.
The organizations are the official bodies through which these activities are implemented. Social
relations help position households and individuals within a society comprising religion, ethnicity,
age, gender and caste. Institutions, social relations and organizations are vital in determining how
assets are utilized to achieve the livelihood goals and ambitions. When individuals own multiple
assets, it helps strengthen their livelihoods by giving them multiple options to choose from
(Webb et al., 1992). Dissimilar households usually have diverse sources of livelihood assets.
Their livelihoods are usually influenced by balance between these assets, different assets and the
amount of asset. When livelihood objectives are balanced it results in motivations for livelihood
priorities, behaviour, diverse activities carried out by humanitarians and development agencies.
According to Scoones (1998) understanding organizational processes, formal and informal
40
institutions allow barriers and opportunities for development of sustainable livelihoods to be
identified.
3.3 Livelihood strategies and outcomes
The livelihood strategies are usually supported by institutions, policies and processes. When
there are different livelihood strategies (own cultivation, employment), the individual has a
higher resilience to the trends, shocks and seasonality conditions within the vulnerability context.
The use of kitchen gardens helps improve nutrition of a household for better nutrients and
protein intake from diverse vegetables. Vegetables provide a rich supply of iron, calcium,
proteins, phosphorous and vitamins (Nesamvuni et al., 2001) which are highly recommended for
nursing and pregnant mothers. Good sources of iron include; hair lettuce, roselle, spider plant
(Weinberger and Msuya 2004) and excellent sources of provitamin A include; the African
nightshade, moringa and jute mallow (Muchiri 2004). Furthermore, availability of vegetables and
fruits in a kitchen garden increase consumption resulting to lower rates of malnutrition.
Additionally, vegetables and fruit gardening provides aesthetic and therapeutic exercise that
helps relieve stress, enhance local environments, improve food security and nutritional status.
Vegetables grown in pocket bags make use of limited space and inputs. These vegetables provide
yields in a short growth period. When high yields are obtained, the surplus is sold and direct
income is generated making homestead production from kitchen gardens an important source of
additional revenue for rural poor families. Most families depend on gardens for income and food
especially during periods of stress and shocks. For instance when they incur a poor harvest, when
faced with unemployment and high price seasons. This is in line with Mbwana et al. (2016) who
mentioned kitchen gardens to be promising sustainable livelihood and nutritional strategies
provided farmers have the right training on land and water utilization.
Tied ridges can help transform farming communities in dry regions from food insecure to food
secure through increased yields. This claim is supported by Kabanza and Rwehumbiza (2007)
who carried out a study in Tanzania using tied ridges on soil moisture management practices
resulting in increased yields of sorghum from 0.4 tons/ha to 2 tons/ha.
41
Furthermore, rainwater harvesting ensures the harvest of water through rainfall resulting in better
crop production. Similar studies in the western savannahs of Sudan using tied rides showed
runoff from water was reduced under seasonal rainfall compared to runoff from flat planting or
open ridges (Hulugalle 1986).
Improved storage bags help make use of less insecticides or fumigant treatments. For more than
50 years now, manipulations on the atmospheric conditions of stored dried products have been
carried out (Yakubu et al., 2010). Hermitic storage has both environmental and economic
advantages due to the fact that it is relatively cheap, requires less insecticides or fumigant
treatments.
On-farm trees provide farmers with timber, fuelwood or charcoal. They can also be used for
medical purposes, to improve soil fertility for crops and fodder for animals. Agroforestry species
such as Sesbania can help reduce Striga asiatica (L.) Kuntze in colonized fields.
Mobile telephony helps rural farmers negotiate and create better openings by increasing access to
information which helps improve decision making (McNamara 2003). A study by ECONET
(2015) in Zimbabwe showed that farmers insure crops to receive and make payments using
mobile services. This saves time for farmers and reduces the burden of travelling to get advice,
market prices and carryout financial transactions (Nyamba and Mlozi 2012). This also enables
farmers to produce better and get better prices and markets. Furthermore, mobile phones can
provide openings for development tune-ups by empowering rural poor farmers to react
effectively to shocks (Albu and Scott 2001).
All in all, the framework reveals some of the benefits of the UPS (kitchen gardens, tied ridges
and fertilizer micro dosing, improved storage bags, improved wood supply and mobile integrated
market access system) and their contribution to household food security, sustainable use of
resources, increased well-being and less vulnerability thus, improving livelihood outcomes.
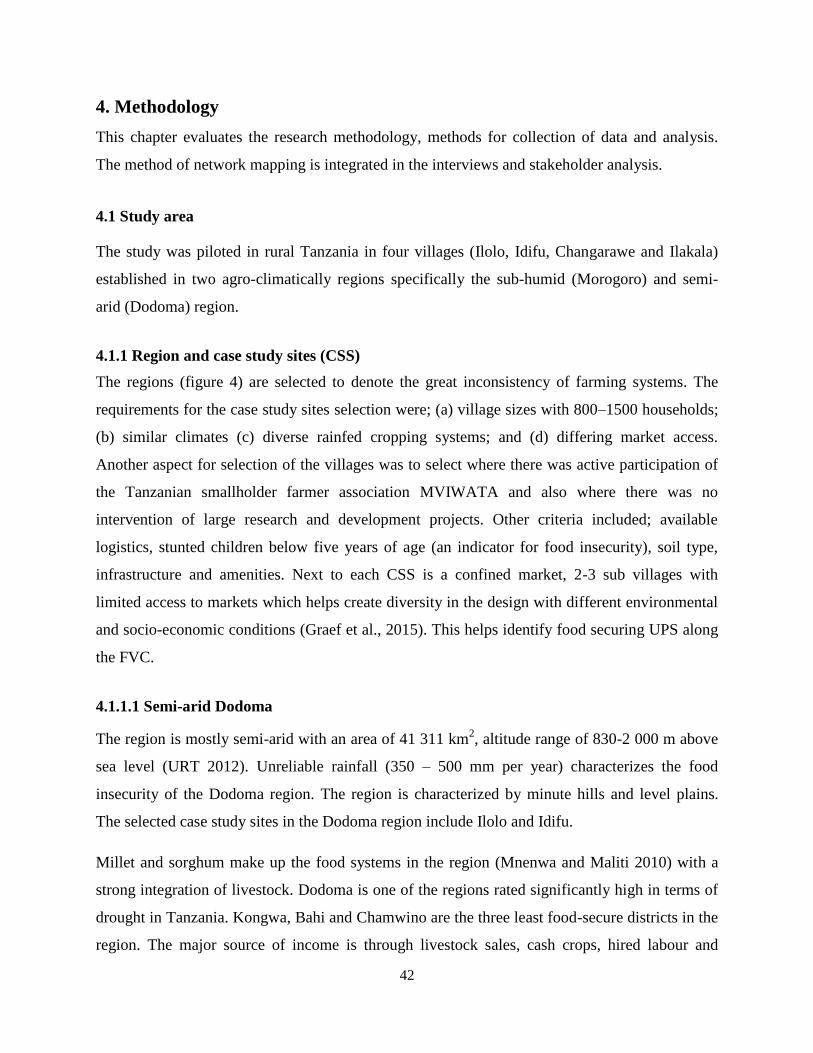
42
4. Methodology
This chapter evaluates the research methodology, methods for collection of data and analysis.
The method of network mapping is integrated in the interviews and stakeholder analysis.
4.1 Study area
The study was piloted in rural Tanzania in four villages (Ilolo, Idifu, Changarawe and Ilakala)
established in two agro-climatically regions specifically the sub-humid (Morogoro) and semi-
arid (Dodoma) region.
4.1.1 Region and case study sites (CSS)
The regions (figure 4) are selected to denote the great inconsistency of farming systems. The
requirements for the case study sites selection were; (a) village sizes with 800–1500 households;
(b) similar climates (c) diverse rainfed cropping systems; and (d) differing market access.
Another aspect for selection of the villages was to select where there was active participation of
the Tanzanian smallholder farmer association MVIWATA and also where there was no
intervention of large research and development projects. Other criteria included; available
logistics, stunted children below five years of age (an indicator for food insecurity), soil type,
infrastructure and amenities. Next to each CSS is a confined market, 2-3 sub villages with
limited access to markets which helps create diversity in the design with different environmental
and socio-economic conditions (Graef et al., 2015). This helps identify food securing UPS along
the FVC.
4.1.1.1 Semi-arid Dodoma
The region is mostly semi-arid with an area of 41 311 km2, altitude range of 830-2 000 m above
sea level (URT 2012). Unreliable rainfall (350 – 500 mm per year) characterizes the food
insecurity of the Dodoma region. The region is characterized by minute hills and level plains.
The selected case study sites in the Dodoma region include Ilolo and Idifu.
Millet and sorghum make up the food systems in the region (Mnenwa and Maliti 2010) with a
strong integration of livestock. Dodoma is one of the regions rated significantly high in terms of
drought in Tanzania. Kongwa, Bahi and Chamwino are the three least food-secure districts in the
region. The major source of income is through livestock sales, cash crops, hired labour and

43
seasonal casual labour. Pests and diseases affecting plants and animals often pose threats to
livelihoods (USAID 2008).
Figure 4: Map of the CSS Morogoro and Dodoma region
Source: Paavola 2008
4.1.1.2 Sub-humid Morogoro
The annual precipitation of the region is 600-800 mm. Highlands, flat plains and alluvial valleys
dominate the geography of the region (Mnenwa and Maliti 2010). The selected case study sites
include Ilakala and Changarawe. Ilakala has six sub villages and Changarawe five.
Food systems in the region is mainly centered on rice, maize, legumes, sorghum, and horticulture
(Mnenwa and Maliti 2010). Farmers are also fairly engaged in livestock (ibid). Areas with
different levels of food insecurity characterize the Morogoro region (Graef et al., 2015).
Agricultural households in the Morogoro region have intensified agriculture with differing
livelihoods. They have also moved to acquire land, employment and markets due to climatic as
well as other stressors.
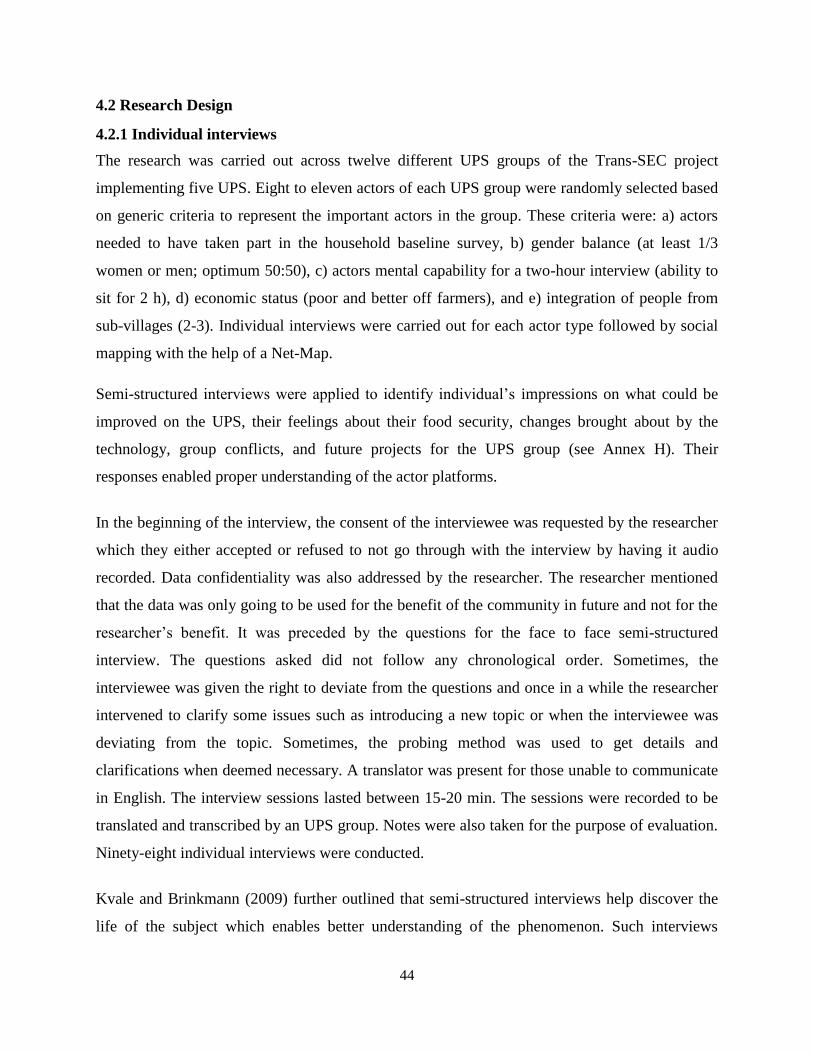
44
4.2 Research Design
4.2.1 Individual interviews
The research was carried out across twelve different UPS groups of the Trans-SEC project
implementing five UPS. Eight to eleven actors of each UPS group were randomly selected based
on generic criteria to represent the important actors in the group. These criteria were: a) actors
needed to have taken part in the household baseline survey, b) gender balance (at least 1/3
women or men; optimum 50:50), c) actors mental capability for a two-hour interview (ability to
sit for 2 h), d) economic status (poor and better off farmers), and e) integration of people from
sub-villages (2-3). Individual interviews were carried out for each actor type followed by social
mapping with the help of a Net-Map.
Semi-structured interviews were applied to identify individual‘s impressions on what could be
improved on the UPS, their feelings about their food security, changes brought about by the
technology, group conflicts, and future projects for the UPS group (see Annex H). Their
responses enabled proper understanding of the actor platforms.
In the beginning of the interview, the consent of the interviewee was requested by the researcher
which they either accepted or refused to not go through with the interview by having it audio
recorded. Data confidentiality was also addressed by the researcher. The researcher mentioned
that the data was only going to be used for the benefit of the community in future and not for the
researcher‘s benefit. It was preceded by the questions for the face to face semi-structured
interview. The questions asked did not follow any chronological order. Sometimes, the
interviewee was given the right to deviate from the questions and once in a while the researcher
intervened to clarify some issues such as introducing a new topic or when the interviewee was
deviating from the topic. Sometimes, the probing method was used to get details and
clarifications when deemed necessary. A translator was present for those unable to communicate
in English. The interview sessions lasted between 15-20 min. The sessions were recorded to be
translated and transcribed by an UPS group. Notes were also taken for the purpose of evaluation.
Ninety-eight individual interviews were conducted.
Kvale and Brinkmann (2009) further outlined that semi-structured interviews help discover the
life of the subject which enables better understanding of the phenomenon. Such interviews
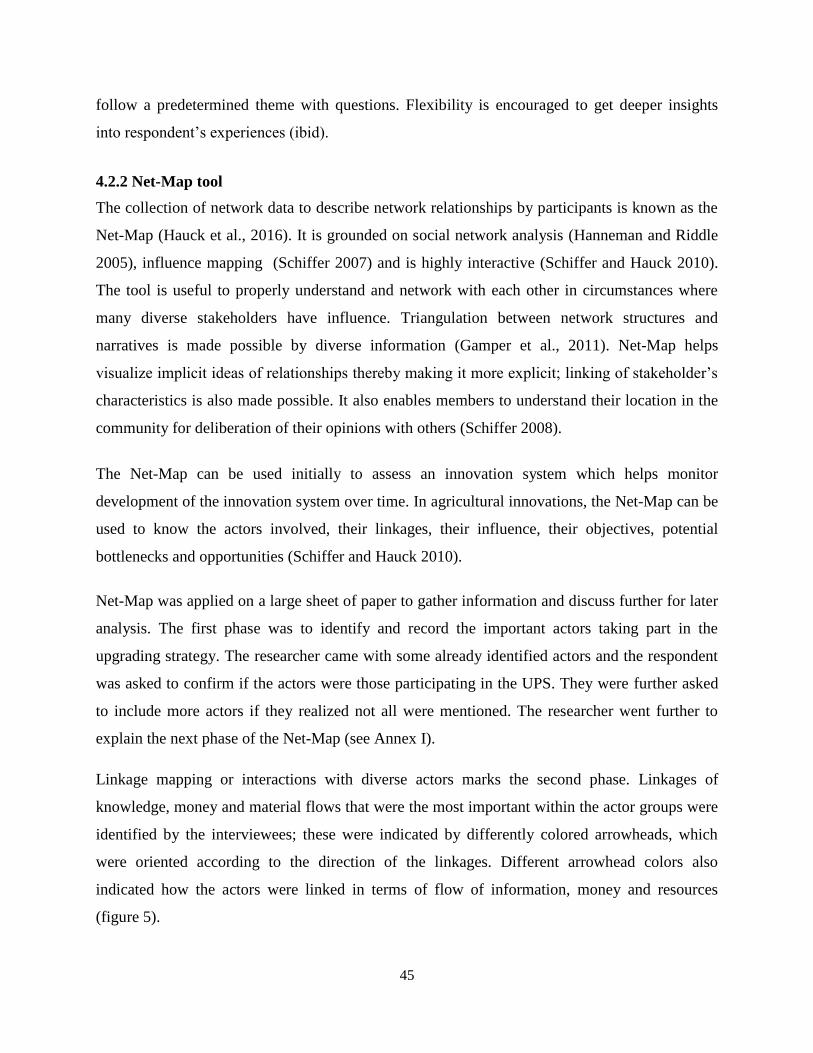
45
follow a predetermined theme with questions. Flexibility is encouraged to get deeper insights
into respondent‘s experiences (ibid).
4.2.2 Net-Map tool
The collection of network data to describe network relationships by participants is known as the
Net-Map (Hauck et al., 2016). It is grounded on social network analysis (Hanneman and Riddle
2005), influence mapping (Schiffer 2007) and is highly interactive (Schiffer and Hauck 2010).
The tool is useful to properly understand and network with each other in circumstances where
many diverse stakeholders have influence. Triangulation between network structures and
narratives is made possible by diverse information (Gamper et al., 2011). Net-Map helps
visualize implicit ideas of relationships thereby making it more explicit; linking of stakeholder‘s
characteristics is also made possible. It also enables members to understand their location in the
community for deliberation of their opinions with others (Schiffer 2008).
The Net-Map can be used initially to assess an innovation system which helps monitor
development of the innovation system over time. In agricultural innovations, the Net-Map can be
used to know the actors involved, their linkages, their influence, their objectives, potential
bottlenecks and opportunities (Schiffer and Hauck 2010).
Net-Map was applied on a large sheet of paper to gather information and discuss further for later
analysis. The first phase was to identify and record the important actors taking part in the
upgrading strategy. The researcher came with some already identified actors and the respondent
was asked to confirm if the actors were those participating in the UPS. They were further asked
to include more actors if they realized not all were mentioned. The researcher went further to
explain the next phase of the Net-Map (see Annex I).
Linkage mapping or interactions with diverse actors marks the second phase. Linkages of
knowledge, money and material flows that were the most important within the actor groups were
identified by the interviewees; these were indicated by differently colored arrowheads, which
were oriented according to the direction of the linkages. Different arrowhead colors also
indicated how the actors were linked in terms of flow of information, money and resources
(figure 5).
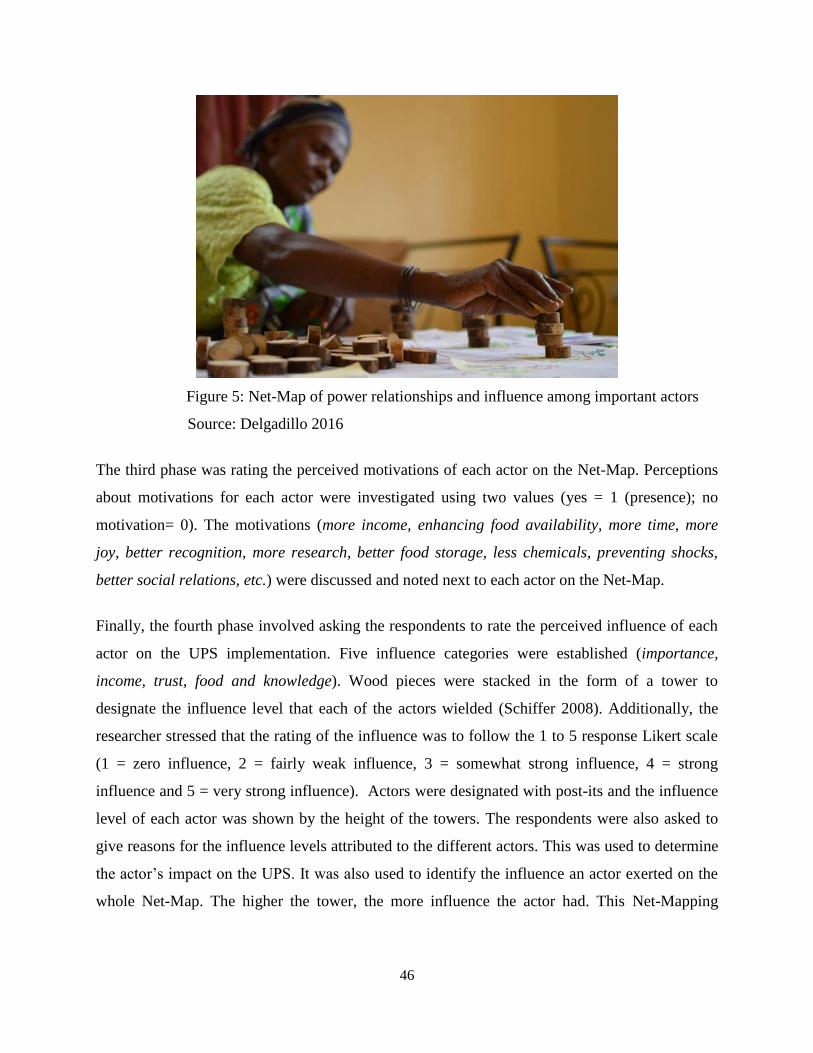
46
Figure 5: Net-Map of power relationships and influence among important actors
Source: Delgadillo 2016
The third phase was rating the perceived motivations of each actor on the Net-Map. Perceptions
about motivations for each actor were investigated using two values (yes = 1 (presence); no
motivation= 0). The motivations (more income, enhancing food availability, more time, more
joy, better recognition, more research, better food storage, less chemicals, preventing shocks,
better social relations, etc.) were discussed and noted next to each actor on the Net-Map.
Finally, the fourth phase involved asking the respondents to rate the perceived influence of each
actor on the UPS implementation. Five influence categories were established (importance,
income, trust, food and knowledge). Wood pieces were stacked in the form of a tower to
designate the influence level that each of the actors wielded (Schiffer 2008). Additionally, the
researcher stressed that the rating of the influence was to follow the 1 to 5 response Likert scale
(1 = zero influence, 2 = fairly weak influence, 3 = somewhat strong influence, 4 = strong
influence and 5 = very strong influence). Actors were designated with post-its and the influence
level of each actor was shown by the height of the towers. The respondents were also asked to
give reasons for the influence levels attributed to the different actors. This was used to determine
the actor‘s impact on the UPS. It was also used to identify the influence an actor exerted on the
whole Net-Map. The higher the tower, the more influence the actor had. This Net-Mapping
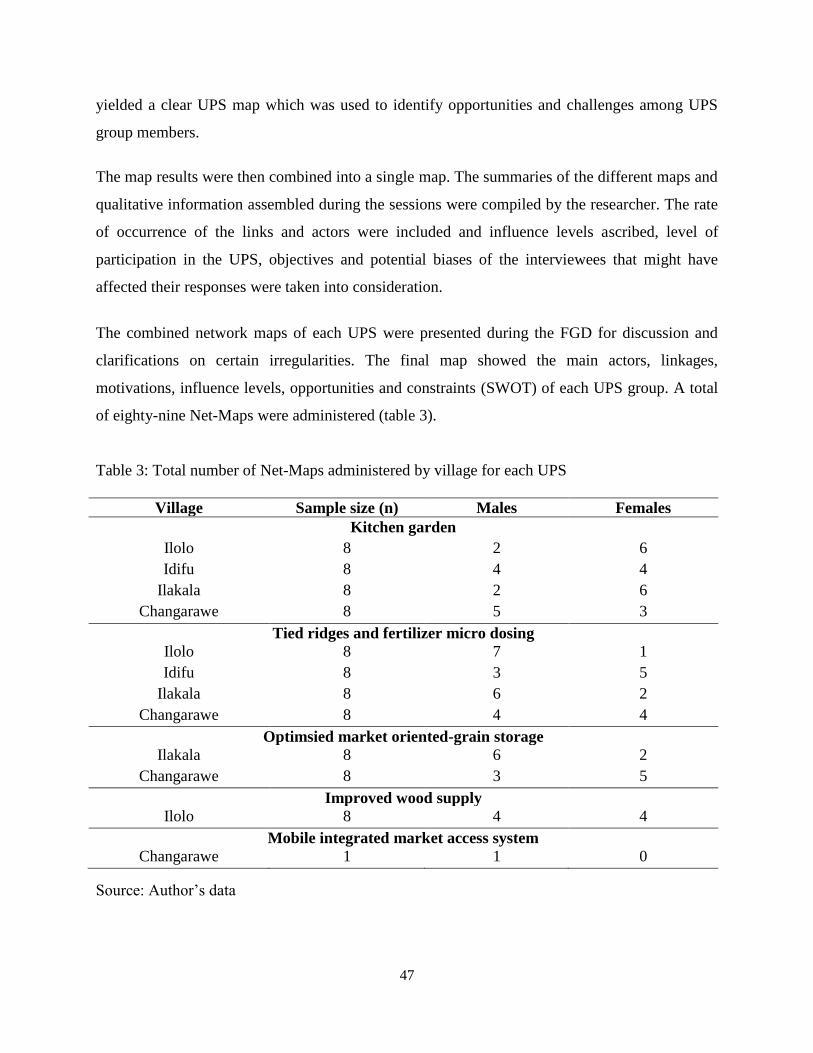
47
yielded a clear UPS map which was used to identify opportunities and challenges among UPS
group members.
The map results were then combined into a single map. The summaries of the different maps and
qualitative information assembled during the sessions were compiled by the researcher. The rate
of occurrence of the links and actors were included and influence levels ascribed, level of
participation in the UPS, objectives and potential biases of the interviewees that might have
affected their responses were taken into consideration.
The combined network maps of each UPS were presented during the FGD for discussion and
clarifications on certain irregularities. The final map showed the main actors, linkages,
motivations, influence levels, opportunities and constraints (SWOT) of each UPS group. A total
of eighty-nine Net-Maps were administered (table 3).
Table 3: Total number of Net-Maps administered by village for each UPS
Village Sample size (n) Males Females
Kitchen garden
Ilolo 8 2 6
Idifu 8 4 4
Ilakala 8 2 6
Changarawe 8 5 3
Tied ridges and fertilizer micro dosing
Ilolo 8 7 1
Idifu 8 3 5
Ilakala 8 6 2
Changarawe 8 4 4
Optimsied market oriented-grain storage
Ilakala 8 6 2
Changarawe 8 3 5
Improved wood supply
Ilolo 8 4 4
Mobile integrated market access system
Changarawe 1 1 0
Source: Author‘s data

48
The Net-Map tool was successfully used by Aberman et al. (2012) to increase understanding of
fertilizer policy in Malawi and Nigeria thereby helping increase impact of agricultural research
policy. Likewise, the tool was used by Magombeyi et al. (2008) to facilitate consultations
between downstream and upstream irrigation water users in South Africa and advance
stakeholder‘s and the public‘s understanding of the catchment.
Similar studies by means of the Net-Map tool in Ethiopia developed indicators and benchmarks
for maize and chicken innovation systems (Spielman and Birner 2008). Whitfield (2006) used
the tool to analyze urban water policy reforms in Birol and Ghana in the analysis of information
flow on groundnut aflatoxin in Mali.
Elsewhere in Ghana, Nigeria and Ethiopia, the approach was used to assess communication
channels regarding avian Influenza (Schiffer et al., 2008). In Northern Ghana, the Net-Map tool
enabled proper understanding of fishery management in small reservoirs (Hauck and Youkhana
2008). It also revealed the intersection of governance systems which was one of the reasons for
poor sustainable management of resources and hence improper implementation of rules.
One of the advantages of using the Net-Map tool is to visualize linkages in stakeholder‘s
characteristics (Shiffer and Hauck 2010). Additionally, Net-Map helps uncover sources of
conflict and possible areas for partnership (Schiffer and Hauck 2010a). Net-Map also allows
possession over the object and absorbs stakeholders in the process (Schiffer 2008).
4.2.3 Focus Group Discussions (FGDs)
These are qualitative research methods involving guided deliberations on particular issues with a
prearranged group of people (Hennink 2013). The FGDs normally consists of participants with
similar levels of understanding on a topic, people with common characteristics which aims at
homogeneity instead of diversity (ibid). The goal of focus group discussion (FGD) is to obtain
wide range of views on a topic and normally last 60-90 min.
In this study, the participants of the individual interviews of each UPS group were called upon to
participate in a FGD. This was to enable free expression of opinions in order to avoid being
suppressed by the more experienced and dominant participants. After each session of the
individual interviews and Net-Maps, the participants were informed on when to come for the
49
FGDs. The sessions took place at district houses, schools, which involved sitting under trees and
mats. The locations were chosen by the field assistant in each village.
Eight to eleven actors of each UPS group were selected to participate. The criteria for selection
were: a) actors needed to have taken part in the household baseline survey, b) gender balance (at
least 1/3 women or men; optimum 50:50), c) actors mental capability for a two-hour FGD
(ability to sit for 2 h), d) economic status (poor and better off), and e) integration of people from
sub-villages (2-3). Bringing these actors together was important to discuss the Net-Map of each
UPS group in order to obtain more information on interaction within the UPS group, their
perceptions on the use of the UPS and also to detect the major opportunities and constraints
actors face in their collaboration and implementation of the different UPS (see Annex H). At the
same time, first research results were fed back to the participants. This gave them opportunity to
discuss the results and reach a common understanding about the functioning of the UPS and the
changes for daily life that they brought. This helped clarify issues raised by participants.
In the beginning of every focus group assembly, the respondents were enquired about their
willingness to participate, and the confidentially of the information collected was assured (see
Annex H). The sessions ranged from 90 min to 2 h and were grounded on how resourceful the
participants were in the sessions. The sessions were done in Swahili since it was the language of
the participants. There was a translator available for each session and each session was recorded
and later transcribed in English by an UPS group.
Some photographs were taken after each session of the FGDs with consent of participants. The
FGDs (figures 6) were conducted in four UPS (TR-FMD, KG, OMOS and IWS) between April
and June 2016. I was unable to conduct a FGD with m-IMAS UPS due to the fact that only one
actor was available. In total, a hundred and one UPS members participated in the FGDs (table 4)
from four villages.
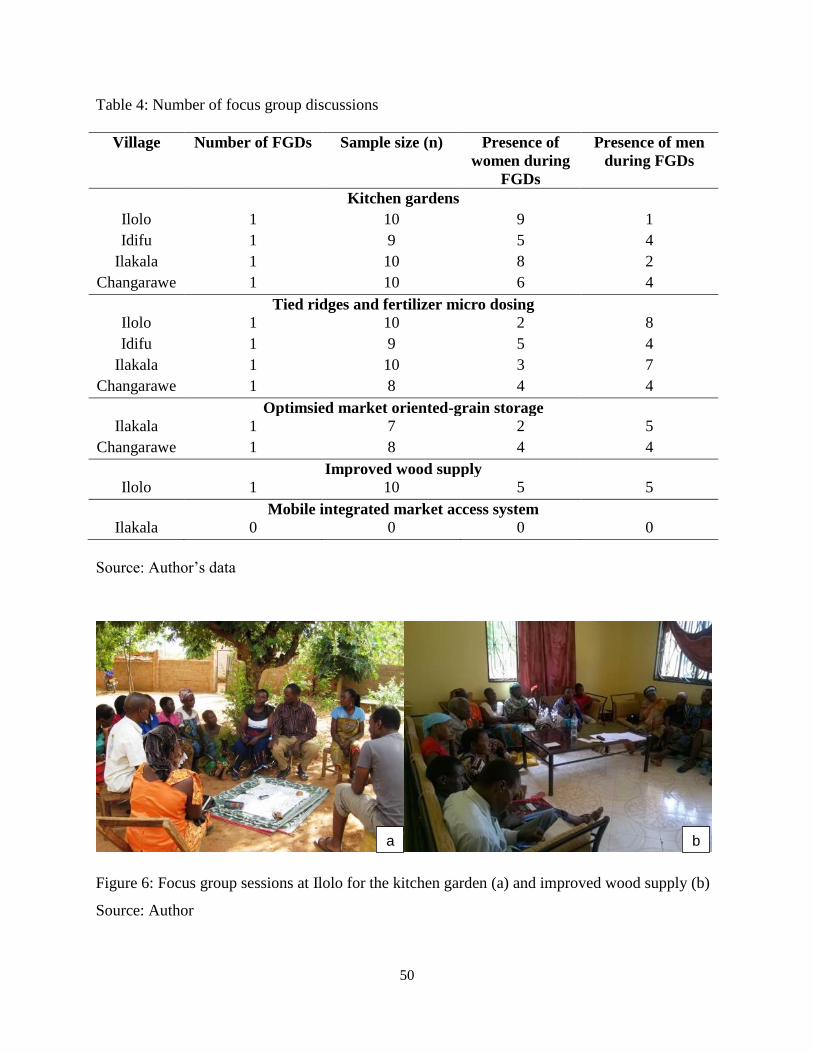
50
Table 4: Number of focus group discussions
Village Number of FGDs Sample size (n) Presence of
women during
FGDs
Presence of men
during FGDs
Kitchen gardens
Ilolo 1 10 9 1
Idifu 1 9 5 4
Ilakala 1 10 8 2
Changarawe 1 10 6 4
Tied ridges and fertilizer micro dosing
Ilolo 1 10 2 8
Idifu 1 9 5 4
Ilakala 1 10 3 7
Changarawe 1 8 4 4
Optimsied market oriented-grain storage
Ilakala 1 7 2 5
Changarawe 1 8 4 4
Improved wood supply
Ilolo 1 10 5 5
Mobile integrated market access system
Ilakala 0 0 0 0
Source: Author‘s data
Figure 6: Focus group sessions at Ilolo for the kitchen garden (a) and improved wood supply (b)
Source: Author
a b
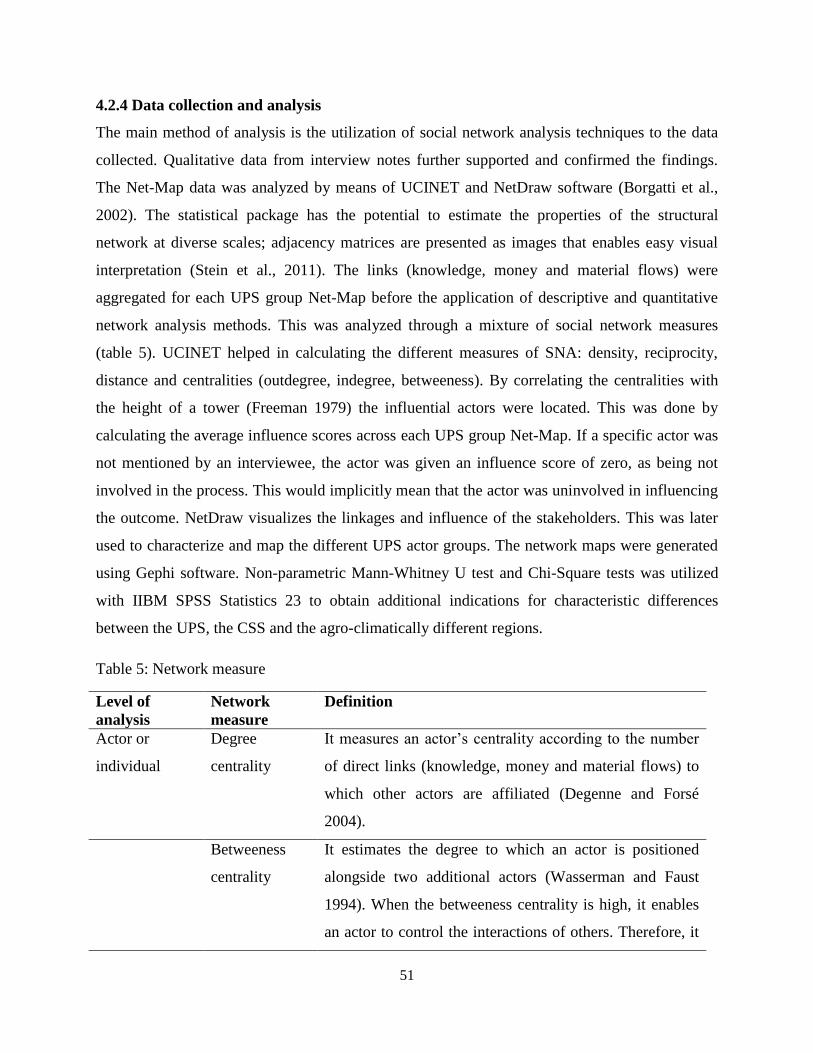
51
4.2.4 Data collection and analysis
The main method of analysis is the utilization of social network analysis techniques to the data
collected. Qualitative data from interview notes further supported and confirmed the findings.
The Net-Map data was analyzed by means of UCINET and NetDraw software (Borgatti et al.,
2002). The statistical package has the potential to estimate the properties of the structural
network at diverse scales; adjacency matrices are presented as images that enables easy visual
interpretation (Stein et al., 2011). The links (knowledge, money and material flows) were
aggregated for each UPS group Net-Map before the application of descriptive and quantitative
network analysis methods. This was analyzed through a mixture of social network measures
(table 5). UCINET helped in calculating the different measures of SNA: density, reciprocity,
distance and centralities (outdegree, indegree, betweeness). By correlating the centralities with
the height of a tower (Freeman 1979) the influential actors were located. This was done by
calculating the average influence scores across each UPS group Net-Map. If a specific actor was
not mentioned by an interviewee, the actor was given an influence score of zero, as being not
involved in the process. This would implicitly mean that the actor was uninvolved in influencing
the outcome. NetDraw visualizes the linkages and influence of the stakeholders. This was later
used to characterize and map the different UPS actor groups. The network maps were generated
using Gephi software. Non-parametric Mann-Whitney U test and Chi-Square tests was utilized
with IIBM SPSS Statistics 23 to obtain additional indications for characteristic differences
between the UPS, the CSS and the agro-climatically different regions.
Table 5: Network measure
Level of
analysis
Network
measure
Definition
Actor or
individual
Degree
centrality
It measures an actor‘s centrality according to the number
of direct links (knowledge, money and material flows) to
which other actors are affiliated (Degenne and Forsé
2004).
Betweeness
centrality
It estimates the degree to which an actor is positioned
alongside two additional actors (Wasserman and Faust
1994). When the betweeness centrality is high, it enables
an actor to control the interactions of others. Therefore, it
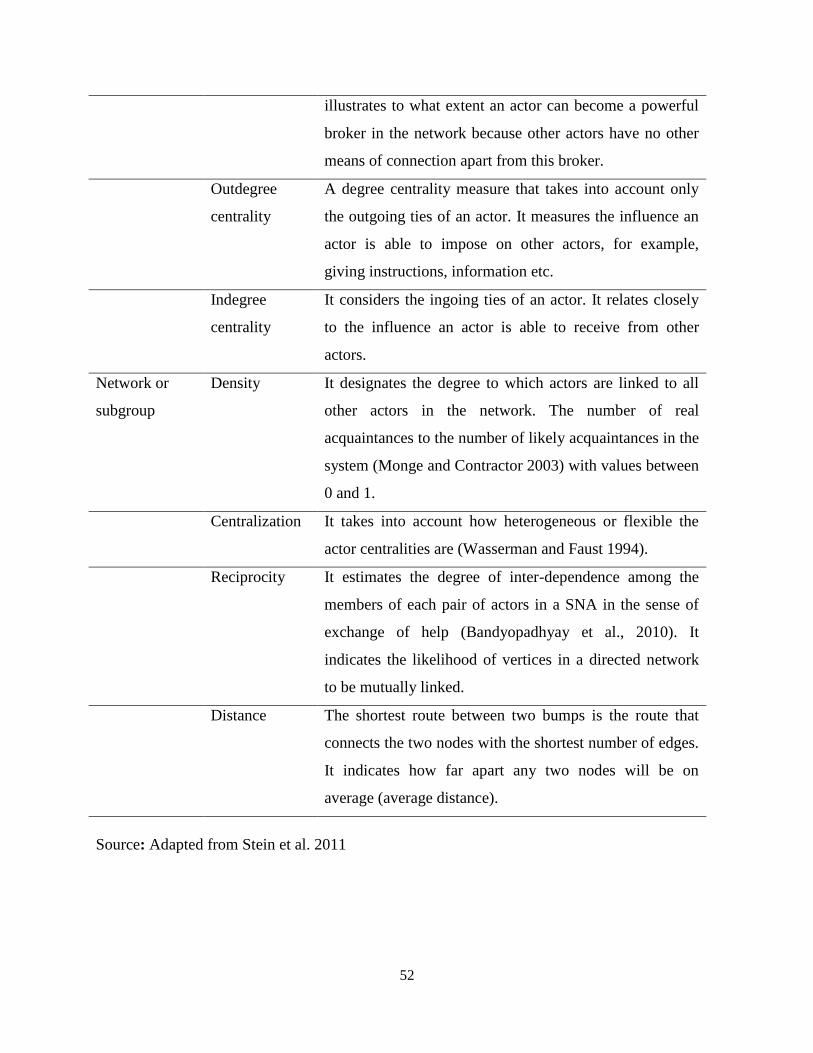
52
illustrates to what extent an actor can become a powerful
broker in the network because other actors have no other
means of connection apart from this broker.
Outdegree
centrality
A degree centrality measure that takes into account only
the outgoing ties of an actor. It measures the influence an
actor is able to impose on other actors, for example,
giving instructions, information etc.
Indegree
centrality
It considers the ingoing ties of an actor. It relates closely
to the influence an actor is able to receive from other
actors.
Network or
subgroup
Density It designates the degree to which actors are linked to all
other actors in the network. The number of real
acquaintances to the number of likely acquaintances in the
system (Monge and Contractor 2003) with values between
0 and 1.
Centralization It takes into account how heterogeneous or flexible the
actor centralities are (Wasserman and Faust 1994).
Reciprocity It estimates the degree of inter-dependence among the
members of each pair of actors in a SNA in the sense of
exchange of help (Bandyopadhyay et al., 2010). It
indicates the likelihood of vertices in a directed network
to be mutually linked.
Distance The shortest route between two bumps is the route that
connects the two nodes with the shortest number of edges.
It indicates how far apart any two nodes will be on
average (average distance).
Source: Adapted from Stein et al. 2011
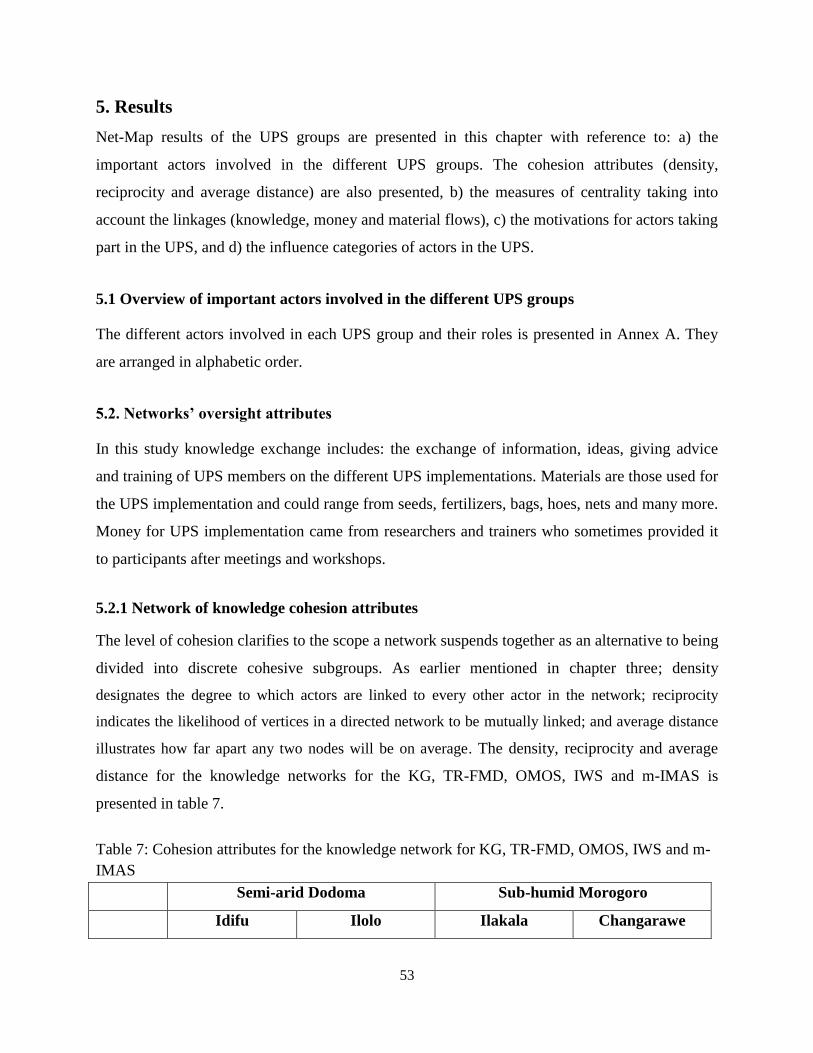
53
5. Results
Net-Map results of the UPS groups are presented in this chapter with reference to: a) the
important actors involved in the different UPS groups. The cohesion attributes (density,
reciprocity and average distance) are also presented, b) the measures of centrality taking into
account the linkages (knowledge, money and material flows), c) the motivations for actors taking
part in the UPS, and d) the influence categories of actors in the UPS.
5.1 Overview of important actors involved in the different UPS groups
The different actors involved in each UPS group and their roles is presented in Annex A. They
are arranged in alphabetic order.
5.2. Networks’ oversight attributes
In this study knowledge exchange includes: the exchange of information, ideas, giving advice
and training of UPS members on the different UPS implementations. Materials are those used for
the UPS implementation and could range from seeds, fertilizers, bags, hoes, nets and many more.
Money for UPS implementation came from researchers and trainers who sometimes provided it
to participants after meetings and workshops.
5.2.1 Network of knowledge cohesion attributes
The level of cohesion clarifies to the scope a network suspends together as an alternative to being
divided into discrete cohesive subgroups. As earlier mentioned in chapter three; density
designates the degree to which actors are linked to every other actor in the network; reciprocity
indicates the likelihood of vertices in a directed network to be mutually linked; and average distance
illustrates how far apart any two nodes will be on average. The density, reciprocity and average
distance for the knowledge networks for the KG, TR-FMD, OMOS, IWS and m-IMAS is
presented in table 7.
Table 7: Cohesion attributes for the knowledge network for KG, TR-FMD, OMOS, IWS and m-
IMAS
Semi-arid Dodoma Sub-humid Morogoro
Idifu Ilolo Ilakala Changarawe
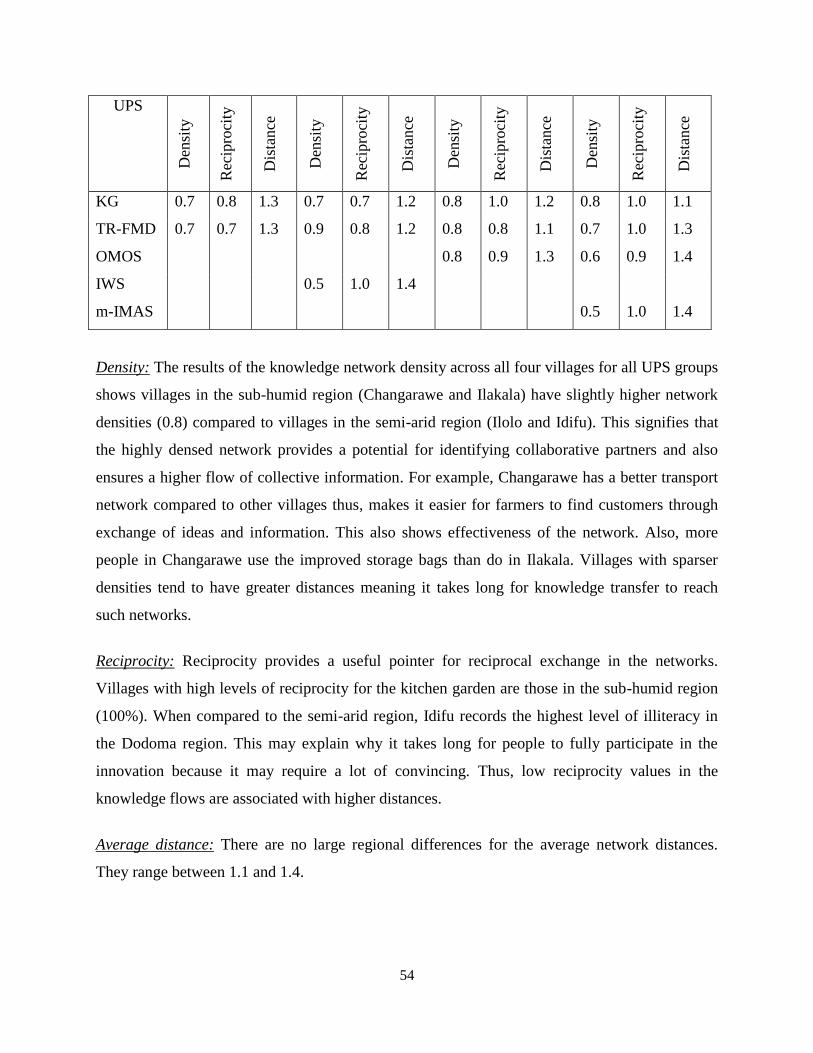
54
UPS
Den
sity
Rec
ipro
city
Dis
tance
Den
sity
Rec
ipro
city
Dis
tance
Den
sity
Rec
ipro
city
Dis
tance
Den
sity
Rec
ipro
city
Dis
tance
KG 0.7 0.8 1.3 0.7 0.7 1.2 0.8 1.0 1.2 0.8 1.0 1.1
TR-FMD 0.7 0.7 1.3 0.9 0.8 1.2 0.8 0.8 1.1 0.7 1.0 1.3
OMOS 0.8 0.9 1.3 0.6 0.9 1.4
IWS 0.5 1.0 1.4
m-IMAS 0.5 1.0 1.4
Density: The results of the knowledge network density across all four villages for all UPS groups
shows villages in the sub-humid region (Changarawe and Ilakala) have slightly higher network
densities (0.8) compared to villages in the semi-arid region (Ilolo and Idifu). This signifies that
the highly densed network provides a potential for identifying collaborative partners and also
ensures a higher flow of collective information. For example, Changarawe has a better transport
network compared to other villages thus, makes it easier for farmers to find customers through
exchange of ideas and information. This also shows effectiveness of the network. Also, more
people in Changarawe use the improved storage bags than do in Ilakala. Villages with sparser
densities tend to have greater distances meaning it takes long for knowledge transfer to reach
such networks.
Reciprocity: Reciprocity provides a useful pointer for reciprocal exchange in the networks.
Villages with high levels of reciprocity for the kitchen garden are those in the sub-humid region
(100%). When compared to the semi-arid region, Idifu records the highest level of illiteracy in
the Dodoma region. This may explain why it takes long for people to fully participate in the
innovation because it may require a lot of convincing. Thus, low reciprocity values in the
knowledge flows are associated with higher distances.
Average distance: There are no large regional differences for the average network distances.
They range between 1.1 and 1.4.
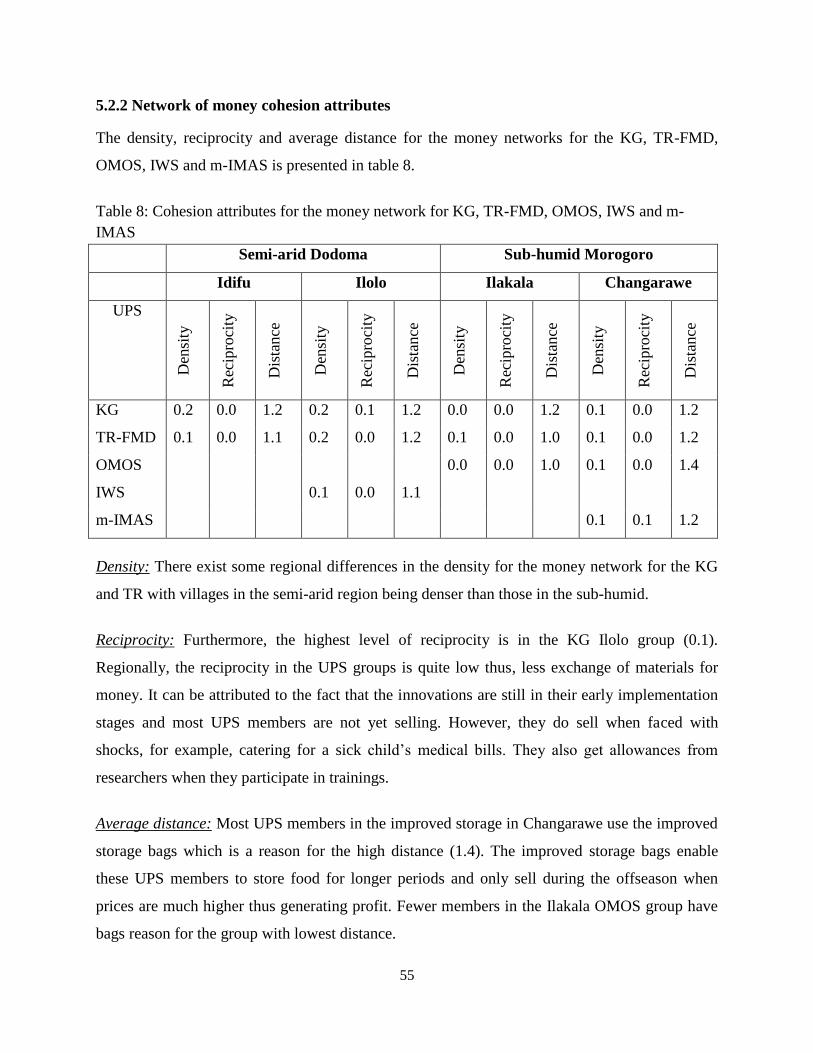
55
5.2.2 Network of money cohesion attributes
The density, reciprocity and average distance for the money networks for the KG, TR-FMD,
OMOS, IWS and m-IMAS is presented in table 8.
Table 8: Cohesion attributes for the money network for KG, TR-FMD, OMOS, IWS and m-
IMAS
Semi-arid Dodoma Sub-humid Morogoro
Idifu Ilolo Ilakala Changarawe
UPS
Den
sity
Rec
ipro
city
Dis
tance
Den
sity
Rec
ipro
city
Dis
tance
Den
sity
Rec
ipro
city
Dis
tance
Den
sity
Rec
ipro
city
Dis
tance
KG 0.2 0.0 1.2 0.2 0.1 1.2 0.0 0.0 1.2 0.1 0.0 1.2
TR-FMD 0.1 0.0 1.1 0.2 0.0 1.2 0.1 0.0 1.0 0.1 0.0 1.2
OMOS 0.0 0.0 1.0 0.1 0.0 1.4
IWS 0.1 0.0 1.1
m-IMAS 0.1 0.1 1.2
Density: There exist some regional differences in the density for the money network for the KG
and TR with villages in the semi-arid region being denser than those in the sub-humid.
Reciprocity: Furthermore, the highest level of reciprocity is in the KG Ilolo group (0.1).
Regionally, the reciprocity in the UPS groups is quite low thus, less exchange of materials for
money. It can be attributed to the fact that the innovations are still in their early implementation
stages and most UPS members are not yet selling. However, they do sell when faced with
shocks, for example, catering for a sick child‘s medical bills. They also get allowances from
researchers when they participate in trainings.
Average distance: Most UPS members in the improved storage in Changarawe use the improved
storage bags which is a reason for the high distance (1.4). The improved storage bags enable
these UPS members to store food for longer periods and only sell during the offseason when
prices are much higher thus generating profit. Fewer members in the Ilakala OMOS group have
bags reason for the group with lowest distance.
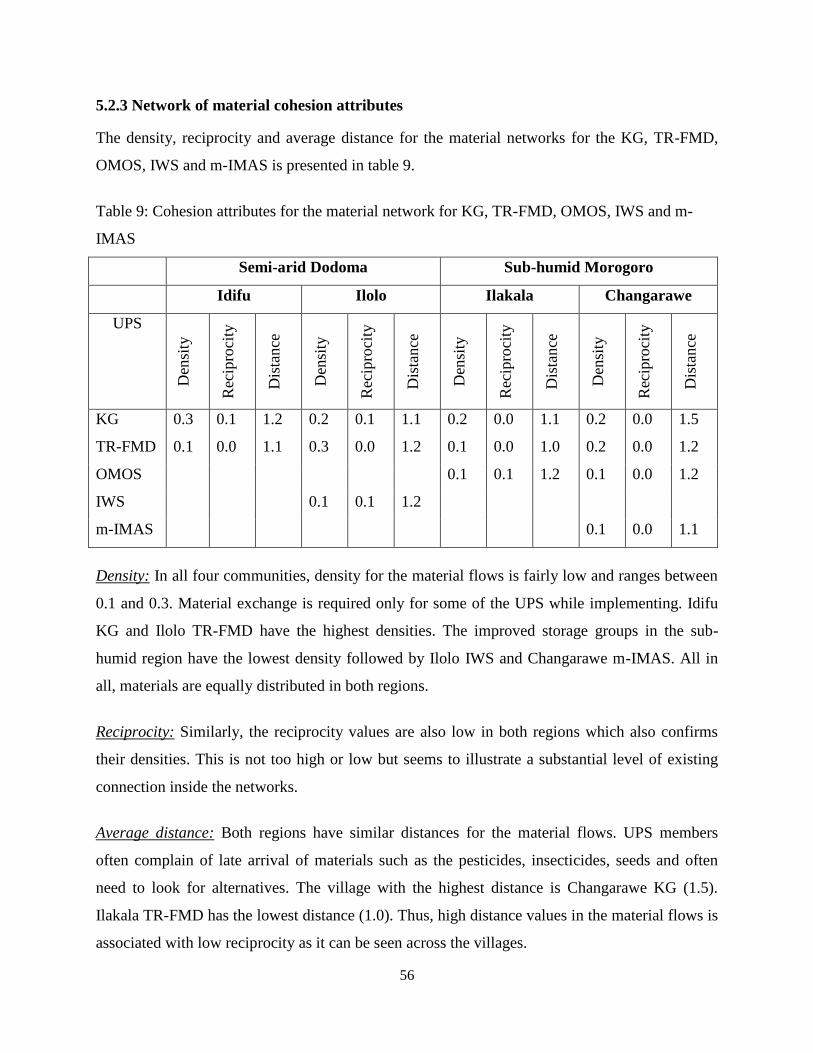
56
5.2.3 Network of material cohesion attributes
The density, reciprocity and average distance for the material networks for the KG, TR-FMD,
OMOS, IWS and m-IMAS is presented in table 9.
Table 9: Cohesion attributes for the material network for KG, TR-FMD, OMOS, IWS and m-
IMAS
Semi-arid Dodoma Sub-humid Morogoro
Idifu Ilolo Ilakala Changarawe
UPS
Den
sity
Rec
ipro
city
Dis
tance
Den
sity
Rec
ipro
city
Dis
tance
Den
sity
Rec
ipro
city
Dis
tance
Den
sity
Rec
ipro
city
Dis
tance
KG 0.3 0.1 1.2 0.2 0.1 1.1 0.2 0.0 1.1 0.2 0.0 1.5
TR-FMD 0.1 0.0 1.1 0.3 0.0 1.2 0.1 0.0 1.0 0.2 0.0 1.2
OMOS 0.1 0.1 1.2 0.1 0.0 1.2
IWS 0.1 0.1 1.2
m-IMAS 0.1 0.0 1.1
Density: In all four communities, density for the material flows is fairly low and ranges between
0.1 and 0.3. Material exchange is required only for some of the UPS while implementing. Idifu
KG and Ilolo TR-FMD have the highest densities. The improved storage groups in the sub-
humid region have the lowest density followed by Ilolo IWS and Changarawe m-IMAS. All in
all, materials are equally distributed in both regions.
Reciprocity: Similarly, the reciprocity values are also low in both regions which also confirms
their densities. This is not too high or low but seems to illustrate a substantial level of existing
connection inside the networks.
Average distance: Both regions have similar distances for the material flows. UPS members
often complain of late arrival of materials such as the pesticides, insecticides, seeds and often
need to look for alternatives. The village with the highest distance is Changarawe KG (1.5).
Ilakala TR-FMD has the lowest distance (1.0). Thus, high distance values in the material flows is
associated with low reciprocity as it can be seen across the villages.

57
5.3. Networks centrality measures
Freeman (1979) reported that betweeness and degree centrality measures can be used to locate
powerful actors in a network. Actors that have lots of ties with other actors can be identified
using degree centrality while betweeness centrality identifies actors that link between others,
thus, possibly providing a gatekeeping function in the network connecting separated segments of
the network. The centrality calculation of most actors is reinforced by the theory that some UPS
members have a gate keeping or a brokerage role. Tables 10, 11 and Annex B shows all UPS
networks‘ with the most important actors per UPS network (2 tables: knowledge, money) (1
table for material Annex).
Only one actor for the mobile integrated market access system (m-IMAS) UPS group was
interviewed. Also, only one Net-Map was drawn for this UPS group. As such, results (for m-
IMAS) for the network centrality measures, motivations for actors taking part in the UPS and
influence categories of actors is excluded from the rest of this thesis.
5.3.1 Network of knowledge
The centrality measures of the knowledge networks for the UPS groups (KG, TR-FMD, OMOS
and IWS) is presented in table 10.
Table 10: Centrality measures (indegree, outdegree and betweeness) of the knowledge networks
for the KG, TR-FMD, OMOS and IWS across two regions.
Sub-humid Morogoro Semi-arid Dodoma
Ilakala Changarawe Ilolo Idifu
Actor
Indeg
ree
Outd
egre
e
Bet
wee
nes
s
Indeg
ree
Outd
egre
e
Bet
wee
nes
s
Indeg
ree
Outd
egre
e
Bet
wee
nes
s
Indeg
ree
Outd
egre
e
Bet
wee
nes
s
Kitchen garden (KG)
KG keepers 35 33 0.6 42 42 0 41 37 0 45 40 0
Group leader 30 29 0.6 42 42 0 36 40 0 38 38 0
Secretary 28 26 0.6 38 38 0 39 36 0 30 28 0
Treasurer 25 22 0.6 36 36 0 30 32 0 33 30 0
Field assistant 22 24 0.6 40 39 0 35 39 0 28 31 0
Research. & trainers 25 27 0.2 36 37 0 32 32 0 30 37 0

58
Customers 7 9 0 19 19 0 28 25 0 21 21 0
Tied ridges and fertilizer micro dosing (TR-FMD)
Small farmers 45 39 1.5 43 43 5.4 33 30 0.5 45 34 0
Group leader 42 36 0.2 38 39 2.2 32 29 0.5 38 35 0
Secretary 40 38 0.1 35 37 2.1 28 28 0.5 32 31 0
Treasurer 39 38 0.2 27 27 1 - - - 25 25 0
Field assistant 37 38 0.2 36 37 3 31 29 0.5 29 32 0
Research. & trainers 41 38 1.5 34 35 2.2 22 30 0 26 36 0
Labourers 15 22 1.3 5 5 0
Customers 3 13 0 9 6 0 5 5 0
Optimized market-oriented grain storage (OMOS)
Bag users 45 46 1.3 43 48 0.6
Group leader 42 42 0.3 40 40 0
Secretary 40 41 1.3 35 36 0.6
Treasurer 36 38 0.3 30 29 0.6
Field assistant 42 43 0.3 44 41 0.6
Research. & trainers 37 38 1 45 44 0.6
Customers 19 20 0.3 30 29 0.1
Traders 13 11 0.6
Improved wood supply (IWS)
Nursery keepers 43 43 4.3
Group Leader 37 39 0.8
Secretary 42 34 0.8
Treasurer 25 28 0.8
Field assistant 18 20 0
Research. & trainers 35 37 4.3
Customers 32 30 0
Government officer 21 24 0
Tap water owners 7 2 0
All UPS members stated exchange of ideas, advice, information sharing with the field assistant,
researchers and trainers (Table 10). There was also flow of information between the UPS
members. This explains the high betweeness score of the UPS members, field assistant,
researchers and trainers. The UPS members detailed that they think everyone counsels each

59
other. The small lead of the field assistant in terms of betweeness comes from the links that exist
between him, researchers and trainers. In both regions betweeness is quite low and ranged
between 0 and 5.4. Furthermore, no actor controls the knowledge flow for the Idifu TR-FMD and
Changarawe KG thus, there is zero betweeness in the groups.
Kitchen garden UPS: In both regions of the kitchen garden, the field assistant, kitchen garden
keepers and their executives have high indegrees showing their willingness to learn thus, a good
indication for the group‘s sustainability. Knowledge received from trainers and researchers
include; setting up the kitchen garden pocket bags, how to irrigate the pocket bags, nutritional
education for households. A kitchen garden keeper in Ilolo mentioned: „We were trained to
irrigate the kitchen garden bags by using the 10 l bucket twice a week, we did that and found out
that here in Dodoma region the sun was too sunny and the vegetables weren’t growing well so
we decided to improve the method of irrigation. So we switched to using a 20 l bucket 3 times a
week. For those who modified it their vegetables were growing up well, and for those who stuck
with the old rule their vegetables were not doing well. These are some of the improvements we
have done in addition to what we were taught”.
Tied ridges and fertilizer micro dosing UPS: In the sub-humid region there is water available
throughout prolonged periods of the year compared to the semi-arid region in which there is
higher water scarcity. Hence, the UPS (TR-FMD) appears more efficient in the sub-humid region
compared to the semi-arid region. Small farmers are highly engaged in the tied ridges in all four
villages‘ reason for the high indegrees thus, they have a high influence on promoting diffusion
and development of knowledge in their communities. Labourers are not important actors in Idifu
and Ilolo for the implementation of tied ridges a reason being the small farmers themselves are
the labourers and do not hire expensive labour for the tied ridges except in Changarawe and
Ilakala. Tied ridges construction is a difficult task. Also, small farmers complained about the
narrowness of the soil beds as these beds are easily washed away by heavy rains. Furthermore,
customers are not really important at this early stage of the tied ridges since the small farmers are
not yet selling their produce from the field thus, low indegrees. A farmer in Changarawe stated
that: „Customers don’t attend training meetings”. Small farmers in the TR are not really
dependent on the researchers and trainers for knowledge as they can hire labour and teach

60
labourers how to construct the ridges reason for the high betweeness thus a good outlook for the
group.
Improved grain storage UPS: UPS members give feedback to researchers and trainers especially
on the progress of their groups which enables researchers and trainers know if the innovations
are working or not. Traders involved in the improved storage have the lowest indegree for
knowledge because they are only involved in the retail of the improved storage bags.
Improved wood supply UPS: Traders and tap water owners give out very little information
regarding the improved wood supply implementation reason for the low outdegrees. The nursery
keepers grow trees like Gliricidia sepium, Melea azedirachta, mikongo, niholo for fuelwood
supply and soil fertility reason for the high indegrees. They are also interested in
entrepreneurship opportunities which is a gateway to generate more income from the marketing
of trees.
5.3.2 Network of money
The treasurer receives money from UPS members for memberships and registration of the group.
He is also in charge of keeping records on inputs. The network of money flows (table 11) seems
less dense than the network of knowledge exchange (table 10). It can also be observed that
researchers and trainers are mentioned in most UPS groups as having the highest outdegrees.
Table 11: Centrality measures (indegree, outdegree and betweeness) of the money networks for
the KG, TR-FMD, OMOS and IWS across two regions.
Sub-humid Morogoro Semi-arid Dodoma
Ilakala Changarawe Ilolo Idifu
Actor
Indeg
ree
Outd
egre
e
Bet
wee
nes
s
Indeg
ree
Outd
egre
e
Bet
wee
nes
s
Indeg
ree
Outd
egre
e
Bet
wee
nes
s
Indeg
ree
Outd
egre
e
Bet
wee
nes
s
Kitchen garden (KG)
KG keepers 1 1 5 3 6 1 19 9 9 10 6 5
Group leader 1 1 5 5 4 1 15 4 5 11 5 0
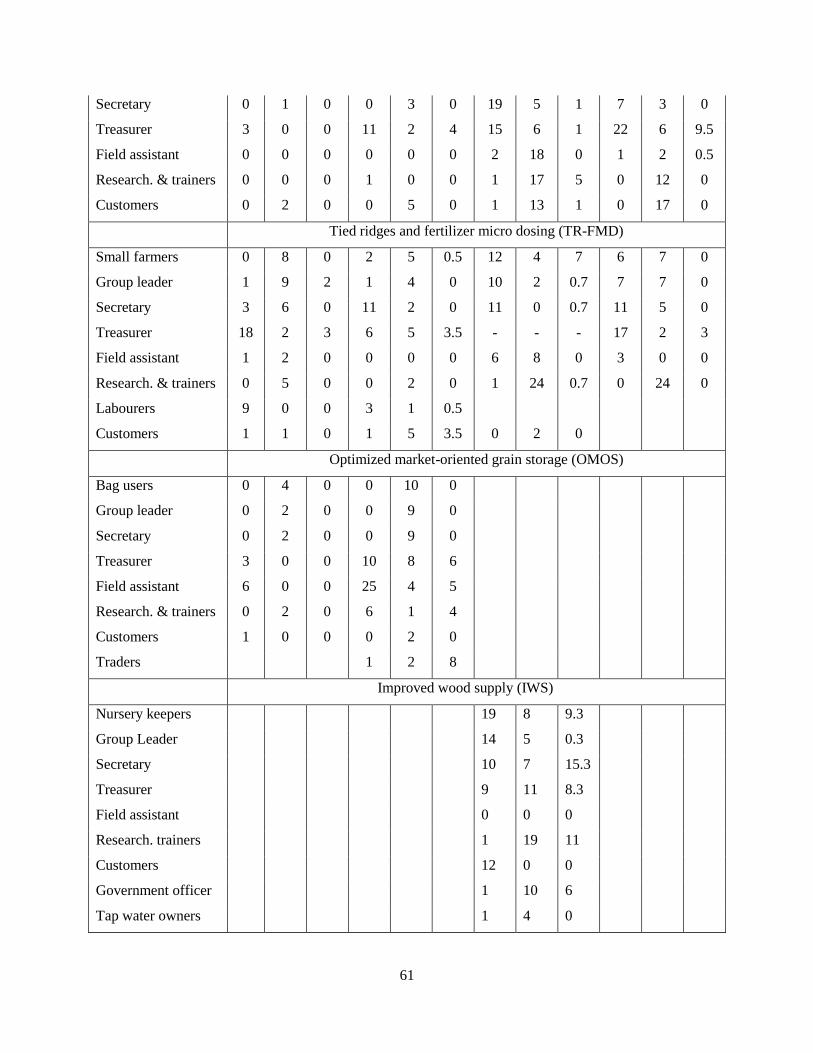
61
Secretary 0 1 0 0 3 0 19 5 1 7 3 0
Treasurer 3 0 0 11 2 4 15 6 1 22 6 9.5
Field assistant 0 0 0 0 0 0 2 18 0 1 2 0.5
Research. & trainers 0 0 0 1 0 0 1 17 5 0 12 0
Customers 0 2 0 0 5 0 1 13 1 0 17 0
Tied ridges and fertilizer micro dosing (TR-FMD)
Small farmers 0 8 0 2 5 0.5 12 4 7 6 7 0
Group leader 1 9 2 1 4 0 10 2 0.7 7 7 0
Secretary 3 6 0 11 2 0 11 0 0.7 11 5 0
Treasurer 18 2 3 6 5 3.5 - - - 17 2 3
Field assistant 1 2 0 0 0 0 6 8 0 3 0 0
Research. & trainers 0 5 0 0 2 0 1 24 0.7 0 24 0
Labourers 9 0 0 3 1 0.5
Customers 1 1 0 1 5 3.5 0 2 0
Optimized market-oriented grain storage (OMOS)
Bag users 0 4 0 0 10 0
Group leader 0 2 0 0 9 0
Secretary 0 2 0 0 9 0
Treasurer 3 0 0 10 8 6
Field assistant 6 0 0 25 4 5
Research. & trainers 0 2 0 6 1 4
Customers 1 0 0 0 2 0
Traders 1 2 8
Improved wood supply (IWS)
Nursery keepers 19 8 9.3
Group Leader 14 5 0.3
Secretary 10 7 15.3
Treasurer 9 11 8.3
Field assistant 0 0 0
Research. trainers 1 19 11
Customers 12 0 0
Government officer 1 10 6
Tap water owners 1 4 0
62
Kitchen garden UPS: When looking at the actors in the KG and IWS with the highest degree
centrality, all actors are perceived to have high influence. The field assistant, researchers and
trainers are perceived to have high influence, but are not in the top of degree centralities. In the
semi-arid region customers perform a major function in the UPS. The customers, field assistant,
researchers and trainers have the highest outdegree centrality in the semi-arid region for the KG
and TR-FMD.
Tied ridges and fertilizer micro dosing UPS: Comparing the results of the indegree centrality in
the semi-arid region, it can be noticed that the small farmers, treasurer and secretary are at the
top of the indegree centrality in contrast to the sub-humid region. The money collected from
small farmers is used for group membership and registration. There is no treasurer in the TR in
Ilolo thus, the secretary performs both functions. In the TR, some UPS members hire labour and
pay for this service whereas in the OMOS group UPS member pay for the purchase of the
improved storage bags reason for the high outdegree.
Improved grain storage UPS: The field assistant has the highest indegree followed by the
treasurer reason being that in the absence of researchers and trainers the field assistant receives
allowances for group meetings and trainings. He also receives money from UPS members to buy
the improved storage bags. Furthermore, the field assistant also receives money for the fueling of
his motor bike which he uses to visit farmers‘ fields. Sometimes he also picks up UPS members
and bring them to trainings and workshops when they are running late. For the UPS members
selling their produce, they receive money from customers and clients. No actor has authority
over the money flows in the OMOS group in Ilakala thus, zero betweeness. Traders receive
money when improved storage bags are bought reason for the high betweeness.
Improved wood supply UPS: The nursery keeper‘s usually get money when seedlings are bought
from the nursery. The field assistant also pays for water which they use in irrigating the seedlings
in the nursery. The field assistant explained that under the Trans-SEC project it is quite common
to provide snacks and drinks to participants. Funds for refreshments is always provided to UPS
members after participating in trainings and workshops organized by researchers and trainers.
63
5.3.3 Network of material
The UPS members mentioned material availability as an important component for UPS
implementation. Materials can range from bags, gravel, wheel barrows, pesticides, fertilizers,
gravel, books and pens (for the secretary and treasurer for minutes taking and record keeping
respectively). Annex B illustrates the material networks for all UPS groups (KG, TR-FMD,
OMOS and IWS) in two regions.
Kitchen garden UPS: According to Annex B, there is no regional difference for the indegree
centralities for the material flows across all villages for the kitchen garden UPS groups. In both
regions the UPS members are not dependent on researchers and trainers for bringing materials to
them. Also, in both regions of the KG the field assistant and treasurer is at the top of the
betweeness centrality.
Tied ridges and fertilizer micro dosing UPS: There is zero betweeness in the TR-FMD UPS
group in Ilakala thus, no actor has authority over the material flows. Moreover, in the TR-FMD
in Changarawe, Ilolo and Idifu the field assistant and researchers are at the top of the outdegree
centrality thus, confirming the low indegrees in the material flows. They are the main providers
of small fertilizer amount for the farmers‘ test plots. An exception is in the Ilakala TR-FMD
where the small farmers and their executives have the highest outdegree. We can also observe
that the researchers and trainers, the field assistant are at the top of the outdegree centralities in
most of the groups thus, are the main distributors of fertilizer.
Improved grain storage UPS: The field assistant is the most influential for the material flows in
the improved storage group as he is the main distributor of materials in the absence of
researchers and trainers. This positions him as broker in the group for material flows since he has
direct contact with trainers and researchers. Also, the field assistant in Changarawe is a member
of the improved storage and some of the UPS members believed that he was more in touch with
the UPS members than the researchers and trainers were. The moderately high betweeness score
of the field assistant originated from his location between the researchers and trainers and the
UPS members as no one pointed out a direct connection between the UPS members and the
researchers and trainers; even though the researchers and trainers visit their sites frequently and
the field assistant participates in several meetings and training sessions.

64
Furthermore in the TR-FMD UPS in the semi-arid region, improved wood supply and improved
storage UPS groups; the UPS members, group leader, field assistant and secretary are equally not
dependent on the researchers and trainers for materials thus high indegrees. We can also observe
that most UPS groups are not dependent on the researchers and trainers for materials but are self-
organized.
5.4. Motivations for actors for the upgrading strategy
The interviewees during the Net-Mapping gave their perceptions about motivations of actors for
taking part in the UPS. The perceived motivations for each UPS group is illustrated (table 12).
From the table it can be seen that the most important motivations regionally are: more
knowledge, enhancing food availability, better social relations and more income.
Table 12: Motivations of actors for all the UPS
Village More
in
com
e
En
han
cin
g
food
avail
ab
ilit
y
More
joy
Bet
ter
soci
al
rela
tion
s
More
kn
ow
led
ge
Pre
ven
tin
g
shock
s
Bet
ter
rep
uta
tion
More
tim
e
Kitchen garden (KG)
Changarawe 0.3 0.6 0.4 0.5 0.7 0.0 0.1 0.3
Ilakala 0.3 0.5 0.2 0.6 0.6 0.0 0.3 0.3
Idifu 0.3 0.5 0.3 0.4 0.3 0.1 0.3 0.1
Ilolo 0.4 0.5 0.3 0.5 0.7 0.0 0.1 0.3
Tied ridges and fertilizer micro dosing (TR-FMD)
Changarawe 0.5 0.6 0.2 0.4 0.5 0.0 0.2 0.2
Ilakala 0.4 0.5 0.1 0.5 0.6 0.0 0.3 0.2
Idifu 0.4 0.5 0.5 0.4 0.5 0.1 0.3 0.1
Ilolo 0.4 0.5 0.4 0.4 0.4 0.0 0.2 0.1
Optimized market-orient grain storage (OMOS)
Changarawe 0.5 0.2 0.5 0.4 0.4 0.0 0.4 0.1
Ilakala 0.4 0.4 0.4 0.3 0.4 0.0 0.3 0.3
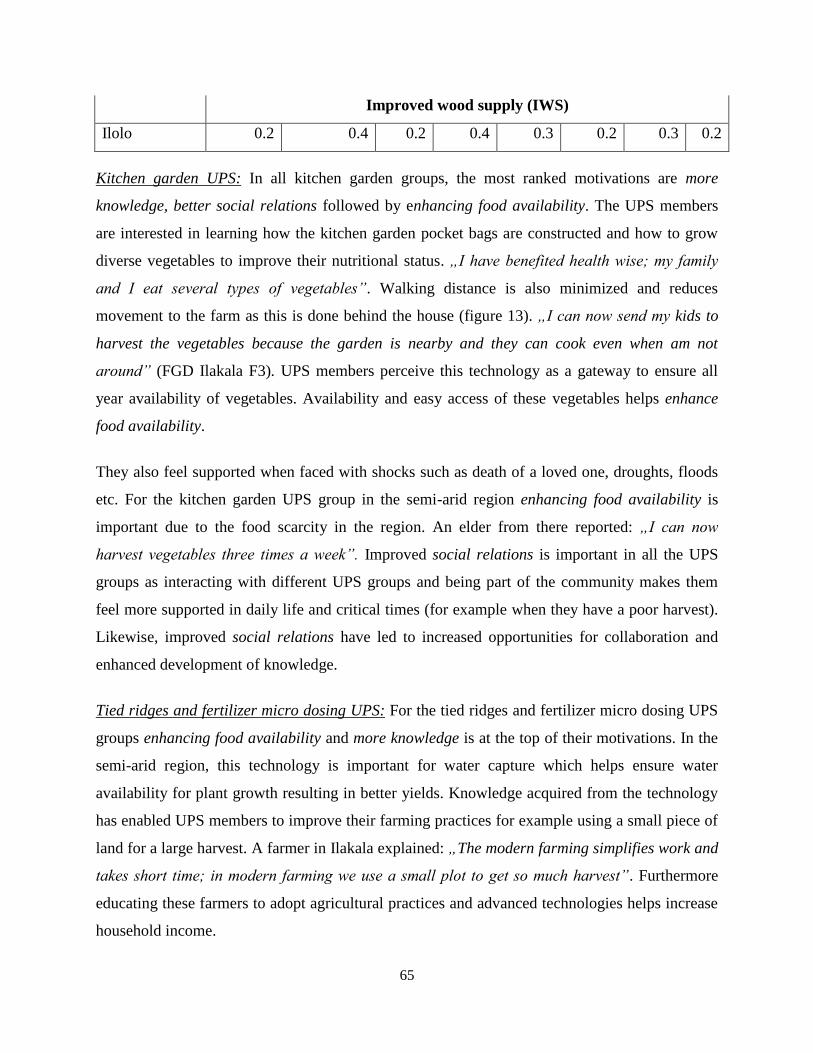
65
Improved wood supply (IWS)
Ilolo 0.2 0.4 0.2 0.4 0.3 0.2 0.3 0.2
Kitchen garden UPS: In all kitchen garden groups, the most ranked motivations are more
knowledge, better social relations followed by enhancing food availability. The UPS members
are interested in learning how the kitchen garden pocket bags are constructed and how to grow
diverse vegetables to improve their nutritional status. „I have benefited health wise; my family
and I eat several types of vegetables”. Walking distance is also minimized and reduces
movement to the farm as this is done behind the house (figure 13). „I can now send my kids to
harvest the vegetables because the garden is nearby and they can cook even when am not
around” (FGD Ilakala F3). UPS members perceive this technology as a gateway to ensure all
year availability of vegetables. Availability and easy access of these vegetables helps enhance
food availability.
They also feel supported when faced with shocks such as death of a loved one, droughts, floods
etc. For the kitchen garden UPS group in the semi-arid region enhancing food availability is
important due to the food scarcity in the region. An elder from there reported: „I can now
harvest vegetables three times a week”. Improved social relations is important in all the UPS
groups as interacting with different UPS groups and being part of the community makes them
feel more supported in daily life and critical times (for example when they have a poor harvest).
Likewise, improved social relations have led to increased opportunities for collaboration and
enhanced development of knowledge.
Tied ridges and fertilizer micro dosing UPS: For the tied ridges and fertilizer micro dosing UPS
groups enhancing food availability and more knowledge is at the top of their motivations. In the
semi-arid region, this technology is important for water capture which helps ensure water
availability for plant growth resulting in better yields. Knowledge acquired from the technology
has enabled UPS members to improve their farming practices for example using a small piece of
land for a large harvest. A farmer in Ilakala explained: „The modern farming simplifies work and
takes short time; in modern farming we use a small plot to get so much harvest”. Furthermore
educating these farmers to adopt agricultural practices and advanced technologies helps increase
household income.
66
Improved grain storage UPS: The major motivations for both improved storage UPS groups
include: more income, more joy and more knowledge. The produce stored in the improved
storage bags is sold during the off season at a higher price to generate more income. A farmer in
Ilakala reported that: „In previous years we used to throw away lots of damaged maize. But now
we don’t throw any, all is safe and sold in good shape. Also maize stays long and we sell later
when it’s scarce”. They feel happy learning a new improved storage technique and are even
more joyful when they don‘t spend money buying pesticides for preserving the grain. An elder
from Ilakala reported: „It’s very disturbing when the chemicals loose the power. You have to
move out the maize in the sun so as to kill the insects and then return it back, but with these new
bags we do not use chemicalsl”.
Enhancing food availability is an essential motivation for food security in both regions as the
improved storage bags do not harbour pests, no colour change in the produce after storage (figure
26). In the sub-humid region in Changarawe more small farmers use the super grain bags than do
in Ilakala. An elder in Changarawe reported that: „One bag for 10 000 Tsh but later the Trans-
SEC people came and sold for 3 000 Tsh”. Even with the reduction in price of the improved
storage bags, the farmers in Ilakala still complained of the price and mentioned it as a reason for
not using many of them. In the past they were sometimes subsidized with free storage bags.
Improved wood supply UPS: More knowledge acquisition for UPS members is an important
motivation in addressing the cooking energy and land degradation problems through the
integration of multipurpose species to provide wood and enrich the soil. When crops are
intercropped with some tree species the nitrogen content in soils is increased leading to improved
soil fertility and crop yields. For instance, intercropping Gliricidia sepium with cereal crops. In
Ilolo a farmer confirmed that: „Tree planting is important because we used to cut trees and it led
to destruction of our land. I was amongst those who were cutting trees but now it is time for re-
forestation”. The relations they‘ve created enables them liaise with each other when faced with
problems especially with pests and diseases.

67
5.5. In-depth comparison of kitchen gardens: both regional and village level
The following sections provide in-depth comparison of kitchen gardens (both between regions
and villages).
5.5.1 Network of knowledge for the kitchen garden UPS
The network of knowledge flows for the kitchen gardens UPS groups across four villages is
presented in figure 7.
Figure 7: Kitchen garden (KG) knowledge network map across four villages
68
Source: Author‗s calculations from Net-Map data, analysis with UCINet, and visualizations with
Gephi software.
Note: Arrow thickness depicts how often the actor was mentioned from the participant‘s
perspective.
There was a solid network exchange of information and ideas (high betweeness) between the
UPS members, the field assistant, researchers and trainers. This explains the low betweeness
score of the customers and village chief. The exchange of information included: types of nets
best suited for fencing the garden, how to properly use the nets to avoid animals and sunlight
from destroying vegetables, types of vegetables to be planted on the pocket bags, how to
improve the nutritional diversity of UPS members households. „We were told to remind each
other to irrigate the bags with water every day so as to secure the bags from being damaged by
the sun. But the treasurer said the problem here is water which is seasonal. You can’t always
buy a bucket of water for 500 Tsh just to irrigate the bags. That’s why they get damaged due to
the sun” (FGD Ilakala F6). Furthermore, this link included advice and training sessions for new
adopters in the group. Knowledge interchange with customers typically contained information on
preparing and preserving the vegetables.
Figures 8 present the results for the centralities of the knowledge network. The values displayed
are for all actors in the network. When comparing the betweeness centrality, it can be noticed
that there is zero betweeness for actors in the kitchen gardens in the semi-arid region (Idifu,
Ilolo) and Changarawe (figures 8) thus, no actor controls the knowledge flows. Actors in the
kitchen garden in Ilakala have the highest betweeness. The lowest betweeness in Ilakala is
observed for the customers and village chief due to their less involvement in the UPS
implementation. Nonetheless the village chief helps mitigate conflicts associated with land
resources and water. „The village chief maintains peace in the village” (FGD KG Idifu).
In the Net-Map of knowledge exchange: kitchen garden keepers, group leader and secretary have
high indegree centralities and a more than average perceived influence. This is expected as the
acquired technological knowledge helps proper implementation of the kitchen gardens.
Sometimes, UPS members look for pesticide alternatives by using leaves and wood ash to create
local pesticides. However, it can sometimes backfire. „The Trans-SEC project was giving us
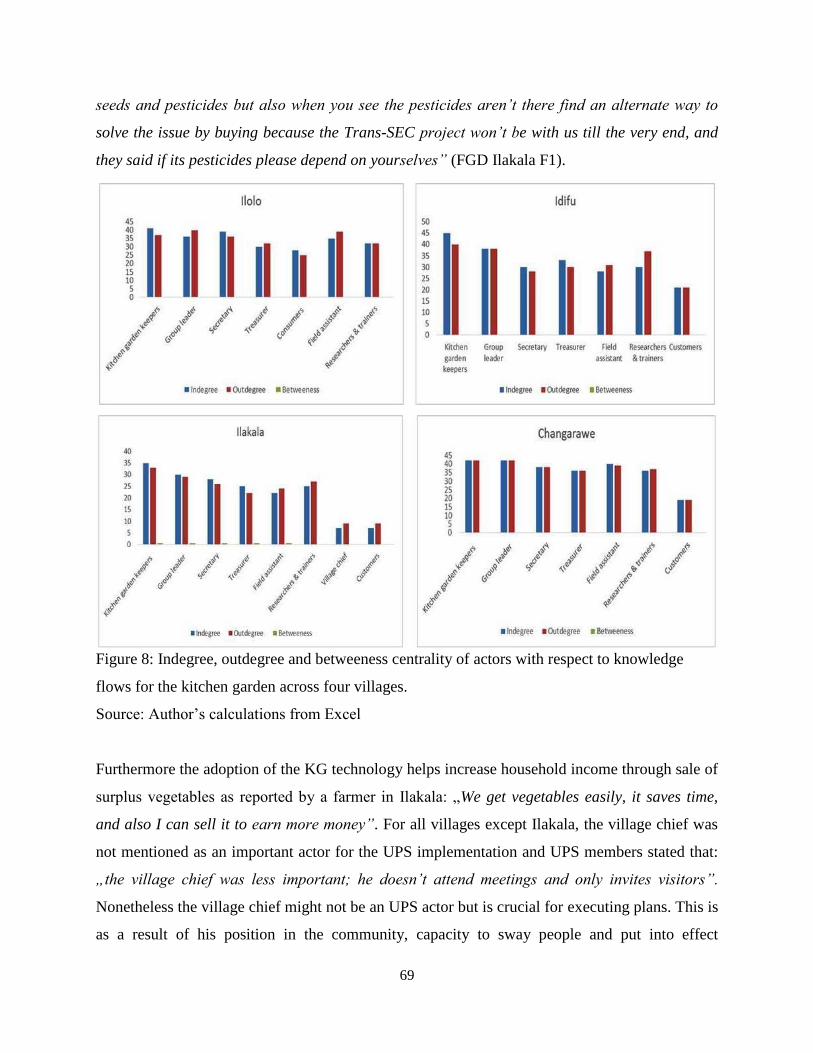
69
seeds and pesticides but also when you see the pesticides aren’t there find an alternate way to
solve the issue by buying because the Trans-SEC project won’t be with us till the very end, and
they said if its pesticides please depend on yourselves” (FGD Ilakala F1).
Figure 8: Indegree, outdegree and betweeness centrality of actors with respect to knowledge
flows for the kitchen garden across four villages.
Source: Author‘s calculations from Excel
Furthermore the adoption of the KG technology helps increase household income through sale of
surplus vegetables as reported by a farmer in Ilakala: „We get vegetables easily, it saves time,
and also I can sell it to earn more money”. For all villages except Ilakala, the village chief was
not mentioned as an important actor for the UPS implementation and UPS members stated that:
„the village chief was less important; he doesn’t attend meetings and only invites visitors”.
Nonetheless the village chief might not be an UPS actor but is crucial for executing plans. This is
as a result of his position in the community, capacity to sway people and put into effect

70
sanctions. Regionally customers in the semi-arid region have higher indegrees for knowledge in
contrast to those in the sub-humid region, suggesting no significant regional differences for the
outdegrees (table 9). Despite the food scarcity in the semi-arid region, the UPS members are still
able to interact with customers, educating them on the benefits of growing vegetables in pocket
bags, how to become members in the UPS group‘s reason for the customers‘ high outdegrees.
5.5.2 Network of money for the kitchen garden UPS
The network of money flows for the kitchen garden is presented in figure 9.
Figure 9: Kitchen garden (KG) money network map across four villages
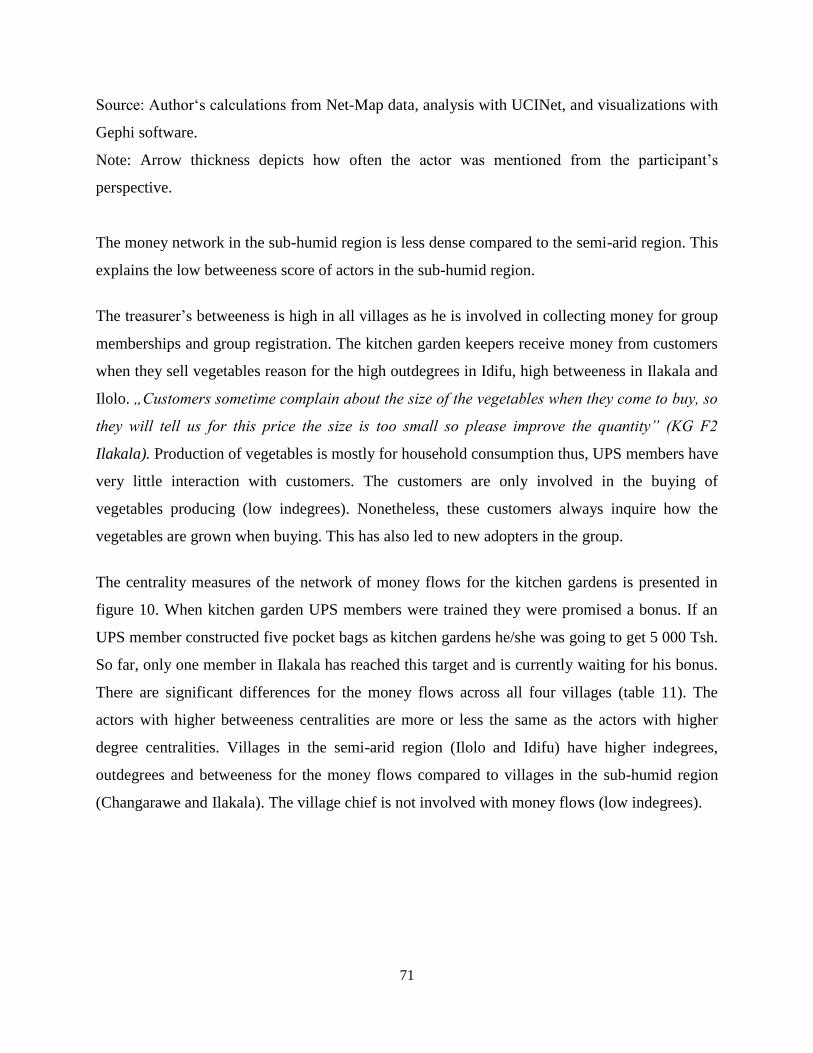
71
Source: Author‗s calculations from Net-Map data, analysis with UCINet, and visualizations with
Gephi software.
Note: Arrow thickness depicts how often the actor was mentioned from the participant‘s
perspective.
The money network in the sub-humid region is less dense compared to the semi-arid region. This
explains the low betweeness score of actors in the sub-humid region.
The treasurer‘s betweeness is high in all villages as he is involved in collecting money for group
memberships and group registration. The kitchen garden keepers receive money from customers
when they sell vegetables reason for the high outdegrees in Idifu, high betweeness in Ilakala and
Ilolo. „Customers sometime complain about the size of the vegetables when they come to buy, so
they will tell us for this price the size is too small so please improve the quantity” (KG F2
Ilakala). Production of vegetables is mostly for household consumption thus, UPS members have
very little interaction with customers. The customers are only involved in the buying of
vegetables producing (low indegrees). Nonetheless, these customers always inquire how the
vegetables are grown when buying. This has also led to new adopters in the group.
The centrality measures of the network of money flows for the kitchen gardens is presented in
figure 10. When kitchen garden UPS members were trained they were promised a bonus. If an
UPS member constructed five pocket bags as kitchen gardens he/she was going to get 5 000 Tsh.
So far, only one member in Ilakala has reached this target and is currently waiting for his bonus.
There are significant differences for the money flows across all four villages (table 11). The
actors with higher betweeness centralities are more or less the same as the actors with higher
degree centralities. Villages in the semi-arid region (Ilolo and Idifu) have higher indegrees,
outdegrees and betweeness for the money flows compared to villages in the sub-humid region
(Changarawe and Ilakala). The village chief is not involved with money flows (low indegrees).

72
Figure 10: Indegree, outdegree and betweeness centrality of actors with respect to money flows
for the kitchen garden across four villages.
Source: Author‗s calculations from Excel
5.5.3 Network of materials for the kitchen garden UPS
Figure 11 presents the betweeness centrality of the material networks for the kitchen garden
across four villages. The UPS members mentioned the field assistant as being very helpful
getting nets for fencing of the gardens. Other materials for the kitchen garden implementation
include; bags, spade, gravel, seeds, pesticides, fertilizer, watering cans, ropes and many more.
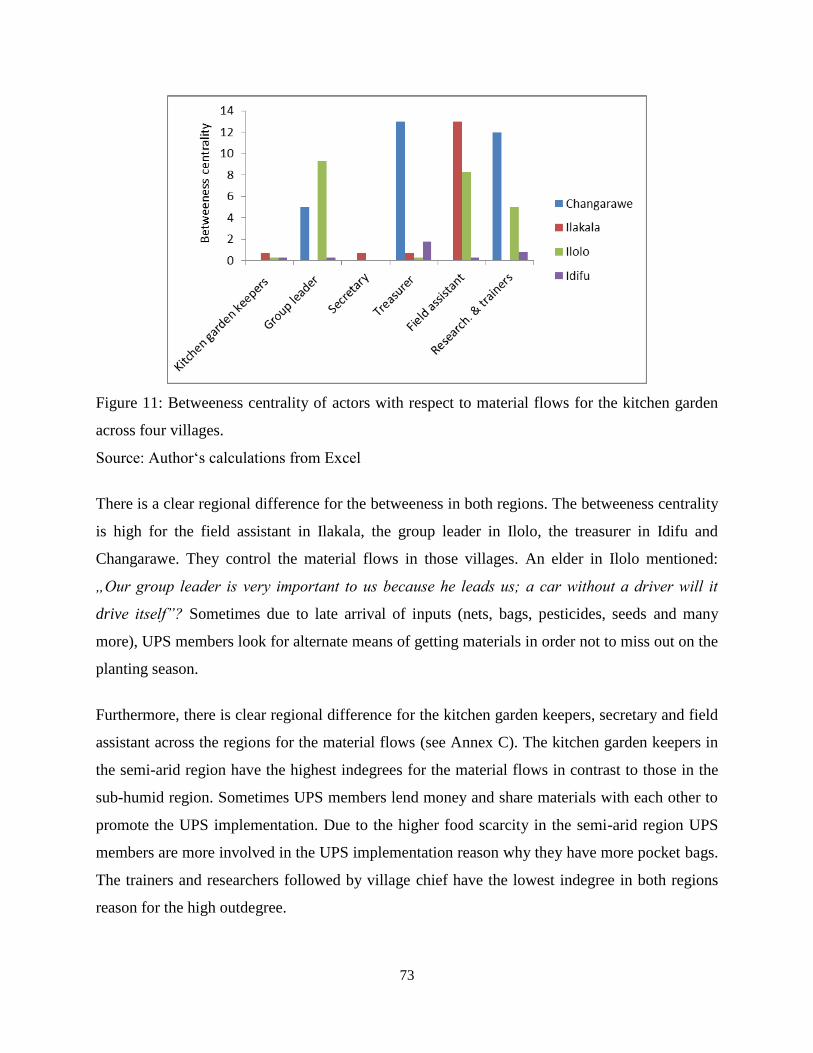
73
Figure 11: Betweeness centrality of actors with respect to material flows for the kitchen garden
across four villages.
Source: Author‗s calculations from Excel
There is a clear regional difference for the betweeness in both regions. The betweeness centrality
is high for the field assistant in Ilakala, the group leader in Ilolo, the treasurer in Idifu and
Changarawe. They control the material flows in those villages. An elder in Ilolo mentioned:
„Our group leader is very important to us because he leads us; a car without a driver will it
drive itself”? Sometimes due to late arrival of inputs (nets, bags, pesticides, seeds and many
more), UPS members look for alternate means of getting materials in order not to miss out on the
planting season.
Furthermore, there is clear regional difference for the kitchen garden keepers, secretary and field
assistant across the regions for the material flows (see Annex C). The kitchen garden keepers in
the semi-arid region have the highest indegrees for the material flows in contrast to those in the
sub-humid region. Sometimes UPS members lend money and share materials with each other to
promote the UPS implementation. Due to the higher food scarcity in the semi-arid region UPS
members are more involved in the UPS implementation reason why they have more pocket bags.
The trainers and researchers followed by village chief have the lowest indegree in both regions
reason for the high outdegree.

74
There is no regional difference among the high outdegrees for the field assistant, secretary,
treasurer, researchers and trainers. The UPS members receive materials from the field assistant
when researchers and trainers are unable to reach them reason for the low outdegrees.
5.5.4 Towers for the kitchen garden upgrading strategy
5.5.4.1 Importance tower for all actors in the kitchen garden UPS
The interviewees were asked for their perceptions on the influence of each actor in taking part in
the UPS. An overview of the importance tower for all villages is illustrated in table 13. For the
sake of simplicity, only the most influential 7-8 actors are displayed.
Table 13: Importance towers for the kitchen gardens showing all actors
Idifu Ilolo Ilakala Changarawe
Actors N Mean Std.
Dev
N Mean Std.
Dev
N Mean Std.
Dev
N Mean Std.
Dev
KG keepers 8 4.0 1.5 8 4.8 0.5 8 4.3 1.0 8 4.5 1.1
Group leader 8 4.4 1.4 8 4.5 0.8 8 4.1 1.1 8 4.6 0.7
Secretary 8 3.3 1.6 8 4.1 1.5 8 2.9 1.4 8 2.8 1.0
Treasurer 8 4.3 1.2 5 3.6 0.9 8 3.1 1.6 8 3.9 1.5
Field assistant 8 3.9 2.1 8 4.1 1.1 8 5 0 8 4.9 0.4
Research. & trainers 8 4.4 1.8 8 4.6 1.1 8 4.8 0.5 8 4.9 0.4
Customers 8 3.8 1.8 8 3.1 1.1 4 1.8 1.5 8 2.3 2.0
Village chief 4 3 2.4
The low influence categories of actors and actor groups with an average score between 0.0 and
2.6 were excluded here.
The most important actors in all villages implementing the kitchen garden include: the field
assistant, researchers and trainers, kitchen garden keepers, group leader and treasurer. There is
no significance difference between the villages for the importance tower. Customers and the
village chief are considered fairly important in the UPS implementation.

75
5.5.4.2 Influence of actors for all kitchen garden implementation
The influential categories for the various actors implementing the kitchen garden is shown in
table 13. As earlier illustrated in chapter three, the influence level was investigated by use of
height of a tower (wood pieces loaded on one another). Five influence categories were examined:
importance, income, trust, food and knowledge. In order to determine the six most relevant
actors, the three highest importance tower scores (mean) were selected for each actor.
Comparing the centralities with the perceived influence of the actors (table 14); it is remarkable
that the actors in the top of the centralities are also perceived to have high influence in the UPS
implementation. The field assistant had a higher average influence, narrowly followed by the
researchers and trainers and kitchen garden keepers. All interviewees agreed on the high
influence of the field assistant. After this, there is a slight gap between these three and the next
influential actors, group leader treasurer and secretary who were the executives of the UPS group
and represented their interest. Not everyone associated these executives with influence. While
the field assistant assigned them with high influence, as should be the case in a proper
functioning of the UPS group, some UPS members allocated little or no influence. Only the
village chief and customers had less influence.
According to the perceptions of the interviewees, the field assistant can influence the
achievement of the UPS; he can instruct almost every actor in the network, visits farmers‘ fields
to see what they are doing. UPS members also trust him since he is the person they turn to when
faced with challenges such as pest infestation, water scarcity, delay in arrival of pesticides. A
farmer in Ilakala mentioned: „The field assistant visits us often and gives us bags and
pesticides”.
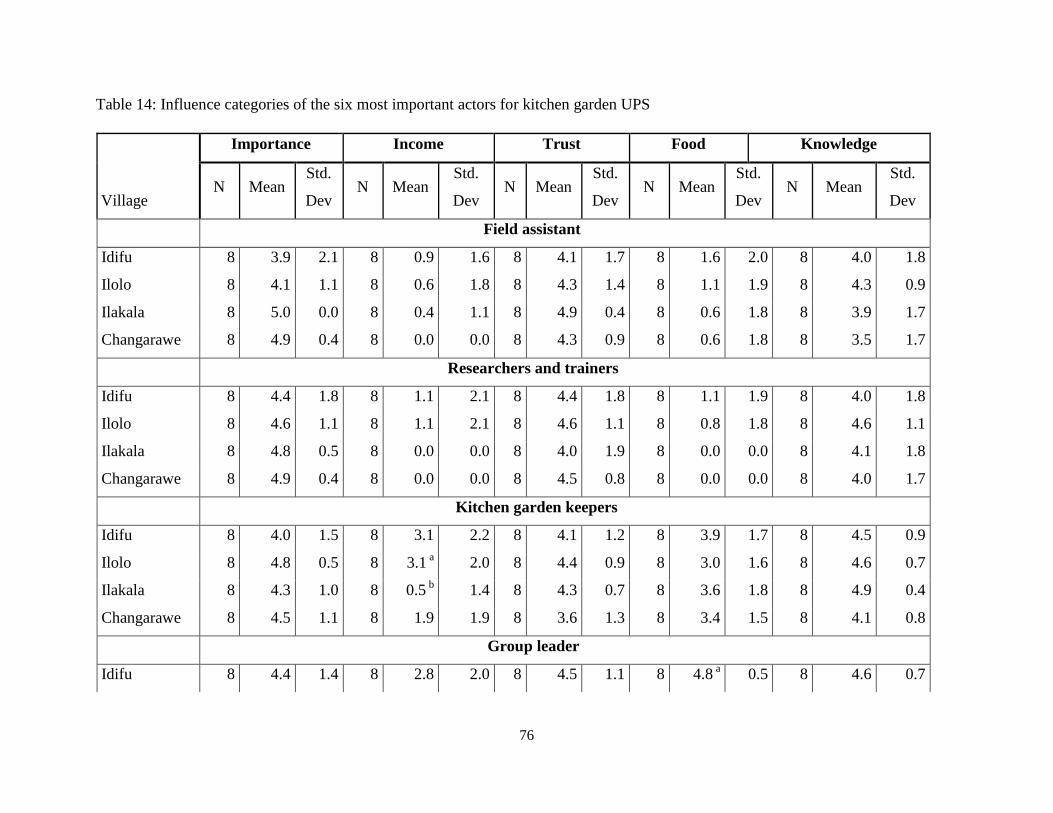
76
Table 14: Influence categories of the six most important actors for kitchen garden UPS
Importance Income Trust Food Knowledge
Village N Mean
Std.
Dev N Mean
Std.
Dev N Mean
Std.
Dev N Mean
Std.
Dev N Mean
Std.
Dev
Field assistant
Idifu 8 3.9 2.1 8 0.9 1.6 8 4.1 1.7 8 1.6 2.0 8 4.0 1.8
Ilolo 8 4.1 1.1 8 0.6 1.8 8 4.3 1.4 8 1.1 1.9 8 4.3 0.9
Ilakala 8 5.0 0.0 8 0.4 1.1 8 4.9 0.4 8 0.6 1.8 8 3.9 1.7
Changarawe 8 4.9 0.4 8 0.0 0.0 8 4.3 0.9 8 0.6 1.8 8 3.5 1.7
Researchers and trainers
Idifu 8 4.4 1.8 8 1.1 2.1 8 4.4 1.8 8 1.1 1.9 8 4.0 1.8
Ilolo 8 4.6 1.1 8 1.1 2.1 8 4.6 1.1 8 0.8 1.8 8 4.6 1.1
Ilakala 8 4.8 0.5 8 0.0 0.0 8 4.0 1.9 8 0.0 0.0 8 4.1 1.8
Changarawe 8 4.9 0.4 8 0.0 0.0 8 4.5 0.8 8 0.0 0.0 8 4.0 1.7
Kitchen garden keepers
Idifu 8 4.0 1.5 8 3.1 2.2 8 4.1 1.2 8 3.9 1.7 8 4.5 0.9
Ilolo 8 4.8 0.5 8 3.1 a 2.0 8 4.4 0.9 8 3.0 1.6 8 4.6 0.7
Ilakala 8 4.3 1.0 8 0.5 b 1.4 8 4.3 0.7 8 3.6 1.8 8 4.9 0.4
Changarawe 8 4.5 1.1 8 1.9 1.9 8 3.6 1.3 8 3.4 1.5 8 4.1 0.8
Group leader
Idifu 8 4.4 1.4 8 2.8 2.0 8 4.5 1.1 8 4.8 a 0.5 8 4.6 0.7
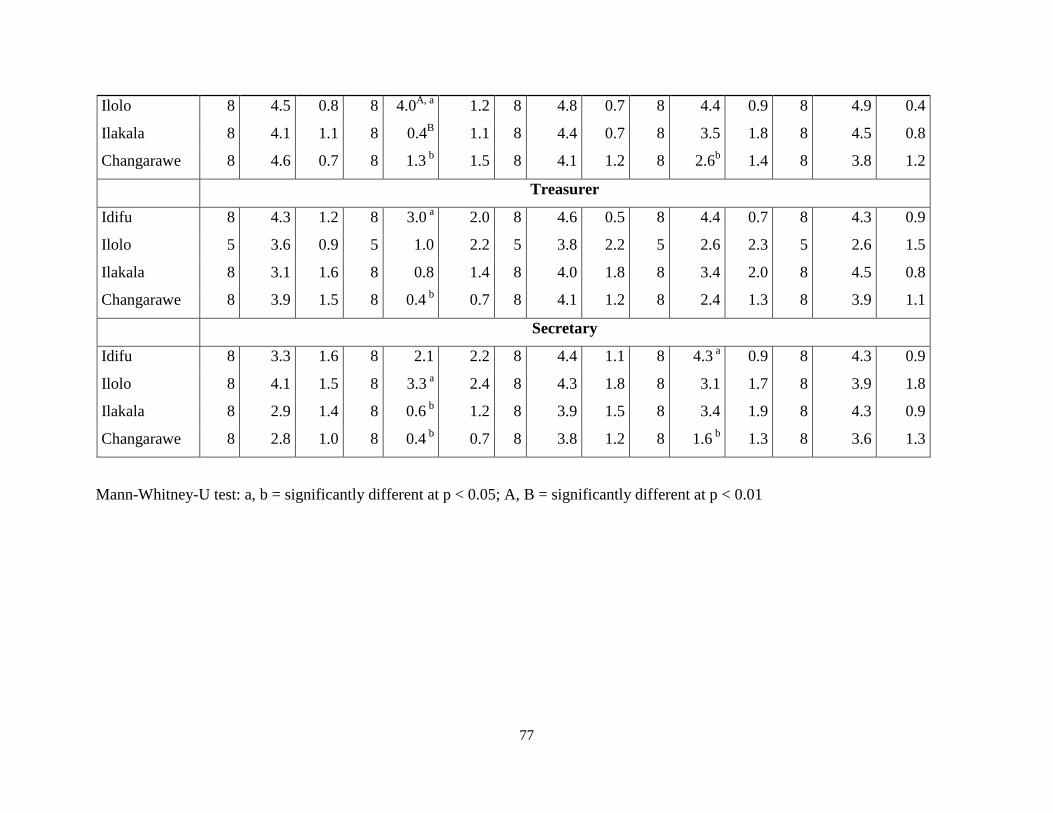
77
Ilolo 8 4.5 0.8 8 4.0A, a
1.2 8 4.8 0.7 8 4.4 0.9 8 4.9 0.4
Ilakala 8 4.1 1.1 8 0.4B 1.1 8 4.4 0.7 8 3.5 1.8 8 4.5 0.8
Changarawe 8 4.6 0.7 8 1.3 b 1.5 8 4.1 1.2 8 2.6
b 1.4 8 3.8 1.2
Treasurer
Idifu 8 4.3 1.2 8 3.0 a 2.0 8 4.6 0.5 8 4.4 0.7 8 4.3 0.9
Ilolo 5 3.6 0.9 5 1.0 2.2 5 3.8 2.2 5 2.6 2.3 5 2.6 1.5
Ilakala 8 3.1 1.6 8 0.8 1.4 8 4.0 1.8 8 3.4 2.0 8 4.5 0.8
Changarawe 8 3.9 1.5 8 0.4 b 0.7 8 4.1 1.2 8 2.4 1.3 8 3.9 1.1
Secretary
Idifu 8 3.3 1.6 8 2.1 2.2 8 4.4 1.1 8 4.3 a 0.9 8 4.3 0.9
Ilolo 8 4.1 1.5 8 3.3 a 2.4 8 4.3 1.8 8 3.1 1.7 8 3.9 1.8
Ilakala 8 2.9 1.4 8 0.6 b 1.2 8 3.9 1.5 8 3.4 1.9 8 4.3 0.9
Changarawe 8 2.8 1.0 8 0.4 b 0.7 8 3.8 1.2 8 1.6
b 1.3 8 3.6 1.3
Mann-Whitney-U test: a, b = significantly different at p < 0.05; A, B = significantly different at p < 0.01
78
Kitchen garden keepers have a high influence in ensuring vegetables are available throughout the
season for their households. They also want to acquire knowledge to properly implement the
UPS. The distribution of income for the kitchen garden keepers in Ilolo (3.1) (p < 0.05) is
considered significantly higher to the distribution of income in Idifu (0.5) (p < 0.05).
Furthermore, there is significant difference in estimated income for the treasurers in Idifu and
Changarawe (p < 0.05). This indicates that the treasurer in Idifu sells more of his vegetables from
the pocket bags. He is also influential to the UPS group members convincing them to have more
pocket bags. In so doing, they can market some of their vegetables to generate indirect income
for their households. Additionally, the treasurer in Idifu has the highest ranks in terms of trust in
contrast to other villages.
Researchers and trainers are assumed to be most influential in importance, trust and knowledge
providers for the UPS implementation across both regions. The researchers do not benefit from
more income and/or more food from the UPS implementation. Reason being that, they only
ensure as external experts that the food security of farmers is improved.
The distribution of income for the group leader in Ilolo (4.0) (p < 0.01) is significantly higher to
the distribution of income in Changarawe (1.3) (p < 0.05) and Ilakala (0.4) (p < 0.01), indicating
that he has more kitchen garden pocket bags and sells the surplus. Moreover, the distribution of
food for the group leader in Idifu (4.8) (p < 0.05) is significantly higher than the distribution of
food for the group leader in Changarawe (2.6) (p < 0.05), possibly because he has more pocket
bags and is harvesting more from it. Furthermore, there are great differences for the secretary‘s
income in Ilolo (3.3) (p < 0.05) to Changarawe (0.4) (p < 0.05) and Ilakala (0.6) (p < 0.05). This
indicates that in spite severe climatic conditions in the semi-arid region, the secretary in Ilolo is
able to utilize different techniques in generating more income from the technology. The different
techniques can include; having more pocket bags, use of nets around his kitchen garden to deter
predators and timely application of pesticides to get rid of diseases and pests. Additionally, the
distribution of food for the secretary in Idifu (4.3) (p < 0.05) is significantly higher to the
distribution of food in Changarawe (1.6) (p < 0.05). Even with the food scarcity in the semi-arid
region, the secretary in Idifu has been able to have a good mastery of the technology. This has
also enabled him /her to utilize the acquired technological skills to get more food for his
household.
79
Interestingly, we find significant differences (p < 0.05) for distribution of food between the
customers of all villages (data not shown). This indicates that customers are highly dependent on
the kitchen garden keepers for vegetables for improving the nutritional status of their households.
From the above results; we can observe that the executives of the UPS group in the semi-arid
region were mentioned as those with the highest influence for income and food in contrast to the
ones in the sub-humid region.
5.5.5 Motivations for actors for the kitchen garden upgrading strategy
Table 15 shows the five most important motivations for the six most important actors for the
kitchen garden group in all four villages. As we can observe, the kitchen garden keepers in
Ilakala and Ilolo were assigned more income and better social relations respectively with the
highest ranks in motivations in contrast to other villages. The surplus vegetable is sold to
generate indirect income for households. Furthermore, we find significant differences in more
knowledge acquisition between the kitchen garden keepers in the groups of Idifu (0.5) and Ilolo
(0.0) (p < 0.01), assuming that farmers receive technical information from various sources.
Additionally, the motivation more joy for the treasurer in Changarawe (0.6) is considered
significantly higher than in Ilakala (0.0) and Idifu (0.4) (p < 0.05).
The motivations of the group leader, secretary, treasurer, researchers and trainers in both regions
is: better social relations, more knowledge followed by more joy and enhancing food
availability. Improved social relations advances apprehension through acquaintance to novel
thoughts. Likewise, the technology has also led to improved social relations with neighbours. A
kitchen garden keeper in Ilakala stated: „It has improved my relations with my neighbours as
they now come to ask for vegetables and I give them for free”. Kitchen garden keepers are also
able to have balanced diets with their families which has helped improved their health status
compared to before. „My health situation has changed a lot since I started cultivating
vegetables. Before I used to eat big ugali, but ever since I did the kitchen garden, I now eat little
ugali with a lot of vegetables” (KG Changarawe F2).
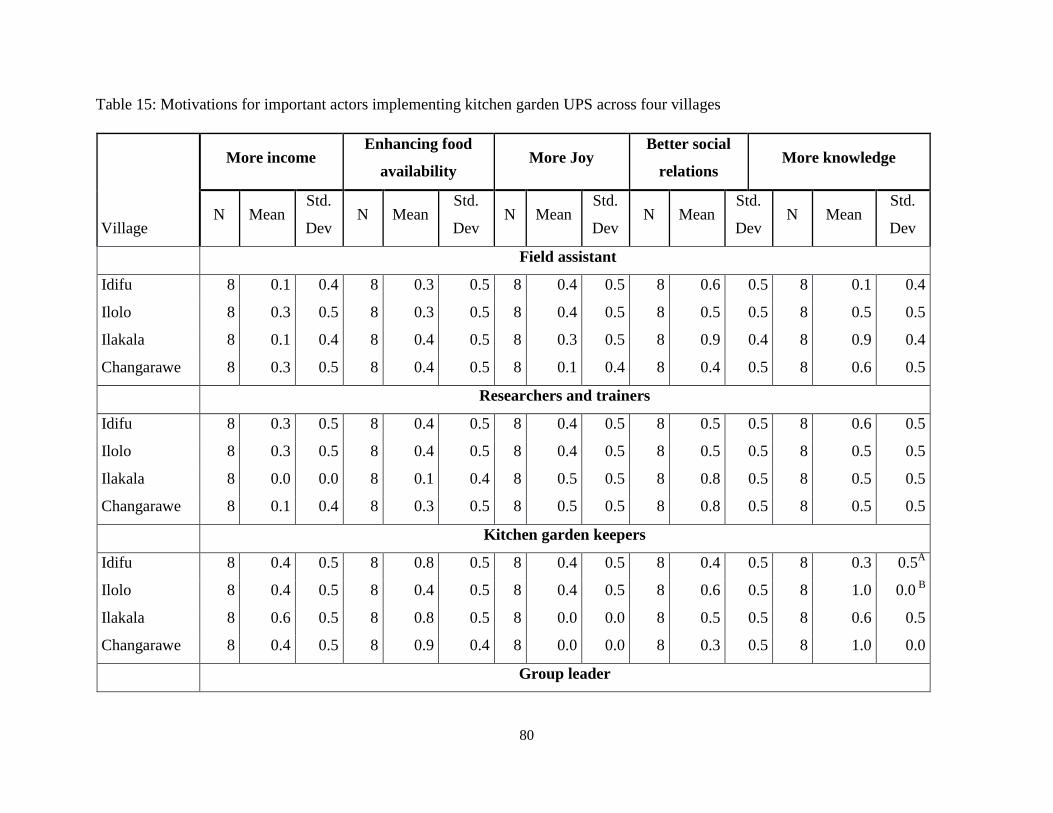
80
Table 15: Motivations for important actors implementing kitchen garden UPS across four villages
More income Enhancing food
availability More Joy
Better social
relations More knowledge
Village N Mean
Std.
Dev N Mean
Std.
Dev N Mean
Std.
Dev N Mean
Std.
Dev N Mean
Std.
Dev
Field assistant
Idifu 8 0.1 0.4 8 0.3 0.5 8 0.4 0.5 8 0.6 0.5 8 0.1 0.4
Ilolo 8 0.3 0.5 8 0.3 0.5 8 0.4 0.5 8 0.5 0.5 8 0.5 0.5
Ilakala 8 0.1 0.4 8 0.4 0.5 8 0.3 0.5 8 0.9 0.4 8 0.9 0.4
Changarawe 8 0.3 0.5 8 0.4 0.5 8 0.1 0.4 8 0.4 0.5 8 0.6 0.5
Researchers and trainers
Idifu 8 0.3 0.5 8 0.4 0.5 8 0.4 0.5 8 0.5 0.5 8 0.6 0.5
Ilolo 8 0.3 0.5 8 0.4 0.5 8 0.4 0.5 8 0.5 0.5 8 0.5 0.5
Ilakala 8 0.0 0.0 8 0.1 0.4 8 0.5 0.5 8 0.8 0.5 8 0.5 0.5
Changarawe 8 0.1 0.4 8 0.3 0.5 8 0.5 0.5 8 0.8 0.5 8 0.5 0.5
Kitchen garden keepers
Idifu 8 0.4 0.5 8 0.8 0.5 8 0.4 0.5 8 0.4 0.5 8 0.3 0.5A
Ilolo 8 0.4 0.5 8 0.4 0.5 8 0.4 0.5 8 0.6 0.5 8 1.0 0.0 B
Ilakala 8 0.6 0.5 8 0.8 0.5 8 0.0 0.0 8 0.5 0.5 8 0.6 0.5
Changarawe 8 0.4 0.5 8 0.9 0.4 8 0.0 0.0 8 0.3 0.5 8 1.0 0.0
Group leader
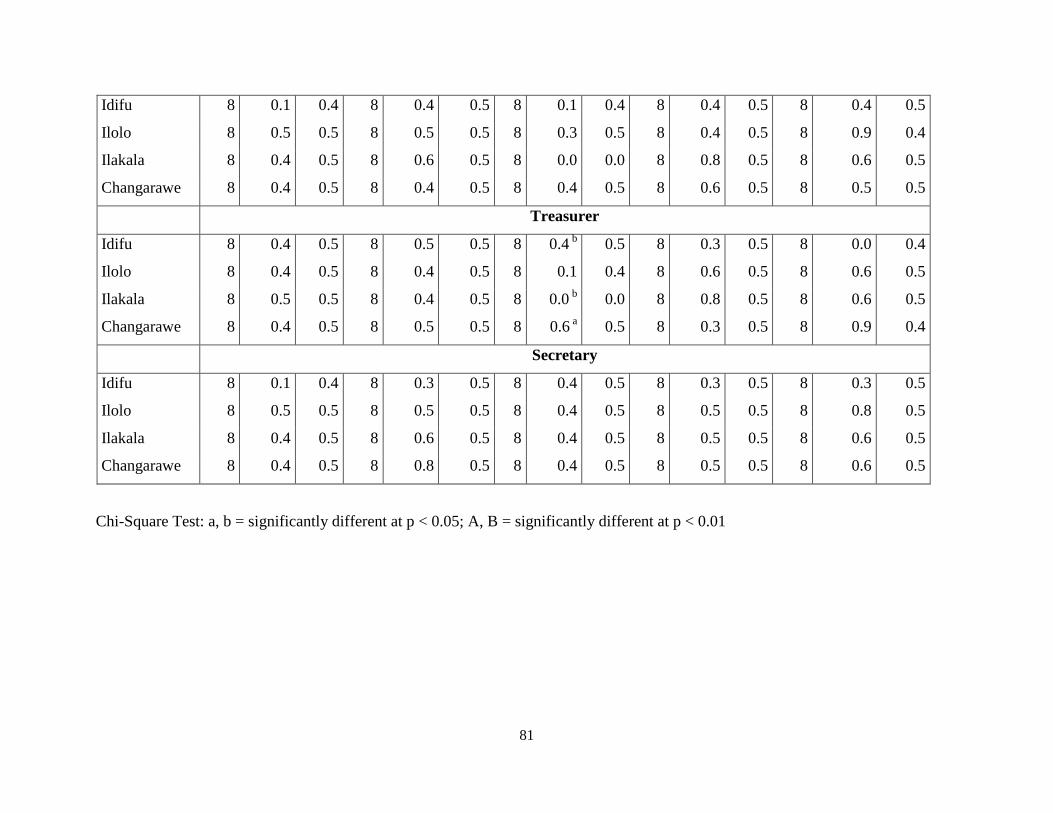
81
Idifu 8 0.1 0.4 8 0.4 0.5 8 0.1 0.4 8 0.4 0.5 8 0.4 0.5
Ilolo 8 0.5 0.5 8 0.5 0.5 8 0.3 0.5 8 0.4 0.5 8 0.9 0.4
Ilakala 8 0.4 0.5 8 0.6 0.5 8 0.0 0.0 8 0.8 0.5 8 0.6 0.5
Changarawe 8 0.4 0.5 8 0.4 0.5 8 0.4 0.5 8 0.6 0.5 8 0.5 0.5
Treasurer
Idifu 8 0.4 0.5 8 0.5 0.5 8 0.4 b 0.5 8 0.3 0.5 8 0.0 0.4
Ilolo 8 0.4 0.5 8 0.4 0.5 8 0.1 0.4 8 0.6 0.5 8 0.6 0.5
Ilakala 8 0.5 0.5 8 0.4 0.5 8 0.0 b 0.0 8 0.8 0.5 8 0.6 0.5
Changarawe 8 0.4 0.5 8 0.5 0.5 8 0.6 a 0.5 8 0.3 0.5 8 0.9 0.4
Secretary
Idifu 8 0.1 0.4 8 0.3 0.5 8 0.4 0.5 8 0.3 0.5 8 0.3 0.5
Ilolo 8 0.5 0.5 8 0.5 0.5 8 0.4 0.5 8 0.5 0.5 8 0.8 0.5
Ilakala 8 0.4 0.5 8 0.6 0.5 8 0.4 0.5 8 0.5 0.5 8 0.6 0.5
Changarawe 8 0.4 0.5 8 0.8 0.5 8 0.4 0.5 8 0.5 0.5 8 0.6 0.5
Chi-Square Test: a, b = significantly different at p < 0.05; A, B = significantly different at p < 0.01
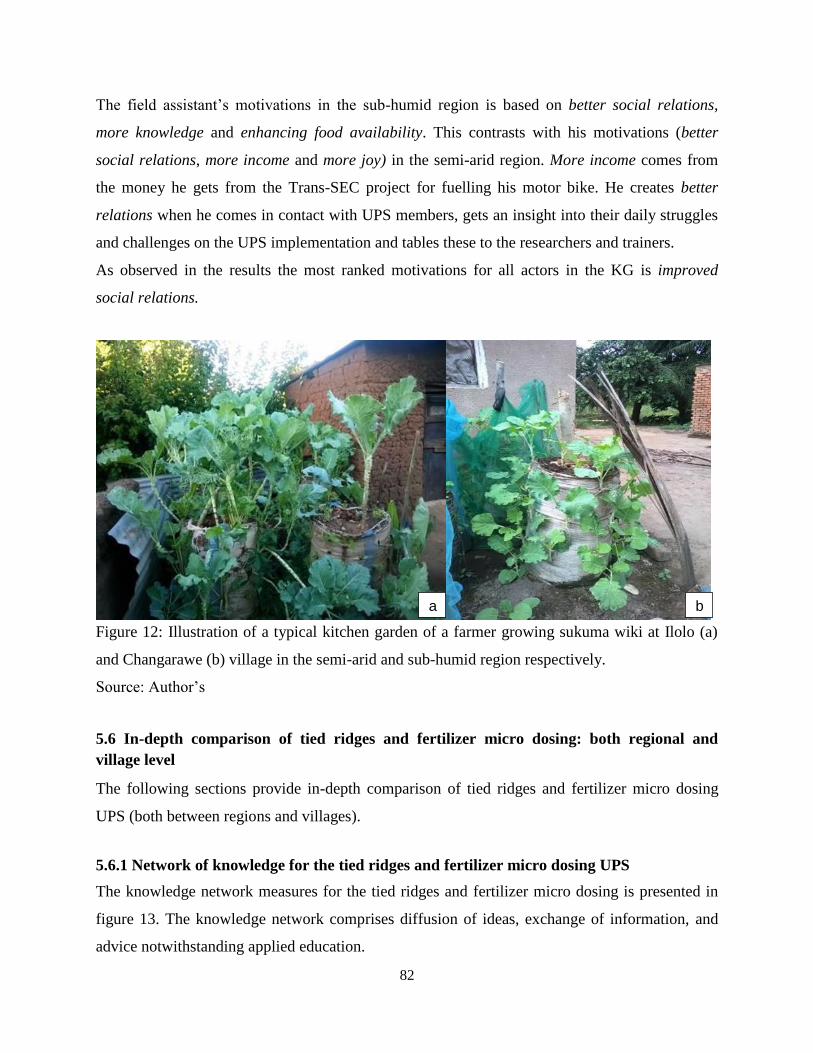
82
The field assistant‘s motivations in the sub-humid region is based on better social relations,
more knowledge and enhancing food availability. This contrasts with his motivations (better
social relations, more income and more joy) in the semi-arid region. More income comes from
the money he gets from the Trans-SEC project for fuelling his motor bike. He creates better
relations when he comes in contact with UPS members, gets an insight into their daily struggles
and challenges on the UPS implementation and tables these to the researchers and trainers.
As observed in the results the most ranked motivations for all actors in the KG is improved
social relations.
Figure 12: Illustration of a typical kitchen garden of a farmer growing sukuma wiki at Ilolo (a)
and Changarawe (b) village in the semi-arid and sub-humid region respectively.
Source: Author‘s
5.6 In-depth comparison of tied ridges and fertilizer micro dosing: both regional and
village level
The following sections provide in-depth comparison of tied ridges and fertilizer micro dosing
UPS (both between regions and villages).
5.6.1 Network of knowledge for the tied ridges and fertilizer micro dosing UPS
The knowledge network measures for the tied ridges and fertilizer micro dosing is presented in
figure 13. The knowledge network comprises diffusion of ideas, exchange of information, and
advice notwithstanding applied education.
a b
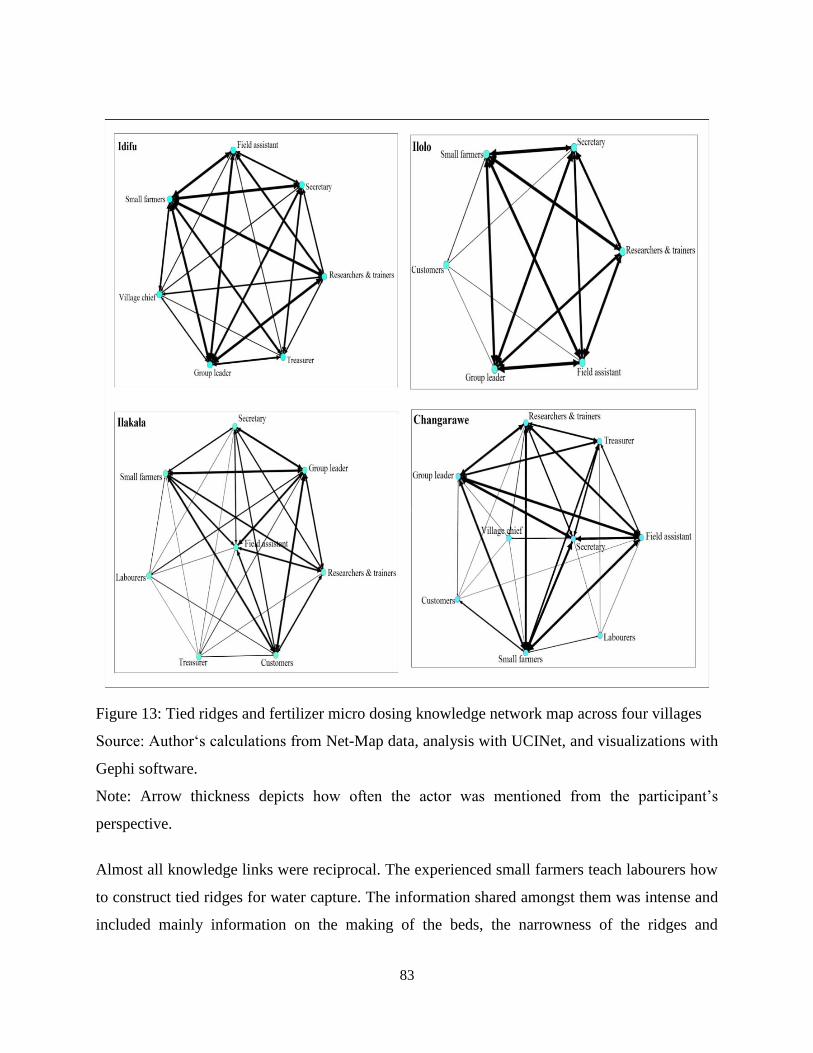
83
Figure 13: Tied ridges and fertilizer micro dosing knowledge network map across four villages
Source: Author‗s calculations from Net-Map data, analysis with UCINet, and visualizations with
Gephi software.
Note: Arrow thickness depicts how often the actor was mentioned from the participant‘s
perspective.
Almost all knowledge links were reciprocal. The experienced small farmers teach labourers how
to construct tied ridges for water capture. The information shared amongst them was intense and
included mainly information on the making of the beds, the narrowness of the ridges and
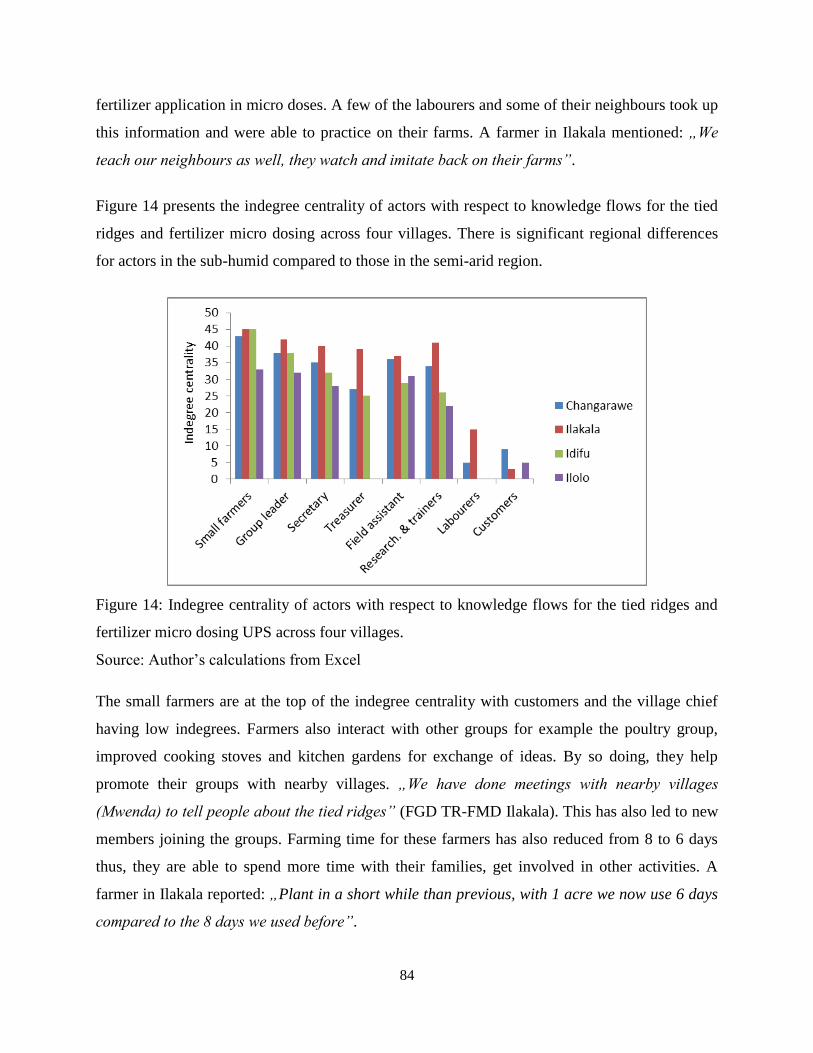
84
fertilizer application in micro doses. A few of the labourers and some of their neighbours took up
this information and were able to practice on their farms. A farmer in Ilakala mentioned: „We
teach our neighbours as well, they watch and imitate back on their farms”.
Figure 14 presents the indegree centrality of actors with respect to knowledge flows for the tied
ridges and fertilizer micro dosing across four villages. There is significant regional differences
for actors in the sub-humid compared to those in the semi-arid region.
Figure 14: Indegree centrality of actors with respect to knowledge flows for the tied ridges and
fertilizer micro dosing UPS across four villages.
Source: Author‘s calculations from Excel
The small farmers are at the top of the indegree centrality with customers and the village chief
having low indegrees. Farmers also interact with other groups for example the poultry group,
improved cooking stoves and kitchen gardens for exchange of ideas. By so doing, they help
promote their groups with nearby villages. „We have done meetings with nearby villages
(Mwenda) to tell people about the tied ridges” (FGD TR-FMD Ilakala). This has also led to new
members joining the groups. Farming time for these farmers has also reduced from 8 to 6 days
thus, they are able to spend more time with their families, get involved in other activities. A
farmer in Ilakala reported: „Plant in a short while than previous, with 1 acre we now use 6 days
compared to the 8 days we used before”.
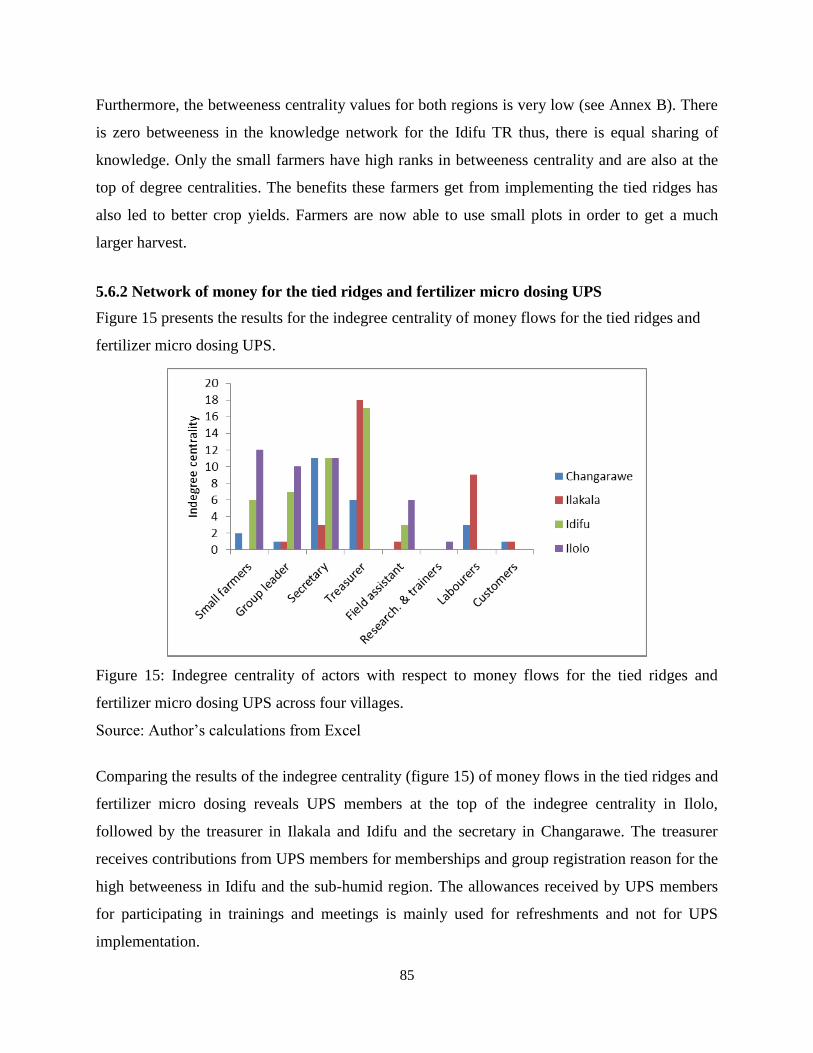
85
Furthermore, the betweeness centrality values for both regions is very low (see Annex B). There
is zero betweeness in the knowledge network for the Idifu TR thus, there is equal sharing of
knowledge. Only the small farmers have high ranks in betweeness centrality and are also at the
top of degree centralities. The benefits these farmers get from implementing the tied ridges has
also led to better crop yields. Farmers are now able to use small plots in order to get a much
larger harvest.
5.6.2 Network of money for the tied ridges and fertilizer micro dosing UPS
Figure 15 presents the results for the indegree centrality of money flows for the tied ridges and
fertilizer micro dosing UPS.
Figure 15: Indegree centrality of actors with respect to money flows for the tied ridges and
fertilizer micro dosing UPS across four villages.
Source: Author‘s calculations from Excel
Comparing the results of the indegree centrality (figure 15) of money flows in the tied ridges and
fertilizer micro dosing reveals UPS members at the top of the indegree centrality in Ilolo,
followed by the treasurer in Ilakala and Idifu and the secretary in Changarawe. The treasurer
receives contributions from UPS members for memberships and group registration reason for the
high betweeness in Idifu and the sub-humid region. The allowances received by UPS members
for participating in trainings and meetings is mainly used for refreshments and not for UPS
implementation.
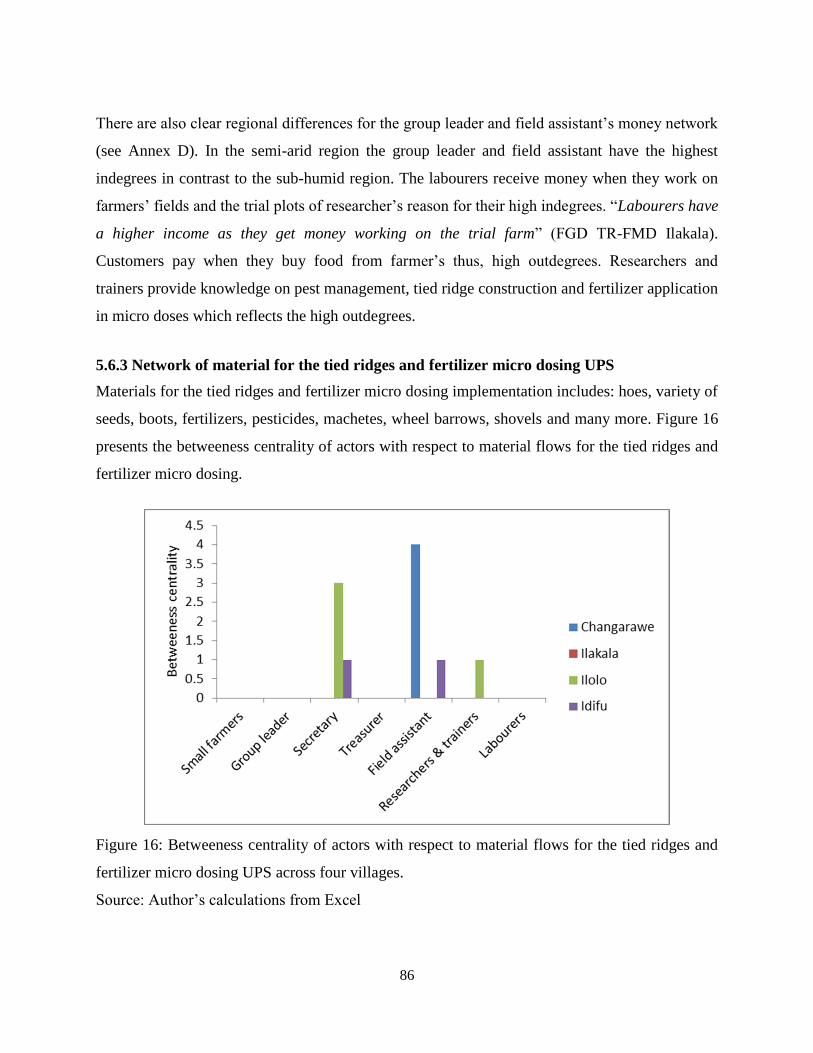
86
There are also clear regional differences for the group leader and field assistant‘s money network
(see Annex D). In the semi-arid region the group leader and field assistant have the highest
indegrees in contrast to the sub-humid region. The labourers receive money when they work on
farmers‘ fields and the trial plots of researcher‘s reason for their high indegrees. ―Labourers have
a higher income as they get money working on the trial farm‖ (FGD TR-FMD Ilakala).
Customers pay when they buy food from farmer‘s thus, high outdegrees. Researchers and
trainers provide knowledge on pest management, tied ridge construction and fertilizer application
in micro doses which reflects the high outdegrees.
5.6.3 Network of material for the tied ridges and fertilizer micro dosing UPS
Materials for the tied ridges and fertilizer micro dosing implementation includes: hoes, variety of
seeds, boots, fertilizers, pesticides, machetes, wheel barrows, shovels and many more. Figure 16
presents the betweeness centrality of actors with respect to material flows for the tied ridges and
fertilizer micro dosing.
Figure 16: Betweeness centrality of actors with respect to material flows for the tied ridges and
fertilizer micro dosing UPS across four villages.
Source: Author‘s calculations from Excel

87
There are regional differences with the small farmers and group leaders in both regions for the
material flows (see Annex E). The small farmers in the sub-humid region have high indegrees
and outdegrees as compared to those in the semi-arid region. The UPS appears more efficient in
the sub-humid region. The sub-humid climate is good for farming and enables farmers to be
more involved in the UPS implementation. They are also not affected by droughts and floods like
in the semi-arid region. In both regions, the customers and village chief have the lowest
indegrees due to their low involvement in the UPS.
The high betweeness centrality of the secretary in the semi-arid region (Idifu and Ilolo) grants
him/her the ability to influence the flow of materials. The secretary receives materials for the
UPS implementation from the treasurer and field assistant and later distributes to the UPS
members. Thus, the secretary controls the material flows in the semi-arid CSS. In Ilakala, there is
no betweeness in the material network meaning no actor has influence on the material flows
which also indicates some sort of equality amongst the UPS members. In Changarawe, the field
assistant controls the materials flows reason for the high betweeness.
5.6.4 Influence of actors for the tied ridges and fertilizer micro dosing implementation
The influential categories for the various actors implementing the tied ridges and fertilizer micro
dosing is displayed in table 16. In order to select the six most influential actors of the tied ridges
and fertilizer micro dosing UPS the average of the importance tower in all the villages was taken
as parameter. The actor with the highest score was then selected.
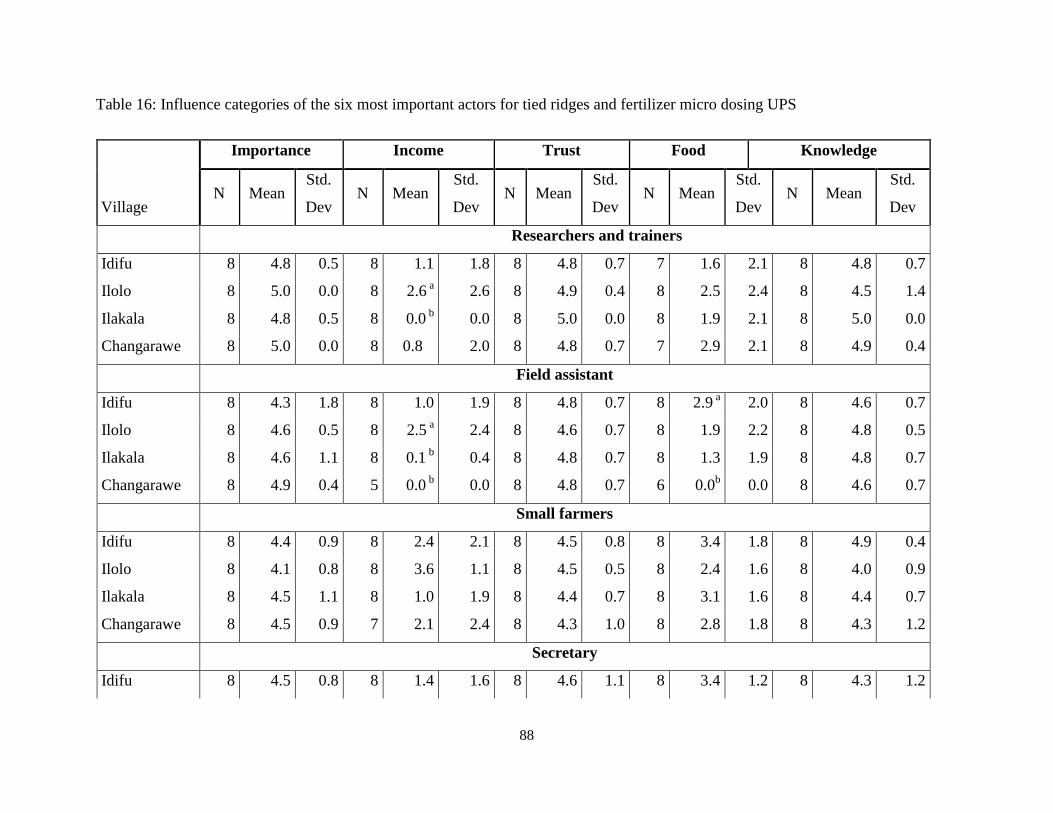
88
Table 16: Influence categories of the six most important actors for tied ridges and fertilizer micro dosing UPS
Importance Income Trust Food Knowledge
Village N Mean
Std.
Dev N Mean
Std.
Dev N Mean
Std.
Dev N Mean
Std.
Dev N Mean
Std.
Dev
Researchers and trainers
Idifu 8 4.8 0.5 8 1.1 1.8 8 4.8 0.7 7 1.6 2.1 8 4.8 0.7
Ilolo 8 5.0 0.0 8 2.6 a 2.6 8 4.9 0.4 8 2.5 2.4 8 4.5 1.4
Ilakala 8 4.8 0.5 8 0.0 b 0.0 8 5.0 0.0 8 1.9 2.1 8 5.0 0.0
Changarawe 8 5.0 0.0 8 0.8 2.0 8 4.8 0.7 7 2.9 2.1 8 4.9 0.4
Field assistant
Idifu 8 4.3 1.8 8 1.0 1.9 8 4.8 0.7 8 2.9 a 2.0 8 4.6 0.7
Ilolo 8 4.6 0.5 8 2.5 a 2.4 8 4.6 0.7 8 1.9 2.2 8 4.8 0.5
Ilakala 8 4.6 1.1 8 0.1 b 0.4 8 4.8 0.7 8 1.3 1.9 8 4.8 0.7
Changarawe 8 4.9 0.4 5 0.0 b 0.0 8 4.8 0.7 6 0.0
b 0.0 8 4.6 0.7
Small farmers
Idifu 8 4.4 0.9 8 2.4 2.1 8 4.5 0.8 8 3.4 1.8 8 4.9 0.4
Ilolo 8 4.1 0.8 8 3.6 1.1 8 4.5 0.5 8 2.4 1.6 8 4.0 0.9
Ilakala 8 4.5 1.1 8 1.0 1.9 8 4.4 0.7 8 3.1 1.6 8 4.4 0.7
Changarawe 8 4.5 0.9 7 2.1 2.4 8 4.3 1.0 8 2.8 1.8 8 4.3 1.2
Secretary
Idifu 8 4.5 0.8 8 1.4 1.6 8 4.6 1.1 8 3.4 1.2 8 4.3 1.2
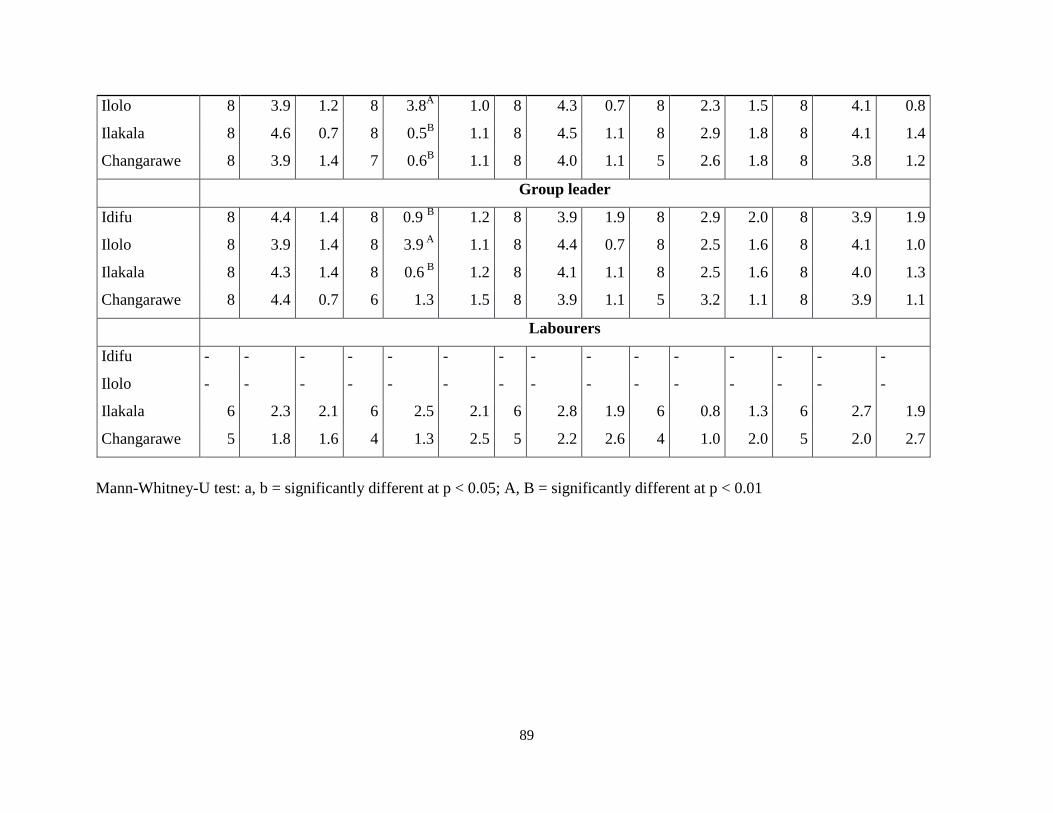
89
Ilolo 8 3.9 1.2 8 3.8A 1.0 8 4.3 0.7 8 2.3 1.5 8 4.1 0.8
Ilakala 8 4.6 0.7 8 0.5B 1.1 8 4.5 1.1 8 2.9 1.8 8 4.1 1.4
Changarawe 8 3.9 1.4 7 0.6B 1.1 8 4.0 1.1 5 2.6 1.8 8 3.8 1.2
Group leader
Idifu 8 4.4 1.4 8 0.9 B 1.2 8 3.9 1.9 8 2.9 2.0 8 3.9 1.9
Ilolo 8 3.9 1.4 8 3.9 A
1.1 8 4.4 0.7 8 2.5 1.6 8 4.1 1.0
Ilakala 8 4.3 1.4 8 0.6 B
1.2 8 4.1 1.1 8 2.5 1.6 8 4.0 1.3
Changarawe 8 4.4 0.7 6 1.3 1.5 8 3.9 1.1 5 3.2 1.1 8 3.9 1.1
Labourers
Idifu - - - - - - - - - - - - - - -
Ilolo - - - - - - - - - - - - - - -
Ilakala 6 2.3 2.1 6 2.5 2.1 6 2.8 1.9 6 0.8 1.3 6 2.7 1.9
Changarawe 5 1.8 1.6 4 1.3 2.5 5 2.2 2.6 4 1.0 2.0 5 2.0 2.7
Mann-Whitney-U test: a, b = significantly different at p < 0.05; A, B = significantly different at p < 0.01
90
In all four villages, respondents identified trust, knowledge and importance as categories with
the most influence by actors in the UPS implementation. The researchers and trainers were
considered the most influential closely followed by the field assistant. The small farmers from all
villages had medium influence. The secretary and treasurer also had average influence scores,
but their high standard deviation illustrates that even though some actors ranked the influence of
their executives high, some did not allocate them much influence. The fifth actor with average
influence was labourers. It is stimulating to see that those who talked about them (in Ilakala and
Changarawe) also assigned them with very high influence scores whereas those in other villages
(Ilolo and Idifu) mentioned that they were not really important and had no influence reason why
they were not included on the map in those villages. Those with the lowest influence scores were
the customers and village chief.
The distribution of income for the group leader in Ilolo (3.9) (p < 0.01) is considered
significantly higher to the distribution of income in Idifu (0.9) (p < 0.01) and Ilakala (0.6) (p <
0.01) indicating that he has more tied ridges, harvests more food and sells the surplus. The
distribution of income for the researchers and trainers in Ilolo (2.6) (p < 0.05) is considered
significantly higher to the distribution of income in Ilakala (0.0) (p < 0.05). The researchers and
trainers provide funding and inputs for the UPS implementation. They also want the small
farmers to have a proper mastery of the technology in order to improve their food security.
Similarly, there are significant differences for the secretary‘s influence on income in Ilolo (3.8)
(p < 0.01) and Ilakala (0.5) (p < 0.01) and between Ilolo (3.8) (p < 0.01) and Changarawe (0.6)
(p < 0.01). This indicates that the secretary sees the technology promising for improving food
security, is able to construct more tied ridges, has a better mastery of fertilizer application and is
able to market some of his vegetables.
The distribution of income for the field assistant in Ilolo (2.5) (p < 0.05) is significantly higher to
the distribution of income in Changarawe (0.0) (p < 0.05) and Ilakala (0.1) (p < 0.05), possibly
because the UPS members are still highly dependent on him for inputs for the UPS
implementation. Furthermore, the distribution of food for the field assistant in Idifu (2.9) is
significantly higher (p < 0.05) to the distribution of food in Changarawe (0.0), indicating that he
harvests more food from the tied ridges. Farmers in Ilakala are not yet selling their crops reason
91
for the low influence on income with an average of 1.0. In Ilakala and Changarawe, labourers are
highly influenced for more knowledge and trust reason why they are always called up to
construct the tied ridges. This has also led to better earnings for them.
As we can observe, actors in the semi-arid region have a higher influence on income in contrast
to the actors in the sub-humid region.
5.6.5 Motivations for actors for the tied ridges and fertilizer micro dosing UPS
Table 17 shows actors motivations for implementing the tied ridges and fertilizer micro dosing
UPS across four villages. In the semi-arid region, enhancing food availability, more knowledge
and more joy followed by more income and better social relations are important motivations
among most actors in contrast to the sub-humid region. Enhancing food availability in the semi-
arid region is very important due to the severe food scarcity in the region (figures 17 and 18). „
For this year food is enough but for last year it was not enough due to the sun as it was too
sunny so the crops dried up‖ (F4 TR-FM Ilolo).
Acquired technological knowledge helps UPS members upgrade their farming skills. „We used
to have problems of getting food but now the situation has improved thanks to the tied ridges
technology‖ (F2 TR-FMD Ilakala). When farmers have a better harvest, they are well respected
amongst their peers. Furthermore, it means they have a better mastery of the technology. A
farmer in Ilakala said: „ The modern farming simplifies work and takes short time; in modern
farming we use a small plot to get so much harvest”. Labourers are sometimes hired to construct
tied ridges thus are motivated for more income, enhancing food availability and better social
relations. The social relations they‘ve created with farmers, researchers and trainers enables
them to be called up when their services are needed for tied ridges construction.
We also find significant differences for more knowledge for the group leader in Ilakala (1.0) (p <
0.05) and Changarawe (0.4) (p < 0.05), possibly because of better upgraded farming skills. The
distribution of more joy for the researchers and trainers in Ilolo (0.6) (p < 0.05) is significantly
higher than Idifu (0.5) (p < 0.05).

92
Table 17: Motivations for important actors implementing tied ridges and fertilizer micro dosing UPS across two regions
More income Enhancing food
availability More Joy
Better social
relations More knowledge
Village N Mean
Std.
Dev N Mean
Std.
Dev N Mean
Std.
Dev N Mean
Std.
Dev N Mean
Std.
Dev
Researchers and trainers
Idifu 8 0.3 0.5 8 0.4 0.5 8 0.5 b 0.5 8 0.5 0.5 8 0.6 0.5
Ilolo 8 0.3 0.5 8 0.1 0.4 8 0.6 a 0.5 8 0.6 0.5 8 0.3 0.5
Ilakala 8 0.3 0.5 8 0.5 0.5 8 0.0 0.0 8 0.5 0.5 8 0.9 0.4
Changarawe 8 0.6 0.5 8 0.5 0.5 8 0.1 0.4 8 0.4 0.5 8 0.6 0.5
Field assistant
Idifu 8 0.3 0.5 8 0.4 0.5 8 0.5 0.5 8 0.5 0.5 8 0.6 0.5
Ilolo 8 0.1 0.4 8 0.3 0.5 8 0.3 0.5 8 0.3 0.5 8 0.6 0.5
Ilakala 8 0.3 0.5 8 0.3 0.5 8 0.3 0.5 8 0.8 0.5 8 0.6 0.5
Changarawe 8 0.4 0.5 8 0.6 0.5 8 0.3 0.5 8 0.4 0.5 8 0.4 0.5
Small farmers
Idifu 8 0.5 0.5 8 0.6 0.5 8 0.5 0.5 8 0.4 0.5 8 0.5 0.5
Ilolo 8 0.4 0.5 8 0.9 0.4 8 0.5 0.5 8 0.4 0.5 8 0.6 0.5
Ilakala 8 0.4 0.5 8 0.8 0.5 8 0.3 0.5 8 0.4 0.5 8 0.6 0.5
Changarawe 8 0.6 0.5 8 0.8 0.5 8 0.1 0.4 8 0.5 0.5 8 0.6 0.5
Secretary
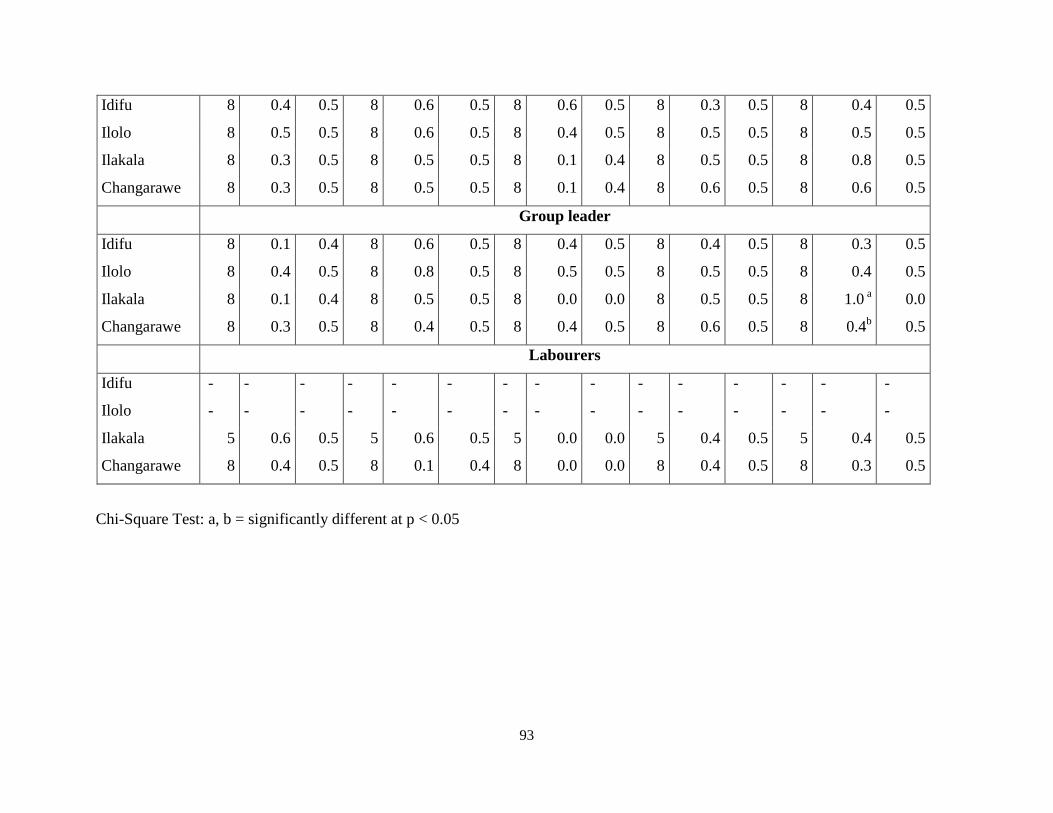
93
Idifu 8 0.4 0.5 8 0.6 0.5 8 0.6 0.5 8 0.3 0.5 8 0.4 0.5
Ilolo 8 0.5 0.5 8 0.6 0.5 8 0.4 0.5 8 0.5 0.5 8 0.5 0.5
Ilakala 8 0.3 0.5 8 0.5 0.5 8 0.1 0.4 8 0.5 0.5 8 0.8 0.5
Changarawe 8 0.3 0.5 8 0.5 0.5 8 0.1 0.4 8 0.6 0.5 8 0.6 0.5
Group leader
Idifu 8 0.1 0.4 8 0.6 0.5 8 0.4 0.5 8 0.4 0.5 8 0.3 0.5
Ilolo 8 0.4 0.5 8 0.8 0.5 8 0.5 0.5 8 0.5 0.5 8 0.4 0.5
Ilakala 8 0.1 0.4 8 0.5 0.5 8 0.0 0.0 8 0.5 0.5 8 1.0 a 0.0
Changarawe 8 0.3 0.5 8 0.4 0.5 8 0.4 0.5 8 0.6 0.5 8 0.4b 0.5
Labourers
Idifu - - - - - - - - - - - - - - -
Ilolo - - - - - - - - - - - - - - -
Ilakala 5 0.6 0.5 5 0.6 0.5 5 0.0 0.0 5 0.4 0.5 5 0.4 0.5
Changarawe 8 0.4 0.5 8 0.1 0.4 8 0.0 0.0 8 0.4 0.5 8 0.3 0.5
Chi-Square Test: a, b = significantly different at p < 0.05
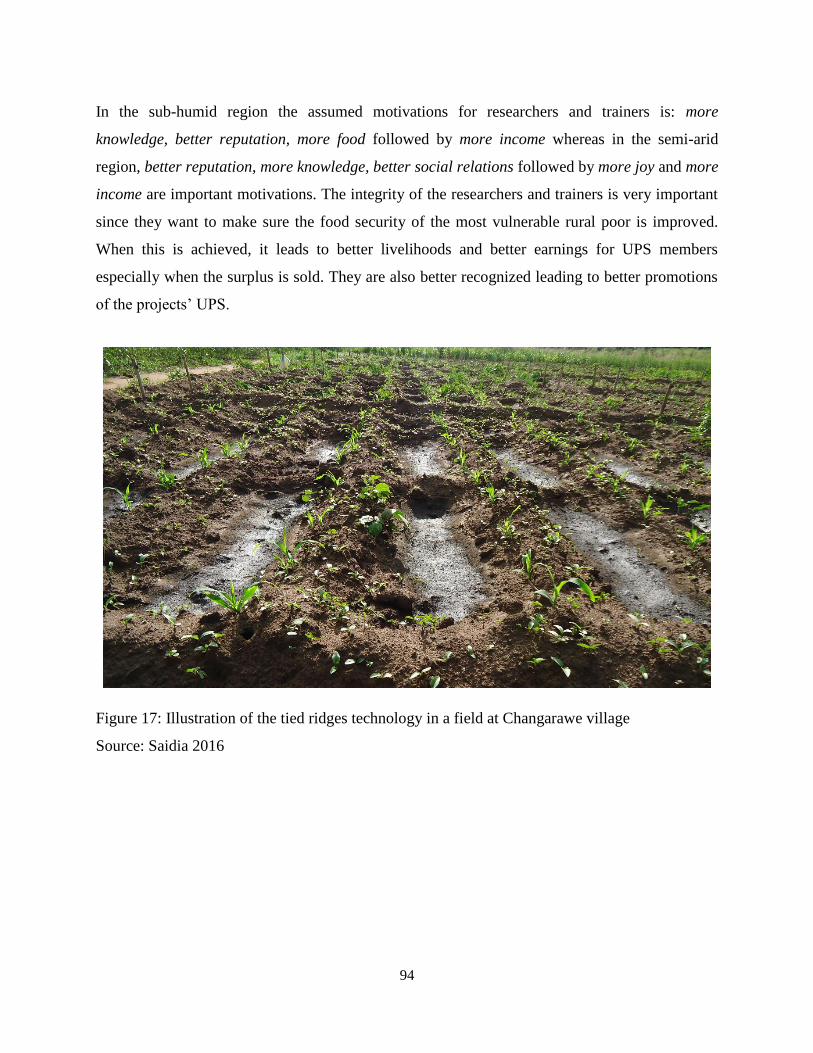
94
In the sub-humid region the assumed motivations for researchers and trainers is: more
knowledge, better reputation, more food followed by more income whereas in the semi-arid
region, better reputation, more knowledge, better social relations followed by more joy and more
income are important motivations. The integrity of the researchers and trainers is very important
since they want to make sure the food security of the most vulnerable rural poor is improved.
When this is achieved, it leads to better livelihoods and better earnings for UPS members
especially when the surplus is sold. They are also better recognized leading to better promotions
of the projects‘ UPS.
Figure 17: Illustration of the tied ridges technology in a field at Changarawe village
Source: Saidia 2016
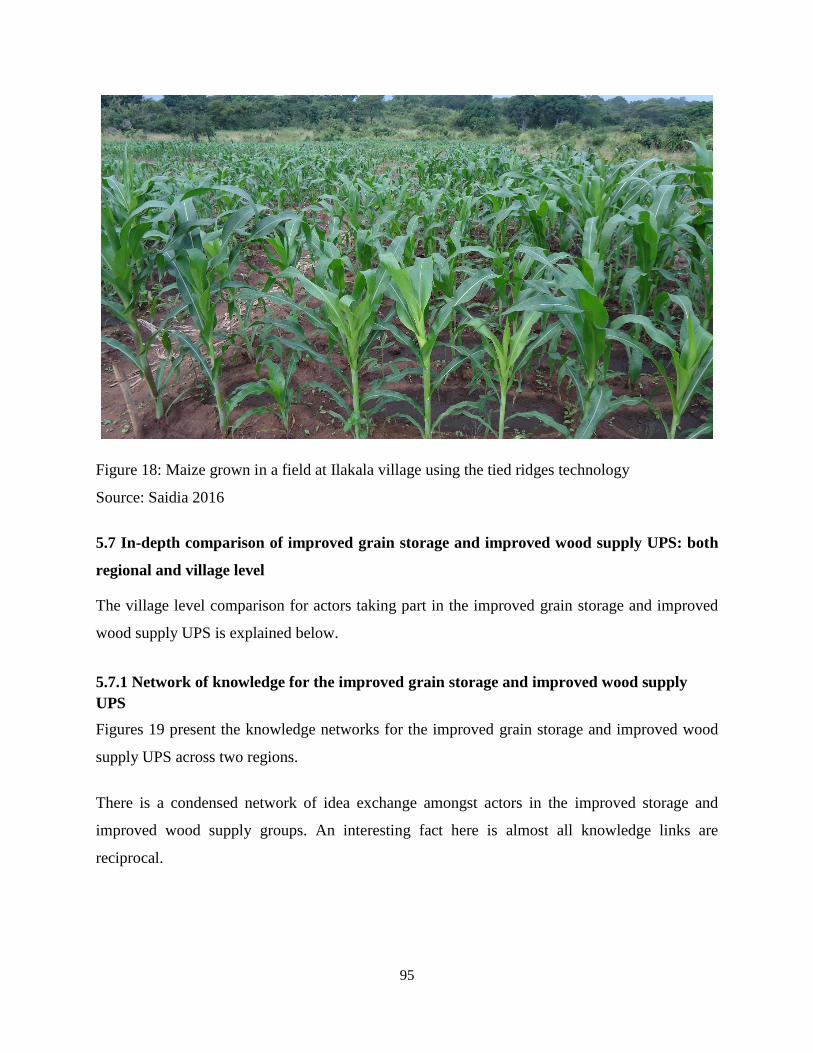
95
Figure 18: Maize grown in a field at Ilakala village using the tied ridges technology
Source: Saidia 2016
5.7 In-depth comparison of improved grain storage and improved wood supply UPS: both
regional and village level
The village level comparison for actors taking part in the improved grain storage and improved
wood supply UPS is explained below.
5.7.1 Network of knowledge for the improved grain storage and improved wood supply
UPS
Figures 19 present the knowledge networks for the improved grain storage and improved wood
supply UPS across two regions.
There is a condensed network of idea exchange amongst actors in the improved storage and
improved wood supply groups. An interesting fact here is almost all knowledge links are
reciprocal.

96
Figure 19: Knowledge network map for improved grain storage and improved wood supply UPS
Source: Author‗s calculations from Net-Map data, analysis with UCINet, and visualizations with
Gephi software.
Note: Arrow thickness depicts how often the actor was mentioned from the participant‘s
perspective.
Improved grain storage UPS: Exchange of information included; how to double pack the bags,
how to properly use the plugs on the bags and many more. The researchers and trainers in the
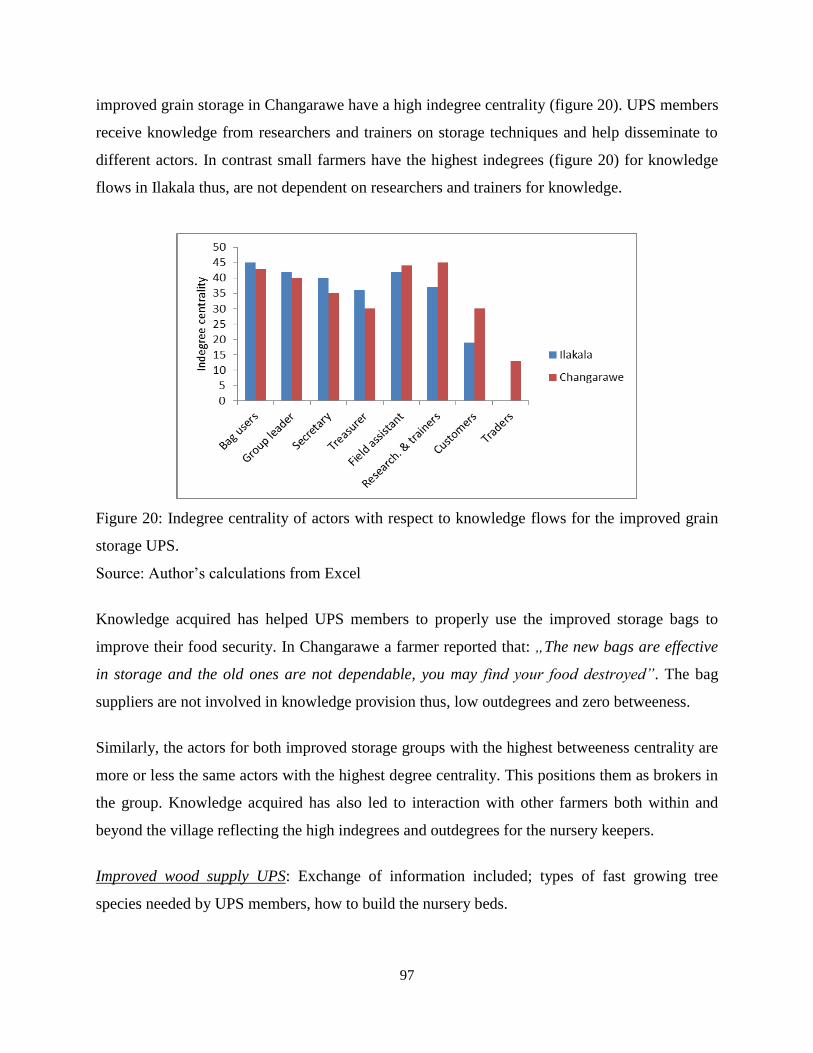
97
improved grain storage in Changarawe have a high indegree centrality (figure 20). UPS members
receive knowledge from researchers and trainers on storage techniques and help disseminate to
different actors. In contrast small farmers have the highest indegrees (figure 20) for knowledge
flows in Ilakala thus, are not dependent on researchers and trainers for knowledge.
Figure 20: Indegree centrality of actors with respect to knowledge flows for the improved grain
storage UPS.
Source: Author‘s calculations from Excel
Knowledge acquired has helped UPS members to properly use the improved storage bags to
improve their food security. In Changarawe a farmer reported that: „The new bags are effective
in storage and the old ones are not dependable, you may find your food destroyed”. The bag
suppliers are not involved in knowledge provision thus, low outdegrees and zero betweeness.
Similarly, the actors for both improved storage groups with the highest betweeness centrality are
more or less the same actors with the highest degree centrality. This positions them as brokers in
the group. Knowledge acquired has also led to interaction with other farmers both within and
beyond the village reflecting the high indegrees and outdegrees for the nursery keepers.
Improved wood supply UPS: Exchange of information included; types of fast growing tree
species needed by UPS members, how to build the nursery beds.

98
The nursery keepers, researchers, trainers and tree providers have the highest betweeness (figure
21) thus, are brokers in the improved wood supply UPS group. Customers are less involved in
tree planting since it is at its early stages of implementation thus, low betweeness. Due to
effectiveness of the OMOS and IWS UPS, it has led to new adopters in the UPS groups. A
farmer in Changarawe reported: „After we used the improved storage bags and saw how effective
they were we started telling other people”.
Figure 21: Degree centrality of actors with respect to knowledge flows for the improved wood
supply UPS
Source: Author‘s calculations from Excel
5.7.2 Network of money for the improved grain storage and improved wood supply UPS
Figure 22 illustrates the indegree centrality for the money network for the improved grain storage
UPS and figure 23 illustrates the degree centrality for the money network for the improved wood
supply UPS.
Improved grain storage UPS: The field assistant is at the top of the indegrees for money flows
for both improved storage groups. Thus, UPS members are still highly dependent on him (see
Annex F). In the absence of researchers and trainers, the field assistant receives allowances for
group meetings and trainings.
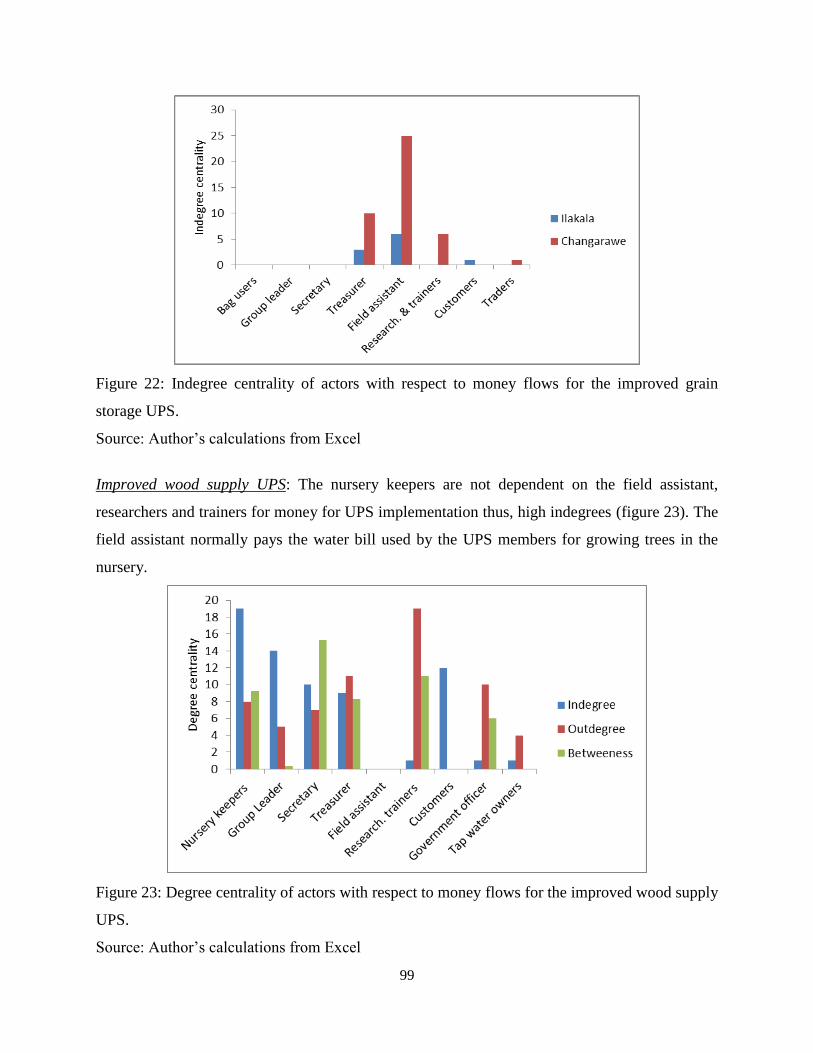
99
Figure 22: Indegree centrality of actors with respect to money flows for the improved grain
storage UPS.
Source: Author‘s calculations from Excel
Improved wood supply UPS: The nursery keepers are not dependent on the field assistant,
researchers and trainers for money for UPS implementation thus, high indegrees (figure 23). The
field assistant normally pays the water bill used by the UPS members for growing trees in the
nursery.
Figure 23: Degree centrality of actors with respect to money flows for the improved wood supply
UPS.
Source: Author‘s calculations from Excel

100
5.7.3 Network of material for the improved gran storage and improved wood supply UPS
Materials for the improved storage include; improved storage bags, plugs for tying the bags and
many more. Improved wood supply materials include; seeds, watering cans, fertilizer, pesticides
and many more.
Improved grain storage UPS: In both villages of the improved grain storage, the field assistant is
at the top of the betweeness centrality. UPS members in Changarawe are still highly dependent
on the field assistant for material provision (figure 24 and see Annex G). In contrast in Ilakala,
UPS members are less dependent on the field assistant for material provision.
Figure 24: Betweeness centrality of actors with respect to material flows for the improved grain
storage UPS.
Source: Author‘s calculations from Excel
Improved wood supply UPS: The group leader (figure 25) is the most influential for the material
flows (high betweeness). Thus, he is the main distributor of materials in the absence of the field
assistant, researchers and trainers. As it can be observed, high betweeness centrality of most
actors is perceived to be the most influence with respect to the UPS implementation. The central
provider of seeds for the improved wood supply UPS group is the World Agroforestry Centre
(ICRAF).
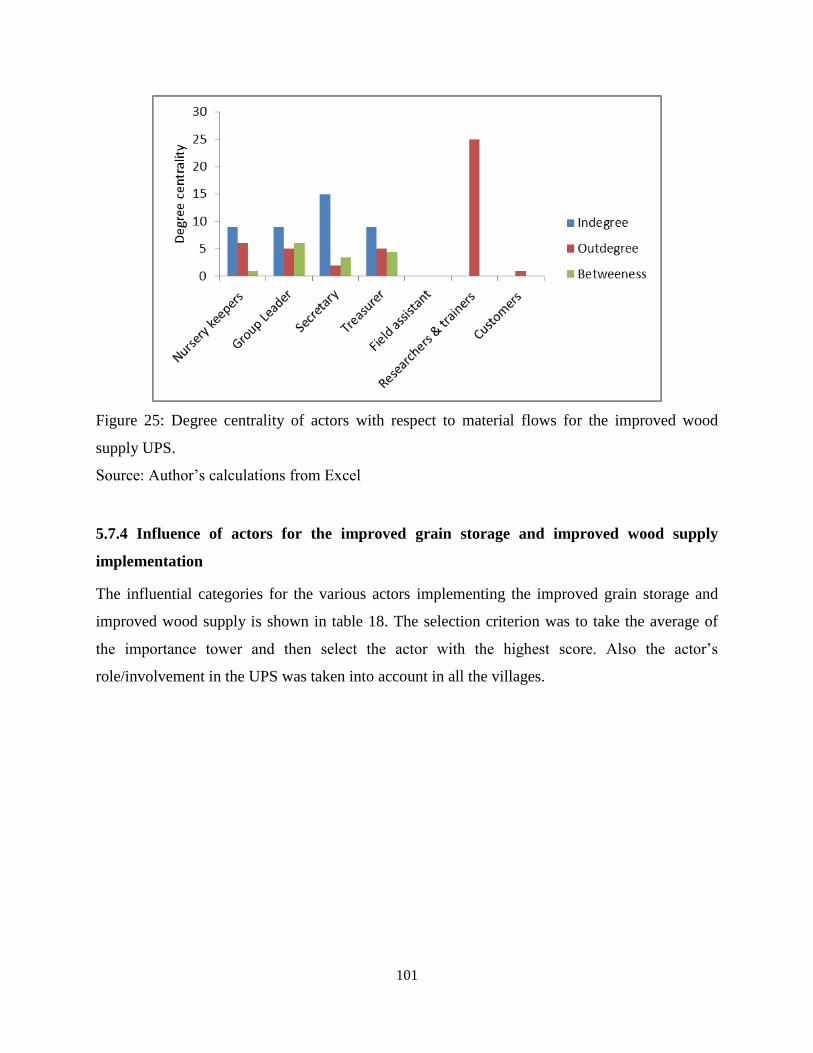
101
Figure 25: Degree centrality of actors with respect to material flows for the improved wood
supply UPS.
Source: Author‘s calculations from Excel
5.7.4 Influence of actors for the improved grain storage and improved wood supply
implementation
The influential categories for the various actors implementing the improved grain storage and
improved wood supply is shown in table 18. The selection criterion was to take the average of
the importance tower and then select the actor with the highest score. Also the actor‘s
role/involvement in the UPS was taken into account in all the villages.
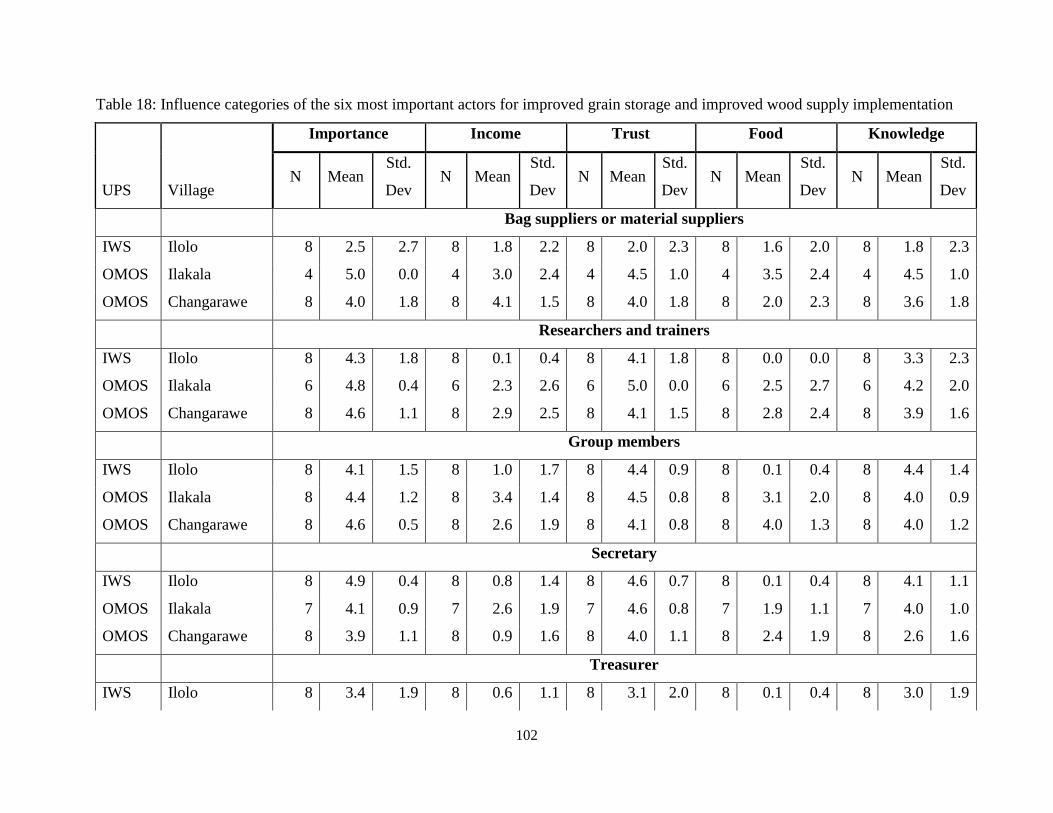
102
Table 18: Influence categories of the six most important actors for improved grain storage and improved wood supply implementation
Importance Income Trust Food Knowledge
UPS Village N Mean
Std.
Dev N Mean
Std.
Dev N Mean
Std.
Dev N Mean
Std.
Dev N Mean
Std.
Dev
Bag suppliers or material suppliers
IWS Ilolo 8 2.5 2.7 8 1.8 2.2 8 2.0 2.3 8 1.6 2.0 8 1.8 2.3
OMOS Ilakala 4 5.0 0.0 4 3.0 2.4 4 4.5 1.0 4 3.5 2.4 4 4.5 1.0
OMOS Changarawe 8 4.0 1.8 8 4.1 1.5 8 4.0 1.8 8 2.0 2.3 8 3.6 1.8
Researchers and trainers
IWS Ilolo 8 4.3 1.8 8 0.1 0.4 8 4.1 1.8 8 0.0 0.0 8 3.3 2.3
OMOS Ilakala 6 4.8 0.4 6 2.3 2.6 6 5.0 0.0 6 2.5 2.7 6 4.2 2.0
OMOS Changarawe 8 4.6 1.1 8 2.9 2.5 8 4.1 1.5 8 2.8 2.4 8 3.9 1.6
Group members
IWS Ilolo 8 4.1 1.5 8 1.0 1.7 8 4.4 0.9 8 0.1 0.4 8 4.4 1.4
OMOS Ilakala 8 4.4 1.2 8 3.4 1.4 8 4.5 0.8 8 3.1 2.0 8 4.0 0.9
OMOS Changarawe 8 4.6 0.5 8 2.6 1.9 8 4.1 0.8 8 4.0 1.3 8 4.0 1.2
Secretary
IWS Ilolo 8 4.9 0.4 8 0.8 1.4 8 4.6 0.7 8 0.1 0.4 8 4.1 1.1
OMOS Ilakala 7 4.1 0.9 7 2.6 1.9 7 4.6 0.8 7 1.9 1.1 7 4.0 1.0
OMOS Changarawe 8 3.9 1.1 8 0.9 1.6 8 4.0 1.1 8 2.4 1.9 8 2.6 1.6
Treasurer
IWS Ilolo 8 3.4 1.9 8 0.6 1.1 8 3.1 2.0 8 0.1 0.4 8 3.0 1.9
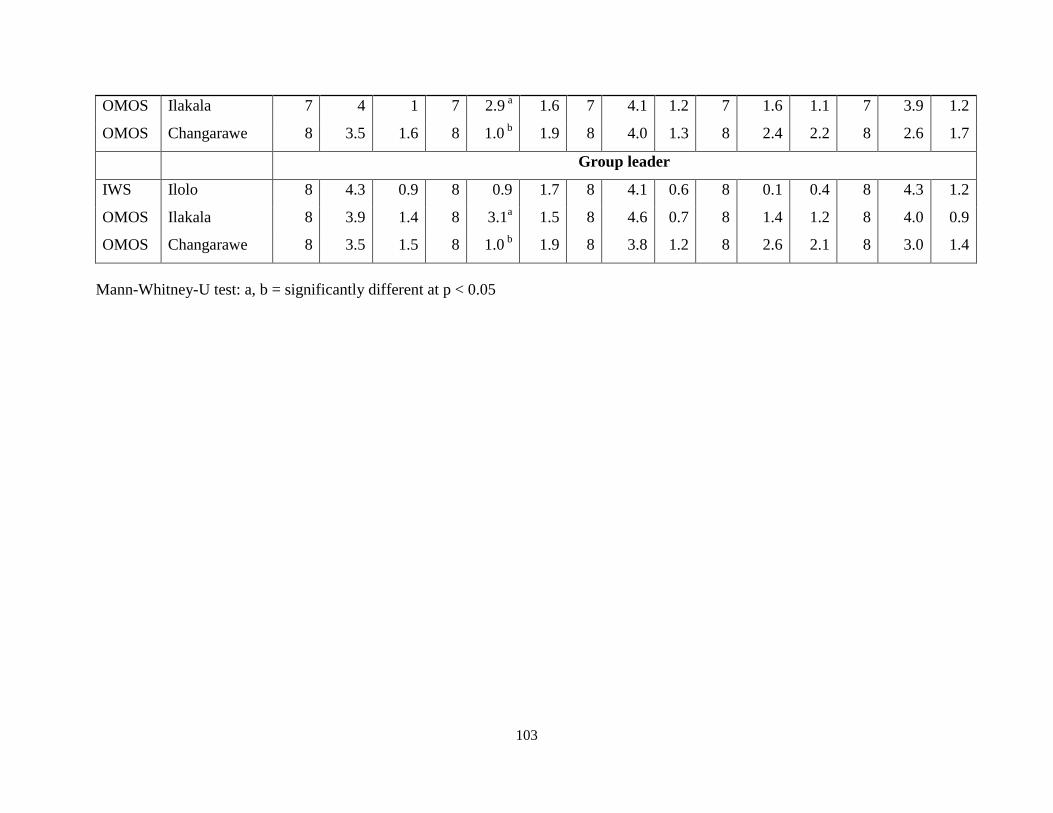
103
OMOS Ilakala 7 4 1 7 2.9 a 1.6 7 4.1 1.2 7 1.6 1.1 7 3.9 1.2
OMOS Changarawe 8 3.5 1.6 8 1.0 b 1.9 8 4.0 1.3 8 2.4 2.2 8 2.6 1.7
Group leader
IWS Ilolo 8 4.3 0.9 8 0.9 1.7 8 4.1 0.6 8 0.1 0.4 8 4.3 1.2
OMOS Ilakala 8 3.9 1.4 8 3.1a 1.5 8 4.6 0.7 8 1.4 1.2 8 4.0 0.9
OMOS Changarawe 8 3.5 1.5 8 1.0 b 1.9 8 3.8 1.2 8 2.6 2.1 8 3.0 1.4
Mann-Whitney-U test: a, b = significantly different at p < 0.05
104
Improved grain storage UPS: The bag suppliers were rated extremely influential and the
moderately low standard deviation demonstrates that almost all UPS actors approved of it. The
next influential actor was the researchers and trainers. This was highly agreed by the UPS
member‘s reason being that without them they wouldn‘t know about the technology. The field
assistant and small farmers have medium influence. The high standard deviation of the last two
(secretary and treasurer) is because they were not talked about often but some UPS members
thought they were highly influential. Bag suppliers are involved in the retail of the improved
storage bags reason for their high influence on income especially in Changarawe.
Furthermore, the distribution of income for the group leader in Ilakala (3.1) (p < 0.05) is
considered significantly higher to the distribution of income in Changarawe (1.0) (p < 0.05)
indicating that he sells more of his produce from the storage bags during the off-season. Also,
there are significant differences (p < 0.05) in rated income for the treasurers in Ilakala and
Changarawe.
All in all, actors of the improved storage UPS in both villages (Ilakala and Changarawe) cited
trust and knowledge as the most influential categories.
Improved wood supply UPS: The secretary was the actor with the most influence with esteem to
importance and trust and most interviewees approved of it due to his high involvement in the
UPS. The secretary is followed by the material suppliers who are the providers of materials
(seeds, watering can, pesticides and many more) for UPS implementation. However, their
influence was disputed denoting that some UPS members offered high scores despite the fact
others offered low scores.
This dissimilarity is mirrored in the high standard deviation for food and income. In contrast
customers have no influence on wood supply thus, were not mentioned. The nursery keepers
were assigned a high influence on knowledge because they are learning quite a lot from it. They
are also highly trust worthy. The nursery keepers are able to profit from the sale of trees from the
nursery and thus, are able to get more food for their families. An UPS member in Ilolo
mentioned: „I took some seeds and planted at home and they grew so people came and choose
some trees and I sold 50 trees to them”.
105
From the results; the respondents identified knowledge, trust and income as categories with the
most influence by actors for the improved wood supply UPS.
5.7.5 Motivations for actors for the improved grain storage and improved wood supply
UPS
The motivations for taking part in the improved grain storage and improved wood supply is
presented in table 19.
Improved grain storage UPS: The UPS members in both UPS groups (in Changarawe and
Ilakala) of the improved storage have more income, enhancing food availability, more joy
followed by more knowledge and better social relations as major motivations.
The assumed motivations for researchers and trainers involved in the improved storage is: more
knowledge, more income and better social relations followed by more joy. They are main
knowledge providers and are found joyful when carrying out workshops, educating them and by
so doing create better relations with the UPS members. More income was a wrongly assumed
motivation. Researchers buy and provide inputs for the UPS implementation but don‘t receive
any profit.
The highest ranked motivations for the secretary in the improved storage group in Changarawe is
better reputation, more knowledge, better social relations followed by more joy whereas the
secretary in Ilakala have enhancing food availability, more income and better social relations as
important motivations. The integrity of the secretary is very important in terms of record keeping
and taking minutes during meetings. The secretary and treasurer‘s motivation for enhancing food
availability in Ilakala is significantly higher (p < 0.05) to Changarawe assuming that they have
more storage bags and store more food.
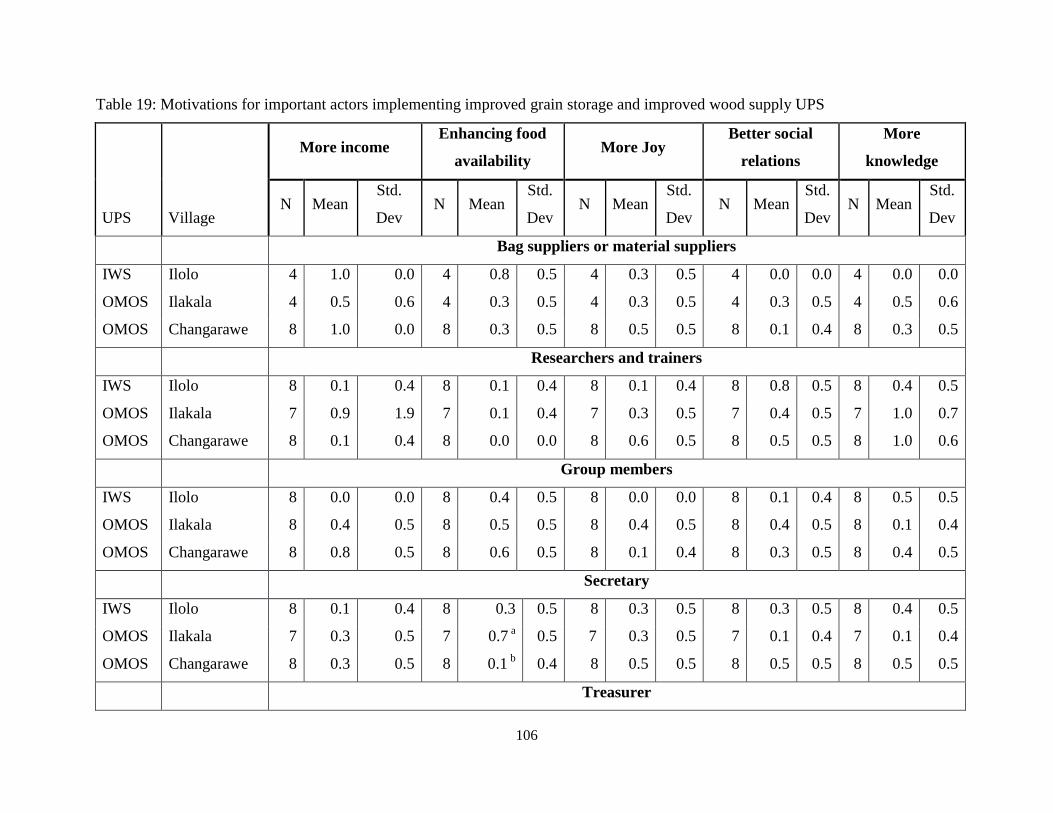
106
Table 19: Motivations for important actors implementing improved grain storage and improved wood supply UPS
More income Enhancing food
availability More Joy
Better social
relations
More
knowledge
UPS Village N Mean
Std.
Dev N Mean
Std.
Dev N Mean
Std.
Dev N Mean
Std.
Dev N Mean
Std.
Dev
Bag suppliers or material suppliers
IWS Ilolo 4 1.0 0.0 4 0.8 0.5 4 0.3 0.5 4 0.0 0.0 4 0.0 0.0
OMOS Ilakala 4 0.5 0.6 4 0.3 0.5 4 0.3 0.5 4 0.3 0.5 4 0.5 0.6
OMOS Changarawe 8 1.0 0.0 8 0.3 0.5 8 0.5 0.5 8 0.1 0.4 8 0.3 0.5
Researchers and trainers
IWS Ilolo 8 0.1 0.4 8 0.1 0.4 8 0.1 0.4 8 0.8 0.5 8 0.4 0.5
OMOS Ilakala 7 0.9 1.9 7 0.1 0.4 7 0.3 0.5 7 0.4 0.5 7 1.0 0.7
OMOS Changarawe 8 0.1 0.4 8 0.0 0.0 8 0.6 0.5 8 0.5 0.5 8 1.0 0.6
Group members
IWS Ilolo 8 0.0 0.0 8 0.4 0.5 8 0.0 0.0 8 0.1 0.4 8 0.5 0.5
OMOS Ilakala 8 0.4 0.5 8 0.5 0.5 8 0.4 0.5 8 0.4 0.5 8 0.1 0.4
OMOS Changarawe 8 0.8 0.5 8 0.6 0.5 8 0.1 0.4 8 0.3 0.5 8 0.4 0.5
Secretary
IWS Ilolo 8 0.1 0.4 8 0.3 0.5 8 0.3 0.5 8 0.3 0.5 8 0.4 0.5
OMOS Ilakala 7 0.3 0.5 7 0.7 a 0.5 7 0.3 0.5 7 0.1 0.4 7 0.1 0.4
OMOS Changarawe 8 0.3 0.5 8 0.1 b 0.4 8 0.5 0.5 8 0.5 0.5 8 0.5 0.5
Treasurer
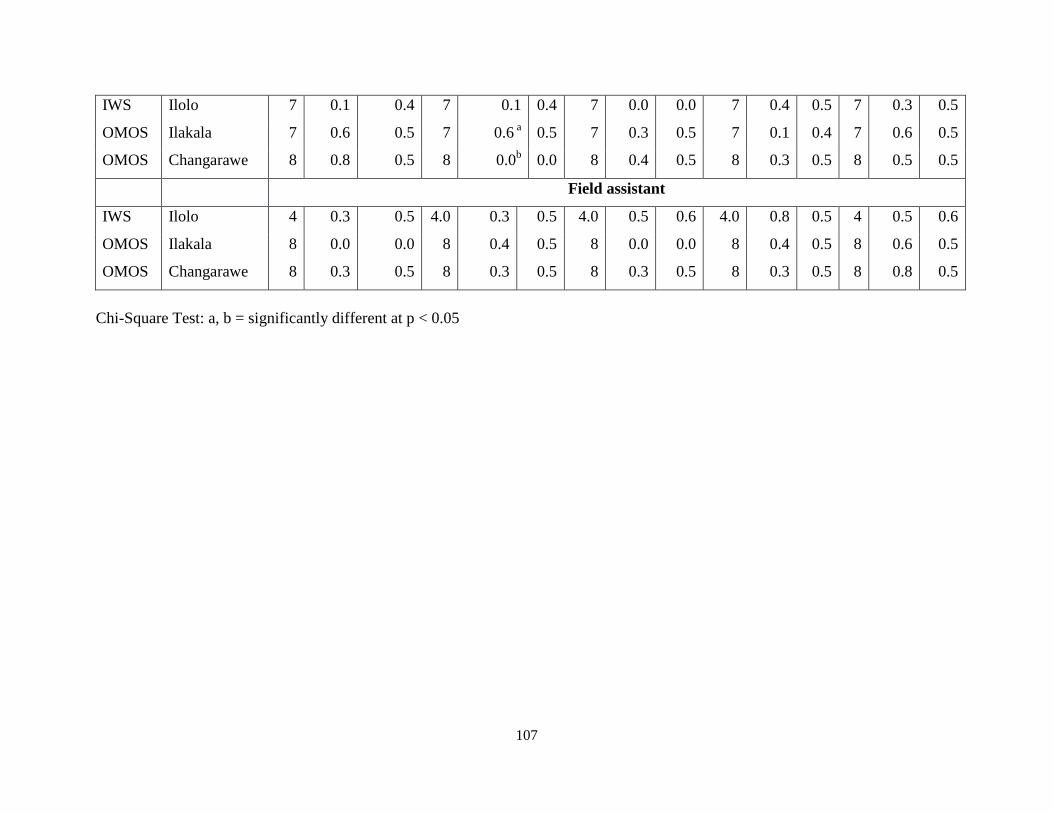
107
IWS Ilolo 7 0.1 0.4 7 0.1 0.4 7 0.0 0.0 7 0.4 0.5 7 0.3 0.5
OMOS Ilakala 7 0.6 0.5 7 0.6 a 0.5 7 0.3 0.5 7 0.1 0.4 7 0.6 0.5
OMOS Changarawe 8 0.8 0.5 8 0.0b 0.0 8 0.4 0.5 8 0.3 0.5 8 0.5 0.5
Field assistant
IWS Ilolo 4 0.3 0.5 4.0 0.3 0.5 4.0 0.5 0.6 4.0 0.8 0.5 4 0.5 0.6
OMOS Ilakala 8 0.0 0.0 8 0.4 0.5 8 0.0 0.0 8 0.4 0.5 8 0.6 0.5
OMOS Changarawe 8 0.3 0.5 8 0.3 0.5 8 0.3 0.5 8 0.3 0.5 8 0.8 0.5
Chi-Square Test: a, b = significantly different at p < 0.05
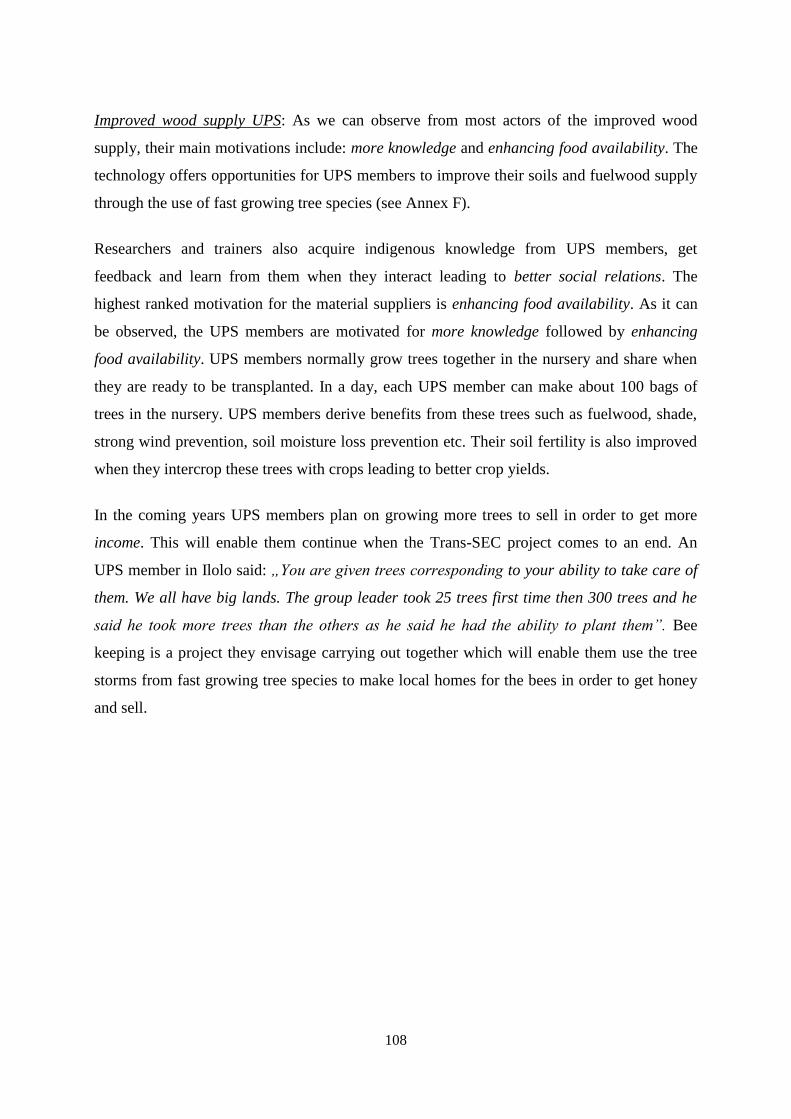
108
Improved wood supply UPS: As we can observe from most actors of the improved wood
supply, their main motivations include: more knowledge and enhancing food availability. The
technology offers opportunities for UPS members to improve their soils and fuelwood supply
through the use of fast growing tree species (see Annex F).
Researchers and trainers also acquire indigenous knowledge from UPS members, get
feedback and learn from them when they interact leading to better social relations. The
highest ranked motivation for the material suppliers is enhancing food availability. As it can
be observed, the UPS members are motivated for more knowledge followed by enhancing
food availability. UPS members normally grow trees together in the nursery and share when
they are ready to be transplanted. In a day, each UPS member can make about 100 bags of
trees in the nursery. UPS members derive benefits from these trees such as fuelwood, shade,
strong wind prevention, soil moisture loss prevention etc. Their soil fertility is also improved
when they intercrop these trees with crops leading to better crop yields.
In the coming years UPS members plan on growing more trees to sell in order to get more
income. This will enable them continue when the Trans-SEC project comes to an end. An
UPS member in Ilolo said: „You are given trees corresponding to your ability to take care of
them. We all have big lands. The group leader took 25 trees first time then 300 trees and he
said he took more trees than the others as he said he had the ability to plant them”. Bee
keeping is a project they envisage carrying out together which will enable them use the tree
storms from fast growing tree species to make local homes for the bees in order to get honey
and sell.
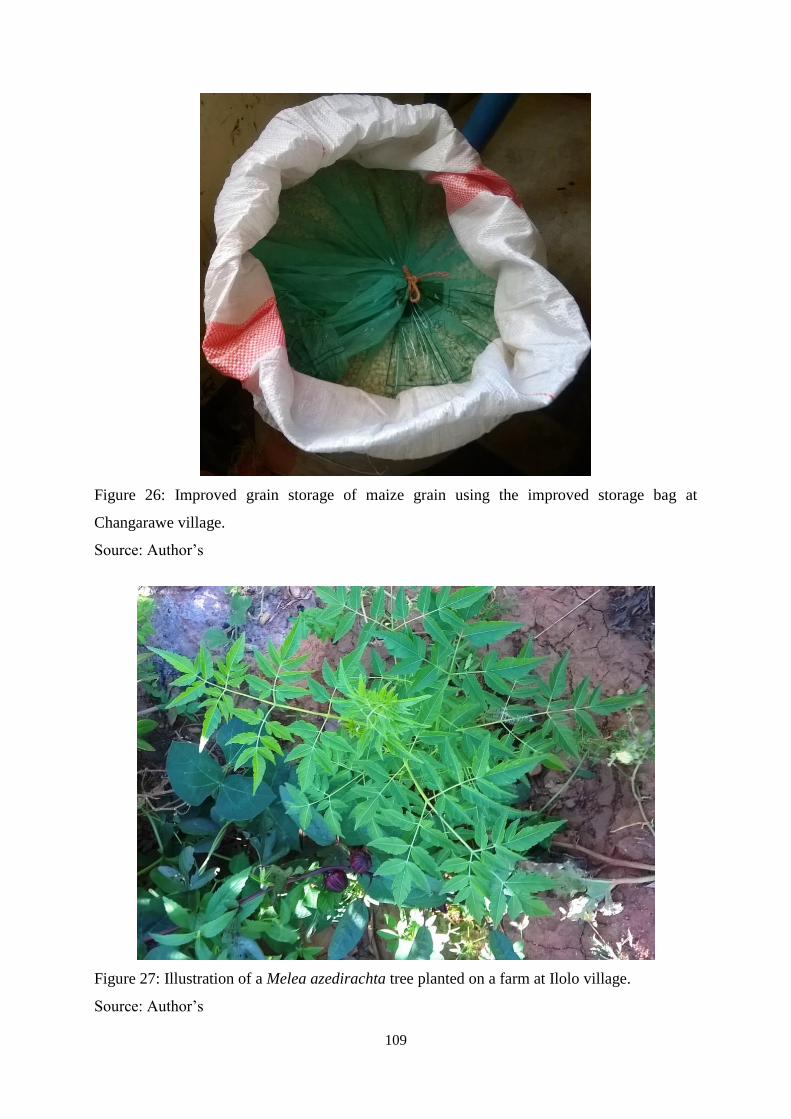
109
Figure 26: Improved grain storage of maize grain using the improved storage bag at
Changarawe village.
Source: Author‘s
Figure 27: Illustration of a Melea azedirachta tree planted on a farm at Ilolo village.
Source: Author‘s
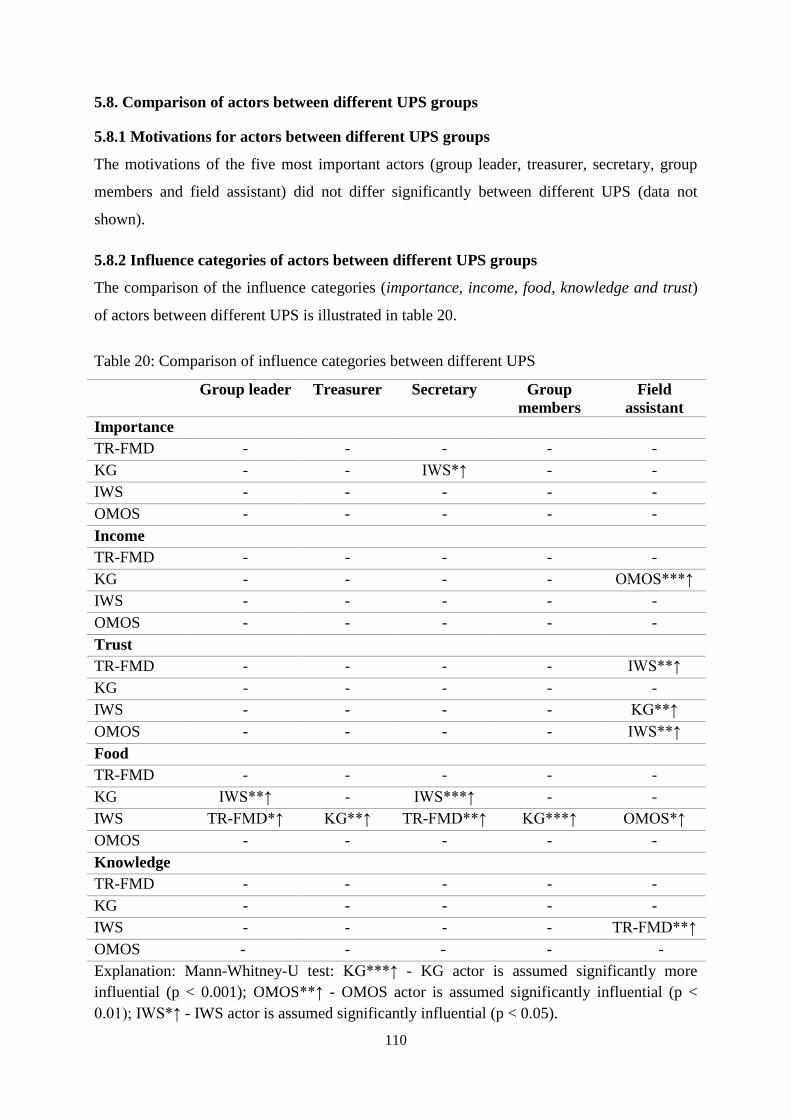
110
5.8. Comparison of actors between different UPS groups
5.8.1 Motivations for actors between different UPS groups
The motivations of the five most important actors (group leader, treasurer, secretary, group
members and field assistant) did not differ significantly between different UPS (data not
shown).
5.8.2 Influence categories of actors between different UPS groups
The comparison of the influence categories (importance, income, food, knowledge and trust)
of actors between different UPS is illustrated in table 20.
Table 20: Comparison of influence categories between different UPS
Group leader Treasurer Secretary Group
members
Field
assistant
Importance
TR-FMD - - - - -
KG - - IWS*↑ - -
IWS - - - - -
OMOS - - - - -
Income
TR-FMD - - - - -
KG - - - - OMOS***↑
IWS - - - - -
OMOS - - - - -
Trust
TR-FMD - - - - IWS**↑
KG - - - - -
IWS - - - - KG**↑
OMOS - - - - IWS**↑
Food
TR-FMD - - - - -
KG IWS**↑ - IWS***↑ - -
IWS TR-FMD*↑ KG**↑ TR-FMD**↑ KG***↑ OMOS*↑
OMOS - - - - -
Knowledge
TR-FMD - - - - -
KG - - - - -
IWS - - - - TR-FMD**↑
OMOS - - - - -
Explanation: Mann-Whitney-U test: KG***↑ - KG actor is assumed significantly more
influential (p < 0.001); OMOS**↑ - OMOS actor is assumed significantly influential (p <
0.01); IWS*↑ - IWS actor is assumed significantly influential (p < 0.05).
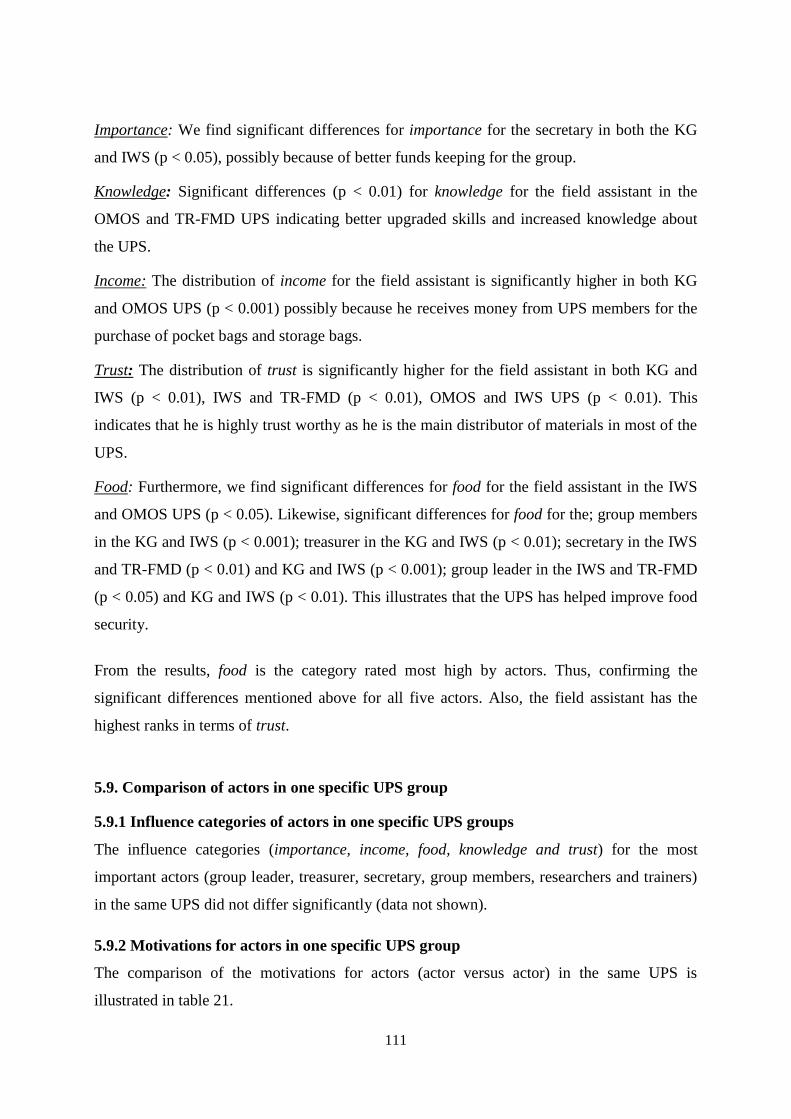
111
Importance: We find significant differences for importance for the secretary in both the KG
and IWS (p < 0.05), possibly because of better funds keeping for the group.
Knowledge: Significant differences (p < 0.01) for knowledge for the field assistant in the
OMOS and TR-FMD UPS indicating better upgraded skills and increased knowledge about
the UPS.
Income: The distribution of income for the field assistant is significantly higher in both KG
and OMOS UPS (p < 0.001) possibly because he receives money from UPS members for the
purchase of pocket bags and storage bags.
Trust: The distribution of trust is significantly higher for the field assistant in both KG and
IWS (p < 0.01), IWS and TR-FMD (p < 0.01), OMOS and IWS UPS (p < 0.01). This
indicates that he is highly trust worthy as he is the main distributor of materials in most of the
UPS.
Food: Furthermore, we find significant differences for food for the field assistant in the IWS
and OMOS UPS (p < 0.05). Likewise, significant differences for food for the; group members
in the KG and IWS (p < 0.001); treasurer in the KG and IWS (p < 0.01); secretary in the IWS
and TR-FMD (p < 0.01) and KG and IWS (p < 0.001); group leader in the IWS and TR-FMD
(p < 0.05) and KG and IWS (p < 0.01). This illustrates that the UPS has helped improve food
security.
From the results, food is the category rated most high by actors. Thus, confirming the
significant differences mentioned above for all five actors. Also, the field assistant has the
highest ranks in terms of trust.
5.9. Comparison of actors in one specific UPS group
5.9.1 Influence categories of actors in one specific UPS groups
The influence categories (importance, income, food, knowledge and trust) for the most
important actors (group leader, treasurer, secretary, group members, researchers and trainers)
in the same UPS did not differ significantly (data not shown).
5.9.2 Motivations for actors in one specific UPS group
The comparison of the motivations for actors (actor versus actor) in the same UPS is
illustrated in table 21.
112
Table 21: Comparison of motivations for actors in the same UPS
Village Actor Group
leader
Treasurer Secretary Group
members
Researchers
& trainers
More income
Changarawe Treasurer - - - KG*↑ -
Group
leader
- KG*↑ TR-FMD*↑ KG*↑ -
Ilakala - - OMOS*↑ - -
- - KG*↑ - -
Enhancing food availability
Ilolo Group
leader
- - KG*↑ - -
Changarawe - TR-FMD*↑ - - -
Idifu Secretary - - - - KG*↑
More joy
Ilakala Group
leader
- - OMOS*↑ - -
Ilolo - - IWS*↑ - -
Better social relations
Ilolo Group
leader
- - TR-FMD*↑ - -
Ilakala - KG*↑ - - -
Ilakala Secretary - - - KG*↑ -
More knowledge
Ilakala Group
leader
- - KG*↑ -
- - - KG*↑ -
Idifu Secretary - - - KG*↑ -
Ilakala - - - KG*↑ -
Explanation: Chi-Square Test: KG *↑ - KG actor is significantly more motivated (p < 0.05)
More income: The distribution of more income for the group leader is significantly higher (p
< 0.05) to the distribution of more income for the secretary for the KG in Ilakala, OMOS in
Ilakala and TR-FMD in Changarawe possibly because of higher earnings on sale of
vegetables and grains from the storage bags in the off-season. The group leaders‘ income is
rated significantly higher (p < 0.05) compared to the treasurer and group members for the KG
in Changarawe. Also, we find significant higher (p < 0.05) motivations for more income for
the treasurer compared to group members for the KG in Changarawe (p < 0.05) indicating
timely contribution of funds for group memberships (from group members) and better funds
keeping by treasurer.
113
Enhancing food availability: The group leader‘s motivation for enhancing food availability is
significantly higher compared to the secretary for the KG in Ilolo (p < 0.05) and the treasurer
for the TR-FMD in Changarawe (p < 0.05) indicating better yields. The secretary‘s
motivation for enhancing food availability is significantly higher compared to the field
assistant for the KG in Idifu (p < 0.05) indicating improved food security for households
leading to better livelihoods.
More joy: The distribution of more joy for the group leader is significantly higher compared to
the secretary for the improved storage in Ilakala and IWS in Ilolo (p < 0.05) indicating better
coordination of group activities.
Better social relations: We find significant high motivation for better social relations for the
group leader compared to the secretary for the TR-FMD in Ilolo (p < 0.05) and also the
treasurer for the KG in Ilakala (p < 0.05). Also, the secretary‘s motivation for more joy is
rated significantly higher compared to the group members for the KG in Ilakala (p < 0.05).
This indicates good interactions between the UPS actors and also good leadership between
their executives.
More knowledge: Furthermore, the group leader‘s motivation for more knowledge is rated
significantly higher compared to the secretary for the KG in Ilakala, the group members for
the KG in Ilakala. Similarly, the secretary‘s motivation for more knowledge is rated
significantly higher compared to the group members for the KG in Idifu and Ilakala (p <
0.05). This illustrates better skills honing.
From the results, enhancing food availability, more knowledge and better social relations
were most frequently mentioned. Also, the group leader has the highest ranks in terms of
motivations.
114
6. Discussion
The overall objective of this study was to determine and understand the role of actors and the
interlinkages among the UPS groups; to determine the relationship within these UPS group
members; to recognize the differences between the different UPS groups and other actors; and
to define possible success factors for UPS group performance. Based on the analysis using the
Net-Map tool, in the subsequent key findings are summarized and implications for the UPS
implementation are derived. The results obtained during the study are discussed in association
to the study objectives and contrasted and compared with existing literature.
6.1 Impact of social network structure on UPS implementation
Farmer groups in the Trans-SEC project were formed to become a vehicle for UPS
implementation with the goal to enhance food security. The findings revealed that high ranks
of indegree centrality of group participants – especially in the KG and TR-FMD UPS - shows
knowledge that has been received evenly by the group members. Learning and information
flow can be easily spread benefiting the outreach of the innovation. This is supported by
Bodin and Crona (2009) who illustrated that having more ties increases the likelihood of
collective action by group members.
It is always assumed that more social ties lead to more prospects for different ways of
partnership and cooperative action (ibid). This can enable actors avoid conflicts thus,
facilitating improvement of shared resource principles. Networks with high density have more
potential for collective action. For instance, all UPS groups in the sub-humid region
(Changarawe and Ilakala) have slightly higher knowledge network densities compared to
those in the semi-arid region (Ilolo and Idifu). Janssen and Ostrom (2006) point out that it can
give rise to improved communication, mutual trust and enlarged levels of reciprocity. This is
also supported by Diani (2003a). In addition, high density can improve establishment of trust
between groups and individuals thus, increasing possibilities for social control (Pretty and
Ward 2001) and can be explained in twofold: Firstly, cost of collaborating with others and
risks is reduced which is important for collaboration and joint action (Burt 2003). In this study
a high level of trust was observed for the field assistant, researchers and trainers in both
regions. They both give information to farmers. The field assistant is the main person UPS
members go to when faced with challenges implementing the UPS. He is linked directly to the
researchers and trainers. The researchers and trainers channel inputs for the UPS
implementation. Secondly, it leads to promotion of development of and compliance with
115
mutual norms (Coleman 1990). The UPS members have come up with rules for governing
their groups, for instance, penalties are levied to UPS members when they do not show up for
three consecutive meetings.
Abrahamson and Rosenkopf (1997) further confirm that high density can also help
dissemination of facts leading to better ease of knowledge access. However, it is agreed with
Crona and Bodin (2006) that high density of social relations between actors can give rise to
diverse blends of skills and information. The relations researchers and trainers have created
with the UPS members leads to better exchange of knowledge and exposure to new thoughts.
Also, the improved social relations between farmers and labourers in the tied ridges UPS
makes it easier for them to always call labourers when they need their services for the
construction of tied ridges.
Furthermore, when density amongst interacting individuals is high, individuals are likely to
take on similar views on an issue. This is demonstrated in two ways: Firstly, in the money
network for the KG and TR-FMD, where villages in the semi-arid region are more highly
densed than those in the sub-humid. Secondly, high densities in the knowledge flows is
observed for all UPS groups in the sub-humid region making it easier for farmers to find
customers through exchange of ideas and information. This coincides with Verheye (2000)
who found that with an average mobile density of 10 or more phones per 100 individuals, they
were likely to benefit more through a per capita GDP growth of 0.59% compared to a similar
country with fewer than 10 mobiles per 100 individuals.
It has also been shown that by involving different stakeholders and promoting development of
relations amongst them, there is a high chance for joint action and collaboration (Hahn et al.,
2006). The networking of UPS groups with each other and those from nearby villages
enhanced better understanding of the UPS implementation and exchange of novel ideas. New
adopters in the different UPS groups suggests knowledge has gone beyond the group leading
to better promotions of the UPS. Similarly, in Sweden Sandström (2004) demonstrated the
positive influence of density on joint action amongst diverse managers of natural resource.
She reported that the existence of numerous social ties amongst diverse actors (for instance
amongst UPS members, researchers and trainers) is important. Furthermore, King (2000)
confirmed this premise when he reported a study in rural Kenya where fishermen were
working together with influential individuals and a number of government officials. By
116
encouraging these fishermen to also interact with each other enabled resolution of
unfavourable conflicts related to fishery.
Relations that do not enhance potentials for collective action can lead to increased
understanding and growth of knowledge through increased amount of information and
exposure to fresh ideas. In most of the UPS groups (KG, TR-FMD, OMOS, IWS) social
relations was mentioned as important motivations for the UPS members. This enables UPS
members to liaise with each other in times of need especially when faced with pests and
diseases on their fields. This is in line with Isaac et al. (2007) who suggested that vital
information on ecological management approaches and new technologies diffuses through
non-formal ties in agroforestry and agriculture. Likewise, they reported that information
which passes through such networks can come from within the network (for instance, species
suitable for a local ecosystem) and from external origin (for instance, new pesticide
techniques). Sandström (2004) further confirms that growth of knowledge seems to require
less ties leading to positive effects of social networks in contrast to what is required to enable
collective action thus, requires more or less caution.
Centrality is another measure that can enhance or inhibit features of a given actor group. Even
though the principle of social network puts forward that actors with high centrality would
result in higher influence (Krebs 2004), in this study in the knowledge network it appears true
for all link types and actors. For instance, in the IWS UPS (figure 19), the group leader is
perceived as a player who can instruct many actors in the group. Nevertheless, during
interviews UPS members confirmed that the group leader had limited impact on the success
of the UPS for three reasons: (i) limited marketability skills (ii) extent of his agroecological
knowledge diffusion on the UPS (see Annex F) and (iii) inability to resolve conflicts. Also,
the group leader does not have funds for group activities and is thus not seen as an influential
actor in the network. Actors with high degree centrality can facilitate the process of solving
simple tasks. The high betweeness of the field assistant in the material flows (see Annex G) in
the improved storage UPS makes him the main distributor of materials in the UPS. He also
carries out simple tasks by providing pesticides and fertilizers, seeds, storage bags and other
inputs to UPS members.
Important information can be easily disseminated only to very few actors in the network who
can act and come up with resolutions (Leavitt 1951). This can be demonstrated with two
examples: first, UPS members in the improved wood supply have assigned the task of making

117
nursery bags to raise seedlings for their fields. Secondly, the presence of executives
(secretary, treasurer, group leader) in all UPS groups makes it easier for group leadership to
be effective. The high indegree centralities of the group members in the KG, OMOS, IWS and
TR-FMD UPS for the knowledge networks indicates that they have a high potential for
promoting the development and diffusion of knowledge in their communities. This
corresponds with Schindler et al. (2016) who reported that access to acquired knowledge and
technology among villagers is important.
In times of change high centrality is essential to enable effective coordination of actors and
resources needed for UPS implementation. Likewise, a network where few actors have high
centralities can enable centralization of governing which can also have negative effects on
learning. This is confirmed by Abrahamson and Rosenkopf (1997) who reported that it can
result to less access to information sources for individual actors. Another drawback of high
centrality is that when an actor has many ties he/she may feel indebted to please most or all of
the actors in the network. This can constrain the actor‘s potential for action (Frank and
Yasumoto 1998). In most of the UPS, the field assistant has many ties in the material flows.
He tries to make sure all UPS members get materials on time. This is not always the case as
some UPS members complain not getting inputs on time and often look for alternatives which
sometimes backfire.
In most of the UPS (TR-FMD, KG and OMOS UPS), the field assistant has a high betweeness
centrality. This gives him the aptitude to direct the flow of resources for UPS implementation.
Additionally, it also provides him with diverse resources (for instance; fuel for his motor bike,
improved storage bags for UPS members, nets, fertilizers, pesticides, seeds and many more)
provided by ties around him (Burt 2004). High betweeness also increases the ability of the
actor to acquire diverse knowledge which can include local ecological knowledge (Crona and
Bodin 2006). Thus, enabling an actor to perceive different changes in the UPS group and
convey this information to others. In this research the field assistant has such ties as he
sometimes visits UPS members to see how they are doing with the UPS implementation and
gives feedback to the researchers and trainers. This corresponds with Krishna (2002) who
reported that bridging ties may likely not be sufficient to enhance governance. Thus, it is vital
for dominant actors to utilize these in techniques that can profit others in the network. The
executives of the UPS groups most often are the ones first receiving information about their
groups before disseminating to UPS members by calling for group meetings.
118
Similarly, an impact on governance outcomes is influenced by the person occupying
favourable points and the way in which they exploit the position. If an influential actor in the
social network is reluctant to take part in joint action, it can result in blocking opportunities
for others. However, in a network having an influential position may not lead to greater
influence. In the results, this is confirmed for the group leader in the improved storage UPS in
Changarawe (table 17). The group leader occupies an influential position in the network but is
not really influential. UPS members complained of not having regular meetings because of
failure of the group leader to organize such meetings. Their last meeting was in December
2015. This is supported by Isaac et al. (2007) who indicated that well placed farmers can
engage in growth of knowledge and information acquisition. This can further lead to
exchange of information amongst farmers in their individual networks thus helping improve
governance in a whole community.
In addition, an actor can be powerful without really occupying an influential spot (for instance
if the actor has an informal level of authority). This corresponds with King (2000) who
illustrated that combined effects of formal level of authority and degree centrality (network
position) matched with perceived level of power in managerial processes and actors not
having both were rated inferior in terms of power. In this study the village chief was
perceived to be most influential as he is the one receiving and authorizing projects in the
villages. Notwithstanding, he does not occupy influential positions in the UPS networks
(knowledge, money and material flows). Additional exploration into the objectives, well-
being of the UPS implementing actors should therefore be vital in network research. This can
be achieved by taking a look at methods and strategies employed by these actors, for instance,
how they make decisions, how they acquire marketing skills, farm management information
and their source of agroecological knowledge.
6.2 Roles and structural positions in the UPS implementation
The broker is a critical position in a network (Burt 2003). In this study, the broker plays a
vital function in the implementation of the UPS. The broker in the UPS groups has admission
to numerous sources of group information captured in the diverse UPS groups. The actors for
both improved storage UPS groups with the highest betweeness centrality is more or less the
same actors with the highest degree centrality thus, are brokers in the other UPS group (see
Annex E). For instance, the high betweeness centrality of the secretary for the tied ridges and
fertilizer micro dosing UPS in the semi-arid region (Idifu and Ilolo) grants him/her the ability

119
to influence the flow of materials. Thus, he is the main distributor of materials in the semi-
arid CSS.
Also in the tied ridges UPS group, the field assistant controls the materials flows.
Furthermore, he learns about the daily struggles of the UPS members in the different UPS
groups. This is an added advantage to him because of the position he occupies as it gives him
the opportunity to know the individual actors or groups to link or not to link, when and how to
link them especially in times of crisis (Burt 2003).
Similarly, a broker can be a group of individuals, an individual or an association that can
discover novel collective resolutions for diverse solutions at diverse points in time. The
broker is very influential as he/she can regulate the performance of the group, knowledge,
money and material flows in the network to a greater level than any other actor. This can be
explained in two ways: (i) the high betweenenss of the nursery keepers, researchers, trainers
and tree providers in the knowledge flows in the improved wood supply UPS positions them
as brokers in the group. This allows them to create a large pool of information and resources.
(ii) The high betweeness centrality for the material flows for the field assistant in Ilakala, the
group leader in Ilolo, the treasurer in Idifu and Changarawe for the kitchen garden positions
them as brokers in the group. Thus, they are the main distributors of materials in those
villages.
The secretary in the KG UPS group in Ilolo has utilized his position and acquired knowledge
to increase income for his household. He constructs KG bags for UPS members and adopters
both within and nearby villages. He has more KG bags than any other member in the UPS
group. This is in line with Burt (2003) who illustrated that a broker with timely access to
relevant information can generate new understanding and seek opportunities that actors
cannot recognize.
For the improved wood supply UPS in Ilolo and improved storage UPS in Ilakala, the highest
betweeness centrality for the material flows is the group leader and group members
respectively. This positions them as brokers in the material flows network as they have direct
contact with the field assistant and bag suppliers (Bodin and Crona 2009). Hence, less
dependence on the field assistant, researchers and trainers for materials for implementing the
UPS.
120
6.3 Motivations and influence categories between different UPS and actors
The interviewees considered the researchers and trainers to be the most dominant and
persuasive actors in the UPS. Although the researchers and trainers channel inputs for the
UPS implementation, they are seen as having a remarkable level of influence due to the
strength of the knowledge flows (tables 14, 15, 16 and 17) and evidence that they bring to the
villages. A KG keeper in Changarawe mentioned: „The researchers came to teach us and the
field assistant is teaching and making follow-ups and we do the implementation”.
The findings showed the contributions of the UPS in improving livelihoods for households.
For instance, the kitchen garden helps households better manage scarce capital and inputs
leading to enhanced livelihoods and food security. „It simplifies the availability of vegetables
and reduces diseases to my children” (FGD KG Changarawe). Gardens close to the home
(figure 12) help minimize transport especially to women cultivating staple foods, medicinal
plants and extra products for sell. Most households are able to utilize the earnings generated
to pay for schooling for their kids, healthcare, getting more food and investing in other
activities as a group (for example, cultivating a field together as a group).
Obtaining more food, for example, can be done by buying it directly or by expanding fields. A
study in Cambodia and Papua Guinea showed that home gardens provided households with
income through sale of vegetables, fruits and livestock products. This helped households buy
more food, make payments for education and extra savings (Iannotti et al., 2009). Similarly,
joy always reflects a combination of different factors such as better health, more food
availability, improved social relations, and more free time (Uchino 2004). The kitchen
gardens have reduced long walks to the field enabling UPS members to easily access
vegetables behind their homes. „At first we were planting vegetables far away in a water
source but now we are planting near our house with small amount of water and it is growing”
(FGD Idifu KG). This has led to more time being spent with neighbours and families.
A significant outcome is understanding the structure of the group leadership which plays a
strategic part for the UPS implementation in enhancing food security. „If there is a challenge
of pest attacking our vegetables, the secretary tells the field assistant, since the secretary
can’t solve such problems” (KG Ilolo F3). This study enabled identifying differences in
influence among important actors for the groups‘ UPS implementation. This was done from
the perspective of the UPS members being an essential factor for the UPS sustainability. I
found that the motivations for participating in a UPS group differ to some extent between all
121
UPS groups and all types of actors, whereby enhancing food availability, more joy, more
income, more knowledge, better reputation and social relations were most frequently
mentioned (tables 16, 18 and 20). These findings coincide with Freeman (1984) who reported
that capturing the needs, priorities and interests of group members is important for
stakeholder analysis which can lead to better performance and management of different
groups.
Associating the results with those of Schindler et al. (2016), there are similar links between
the motivations of the actors and the impacts on food security perceived from implementing
the UPS. In most cases the correlation is positive. For example, the KG, TR-FMD and OMOS
UPS groups reported that the three highest food security impacts were: first, economic (yield,
income); second, social (social relations, food diversity, working conditions, agronomic
knowledge); and third, environmental (agrodiversity, soil fertility, water availability). In this
study, the three most important motivations in the implementation for the UPS members were
enhancing food availability, better social relations and more income. Two interpretations are
possible. Either the results of the implementation are aligned with the motivations of the
participant actors, or the impacts they have experienced have become their motivations. In
both cases this can be taken as a positive outlook on the sustainability of the innovations.
The results show that the flow of UPS knowledge is to some extent linked to the accessibility
and management of resources (for instance crops and fields) and materials in the different
regions. Two examples highlight this: (i) the field assistant in the sub-humid region plays an
important role in the improved storage group management, (ii) group members in the TR-
FMD, IWS and KG UPS groups from the semi-arid region recognize the importance of the
field assistant in the implementation because he provides knowledge on improved agricultural
practices to farmers as potential customers. „The field assistant is important because he helps
bring pesticides when we have pest problems” (FGD TR-FMD Ilakala).
Farmers perceive farming upgrades involving tied ridges as a means of harvesting and storing
water: farming time in the field dropped from eight to six days (more free time to spend with
loved ones). This supports El-Swaify et al. (1985), who found that tied ridges successfully
reduced evapotranspiration and surface run-off, and Macartney et al. (1971), who reported an
increase in maize yield in high rainfall areas in Tanzania using tied ridges. It led to greater
increased maize yield thus, ensuring food availability for households. Also, kitchen gardens

122
provide labour and land for cultivation of horticultural crops (for instance fruits, vegetables,
medicinal plants).
The most important motivation assumed for researchers for the implementation of the TR-
FMD and improved storage is generating knowledge. This also coincides with the high
indegree centrality in the knowledge flows in both UPS and reflects the important role they
play in disseminating knowledge during the UPS implementation. Furthermore, in both
improved storage UPS groups of the sub-humid region, the field assistant has the highest
indegree centrality for money flows and the highest betweeness for the material flows. This
reflects the important role he plays in the money and material networks in the improved
storage groups.
The results obtained during the interviews and FGDs showed that for instance; the improved
storage bags are essential for improving food security during the year. Many interviewees
mentioned the improved storage bags helped ensure food availability for households during
critical periods which is usually characterized with high prices and food shortages. „We used
to buy normal bags for 1 000 Tsh and the pesticides for 4 000 Tsh which lasts 1 year of which
you can use for storage for 4 years. When we use the chemicals to store the maize we were
advised to have maize flour. The improved storage bags last for 5 years and do not require
any chemical use” (FGD OMOS Changarawe).
Farmer‘s income also increased due to improved grain quality by use of the improved storage
bags. A farmer in Ilakala mentioned that: „I was happy to know we can store maize for long
time”. This corresponds with Williams et al. (2014), who carried out a study using maize with
four different moisture contents (12%, 15%, 18% and 21%) using woven and PICS bags. He
discovered that the moistness of grains in woven bags existed because of environmental
packing conditions and also the aflatoxin content. This was found to be greater in bags with
higher moisture content. In contrast to the PICS bags, the original moisture content was
maintained for two months of storage which helped prevent accumulation of aflatoxin.
The case study sites suffer from problems of market access and are often subjected to
unfavourable market dynamics. Access to technologies and ability to cope with diseases and
pests often leads to losses of produce. The highly ranked motivations for UPS members in the
improved storage were; more income, enhancing food availability, more joy followed by more
knowledge and better social relations. In the same line a farmer in Changarawe said: „The
123
maize in the improved storage bags can be used for 3 years compared to buying chemicals
every year to put in the crops”. Increasing agricultural production and productivity through
fertilizer use and improved seed varieties without adequate management practices results in
huge quantities and qualities of grain loss. Managerial, technical and financial limitations in
cooling facilities, storage, infrastructure, harvesting techniques, packaging and marketing
systems often lead to food wastes and losses especially in the developing world. According to
Nellemann (2009), limited cold storage facilities account for 35-40% of losses on fresh
produce in India especially in retail outlets and wholesale. Pre-retail losses in the developed
world are lower as a result of the moderately low-cost of food (GOV 2008). In South East
Asia, after harvest about one-third of rice incurs losses due to pests and spoilage (FAO 1997).
Losses on paddy rice (Oryza sativa L.) usually occurs at storage with insects.
The tree species used by improved wood supply UPS actors for fuelwood include; C. sinensis,
M. azadirachta, G. robusta, and G. sepium (Orwa et al., 2009). The sapwood calorific value is
about 4 800 kcal/kg (ibid). In contrast to the heartwood is 4 950 kcal/kg (ibid) which reflects
its great potential for household cooking energy. These fast growing tree species help
maintain soil fertility, environmental restoration, agricultural productivity and soil nutrient
cycling. Diverse tree species when incorporated into agricultural systems help improve crop
productivity, income of small-scale farmers through diverse products (for instance fruits,
fodder, edible flowers). The on-farm benefits of these fast growing tree species include; soil
fertility improvement, nutrient cycling, soil conservation, carbon sequestration, bioenergy and
biofuel production, nutrient cycling. Agroforestry systems have potential to contribute in
meeting deficits of agricultural and tree products. Likewise, it is assumed that agroforestry
systems may solve food insecurity problems (Singh and Pandey 2011).
6.4 Methodological features and implications
The combination of individual Net-Map interviews and joint focus group discussion (FGD)
showed us the relations among and current development of the group. The participation of
UPS members in the FGD was important to help clarify the Net-Map results. This approach
provided a platform for discussing the relations they have built and those potential relations
that could be fruitful for group performance. The active participation of the moderator is vital
during such sessions. Nevertheless, certain factors can affect the results: (i) constant
participation of group leaders as representatives of the groups. Some UPS members did not
feel at ease expressing their opinions when group representatives were present; and (ii)
124
personal points of view that are difficult to express by individuals and participants who often
seem to be seeking researcher approval on their answers (Jakobsen 2012). Future FGD might
consider letting the participants explain the Net-Maps to each other in order to promote more
interaction.
Focus group discussions revealed some practical challenges for the UPS members. For
instance, (i) in the TR-FMD UPS, key constraints limiting the implementation were:
difficulties in constructing the ridges, prevalence of diseases and pests, untimely arrival of
seeds, inadequate knowledge on fertilizer application thus, limiting households‘ ability to
maximize the full potential of the technology. A farmer in Ilakala mentioned that: „Our land
is dry and has different texture of soil and animals such as cows use it as eating place so they
make the land so rough and dry.‖ In spite of these shortcomings indirect income generation,
minimal agricultural inputs, and maintaining a steady food supply all through the year
demonstrates the prospects of the technology (figure 18) and (ii) in the improved wood supply
UPS, challenges included: material and seed availability, stealing of trees, water costs at the
nursery level.
A number of challenges were faced during the individual interviews with Net-Map and even
the FGDs. The interviewees tried sometimes to predict what the facilitator would like to hear.
This made them to sometimes provide strategic answers. Interviewees were not familiar with
the influence tower which was very helpful in avoiding such strategic answers. Time was
required to build up trust and reassure the interviewee of discretion. One more challenge was
drawing of the network which usually was time consuming. Sometimes, interviewees felt like
being at school and easily lost focus. The presence of men and women in the same sessions
(FGDs) was sometimes very problematic. Most at times, women allowed men to do most of
the talking. They didn‘t say much and I had to intervene by encouraging them to contribute to
the discussions. Sometimes, I had to use the robin round approach for each participant to
contribute to the discussion.
Despite the fact that meeting times were agreed upon with the UPS members, arriving on time
for the interviews and FGD was always a challenge. When asked about their late arrival, most
participants complained about the time schedule for the meetings since they had other
engagements to attend to, especially in the early hours of the morning (for instance working
on their fields). Time of meetings usually overlapped with farmer‘s field activities and they
recommended that it was best to always schedule such meetings in the late afternoons.
125
In this study, Net-Map helped recognize the important actors in the different UPS
implementation. It provided understanding of the different linkages especially on knowledge,
money and material diffusion in the network. The Net-Map tool was successfully used in
northern Ghana to improve and understand water governance (Schiffer and Hauck 2010) on
knowledge exchange, roles of diverse actors and importance of essential actors for the
network (DFID and World Bank 2007). It enabled strategic plans to be developed which
improved organizational goals.
In the Net-Mapping sessions, it was obvious that UPS actors had wide information about
where they fall in the network. This resulted in better understanding of their views when it
was discussed with others. Notwithstanding, I found some misunderstandings about actors
with whom they did not frequently network with.
The Net-Map enabled UPS actors to appreciate the fact that actors like the government officer
and village chief might not be UPS actors as such, but are crucial for executing rules and
sanctions due to their social position in the village and their competence to administer suitable
actions.
Another advantage of using the Net-Map tool in carrying out this study was the interactive
participation of the interviewees. It is easier for interviewees to answer questions regarding
ties when they can visualize the actors and their linkages. Similarly, physically moving things
around and playing with them enables a completely different engagement. The visual quality
of the map simplifies grasping the various layers of information relevant to networks (actors,
relationships, influence power of actors and many more). Finally, data obtained can be put
into a SNA computer program and further analysed for different aspects.
Some limitations of Net-Maps include: the perceived view of interviewees about other actors
can be biased, actors may have different roles and individuals may belong to more than one
group in a network. Analyzing such views occasionally reveals doubts and biases: for
instance, some UPS members during the interviews gave different names for their group
executives. Another limitation is that the Net-Map sessions should not be too long. Lengthy
sessions affect interviewee‘s performance: they tend to lose focus after the first hour.
The cultural difference and language barrier was another challenge. This led to technical
hitches in deriving a collective understanding. For instance, the knowledge link and influence
126
category. Clarifying a situation sometimes proved difficult, time consuming and some aspects
remained ambiguous. However, Brugha and Varvasovszky (2000) found out that, stakeholder
analysis does contain uncertainties and biases. Despite these shortcomings, the Net-Map is an
excellent tool to collect network data and also structure the interviewing process. The results
provide in depth knowledge on activities required to strengthen group relations. This is
needed year round and not only seasonally to tackle challenges that come up during Net-
Mapping sessions and FGDs. This helps to strengthen a group's performance.
6.5 Possible impacts of the upgrading strategies on livelihoods and food security
Impacts of the UPS ranged from better food storage, water capture, fewer days in the field,
more knowledge acquisition, more time to spend with loved ones, favorable interview
locations, sociability, networking with other UPS groups, and contact with researchers and
stakeholders. It was found very important for UPS members to have a clear understanding of
their roles as well as to recognize the benefits of the innovation. Four examples highlight this:
(i) fewer days spent in the field and knowledge about the TR-FMD is vital: „We didn’t know
to farm using tide ridges or to plant in lines and apply fertilizer but now we know” (F2 TR-
FMD Ilakala); (ii) knowledge on the types of multipurpose species needed to enrich the soil:
„When someone is given trees it’s obvious he will be happy about it” (IWS Ilolo F2); (iii)
improved storage practices and marketing techniques for small farmers: „I joined the group to
stop using the old method of storing food that uses chemicals that may harm me in the future
and also to get more education” (F2 OMOS Changarawe); and (iv) improved nutritional
status of households implementing kitchen gardens: „I have seen the changes as I can harvest
vegetables 3 times a week instead of buying all the time” (FGD KG Ilolo). The secretary in
Ilolo has more kitchen garden pocket bags than any other member in the group. He has been
able to turn this innovation around as a source of income for his household and is able to sell
some vegetables thus, improving his livelihood. He is also able to construct kitchen gardens
for people both within and beyond the village to earn additional income.
The adoption of tide ridges and fertilizer micro dosing technology was highly praised by the
UPS actors. Small farmers find this technology promising as they now spend less days in the
field and obtain better yields. „We farm a small area to get many crops. Also when you farm
children and neighbours also adopt the technology” (FGD TR-FMD Ilakala). The hiring of
labour for the TR enable farmers to teach labourers how to construct the ridges. This helps
disseminate knowledge about the technology. Also, water captured for later use is seen to

127
improve farming (figure 17). Small farmers who practice the innovation also educate others
which has led to new adopters in some UPS groups. In some of the UPS, the farmers also
mentioned they will become trainers when the Trans-SEC project comes to an end.
For the improved storage UPS group, success features were: use of safe food without
chemicals, unity in the UPS groups, networking and meeting new people especially the
researchers and trainers and knowledge acquisition on food storage. Similarly, the farmers
mentioned the gender balance in the UPS groups (the balance between men and women) has
remained unchanged.
The ability for stakeholders to network is a success factor in itself. „When there is a kitchen
garden made somewhere they call us to go and see” (KG Changarawe F2). This is in line
with Bibeault (1982) who illustrated that key success factors in enterprise renovation include
people, financial resources and business aspects of macro competitiveness. Donor inputs such
as bags, seeds or machinery also play a role. Finally, setting the right direction through
leadership is essential.
128
7. Conclusions
This chapter re-examines the study objectives, reviews the results and offers conclusions
based on the discussion and research findings. As stated out in the introduction, the objective
of this study was to deeply apprehend the relations of the UPS groups for evaluation of the
long-term sustainable performance of the upgrading strategies that are being implemented.
The utilization of the above stated results improve the basis for carrying out participatory
action research.
The specific actors and network structures were different across the UPS networks. The
presence of adopters in most of the UPS groups helped improve the outlook for group
sustainability. The improved storage and improved wood supply networks were highly
centralized with more actors. In contrast, the kitchen garden and tied ridges networks were
made up of far fewer actors and had a very low level of centralization. All networks indicate a
fairly equal rank of participation of all actors. One interesting aspect of all the UPS network is
that, knowledge exchange is seen as almost entirely bi-directional; everyone who receives
technical information from a different actor also offered it. Thus, all UPS networks illustrate
the aspect of free knowledge flows instead of the classic model of, for instance, giving
information to a lone policymaking body.
The Net-Map tool in this study offered a strong instrument for collecting data. It was used to
determine actor roles within the UPS networks. The tool proved valuable for revealing
perceptions about the different UPS, drawing opinions on the challenges to a successful UPS
implementation and pinpointing the most powerful or critical actors. It also helped enhance
understanding of actor‘s motivations for implementing the UPS. The findings from this study
revealed that in defining the powerful actors in the process, formal lines of authority and
informal networks perceived to be most relevant while others for instance external
governance processes are fairly irrelevant.
The compilation and analysis of the SNA data and the FGDs with the UPS groups promoted
understanding of the knowledge, material and money flows within the UPS groups. This
enables communication and coordination between actors. One example is identifying possible
bottlenecks, such as labour, agricultural inputs, education and human capital between the UPS
group members. This improves group functioning and strengthens capacities within the UPS
groups for better actor performance. Furthermore, a single UPS is insufficient for success:
several must be merged to meet stakeholders‘ expectations.
129
The most important success factors were favorable village locations, sociability and personal
contact with stakeholders and researchers, both underpinning the significance of linkages.
Better social relations were the most prominent motivations in all UPS groups. Interviewees
were generally happy about their upgraded skills. UPS members gave views on where they
agreed and disagreed in their opinions of the different UPS in improving food security for
households. Nonetheless, perceptions of the roles and influence of the major actors were
largely consistent across the different UPS.
The findings indicate that UPS members are the most leading sources of information for other
UPS members. Furthermore, the findings indicate the UPS (OMOS, KG, TR-FMD) are
providing income and food for the UPS members through better storage techniques,
production of different varieties of vegetables and crops. Many of the vegetables grown in the
kitchen garden help improve nutritional status of households leading to balanced diets. The
findings of this study also confirm the benefits of improved storage bags and IWS in
contributing to food security and soil fertility. While remunerations of these upgrading
strategies are enormous there are several shortcomings identified by the UPS members. The
most common shortcomings include; access to inputs, problems of pests and diseases, labour,
climate, shocks (floods, droughts) and capital.
Definitely the most significant findings of this study is the fact that less labour is required for
the kitchen garden implementation. Hiring labour is not required as it is done behind the
house. This is a positive outlook for the adoption of this technology and a good outlook for
the UPS group‘s sustainability. For the TR-FMD UPS, even though fewer days are spent in
the field (farming time dropped from eight to six days) it tends to be more beneficial for small
farmers under high rainfall conditions. Notwithstanding, it requires well-timed management
when it comes to weeding (especially when weeds are too tiny) and planting (especially when
the ridges are wet). Likewise, it also requires additional labour inputs especially when the first
weeding has not been done properly.
Furthermore, another significant finding is: UPS members have incorporated kitchen gardens,
TR-FMD, improved storage techniques, and intercropping crops with fast growing trees into
their livelihoods activities. The indirect income they get from selling their crops especially in
the off season (from the improved storage bags) lifts households from poverty. This also
shows the attractiveness of the UPS. While indirect income from kitchen gardens, TR-FMD,
improved storage and IWS does not guarantee complete escape from poverty, it thus, provide
130
opportunities to vary their earnings. Diversification of revenue for households enables them to
be less prone to shocks. Nevertheless, it allows households cope with the dry and most
importantly the hunger season, when they have shortage of other income sources. It was
found that vegetables not only provide a revenue source, on the other hand diversifies diets.
Furthermore, the income from improved storage bags, kitchen gardens, tied ridges, sale of
trees can be used to capitalize other livelihood approaches, for instance, hiring labour for tied
ridges, livestock keeping, bee keeping, sending children to school, and many more.
These findings help increase both stakeholder and researcher‘s knowledge on the UPS
implementation. Stakeholder participation is clearly shaped by the policy and institutional
context of Tanzania. Nonetheless, many civil society organizations see room for increased
engagement on a whole range of issues. The coming together of UPS members to exchange
knowledge, network and establish agreements on UPS implementation can yield great
benefits, among them enhanced knowledge, group transparency and community harmony.
The collective cooperation amongst UPS members produces more satisfactory and sustainable
UPS implementation leading to improved food security.
131
8. Recommendations
The study shows that group members within one UPS are aware of the potential of
cooperation within their actor groups. Also, the relations within each UPS group developed
separately from the others. It is recommended to not only facilitate group-internal cooperation
but also a platform for members to network and interact with those from other UPS. This will
enable them learn more from each other and profit from these relations thus, leading to social
learning and fostering of collaborations.
Rural actor groups implementing UPS to improve food security are generally recommended
to invest in trainings, marketing strategies and capacity building. During the interviews it
became clear that group governance would be a supplementary indicator of economic
connections between actors to ease understanding of the powerful networks at play. This is a
vital area to look into for upcoming research study in Tanzania and beyond.
Future FGDs might consider letting the participants explain the Net-Map results to each other
in order to promote more interaction. We also recommend more engagement of other people
from the villages in the UPS. It is further vital that UPS members learn working financially
independent without assistance from Trans-SEC. This will go a long way to ensure
functioning of the UPS groups.
Net-Map tool is recommended for exploring and understanding the different actors‘ and
groups‘ relationships, motivations, and influential factors for the different UPS. Furthermore,
further research on why actor and group views change over time is required. I also hope the
findings will spur additional inquiry into investigating the potential of how actors and groups
views of networks vary.
Up-scaling and extension of the UPS (KG, TR-FMD, OMOS and IWS) is thus, suggested as
an instrument to reduce hardships of poverty and food insecurity in Dodoma and Morogoro
region as well as other rural regions of Tanzania. In doing so, the concept of long term
sustainability must be considered.
132
Bibliography
Aberman, N. L., Johnson, M. E., Droppelmann, K., Schiffer, E., Birner, R., & Gaff, P. (2012).
Mapping the contemporary fertilizer policy landscape in Malawi: A guide for policy researchers
(No. 1204). International Food Policy Research Institute (IFPRI).
Abrahamson, E., & Rosenkopf, L. (1997). Social network effects on the extent of innovation diffusion:
A computer simulation. Organization science, 8(3), 289-309.
Afari-Sefa, V., Rajendran, S., Kessy, R. F., Karanja, D. K., Musebe, R., Samali, S., & Makaranga, M.
(2016). Impact of nutritional perceptions of traditional African vegetables on farm household
production decisions: a case study of smallholders in Tanzania. Experimental Agriculture,
52(02), 300-313. DOI: 10.1017/S0014479715000101.
Agong, S. G., Ojiewo, C. O., Mwai, G. N., Abukutsa-Onyango, M. O., & Nono-Womdim, R. (2013).
Exploiting the genetic diversity of vegetable African nightshades.
Aker, J. C. (2008). Does digital divide or provide? The impact of cell phones on grain markets in
Niger. In SSRN Journal. DOI: 10.2139/ssrn.1093374.
Albu, M., & Scott, A. (2001). Understanding livelihoods that involve micro-enterprise: Bourton, UK:
Intermediate Technology Development Group.
Araya, A., & Stroosnijder, L. (2010). Effects of tied ridges and mulch on barley (Hordeum vulgare)
rainwater use efficiency and production in Northern Ethiopia. Agricultural water management,
97(6), 841-847.
Bagayoko, M., Maman, N., Palé, S., Sirifi, S., Taonda, S. J. B., Traore, S., & Mason, S. C. (2011).
Microdose and N and P fertilizer application rates for pearl millet in West Africa. African
Journal of Agricultural Research, 6(5), 1141-1150.
Bainbridge, D. A. (1998). A handbook for erosion control and watershed rehabilitation, Hungry
Valley. SERG/USIS ESP for State Parks OHMVRA, San Diego, CA, 120.
Bandyopadhyay S, Rao AR, Sinha Bikas K. (2010). Models for Social Networks with Statistical
Applications. London: Sage Publications.
Baoua, I. B., Amadou, L., Baributsa, D., & Murdock, L. L. (2014). Triple bag hermetic technology for
post-harvest preservation of Bambara groundnut (Vigna subterranea (L.) Verdc.). Journal of
Stored Products Research, 58, 48-52. DOI: 10.1016/j.jspr.2014.01.005.
Barrett, C. B. (2010). Measuring food insecurity. Science, 327(5967), 825-828. DOI:
10.1126/science.1182768.
Battisti, D. S., & Naylor, R. L. (2009). Historical warnings of future food insecurity with
unprecedented seasonal heat. Science, 323(5911), 240-244.
Becker, M. H. (1970). Sociometric location and innovativeness: Reformulation and extension of the
diffusion model. American sociological review, 267-282.
Ben, D. C., Liem, P. V., Dao, N. T., Gummert, M., & Richman, J. F. (2006). Effect of hermetic
storage in the super bag on seed quality and on milled rice quality of different varieties in Bac
Lieu, Vietnam. Int. Rice Res. Notes, 31(5).
Bibeault, D. B. (1998). Corporate turnaround: how managers turn losers into winners!. Beard Books.
133
Binagwaho, A., Agbonyitor, M., Rukundo, A., Ratnayake, N., Ngabo, F., Kayumba, J., ... & Fawzi, M.
C. S. (2011). Underdiagnosis of malnutrition in infants and young children in Rwanda:
implications for attainment of the Millennium Development Goal to end poverty and hunger.
International journal for equity in health, 10(1), 61. DOI: 10.1186/1475-9276-10-61.
Black, R. E., Allen, L. H., Bhutta, Z. A., Caulfield, L. E., De Onis, M., Ezzati, M., ... & Maternal and
Child Undernutrition Study Group. (2008). Maternal and child undernutrition: global and
regional exposures and health consequences. The lancet, 371(9608), 243-260.
DOI:10.1016/S0140-6736(07)61690-0.
Bodin, Ö., & Crona, B. I. (2009). The role of social networks in natural resource governance: What
relational patterns make a difference? Global environmental change, 19(3), 366-374. DOI:
10.1016/j.gloenvcha.2009.05.002.
Borgatti, S. P., Everett, M. G., & Freeman, L. C. (2002). Ucinet for Windows: Software for social
network analysis.
Boxall, R. A. (2002). Damage and loss caused by the larger grain borer Prostephanus truncatus.
Integrated Pest Management Reviews, 7(2), 105-121. DOI: 10.1023/A:1026397115946.
Brugha, R., & Varvasovszky, Z. (2000). Stakeholder analysis: a review. Health policy and planning,
15(3), 239-246.
Burt, R. S. (2002). The social capital of structural holes. The new economic sociology: Developments
in an emerging field, 148-190.
Cairns, J. E., Hellin, J., Sonder, K., Araus, J. L., MacRobert, J. F., Thierfelder, C., & Prasanna, B. M.
(2013). Adapting maize production to climate change in sub-Saharan Africa. Food Security, 5(3),
345-360. DOI: 10.1007/s12571-013-0256-x.
Campbell, S. W., & Kwak, N. (2010). Mobile communication and civic life: Linking patterns of use to
civic and political engagement. Journal of communication, 60(3), 536-555. DOI: 10.1111/j.1460-
2466.2010.01496.x.
CARE. (2013): Exploring the Challenges and Solutions to Food & Nutrition Security. Findings from
the CARE Learning Tour to South Sudan & Tanzania. Edited by CARE. Available online at
http://www.care.org/sites/default/files/documents/CH-2013-Trip-Report-Learning-Tour-to-
South-Sudan-Tanzania.pdf
Carey, H. A. (1999). Communication in extension: a teaching and learning guide. Food & Agriculture
Organization.
Castells, M. (2011). The rise of the network society: The information age: Economy, society, and
culture (Vol. 1). John Wiley & Sons.
Ceccarelli, S., & Grando, S. (2009). Participatory plant breeding. In Cereals (pp. 395-414). Springer
US.
Chen, W. (2013). Internet use, online communication, and ties in Americans‘ networks. Social Science
Computer Review, 31(4), 404-423. DOI: 10.1177/0894439313480345.
Chung, K. (Ed.). (1997). Identifying the food insecure: The application of mixed-method approaches
in India. Intl Food Policy Res Inst.
Chweya, J. A., & Eyzaguirre, P. B. (1999). The biodiversity of traditional leafy vegetables. University
of Nairobi.
134
Coleman, J. (1990). Foundations of Social Theory Harvard University Press, Cambridge,
Massachusetts, USA.
Coleman-Jensen, A. (2013). Statistical Supplement to Household Food Security in the United States in
2011. BiblioGov.
Compton, J. A., Floyd, S., Ofosu, A., & Agbo, B. (1998). The modified count and weigh method: An
improved procedure for assessing weight loss in stored maize cobs. Journal of Stored Products
Research, 34(4), 277-285.
Contractor, N. S., Wasserman, S., & Faust, K. (2006). Testing multitheoretical, multilevel hypotheses
about organizational networks: An analytic framework and empirical example. Academy of
Management Review, 31(3), 681-703. DOI: 10.5465/AMR.2006.21318925.
Critchley, W. (1991). Looking after our land: Soil and water conservation in dryland Africa. Oxfam.
Crona, B., & Bodin, Ö. (2006). What you know is who you know? Communication patterns among
resource users as a prerequisite for co-management. Ecology and society, 11(2).
Degenne, A., & Forsé, M. (1999). Introducing social networks. Sage.
Degenne, A., & Forsé, M. (2004). Les réseaux sociaux.
DFID (Department for International Development). (1999): Sustainable Livelihoods Guidance Sheets.
United Kingdom. Available online at
http://www.eldis.org/vfile/upload/1/document/0901/section2.pdf
DFID (UK Department for International Development) and World Bank. 2007. Tool for
Understanding Institutional, Political and Social Analysis (TIPS). Poverty Analysis and MDGs
Team/World Bank Social Development Division. https://www.worldbank.org/tips.
Diani, M., & McAdam, D. (2003). Social movements and networks: Relational approaches to
collective action. Oxford University Press.
Dibsdall, L. B. (2011). Low-income consumers' attitudes and behavior towards access availability and
motivation to eat fruit and vegetables. American Journal of Public Health: August 2011, Vol.
101, 159-168.
Donner, J. (2006). The use of mobile phones by microentrepreneurs in Kigali, Rwanda: Changes to
social and business networks. Information Technologies & International Development, 3(2), pp-
3.
Doss, C. R. (2006). Analyzing technology adoption using microstudies: limitations, challenges, and
opportunities for improvement. Agricultural Economics, 34(3), 207-219.
D'souza, A., & Jolliffe, D. (2014). Food insecurity in vulnerable populations: coping with food price
shocks in Afghanistan. American Journal of Agricultural Economics, 96(3), 790-812.
Ecker, O., Weinberger, K., & Qaim, M. (2010). Patterns and determinants of dietary micronutrient
deficiencies in rural areas of East Africa.
ECONET (2015). Ecofarmer. https://www.econet.co.zw/ecofarmer. Available online at
www.econet.co.zw/ecofarme.
Egyir, I. S., Al-Hassan, R., & Abakah, J. K. (2011). ICT-based Market Information Services Show
Modest Gains in Ghana‘s Food Commodity Markets. In a conference on Development on the
Margin, University of Bonn, October (pp. 5-7).
135
Ek, T. M. (1994). Biomass structure in miombo woodland and semievergreen forest. Ås: Norwegian
University of Life Sciences (NMBU).
El-Swaify, S. A., Pathak, P., Rego, T. J., & Singh, S. (1985). Soil management for optimized
productivity under rainfed conditions in the semi-arid tropics. In Advances in soil science (pp. 1-
64). Springer New York.
Elwell, H. A., & Norton, A. J. (1988). No-till tied-ridging: a recommended sustained crop production
system. IAE.
Falkenmark, M., Fox, P., Persson, G., & Rockström, J. (2001). Water harvesting for upgrading of
rainfed agriculture. Problem Analysis and Research Needs. SIWI Report II. Stockholm
International Water Institute, Sweden.
FAO. (1996). Declaration on world food security. World Food Summit, FAO, Rome. (2002).
FAO (1997). www.fao.org/english/newsroom/factfile/IMG/FF9712-e.pdf.
FAO (2000). Crops and Drops (FAO, Rome, 2000).
FAO (2001): ―The impact of HIV/AIDS on food security‖. Committee on World Food Security, 27th
Session, Rome, 28th May to 1
st June, 2001.
FAO (2006). Food Security. Policy Brief, Rome: Food and Agriculture Organization.
FAO (2008). Household metal silos: key allies in FAO‘s fight against hunger. Rome, Italy:
Agricultural and Food Engineering Technologies Service.
FAO (2009). Economic crises. Impacts and lessons learned. Rome: FAO (The state of food insecurity
in the world, 10.2009).
FAO (2010). Reducing Post-harvest Losses in Grain Supply Chains in Africa: Lessons Learned and
Practical Guidelines FAO/World Bank Work. FAO Headquarters, Rome Italy (2010), pp. 18-19
March 2010.
FAO (2011). How does international price volatility affect domestic economies and food security?
Rome: FAO (The state of food insecurity in the world, 2011).
FAO (2012). State of Food and Agriculture 2012. Investing in agriculture for a Better Future. Rome:
FAO. Available online at http://gbv.eblib.com/patron/FullRecord.aspx?p=3239172.
FAO (2014). Strengthening the enabling environment for food security and nutrition. Rome: FAO
(The state of food insecurity in the world, 2014).
FAO (2015). The State of Food and Agriculture 2015 (SOFA): Social Protection and Agriculture:
Breaking the Cycle of Rural Poverty. FAO, Rome. FAO, 2016, RIMA-II (paper forthcoming)
available at http://www.fao.org/3/a-i5298e.pdf. Available online at http://www.fao.org/3/a-
i5298e.pd.
FAO, IFAD and WFP. (2013). The State of Food Insecurity in the World 2013. The Multiple
Dimensions of Food Security, FAO, Rome, website:
http://www.fao.org/docrep/018/i3434e/i3434e.pdf.
FARMAfrica (2007). Keeping up with technology: The use of mobile telephony in delivering
communitybased decentralized animal health services in Mwingi and Kitui Districts, Kenya.
Retrieved from http://www.farmafrica.org.uk/view_ publications.cfm?DocTypeID_11
FAOStat (2014). United Republic of Tanzania. Available at: http://faostat3.fao.org/browse/area/215/E
136
FAOSTAT (2016). Food and Agicultural Organisation Statistical Division. Available online at
http://faostat3.fao.org/home/E
Farrell, G., & Schulten, G. G. M. (2002). Larger grain borer in Africa; a history of efforts to limit its
impact. Integrated Pest Management Reviews, 7(2), 67-84.
Foley, J. A., Ramankutty, N., Brauman, K. A., Cassidy, E. S., Gerber, J. S., Johnston, M., ... & Balzer,
C. (2011). Solutions for a cultivated planet. Nature, 478(7369), 337-342. DOI:
10.1038/nature10452.
Fortunati, L. (2000). The mobile phone: new social categories and relations. University of Trieste.
Frank, K. A., & Yasumoto, J. Y. (1998). Linking action to social structure within a system: Social
capital within and between subgroups 1. American journal of sociology, 104(3), 642-686. DOI:
10.1086/210083.
Freeman, L. C. (1978). Centrality in social networks conceptual clarification. Social networks, 1(3),
215-239.
Freeman, R. E. (1984). Stakeholder management: framework and philosophy. Pitman, Mansfield, MA.
Freeman, R. E. (2010). Strategic management: A stakeholder approach. Cambridge University Press.
Fujisaka, S., Zandamela, C. B., & Denning, G. L. (1996). Rainfed Lowland Rice and research needs in
Mozambique. Report document to IRRI. Mozambique.
Galhena, D. H., Freed, R., & Maredia, K. M. (2013). Home gardens: a promising approach to enhance
household food security and wellbeing. Agriculture & Food Security, 2(1), 8. DOI:
10.1186/2048-7010-2-8.
Gamper, M., Schönhuth, M., & Kronenwett, M. (2011). Bringing Qualitative and Quantitative Data
Together: Collecting Network Data with the Help. Social Networking and Community Behavior
Modeling: Qualitative and Quantitative Measures: Qualitative and Quantitative Measures, 193.
Gergen, K. J. (2002): The challenge of absent presence. In Katz, J, E. & Aakhus (Eds.). Perpetual
contact: Mobile communication, private talk, public performance (227-231). Cambridge:
Cambridge university press.
German, L., Mowo, J., & Kingamkono, M. (2006). A methodology for tracking the ―fate‖ of
technological interventions in agriculture. Agriculture and Human Values, 23(3), 353-369. DOI:
10.1007/s10460-006-9008-2.
Geser, H. (2006). Is the cell phone undermining the social order? Understanding mobile technology
from a sociological perspective. Knowledge, Technology & Policy, 19(1), 8-18. DOI:
10.1007/s12130-006-1010-x.
Gnonlonfin, G. B., Hell, K., Siame, A. B., & Fandohan, P. (2008). Infestation and population
dynamics of insects on stored cassava and yams chips in Benin, West Africa. Journal of
economic entomology, 101(6), 1967-1973.
Gómez, M. I., Barrett, C. B., Buck, L. E., De Groote, H., Ferris, S., Gao, H. O., McCullough, E.,
Miller, D.D., Outhred, H., Pell, A.N. & Reardon, T. (2011). Research principles for developing
country food value chains. Science, 332(6034), 1154-1155.
GOV, C. (2008). California Integrated Waste Management Board.
Graef, F., Sieber, S., Mutabazi, K., Asch, F., Biesalski, H. K., Bitegeko, J., ... & Fasse, A. (2014).

137
Framework for participatory food security research in rural food value chains. Global Food
Security, 3(1), 8-15. DOI: 10.1016/j.gfs.2014.01.001.
Graef, F., Schneider, I., Fasse, A., Germer, J. U., Gevorgyan, E., Haule, F., ... & Lambert, C. (2015).
Assessment of upgrading strategies to improve regional food systems in Tanzania: Food
processing, waste management and bioenergy, and income generation. Outlook on Agriculture,
44(3), 179-186. DOI: 10.5367/oa.2015.0209.
Granovetter, M. S. (1973). The strength of weak ties. American journal of sociology, 78(6), 1360-
1380.
Gunathilake, H. A. J., Joseph, P. G., Wickremasinghe, H., & Peiris, T. S. G. (2005). Sustainable
Biomass Production in Sri Lanka and Possibilities for Agroforestry Intervention. In International
Conference on the Issues for Sustainable use of Biomass Resources for Energy. Colombo (pp.
15-18).
Gundersen, C., Kreider, B., & Pepper, J. (2011). The economics of food insecurity in the United
States. Applied Economic Perspectives and Policy, 281-303.
Haddad, L., & Gillespie, S. (2001). Effective food and nutrition policy responses to HIV/AIDS: what
we know and what we need to know. Journal of International development, 13(4), 487-511.
Hahn, T., Olsson, P., Folke, C., & Johansson, K. (2006). Trust-building, knowledge generation and
organizational innovations: the role of a bridging organization for adaptive comanagement of a
wetland landscape around Kristianstad, Sweden. Human ecology, 34(4), 573-592. DOI:
10.1007/s10745-006-9035-z.
Hale, J., Knapp, C., Bardwell, L., Buchenau, M., Marshall, J., Sancar, F., & Litt, J. S. (2011).
Connecting food environments and health through the relational nature of aesthetics: Gaining
insight through the community gardening experience. Social science & medicine, 72(11), 1853-
1863. DOI: 10.1016/j.socscimed.2011.03.044.
Hampton, K. N., Sessions, L. F., & Her, E. J. (2011). Core networks, social isolation, and new media:
How Internet and mobile phone use is related to network size and diversity. Information,
Communication & Society, 14(1), 130-155. DOI: 10.1080/1369118X.2010.513417.
Hanneman, R. A., & Riddle, M. (2005). Introduction to social network methods.
Hargittai, E., & Hinnant, A. (2008). Digital inequality differences in young adults' use of the Internet.
Communication Research, 35(5), 602-621.
Hartung, H. (2006). Local financing mechanisms for roofwater harvesting in Uganda. Waterlines,
24(4), 8-11. DOI: 10.3362/0262-8104.2006.019.
Hartung, H. (2007). Rainwater utilization in Africa, some experiences. In Proceedings of the 1st
International Rainwater Leadership Workshop. International Water Association Rainwater
Harvesting and Management Specialist Group (IWA WHM SG), Seoul National University Brain
Korea (Vol. 21).
Hauck, J., Schmidt, J., & Werner, A. (2016). Using social network analysis to identify key
stakeholders in agricultural biodiversity governance and related land-use decisions at regional
and local level. Ecology and Society, 21(2). DOI: 10.5751/ES-08596-210249.
Hauck, J., & Youkhana, E. (2008). Histories of water and fisheries management in Northern Ghana
(No. 32). ZEF working paper series.
138
Hayma, J. (2003). AD31E The storage of tropical agricultural products. Agromisa Foundation.
Helms, R., Ignacio, R., Brinkkemper, S., & Zonneveld, A. (2010). Limitations of network analysis for
studying efficiency and effectiveness of knowledge sharing. Electronic Journal of Knowledge
Management, 8(1), 53-68.
Hennink, M. M. (2013). Focus group discussions. Oxford University Press.
Herzog, W. A., Stanfield, D., Whiting, G. C., & Svenning, L. (1968). Patterns of diffusion in rural
Brazil. A USAID-funded research project, Michigan: Michigan State University.
Hogset, H. (2005). Social networks and technology adoption. BASIS Policy Brief No, 6.
Holden, S. T., & Otsuka, K. (2014). The roles of land tenure reforms and land markets in the context
of population growth and land use intensification in Africa. Food Policy, 48, 88-97. DOI:
10.1016/j.foodpol.2014.03.005.
Holst, N., Meikle, W. G., & Markham, R. H. (2000). Grain injury models for Prostephanus truncatus
(Coleoptera: Bostrichidae) and Sitophilus zeamais (Coleoptera: Curculionidae) in rural maize
stores in West Africa. Journal of economic entomology, 93(4), 1338-1346.
Hudson, H. E. (2013). From rural village to global village: Telecommunications for development in
the information age. Routledge.
Hughes, C. E. (1987). Biological considerations in designing a seed collection strategy for Gliricidia
sepium (Jacq.) Walp. (Leguminosae). The Commonwealth Forestry Review, 31-48.
Hulugalle, N.R. (1986). Soil-water management. International Institute of Tropical Agriculture
(IITA)/Semi-Arid Food Grains Research and Development (SAFGRAD) Project Annual Report
for 1985. IITA/SAFGRAD, Ouagadougou, Burkina Faso, pp. G 1-G26.
Hulugalle, N.R. (1987). Effect of tied ridges on soil water content, evapotranspiration, root growth and
yield of cowpeas in the Sudan savannah of Burkina Faso. Field Crops Res., 17:219- 228.
Hulugalle, N.R. (1988b). Growth of millet (Pennisetum americanum Leek.) under tied ridging in the
West African Sudan savannah. Paper presented at the Australian Society of Soil Sci. (Inc.). Natl.
Soils Conference, 9-12 May 1988, Canberra ACT, Australia.
Hulugalle, N.R. (1988c). Intercropping millet and bambara groundnut on tied ridges in the Sudan
savannah of Burkina Faso. Arid Soil Res. Rehabil., 2: 97-109.
Hulugalle, N.R. (1988d). Effect of tied ridges and undersown Stylosanthes hamata on soil properties
and growth of maize in the Sudan savannah of Burkina Faso. Agric. Ecosyst. Environ., 25: 39-
51.
Hulugalle, N.R. and Rodriguez, M.S., (1988). Soil physical properties of tied ridges in the Sudan
Savannah of Burkina Faso. Experimental agriculture, 24(03), pp.375-384.
Hulugalle, N. R., De Koning, J., & Matlon, P. J. (1990). Effect of rock bunds and tied ridges on soil
water content and soil properties in the Sudan savannah of Burkina Faso. Tropical agriculture,
67(2), 149-153.
Iannotti, L., Cunningham, K., & Ruel, M. (2009). Improving diet quality and micronutrient nutrition:
homestead food production in Bangladesh. Intl Food Policy Res Inst.
ICF-Macro & NBS. (2011). Micronutrients: Results of the 2010 Tanzania Demographic and Health
Survey. Dar es Salaam: NBS and ICF Macro.
139
ICR1SAT (1983). Annual Report: Cooperative Program. Ouagadougou, Burkina Faso: International
Crop Research Institute of the Semi-Arid Tropics.
IPCC (2013). Climate Change 2013: The Physical Science Basis. Genevra: s.n.
IFPRI (2014). 2013 global food policy report. Washington, DC: International Food Policy Research
Institute.
Isaac, M., Erickson, B., Quashie-Sam, S., & Timmer, V. (2007). Transfer of knowledge on
agroforestry management practices: the structure of farmer advice networks. Ecology and
Society, 12(2).
Isham, J. (2001). The Effect of Social Capital on Technology Adoption: evidence from Rural
Tanzania. In SSRN Journal. DOI: 10.2139/ssrn.260053.
Islam, M. S., & Grönlund, Å. (2011). Bangladesh calling: farmers' technology use practices as a driver
for development. Information Technology for Development, 17(2), 95-111. DOI:
10.1080/02681102.2010.526093.
Jakobsen, H. (2012). Focus groups and methodological rigour outside the minority world: making the
method work to its strengths in Tanzania. Qualitative Research, 12(2), 111-130.
Janssen, M.A. and Ostrom, E. (2006). In: Baland, J.M., Bardhan, P., Bowles, S. (Eds.), Inequality,
Cooperation and Environmental Sustainability. Princeton University Press, pp. 60–96.
Jensen, J. R., Bernhard, R. H., Hansen, S., McDonagh, J., Møberg, J. P., Nielsen, N. E., & Nordbo, E.
(2003). Productivity in maize based cropping systems under various soil–water–nutrient
management strategies in a semi-arid, alfisol environment in East Africa. Agricultural Water
Management, 59(3), 217-237. DOI: 10.1016/S0378-3774(02)00151-8.
Jones, P. G., & Thornton, P. K. (2009). Croppers to livestock keepers: livelihood transitions to 2050 in
Africa due to climate change. Environmental Science & Policy, 12(4), 427-437. DOI:
10.1016/j.envsci.2008.08.006.
Kaba, B., Diallo, A., Plaisent, M., Bernard, P., & N'Da, K. (2006). Explaining the factors influencing
cellular phones use in Guinea. The Electronic Journal of Information Systems in Developing
Countries, 28(3), 1-7.
Kabanza, A. K., & Rwehumbiza, F. B. R. (2007). Assessment of the contribution of tied ridges and
farmyard manure application to sorghum production in semi-arid areas of Tanzania. Advances in
Integrated Soil Fertility Management in sub-Saharan Africa: Challenges and Opportunities,
723-730.
Kadigi, I. L., Muhiche, L., Kadigi, R. M., Makindara, J., Laswai, G., & Kashaigili, J. J. (2013). E-
Ng‘Ombe: a mobile phone ICT to tackle the pitfall of information asymmetry in the value chain
of indigenous beef cattle in Mwanza region, Tanzania. Journal of Agriculture Economics and
Rural Development, 1(1), 1-7.
Kang, B.T. & Mulongny, I.L. (1987). Gliricidia sepium as a source of green manure in an alley
cropping system. Nitrogen Fixing Trce Association Special Publication 87-01, pp. 44-49.
Kangalawe, R. Y., & Lyimo, J. G. (2013). Climate change, adaptive strategies and rural livelihoods in
semi-arid Tanzania. In NR 04 (03), pp. 266–278. DOI: 10.4236/nr.2013.43034.
Karamagi, H., & Nalumansi, L. (2009). No more spoilt milk: Mobile phones improve the supply of
milk to the market in Uganda. ICT Update 47.
140
Kimaro, A. A., Timmer, V. R., Mugasha, A. G., Chamshama, S. A., & Kimaro, D. A. (2007). Nutrient
use efficiency and biomass production of tree species for rotational woodlot systems in semi-arid
Morogoro, Tanzania. Agroforestry Systems, 71(3), 175-184. DOI: 10.1007/s10457-007-9061-x.
Kimaro, A.A., Chamshama, S.A.O., Ngaga, Y.M. & Mpanda, M. (2014). Boundary tree planting in
maize-based system for improved crop yield and wood supply in Dodoma, Tanzania.
Kimenye, L., & Bombom, A. (2009). Best-bet research outputs for enhancing agricultural productivity
in Eastern and Central Africa: Abstracts. Kul Graphics Limited, Nairobi, Kenya.
King, A. (2000). Managing without institutions: The role of communication networks in governing
resource access and control (Doctoral dissertation, University of Warwick).
Kpadonou, R. A. B., Owiyo, T., Barbier, B., Denton, F., Rutabingwa, F., & Kiema, A. (2017).
Advancing climate-smart-agriculture in developing drylands: Joint analysis of the adoption of
multiple on-farm soil and water conservation technologies in West African Sahel. Land Use
Policy, 61, 196-207. DOI: 10.1016/j.landusepol.2016.10.050.
Krebs, V. (2004). Power in networks. Available at www.orgnet.com (retrieved March 21, 2017).
Krishna, A. (2002). Active social capital: Tracing the roots of development and democracy. Columbia
University Press.
Lal, R. (1990), Ridge-tillage. In Soil and Tillage Research 18 (2-3), pp. 107–111. DOI: 10.1016/0167-
1987(90)90053-G.
Leavitt, H. J. (1951). Some effects of certain communication patterns on group performance. The
Journal of Abnormal and Social Psychology, 46(1), 38. DOI: 10.1037/h0057189.
Leuenberger, H., & Wohlgemuth, N. (2006). Biofuels and energy security in Africa. United Nations
Industrial Development Organisation, UNIDO.
Ling, R. S. (2008). New tech, new ties. Cambridge, MA: MIT press.
Lott, J. E., Howard, S. B., Ong, C. K., & Black, C. R. (2000). Long-term productivity of a Grevillea
robusta-based overstorey agroforestry system in semi-arid Kenya: II. Crop growth and system
performance. Forest ecology and management, 139(1), 187-201. DOI: 10.1016/S0378-
1127(00)00267-X.
Mwinuka, L., Schneider, I., Maeda, C., Mutabazi, K. D., Makindara, J., Graef, F., ... & Swamila, M.
(2015). Comparing stakeholder views for mutual acceptable food value chain upgrading
strategies in Tanzania. African Journal of Agricultural Research, 10(12), 1376-1385. DOI:
10.5897/AJAR2014.8901.
Macartney, J. C., & Northwood, P. J. (1971). Effect of different cultivation techniques on soil
moisture. Conservation and the establishment and yield of maize at Kongwa, central Tanzania.
Trop Agr St Augustine.
MAFAP. (2013). Review of food and agricultural policies in the united republic of Tanzania 2005-
2011, (July). MAFAP Country Report Series, FAO, Rome, Italy.
Magombeyi, M. S., Rollin, D., & Lankford, B. (2008). The river basin game as a tool for collective
water management at community level in South Africa. Physics and Chemistry of the Earth,
Parts A/B/C, 33(8), 873-880. DOI: 10.1016/j.pce.2008.06.045.
Mahoo, H.F., F.C. Kahimba, K.D. Mutabazi, S.D. Tumbo, F.B. Rwehumbiza, P. Reuben, B.P.
141
Mbilinyi, and J.W. Gowing. (2012): Adoption and up scaling of water harvesting technologies in
Tanzania. Chapter 6. In: Eds. W. Christley and J. Gowing. Water Harvesting Technologies in
SSA: State of the Art. Earth Scan Publishers.
Makumba, W., Janssen, B., Oenema, O., Akinnifesi, F. K., Mweta, D., & Kwesiga, F. (2006). The
long-term effects of a gliricidia–maize intercropping system in Southern Malawi, on gliricidia
and maize yields, and soil properties. Agriculture, ecosystems & environment, 116(1), 85-92.
DOI: 10.1016/j.agee.2006.03.012.
Mallick, D., & Rafi, M. (2010). Are female-headed households more food insecure? Evidence from
Bangladesh. World development, 38(4), 593-605. DOI: 10.1016/j.worlddev.2009.11.004.
Marshall, C., & Rossman, G. B. (2014). Designing qualitative research. Sage publications.
Martin, B., & Abbott, E. (2010). Development calling: the use of mobile phones in agriculture
development in Uganda. International Federation for Information Processing (IFIP), Technical
Commission.
Masuka, B., Matenda, T., Chipomho, J., Mapope, N., Mupeti, S., Tatsvarei, S., & Ngezimana, W.
(2016). Mobile phone use by small-scale farmers: a potential to transform production and
marketing in Zimbabwe. South African Journal of Agricultural Extension, 44(2), 121-135. DOI:
10.17159/2413-3221/2016/v44n2a406.
Mazur, R., & Onzere, S. (2009). Social networks and status in adopting agricultural technologies and
practices among small-scale farmers in Uganda. Innovation Africa: enriching farmers
livelihoods. Earthscan, London, 120-134.
Mbwana, H. A., Kinabo, J., Lambert, C., & Biesalski, H. K. (2016). Determinants of household
dietary practices in rural Tanzania: Implications for nutrition interventions. Cogent Food &
Agriculture, 2(1), 1224046. DOI: 10.1080/23311932.2016.1224046.
McNamara, K. S. (2003). Information and Communication Technologies, Poverty and Development:
Learning from Experience.
Meikle, W. G., Markham, R. H., Nansen, C., Holst, N., Degbey, P., Azoma, K., & Korie, S. (2002).
Pest management in traditional maize stores in West Africa: a farmer‘s perspective. Journal of
Economic Entomology, 95(5), 1079-1088. DOI: 10.1603/0022-0493-95.5.1079.
Misaki, E., Apiola, M., & Gaiani, S. (2015, June). Technology for agriculture: Information channels
for decision making in Chamwino, Tanzania. In Engineering, Technology and
Innovation/International Technology Management Conference (ICE/ITMC), 2015 IEEE
International Conference on (pp. 1-8). IEEE.
Mizruchi, M. S., & Potts, B. B. (1998). Centrality and power revisited: actor success in group decision
making. Social Networks, 20(4), 353-387. DOI: 10.1016/S0378-8733(98)00009-4.
Mnenwa, R., & Maliti, E. (2010). A comparative analysis of poverty incidence in farming systems of
Tanzania. Research on Poverty Alleviation.
MoHSW (2004). Tanzania National Strategy on Infanta and Young Child Nutrition Implementation
Plan. Dar es Salaam, Tanzania.
Monge, P. R., & Contractor, N. S. (2003). Theories of communication networks. Oxford University
Press, USA.
Monge, P.R. and Contractor, N.S. (2003): Theories of communication networks.
142
Morgan, D. L. (1996). Focus groups. Annual review of sociology, 22(1), 129-152. DOI:
10.1146/annurev.soc.22.1.129.
Motsi, K. E., Chuma, E., & Mukamuri, B. B. (2004). Rainwater harvesting for sustainable agriculture
in communal lands of Zimbabwe. Physics and Chemistry of the Earth, Parts A/B/C, 29(15),
1069-1073. DOI: 10.1016/j.pce.2004.08.008.
Moussa, B., Otoo, M., Fulton, J., & Lowenberg-DeBoer, J. (2011). Effectiveness of alternative
extension methods through radio broadcasting in West Africa. The Journal of Agricultural
Education and Extension, 17(4), 355-369. DOI: 10.1080/1389224X.2011.576826.
Muchiri, S.V. (2004). Characterization and purification of African nightshade accessions for
sustainable seed purification in Kenya. In the Proceedings of the Third Horticulture Workshop on
Sustainable Horticultural Production in the Tropics, 26th–29th November 2003. Maseno
University, MSU, Maseno, Kenya. Available at Web site http://www.igps.uni-
hannover.de/fileadmin/gemuesebau/pdf/SVepit/PROCEEDINGS_2003.pdf
Mudatenguha, F., Anena, J., Kiptum, C. K., & Mashingaidze, A. B. (2014). In Situ Rainwater
Harvesting Techniques Increase Maize Growth and Grain Yield in a Semi-arid Agro-ecology of
Nyagatare, Rwanda. International Journal of Agriculture & Biology, 16(5), 996-1000.
Müller, C. (2011). Agriculture: Harvesting from uncertainties. Nature Climate Change, 1(5), 253.
DOI: 10.1038/nclimate1179.
Munshi, K., & Myaux, J. (1998). Social Effects in the Demographic Transition: Evidence from
Matlab, Bangladesh. Mimeo. University of Pennsylvania.
Munslow, B., Katerere, Y., Ferf, A., & O'Keefe, P. (2013). The fuelwood trap: A study of the SADCC
region. Routledge.
Murdock, L. L., Margam, V., Baoua, I., Balfe, S., & Shade, R. E. (2012). Death by desiccation: effects
of hermetic storage on cowpea bruchids. Journal of stored products research, 49, 166-170. DOI:
10.1016/j.jspr.2012.01.002.
Muto, M., & Yamano, T. (2009). The impact of mobile phone coverage expansion on market
participation: Panel data evidence from Uganda. World development, 37(12), 1887-1896. DOI:
10.1016/j.worlddev.2009.05.004.
Mutungi, C. M., Affognon, H., Njoroge, A. W., Baributsa, D., & Murdock, L. L. (2014). Storage of
mung bean (Vigna radiata [L.] Wilczek) and pigeonpea grains (Cajanus cajan [L.] Millsp) in
hermetic triple-layer bags stops losses caused by Callosobruchus maculatus (F.)(Coleoptera:
Bruchidae). Journal of Stored Products Research, 58, 39-47. DOI: 10.1016/j.jspr.2014.03.004.
Mwakaje, A. G. (2010). Information and communication technology for rural farmer‘s market access
in Tanzania.
Navarro, S. (1978). The effects of low oxygen tensions on three stored-product insect pests.
Phytoparasitica, 6(2), 51-58. DOI: 10.1007/BF02980382.
Nellemann, C. (Ed.). (2009). The environmental food crisis: the environment's role in averting future
food crises: a UNEP rapid response assessment. UNEP/Earthprint.
Nesamvuni, C., Steyn, N. P., & Potgieter, M. J. (2001). Nutritional value of wild, leafy plants
consumed by the Vhavenda: research letter. South African Journal of Science, 97(1-2), 51-54.
Ngigi, S. N. (2003). What is the limit of up-scaling rainwater harvesting in a river basin?. Physics and

143
Chemistry of the Earth, Parts A/B/C, 28(20), 943-956.DOI: 10.1016/j.pce.2003.08.015.
Niñez, V. K. (1984). Household gardens: theoretical considerations on an old survival strategy.
Potatoes in Food Systems Research Series, 1, 1-41.
Njoroge, A. W., Affognon, H. D., Mutungi, C. M., Manono, J., Lamuka, P. O., & Murdock, L. L.
(2014). Triple bag hermetic storage delivers a lethal punch to Prostephanus truncatus
(Horn)(Coleoptera: Bostrichidae) in stored maize. Journal of Stored Products Research, 58, 12-
19. DOI: 10.1016/j.jspr.2014.02.005.
Nordin, S., & Nordin, K. (2005). Permaculture network of Malawi. Personal communication with
Stacia Nordin, World Food Program, Malawi.
North, D. C. (1990). Institutions, institutional change and economic performance. Cambridge
university press.
Nyadzi, G. I., Otsyina, R. M., Banzi, F. M., Bakengesa, S. S., Gama, B. M., Mbwambo, L., & Asenga,
D. (2003). Rotational woodlot technology in northwestern Tanzania: Tree species and crop
performance. Agroforestry Systems, 59(3), 253-263. DOI:
10.1023/B:AGFO.0000005226.62766.05.
Nyagumbo, I. (1993). The influence of socio-economic factors on potential adoption of no-till tied
ridging in four communal areas of Zimbabwe.
Nyamba, S. Y., & Mlozi, M. R. (2012). Factors influencing the use of mobile phones in
communicating agricultural information: A case of Kilolo District, Iringa, Tanzania.
International Journal of Information and Communication Technology Research, 2(7).
Ochse, J.J., and G.J.A. Terra. (1937). The economic aspect of the "Koetawinangoen report."
Landbouw 13:54-6. (in Dutch with English summary.)
Ohm, H. W., Nagy, J. G. & Sawadogo, S. (1985b). Complementary effects of tied ridging and
fertilization with cultivation by manual, donkey and ox traction. In Appropriate Technologies for
Farmers in Semi-Arid West Africa, 61-73 (Eds H. W. Ohm & J. G. Nagy). West Lafayette,
Indiana: International Programs in Agriculture, Purdue University.
Ojo, J. A., & Omoloye, A. A. (2012). Rearing the Maize Weevil, Sitophilus zeamais, on an artificial
maize—cassava diet. Journal of Insect Science, 12(69), 1-9. DOI: 10.1673/031.012.6901.
Orwa, C., Mutua, A., Kindt, R., Jamnadass, R., & Simons, A. (2009). Agroforestree database: a tree
species reference and selection guide version 4.0. World Agroforestry Centre ICRAF, Nairobi,
KE.
Paavola, J. (2008). Livelihoods, vulnerability and adaptation to climate change in Morogoro,
Tanzania. Environmental Science & Policy, 11(7), 642-654. DOI: 10.1016/j.envsci.2008.06.002.
Pantenius, C. U. (1988). Storage losses in traditional maize granaries in Togo. International Journal of
Tropical Insect Science, 9(06), 725-735. DOI: 10.1017/S1742758400005610.
Perz, S. G. (2003). Social determinants and land use correlates of agricultural technology adoption in a
forest frontier: A case study in the Brazilian Amazon. Human Ecology, 31(1), 133-165. DOI:
10.1023/A:1022838325166.
Piha, M. I. (1993). Optimizing fertilizer use and practical rainfall capture in a semi-arid environment
with variable rainfall. Experimental Agriculture, 29(04), 405-415. DOI:
10.1017/S0014479700021128.
Powell, R. A., & Single, H. M. (1996). Mathodology Mathers V. Focus Groups. Intern J Quality
Health Care, 8, 499-504. DOI: 10.1093/intqhc/8.5.499.
144
Prasantha, B. R., Hafeel, R. F., Wimalasiri, K. M. S., & Pathirana, U. P. D. (2014). End-use quality
characteristics of hermetically stored paddy. Journal of Stored Products Research, 59, 158-166.
Pretty, J. N. (1995). Participatory learning for sustainable agriculture. World development, 23(8),
1247-1263. DOI: 10.1016/0305-750X(95)00046-F.
Pretty, J. (1999). Can sustainable agriculture feed Africa? New evidence on progress, processes and
impacts. Environment, development and sustainability, 1(3), 253-274. DOI:
10.1023/A:1010039224868.
Pretty, J., & Ward, H. (2001). Social capital and the environment. World development, 29(2), 209-227.
DOI: 10.1016/S0305-750X(00)00098-X.
Reij, C., Scoones, I., & Toulmin, C. (2013). Sustaining the soil: indigenous soil and water
conservation in Africa. Routledge.
Rickman, J. F., & Aquino, E.U. (2004, August). Appropriate technology for maintaining grain quality
in small-scale storage. In 2007) Proc. Int. Conf. Controlled Atmosphere and Fumigation in
Stored Products, Gold-Coast Australia (pp. 149-157).
Riisgaard, L., Bolwig, S., Ponte, S., Du Toit, A., Halberg, N., & Matose, F. (2010). Integrating poverty
and environmental concerns into value‐chain analysis: a strategic framework and practical guide.
Development Policy Review, 28(2), 195-216.
Rogers, E. (2003). Diffusion of Innovations. New York: Simon & Schuster, Limited.
Rogers, E. M. (1995). Difiusion of innovations. The Free.
Roose, E., & Piot, J. (1984). Runoff, erosion and soil fertility restoration on the Mossi Plateau (central
Upper Volta). IAHS-AISH publication, (144), 485-498.
Rosegrant, M. W., & Cline, S. A. (2003). Global food security: challenges and policies. Science,
302(5652), 1917-1919.
Roy, S. K., Fuchs, G. J., Mahmud, Z., Ara, G., Islam, S., Shafique, S., ... & Chakraborty, B. (2005).
Intensive nutrition education with or without supplementary feeding improves the nutritional
status of moderately-malnourished children in Bangladesh. Journal of Health, Population and
Nutrition, 320-330.
Sanders, J. H., Shapiro, B. I., & Ramaswamy, S. (1996). The economics of agricultural technology in
semi-arid sub-Saharan Africa. Johns Hopkins University Press.
Sandström, A. (2004). Innovative policy networks: the relation between structure and performance
(Doctoral dissertation, Luleå tekniska universitet).
Sanginga, P. C., Best, R., Chitsike, C., Delve, R., Kaaria, S., & Kirkby, R. (2004). Enabling rural
innovation in Africa: An approach for integrating farmer participatory research and market
orientation for building the assets of rural poor. Uganda Journal of Agricultural Sciences, 9(1),
942-957.
Sarvade, S., Singh, R., Prasad, H., & Prasad, D. (2014). Agroforestry Practices for Improving Soil
Nutrient Status. Volume-2, Issue-1 (January-March).
Sasson, A. (2012). Food security for Africa: an urgent global challenge. Agriculture & Food Security,
1(1), 2. DOI: 10.1186/2048-7010-1-2.
Schiffer, E., & Hauck, J. (2002). Net-Map: Influence network mapping–theory. Small reservoirs

145
toolkit. CGIAR challenge program on Water for Food. http://www. smallreservoirs.
org/full/toolkit/docs/IVb.
Schiffer, E. (2007). Net-Map Toolbox: Manual. Washington, DC: International Food Policy Research
Institute. http://Net-Map.files.wordpress.com/2008/06/Net-Map-manual-long1.pdf.
Schiffer, E. (2008). Net-Map toolbox: Influence mapping of social networks.
Schiffer, E. (2008). Tracing Power and Influence in Networks: Net-Map as a Tool for Research and
Strategic Network Planning. In: IFPRI Discussion Paper (00772).
Schiffer, E., Narrod, C., & von Grebmer, K. (2008). The Role of Information Networks in
Communicating and Responding to HPAI Outbreaks. HPAI Research Brief, (5).
Schiffer, E., & Peakes, J. (2009). An innovative approach to building stronger coalitions: the Net-Map
Toolbox. DOI: 10.1080/09614520802576500.
Schiffer, E., & Hauck, J. (2010). Net-Map: collecting social network data and facilitating network
learning through participatory influence network mapping. Field Methods, 22(3), 231-249. DOI:
10.1177/1525822X10374798.
Schindler, J., Graef, F., König, H. J., Mchau, D., Saidia, P., & Sieber, S. (2016). Sustainability impact
assessment to improve food security of smallholders in Tanzania. Environmental Impact
Assessment Review, 60, 52-63. DOI: 10.1016/j.eiar.2016.04.006.
Schnegg, M., & Lang, H. (2002). Network analysis. A practice-oriented introduction. Methods of
ethnography, 1, 1-55.
Schmidhuber, J., & Tubiello, F. N. (2007). Global food security under climate change. Proceedings of
the National Academy of Sciences, 104(50), 19703-19708. DOI: 10.1073/pnas.0701976104.
Scoones, I. (1998). Sustainable rural livelihoods: a framework for analysis.
Seibert, B. (1987). Management of plantation cocoa under gliricidia. Gliricidia sepium, 87-01.
Seligman, H. K., Laraia, B. A., & Kushel, M. B. (2010). Food insecurity is associated with chronic
disease among low-income NHANES participants. The Journal of nutrition, 140(2), 304-310.
DOI: 10.3945/jn.109.112573.
Shemdoe, R. S. (2011). Tracking effective indigenous adaptation strategies on impacts of climate
variability on food security and health of subsistence farmers in Tanzania.
Singh, V. S., & Pandey, D. N. (2011). Multifunctional agroforestry systems in India: Science-based
policy options. Climate Change and CDM Cell. Rajasthan State Pollution Control Board.
Jaipur.
Spielman, D. J., & Birner, R. (2008). How innovative is your agriculture? Using innovation indicators
and benchmarks to strengthen national agricultural innovation systems. World Bank.
Stathers, T. E., Riwa, W., Mvumi, B. M., Mosha, R., Kitandu, L., Mngara, K., ... & Morris, M. (2008).
Do diatomaceous earths have potential as grain protectants for small-holder farmers in sub-
Saharan Africa? The case of Tanzania. Crop Protection, 27(1), 44-70. DOI:
10.1016/j.cropro.2007.04.020.
Stein, C., Ernstson, H., & Barron, J. (2011). A social network approach to analyzing water
governance: The case of the Mkindo catchment, Tanzania. Physics and Chemistry of the Earth,
Parts A/B/C, 36(14), 1085-1092. DOI: 10.1016/j.pce.2011.07.083.
146
Stern, R., Van Der Merwe, A. J., Laker, M. C., & Shainberg, I. (1992). Effect of soil surface
treatments on runoff and wheat yields under irrigation. Agronomy Journal, 84(1), 114-119. DOI:
10.2134/agronj1992.00021962008400010022x.
Stern, M. J., & Adams, A. E. (2010). Do rural residents really use the internet to build social capital?
An empirical investigation. American Behavioral Scientist. DOI:0.1177/0002764210361692.
Tadesse, G., & Bahiigwa, G. (2015). Mobile phones and farmers‘ marketing decisions in Ethiopia.
World development, 68, 296-307. DOI: 10.1016/j.worlddev.2014.12.010.
Taylor, H. M. (1983). Managing root systems for efficient water use: an overview. Limitations to
efficient water use in crop production, (limitationstoef), 87-113.
Tefera, T. (2012). Post-harvest losses in African maize in the face of increasing food shortage. Food
security, 4(2), 267-277.
Tenkouano, A. (2011). The nutritional and economic potential of vegetables. World Watch Institute
(Ed.), The state of the world, 27-35.
TFNC (Tanzania Food and Nutrition Centre) (2014). National Nutrition Survey 2014 collection. With
assistance of Ministry of Health and Social Welfare Tanzania. Tanzania. Available online at
http://reliefweb.int/sites/reliefweb.int/files/resources/Tanzania_National_Nutrition_Survey_2014
Thomasson, D. A. (1994). Montserrat kitchen gardens: Social functions and development potential.
Caribbean Geography, 5(1), 20.
Thompson, B., & Subasinghe, R. (2011). Aquaculture's role in improving food and nutrition security:
pp. 150-162 In: Thompson, B. & Amoroso, L.(ed.) Combating micronutrient deficiencies: food-
based approaches.
Thornton, P. K., Van de Steeg, J., Notenbaert, A., & Herrero, M. (2009). The impacts of climate
change on livestock and livestock systems in developing countries: A review of what we know
and what we need to know. Agricultural Systems, 101(3), 113-127. DOI:
10.1016/j.agsy.2009.05.002.
Tichenor, P. J., Donohue, G. A., & Olien, C. N. (1970). Mass media flow and differential growth in
knowledge. Public opinion quarterly, 34(2), 159-170. DOI: 10.1086/267786.
Trans-SEC. (2016): http://project2.zalf.de/trans-sec/public/factsheet. Accessed 15th Dec. 2016
Tzatha, A., & Schepers, J. (2009). The limitations of social network analysis. Journal of Network
Theory, 4(2), 1-3.
Uchino, B. N. (2004). Social support and physical health: Understanding the health consequences of
relationships. Yale University Press.
UNICEF (2009). Tracking Progress on Child and Maternal Nutrition:A Survival and Development
Priority. UNICEF: New York, NY.
UNICEF (2016). Available at web site http://www.unicef.org/tanzania/nutrition.html
UN (2013). ―Statistics, United Republic of Tanzania,‖ UNICEF, New York, NY. http://
www.unicef.org/infobycountry/tanzania_statistics.html (accessed June 24, 2013).
UN (2015). Department of Economic and Social Affairs, Population Division. World Population
Prospects: The 2015 Revision, Key Findings and Advance Tables. Working Paper No.

147
ESA/P/WP.241.
UNAIDS/WHO (Joint United Nations Programme on HIV/AIDS/ World Health Organization)
Working Group on Global HIV/AIDS and STI Surveillance. Guidelines for conducting HIV
sentinel sero surveys among pregnant women and other groups. Geneva: UNAIDS; 2003.
URT (1997): United Republic of Tanzania. Mbeya District Socio-Economic Profile. 129pp.
URT (2001). Agricultural Sector Development Strategy. Ministry of Agriculture, Dares Salaam.
URT (2005). National strategy for growth and reduction of poverty (NSGRP). Tanzania.
URT (2012): National Agriculture Policy, Ministry of Agriculture Food Security and Cooperatives
Dar Es Salaam, Tanzania.
URT (2013). National Agriculture Policy, Ministry of Agriculture Food Security and Cooperatives
Dar Es Salaam, Tanzania
USAID (2008): Preliminary Rural Livelihood Zoning: Tanzania – A special report by the famine early
warning system network (FEWS NET), USAID, Dar es Salaam.
Verheye, W. H. (2000). Food production or food aid? An African challenge. Finance and
Development, 38-41.
Wanjek, C. (2005). Food at Work: Workplace solutions for malnutrition, obesity and chronic diseases.
International Labour Organization.
Wasserman, S., & Faust, K. (1994). Social network analysis: Methods and applications (Vol. 8).
Cambridge university press.
Webb, P., Von Braun, J., & Yohannes, Y. (1992). Famine in Ethiopia: policy implications of coping
failure at national and household levels (Vol. 92). Intl Food Policy Res Inst.
Wegren, S. K. (2013). Food security in the Russian Federation. Eurasian geography and economics,
54(1), 22-41.
Weinberger, K., & Msuya, J. M. (2004). Indigenous vegetables in Tanzania: significance and
prospects (Vol. 600). AVRDC-WorldVegetableCenter.
Wheeler, T., & Von Braun, J. (2013). Climate change impacts on global food security. Science,
341(6145), 508-513. DOI: 10.1126/science.1239402.
Whitfield, L. (2006). The politics of urban water reform in Ghana 1. Review of African political
economy, 33(109), 425-448.
Williams, S. B., Baributsa, D., & Woloshuk, C. (2014). Assessing Purdue Improved Crop Storage
(PICS) bags to mitigate fungal growth and aflatoxin contamination. Journal of Stored Products
Research, 59, 190-196. DOI: 10.1016/j.jspr.2014.08.003.
Wiyo, K. A., Kasomekera, Z. M., & Feyen, J. (1999). Variability in ridge and furrow size and shape
and maize population density on small subsistence farms in Malawi. Soil and Tillage Research,
51(1), 113-119. DOI: 10.1016/S0167-1987(99)00033-1.
World Bank (1996). Poverty Reduction and the World Bank: Progress and Challenges in the 1990s
(The International Bank for Reconstruction and Development/ The World Bank, Washington,
DC, 1996).
World Bank (2011). World Development Report 2011: Conflict, Security, and Development.
148
Washington, DC: s.n.
World Bank (2015). Tanzania Overview. Available online at http://www.worldbank.org/
en/country/tanzania/overview. Accessed 20 October 2016.
World Bank (2016). Development Goals in an Era of Demographic Change, Washington, DC: sn.
WFP (2007). Executive Brief: Tanzania Comprehensive Food Security and Vulnerability Analysis.
United Nations World Food Program. Available online at
http://documents.wfp.org/stellent/groups/public/documents/ena/WFP119800.pdf?iframe-
WFP (2010). United Republic of Tanzania 2009/10 Comprehensive Food Security and Vulnerability
Analysis. World Food Programme, Rome, Italy.
WHO (2013). World Health Organisation 2013. Available online at
http://www.who.int/trade/glossary/story028/en/.
Wright, M., Akou-Edi, D., & Stabrawa, A. (1993). Infestation of dried cassava and maize by
Prostephanus truncatus: entomological and socio-economic assessments for the development of
loss reduction strategies. Larger Grain Borer Project, Togo. Chatham, United Kingdom: NRI.
Yakubu, A. (2009). Non-chemical on-farm hermetic maize storage in East Africa.
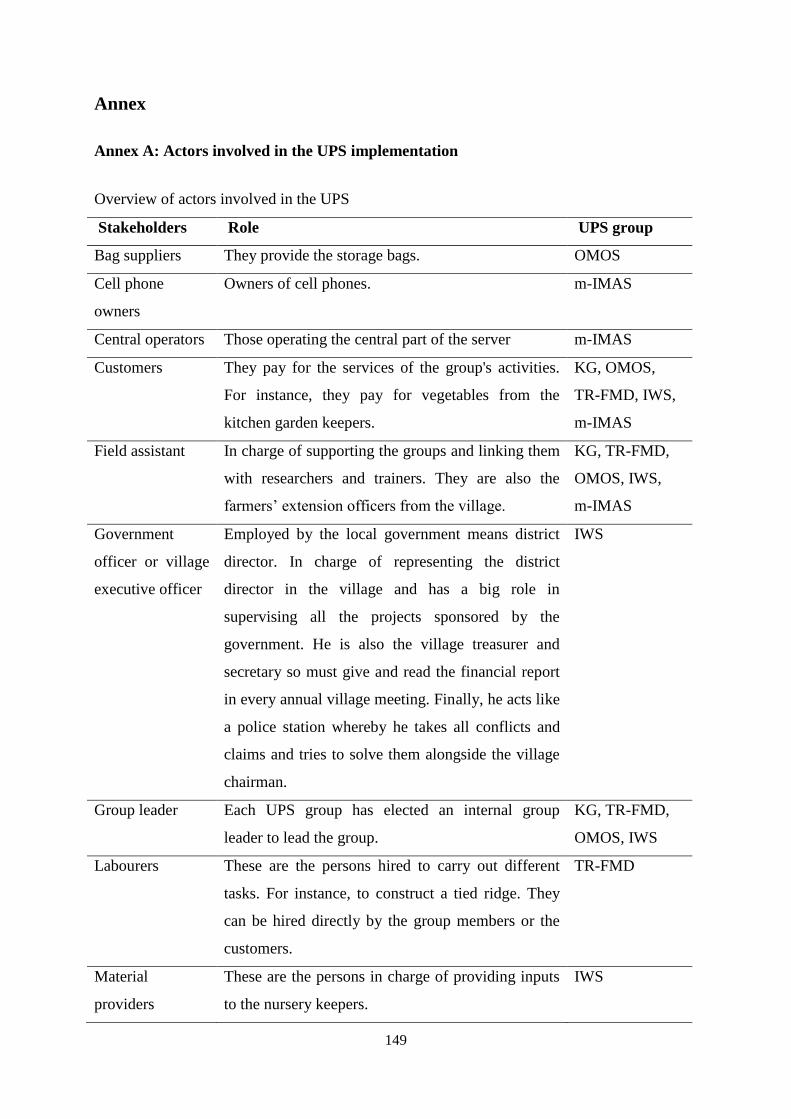
149
Annex
Annex A: Actors involved in the UPS implementation
Overview of actors involved in the UPS
Stakeholders Role UPS group
Bag suppliers They provide the storage bags. OMOS
Cell phone
owners
Owners of cell phones. m-IMAS
Central operators Those operating the central part of the server m-IMAS
Customers They pay for the services of the group's activities.
For instance, they pay for vegetables from the
kitchen garden keepers.
KG, OMOS,
TR-FMD, IWS,
m-IMAS
Field assistant In charge of supporting the groups and linking them
with researchers and trainers. They are also the
farmers‘ extension officers from the village.
KG, TR-FMD,
OMOS, IWS,
m-IMAS
Government
officer or village
executive officer
Employed by the local government means district
director. In charge of representing the district
director in the village and has a big role in
supervising all the projects sponsored by the
government. He is also the village treasurer and
secretary so must give and read the financial report
in every annual village meeting. Finally, he acts like
a police station whereby he takes all conflicts and
claims and tries to solve them alongside the village
chairman.
IWS
Group leader Each UPS group has elected an internal group
leader to lead the group.
KG, TR-FMD,
OMOS, IWS
Labourers
These are the persons hired to carry out different
tasks. For instance, to construct a tied ridge. They
can be hired directly by the group members or the
customers.
TR-FMD
Material
providers
These are the persons in charge of providing inputs
to the nursery keepers.
IWS
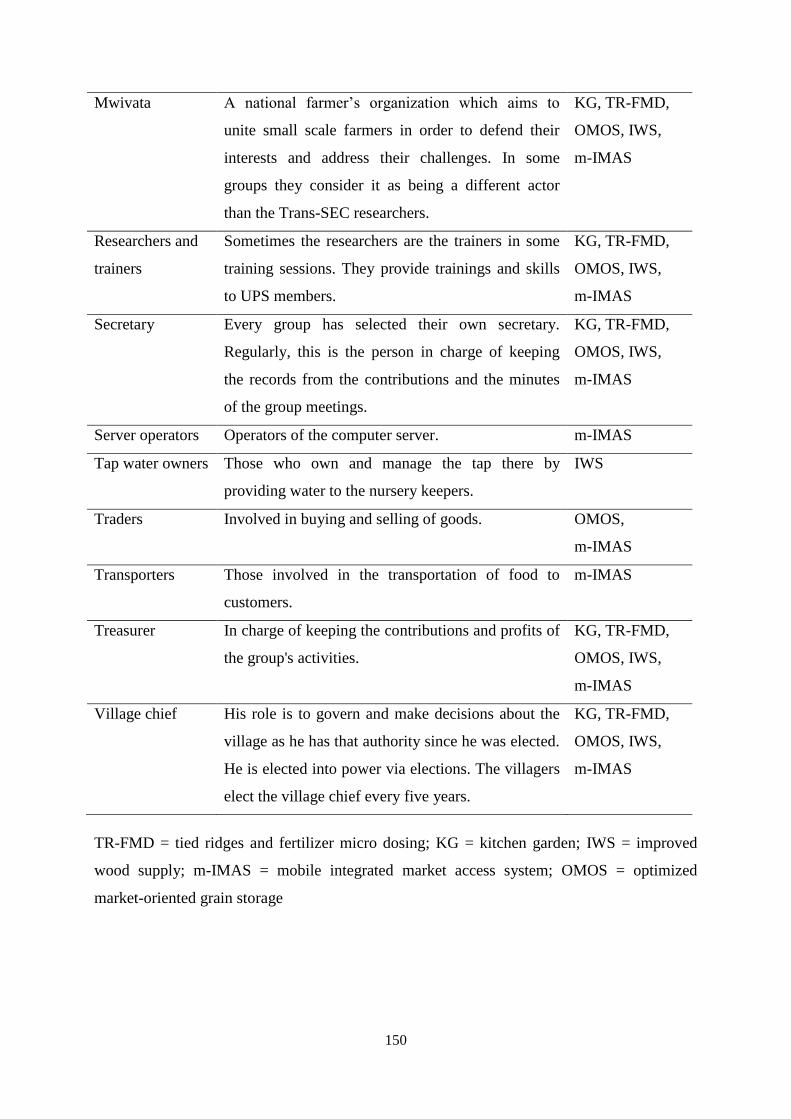
150
Mwivata A national farmer‘s organization which aims to
unite small scale farmers in order to defend their
interests and address their challenges. In some
groups they consider it as being a different actor
than the Trans-SEC researchers.
KG, TR-FMD,
OMOS, IWS,
m-IMAS
Researchers and
trainers
Sometimes the researchers are the trainers in some
training sessions. They provide trainings and skills
to UPS members.
KG, TR-FMD,
OMOS, IWS,
m-IMAS
Secretary Every group has selected their own secretary.
Regularly, this is the person in charge of keeping
the records from the contributions and the minutes
of the group meetings.
KG, TR-FMD,
OMOS, IWS,
m-IMAS
Server operators Operators of the computer server. m-IMAS
Tap water owners Those who own and manage the tap there by
providing water to the nursery keepers.
IWS
Traders Involved in buying and selling of goods. OMOS,
m-IMAS
Transporters Those involved in the transportation of food to
customers.
m-IMAS
Treasurer In charge of keeping the contributions and profits of
the group's activities.
KG, TR-FMD,
OMOS, IWS,
m-IMAS
Village chief His role is to govern and make decisions about the
village as he has that authority since he was elected.
He is elected into power via elections. The villagers
elect the village chief every five years.
KG, TR-FMD,
OMOS, IWS,
m-IMAS
TR-FMD = tied ridges and fertilizer micro dosing; KG = kitchen garden; IWS = improved
wood supply; m-IMAS = mobile integrated market access system; OMOS = optimized
market-oriented grain storage

151
Annex B: Centrality measures of the material networks for the KG, TR-FMD, OMOS
and IWS
Sub-humid Morogoro Semi-arid Dodoma
Ilakala Changarawe Ilolo Idifu
Actors
Indeg
ree
Outd
egre
e
Bet
wee
nes
s
Indeg
ree
Outd
egre
e
Bet
wee
nes
s
Indeg
ree
Outd
egre
e
Bet
wee
nes
s
Indeg
ree
Outd
egre
e
Bet
wee
nes
s
Kitchen garden (KG)
KG keepers 17 1 0.7 14 1 0 19 4 0.3 21 8 0.3
Group leader 11 6 0 13 15 5 11 11 9.3 18 18 0.3
Secretary 12 2 0.7 12 1 0 14 8 0 13 7 0
Treasurer 15 2 0.7 12 1 13 9 9 0.3 11 13 1.8
Field assistant 7 28 13 8 22 0 2 19 8.3 5 18 0.3
Researchers & trainers 0 19 0 1 19 12 2 7 5 3 23 0.8
Tied ridges and fertilizer micro dosing (TR)
Small farmers 0 12 0 12 2 0 12 0 0 13 0 0
Group leader 0 11 0 10 6 0 13 0 0 10 1 0
Secretary 0 11 0 13 1 0 12 4 3 10 1 1
Treasurer 1 11 0 14 0 0 - - - 7 0 0
Field assistant 28 6 0 8 28 4 6 17 0 2 29 1
Researchers & trainers 25 0 0 0 19 0 1 23 1 0 10 0
Labourers 0 3 0 0 0 0
Optimized market-oriented grain storage (OMOS)
Bag users 7 1 4 7 0 0
Group leader 5 0 0 5 0 0
Secretary 4 1 0 5 0 0
Treasurer 3 3 0 4 3 0
Field assistant 6 15 13 4 19 8
Researchers & trainers 0 3 0 2 3 0
Improved wood supply (IWS)
Nursery keepers 9 6 1
Group Leader 9 5 6
Secretary 15 2 3.5
Treasurer 9 5 4.5
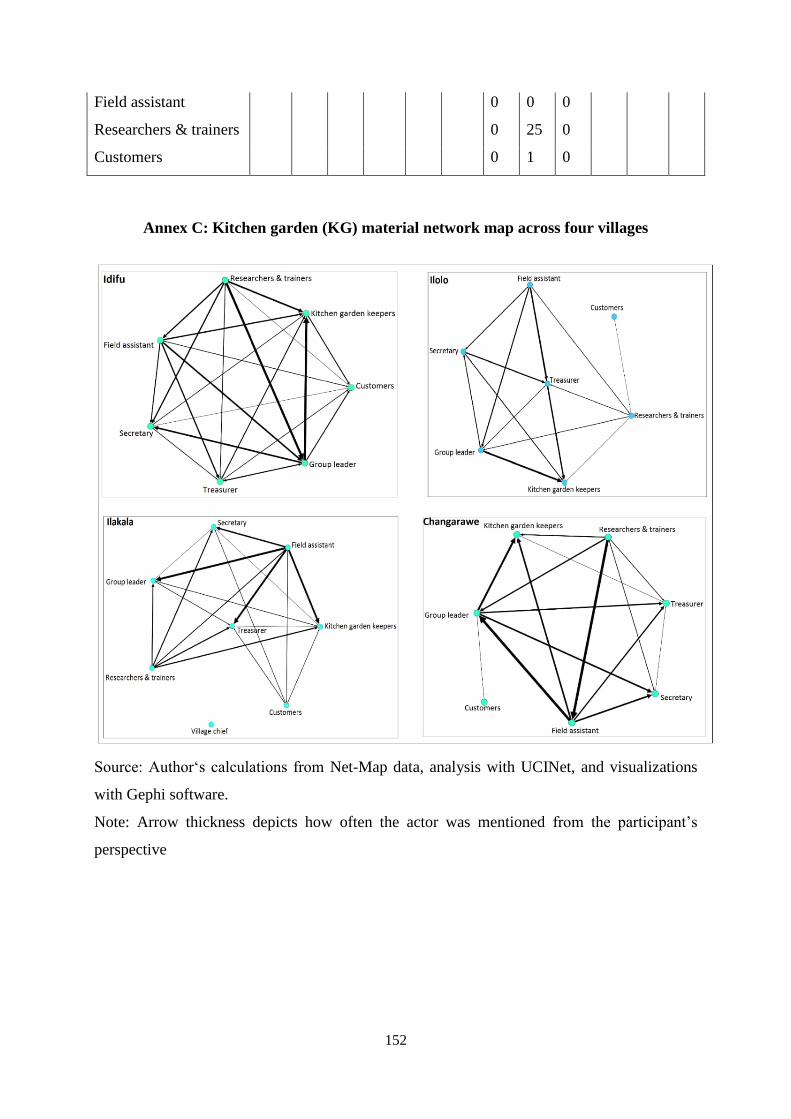
152
Field assistant 0 0 0
Researchers & trainers 0 25 0
Customers 0 1 0
Annex C: Kitchen garden (KG) material network map across four villages
Source: Author‗s calculations from Net-Map data, analysis with UCINet, and visualizations
with Gephi software.
Note: Arrow thickness depicts how often the actor was mentioned from the participant‘s
perspective

153
Annex D: Tied ridges and fertilizer micro dosing money network map across four
villages
Source: Author‗s calculations from Net-Map data, analysis with UCINet, and visualizations
with Gephi software.
Note: Arrow thickness depicts how often the actor was mentioned from the participant‘s
perspective
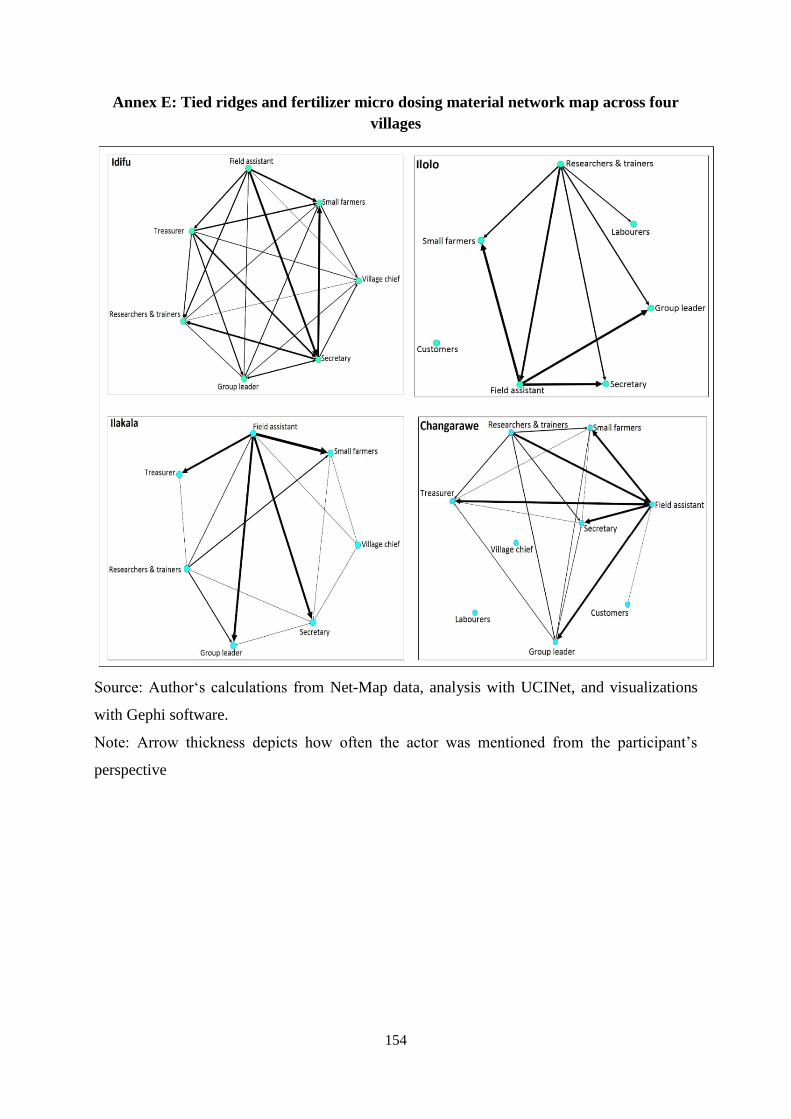
154
Annex E: Tied ridges and fertilizer micro dosing material network map across four
villages
Source: Author‗s calculations from Net-Map data, analysis with UCINet, and visualizations
with Gephi software.
Note: Arrow thickness depicts how often the actor was mentioned from the participant‘s
perspective
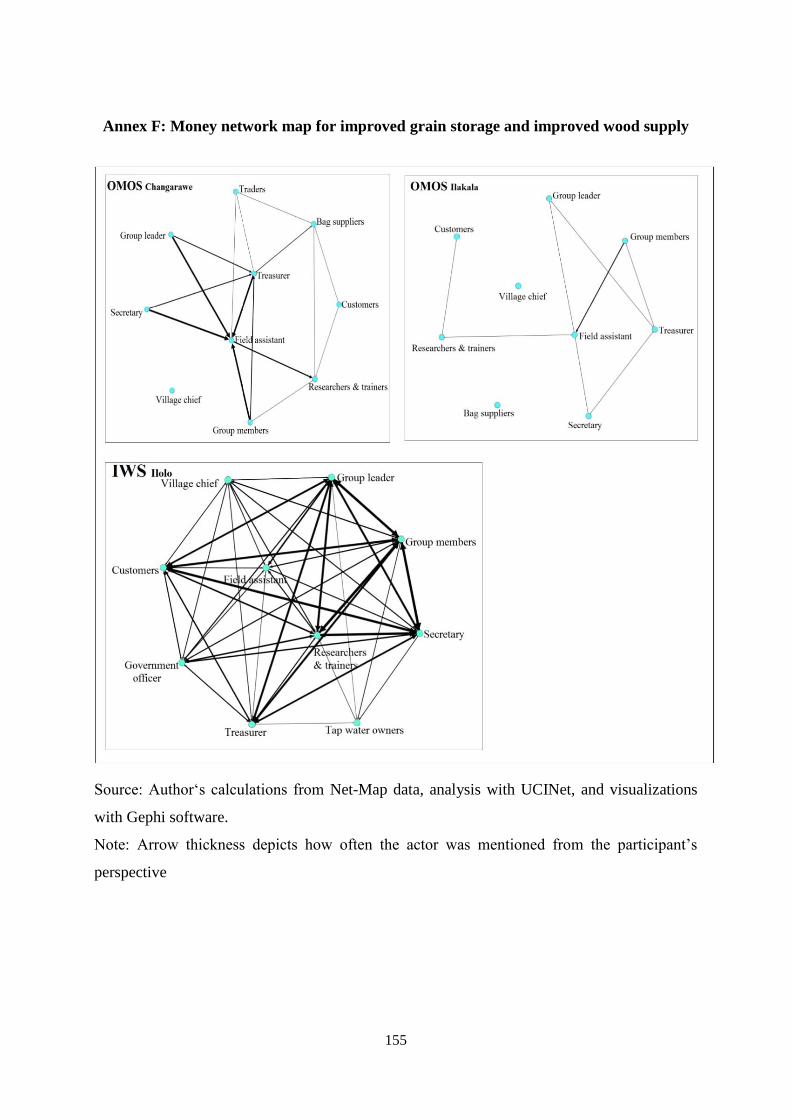
155
Annex F: Money network map for improved grain storage and improved wood supply
Source: Author‗s calculations from Net-Map data, analysis with UCINet, and visualizations
with Gephi software.
Note: Arrow thickness depicts how often the actor was mentioned from the participant‘s
perspective

156
Annex G: Material network map for improved grain storage and improved wood supply
Source: Author‗s calculations from Net-Map data, analysis with UCINet, and visualizations
with Gephi software.
Note: Arrow thickness depicts how often the actor was mentioned from the participant‘s
perspective

157
Annex H: Individual interviews and Focus Group Discussion plans
Introduction
―My name is Ernestine Mefor Halle, a master‘s student at the University of Hohenheim
(Germany). I am doing my thesis in collaboration with the Trans-SEC project. I am currently
conducting a research study on ―Social network analysis of stakeholder groups implementing
upgrading strategies to enhance food security in rural regions of Tanzania‖. My curiosity lies
in understanding the different actors involved in the UPS implementation, how they are
linked, activities UPS members are engaged in as a group, their motivations for taking part in
the UPS and understanding the most influential actors in the UPS implementation. I would be
most pleased if you can take part in the interview and Net-Map session.
If you agree to take part, I will begin by asking some few questions about the UPS group and
later we will draw a Net-Map together. Kindly retain in mind that there is no ―wrong‖ or
―right‖ answer to a question. I just want to get your point of view. Please, also feel free to
interrupt me once in a while during the interview process to share your opinion. Your
partaking will be voluntary. It is okay if you do not want to participate. You are also not
obliged to reply to all questions. You can also pull out from the conversation at any time. I
will do a record of the session. Please also bear in mind that notes will be taken to ensure I
effectively grasp your ideas during the dialogue. Nevertheless, your remarks and name will
remain anonymous. The interview will take between 2 to 3 hr. I hope you will be happy
sharing your views honorably. Thank you‖

158
Consent form UPS group: ____________________________________
Village: _________________________ Location: ______________________
District: ________________
―I consent voluntarily to participate in this study and understand that I have the right to
withdraw from the discussion at any time with no consequences.‖
Respondents name Signature
i
ii
iii
iv
v
vi
vii
viii
iv
x
Date______________ Place ________________
159
Questions
1) Knowledge about the UPS group
- What is your role in the UPS group?
- How many members are there in the UPS group (women and men)?
- Is there a second group?
- Tell me about your constitution and if the group is registered?
- What‘s the criteria to join your group?
- How were your leaders selected?
- How often do you meet as a group?
- What other activities are you involved in as a group?
- What are the activities that enhance the proper functioning of your group?
- How have you been promoting yourself as a group?
- What physical inputs do you need as a group?
- Do you network or interact with other groups? If yes, which ones?
- Is there anything you think would be more beneficial to add to the group?
- What other projects are you involved in as a group?
- What plans do you have as a group in the future?
1.1) Involvement in the KG UPS
- Why did you decide to take part in the KG UPS?
- Where do you get your vegetable seeds from?
- Which vegetables do you cultivate?
- How many pocket bags of vegetables do you have?
- How many pocket bags have you constructed for people?
- What other crops do you grow?
- Do you keep livestock?
- Do you suffer from pest attack?
- How often do you use fertilizers and pesticides on your KGs?
- Do you sell some of the harvested vegetables?
- If yes, how much do you sell a bunch of vegetables?
- What benefits do you get from the KG?
- What other varieties of seeds would you prefer?
- Who are your trainers?
- What can be improved in the UPS implementation?

160
- What are your impressions about this UPS?
- How do you now feel about your food security now that you are involved in this UPS
implementation?
- Are you able to turn this innovation as a means to earn more income for your
household? If so, how?
1.2) Involvement in the TR-FMD UPS
- Why did you decide to take part in the TR-FMD UPS?
- What do you cultivate on your tied ridges?
- What other varieties of seeds would you prefer for your TR?
- How do you get the seeds for the tied ridges and ow often do you get these seeds?
- Do you hire labour for your TR? If so, how much do you pay, how seasonally do you
do it?
- Are you able to sell some of your harvested crops from the TR?
- How often do you use fertilizers and pesticides on your crops?
- What problems do you face with the TR-FMD?
- How different is this farming technology from the previous?
- What benefits do you get from the TR?
- How often do you receive trainings on the TR-FMD?
- Do you get bonuses for the tied ridges
- What other crops do you cultivate?
- Do you keep livestock?
- What can be improved in the TR-FMD UPS implementation?
- What are your impressions about this UPS?
- How do you now feel about your food security?
- Are you able to turn this innovation as a means to earn extra income for your
household?
1.3) Involvement in the improved storage UPS
- Why did you decide to take part in the improved storage UPS?
- How many improved storage bags do you have?
- What do you store in these improved storage bags?
- Where do you get the bags from and how much do they cost?
- For how long have you been storing food in the improved storage bags?
- Is there a change in colour or taste when the produce is removed from the bags?
161
- Have you been able to replant the seeds from the storage bags?
- Do you face any problems with the improved bags?
- How are these bags different from the previous?
- Who are your buyers?
- Would you prefer other contacts to sell your products?
- Do you travel to other villages to sell?
- What plans do you have as a group in future?
- Economically, socially; what changes have these improved storage bags brought?
- Are people interested in using the bags within and beyond the village?
- What would the group like to learn more in the oriented storage?
- What are your impressions about this UPS?
- What can be improved in the improved storage UPS implementation?
- How do you now feel about your food security?
1.4) Involvement in the IWS UPS
- Why did you decide to take part in the IWS UPS?
- What was your target for the number of trees to be planted when you began as a
group?
- How many trees have you planted so far?
- Do you apply fertilizers on these trees?
- Do you hire labour for making the nursery beds? If so, how much do you pay, how
seasonally do you do it?
- What are your impressions about this UPS?
- Is there any unforeseen benefit that you get from implementing the UPS?
- Do you need more trainings as a group?
- What would the group like to learn more?
- What other trees do you grow?
- What are your impressions about this UPS?
- What do you think can be improved in the UPS implementation?
- How do you now feel about your food security?
1.5) Involvement in m-IMAS UPS
- Are you using m-IMAS to get sellers/buyers or to sell your produce?
- What kind of crops do you cultivate?
- Do you keep livestock?

162
- What are your impressions about m-IMAS?
- Would you prefer other contacts for middlemen? If yes, which ones?
- Will you use the technology in future to market your produce?
- What do you think can be improved in the UPS implementation?
- How do you now feel about your food security?
Annex I: Interview Protocol
This section includes the steps of the Net-Map. This covers the aim of the individual
interviews and the tools used in the Net-Map session.
Aim:
- To get an overview of the actors involved in the different UPS groups as well as their
linkages.
- To assess their motivations and influence factors that determine the performance of the
UPS group.
- To determine the joint and individual activities that enhance the proper functioning of
the UPS groups and the implementation of the UPS.
Requirements
- Coloured post-its
- Markers (different colours)
- Mapping sheets
- Wooden pieces (for building the towers)
- Recorder
- Book, pen
- Camera
Individual interviews and steps of the Net-Map
The questions for the interview are integrated in the steps of the Net-Map. The questions have
already been presented above (appendix H). We will now describe the steps for the Net-Map.
First step
Explanation of the mapping sheet to the respondent followed by asking who is important in
the UPS implementation (for instance the KG UPS)? Let them choose among the prepared
post-its (actor cards), and ask for other actors involved which you didn‘t mention.
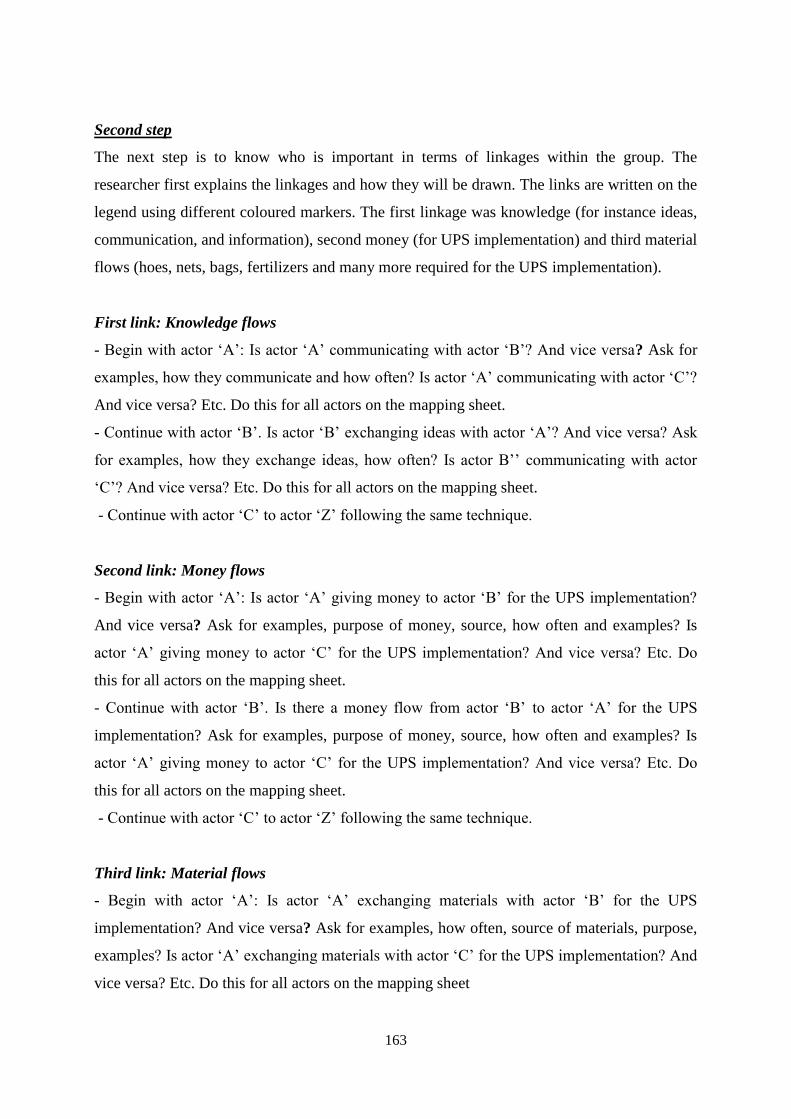
163
Second step
The next step is to know who is important in terms of linkages within the group. The
researcher first explains the linkages and how they will be drawn. The links are written on the
legend using different coloured markers. The first linkage was knowledge (for instance ideas,
communication, and information), second money (for UPS implementation) and third material
flows (hoes, nets, bags, fertilizers and many more required for the UPS implementation).
First link: Knowledge flows
- Begin with actor ‗A‘: Is actor ‗A‘ communicating with actor ‗B‘? And vice versa? Ask for
examples, how they communicate and how often? Is actor ‗A‘ communicating with actor ‗C‘?
And vice versa? Etc. Do this for all actors on the mapping sheet.
- Continue with actor ‗B‘. Is actor ‗B‘ exchanging ideas with actor ‗A‘? And vice versa? Ask
for examples, how they exchange ideas, how often? Is actor B‘‘ communicating with actor
‗C‘? And vice versa? Etc. Do this for all actors on the mapping sheet.
- Continue with actor ‗C‘ to actor ‗Z‘ following the same technique.
Second link: Money flows
- Begin with actor ‗A‘: Is actor ‗A‘ giving money to actor ‗B‘ for the UPS implementation?
And vice versa? Ask for examples, purpose of money, source, how often and examples? Is
actor ‗A‘ giving money to actor ‗C‘ for the UPS implementation? And vice versa? Etc. Do
this for all actors on the mapping sheet.
- Continue with actor ‗B‘. Is there a money flow from actor ‗B‘ to actor ‗A‘ for the UPS
implementation? Ask for examples, purpose of money, source, how often and examples? Is
actor ‗A‘ giving money to actor ‗C‘ for the UPS implementation? And vice versa? Etc. Do
this for all actors on the mapping sheet.
- Continue with actor ‗C‘ to actor ‗Z‘ following the same technique.
Third link: Material flows
- Begin with actor ‗A‘: Is actor ‗A‘ exchanging materials with actor ‗B‘ for the UPS
implementation? And vice versa? Ask for examples, how often, source of materials, purpose,
examples? Is actor ‗A‘ exchanging materials with actor ‗C‘ for the UPS implementation? And
vice versa? Etc. Do this for all actors on the mapping sheet
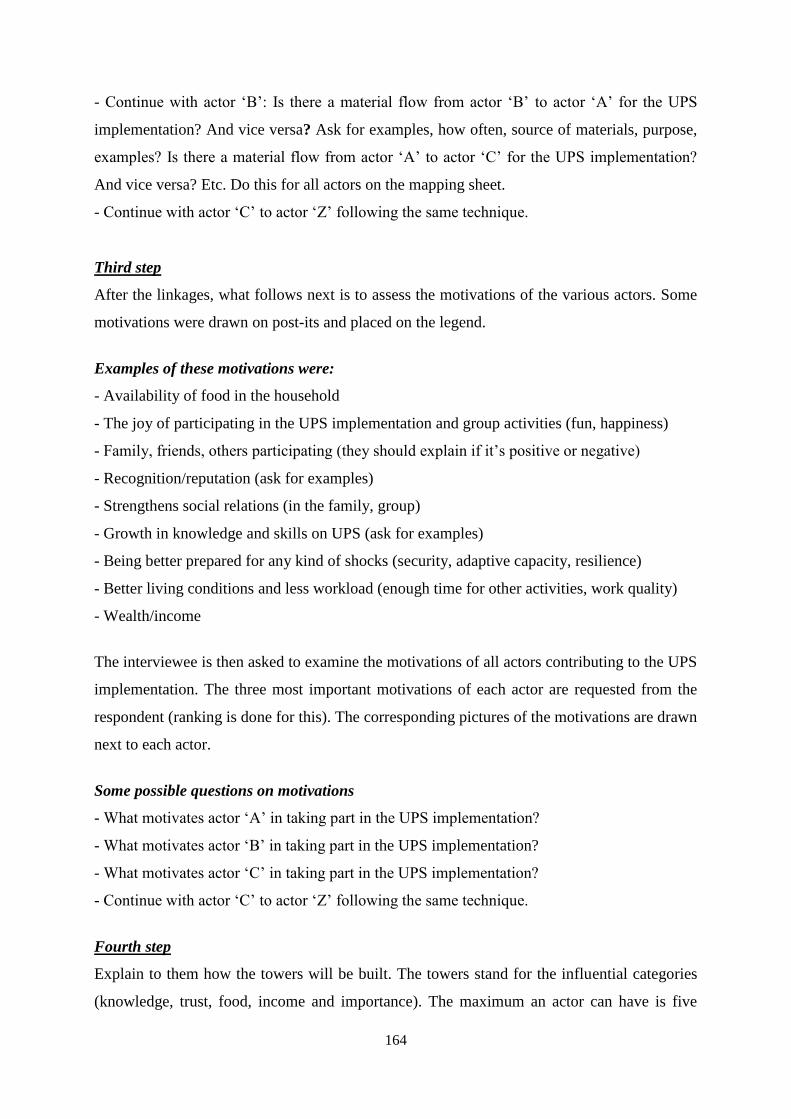
164
- Continue with actor ‗B‘: Is there a material flow from actor ‗B‘ to actor ‗A‘ for the UPS
implementation? And vice versa? Ask for examples, how often, source of materials, purpose,
examples? Is there a material flow from actor ‗A‘ to actor ‗C‘ for the UPS implementation?
And vice versa? Etc. Do this for all actors on the mapping sheet.
- Continue with actor ‗C‘ to actor ‗Z‘ following the same technique.
Third step
After the linkages, what follows next is to assess the motivations of the various actors. Some
motivations were drawn on post-its and placed on the legend.
Examples of these motivations were:
- Availability of food in the household
- The joy of participating in the UPS implementation and group activities (fun, happiness)
- Family, friends, others participating (they should explain if it‘s positive or negative)
- Recognition/reputation (ask for examples)
- Strengthens social relations (in the family, group)
- Growth in knowledge and skills on UPS (ask for examples)
- Being better prepared for any kind of shocks (security, adaptive capacity, resilience)
- Better living conditions and less workload (enough time for other activities, work quality)
- Wealth/income
The interviewee is then asked to examine the motivations of all actors contributing to the UPS
implementation. The three most important motivations of each actor are requested from the
respondent (ranking is done for this). The corresponding pictures of the motivations are drawn
next to each actor.
Some possible questions on motivations
- What motivates actor ‗A‘ in taking part in the UPS implementation?
- What motivates actor ‗B‘ in taking part in the UPS implementation?
- What motivates actor ‗C‘ in taking part in the UPS implementation?
- Continue with actor ‗C‘ to actor ‗Z‘ following the same technique.
Fourth step
Explain to them how the towers will be built. The towers stand for the influential categories
(knowledge, trust, food, income and importance). The maximum an actor can have is five
165
towers. The higher the tower the more influential the actor. After the towers are built, the
interviewee is asked to give reasons for placing the towers the way he/she did.
Some possible questions on influence categories
- Which actor is perceived to have the most influence on the UPS implementation? And why?
- How much more income is each actor receiving from the UPS implementation?
- How much more food is each actor getting out of the UPS implementation?
- Who gets the most knowledge out of the UPS implementation?
- Who do u think is the most trust worthy in the UPS implementation?
Final remarks: the interviewee is thanked for taking part and asked for his/her impressions,
remarks that could be important. He/she is asked if they need clarification on any aspect.
Additional questions after Net-Mapping
- Does your involvement in the UPS change your daily life, habits and attitude?
- Do you think the UPS is done in a fair way? If so, how?
- Do you think someone from outside or within the village should be included in the
UPS implementation?
- Would it make a difference if you did not take part in the UPS?
- How did your involvement change the implementation of the UPS?
- Do you face any conflicts in the group?
- Who is having conflict within the group?
- What unifies you as a group?
- What are the weaknesses of being a group implementing the UPS?
- What do you think are the threats of your group in the future?
- What are your opportunities as a group?
- What do you think are the future chances for your group?
- What are u going to do as a group when the project comes to an end?
- Do you have meetings with other Trans-SEC UPS groups?
- What are your recommendations for the Trans-SEC project?
- Do you have any questions for the researcher?