social networks and business practices: evidence from a
TRANSCRIPT

Social Networks and Business Practices:Evidence from a Randomized Experiment with
Microentrepreneurs*
Marcel Fafchamps† Simon Quinn‡
August 2013
Abstract
We introduce a representative sample of small Ghanaian entrepreneurs to randomly-selectedpeers. We do this through a team experiment that favors the creation of new social links amongentrepreneurs. Participants are divided into three treatment groups: pure controls, who onlyparticipate to the ex ante and ex post surveys; treated subjects, who are invited to participateto the link formation treatment; and placebo subjects, who are invited to the same activity asthe treated subjects but perform this activity individually. We also seed a randomly selectedsubsample of the population of control and placebo subjects with ideas about business prac-tices. We find that the experiment has a significant positive effect on several aspects of firmperformance. Further, we find evidence of diffusion of business practices among treated en-trepreneurs who were on the same team. For business performance, however, we find thattreated firms who were on the same team are on average more different ex post than firms thatwere not on the same team. These results question several common narratives about networksand firm performance in developing economies.
JEL codes: D22, L26, O33.
*We are grateful to participants at numerous seminars for useful comments. The authors thank Paolo Falco foroutstanding work as field coordinator, and to Afra Khan and Poorna Mazumdar for excellent field assistance. Financialsupport from the World Bank is gratefully acknowledged.
†University of Oxford. Email: [email protected]‡University of Oxford. Email: [email protected]
1

Social Networks and Business Practices
1 Introduction
Since Melitz (2003), it is now increasingly accepted that the productivity of an economy ulti-
mately depends on the distribution of productivity levels of the units that compose it. Improv-
ing aggregate productivity requires upgrading the productivity of existing firms or improving
the mix of low and high productivity firms. In developing economies, microenterprises con-
stitute a large proportion of these low productivity firms. The question then is how can their
productivity be improved.
The recent literature has relied on a series of experiments to explore which methods are
capable of improving the productivity of individual small firms. Examples include capital
grants (De Mel, McKenzie, and Woodruff, 2008; Fafchamps, McKenzie, Quinn, and Woodruff,
2013), training (Bruhn, Karlan, and Schoar, 2013; Fafchamps and Woodruff, 2013), labor sub-
sidies (De Mel, McKenzie, and Woodruff, 2010), or combinations of interventions (Berge,
Bjorvatn, and Tungodden, 2011). While this literature has tentatively identified interventions
that have a stronger impact on individual firms, it is doubtful that these interventions can be
scaled up to the level of entire economies because of their cost (see Bruhn, Karlan, and Schoar
(2013) or Bloom, Eifert, Mahajan, McKenzie, and Roberts (2013) for recent examples of suc-
cessful entreprise support interventions that are too costly to scale up). To be cost effective,
any intervention to improve the aggregate productivity of small enterprises must rely on the
diffusion of new ideas and practices among small entrepreneurs.1
In policy circles interested in private sector development, it is widely accepted that the diffu-
sion of ideas and practices is essential for aggregate economic performance: to become more
productive firms must innovate in the technology they use but also in the products they buy and
sell and in the way they organize themselves internally (e.g., labor management, delegation)
and externally (e.g., supplier credit, hiring practices). There is less agreement on how ideas
1 Ideas and practices can also diffuse across firms through workers (e.g., Muendler, Rauch, and Tocoian (2012)).Since the firms we study do not, as a rule, employ wage workers, we ignore this possible diffusion channel here.
2 Marcel Fafchamps and Simon Quinn

Social Networks and Business Practices
and practices diffuse among firms, and particularly on the role that social networks play in the
diffusion of business practices.
We present the results of an experiment designed to test the diffusion of business ideas and
practices between microenterprises through social contact between entrepreneurs. Our purpose
is to empirically identify the diffusion of business practices through social networks among
small entrepreneurs. To do this convincingly, we need an empirical context in which social
links are not self-selected but assigned at random. The reason is that people with similar views
or interests are more likely to adopt similar practices but also more likely to be linked because
of homophily (e.g., Moffitt (2001)).
To circumvent this problem, we introduce a representative sample of small entrepreneurs to
randomly-selected peers. Early inspiration for this approach comes from the work of Sac-
erdote (2001) who uses a natural experiment — the random assignment of roommates and
dormmates at Darmouth College — to study social network effects on GPA and social group-
ings. Similar strategies were used by Lyle (2007, 2009) and Shue (2012). Synthetic network
randomisation was pioneered by Centola (2010, 2011). The nature of the social interaction en-
abled by Centola’s experiment remains quite limited, however – i.e., automatic messages.2 To
improve on this design, we follow Fafchamps and Quinn (2012) and organize a team activity
that favors the creation of new social links among entrepreneurs. Participants are divided into
three treatment groups: pure controls, who only participate to the ex ante and ex post surveys;
treated subjects, who are invited to participate to the link formation treatment; and placebo
subjects, who are invited to the same activity as the treated subjects but perform this activity
individually. We also seed a randomly selected subsample of the population of control and
placebo subjects with ideas about business practices. This is achieved through the distibution
of factsheets based on the results from a comparative enterprise survey in Africa and Asia.
All participants are surveyed one year before and one year after the experiment, so as to give
2 Duflo, Dupas, and Kremer (2011) randomly assigned students to groups – i.e., sections in Kenyan schools – to studyspill-over effects on student achievement.
3 Marcel Fafchamps and Simon Quinn

Social Networks and Business Practices
enough time for the intervention to have an effect.
We find a fairly high level of compliance with treatment: most invited subjects participate ei-
ther as treated or placebo subjects, and there is balance across them. We find little evidence of
selective attrition between invited participants and pure controls. The social network treatment
works in the sense that treated subjects are more likely to remember participants in their team,
and significantly more likely to speak to them after the experiment has ended, including about
business matters. Factsheets have little additional effect on social links.
From Intent-To-Treat and LATE regressions, we find that the social network treatment has a
significant effect on some firm outcomes, notably (i) whether others are employed to work in
the business, (ii) the value of firm inventories, (iii) the combined value of firm inventories and
cash holding, (iv) total firm capital, and (v) firm profits. We find almost no such significant
effect for placebo participants (although we cannot always reject that the effect of being in-
vited to the experiment is the same for placebo and treated subjects). The factsheets have little
noticeable impact on subsequent firm performance, which may not be a surprise given the low
intensity of this treatment.
To test for evidence of diffusion along social networks, we estimate dyadic regressions com-
paring business practices and performance across linked and unlinked firms. If productivity
enhancing ideas diffuse across firms along social networks, we expect to observe that treated
entrepreneurs who were part of the same team have more similar business practices than those
who part of different teams. The anticipated effect of diffusion on individual firm performance
is, however, less clear a priori. One possibility is that social links permit the transmission of
information about new practices that benefit all firms, in which case we expect linked firms to
have more similar performance improvements than unliked firms. It is also conceivable that
the information that is being transmitted only benefits certain firms. This could be because the
information exchange game resembles a ‘treasure hunt’ (Möbius, Phan, and Szeidl, 2010): two
4 Marcel Fafchamps and Simon Quinn

Social Networks and Business Practices
players who share information about the possible location of a single treasure increase their
joint likelihood finding it, even though at most one of them can find it. Transposed to the world
of business, this could be because firms compete for the same market (Aghion, Bechtold, Cas-
sar, and Herz, 2013).
We test these hypotheses and find evidence of diffusion of business practices among treated
entrepreneurs who were on the same team. For business performance, however, we find that
treated firms who were on the same team are on average more different ex post than firms that
were not on the same team.
The paper is organized a follows. The experimental design is presented in Section 2. The
sampling strategy and the implementation of the experiment are described in Section 3. Data
descriptives are presented in Section 4. Average treatment effects are estimated in Section 5
while results on diffusion from dyadic regressions are detailed in Section 6.
2 Experimental design
Our experimental design is close in spirit to that of Sacerdote’s natural setting and to that
of Fafchamps and Quinn (2012): to encourage the formation of social links, we invite en-
trepreneurs to undertake, with three randomly assigned peers, a financially incentivized joint
activity. The success of this activity requires the collaboration of the four members of the team.
Participants take turn leading their team. Because we expect the formation of social links to
require repeated interaction, the activity is conducted over a period of 16 days and requires
daily interaction. We test whether the experiment is effective in creating social links, that is,
whether being assigned to the same team affects subsequent social contact. We also conduct a
‘placebo’ treatment which is in every way identical to the team treatment except that partici-
pants complete the activity individually.
5 Marcel Fafchamps and Simon Quinn
Social Networks and Business Practices
The activity that participants are invited to engage in is closely inspired from the level-k strate-
gic thinking experiment of Costa-Gomes and Crawford (2006). In this experiment, each team
i (or each subject, for participants playing individually) is asked to choose a number di con-
tained between two bounds bi and bi. The opposing team is asked to similarly choose a number
dj contained between two other bounds bj and bj . Team i receives a payoff that is highest if di
is closest to dj × pi. Similarly, team j receives a payoff that decreases rapidly in the distance
between dj and di × pj .3
Costa-Gomes and Crawford (2006) show that many subjects play a best response to random
play by the other team. They call this ‘level-1 thinking’. In the above notation, it means set-
ting di =
(bj +
bj−bj2
)pi. Random play is denoted ‘level-0 thinking’. Level-2 thinking is
when subjects play a best response to level-1 play, etc. Each team (or individual player) is
given all six pieces of information – bi and bi, bj and bj , pi and pj . The game is designed
to require strategic thinking, that is, a deliberate mental effort to anticipate the action of the
opposite player and calculate a best response to it. This game is chosen because its complex-
ity creates conditions that should encourage team members to debate the appropriate decision.4
In practice, our level-k experiment is implemented over the phone. At the beginning of each of
the 16 consecutive days covered by the experiment, participants are sent SMS messages with
the six pieces of information listed above. For subjects playing individually, they receive all
six in a single message. For subjects playing in a team, each of the four members of the team
receives one piece of information as follows: bi and bi; bj and bj ; pi; and pj . Team members
therefore need to pool the information in order to make an informed choice.5 Each team or
individual participant has to return their choice in an SMS before a set time on the same day.
3 As in Costa-Gomes and Crawford (2006), guesses that fall outside the acceptable bounds are automatically broughtto the closest bound for the purpose of calculating payoffs.
4 The main differences between our experiment and Costa-Gomes and Crawford (2006) are that (1) we optimized thevalues of bi and bi, bj and bj , pi and pj so as to discriminate more efficiently between different player archetypes;and (2) the game was played over the phone by entrepreneurs, instead of university students in a computer laboratory.
5 The order of play is further randomized, so that team i on day t is playing game s against team j, while on that sameday team j is playing game n 6= s. This was done to eliminate the possibility of collusion across teams.
6 Marcel Fafchamps and Simon Quinn

Social Networks and Business Practices
For teams, one players is designed, at random, to be the player habilitated to return a decision.
Other members are nevertheless incentivized to return their own choice as well. Final payoffs
are calculated by selecting one play at random. In addition to a turn-up fee and final payoff,
participants are given an airtime lumpsum to cover the cost of SMS and phone calls associated
with the experiment.
We combine random network assignment with random ‘seeding’ of information. At the end of
the interaction period, participants are handed one of three randomly selected ‘factsheets’ pre-
sented in appendix. Two of the factsheets provide very simple summaries of academic findings
on small firm performance. One focuses on labor management, the other on enterprise finance.
The third factsheet is a ‘placebo’ factsheet that contains no business-relevant information but
encourages participants to wear a seatbelt. These factsheets are provided in the appendix. A
quarter of the participants receive no factsheet. At no point are participants told that the pur-
pose the experiment is to study social networks or the diffusion of business practices.
We focus here on the effect of the experiment on subsequent entrepreneur performance. Choices
made during the experiment itself are the object of separate analysis.
3 Sampling strategy and implementation
The population invited to participate to the experiment is composed of male and female Ghana-
ian microentrepreneurs living in Accra. In 2008, a sample of around 900 microentrepreneurs
was drawn at random from the population of Accra and the neighboring town of Tema. In-
dividuals employing wage workers at baseline were excluded from the sampling frame. So
were taxi and truck drivers, leaving microentrepreneurs involved in manufacturing, trade, and
services. These microentrepreneurs were surveyed six times at three month intervals prior to
our experiment — see Fafchamps, McKenzie, Quinn, and Woodruff (2012, 2013) for details.
Over the six rounds there was some attrition, in line with the rates of firm exit common in
7 Marcel Fafchamps and Simon Quinn

Social Networks and Business Practices
the microentreprise sector. The experiment took place in the summer of 2011, one year after
the round 6 survey. All entrepreneurs – participants and non-participants – were resurveyed in
the March 2012, approximately one year after the experiment and two years after the round 6
survey.
Participants to the experiment were drawn from entrepreneurs who (i) answered round 6 of the
panel survey and (ii) are located in Accra. We focus on round 6 entrepreneurs because these
are the ones we can locate more easily. We drop Tema to simplify the logistics of the experi-
ment. These leaves a sampling population of 551 entrepreneurs. Of these, 455 were invited to
take part to the experiment. Not all responded or could be located. Of those who were invited,
298 accepted to take part. Two third of these, or 202, were randomly assigned to the team
treatment. The rest, 96, were assigned to the individual treatment.
Participants were first invited to a half-day training session during which the game was ex-
plained and all participants were shown examples of the game. The focus of the training was
on the rules of the game, and the calculation of payoffs. Participants were not presented with
heuristics leading them to play according to level-1 or level-2 thinking, etc. The purpose of
this was to ensure that the strategic complexity of the game remains intact, hence encouraging
subjects to interact with each other. After the training session participants were quizzed on
their understanding of the rules of the game. They were also given instructions on how to play
the game using SMS messages.
Participants to the training session were then randomly divided between treated and placebo,
and treated participants were randomly assigned to different teams of four individuals. To min-
imize the logistically complexity of the experiment, randomization into teams was performed
in each session separately, thereby precluding ex ante stratification.
8 Marcel Fafchamps and Simon Quinn

Social Networks and Business Practices
4 The data
Table 1 shows descriptive statistics from our pre-experiment survey for those invited and those
not invited to participate.6 Note that all currency values in this paper refer to real Ghana cedis;
given the normalisation used, one real Ghana cedi was worth about 40 US cents at the time
of the 2012 follow-up survey. Table 1 shows that balance was broadly achieved; of the 14
variables tested, two show significant differences between those invited and those not (in the
number of hours worked by others in the business, and in whether the respondent had a bank
account).
< Table 1 here. >
Table 2 shows the balance between those accepting and those declining the invitation. The table
shows that respondents accepting the invitation were very similar to those declining, except
that they had significantly higher education (on average, one additional year). (Of course,
balance on this table is not necessary for the validity of the experiment, because we do not rely
on acceptance of the invitation being random or quasi-random — but this is informative for
describing the experiment participants.)
< Table 2 here. >
Table 3 shows the balance between those assigned to the group treatment and those assigned
to the individual treatment. There are significant differences on four variables: (i) gender, (ii)
education, (iii) hours worked in the business by others, and (iv) whether the respondent has a
bank account.
< Table 3 here. >6 As explained earlier, this survey was round 6 of an earlier microenterprise panel survey, used by Fafchamps, McKen-
zie, Quinn, and Woodruff (2012, 2013). In this paper, we term this survey the ‘baseline’, in that we use it as abaseline for the networks experiment.
9 Marcel Fafchamps and Simon Quinn

Social Networks and Business Practices
5 Treatment effects
5.1 Identification strategy for treatment effects
Denote yit as the outcome for firm i in period t (where t = 0 refers to data collected in Febru-
ary 2010, and t = 1 to data collected in March 2012). Denote zgi and zhi respectively as dummy
variables for whether respondent i was invited to participate in the group experiment and the
individual experiment.7
Denote xgi and xhi respectively as dummy variables for whether respondent i actually partic-
ipated in the group and individual experiments. We use a difference-in-difference estimation
identification strategy:
yit = β0 + βg1 · zgi · t+ βh1 · zhi · t+ βg2 · z
gi + βh2 · zhi + β3 · t+ εit, (1)
where βg1 and βh1 respectively represent the Intent To Treat (‘ITT’) of the group experiment
and the individual experiment.8
We estimate the Local Average Treatment Effect (‘LATE’) of participation in the group and
individual experiments by estimating the following first stages:
xhi = γ0 + γg1 · zgi + γh1 · zhi + µhi (2)
xgi = δ0 + δg1 · zgi + δh1 · zhi + φhi . (3)
We then form the predicted values, x̂hi and x̂gi , and use x̂hi , x̂gi , x̂hi · t and x̂gi · t to instrument
7 In practice, we did not separately invite respondents to participate in the group experiment and the individual exper-iment. Instead, we issued each chosen respondent a general invitation to participate in the experiment; respondentswho agreed were then randomly assigned either to the group treatment or to the individual treatment. We thereforeuse a synthetic randomization method, in which those respondents who declined our invitation to participate areassigned ex post to either zgi = 1 or zhi = 1, such that the proportion of respondents declining is equal acrosssynthetic assignments.
8 We begin, in each set of regressions, by restricting βg1 = βh
1 ; this estimates the ITT for being invited to participate,whether or not that participation was in the group or the individual experiment.
10 Marcel Fafchamps and Simon Quinn

Social Networks and Business Practices
together for zgi · t, zhi · t, zgi and zhi (see Wooldridge (2010)).
Several important outcomes — in particular, outcomes concerning innovation — were ob-
served only in the follow-up questionnaire. For these outcomes, we use the following simple
difference estimator (with an analogous IV procedure):
yi1 = β0 + βg1 · zgi + βh1 · zhi + ξit. (4)
In each case, we cluster errors by team (where, for clustering purposes, each respondent in the
individual experiment is assigned to his or her own one-person ‘team’).
5.2 Results
We consider three measures of firm inputs: (i) the number of hours worked by the respondent
in the firm in the previous week, (ii) a dummy variable for whether others work in the firm, and
(iii) the total expenses for the firm over the previous month. Results are reported respectively in
Tables 4, 5 and 6. We find no effect on hours worked or expenses. We find a significant positive
effect of the experiment on whether others are employed to work in the business: those invited
to participate in the experiment are almost 12 percentage points more likely to hire others
(significant at the 10% level). This effect is wholly explained by the effect of participation in
the group treatment (for which we estimate an ITT of almost 15 percentage points and a LATE
of about 20 percentage points, both significant at the 5% level).9
< Table 4 here. >
< Table 5 here. >
< Table 6 here. >
We use three measures of firm assets: (i) the value of firm inventories, (ii) the combined value
of firm inventories and the firm cash holding, and (iii) total firm capital (defined here as the sum
9 A formal test for whether individual and group effects are the same almost rejects the null hypothesis of equality:p = 0.158 for the ITT and p = 0.112 for the LATE.
11 Marcel Fafchamps and Simon Quinn

Social Networks and Business Practices
of firm inventories and firm assets, excluding land and buildings). We report results in Tables
7, 8 and 9 respectively. We find a large effect of the group treatment on all three measures. We
find no effect of the individual treatment on any measure.10
< Table 7 here. >
< Table 8 here. >
< Table 9 here. >
We have two variables showing firm outcomes: (i) sales last month and (ii) profit last month.
Estimates are reported in Tables 10 and 11. We find no significant effect on sales, but we find
large and significant effects on profits of both the individual and group treatments.
< Table 10 here. >
< Table 11 here. >
We consider two measures of savings behavior: (i) whether the respondent has a bank account,
and (ii) whether the respondent uses a susu collector. We find no significant effect on either
outcome. (See the appendix for regression tables.)
Finally, we run a series of tests on various measures of firm innovation. Specifically, we con-
sider (i) whether the firm introduced new design or packaging, (ii) whether the firm introduced
a new channel for selling its products, (iii) whether the firm introduced a new method for pric-
ing, (iv) whether the firm introduced a new way of advertising or promotion, (v) whether the
firm changed or introduced new business processes, (vi) whether the firm changed the organi-
zation of its work, (vii) whether the firm introduced new quality control standards for suppliers
or subcontractors, and (viii) whether the firm introduced new products. Measures (i) to (vii)
were asked about the preceding year, and the final measure was asked about the preceding two
10 The difference between group treatment and individual treatment is significant in the case of the combined value offirm inventories and cash; in the case of the other two measures, the p-value is between 0.1 and 0.2.
12 Marcel Fafchamps and Simon Quinn
Social Networks and Business Practices
years. Each of these questions was asked only at the follow-up.
We test each of these outcomes separately; we also use the method of Anderson (2008) to create
a weighted index of innovation, which we then test as a distinct outcome variable. We find
positive and significant effects of the experiment on whether the firm introduced new products
in the previous two years, and whether the firm introduced new quality control standards in
the previous year; in each case, the estimated ITT is about 10 percentage points. We also find
a positive and significant effect on the index of innovation, of about 0.1 standard deviations.
In each of these cases, it is only the individual treatment that is separately significant — but
we comfortably pass hypothesis tests that individual and group effects are equal. These results
are reported in Tables 12, 13 and 14. We find no effect testing each of the other innovation
measures separately; these results are not reported, but are available on request.
< Table 12 here. >
< Table 13 here. >
< Table 14 here. >
In sum, we find large and significant effects of our experiment on several important measures
of firm performance and firm innovation; these results appear primarily to be driven by the
group treatment. This motivates a deeper analysis of the group treatment, in which we use
dyadic regression to test outcomes at the level of the firm-to-firm dyad.
6 Network effects of the group experiment
6.1 Identification strategy for network effects
We use dyadic regression to estimate effects of entrepreneurs being assigned to the same team.
These dyadic regressions take two forms: directed and undirected.
13 Marcel Fafchamps and Simon Quinn

Social Networks and Business Practices
We use directed dyadic regressions where the outcome records participant i’s response about
participant j. As part of the follow-up survey, each participant in the experiment was asked
questions about nine other participants in the experiment. For participants in the group experi-
ment, these nine other participants included all of the other members of participant i’s team.11
In this paper, we focus specifically on two questions: “Were you on the same team as this per-
son?”, and “Have you spoken to this person since the game ended?”. Denote yij as recording
i’s answer to such a question about j, and denote sij as a dummy for whether i and j were
actually on the same team. Then we estimate the following dyadic regression:
yij = β0 + β1 · sij + εij . (5)
We then test for heterogeneous network effects by interacting sij with other covariates (specif-
ically, dummy variables recording factsheet assignment and gender).
We use undirected dyadic regressions to test whether entrepreneurs were prompted to adopt
similar business practices — and have similar outcomes — to those of their fellow team mem-
bers. Denote yit as an outcome for firm i at time t (for example, firm profit). Following
Fafchamps and Söderbom (forthcoming), we use |yit − yjt| as a measure of firm similarity.
We therefore test for experimental effects on firm similarity using a difference-in-difference
estimator:
|yit − yjt| = β0 + β1 · sij · t+ β2 · sij + β3 · t+ εijt. (6)
For measures of innovation — observed only in the follow-up survey — we use an analogous
difference estimator:
|yi1 − yj1| = β0 + β1 · sij + εij1. (7)
11 Other participants j were randomly drawn, balanced so that each participant was the object of an (approximately)equal number of questions.
14 Marcel Fafchamps and Simon Quinn

Social Networks and Business Practices
Under both specifications, we will estimate β1 < 0 if participating on the same team causes
firms to have similar outcomes; if outcomes are driven to be more dispersed, we will estimate
β1 > 0.
For both directed and undirected dyadic regressions, we use the two-way clustering of Cameron,
Gelbach, and Miller (2011).12
6.2 Results
We begin by using directed dyadic regressions to measure the direct effect of being on the same
team. In Table 15, we measure the effect of being on the same team on (i) whether i (correctly)
remembered that (s)he was on the same team as j, (ii) whether i reports having spoken to j
since the competition, and (iii) whether i reports having discussed savings, labor or innovation
with j. We find highly significant effects on all measures. Almost nobody wrongly claims to
have been on a team with someone who was not a teammate, and about half of team members
correctly remember another named team member. Shared team membership shifts the prob-
ability of a subsequent conversation from approximately zero to about 16%. We find small
effects (approximately 2%) for each measure of topics discussed. These results are reassuring
for showing that our experiment created meaningful connections between entrepreneurs.13
< Table 15 here. >
Table 16 shows the effects of the factsheets. We estimate that a respondent who received
the labor factsheet is about nine percentage points more likely to be remembered by a former
teammate; this is marginally significant. We estimate that participants are about five percentage
points less likely to have spoken with a former teammate who received the placebo factsheet;
12 This is a good approximation to the dyadic clustering of Fafchamps and Gubert (2007), because the network adja-cency matrix is sparse.
13 In the appendix, we report a separate set of regressions in which we include (i) a dummy variable for i and j havingshared the same training session, and (ii) that same dummy plus a set of dummies for i’s training session and a setof dummies for j’s training session. We show that this barely shifts the results. This is a useful robustness check forshowing that our results are not somehow driven by assortative matching into training sessions.
15 Marcel Fafchamps and Simon Quinn

Social Networks and Business Practices
this, too, is marginally significant. In sum, we find some factsheet effects, but these are not
particularly striking, nor highly significant.
< Table 16 here. >
Table 17 shows the effect of gender. It is often suggested that female owners of microenter-
prises are inherently more sociable than their male counterparts: more likely to network, more
likely to behave cooperatively, more likely to refer other female entrepreneurs for opportuni-
ties, and so on. However, recent experimental evidence by Beaman, Keleher, and Magruder
(2013) has cast some doubt on this conclusion, suggesting that highly skilled women may be
disadvantaged in the labor market because other women refer less qualified candidates for jobs.
Of course, gender is not the focus of this present paper. Nonetheless, it is interesting to note
that our results, like those of Beaman, Keleher, and Magruder (2013), challenge the simplistic
narrative: in our sample, men were more likely to remember having been on a team than were
women.
< Table 17 here. >
We now move to test whether our random group assignment caused adoption of similar busi-
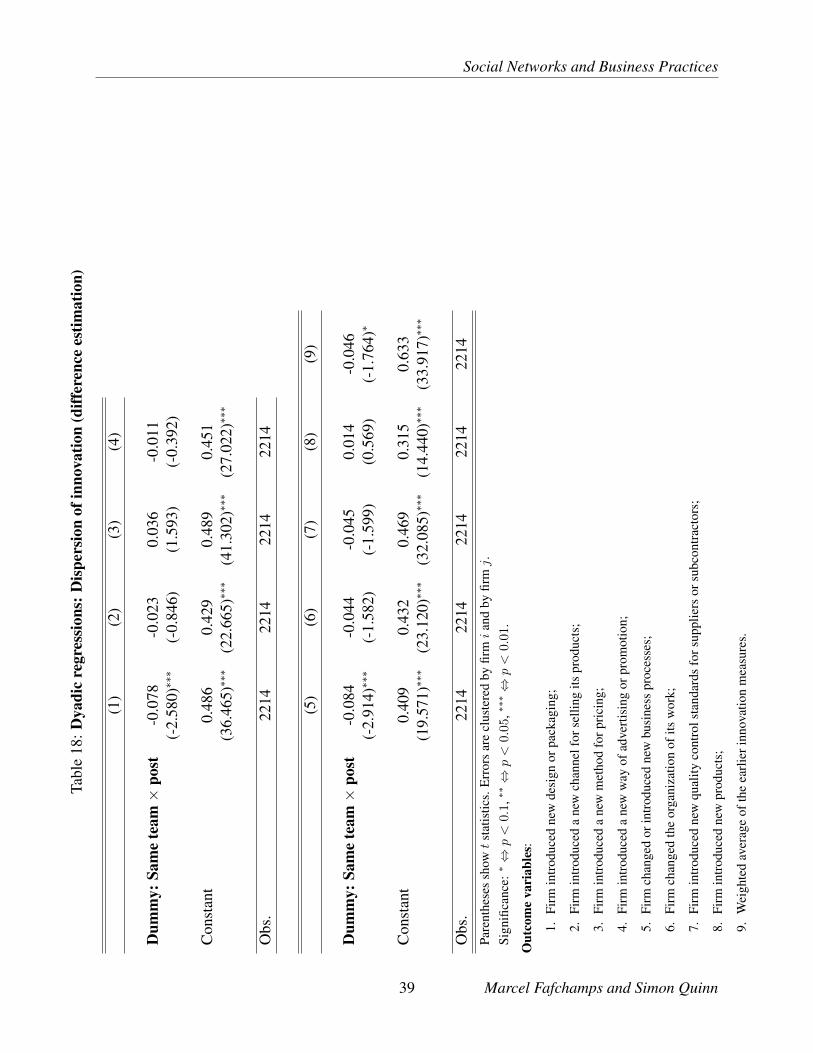
ness practices. Table 18 shows results from estimating equation 7 across our eight separate
measures of innovation, plus our weighted innovation index. Taken separately, we find strongly
significant negative effects for two innovations: the introduction of new designs/packaging,
and changing or introducing new business practices.14 The weighted index of innovation also
shows a significant negative effect. Together, we interpret these results as indicating that the
experience of participating on a team together caused a positive correlation in adoption of new
business practices.15
< Table 18 here. >14 In this draft of the paper, we report p-values from individual hypothesis tests. In a future revision, we intend to
complement these results by using a Westfall-Young Stepdown Bootstrap to calculate the Family-Wise Error Rate.15 Recall that, in equations 6 and 7, a negative coefficient implies a positive correlation in outcomes.
16 Marcel Fafchamps and Simon Quinn

Social Networks and Business Practices
We extend these results by estimating equation 6, using our earlier measures of firm outcomes;
the estimations are reported in Table 19. Given the negative coefficients in Table 18 — and,
indeed, much of the accepted wisdom on firm networks — one might expect to estimate that
participating on a team together caused a positive correlation in business outcomes. However,
we obtain the opposite result. For three measures — cash and inventories, capital stock, and
sales — we estimate that participating on a team together generates a large and significant
negative correlation between firm outcomes (i.e. significant positive coefficients); we also
estimate positive coefficients that are almost significant for expenses and inventories. That is,
we find that, if two firms were randomly paired to participate in a team, the experience caused
them to have less similar cash and inventories, capital and sales than they otherwise would
have had.
< Table 19 here. >
7 Robustness to attrition
We plan to run an extensive set of robustness checks in a future version of the paper. At this
stage, we report our main robustness check: on whether the experiment differentially affected
attrition rates. Table 20 shows no significant effect of the experiment on attrition. We conclude
that it does not appear that our results are driven by attrition.
< Table 20 here. >
8 Conclusion
We have presented the results from an original field experiment designed to test whether exper-
imentally induced social links can improve firm performance and diffuse business practices.
We find that they can: firms that were invited to a link formation activity have significantly
higher performance, on average, than untreated firms, and firms on the same randomly as-
signed experimental team have more similar business practices one year after the experiment.
17 Marcel Fafchamps and Simon Quinn

Social Networks and Business Practices
Social links do not, however, raise firm performance equally for newly linked entrepreneurs:
some gain more than others, so much so that the performances of linked treated entrepreneurs
are more different than those of unlinked ones.
What do these findings suggest regarding the role of social networks in the diffusion of busi-
ness practices and the improvement of the aggregate productivity level of small enterprises?
The evidence presented here suggest that diffusion of practices can indeed be facilitated by
forming social links between entrepreneurs. Entrepreneurs should not be expected to bene-
fit equally from the newly formed links. Instead of facilitating convergence in performance,
creating social links between firms results in diverging performance. Perhaps we should not
be surprised by these findings. The anecdotes frequently used to claim that social networks
facilitate diffusion often focus on success stories and ignore the rest — for example, we nor-
mally hear about the Mark Zuckerbergs of the world, but less about the friends with whom he
shared his initial ideas for Facebook (except, in this case, for the movie). Yet the larger the
successes are, the more divergence there must be between the successful and the friends they
left behind. This does not imply that exchange of information and ideas was unimportant, only
that not everyone benefits equally. This observation in turn raises the question of who is most
likely to benefit, a research question for which more experimental evidence is needed. It is also
unclear, from the evidence presented here, whether the success of a few is sufficient to raise
the aggregate performance of the microenterprise sector. These and other issues remain to be
explored, and will be the focus of future work.
18 Marcel Fafchamps and Simon Quinn

Social Networks and Business Practices
ReferencesAGHION, P., S. BECHTOLD, L. CASSAR, AND H. HERZ (2013): “The Causal Effects of
Competition on Innovation: Experimental Evidence,” Working paper.
ANDERSON, M. L. (2008): “Multiple Inference and Gender Differences in the Effects ofEarly Intervention: A Reevaluation of the Abecedarian, Perry Preschool, and Early TrainingProjects,” Journal of the American Statistical Association, 103(484), 1481–1495.
BEAMAN, L., N. KELEHER, AND J. MAGRUDER (2013): “Do Job Networks DisadvantageWomen? Evidence from a Recruitment Experiment in Malawi,” Working paper.
BERGE, L. I., K. BJORVATN, AND B. TUNGODDEN (2011): “Human and financial capitalfor microenterprise development: Evidence from a field and lab experiment,” NHH Dept. ofEconomics Discussion Paper, (1).
BLOOM, N., B. EIFERT, A. MAHAJAN, D. MCKENZIE, AND J. ROBERTS (2013): “DoesManagement Matter? Evidence from India,” The Quarterly Journal of Economics, 128(1),1–51.
BRUHN, M., D. S. KARLAN, AND A. SCHOAR (2013): “The Impact of Consulting Serviceson Small and Medium Enterprises: Evidence from a Randomized Trial in Mexico,” Workingpaper.
CAMERON, A., J. GELBACH, AND D. MILLER (2011): “Robust Inference with MultiwayClustering,” Journal of Business and Economic Statistics, 29(2), 238–249.
CENTOLA, D. (2010): “The Spread of Behavior in an Online Social Network Experiment,”science, 329(5996), 1194–1197.
(2011): “An experimental study of homophily in the adoption of health behavior,”Science, 334(6060), 1269–1272.
COSTA-GOMES, M. A., AND V. P. CRAWFORD (2006): “Cognition and Behavior in Two-person Guessing Games: An Experimental Study,” The American Economic Review, pp.1737–1768.
DE MEL, S., D. MCKENZIE, AND C. WOODRUFF (2008): “Returns to capital in microen-terprises: evidence from a field experiment,” The Quarterly Journal of Economics, 123(4),1329–1372.
(2010): “Wage Subsidies for Microenterprises,” The American Economic ReviewPapers and Proceedings, 100(2), 614–618.
DUFLO, E., P. DUPAS, AND M. KREMER (2011): “Peer Effects, Teacher Incentives, and theImpact of Tracking: Evidence from a Randomized Evaluation in Kenya,” The AmericanEconomic Review, 101(5), 1739–1774.
FAFCHAMPS, M., AND F. GUBERT (2007): “The Formation of Risk Sharing Networks,” Jour-nal of Development Economics, 83(2), 326–350.
19 Marcel Fafchamps and Simon Quinn

Social Networks and Business Practices
FAFCHAMPS, M., D. MCKENZIE, S. QUINN, AND C. WOODRUFF (2012): “Using PDAConsistency Checks to Increase the Precision of Profits and Sales Measurement in Panels,”Journal of Development Economics, 98(1), 51–57.
(2013): “Female Microenterprises and the Fly-paper Effect: Evidence from a Ran-domized Experiment In Ghana,” Working paper.
FAFCHAMPS, M., AND S. QUINN (2012): “Networks and Manufacturing Firms in Africa:Initial Results from a Randomised Experiment,” Working paper.
FAFCHAMPS, M., AND M. SÖDERBOM (forthcoming): “Network Proximity and BusinessPractices in African Manufacturing,” World Bank Economic Review.
FAFCHAMPS, M., AND C. WOODRUFF (2013): “Identifying Gazelles: Expert Panels vs Sur-veys as a Means to Identify Firms with Rapid Growth Potential,” Working paper.
LYLE, D. (2007): “Estimating and Interpreting Peer and Role Model Effects from RandomlyAssigned Social Groups at West Point,” The Review of Economics and Statistics, 89(2),289–299.
(2009): “The Effects of Peer Group Heterogeneity on the Production of Human Cap-ital at West Point,” American Economic Journal: Applied Economics, pp. 69–84.
MELITZ, M. J. (2003): “The impact of trade on intra-industry reallocations and aggregateindustry productivity,” Econometrica, 71(6), 1695–1725.
MÖBIUS, M., T. PHAN, AND A. SZEIDL (2010): “Treasure Hunt,” Working Paper.
MOFFITT, R. A. (2001): “Policy Interventions, Low-Level Equilibria, and Social Interac-tions,” in Social Dynamics, ed. by S. Durlauf, and P. Young, pp. 45–82. Cambridge: MITPress.
MUENDLER, M.-A., J. E. RAUCH, AND O. TOCOIAN (2012): “Employee spinoffs andother entrants: Stylized facts from Brazil,” International Journal of Industrial Organiza-tion, 30(5), 447–458.
SACERDOTE, B. (2001): “Peer Effects with Random Assignment: Results for DartmouthRoommates,” The Quarterly Journal of Economics, 116(2), 681–704.
SHUE, K. (2012): “Executive Networks and Firm Policies: Evidence from the Random As-signment of MBA Peers,” Working Paper.
WOOLDRIDGE, J. (2010): “Econometric Analysis of Cross Section and Panel Data, Vol. 1 ofMIT Press Books,” .
20 Marcel Fafchamps and Simon Quinn

Social Networks and Business Practices
Tables
21 Marcel Fafchamps and Simon Quinn

Social Networks and Business PracticesTa
ble
1:B
alan
cebe
twee
nth
ose
invi
ted
and
thos
eno
tinv
ited
INV
ITE
DN
OT
INV
ITE
DN
Mea
nSt
d.D
evN
Mea
nSt
d.D
evM
ean
equa
lity
(p)
Dum
my:
Mal
e45
60.
428
0.49
595
0.41
10.
495
0.75
9
Yea
rsof
educ
atio
n45
48.
786
3.68
994
8.81
93.
935
0.93
8
Hou
rs:R
espo
nden
t44
056
.234
25.1
9692
55.0
6523
.884
0.68
3
Dum
my:
Oth
ers
wor
kin
the
busi
ness
440
0.34
30.
475
920.
370
0.48
50.
630
Hou
rs:A
llot
hers
(tot
al)
438
16.5
5034
.962
9126
.330
62.0
490.
038∗
∗
Rea
lsal
esla
stm
onth
440
600.
373
1538
.129
9264
1.65
992
1.86
00.
804
Rea
lexp
ense
sla
stm
onth
439
487.
103
1446
.754
9153
6.29
910
39.0
190.
758
Rea
linv
ento
ries
456
329.
357
921.
241
9537
7.98
599
2.75
70.
644
Rea
ltot
alca
sh45
665
5.26
324
26.6
9195
632.
029
1076
.552
0.92
7
Rea
lpro
fitla
stm
onth
440
122.
664
212.
857
9214
8.04
823
1.98
30.
306
Rea
ltot
alca
pita
l40
437
4.85
197
8.88
584
428.
316
1046
.021
0.65
3
Intr
oduc
edne
wpr
oduc
ts44
00.
073
0.26
092
0.06
50.
248
0.80
0
Res
pond
enth
asba
nkac
coun
t43
60.
424
0.49
588
0.33
00.
473
0.09
9∗
Res
pond
entu
ses
asu
suco
llect
or44
00.
461
0.49
992
0.54
30.
501
0.15
2
‘Mea
neq
ualit
y(p
)’re
port
sth
ep
-val
uefr
oma
two-
sam
plet
test
with
equa
lvar
ianc
es.
‘Dis
tr.eq
ualit
y(p
)’re
port
sth
ep
-val
uefr
oma
two-
sam
ple
Kol
mog
orov
-Sm
irno
vte
st(c
alcu
late
dex
actly
,rat
her
than
appr
oxim
atel
y).
Con
fiden
ce:
‘∗’:
90%
;‘∗∗
’:95
%;‘∗∗∗’
:99
%.
22 Marcel Fafchamps and Simon Quinn

Social Networks and Business PracticesTa
ble
2:B
alan
cebe
twee
nth
ose
acce
ptin
gan
dth
ose
decl
inin
gth
ein
vita
tion
AC
CE
PT
ED
INV
ITA
TIO
ND
EC
LIN
ED
INV
ITA
TIO
NN
Mea
nSt
d.D
evN
Mea
nSt
d.D
evM
ean
equa
lity
(p)
Dum
my:
Mal
e29
80.
443
0.49
815
80.
399
0.49
10.
365
Yea
rsof
educ
atio
n29
89.
188
3.48
615
68.
019
3.94
70.
001∗
∗∗
Hou
rs:R
espo
nden
t29
356
.491
26.0
1314
755
.721
23.5
620.
763
Dum
my:
Oth
ers
wor
kin
the
busi
ness
293
0.35
20.
478
147
0.32
70.
471
0.60
3
Hou
rs:A
llot
hers
(tot
al)
291
17.5
5737
.997
147
14.5
5828
.015
0.39
7
Rea
lsal
esla
stm
onth
293
563.
968
1449
.810
147
672.
935
1703
.487
0.48
4
Rea
lexp
ense
sla
stm
onth
292
431.
918
1195
.804
147
596.
724
1846
.891
0.26
0
Rea
linv
ento
ries
298
376.
531
1081
.279
158
240.
383
485.
430
0.13
3
Rea
ltot
alca
sh29
879
0.69
729
64.1
4615
839
9.82
558
7.29
60.
102
Rea
lpro
fitla
stm
onth
293
125.
013
225.
062
147
117.
983
186.
804
0.74
4
Rea
ltot
alca
pita
l26
542
7.98
111
48.4
9813
927
3.55
950
9.03
20.
132
Intr
oduc
edne
wpr
oduc
ts29
30.
065
0.24
714
70.
088
0.28
50.
370
Res
pond
enth
asba
nkac
coun
t28
80.
448
0.49
814
80.
378
0.48
70.
165
Res
pond
entu
ses
asu
suco
llect
or29
30.
440
0.49
714
70.
503
0.50
20.
211
‘Mea
neq
ualit
y(p
)’re
port
sth
ep
-val
uefr
oma
two-
sam
plet
test
with
equa
lvar
ianc
es.
‘Dis
tr.eq
ualit
y(p
)’re
port
sth
ep
-val
uefr
oma
two-
sam
ple
Kol
mog
orov
-Sm
irno
vte
st(c
alcu
late
dex
actly
,rat
her
than
appr
oxim
atel
y).
Con
fiden
ce:
‘∗’:
90%
;‘∗∗
’:95
%;‘∗∗∗’
:99
%.
23 Marcel Fafchamps and Simon Quinn

Social Networks and Business PracticesTa
ble
3:B
alan
cebe
twee
ngr
oup
trea
tmen
tand
indi
vidu
altr
eatm
ent
GR
OU
PT
RE
AT
ME
NT
IND
IVID
UA
LT
RE
AT
ME
NT
NM
ean
Std.
Dev
NM
ean
Std.
Dev
Mea
neq
ualit
y(p
)
Dum
my:
Mal
e20
20.
490
0.50
196
0.34
40.
477
0.01
7∗∗
Yea
rsof
educ
atio
n20
29.
470
3.47
396
8.59
43.
457
0.04
2∗∗
Hou
rs:R
espo
nden
t20
055
.960
25.1
5393
57.6
3427
.880
0.60
9
Dum
my:
Oth
ers
wor
kin
the
busi
ness
200
0.33
50.
473
930.
387
0.49
00.
386
Hou
rs:A
llot
hers
(tot
al)
198
14.5
5632
.080
9323
.946
47.8
200.
049∗
∗
Rea
lsal
esla
stm
onth
200
576.
626
1507
.751
9353
6.74
813
24.0
210.
827
Rea
lexp
ense
sla
stm
onth
199
477.
040
1414
.188
9333
5.36
545
2.72
60.
346
Rea
linv
ento
ries
202
415.
865
1185
.757
9629
3.76
481
8.61
20.
363
Rea
ltot
alca
sh20
271
1.76
918
10.9
1396
956.
775
4526
.442
0.50
6
Rea
lpro
fitla
stm
onth
200
128.
909
258.
953
9311
6.63
512
4.96
90.
665
Rea
ltot
alca
pita
l18
146
4.11
512
44.0
0084
350.
121
911.
285
0.45
3
Intr
oduc
edne
wpr
oduc
ts20
00.
080
0.27
293
0.03
20.
178
0.12
3
Res
pond
enth
asba
nkac
coun
t19
60.
490
0.50
192
0.35
90.
482
0.03
7∗∗
Res
pond
entu
ses
asu
suco
llect
or20
00.
420
0.49
593
0.48
40.
502
0.30
7
‘Mea
neq
ualit
y(p
)’re
port
sth
ep
-val
uefr
oma
two-
sam
plet
test
with
equa
lvar
ianc
es.
‘Dis
tr.eq
ualit
y(p
)’re
port
sth
ep
-val
uefr
oma
two-
sam
ple
Kol
mog
orov
-Sm
irno
vte
st(c
alcu
late
dex
actly
,rat
her
than
appr
oxim
atel
y).
Con
fiden
ce:
‘∗’:
90%
;‘∗∗
’:95
%;‘∗∗∗’
:99
%.
24 Marcel Fafchamps and Simon Quinn

Social Networks and Business Practices
Table 4: Experimental results: Hours worked
(1) (2) (3) (4) (5)ITT ITT LATE ITT LATE
Dummy: Invited × post -0.336(-0.115)
Dummy: Individual treatment × post -2.689 -3.444(-0.720) (-0.723)
Dummy: Group treatment × post 0.714 1.030(0.235) (0.242)
Dummy: Capital factsheet × post 3.821 4.897(1.061) (1.042)
Dummy: Labor factsheet × post -5.024 -6.980(-1.427) (-1.441)
Dummy: Placebo factsheet × post -2.497 -3.504(-0.755) (-0.755)
Dummy: Invited 1.368(0.472)
Dummy: Individual treatment 1.997 2.552(0.554) (0.557)
Dummy: Group treatment 1.090 1.524(0.365) (0.367)
Dummy: Capital factsheet -6.096 -7.899(-1.942)∗ (-1.926)∗
Dummy: Labor factsheet 2.988 4.124(0.955) (0.966)
Dummy: Placebo factsheet 2.802 3.931(0.939) (0.941)
Dummy: Post 2.278 2.278 2.278 2.817 2.817(0.918) (0.917) (0.922) (1.543) (1.553)
Constant 42.094 42.094 42.094 39.999 39.999(2.551)∗∗ (2.548)∗∗ (2.560)∗∗ (3.380)∗∗∗ (3.400)∗∗∗
Obs. 910 910 910 910 910H0: Same treatment effect (p-value) 0.288 0.288 0.125 0.120Parentheses show t statistics. Errors are clustered by team (where each individual player forms his/her own team).Significance: ∗ ⇔ p < 0.1, ∗∗⇔ p < 0.05, ∗∗∗ ⇔ p < 0.01.
25 Marcel Fafchamps and Simon Quinn

Social Networks and Business Practices
Table 5: Experimental results: Others work in the business
(1) (2) (3) (4) (5)ITT ITT LATE ITT LATE
Dummy: Invited × post 0.118(1.905)∗
Dummy: Individual treatment × post 0.056 0.072(0.700) (0.706)
Dummy: Group treatment × post 0.146 0.205(2.304)∗∗ (2.328)∗∗
Dummy: Capital factsheet × post 0.082 0.105(1.171) (1.163)
Dummy: Labor factsheet × post 0.046 0.063(0.636) (0.638)
Dummy: Placebo factsheet × post 0.092 0.129(1.372) (1.359)
Dummy: Invited -0.046(-0.792)
Dummy: Individual treatment 0.008 0.010(0.107) (0.108)
Dummy: Group treatment -0.069 -0.097(-1.171) (-1.172)
Dummy: Capital factsheet -0.102 -0.132(-1.739)∗ (-1.739)∗
Dummy: Labor factsheet -0.039 -0.053(-0.626) (-0.631)
Dummy: Placebo factsheet -0.108 -0.152(-1.879)∗ (-1.875)∗
Dummy: Post -0.059 -0.059 -0.059 -0.007 -0.007(-1.046) (-1.045) (-1.050) (-0.168) (-0.169)
Constant 0.747 0.747 0.747 0.448 0.448(2.015)∗∗ (2.013)∗∗ (2.022)∗∗ (1.651) (1.661)∗
Obs. 912 912 912 912 912H0: Same treatment effect (p-value) 0.158 0.112 0.821 0.829Parentheses show t statistics. Errors are clustered by team (where each individual player forms his/her own team).Significance: ∗ ⇔ p < 0.1, ∗∗⇔ p < 0.05, ∗∗∗ ⇔ p < 0.01.
26 Marcel Fafchamps and Simon Quinn

Social Networks and Business Practices
Table 6: Experimental results: Expenses last month
(1) (2) (3) (4) (5)ITT ITT LATE ITT LATE
Dummy: Invited × post -96.085(-0.420)
Dummy: Individual treatment × post -77.972 -103.692(-0.330) (-0.341)
Dummy: Group treatment × post -103.824 -147.038(-0.444) (-0.448)
Dummy: Capital factsheet × post 45.649 56.244(0.253) (0.236)
Dummy: Labor factsheet × post -83.848 -119.521(-0.521) (-0.535)
Dummy: Placebo factsheet × post -190.023 -266.876(-1.071) (-1.071)
Dummy: Invited -53.524(-0.563)
Dummy: Individual treatment -136.635 -174.589(-1.561) (-1.567)
Dummy: Group treatment -16.621 -23.270(-0.152) (-0.152)
Dummy: Capital factsheet -123.034 -159.424(-1.321) (-1.310)
Dummy: Labor factsheet -108.223 -149.378(-1.070) (-1.072)
Dummy: Placebo factsheet 45.271 63.791(0.242) (0.243)
Dummy: Post 189.012 189.012 189.012 157.083 157.083(0.853) (0.852) (0.856) (1.087) (1.093)
Constant -669.907 -669.907 -669.907 -483.430 -483.430(-0.497) (-0.497) (-0.499) (-0.530) (-0.533)
Obs. 915 915 915 915 915H0: Same treatment effect (p-value) 0.816 0.773 0.288 0.285Parentheses show t statistics. Errors are clustered by team (where each individual player forms his/her own team).Significance: ∗ ⇔ p < 0.1, ∗∗⇔ p < 0.05, ∗∗∗ ⇔ p < 0.01.
27 Marcel Fafchamps and Simon Quinn

Social Networks and Business Practices
Table 7: Experimental results: Inventories
(1) (2) (3) (4) (5)ITT ITT LATE ITT LATE
Dummy: Invited × post 290.255(1.865)∗
Dummy: Individual treatment × post 122.542 158.201(0.939) (0.940)
Dummy: Group treatment × post 365.049 516.178(1.909)∗ (1.919)∗
Dummy: Capital factsheet × post 490.976 654.635(1.251) (1.259)
Dummy: Labor factsheet × post 54.906 76.154(0.302) (0.301)
Dummy: Placebo factsheet × post 42.011 58.831(0.233) (0.234)
Dummy: Invited -32.416(-0.258)
Dummy: Individual treatment -109.652 -141.486(-0.819) (-0.822)
Dummy: Group treatment 2.692 3.800(0.020) (0.020)
Dummy: Capital factsheet -120.484 -160.646(-1.049) (-1.048)
Dummy: Labor factsheet -64.282 -89.281(-0.482) (-0.484)
Dummy: Placebo factsheet -18.452 -25.779(-0.141) (-0.142)
Dummy: Post -59.928 -59.928 -59.928 56.964 56.964(-0.541) (-0.540) (-0.543) (0.392) (0.395)
Constant 744.759 744.759 744.759 59.072 59.072(0.980) (0.979) (0.983) (0.064) (0.064)
Obs. 929 929 929 929 929H0: Same treatment effect (p-value) 0.161 0.135 0.504 0.503Parentheses show t statistics. Errors are clustered by team (where each individual player forms his/her own team).Significance: ∗ ⇔ p < 0.1, ∗∗⇔ p < 0.05, ∗∗∗ ⇔ p < 0.01.
28 Marcel Fafchamps and Simon Quinn

Social Networks and Business Practices
Table 8: Experimental results: Cash and inventories holding
(1) (2) (3) (4) (5)ITT ITT LATE ITT LATE
Dummy: Invited × post 528.757(2.282)∗∗
Dummy: Individual treatment × post -34.239 -43.179(-0.089) (-0.088)
Dummy: Group treatment × post 782.086 1105.877(2.971)∗∗∗ (2.971)∗∗∗
Dummy: Capital factsheet × post 959.528 1279.370(1.771)∗ (1.787)∗
Dummy: Labor factsheet × post -288.011 -399.389(-0.606) (-0.610)
Dummy: Placebo factsheet × post 559.846 785.218(1.263) (1.263)
Dummy: Invited 66.958(0.367)
Dummy: Individual treatment 191.135 246.626(0.490) (0.493)
Dummy: Group treatment 10.513 14.842(0.066) (0.066)
Dummy: Capital factsheet -221.063 -294.751(-1.290) (-1.285)
Dummy: Labor factsheet 344.303 478.199(0.734) (0.740)
Dummy: Placebo factsheet -40.135 -56.071(-0.222) (-0.224)
Dummy: Post -43.477 -43.477 -43.477 141.175 141.175(-0.350) (-0.349) (-0.351) (0.812) (0.817)
Constant 906.926 906.926 906.926 -165.974 -165.974(1.084) (1.083) (1.088) (-0.147) (-0.148)
Obs. 929 929 929 929 929H0: Same treatment effect (p-value) 0.062∗ 0.046∗∗ 0.136 0.136Parentheses show t statistics. Errors are clustered by team (where each individual player forms his/her own team).Significance: ∗ ⇔ p < 0.1, ∗∗⇔ p < 0.05, ∗∗∗ ⇔ p < 0.01.
29 Marcel Fafchamps and Simon Quinn

Social Networks and Business Practices
Table 9: Experimental results: Capital stock
(1) (2) (3) (4) (5)ITT ITT LATE ITT LATE
Dummy: Invited × post 388.595(2.285)∗∗
Dummy: Individual treatment × post 209.381 269.767(1.309) (1.314)
Dummy: Group treatment × post 469.895 664.453(2.315)∗∗ (2.317)∗∗
Dummy: Capital factsheet × post 639.026 847.569(1.618) (1.622)
Dummy: Labor factsheet × post 145.443 203.994(0.693) (0.696)
Dummy: Placebo factsheet × post 137.209 192.883(0.681) (0.685)
Dummy: Invited -38.509(-0.273)
Dummy: Individual treatment -107.225 -137.300(-0.703) (-0.705)
Dummy: Group treatment -8.571 -12.151(-0.058) (-0.058)
Dummy: Capital factsheet -122.505 -158.874(-0.954) (-0.954)
Dummy: Labor factsheet -59.900 -84.234(-0.399) (-0.401)
Dummy: Placebo factsheet -39.092 -55.225(-0.276) (-0.278)
Dummy: Post 39.243 39.243 39.243 168.566 168.566(0.309) (0.308) (0.310) (1.093) (1.099)
Constant 198.183 198.183 198.183 -564.118 -564.118(0.228) (0.227) (0.228) (-0.568) (-0.571)
Obs. 822 822 822 822 822H0: Same treatment effect (p-value) 0.167 0.128 0.436 0.448Parentheses show t statistics. Errors are clustered by team (where each individual player forms his/her own team).Significance: ∗ ⇔ p < 0.1, ∗∗⇔ p < 0.05, ∗∗∗ ⇔ p < 0.01.
30 Marcel Fafchamps and Simon Quinn

Social Networks and Business Practices
Table 10: Experimental results: Sales last month
(1) (2) (3) (4) (5)ITT ITT LATE ITT LATE
Dummy: Invited × post -212.833(-0.526)
Dummy: Individual treatment × post -411.140 -538.046(-0.980) (-0.997)
Dummy: Group treatment × post -126.191 -175.924(-0.308) (-0.310)
Dummy: Capital factsheet × post 12.490 -0.441(0.040) (-0.001)
Dummy: Labor factsheet × post -350.445 -464.320(-1.343) (-1.341)
Dummy: Placebo factsheet × post -182.658 -255.031(-0.746) (-0.754)
Dummy: Invited -136.099(-1.087)
Dummy: Individual treatment -160.390 -204.943(-1.052) (-1.055)
Dummy: Group treatment -125.355 -175.228(-0.914) (-0.912)
Dummy: Capital factsheet -191.034 -247.537(-1.909)∗ (-1.879)∗
Dummy: Labor factsheet -17.559 -24.237(-0.112) (-0.113)
Dummy: Placebo factsheet 95.045 133.347(0.448) (0.451)
Dummy: Post 425.942 425.942 425.942 359.455 359.455(1.074) (1.073) (1.078) (1.679)∗ (1.690)∗
Constant -1875.259 -1875.259 -1875.259 -1565.933 -1565.933(-0.787) (-0.786) (-0.790) (-1.203) (-1.211)
Obs. 813 813 813 813 813H0: Same treatment effect (p-value) 0.099∗ 0.116 0.392 0.443Parentheses show t statistics. Errors are clustered by team (where each individual player forms his/her own team).Significance: ∗ ⇔ p < 0.1, ∗∗ ⇔ p < 0.05, ∗∗∗ ⇔ p < 0.01.
31 Marcel Fafchamps and Simon Quinn

Social Networks and Business Practices
Table 11: Experimental results: Profit
(1) (2) (3) (4) (5)ITT ITT LATE ITT LATE
Dummy: Invited × post 78.351(2.654)∗∗∗
Dummy: Individual treatment × post 97.315 124.516(2.129)∗∗ (2.138)∗∗
Dummy: Group treatment × post 69.932 97.323(2.450)∗∗ (2.436)∗∗
Dummy: Capital factsheet × post 49.477 64.065(1.741)∗ (1.746)∗
Dummy: Labor factsheet × post 27.262 37.211(0.976) (0.972)
Dummy: Placebo factsheet × post 96.948 135.335(1.758)∗ (1.770)∗
Dummy: Invited -28.052(-1.018)
Dummy: Individual treatment -34.901 -44.596(-1.255) (-1.261)
Dummy: Group treatment -25.022 -34.977(-0.849) (-0.851)
Dummy: Capital factsheet -21.620 -28.014(-1.145) (-1.149)
Dummy: Labor factsheet -7.306 -10.084(-0.323) (-0.325)
Dummy: Placebo factsheet 8.942 12.545(0.237) (0.239)
Dummy: Post -32.219 -32.219 -32.219 -2.506 -2.506(-1.226) (-1.225) (-1.231) (-0.166) (-0.167)
Constant 341.546 341.546 341.546 144.204 144.204(1.908)∗ (1.906)∗ (1.915)∗ (1.414) (1.422)
Obs. 866 866 866 866 866H0: Same treatment effect (p-value) 0.490 0.597 0.442 0.441Parentheses show t statistics. Errors are clustered by team (where each individual player forms his/her own team).Significance: ∗ ⇔ p < 0.1, ∗∗⇔ p < 0.05, ∗∗∗ ⇔ p < 0.01.
32 Marcel Fafchamps and Simon Quinn

Social Networks and Business Practices
Tabl
e12
:Exp
erim
enta
lres
ults
:Fir
min
trod
uced
new
prod
ucts
inth
epa
sttw
oye
ars(
diff
eren
cees
timat
es)
(1)
(2)
(3)
(4)
(5)
ITT
ITT
LA
TE
ITT
LA
TE
Dum
my:
Invi
ted×
post
0.07
0(1
.683
)∗
Dum
my:
Indi
vidu
altr
eatm
ent×
post
0.10
90.
141
(2.0
13)∗
∗(2
.034
)∗∗
Dum
my:
Gro
uptr
eatm
ent×
post
0.05
30.
074
(1.2
30)
(1.2
31)
Dum
my:
Cap
italf
acts
heet×
post
0.10
30.
136
(2.0
67)∗
∗(2
.026
)∗∗
Dum
my:
Lab
orfa
ctsh
eet×
post
0.09
00.
126
(1.7
22)∗
(1.7
25)∗
Dum
my:
Plac
ebo
fact
shee
t×po
st0.
010
0.01
4(0
.227
)(0
.228
)
Con
stan
t0.
123
0.12
30.
123
0.13
90.
139
(3.2
50)∗
∗∗(3
.247
)∗∗∗
(3.2
61)∗
∗∗(5
.139
)∗∗∗
(5.1
67)∗
∗∗
Obs
.45
845
845
845
845
8H
0:S
ame
trea
tmen
teff
ect(p-
valu
e)0.
213
0.26
70.
217
0.23
7Pa
rent
hese
ssh
owt
stat
istic
s.E
rror
sar
ecl
uste
red
byte
am(w
here
each
indi
vidu
alpl
ayer
form
shi
s/he
row
nte
am).
Sign
ifica
nce:
∗⇔p<
0.1
,∗∗⇔p<
0.05
,∗∗∗⇔p<
0.01.
33 Marcel Fafchamps and Simon Quinn

Social Networks and Business Practices
Tabl
e13
:Exp
erim
enta
lres
ults
:Fir
min
trod
uced
new
qual
ityco
ntro
lsta
ndar
dsin
the
past
year
(diff
eren
cees
timat
es)
(1)
(2)
(3)
(4)
(5)
ITT
ITT
LA
TE
ITT
LA
TE
Dum
my:
Invi
ted×
post
0.11
5(1
.839
)∗
Dum
my:
Indi
vidu
altr
eatm
ent×
post
0.14
90.
192
(2.0
27)∗
∗(2
.000
)∗∗
Dum
my:
Gro
uptr
eatm
ent×
post
0.09
90.
140
(1.5
43)
(1.5
59)
Dum
my:
Cap
italf
acts
heet×
post
0.05
40.
071
(0.8
91)
(0.8
93)
Dum
my:
Lab
orfa
ctsh
eet×
post
0.03
70.
051
(0.5
96)
(0.6
01)
Dum
my:
Plac
ebo
fact
shee
t×po
st0.
018
0.02
5(0
.281
)(0
.282
)
Con
stan
t0.
506
0.50
60.
506
0.57
80.
578
(8.7
64)∗
∗∗(8
.754
)∗∗∗
(8.7
92)∗
∗∗(1
5.31
3)∗∗
∗(1
5.39
5)∗∗
∗
Obs
.45
845
845
845
845
8H
0:S
ame
trea
tmen
teff
ect(p-
valu
e)0.
367
0.48
40.
876
0.88
9Pa
rent
hese
ssh
owt
stat
istic
s.E
rror
sar
ecl
uste
red
byte
am(w
here
each
indi
vidu
alpl
ayer
form
shi
s/he
row
nte
am).
Sign
ifica
nce:
∗⇔p<
0.1
,∗∗⇔p<
0.05,
∗∗∗⇔p<
0.01
.
34 Marcel Fafchamps and Simon Quinn

Social Networks and Business Practices
Tabl
e14
:Exp
erim
enta
lres
ults
:Inn
ovat
ion
inde
x(d
iffer
ence
estim
ates
)
(1)
(2)
(3)
(4)
(5)
ITT
ITT
LA
TE
ITT
LA
TE
Dum
my:
Invi
ted×
post
0.12
7(1
.999
)∗∗
Dum
my:
Indi
vidu
altr
eatm
ent×
post
0.16
50.
213
(2.1
92)∗
∗(2
.182
)∗∗
Dum
my:
Gro
uptr
eatm
ent×
post
0.11
00.
156
(1.6
34)
(1.6
45)∗
Dum
my:
Cap
italf
acts
heet×
post
0.11
30.
151
(1.8
24)∗
(1.7
93)∗
Dum
my:
Lab
orfa
ctsh
eet×
post
0.11
00.
153
(1.7
02)∗
(1.6
90)∗
Dum
my:
Plac
ebo
fact
shee
t×po
st0.
042
0.05
9(0
.606
)(0
.614
)
Con
stan
t0.
000
0.00
00.
000
0.05
00.
050
(0.0
00)
(0.0
00)
(0.0
00)
(1.1
95)
(1.2
02)
Obs
.46
646
646
646
646
6H
0:S
ame
trea
tmen
teff
ect(p-
valu
e)0.
377
0.49
50.
625
0.64
5Pa
rent
hese
ssh
owt
stat
istic
s.E
rror
sar
ecl
uste
red
byte
am(w
here
each
indi
vidu
alpl
ayer
form
shi
s/he
row
nte
am).
Sign
ifica
nce:
∗⇔p<
0.1,
∗∗⇔p<
0.05,
∗∗∗⇔p<
0.01
.
35 Marcel Fafchamps and Simon Quinn

Social Networks and Business Practices
Tabl
e15
:Dya
dic
regr
essi
ons:
Eff
ects
ofbe
ing
onth
esa
me
team
(1)
(2)
(3)
(4)
(5)
idi
scus
sed
with
j...
ire
mem
bersj
isp
oke
with
j..
.sav
ings
...l
abor
...i
nnov
atio
n
Dum
my:
Sam
ete
am0.
469
0.15
70.
015
0.02
10.
021
(17.
207)
∗∗∗
(8.2
33)∗
∗∗(2
.557
)∗∗
(3.2
26)∗
∗∗(3
.324
)∗∗∗
Con
stan
t0.
006
0.00
50.
002
0.00
10.
001
(2.7
37)∗
∗∗(2
.761
)∗∗∗
(1.7
50)∗
(1.4
19)
(1.0
02)
Obs
.24
1424
1424
1424
1424
14Pa
rent
hese
ssh
owt
stat
istic
s.E
rror
sar
ecl
uste
red
byfir
mi
and
byfir
mj.
Sign
ifica
nce:
∗⇔p<
0.1
,∗∗⇔p<
0.05,
∗∗∗⇔p<
0.01
.
36 Marcel Fafchamps and Simon Quinn

Social Networks and Business Practices
Tabl
e16
:Dya
dic
regr
essi
ons:
Eff
ects
offa
ctsh
eets
(1)
(2)
(3)
(4)
ire
mem
bersj
isp
oke
with
j
Dum
my:
Sam
ete
am0.
448
0.44
50.
162
0.15
7(1
0.29
5)∗∗
∗(1
0.39
0)∗∗
∗(5
.362
)∗∗∗
(5.1
45)∗
∗∗
Dum
my:
Sam
ete
aman
dj
rece
ived
capi
talf
acts
heet
0.02
00.
028
-0.0
08-0
.002
(0.3
81)
(0.5
25)
(-0.
206)
(-0.
047)
Dum
my:
Sam
ete
aman
dj
rece
ived
labo
rfa
ctsh
eet
0.08
90.
093
0.04
30.
053
(1.6
83)∗
(1.8
14)∗
(1.0
10)
(1.2
36)
Dum
my:
Sam
ete
aman
dj
rece
ived
plac
ebo
fact
shee
t-0
.028
-0.0
28-0
.056
-0.0
54(-
0.48
1)(-
0.48
4)(-
1.81
4)∗
(-1.
736)
∗
Dum
mie
s:j’
sfa
ctsh
eet
33
Dum
mie
s:i’
sfa
ctsh
eet
33
Obs
.24
1424
1424
1424
14H
0:F
acts
heet
effe
cts
join
tlyze
ro(p
-val
ue)
0.19
90.
148
0.04
4∗∗
0.02
1∗∗
Pare
nthe
ses
show
tst
atis
tics.
Err
ors
are
clus
tere
dby
firmi
and
byfir
mj.
Sign
ifica
nce:
∗⇔p<
0.1
,∗∗⇔p<
0.05
,∗∗∗⇔p<
0.01.
37 Marcel Fafchamps and Simon Quinn

Social Networks and Business Practices
Tabl
e17
:Dya
dic
regr
essi
ons:
Eff
ects
ofge
nder
(1)
(2)
ire
mem
bersj
isp
oke
with
j
Dum
my:
Sam
ete
aman
di
mal
ean
dj
mal
e0.
487
0.19
4(1
0.18
9)∗∗
∗(5
.284
)∗∗∗
Dum
my:
Sam
ete
aman
di
mal
ean
dj
fem
ale
0.58
90.
186
(11.
709)
∗∗∗
(4.1
92)∗
∗∗
Dum
my:
Sam
ete
aman
di
fem
ale
andj
mal
e0.
418
0.13
5(8
.882
)∗∗∗
(3.3
71)∗
∗∗
Dum
my:
Sam
ete
aman
di
fem
ale
andj
fem
ale
0.39
00.
111
(9.1
96)∗
∗∗(3
.712
)∗∗∗
Dum
my:
im
ale
andj
mal
e0.
006
0.01
2(1
.431
)(2
.030
)∗∗
Dum
my:
im
ale
andj
fem
ale
0.00
70.
005
(1.7
51)∗
(1.4
35)
Dum
my:
ife
mal
ean
dj
mal
e0.
009
0.00
4(2
.052
)∗∗
(1.4
26)
Dum
my:
ife
mal
ean
dj
fem
ale
0.00
50.
002
(1.7
55)∗
(1.0
03)
Obs
2414
2414
H0:E
qual
gend
er×
team
effe
cts
(p-v
alue
)0.
018∗
∗0.
306
Pare
nthe
ses
show
tst
atis
tics.
Err
ors
are
clus
tere
dby
firmi
and
byfir
mj.
Sign
ifica
nce:
∗⇔p<
0.1
,∗∗⇔p<
0.05
,∗∗∗⇔p<
0.01.
38 Marcel Fafchamps and Simon Quinn
Social Networks and Business PracticesTa
ble
18:D
yadi
cre
gres
sion
s:D
ispe
rsio
nof
inno
vatio
n(d
iffer
ence
estim
atio
n)
(1)
(2)
(3)
(4)
Dum
my:
Sam
ete
am×
post
-0.0
78-0
.023
0.03
6-0
.011
(-2.
580)
∗∗∗
(-0.
846)
(1.5
93)
(-0.
392)
Con
stan
t0.
486
0.42
90.
489
0.45
1(3
6.46
5)∗∗
∗(2
2.66
5)∗∗
∗(4
1.30
2)∗∗
∗(2
7.02
2)∗∗
∗
Obs
.22
1422
1422
1422
14
(5)
(6)
(7)
(8)
(9)
Dum
my:
Sam
ete
am×
post
-0.0
84-0
.044
-0.0
450.
014
-0.0
46(-
2.91
4)∗∗
∗(-
1.58
2)(-
1.59
9)(0
.569
)(-
1.76
4)∗
Con
stan
t0.
409
0.43
20.
469
0.31
50.
633
(19.
571)
∗∗∗
(23.
120)
∗∗∗
(32.
085)
∗∗∗
(14.
440)
∗∗∗
(33.
917)
∗∗∗
Obs
.22
1422
1422
1422
1422
14Pa
rent
hese
ssh
owt
stat
istic
s.E
rror
sar
ecl
uste
red
byfir
mi
and
byfir
mj.
Sign
ifica
nce:
∗⇔p<
0.1,
∗∗⇔p<
0.05
,∗∗∗⇔p<
0.01.
Out
com
eva
riab
les:
1.Fi
rmin
trod
uced
new
desi
gnor
pack
agin
g;
2.Fi
rmin
trod
uced
ane
wch
anne
lfor
selli
ngits
prod
ucts
;
3.Fi
rmin
trod
uced
ane
wm
etho
dfo
rpri
cing
;
4.Fi
rmin
trod
uced
ane
ww
ayof
adve
rtis
ing
orpr
omot
ion;
5.Fi
rmch
ange
dor
intr
oduc
edne
wbu
sine
sspr
oces
ses;
6.Fi
rmch
ange
dth
eor
gani
zatio
nof
itsw
ork;
7.Fi
rmin
trod
uced
new
qual
ityco
ntro
lsta
ndar
dsfo
rsup
plie
rsor
subc
ontr
acto
rs;
8.Fi
rmin
trod
uced
new
prod
ucts
;
9.W
eigh
ted
aver
age
ofth
eea
rlie
rinn
ovat
ion
mea
sure
s.
39 Marcel Fafchamps and Simon Quinn

Social Networks and Business Practices
Tabl
e19
:Dya
dic
regr
essi
ons:
Dis
pers
ion
ofou
tcom
es(d
iffer
ence
-in-d
iffer
ence
estim
atio
n)
(1)
(2)
(3)
(4)
(5)
Dum
my:
Sam
ete
am×
post
0.24
20.
021
126.
625
231.
073
582.
663
(0.1
16)
(0.5
00)
(1.4
99)
(1.6
06)
(1.9
54)∗
Diff
eren
cein
win
ning
s×
post
-0.0
80-0
.002
1.36
1-3
.293
-9.5
43(-
0.98
9)(-
1.38
2)(0
.418
)(-
0.49
8)(-
0.56
6)
Con
trol
s3
33
33
Obs
.43
8444
1844
2744
9844
98
(6)
(7)
(8)
(9)
(10)
Dum
my:
Sam
ete
am×
post
261.
919
439.
237
-37.
040
-0.0
250.
009
(1.7
29)∗
(3.7
50)∗∗∗
(-1.
248)
(-0.
679)
(0.2
19)
Diff
eren
cein
win
ning
s×
post
-2.3
10-3
.612
0.54
70.
000
-0.0
02(-
0.34
5)(-
0.59
9)(0
.648
)(0
.242
)(-
2.09
9)∗∗
Con
trol
s3
33
33
Obs
.40
7136
2240
5343
4144
04Pa
rent
hese
ssh
owt
stat
istic
s.E
rror
sar
ecl
uste
red
byfir
mi
and
byfir
mj.
Sign
ifica
nce:
∗⇔p<
0.1,
∗∗⇔p<
0.05
,∗∗∗⇔p<
0.01.
‘Con
trol
s’ar
e‘s
ame
team
’,‘p
ost’
and
‘diff
eren
cein
win
ning
s’,a
ndan
inte
rcep
t.
Out
com
eva
riab
les:
1.H
ours
wor
ked
byth
ere
spon
dent
inth
efir
m;
2.W
heth
erot
hers
wor
kin
the
firm
;
3.To
tale
xpen
ses
last
mon
th;
4.In
vent
orie
s;
5.C
ash
and
inve
ntor
ies;
6.C
apita
lsto
ck;
7.Sa
les
last
mon
th;
8.Pr
ofit;
9.W
heth
erth
ere
spon
dent
has
aba
nkac
coun
t;
10.
Whe
ther
the
resp
onde
ntus
esa
susu
colle
ctor
.
40 Marcel Fafchamps and Simon Quinn

Social Networks and Business Practices
Tabl
e20
:Exp
erim
enta
lres
ults
:Att
rite
dbe
twee
nw
aves
6an
d7
(1)
(2)
(3)
(4)
(5)
ITT
ITT
LA
TE
ITT
LA
TE
Dum
my:
Invi
ted×
post
0.02
1(0
.519
)
Dum
my:
Indi
vidu
altr
eatm
ent×
post
0.04
70.
072
(0.9
22)
(0.9
03)
Dum
my:
Gro
uptr
eatm
ent×
post
0.00
90.
013
(0.2
14)
(0.2
15)
Dum
my:
Cap
italf
acts
heet×
post
0.05
10.
078
(1.2
34)
(1.2
06)
Dum
my:
Lab
orfa
ctsh
eet×
post
0.01
00.
016
(0.2
41)
(0.2
41)
Dum
my:
Plac
ebo
fact
shee
t×po
st-0
.006
-0.0
09(-
0.13
5)(-
0.13
6)
Con
stan
t0.
137
0.13
70.
137
0.14
20.
142
(3.7
55)∗
∗∗(3
.752
)∗∗∗
(3.7
66)∗
∗∗(5
.415
)∗∗∗
(5.4
40)∗
∗∗
Obs
.55
155
155
155
155
1H
0:S
ame
trea
tmen
teff
ect(p-
valu
e)0.
328
0.34
20.
453
0.47
0Pa
rent
hese
ssh
owt
stat
istic
s.E
rror
sar
ecl
uste
red
byte
am(w
here
each
indi
vidu
alpl
ayer
form
shi
s/he
row
nte
am).
Sign
ifica
nce:
∗⇔p<
0.1
,∗∗⇔p<
0.05
,∗∗∗⇔p<
0.01.
41 Marcel Fafchamps and Simon Quinn

Social Networks and Business Practices
Appendix: Factsheets and further tables (for online pub-lication)
42 Marcel Fafchamps and Simon Quinn

Social Networks and Business Practices
Figure 1: Factsheet: Placebo
43 Marcel Fafchamps and Simon Quinn

Social Networks and Business Practices
Figure 2: Factsheet: Labor
44 Marcel Fafchamps and Simon Quinn

Social Networks and Business Practices
Figure 3: Factsheet: Capital
45 Marcel Fafchamps and Simon Quinn

Social Networks and Business Practices
Table 21: Experimental results: Respondent has a bank account
(1) (2) (3) (4) (5)ITT ITT LATE ITT LATE
Dummy: Invited × post -0.016(-0.240)
Dummy: Individual treatment × post -0.010 -0.012(-0.123) (-0.114)
Dummy: Group treatment × post -0.018 -0.025(-0.270) (-0.267)
Dummy: Capital factsheet × post 0.089 0.117(1.248) (1.250)
Dummy: Labor factsheet × post -0.012 -0.017(-0.173) (-0.176)
Dummy: Placebo factsheet × post -0.014 -0.019(-0.196) (-0.190)
Dummy: Invited 0.094(1.564)
Dummy: Individual treatment 0.060 0.077(0.841) (0.841)
Dummy: Group treatment 0.109 0.153(1.749)∗ (1.775)∗
Dummy: Capital factsheet -0.038 -0.050(-0.582) (-0.585)
Dummy: Labor factsheet 0.057 0.079(0.915) (0.909)
Dummy: Placebo factsheet 0.082 0.114(1.345) (1.384)
Dummy: Post 0.190 0.190 0.190 0.164 0.164(3.138)∗∗∗ (3.135)∗∗∗ (3.150)∗∗∗ (3.968)∗∗∗ (3.992)∗∗∗
Constant -0.808 -0.808 -0.808 -0.596 -0.596(-2.052)∗∗ (-2.049)∗∗ (-2.059)∗∗ (-2.228)∗∗ (-2.241)∗∗
Obs. 903 903 903 903 903H0: Same treatment effect (p-value) 0.901 0.875 0.394 0.401Parentheses show t statistics. Errors are clustered by team (where each individual player forms his/her own team).Significance: ∗ ⇔ p < 0.1, ∗∗ ⇔ p < 0.05, ∗∗∗ ⇔ p < 0.01.
46 Marcel Fafchamps and Simon Quinn

Social Networks and Business Practices
Table 22: Experimental results: Respondent uses a susu collector
(1) (2) (3) (4) (5)ITT ITT LATE ITT LATE
Dummy: Invited × post 0.087(1.141)
Dummy: Individual treatment × post 0.104 0.134(1.128) (1.133)
Dummy: Group treatment × post 0.080 0.112(1.022) (1.021)
Dummy: Capital factsheet × post 0.053 0.069(0.685) (0.688)
Dummy: Labor factsheet × post -0.053 -0.073(-0.710) (-0.716)
Dummy: Placebo factsheet × post 0.020 0.028(0.258) (0.259)
Dummy: Invited -0.070(-1.035)
Dummy: Individual treatment -0.040 -0.051(-0.507) (-0.509)
Dummy: Group treatment -0.083 -0.116(-1.201) (-1.214)
Dummy: Capital factsheet -0.042 -0.054(-0.649) (-0.655)
Dummy: Labor factsheet 0.054 0.075(0.879) (0.885)
Dummy: Placebo factsheet 0.034 0.048(0.519) (0.522)
Dummy: Post -0.057 -0.057 -0.057 0.012 0.012(-0.759) (-0.759) (-0.762) (0.249) (0.251)
Constant 0.885 0.885 0.885 0.405 0.405(1.798)∗ (1.796)∗ (1.804)∗ (1.293) (1.300)
Obs. 910 910 910 910 910H0: Same treatment effect (p-value) 0.719 0.802 0.477 0.471Parentheses show t statistics. Errors are clustered by team (where each individual player forms his/her own team).Significance: ∗ ⇔ p < 0.1, ∗∗ ⇔ p < 0.05, ∗∗∗ ⇔ p < 0.01.
47 Marcel Fafchamps and Simon Quinn

Social Networks and Business Practices
Tabl
e23
:Dya
dic
regr
essi
ons:
Eff
ects
ofbe
ing
onth
esa
me
team
(con
trol
ling
for
trai
ning
sess
ion)
(1)
(2)
(3)
(4)
(5)
(6)
ire
mem
bersj
isp
oke
with
j
Dum
my:
Sam
ete
am0.
469
0.43
20.
440
0.15
70.
144
0.14
1(1
7.20
7)∗∗
∗(8
.970
)∗∗∗
(10.
391)
∗∗∗
(8.2
34)∗
∗∗(4
.916
)∗∗∗
(4.6
83)∗
∗∗
Dum
my:
Sam
etr
aini
ngse
ssio
n0.
042
0.02
60.
014
0.01
3(1
.021
)(0
.788
)(0
.538
)(0
.492
)
Con
stan
t0.
006
0.00
50.
005
0.00
4(2
.737
)∗∗∗
(2.1
23)∗
∗(2
.761
)∗∗∗
(2.6
76)∗
∗∗
Dum
mie
s:i’
str
aini
ngse
ssio
n3
3
Dum
mie
s:j’
str
aini
ngse
ssio
n3
3
Obs
.24
1424
1424
1424
1424
14Pa
rent
hese
ssh
owt
stat
istic
s.E
rror
sar
ecl
uste
red
byfir
mi
and
byfir
mj.
Sign
ifica
nce:
∗⇔p<
0.1
,∗∗⇔p<
0.05,
∗∗∗⇔p<
0.01
.
48 Marcel Fafchamps and Simon Quinn