social progress index 2015 · social progress index 2015 s p i 2015 social progress index ... beta,...
TRANSCRIPT
SOCIAL PROGRESS INDEX 2015
BY MICHAEL E PORTER AND SCOTT STERN WITH MICHAEL GREEN

The Social Progress Imperative is registered as a nonprofit organization in the United States.We are grateful to the following organizations for their financial support:
1Social Progress Index 2015 | © Social Progress Imperative 2015Social Progress Index 2015 | © Social Progress Imperative 2015
FOREWORD ………………………………………………………………………………………………………………………………….2
ACKNOWLEDGEMENTS ………………………………………………………………………………………………………………4
EXECUTIVE SUMMARY ………………………………………………………………………………………………………………..11
CHAPTER 1 / WHY MEASURE SOCIAL PROGRESS? …………………………………………………………………27
CHAPTER 2 / SOCIAL PROGRESS INDEX 2015 RESULTS ………………………………………………………………39
CHAPTER 3 / SOCIAL PROGRESS AND ECONOMIC DEVELOPMENT ……………………………………..65
CHAPTER 4 / BENCHMARKING SOCIAL PROGRESS ……………………………………………………………….89
CHAPTER 5 / APPLICATIONS OF THE SOCIAL PROGRESS INDEX …………………………………………..105
CHAPTER 6 / THE SOCIAL PROGRESS NETWORK …………………………………………………………………..121
APPENDIX A / INDICATOR DEFINITIONS AND DATA SOURCES……………………………………………140
APPENDIX B / SOCIAL PROGRESS INDEX 2015 FULL RESULTS ………………………………………………146
APPENDIX C / SOCIAL PROGRESS INDEX 2014 RESTATED RESULTS ……………………………………148
APPENDIX D / SOCIAL PROGRESS INDEX VS LOG OF GDP PER CAPITA ………………………………150
APPENDIX E / SOCIAL PROGRESS INDEX 2015 SCORES AND CORRELATIONS ……………………151
APPENDIX F / SCORECARD SUMMARY ……………………………………………………………………………..……152
SOCIAL PROGRESS INDEX 2015
2 Social Progress Index 2015 | © Social Progress Imperative 2015Social Progress Index 2015 | © Social Progress Imperative 2015
FOREWORD/ BRIZIO BIONDI-MORRA
The Social Progress Imperative believes that redefining what it means to be a successful society will empower leaders and changemakers to create better outcomes for people and planet. So I am delighted that just two years since we launched the first, beta, version of the Social Progress Index we are already seeing real impact. In December the Government of Paraguay launched a new National Development Plan to 2030 that explicitly targets not just economic growth but social progress as well. Attached to that plan are new budgetary priorities, new investments to advance those goals, one of which is to reduce child malnutrition to 2% or less of the population by 2018. The Social Progress Index has helped the government of President Horacio Cartes to identify problems like this and, with the support of stakeholders across government, business and civil society in the Social Progress Network in Paraguay, to mobilize the resources to find solutions.
This is just one example. In the last year we have seen an explosion of interest in adopting and using the Social Progress tool not just by national governments but also by international organizations such as the European Commission and by regions and cities in Latin America and, more recently, in North America. Indeed, the first sub-national Social Progress Index that was launched in August 2014 for 772 municipalities across the Amazon region of Brazil has proven to be a model and an inspiration for cities and regions and communities around the world, as we describe in Chapter 6 of this report. Businesses too are seeing the power of understanding their impact on society. In this report you will find a case study of our work with Coca-Cola, Natura and Ipsos to measure social progress at the community level and drive cross-sector collaboration to find solutions to social and environmental problems.
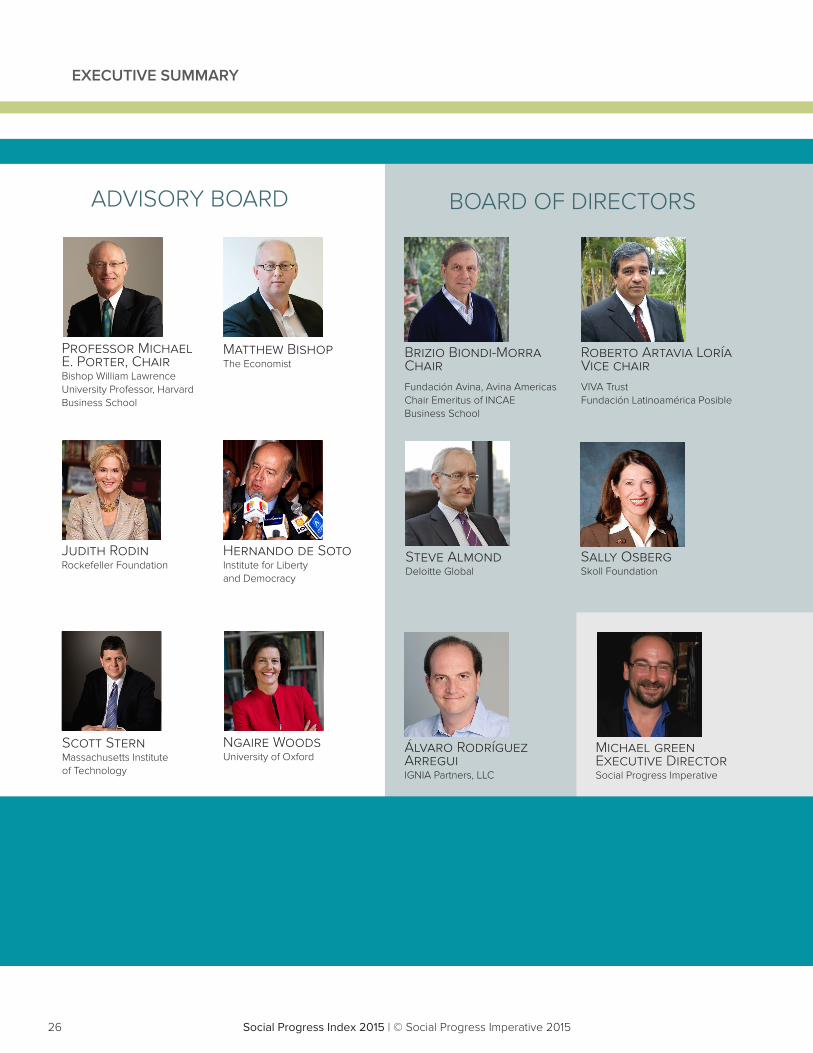
We greatly appreciate the intellectual leadership of the chairman of our Advisory Board, Prof Michael Porter, and Prof Scott Stern who have guided the development of the Social Progress Index. It is a testament to their intellectual leadership, alongside the other members of our Advisory Board – Matthew Bishop (whose initial idea sparked this endeavor), Judith Rodin, Hernando de Soto, and Ngaire Woods - that the Social Progress Index has so quickly established itself within the global debate.
We are also profoundly appreciative of the financial support of Avina Foundation, Compartamos Banco, Cisco, Deloitte, Rockefeller Foundation, and Skoll Foundation that has brought us to this point. We are fortunate to have such a group of committed and visionary supporters, whose contribution goes far beyond money. Special thanks to the Skoll Foundation for making the Social Progress Imperative an integral part of the Skoll World Forum on Social Entrepreneurship and to Avina Foundation, Deloitte and Jose Roberto Marinho for their practical, hands-on support in building the Social Progress Network in Latin America and beyond.
3Social Progress Index 2015 | © Social Progress Imperative 2015Social Progress Index 2015 | © Social Progress Imperative 2015
FOREWORD/ BRIZIO BIONDI-MORRA
The Social Progress Imperative has come a long way in a short period of time but we have a big, audacious goal: to redefine how the world measures success, by putting social progress alongside GDP when we determine a society’s performance. I am confident we can get there because of the dedication, wisdom, and inspiration of the outstanding team that makes up our board of directors. Roberto Artavia Loria, our vice-chairman, has been not just an architect of the Social Progress Index but also a tireless advocate for social progress. It is his championing that has positioned Latin America as a pioneer in applying the Index and building national networks to promote social change. Sally Osberg’s determination always to aim for the highest goals, and to commit so much of her challenging and creative mind to help us get there, has proven incredibly contagious. Alvaro Rodriguez Arregui, our treasurer, has guided the organization through our growth and expansion with practical wisdom and collegial generosity. Steve Almond, the newest member of our team, has brought strategic vision and insight at the time that we needed it most. I thank them all - as well as previous board members Matthew Bishop, Heather Hancock, and Tae Yoo - who have guided us on our journey.
The second reason I am confident that Social Progress Imperative can deliver on its promise is the team, led by Michael Green our Executive Director. We have an outstanding staff of committed professionals in their different fields of expertise and, in Michael, a dedicated leader whose TED Talk about the Social Progress Index sent a clear message to the world that the time has come for a measurement revolution.
Yet what gives me most confidence is the network of partners who are working on the ground to make the world a better place. Among this group we can count presidents, ministers, governors, mayors, CEOs, social entrepreneurs, and engaged citizens at all levels. I am delighted that the Social Progress Index has proved to be such a powerful tool but it only has force in the hands of these committed individuals. I thank them and hope that ever more social innovators such as these will join this venture to put social progress at the center of how we all think, speak, and act.
Brizio Biondi-Morra Chairman, Social Progress Imperative
4 Social Progress Index 2015 | © Social Progress Imperative 2015Social Progress Index 2015 | © Social Progress Imperative 2015
ACKNOWLEDGEMENTS
The creation of the Social Progress Index has been made possible only with the help of many, many people and organizations. We thank everyone who has contributed to our effort. We could never hope to name all those who have helped us, but we would like to highlight the following individuals and organizations for their contributions. To anyone we may have forgotten, we can only ask that you be as generous in spirit as you were with your time.
Thanks to our financial supporters Cisco, Compartamos Banco, Deloitte Touche Tohmatsu Limited, Fundación Avina, The Rockefeller Foundation, and Skoll Foundation. These organizations had faith in our project and generously funded our work.
For tireless work on our behalf to carry our work forward across Latin America, thanks to the team at Fundación Avina and Avina Americas: Gabriel Baracatt, Glaucia Barros, Martin Beaumont, Edgard Bermudez, Diana Castro, Marcus Fuchs, Tatiana Lopez, Cynthia Loría, Sean McKaughan, María José Meza, Valdemar Oliveira, Francisca Rivero, Eduardo Rotela, Guillermo Scallan, Bernardo Toro and Pablo Vagliente. The team of Emily Adelman Hunsberger, Emily Fintel Kaiser, and Adrian Naranjo provided critical support of the Social Progress Imperative before it became an independent organization and have supported us since. Raul Gauto led special efforts at Fundación Avina to create our Social Progress Network in Latin America.
Thanks to Deloitte for their significant contributions globally across a number of strategic areas: leadership and direction on the Board of Directors; strategic input to develop an engagement strategy for the private sector; convening key stakeholder around the Social Progress Index and the Social Progress Imperative’s agenda; economic consulting expertise and insight to author a global report on the relationship between foreign direct investment and social progress; strategic communications advice, expertise and execution to support launch activities globally, and in country, with the media, government and the private sector to build awareness and advance the global debate on social progress; guidance and support in progressing sub national index discussions in North America and the EU; and active engagement in social progress networks across Latin America to advance discussions and actions on national priorities.
Especial thanks to the great team at Skoll Foundation: Edwin Ou, Paula Kravitz, Renee Kaplan, and Suzana Grego. At the Skoll World Forum, thanks to Sarah Borgman, Lindsey Fishleder, Jill Ultan, Gabriel Diamond, Phil Collis, and Tina Tan-Zane. In addition to providing a platform for the 2013 launch of our organization and the beta version of our index and for the 2014 launch of the Social Progress Network, the Forum has enabled us to benefit from the wisdom of some of the world’s leading social innovators.
At The Rockefeller Foundation, thanks to Zia Khan, Nancy MacPherson, John Irons, Alyson Wise, Jeremy Cooper, Tommy O’Donnell, Laura Gordon, Abigail Carlton, Erissa Scalera, Michael Myers, Selina Patton, and Laura Fishler.
Much thanks for the groundbreaking work and inspiration of Professor Jean-Paul Fitoussi, Institut d’Études Politiques de Paris; Professor Amartya Sen, Harvard University; Professor Joseph E. Stiglitz, Columbia University; and Professor Mahbub ul Haq, University of Karachi Our project would be literally unimaginable without the ability to build on your work.
5Social Progress Index 2015 | © Social Progress Imperative 2015Social Progress Index 2015 | © Social Progress Imperative 2015
ACKNOWLEDGEMENTS
Thanks to the members of the OECD High Level Expert Group: Chairs Joseph E. Stiglitz, Professor of Economics, Business and International Affairs, Columbia University; Jean-Paul Fitoussi, Professor of Economics at Sciences Po (Paris) and Luiss (Rome); Martine Durand, Chief Statistician, OECD; and Members Yann Algan, Professor of Economics, Sciences-Po, Paris; Timothy Besley, Professor of Economics and Political Science, London School of Economics; Francois Bourguignon, Director, Paris School of Economics; Angus Deaton, Dwight D. Eisenhower Professor of Economics and International Affairs, Woodrow Wilson School of Public and International Affairs and Economics Department at Princeton University; Enrico Giovannini, Professor of Economic Statistics, University of Rome Tor Vergata; Jacob Hacker, Director of the Institution for Social and Policy Studies, and Stanley B. Resor Professor of Political Science at Yale University; Geoffrey Heal, Garrett Professor of Public Policy and Corporate Responsibility, Professor of Economics and Finance, Columbia University’s Graduate School of Business; Director of the Earth Institute’s Center for Economy, Environment, and Society; Ravi Kanbur, T.H. Lee Professor of World Affairs, International Professor of Applied Economics and Management and Professor of Economics, Cornell University; Alan Krueger, Bendheim Professor of Economics and Public Affairs, Princeton University; Nora Lustig, Samuel Z. Stone Professor of Latin American Economics, Tulane University; Jil Matheson, Former United Kingdom National Statistician; Thomas Piketty, Professor, Paris School of Economics; Walter Radermacher, Director-General, Eurostat; Chiara Saraceno, Honorary fellow at the Collegio Carlo Alberto, Torino; Pronab Sen, Chairman, National Statistical Commission, India; Arthur Stone, Senior Behavioral Scientist, Professor of Psychology, University of Southern California; and Yang Yao, Director of CCER and dean of National School of Development at Peking University.
Thanks also to scholars whose wisdom has helped shape our work: Marc Fleurbaey, Princeton University; Nava Ashraf, Harvard Business School; Sigal Barsade, Wharton School, University of Pennsylvania; Manuel Trajtenberg, Council for Higher Education in Israel; Justin Wolfers, University of Michigan, Denise Lievesley, Sabina Alkire, Oxford Poverty and Human Development Initiative, University of Oxford; Terra Lawson-Remer; and Allister McGregor, Institute for Development Studies, University of Sussex.
At Harvard Business School and its Institute for Competitiveness, thanks to Richard Bryden, Marcela Merino, Alexandra Houghtalin, Kyla Hanaway, Jordan Goldberg, Jill Hogue, Jem Hudson, Christian Ketels, Jorge Ramirez-Vallejo, and Michael Toffel.
At the Massachusetts Institute of Technology, thanks to Bella DiMambro.
Thanks to Alison Kennedy, and Anuja Singh at UNESCO Institute for Statistics; Fiona David, Katharine Bryant , and Davina Durgana at Walk Free Foundation; Juan Botero and Alejandro Ponce at the World Justice Project; and Diana Fletschner at Landesa for technical input on components and indicators.
Thanks to Patrick O’Sullivan, Professor of Business Ethics, Grenoble School of Management and University of Warsaw, for contributing text on the challenges of measuring leisure time, and to Clive Bates for writing on the challenges of measuring ecosystem sustainability.
6 Social Progress Index 2015 | © Social Progress Imperative 2015Social Progress Index 2015 | © Social Progress Imperative 2015
Special thanks to Sir Martin Sorrell and Lady Cristina Falcone for hosting the launch of Social Progress Index 2014.
Special thanks to Darren Walker of the Ford Foundation for highlighting the Social Progress Index at the Clinton Global Initiative in 2014.
At TED, thanks to Bruno Giussani, Chris Anderson, Emily McManus, Gwen Schroeder, Thu-Huong Ha, Katerina Biliouri, and Katherine McCartney.
At the BMW Foundation, thanks to Ilsabe von Campenhausen, Inna Veleva, Phillip von der Wippel, Sandra Ortiz Diaz, Dr. Astrid Skala-Kuhmann, Mark Fliegauf, Dr. Oliver Meinecke, Dr. Steffi Augter, Dr. Joerg Mayer-Ries, and Oliver Renner.
At The Bill and Melinda Gates Foundation, thanks to Gargee Ghosh and Julie Walz.
At the World Bank, thanks to Maitreyi Bordia Das, Fabrice Houdart, Aleem Walji, Anil Sinha, Neil Fantom. At the Center for Global Development, thanks to Andy Sumner and Owen Barder. At the UN Foundation, thanks to Andrew Maskrey and Bina Desai at Global Assessment Report on Disaster Risk Reduction.
Thanks too to our friends Henry and Colleen Timms, Pamela Hartigan, Indy Johar, Randolph Kent, Laurie Joshua, and Michael Borowitz for wisdom and inspiration.
Special thanks to our former colleagues Madelyn Swift and Sarah Orzell, who contributed so much to this work.
Numerous partner organizations in Latin America were among our earliest and remain our most constant and innovative supporters. At Fundación Latinoamérica Posible, special thanks to Roberto Artavia, for leading our pioneering efforts and for its continuous guidance and support to the Social Progress Network in Latin America, as well as to Shannon Music, Monika Schmid, Ethan Murray, Roberto J. Artavia, and Eduardo López. At CiC, thanks to Urs Jagger, Felipe Castro and Arturo Rodriguez. At GENTERA, thanks to Alejandro Puente and Jorge Daniel Manrique. At IGNIA, thanks to Sebastian Cueva Pena and Gladys Garza Rivera. At INCAE Business School, special thanks to Arturo Condo for continuous support to our early deployment in Latin America since 2013; to Abraham Naranjo, Maria Balbas, Camelia Ilie and Luatania Vega, to help us implement the first expert training on SPI methodology in May 2014; and to Victor Umaña, Ronald Arce, Andrea Prado and Melania Chaverri to lead an applied research agenda on social progress at the Latin American Center for Competitiveness and Sustainable Development (CLACDS).
Many organizations in Paraguay took a risk, organized our first national network and helped to pioneer use of the Social Progress Framework. Thanks to the leaders and teams at Secretaría Técnica de Planificación del Desarrollo Económico y Social (STP), Fundación Avina, Fundación Paraguaya, Fundación Moisés Bertoni, Fundación Desarrollo en Democracia, Mingarã, Feprinco, Asociación de Empresarios Cristianos, Club de Ejecutivos, Pro Desarrollo Paraguay, Equipo Nacional de Estrategia País, Fundación MAE UC, Global Shapers Asunción, Deloitte Paraguay, Red de Líderes
ACKNOWLEDGEMENTS
7Social Progress Index 2015 | © Social Progress Imperative 2015Social Progress Index 2015 | © Social Progress Imperative 2015
para la Competitividad and Red del Pacto Global Paraguay. Special thanks to Minister José Molinas for leading the first National Development Plan Paraguay 2030, which adopts the Social Progress Index as key performance indicator. Thanks to Eduardo Rotela, chair of the national network, and to Rodrigo Medina, executive coordinator.
In Brazil, several partner organizations have been critical to some of the first real-world application of our tools at the subnational level. Thanks to Banco do Brasil, Coca-Cola Brazil, Comunitas, Camargo Correa, Centro Ruth Cardoso, CLUA, Deloitte, Fundacíon Avina, Fundação Amazônia Sustentável, Fundação Dom Cabral, Fractal Processos, GIFE, Giral, Good Energies, Instituto Arapyaú, Instituto Ethos, Instituto Pereira Passos, ICE, Imazon, Imaflora, IPSOS, Instituto Ethos, ISA, Natura, Observatório do Clima, Pontifícia Universidade Católica de São Paulo, Sistema B and Vale. Thanks to Tasso Azevedo and Anna Peliano. Special thanks to José Roberto Marinho for continuous support of the application of the Social Progress Index in Brazil. Thanks to Glaucia Barros, chair of the network, Renato Souza, communications lead and Paula Sarquis and Elaine Smith, executive coordination. Special thanks to Imazon to lead the first subnational Social Progress Index at the Municipal level, and to Coca-Cola, Natura and IPSOS to lead the first application of the social progress methodology at the community level.
In Chile, special thanks to the Ministerio de Desarrollo Social, Acción RSE, Deloitte, Fundación Avina, Fundación Superación Pobreza, Masisa. Thanks to Francisca Rivero for chairing the Network, and to Patricia Jara.
In Costa Rica, special thanks to AED, Borge & Asociados, Cenecoop, Deloitte, Fenecoop, Fifco, Fundación Avina, FLAP, INCAE Business School, Infocoop, and Voces Vitales. Special thanks to the leaders and organizations of the cooperativist movement for leading the first application of the Social Progress Index to the sectoral level.
In Colombia, thanks to Fundación Corona, Bogotá Como Vamos, Compartamos con Colombia, Deloitte, and Fundación Avina. Special thanks to Angela Escallón and Diana Castro for leading our efforts to build the first application of the Social Progress Index to the city level, and to Alvaro Bernal and our colleagues at Compartamos con Colombia for securing the executive coordination of our emerging network
In El Salvador, special thanks to Alejandro Poma, Manuel Sanchez Masferrer and to the organizations promoting the social progress index: Fundación Poma and Escuela Superior de Economia y Negocios.
In Guatemala, special thanks to Emmanuel Seidner, its team at the Instituto Progreso Social Guatemala and supporting organizations like ASIES, CABI, CIEN, CEUR-USAC, Deloitte, Fundación Avina, FUNDESA, Mejoremos Guate, Alianza por la Nutrición, IDIES-URL, INCAE Business School, Facultad de Medicina USAC, Fundación Fe y Alegría, Grupos Gestores, Obras Sociales del Hermano Pedro, Observatorio de Salud Urbana, WAKAMI, and the Municipality of Guatemala City.
ACKNOWLEDGEMENTS
8 Social Progress Index 2015 | © Social Progress Imperative 2015Social Progress Index 2015 | © Social Progress Imperative 2015
In Panama, special thanks to Marcela Alvarez Calderon for chairing our emerging network and to Maripaz Vindas for securing its executive coordination. Many thanks to the following supporting organizations: Cámara de Comercio, Centro Nacional de Competitividad, Ciudad del Saber, Copa Airlines, United Way, Consejo del Sector Privado para la Asistencia Educacional, La Prensa, Ministerio de Desarrollo Social, Ministerio de Economía y Finanzas, Ministerio de Gobierno y Justicia, Ministerio de Salud, Sumarse, Universidad Latina.
In Peru, special thanks to Juan Manuel Arribas for chairing our emerging network and to Alexandra Ames for securing its executive coordination. Many thanks to the following supporting organizations: Ministerio de Cultura, Ministerio de Desarrollo e Inclusión Social, Fundacion Avina, CIES, Perú 2021, Grupo Radio Programas del Peru, Soluciones Empresariales contra la Pobreza, Sociedad Nacional de Industrias, UNACEM and Universidad del Pacífico. Also special thanks to Percy Medina from IDEA Internacional, Patricia Zárate, Arturo Maldonado, Luis Egúsquiza, Ana Neyra y Luis Fernando Llanos.
We also want to acknowledge the following organizations which are supporting SPI-related activities and emerging networks: Government of Salta and Fundaciόn Avina (Argentina), Ciudadania (Bolivia), ChangeX (Ireland), Scope Consult (Malaysia) and LifeSupport Caribbean (Trinidad and Tobago).
In Europe, the active leadership of the European Commission, through DG Regions and the Joint Research Centre, and the support of Orkestra (Basque Competitiveness Institute) and Deloitte, is leading towards the first social progress index applied at the regional level.
In North America, numerous champions of our work are leading the growth of networks in the US and Canada. Thanks to Emechete Onuoha of Xerox Canada. In Michigan, thanks to Alicia Douglas of Passion in Philanthropy, Dan Pitera of the University of Detroit Mercy’s Detroit Collaborative Design Center, Mark Davidoff of Deloitte, Rob Collier of the Michigan Council of Foundations, Jill Ford of the Mayor’s Office, City of Detroit, and Paul Groll and Harvey Hollins of the State of Michigan. Special thanks to Mayor Joseph Curtatone whose vision for the city of Somerville, Massachusetts is one of social progress, and his team at SomerStat including Skye Stewart, Emily Monea, and John Harding. Thank you also to Mark Esposito of Harvard Business School and the Microeconomics of Competitiveness network, Patrick O’Sullivan of Grenoble Ecole de Management, and Ayesha Khalid, Massachusetts Institute of Technology.
Thanks to to Benjamin Wiederkehr and his team at Interactive Things including Peter Gassner, Piotr Fedorczyk, Jeremy Stucki, and Christian Siegrist, for again taking our endless list of technical requirements and requests for last-minute changes to provide a world-class online data exploration tool and website at http://www.socialprogressimperative.org. Thanks to Robert Ludke, Holly Fisher Skillin, and team at H&K Strategies for expert counsel and assistance on our communications. Thanks to Oliver Kendall and Michael Williams at Westminster Public Affairs for leading our efforts to put the Social Progress Index in front of journalists.
ACKNOWLEDGEMENTS
9Social Progress Index 2015 | © Social Progress Imperative 2015Social Progress Index 2015 | © Social Progress Imperative 2015
Thanks to RJ Andrews, Mark de Graef, Julie Moores, and Andrea Nordstrom for graphics and layout work on this report.
Thanks to Karen Weisblatt and team at Weisblatt & Associes for conducting a user study to improve this report.
Finally, our gratitude to the organizations on whose data we relied to create the Social Progress Index 2015: Academic Ranking of World Universities, Barro-Lee Educational Attainment Dataset,
Cingranelli-Richards Human Rights Data Project, Food and Agriculture Organization of the United Nations, Freedom House, Fund for Peace Fragile States Index, Gallup World Poll, Heritage Foundation,
Institute for Economics and Peace Global Peace Index, Institute for Global Health Metrics and Evaluation, Institute for Health Metrics and Evaluation, International Telecommunications Union,
OECD Gender Institutions and Development Database, Pew Research Center Government Restrictions Index, Pew Research Center Social Hostilities Index, QS World University Rankings, Reporters Without Borders, Sustainable Energy for All, Times Higher Education World University Rankings, Transparency International, UN Inter-agency Group for Child Mortality Estimation, United Nations Development Programme, United Nations Population Division, WHO/UNICEF Joint Monitoring Programme for Water Supply and Sanitation,World Bank, World Economic Forum Global Competitiveness Report, World Health Organization, World Resources Institute, Yale Center for Environmental Law & Policy and Columbia University Center for International Earth Science Information Network Environmental Performance Index, and the United Nations Educational, Scientific, and Cultural Organization Institute for Statistics. Our use of their data does not imply their endorsement. As an organization that believes that better information can build a better world, we recognize and appreciate those who created such important resources of data.
ACKNOWLEDGEMENTS

10 Social Progress Index 2015 | © Social Progress Imperative 2015Social Progress Index 2015 | © Social Progress Imperative 2015
11Social Progress Index 2015 | © Social Progress Imperative 2015Social Progress Index 2015 | © Social Progress Imperative 2015
EXECUTIVE SUMMARYSOCIAL PROGRESS INDEX 2015
12 Social Progress Index 2015 | © Social Progress Imperative 2015Social Progress Index 2015 | © Social Progress Imperative 2015
EXECUTIVE SUMMARY
13Social Progress Index 2015 | © Social Progress Imperative 2015Social Progress Index 2015 | © Social Progress Imperative 2015
EXECUTIVE SUMMARY
Economic growth has lifted hundreds of millions out of poverty and improved the lives of many more over the last half century. Yet it is increasingly evident that a model of development based on economic progress alone is incomplete. Economic growth alone is not enough. A society that fails to address basic human needs, equip citizens to improve their quality of life, protect the environment, and provide opportunity for many of its citizens is not succeeding. We must widen our understanding of the success of societies beyond economic outcomes. Inclusive growth requires achieving both economic and social progress.
The Social Progress Index aims to meet this pressing need by creating a robust and holistic measurement framework for national social and environmental performance that can be used by leaders in government, business, and civil society to benchmark success and accelerate progress. The Social Progress Index is the first comprehensive framework for measuring social progress that is independent of GDP, and complementary to it. Our vision is a world in which social progress sits alongside GDP as a core benchmark for national performance. The Index provides the systematic, empirical foundation to guide strategy for inclusive growth.
Measuring social progress guides us in translating economic gains into advancing social and environmental performance in ways that will unleash even greater economic success. The Social Progress Index offers a concrete way to understand and then prioritize an actionable agenda advancing both social and economic performance.
14 Social Progress Index 2015 | © Social Progress Imperative 2015Social Progress Index 2015 | © Social Progress Imperative 2015
EXECUTIVE SUMMARY
THE SOCIAL PROGRESS INDEX METHODOLOGY
The Social Progress Index incorporates four key design principles:
1. Exclusively social and environmental indicators: our aim is to measure social progress directly, rather than utilize economic proxies. By excluding economic indicators, we can, for the first time, rigorously and systematically analyze the relationship between economic development (measured for example by GDP per capita) and social development. Prior efforts to move “beyond GDP” have comingled social and economic indicators, making it difficult to disentangle cause and effect.
2. Outcomes, not inputs: our aim is to measure the outcomes that matter to the lives of real people, not the inputs. For example, we want to measure a country’s health and wellness achieved, not how much effort is expended nor how much the country spends on healthcare.
3. Holistic and relevant to all countries: our aim is to create a holistic measure of social progress that encompasses the many aspects of health of societies. Most previous efforts have focused on the poorest countries, for understandable reasons. But knowing what constitutes a healthy society for any country, including higher-income countries, is indispensable in charting a course for less-prosperous societies to get there.
4. Actionable: the Index aims to be a practical tool that will help leaders and practitioners in government, business and civil society to implement policies and programs that will faster drive social progress. To achieve that goal, we measure outcomes in a granular way that focuses on specific areas that can be implemented directly. The Index is structured around 12 components and 52 distinct indicators. The framework allows us to not only provide an aggregate country score and ranking, but also to allow granular analyses of specific areas of strength and weakness. Transparency of measurement using a comprehensive framework allows changemakers to identify and act upon the most pressing issues in their societies.
We define social progress in a comprehensive and inclusive way. Social progress is the capacity of a society to meet the basic human needs of its citizens, establish the building blocks that allow citizens and communities to enhance and sustain the quality of their lives, and create the conditions for all individuals to reach their full potential.
15Social Progress Index 2015 | © Social Progress Imperative 2015Social Progress Index 2015 | © Social Progress Imperative 2015
EXECUTIVE SUMMARY
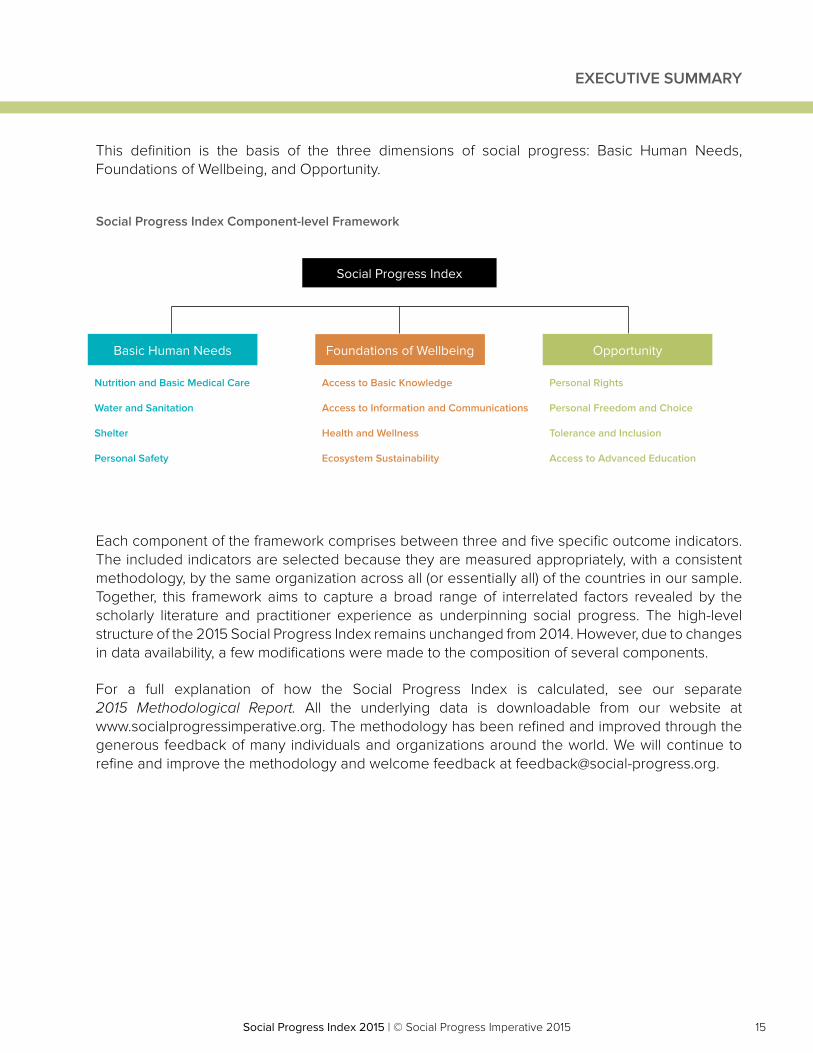
This definition is the basis of the three dimensions of social progress: Basic Human Needs, Foundations of Wellbeing, and Opportunity.
Each component of the framework comprises between three and five specific outcome indicators. The included indicators are selected because they are measured appropriately, with a consistent methodology, by the same organization across all (or essentially all) of the countries in our sample. Together, this framework aims to capture a broad range of interrelated factors revealed by the scholarly literature and practitioner experience as underpinning social progress. The high-level structure of the 2015 Social Progress Index remains unchanged from 2014. However, due to changes in data availability, a few modifications were made to the composition of several components.
For a full explanation of how the Social Progress Index is calculated, see our separate 2015 Methodological Report. All the underlying data is downloadable from our website at www.socialprogressimperative.org. The methodology has been refined and improved through the generous feedback of many individuals and organizations around the world. We will continue to refine and improve the methodology and welcome feedback at [email protected].
Basic Human Needs
Nutrition and Basic Medical Care
Water and Sanitation
Shelter
Personal Safety
Access to Basic Knowledge
Access to Information and Communications
Health and Wellness
Ecosystem Sustainability
Personal Rights
Personal Freedom and Choice
Tolerance and Inclusion
Access to Advanced Education
Foundations of Wellbeing
Social Progress Index
Opportunity
Social Progress Index Component-level Framework
16 Social Progress Index 2015 | © Social Progress Imperative 2015Social Progress Index 2015 | © Social Progress Imperative 2015
EXECUTIVE SUMMARY
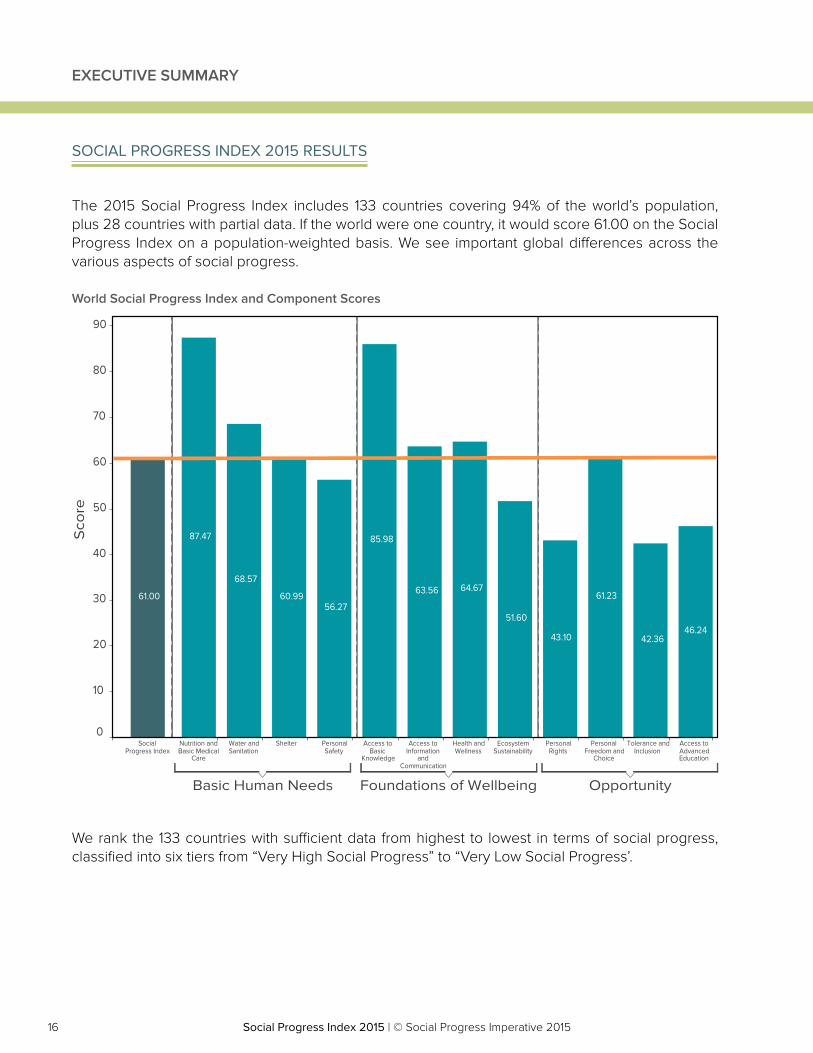
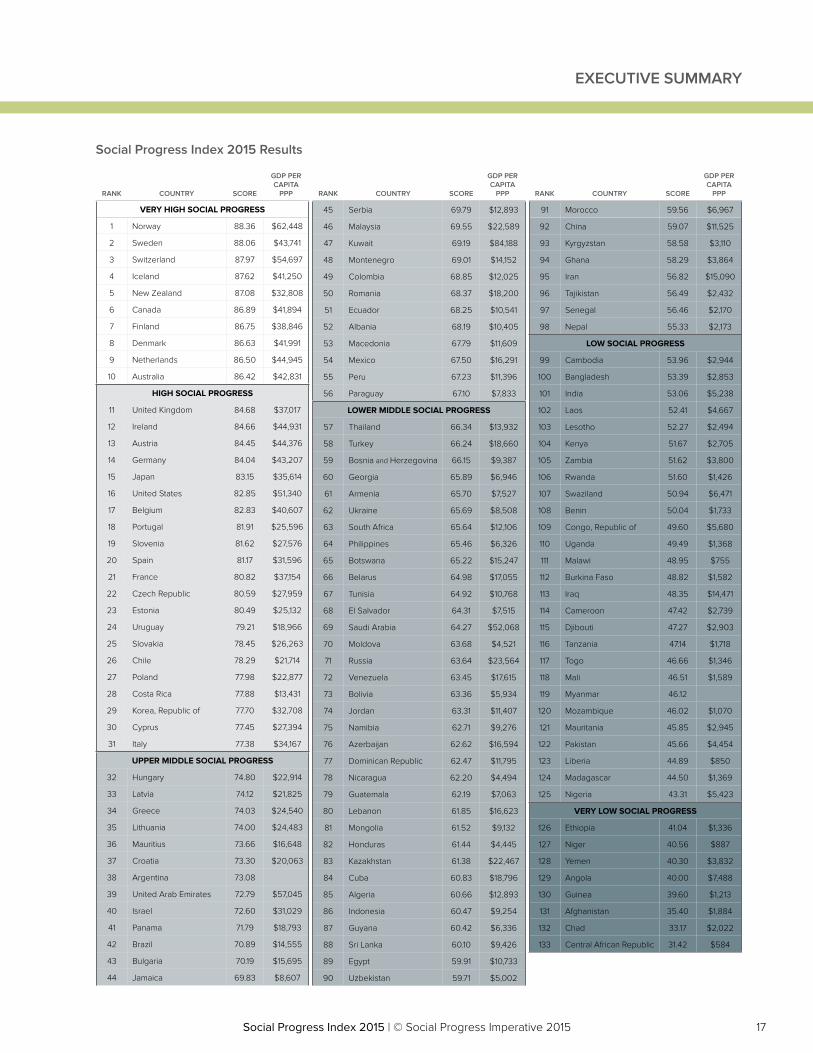
SOCIAL PROGRESS INDEX 2015 RESULTS
The 2015 Social Progress Index includes 133 countries covering 94% of the world’s population, plus 28 countries with partial data. If the world were one country, it would score 61.00 on the Social Progress Index on a population-weighted basis. We see important global differences across the various aspects of social progress.
We rank the 133 countries with sufficient data from highest to lowest in terms of social progress, classified into six tiers from “Very High Social Progress” to “Very Low Social Progress’.
World Social Progress Index and Component Scores
Nutrition andBasic Medical
Care
Water andSanitation
Shelter PersonalSafety
Access toBasic
Knowledge
Access toInformation
andCommunication
Health andWellness
EcosystemSustainability
PersonalRights
PersonalFreedom and
Choice
Tolerance andInclusion
Access toAdvancedEducation
0
10
20
30
40
50
60
70
80
90
Sco
re
85.98
60.99
87.47
68.57
56.2761.23
64.67
42.36
63.56
51.60
43.10
SocialProgress Index
61.00
46.24
Basic Human Needs Foundations of Wellbeing Opportunity
17Social Progress Index 2015 | © Social Progress Imperative 2015Social Progress Index 2015 | © Social Progress Imperative 2015
EXECUTIVE SUMMARY
Social Progress Index 2015 Results
Social Progress Index 2015 results
RANK COUNTRY SCORE
GDP PER CAPITA
PPP
VERY HIGH SOCIAL PROGRESS
1 Norway 88.36 $62,448
2 Sweden 88.06 $43,741
3 Switzerland 87.97 $54,697
4 Iceland 87.62 $41,250
5 New Zealand 87.08 $32,808
6 Canada 86.89 $41,894
7 Finland 86.75 $38,846
8 Denmark 86.63 $41,991
9 Netherlands 86.50 $44,945
10 Australia 86.42 $42,831
HIGH SOCIAL PROGRESS
11 United Kingdom 84.68 $37,017
12 Ireland 84.66 $44,931
13 Austria 84.45 $44,376
14 Germany 84.04 $43,207
15 Japan 83.15 $35,614
16 United States 82.85 $51,340
17 Belgium 82.83 $40,607
18 Portugal 81.91 $25,596
19 Slovenia 81.62 $27,576
20 Spain 81.17 $31,596
21 France 80.82 $37,154
22 Czech Republic 80.59 $27,959
23 Estonia 80.49 $25,132
24 Uruguay 79.21 $18,966
25 Slovakia 78.45 $26,263
26 Chile 78.29 $21,714
27 Poland 77.98 $22,877
28 Costa Rica 77.88 $13,431
29 Korea, Republic of 77.70 $32,708
30 Cyprus 77.45 $27,394
31 Italy 77.38 $34,167
UPPER MIDDLE SOCIAL PROGRESS
32 Hungary 74.80 $22,914
33 Latvia 74.12 $21,825
34 Greece 74.03 $24,540
35 Lithuania 74.00 $24,483
36 Mauritius 73.66 $16,648
37 Croatia 73.30 $20,063
38 Argentina 73.08
39 United Arab Emirates 72.79 $57,045
40 Israel 72.60 $31,029
41 Panama 71.79 $18,793
42 Brazil 70.89 $14,555
43 Bulgaria 70.19 $15,695
44 Jamaica 69.83 $8,607
RANK COUNTRY SCORE
GDP PER CAPITA
PPP
45 Serbia 69.79 $12,893
46 Malaysia 69.55 $22,589
47 Kuwait 69.19 $84,188
48 Montenegro 69.01 $14,152
49 Colombia 68.85 $12,025
50 Romania 68.37 $18,200
51 Ecuador 68.25 $10,541
52 Albania 68.19 $10,405
53 Macedonia 67.79 $11,609
54 Mexico 67.50 $16,291
55 Peru 67.23 $11,396
56 Paraguay 67.10 $7,833
LOWER MIDDLE SOCIAL PROGRESS
57 Thailand 66.34 $13,932
58 Turkey 66.24 $18,660
59 Bosnia and Herzegovina 66.15 $9,387
60 Georgia 65.89 $6,946
61 Armenia 65.70 $7,527
62 Ukraine 65.69 $8,508
63 South Africa 65.64 $12,106
64 Philippines 65.46 $6,326
65 Botswana 65.22 $15,247
66 Belarus 64.98 $17,055
67 Tunisia 64.92 $10,768
68 El Salvador 64.31 $7,515
69 Saudi Arabia 64.27 $52,068
70 Moldova 63.68 $4,521
71 Russia 63.64 $23,564
72 Venezuela 63.45 $17,615
73 Bolivia 63.36 $5,934
74 Jordan 63.31 $11,407
75 Namibia 62.71 $9,276
76 Azerbaijan 62.62 $16,594
77 Dominican Republic 62.47 $11,795
78 Nicaragua 62.20 $4,494
79 Guatemala 62.19 $7,063
80 Lebanon 61.85 $16,623
81 Mongolia 61.52 $9,132
82 Honduras 61.44 $4,445
83 Kazakhstan 61.38 $22,467
84 Cuba 60.83 $18,796
85 Algeria 60.66 $12,893
86 Indonesia 60.47 $9,254
87 Guyana 60.42 $6,336
88 Sri Lanka 60.10 $9,426
89 Egypt 59.91 $10,733
90 Uzbekistan 59.71 $5,002
RANK COUNTRY SCORE
GDP PER CAPITA
PPP
91 Morocco 59.56 $6,967
92 China 59.07 $11,525
93 Kyrgyzstan 58.58 $3,110
94 Ghana 58.29 $3,864
95 Iran 56.82 $15,090
96 Tajikistan 56.49 $2,432
97 Senegal 56.46 $2,170
98 Nepal 55.33 $2,173
LOW SOCIAL PROGRESS
99 Cambodia 53.96 $2,944
100 Bangladesh 53.39 $2,853
101 India 53.06 $5,238
102 Laos 52.41 $4,667
103 Lesotho 52.27 $2,494
104 Kenya 51.67 $2,705
105 Zambia 51.62 $3,800
106 Rwanda 51.60 $1,426
107 Swaziland 50.94 $6,471
108 Benin 50.04 $1,733
109 Congo, Republic of 49.60 $5,680
110 Uganda 49.49 $1,368
111 Malawi 48.95 $755
112 Burkina Faso 48.82 $1,582
113 Iraq 48.35 $14,471
114 Cameroon 47.42 $2,739
115 Djibouti 47.27 $2,903
116 Tanzania 47.14 $1,718
117 Togo 46.66 $1,346
118 Mali 46.51 $1,589
119 Myanmar 46.12
120 Mozambique 46.02 $1,070
121 Mauritania 45.85 $2,945
122 Pakistan 45.66 $4,454
123 Liberia 44.89 $850
124 Madagascar 44.50 $1,369
125 Nigeria 43.31 $5,423
VERY LOW SOCIAL PROGRESS
126 Ethiopia 41.04 $1,336
127 Niger 40.56 $887
128 Yemen 40.30 $3,832
129 Angola 40.00 $7,488
130 Guinea 39.60 $1,213
131 Afghanistan 35.40 $1,884
132 Chad 33.17 $2,022
133 Central African Republic 31.42 $584
18 Social Progress Index 2015 | © Social Progress Imperative 2015Social Progress Index 2015 | © Social Progress Imperative 2015
EXECUTIVE SUMMARY
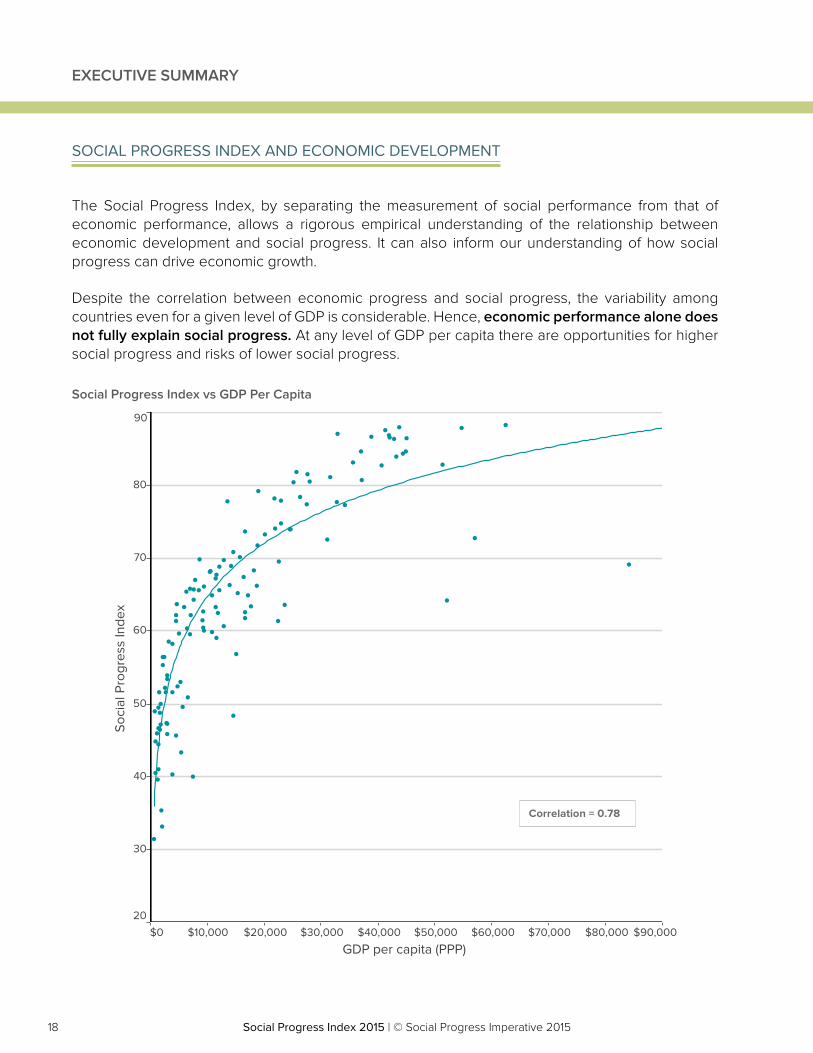
SOCIAL PROGRESS INDEX AND ECONOMIC DEVELOPMENT
The Social Progress Index, by separating the measurement of social performance from that of economic performance, allows a rigorous empirical understanding of the relationship between economic development and social progress. It can also inform our understanding of how social progress can drive economic growth.
Despite the correlation between economic progress and social progress, the variability among countries even for a given level of GDP is considerable. Hence, economic performance alone does not fully explain social progress. At any level of GDP per capita there are opportunities for higher social progress and risks of lower social progress.
Social Progress Index vs GDP Per Capita
$0 $10,000 $20,000 $30,000 $40,000 $50,000 $60,000 $70,000 $80,000 $90,000
GDP per capita (PPP)
20
30
40
50
60
70
80
90
Soci
al P
rogr
ess
Inde
x
Correlation = 0.78
19Social Progress Index 2015 | © Social Progress Imperative 2015Social Progress Index 2015 | © Social Progress Imperative 2015
EXECUTIVE SUMMARY
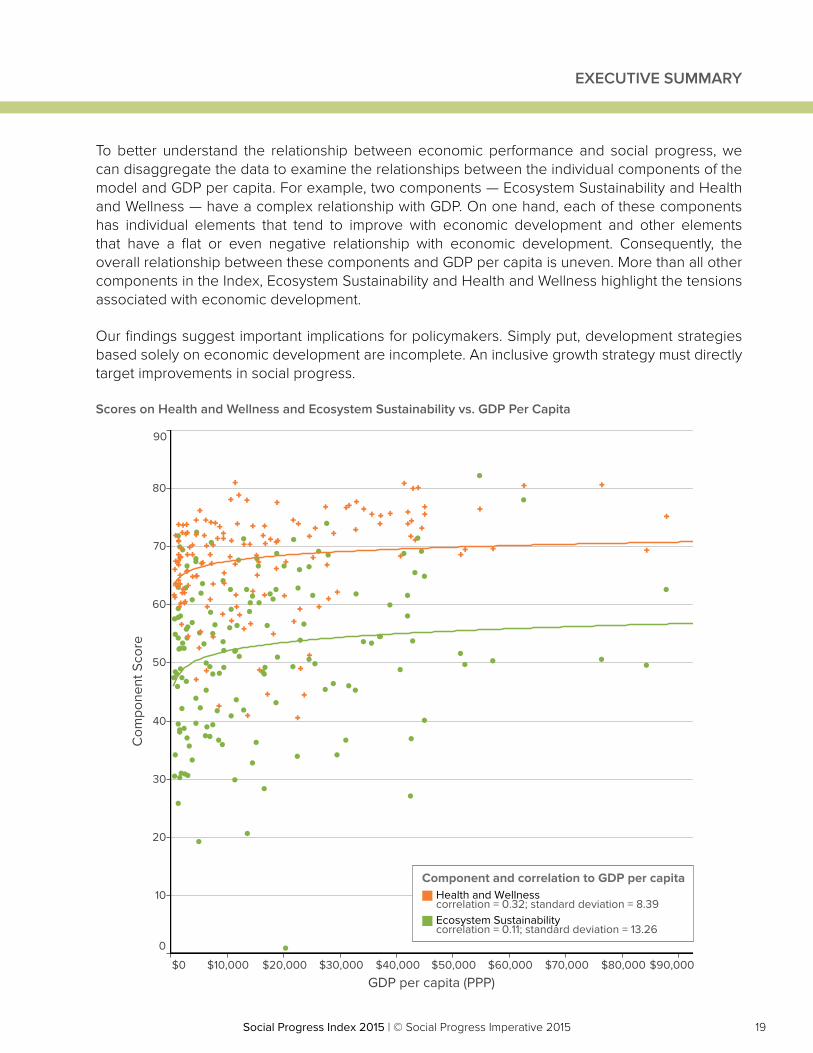
To better understand the relationship between economic performance and social progress, we can disaggregate the data to examine the relationships between the individual components of the model and GDP per capita. For example, two components — Ecosystem Sustainability and Health and Wellness — have a complex relationship with GDP. On one hand, each of these components has individual elements that tend to improve with economic development and other elements that have a flat or even negative relationship with economic development. Consequently, the overall relationship between these components and GDP per capita is uneven. More than all other components in the Index, Ecosystem Sustainability and Health and Wellness highlight the tensions associated with economic development.
Our findings suggest important implications for policymakers. Simply put, development strategies based solely on economic development are incomplete. An inclusive growth strategy must directly target improvements in social progress.
Scores on Health and Wellness and Ecosystem Sustainability vs. GDP Per Capita
$0 $10,000 $20,000 $30,000 $40,000 $50,000 $60,000 $70,000 $80,000 $90,000
GDP per capita (PPP)
0
10
20
30
40
50
60
70
80
90
Com
pone
nt S
core
Component and correlation to GDP per capitaHealth and Wellnesscorrelation = 0.32; standard deviation = 8.39Ecosystem Sustainabilitycorrelation = 0.11; standard deviation = 13.26
20 Social Progress Index 2015 | © Social Progress Imperative 2015Social Progress Index 2015 | © Social Progress Imperative 2015
EXECUTIVE SUMMARY
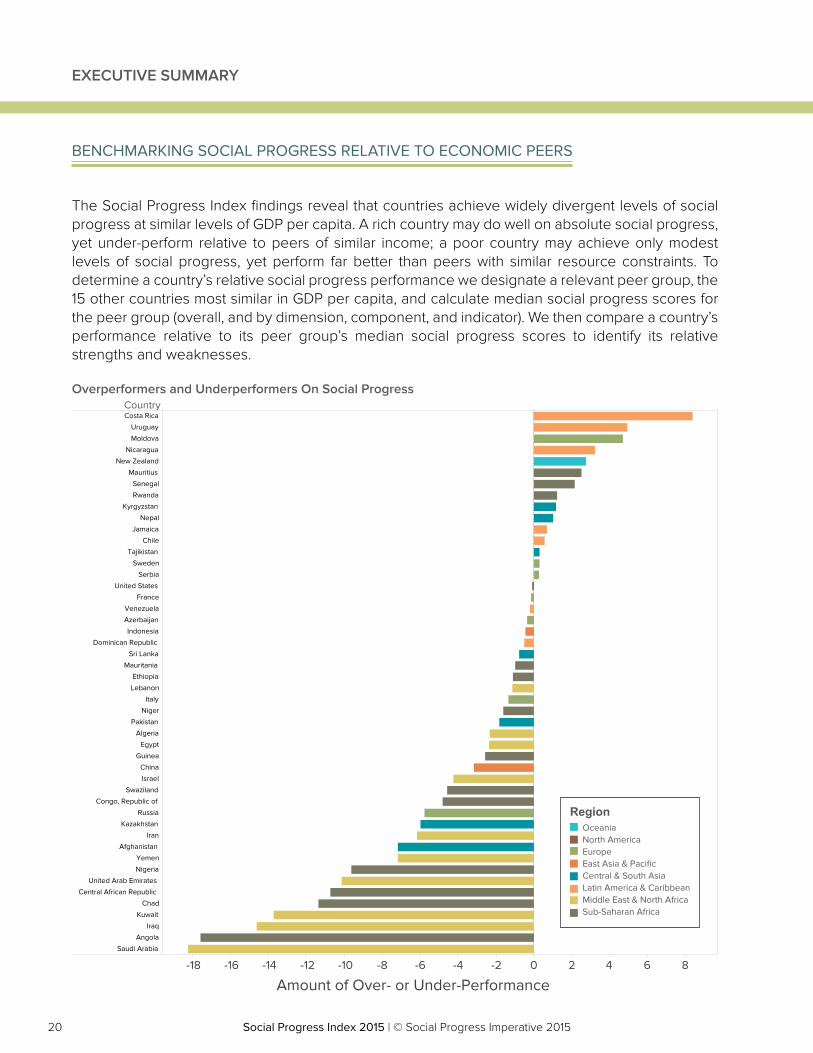
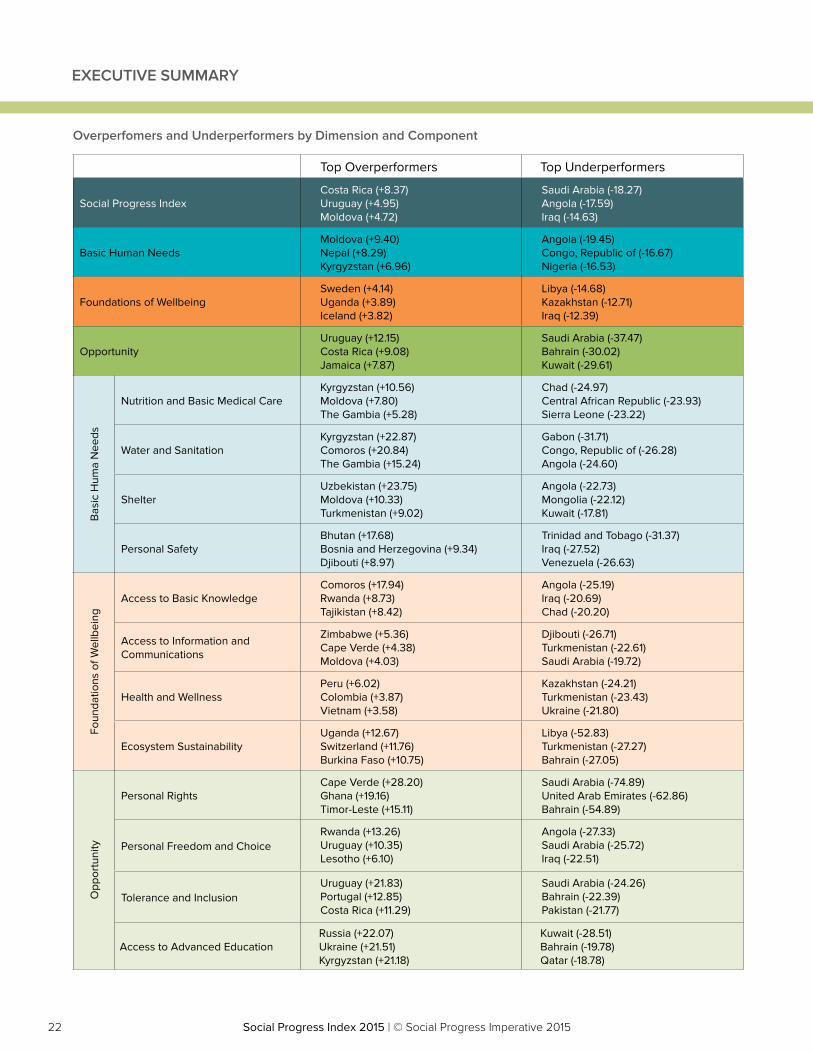
BENCHMARKING SOCIAL PROGRESS RELATIVE TO ECONOMIC PEERS
The Social Progress Index findings reveal that countries achieve widely divergent levels of social progress at similar levels of GDP per capita. A rich country may do well on absolute social progress, yet under-perform relative to peers of similar income; a poor country may achieve only modest levels of social progress, yet perform far better than peers with similar resource constraints. To determine a country’s relative social progress performance we designate a relevant peer group, the 15 other countries most similar in GDP per capita, and calculate median social progress scores for the peer group (overall, and by dimension, component, and indicator). We then compare a country’s performance relative to its peer group’s median social progress scores to identify its relative strengths and weaknesses.
Overperformers and Underperformers On Social ProgressCountry
-18 -16 -14 -12 -10 -8 -6 -4 -2 0 2 4 6 8
Amount of Over- or Under-Performance
yCosta Rica
Uruguay
Moldova
Nicaragua
New Zealand
Mauritius
Senegal
Rwanda
Kyrgyzstan
Nepal
Jamaica
Chile
Tajikistan
Sweden
Serbia
United States
France
Venezuela
Azerbaijan
Indonesia
Dominican Republic
Sri Lanka
Mauritania
Ethiopia
Lebanon
Italy
Niger
Pakistan
Algeria
Egypt
Guinea
China
Israel
Swaziland
Congo, Republic of
Russia
Kazakhstan
Iran
Afghanistan
Yemen
Nigeria
United Arab Emirates
Central African Republic
Chad
Kuwait
Iraq
Angola
Saudi Arabia
RegionOceaniaNorth AmericaEuropeEast Asia & PacificCentral & South AsiaLatin America & CaribbeanMiddle East & North AfricaSub-Saharan Africa
21Social Progress Index 2015 | © Social Progress Imperative 2015Social Progress Index 2015 | © Social Progress Imperative 2015
EXECUTIVE SUMMARY
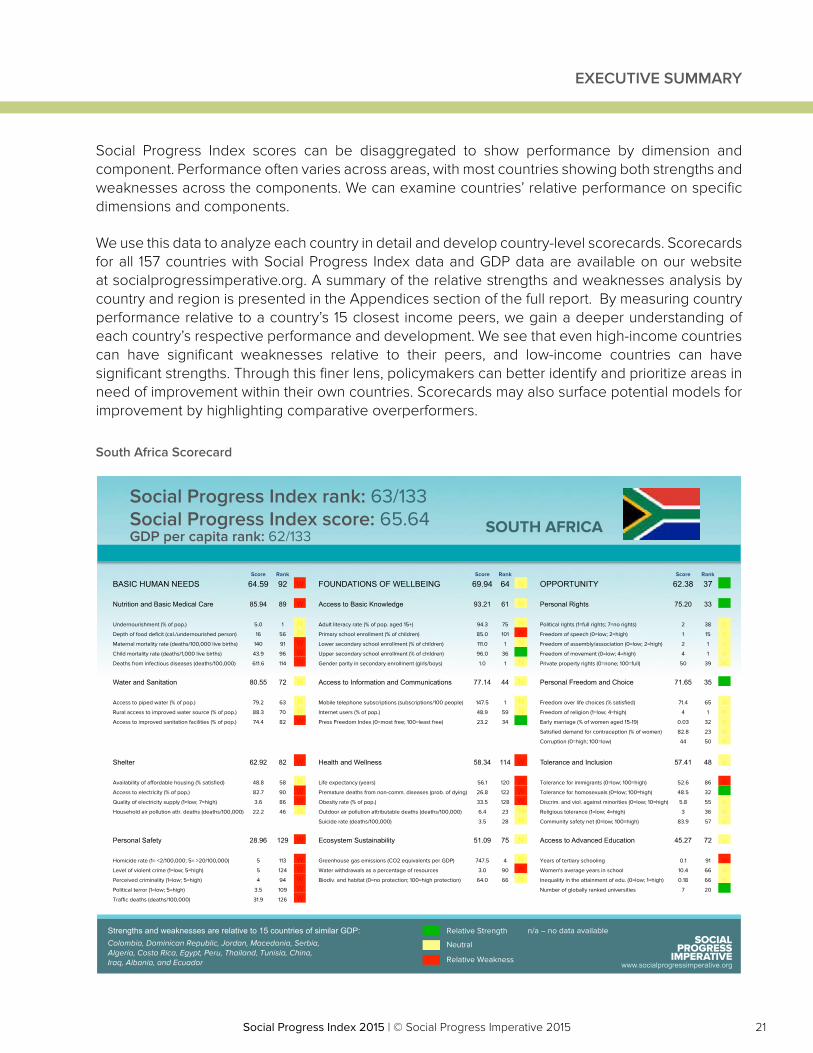
South Africa Scorecard
www.socialprogressimperative.org
Strengths and weaknesses are relative to 15 countries of similar GDP: Relative Strength n/a – no data available
Neutral
Relative Weakness
SOUTH AFRICA
Score Rank Score Rank Score Rank
BASIC HUMAN NEEDS 64.59 92 W FOUNDATIONS OF WELLBEING 69.94 64 N OPPORTUNITY 62.38 37 S
Nutrition and Basic Medical Care 85.94 89 W Access to Basic Knowledge 93.21 61 N Personal Rights 75.20 33 S
Undernourishment (% of pop.) 5.0 1 N Adult literacy rate (% of pop. aged 15+) 94.3 75 N Political rights (1=full rights; 7=no rights) 2 38 N
Depth of food deficit (cal./undernourished person) 16 56 N Primary school enrollment (% of children) 85.0 101 W Freedom of speech (0=low; 2=high) 1 15 N
Maternal mortality rate (deaths/100,000 live births) 140 91 W Lower secondary school enrollment (% of children) 111.0 1 N Freedom of assembly/association (0=low; 2=high) 2 1 N
Child mortality rate (deaths/1,000 live births) 43.9 96 W Upper secondary school enrollment (% of children) 96.0 36 S Freedom of movement (0=low; 4=high) 4 1 N
Deaths from infectious diseases (deaths/100,000) 611.6 114 W Gender parity in secondary enrollment (girls/boys) 1.0 1 N Private property rights (0=none; 100=full) 50 39 N
Water and Sanitation 80.55 72 N Access to Information and Communications 77.14 44 N Personal Freedom and Choice 71.65 35 S
Access to piped water (% of pop.) 79.2 63 N Mobile telephone subscriptions (subscriptions/100 people) 147.5 1 N Freedom over life choices (% satisfied) 71.4 65 N
Rural access to improved water source (% of pop.) 88.3 70 N Internet users (% of pop.) 48.9 59 N Freedom of religion (1=low; 4=high) 4 1 N
Access to improved sanitation facilities (% of pop.) 74.4 82 W Press Freedom Index (0=most free; 100=least free) 23.2 34 S Early marriage (% of women aged 15-19) 0.03 32 N
Satisfied demand for contraception (% of women) 82.8 23 N
Corruption (0=high; 100=low) 44 50 N
Shelter 62.92 82 W Health and Wellness 58.34 114 W Tolerance and Inclusion 57.41 48 N
Availability of affordable housing (% satisfied) 48.8 58 N Life expectancy (years) 56.1 120 W Tolerance for immigrants (0=low; 100=high) 52.6 86 W
Access to electricity (% of pop.) 82.7 90 W Premature deaths from non-comm. diseases (prob. of dying) 26.8 122 W Tolerance for homosexuals (0=low; 100=high) 48.5 32 S
Quality of electricity supply (1=low; 7=high) 3.6 86 W Obesity rate (% of pop.) 33.5 128 W Discrim. and viol. against minorities (0=low; 10=high) 5.8 55 N
Household air pollution attr. deaths (deaths/100,000) 22.2 46 N Outdoor air pollution attributable deaths (deaths/100,000) 6.4 23 N Religious tolerance (1=low; 4=high) 3 36 N
Suicide rate (deaths/100,000) 3.5 28 N Community safety net (0=low; 100=high) 83.9 57 N
Personal Safety 28.96 129 W Ecosystem Sustainability 51.09 75 N Access to Advanced Education 45.27 72 N
Homicide rate (1= <2/100,000; 5= >20/100,000) 5 113 W Greenhouse gas emissions (CO2 equivalents per GDP) 747.5 4 N Years of tertiary schooling 0.1 91 W
Level of violent crime (1=low; 5=high) 5 124 W Water withdrawals as a percentage of resources 3.0 90 W Women's average years in school 10.4 66 N
Perceived criminality (1=low; 5=high) 4 94 W Biodiv. and habitat (0=no protection; 100=high protection) 64.0 66 N Inequality in the attainment of edu. (0=low; 1=high) 0.18 66 N
Political terror (1=low; 5=high) 3.5 109 W Number of globally ranked universities 7 20 S
Traffic deaths (deaths/100,000) 31.9 126 W
Colombia, Dominican Republic, Jordan, Macedonia, Serbia, Algeria, Costa Rica, Egypt, Peru, Thailand, Tunisia, China, Iraq, Albania, and Ecuador
GDP per capita rank: 62/133
Social Progress Index rank: 63/133 Social Progress Index score: 65.64
Social Progress Index scores can be disaggregated to show performance by dimension and component. Performance often varies across areas, with most countries showing both strengths and weaknesses across the components. We can examine countries’ relative performance on specific dimensions and components.
We use this data to analyze each country in detail and develop country-level scorecards. Scorecards for all 157 countries with Social Progress Index data and GDP data are available on our website at socialprogressimperative.org. A summary of the relative strengths and weaknesses analysis by country and region is presented in the Appendices section of the full report. By measuring country performance relative to a country’s 15 closest income peers, we gain a deeper understanding of each country’s respective performance and development. We see that even high-income countries can have significant weaknesses relative to their peers, and low-income countries can have significant strengths. Through this finer lens, policymakers can better identify and prioritize areas in need of improvement within their own countries. Scorecards may also surface potential models for improvement by highlighting comparative overperformers.
22 Social Progress Index 2015 | © Social Progress Imperative 2015Social Progress Index 2015 | © Social Progress Imperative 2015
Top Overperformers Top Underperformers
Social Progress IndexCosta Rica (+8.37)Uruguay (+4.95)Moldova (+4.72)
Saudi Arabia (-18.27)Angola (-17.59)Iraq (-14.63)
Basic Human NeedsMoldova (+9.40)Nepal (+8.29)Kyrgyzstan (+6.96)
Angola (-19.45)Congo, Republic of (-16.67)Nigeria (-16.53)
Foundations of WellbeingSweden (+4.14)Uganda (+3.89)Iceland (+3.82)
Libya (-14.68)Kazakhstan (-12.71)Iraq (-12.39)
OpportunityUruguay (+12.15)Costa Rica (+9.08)Jamaica (+7.87)
Saudi Arabia (-37.47)Bahrain (-30.02)Kuwait (-29.61)
Bas
ic H
uma
Nee
ds
Nutrition and Basic Medical CareKyrgyzstan (+10.56)Moldova (+7.80)The Gambia (+5.28)
Chad (-24.97)Central African Republic (-23.93)Sierra Leone (-23.22)
Water and SanitationKyrgyzstan (+22.87)Comoros (+20.84)The Gambia (+15.24)
Gabon (-31.71)Congo, Republic of (-26.28)Angola (-24.60)
ShelterUzbekistan (+23.75)Moldova (+10.33)Turkmenistan (+9.02)
Angola (-22.73)Mongolia (-22.12)Kuwait (-17.81)
Personal SafetyBhutan (+17.68)Bosnia and Herzegovina (+9.34)Djibouti (+8.97)
Trinidad and Tobago (-31.37)Iraq (-27.52)Venezuela (-26.63)
Foun
datio
ns o
f Wel
lbei
ng
Access to Basic KnowledgeComoros (+17.94)Rwanda (+8.73)Tajikistan (+8.42)
Angola (-25.19)Iraq (-20.69)Chad (-20.20)
Access to Information and Communications
Zimbabwe (+5.36)Cape Verde (+4.38)Moldova (+4.03)
Djibouti (-26.71)Turkmenistan (-22.61)Saudi Arabia (-19.72)
Health and WellnessPeru (+6.02)Colombia (+3.87)Vietnam (+3.58)
Kazakhstan (-24.21)Turkmenistan (-23.43)Ukraine (-21.80)
Ecosystem SustainabilityUganda (+12.67)Switzerland (+11.76)Burkina Faso (+10.75)
Libya (-52.83)Turkmenistan (-27.27)Bahrain (-27.05)
Opp
ortu
nity
Personal RightsCape Verde (+28.20)Ghana (+19.16)Timor-Leste (+15.11)
Saudi Arabia (-74.89)United Arab Emirates (-62.86)Bahrain (-54.89)
Personal Freedom and ChoiceRwanda (+13.26)Uruguay (+10.35)Lesotho (+6.10)
Angola (-27.33)Saudi Arabia (-25.72)Iraq (-22.51)
Tolerance and InclusionUruguay (+21.83)Portugal (+12.85)Costa Rica (+11.29)
Saudi Arabia (-24.26)Bahrain (-22.39)Pakistan (-21.77)
Access to Advanced EducationRussia (+22.07)Ukraine (+21.51)Kyrgyzstan (+21.18)
Kuwait (-28.51)Bahrain (-19.78)Qatar (-18.78)
Overperfomers and Underperformers by Dimension and Component
EXECUTIVE SUMMARY

23Social Progress Index 2015 | © Social Progress Imperative 2015Social Progress Index 2015 | © Social Progress Imperative 2015
APPLICATIONS OF THE SOCIAL PROGRESS INDEX
The Social Progress Index offers a new lens to evaluate a number of pressing policy concerns and the initiatives designed to address them. As concerns around inequality and calls for ‘inclusive growth’ have grown stronger in the wake of stagnating middle-class incomes in high-income countries and growth in developing countries driven by extractive industries, we see increasing commitment to ‘shared prosperity’ based on intuitive objectives as opposed to empirical data. By providing a rigorous and holistic measure of inclusiveness that is independent of GDP and other economic measures, the Social Progress Index provides a powerful tool for leaders in government, business, and civil society to benchmark performance, identify priorities for action, and to track the impact of interventions.
In this report we examine three critical issues:
• Inequality and Poverty: With increased attention to issues of income inequality, we explore how the Social Progress Index relates to the overall distribution of income, as well as the incidence of poverty on an absolute and relative basis. Social Progress offers a new lens with which to view this polarizing debate.
• International Aid: Decisions about which countries receive aid and how much rely heavily on measures of economic performance, particularly GDP per capita. We show how moving beyond exclusively economic measures offers new insight into how international aid might be structured.
• Life Satisfaction: There has been growing international interest in using measures of subjective wellbeing to guide government policy and engagement by civil society. We describe how the Social Progress Index relates to measures of subjective wellbeing and informs our understanding of how such measures can inform the public debate.
There are wide possibilities for using Social Progress Index data to inform scholarly and policy debates. We welcome others to use our data for the purpose of analysis.
EXECUTIVE SUMMARY
24 Social Progress Index 2015 | © Social Progress Imperative 2015Social Progress Index 2015 | © Social Progress Imperative 2015
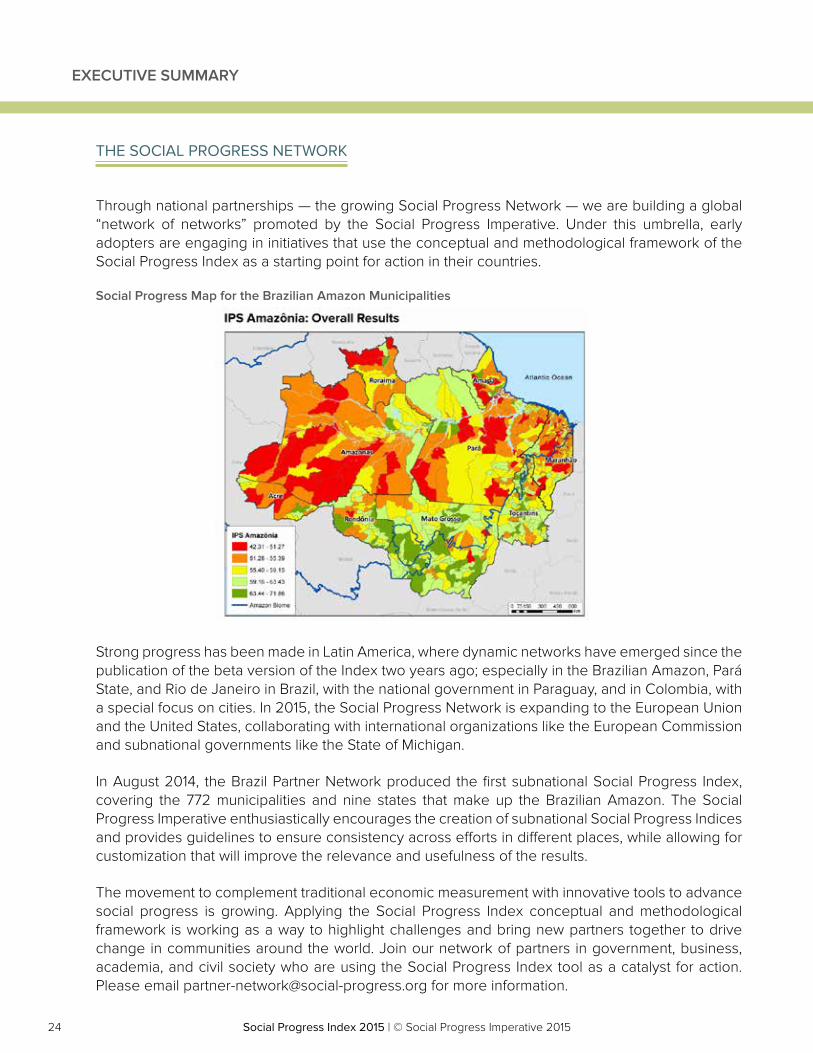
THE SOCIAL PROGRESS NETWORK
Through national partnerships — the growing Social Progress Network — we are building a global “network of networks” promoted by the Social Progress Imperative. Under this umbrella, early adopters are engaging in initiatives that use the conceptual and methodological framework of the Social Progress Index as a starting point for action in their countries.
Strong progress has been made in Latin America, where dynamic networks have emerged since the publication of the beta version of the Index two years ago; especially in the Brazilian Amazon, Pará State, and Rio de Janeiro in Brazil, with the national government in Paraguay, and in Colombia, with a special focus on cities. In 2015, the Social Progress Network is expanding to the European Union and the United States, collaborating with international organizations like the European Commission and subnational governments like the State of Michigan.
In August 2014, the Brazil Partner Network produced the first subnational Social Progress Index, covering the 772 municipalities and nine states that make up the Brazilian Amazon. The Social Progress Imperative enthusiastically encourages the creation of subnational Social Progress Indices and provides guidelines to ensure consistency across efforts in different places, while allowing for customization that will improve the relevance and usefulness of the results.
The movement to complement traditional economic measurement with innovative tools to advance social progress is growing. Applying the Social Progress Index conceptual and methodological framework is working as a way to highlight challenges and bring new partners together to drive change in communities around the world. Join our network of partners in government, business, academia, and civil society who are using the Social Progress Index tool as a catalyst for action. Please email [email protected] for more information.
Social Progress Map for the Brazilian Amazon Municipalities
EXECUTIVE SUMMARY
25Social Progress Index 2015 | © Social Progress Imperative 2015Social Progress Index 2015 | © Social Progress Imperative 2015
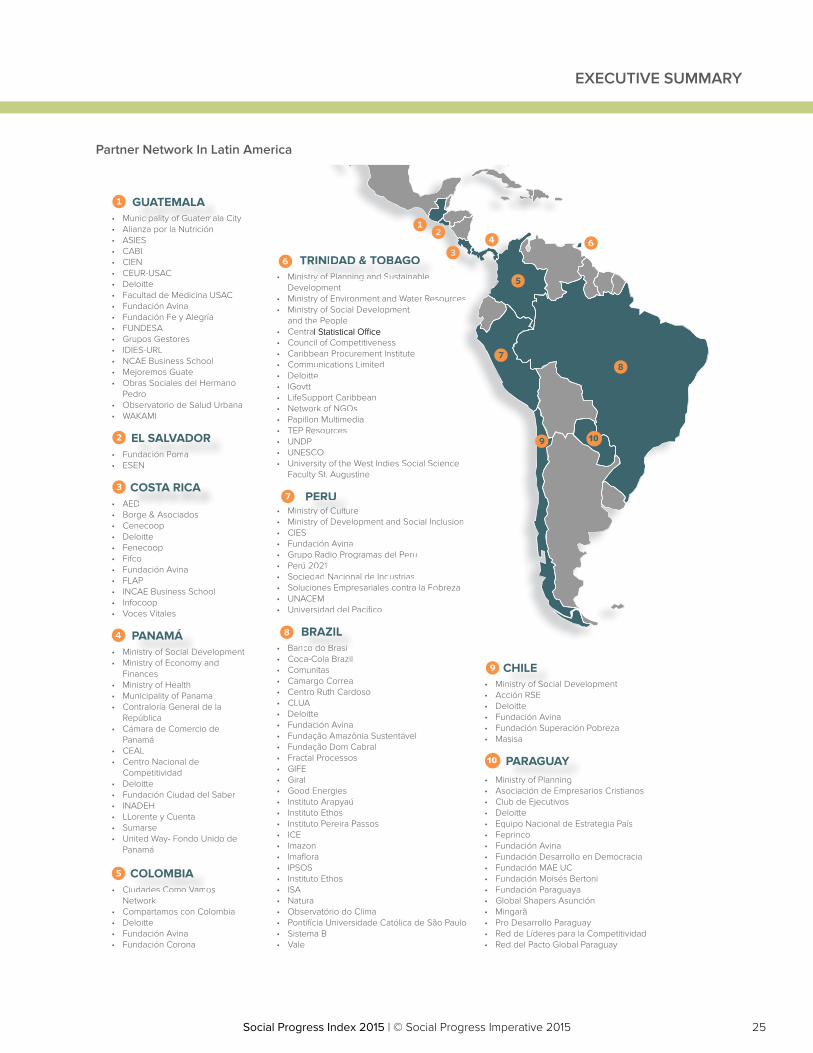
Partner Network In Latin America
• Municipality of Guatemala City• Alianza por la Nutrición• ASIES• CABI• CIEN• CEUR-USAC• Deloitte• Facultad de Medicina USAC• Fundación Avina• Fundación Fe y Alegría• FUNDESA• Grupos Gestores• IDIES-URL• NCAE Business School• Mejoremos Guate• Obras Sociales del Hermano
Pedro• Observatorio de Salud Urbana• WAKAMI
niicicipapalilityty ooff GuGuatatememaala
GUATEMALA1
• Fundación Poma• ESEN
nddacacióiónn PPomomaa
EL SALVADOR2
• AED• Borge & Asociados• Cenecoop• Deloitte• Fenecoop• Fifco• Fundación Avina• FLAP• INCAE Business School• Infocoop• Voces Vitales
EDD
COSTA RICA3
• Ministry of Social Development• Ministry of Economy and
Finances• Ministry of Health• Municipality of Panama• Contraloría General de la
República• Cámara de Comercio de
Panamá• CEAL• Centro Nacional de
Competitividad• Deloitte• Fundación Ciudad del Saber• INADEH• LLorente y Cuenta• Sumarse• United Way- Fondo Unido de
Panamá
niststryry ooff SoSocicialal DD
PANAMÁ4
• Ciudades Como Vamos Network
• Compartamos con Colombia• Deloitte• Fundación Avina• Fundación Corona
uddadadeses CComomoo VVamamo
COLOMBIA5
• Ministry of Culture• Ministry of Development and Social Inclusion• CIES• Fundación Avina• Grupo Radio Programas del Peru• Perú 2021• Sociedad Nacional de Industrias• Soluciones Empresariales contra la Pobreza• UNACEM • Universidad del Pacífico
tryryPERU7
• Ministry of Planning and Sustainable Development
• Ministry of Environment and Water Resources• Ministry of Social Development
and the People• • Council of Competitiveness• Caribbean Procurement Institute• Communications Limited• Deloitte• IGovtt• LifeSupport Caribbean• Network of NGOs• Papillon Multimedia• TEP Resources• UNDP• UNESCO• University of the West Indies Social Science
Faculty St. Augustine
isttryry
TRINIDAD & TOBAGO6
• Banco do Brasil• Coca-Cola Brazil• Comunitas• Camargo Correa• Centro Ruth Cardoso• CLUA• Deloitte• Fundación Avina• Fundação Amazônia Sustentável• Fundação Dom Cabral• Fractal Processos• GIFE• Giral• Good Energies• Instituto Arapyaú• Instituto Ethos• Instituto Pereira Passos• ICE• Imazon• Imaflora• IPSOS• Instituto Ethos• ISA• Natura• Observatório do Clima• Pontifícia Universidade Católica de São Paulo• Sistema B• Vale
coo dodo BBrarasisill
BRAZIL8
• Ministry of Planning• Asociación de Empresarios Cristianos• Club de Ejecutivos• Deloitte• Equipo Nacional de Estrategia País• Feprinco• Fundación Avina• Fundación Desarrollo en Democracia• Fundación MAE UC• Fundación Moisés Bertoni• Fundación Paraguaya• Global Shapers Asunción• Mingarã• Pro Desarrollo Paraguay• Red de Líderes para la Competitividad• Red del Pacto Global Paraguay
nistry off PlPlan ining
PARAGUAY10
• Ministry of Social Development• Acción RSE• Deloitte• Fundación Avina• Fundación Superación Pobreza• Masisa
niiststryry ooff SoSoc
CHILE9
rey of Development and Social Inclusion
ción AvinaRadio Programas del Peru021ad Nacional de Industrias
ones Empresariales contra la PobrezaEM sidad del Pacífico
yy ooff CuCultltuuERUERU
y gopmenty of Environment and Water Resourcesy of Social Development e People
il of Competitivenessean Procurement Instituteunications Limitede
pport Caribbeanrk of NGOsn Multimedia
esources
COsity of the West Indies Social Sciencey St. Augustine
yy ooff PlPlananniningng aandnd SSusustataininabablele
INIINIDDAD &AD & DDD TTOBOBAAGOGOAAA
RAZILRAZIL
5
12
34 6
78
9 10
EXECUTIVE SUMMARY
26 Social Progress Index 2015 | © Social Progress Imperative 2015Social Progress Index 2015 | © Social Progress Imperative 2015
BOARD OF DIRECTORS
Steve AlmondDeloitte Global
Álvaro Rodríguez ArreguiIGNIA Partners, LLC
Sally OsbergSkoll Foundation
Brizio Biondi-MorraChairFundación Avina, Avina AmericasChair Emeritus of INCAEBusiness School
Roberto Artavia LoríaVice chairVIVA TrustFundación Latinoamérica Posible
ADVISORY BOARD
Hernando de SotoInstitute for Liberty and Democracy
Judith RodinRockefeller Foundation
Scott SternMassachusetts Institute of Technology
Ngaire WoodsUniversity of Oxford
Matthew BishopThe Economist
Professor Michael E. Porter, ChairBishop William Lawrence University Professor, Harvard Business School
Michael greenExecutive DirectorSocial Progress Imperative
EXECUTIVE SUMMARY
27Social Progress Index 2015 | © Social Progress Imperative 2015Social Progress Index 2015 | © Social Progress Imperative 2015
CHAPTER 1WHY MEASURE SOCIAL PROGRESS?
28 Social Progress Index 2015 | © Social Progress Imperative 2015Social Progress Index 2015 | © Social Progress Imperative 2015
CHAPTER 1 / WHY MEASURE SOCIAL PROGRESS?
29Social Progress Index 2015 | © Social Progress Imperative 2015Social Progress Index 2015 | © Social Progress Imperative 2015
WHY MEASURE SOCIAL PROGRESS?
Economic growth has lifted hundreds of millions out of poverty and improved the lives of many more over the last half-century. Yet it is increasingly evident that a model of development based on economic progress alone is incomplete. Economic growth alone is not enough. A society that fails to address basic human needs, equip citizens to improve their quality of life, protect the environment, and provide opportunity for many of its citizens is not succeeding. We must widen our understanding of the success of societies beyond economic outcomes. Inclusive growth requires achieving both economic and social progress.
A broader and inclusive model of development requires a new framework of metrics with which policy-makers and citizens can evaluate national performance. We must move beyond simply measuring Gross Domestic Product (GDP) per capita, and make social and environmental measurement integral to measuring national performance. If we can track societal performance rigorously, this will enable better choices, better policies, and better investments by government and business. Measuring social progress will also guide us in translating economic gains into social progress, and advancing social performance in ways that will unleash even greater economic success.
The Social Progress Index aims to meet this pressing need by creating a robust and holistic measurement framework for national social and environmental performance that can be used by leaders in government, business, and civil society to benchmark success and accelerate progress. The Social Progress Index is the first comprehensive framework for measuring social progress that is independent of GDP, but complementary to it. Our vision is a world in which social progress sits alongside GDP as a core benchmark for national performance. The Index provides the systematic, empirical foundation to guide strategy for inclusive growth.
The Social Progress Index, by separating the measurement of social and environmental performance from economic performance, provides an empirical understanding of the relationship between economic development and social progress. It can also inform our understanding of how social progress can drive economic growth. Our data suggests that countries may face important choices in their development strategies. For example, a development path that yields lower economic growth in the short term may be preferable if it also brings greater social progress, particularly if that social progress agenda supports economic growth in the longer term. It also allows a deeper analysis at the dimension and component level with various aspects of economic development, such as inequality. Understanding these choices and dynamics is a priority for our ongoing research.
CHAPTER 1 / WHY MEASURE SOCIAL PROGRESS?
30 Social Progress Index 2015 | © Social Progress Imperative 2015Social Progress Index 2015 | © Social Progress Imperative 2015
The Social Progress Index reveals country performance on a wide range of dimensions of social and environmental performance, which are relevant for countries at all levels of economic development. It enables an assessment of not just absolute performance but of relative performance versus a country’s economic peers. The Social Progress Index allows us to assess a country’s success in turning economic progress into improved social outcomes. Tracking social and environmental performance rigorously allows improved public policies and investment choices by government and business. Measuring social progress guides us in translating economic gains into advancing social and environmental performance in ways that will unleash even greater economic success. The Social Progress Index offers a concrete way to understand and then prioritize an actionable agenda advancing both social and economic performance.
GDP has been a powerful benchmark to guide economic development for more than half a century. The Social Progress Index is not intended to replace GDP but to complement it, as a core national performance metric. Measuring social progress offers citizens and leaders a more complete picture of how their country is developing. It will help societies make better choices and create stronger communities – and better lives.
This chapter describes the analytical foundations and principles used to develop the Social Progress Index, how the Social Progress Index complements and advances other efforts to move “beyond GDP,” and introduces the rest of the report.
THE SOCIAL PROGRESS INDEX METHODOLOGY
The Social Progress Index, first released in 2014 building on a beta version previewed in 2013, measures a comprehensive array of components of social and environmental performance and aggregates them into an overall framework. The Index was developed based on extensive discussions with stakeholders around the world about what has been missed when policymakers focus on GDP to the exclusion of social performance. Our work was influenced by the seminal contributions of Amartya Sen on social development, as well as by the recent call for action in the report Mismeasuring Our Lives1 by the Commission on the Measurement of Economic Performance and Social Progress.
1 The Commission on the Measurement of Economic Performance and Social Progress was created by President Sarkozy of France in 2008 to identify the limits of GDP as an indicator of economic performance and social progress, including the problems with its measurement; to consider what additional information might be required for the production of more relevant indicators of social progress; to assess the feasibility of alternative measurement tools; and to discuss how to present the statistical information in an appropriate way. The Commission was chaired by Professor Joseph E. Stiglitz, Columbia University. Professor Amartya Sen, Harvard University, was Chair Adviser. Professor Jean-Paul Fitoussi, Institut d’Etudes Politiques de Paris, President of the Observatoire Français des Conjonctures Economiques (OFCE), was Coordinator of the Commission.
CHAPTER 1 / WHY MEASURE SOCIAL PROGRESS?
31Social Progress Index 2015 | © Social Progress Imperative 2015Social Progress Index 2015 | © Social Progress Imperative 2015
CHAPTER 1 / WHY MEASURE SOCIAL PROGRESS?
The Social Progress Index incorporates four key design principles:
1. Exclusively social and environmental indicators: our aim is to measure social progress directly, rather than utilize economic proxies. By excluding economic indicators, we can, for the first time, rigorously and systematically analyze the relationship between economic development (measured for example by GDP per capita) and social development. Prior efforts to move “beyond GDP” have comingled social and economic indicators, making it difficult to disentangle cause and effect.
2. Outcomes not inputs: our aim is to measure the outcomes that matter to the lives of real people, not the inputs. For example, we want to measure a country’s health and wellness achieved, not how much effort is expended nor how much the country spends on healthcare.
3. Holistic and relevant to all countries: our aim is to create a holistic measure of social progress that encompasses the many aspects of health of societies. Most previous efforts have focused on the poorest countries, for understandable reasons. But knowing what constitutes a healthy society for any country, including higher-income countries, is indispensable in charting a course for less-prosperous societies to get there.
4. Actionable: the Index aims to be a practical tool that will help leaders and practitioners in government, business and civil society to implement policies and programs that will drive faster social progress. To achieve that goal, we measure outcomes in a granular way that focuses on specific areas that can be implemented directly. The Index is structured around 12 components and 52 distinct indicators. The framework allows us to not only provide an aggregate country score and ranking, but also to allow granular analyses of specific areas of strength and weakness. Transparency of measurement using a comprehensive framework allows change-makers to identify and act upon the most pressing issues in their societies.
These design principles are the foundation for our conceptual framework. We define social progress in a comprehensive and inclusive way. Social progress is the capacity of a society to meet the basic human needs of its citizens, establish the building blocks that allow citizens and communities to enhance and sustain the quality of their lives, and create the conditions for all individuals to reach their full potential.
32 Social Progress Index 2015 | © Social Progress Imperative 2015Social Progress Index 2015 | © Social Progress Imperative 2015
CHAPTER 1 / WHY MEASURE SOCIAL PROGRESS?
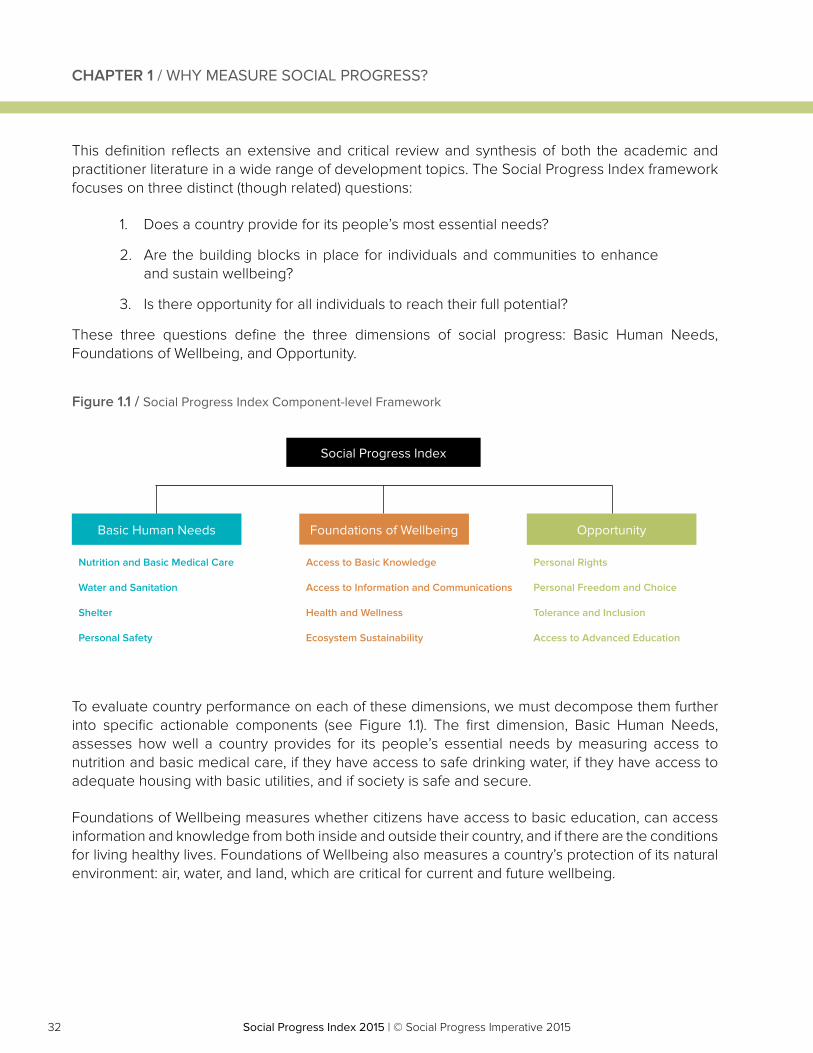
This definition reflects an extensive and critical review and synthesis of both the academic and practitioner literature in a wide range of development topics. The Social Progress Index framework focuses on three distinct (though related) questions:
1. Does a country provide for its people’s most essential needs?
2. Are the building blocks in place for individuals and communities to enhance and sustain wellbeing?
3. Is there opportunity for all individuals to reach their full potential?
These three questions define the three dimensions of social progress: Basic Human Needs, Foundations of Wellbeing, and Opportunity.
To evaluate country performance on each of these dimensions, we must decompose them further into specific actionable components (see Figure 1.1). The first dimension, Basic Human Needs, assesses how well a country provides for its people’s essential needs by measuring access to nutrition and basic medical care, if they have access to safe drinking water, if they have access to adequate housing with basic utilities, and if society is safe and secure.
Foundations of Wellbeing measures whether citizens have access to basic education, can access information and knowledge from both inside and outside their country, and if there are the conditions for living healthy lives. Foundations of Wellbeing also measures a country’s protection of its natural environment: air, water, and land, which are critical for current and future wellbeing.
Basic Human Needs
Nutrition and Basic Medical Care
Water and Sanitation
Shelter
Personal Safety
Access to Basic Knowledge
Access to Information and Communications
Health and Wellness
Ecosystem Sustainability
Personal Rights
Personal Freedom and Choice
Tolerance and Inclusion
Access to Advanced Education
Foundations of Wellbeing
Social Progress Index
Opportunity
Figure 1.1 / Social Progress Index Component-level Framework
33Social Progress Index 2015 | © Social Progress Imperative 2015Social Progress Index 2015 | © Social Progress Imperative 2015
CHAPTER 1 / WHY MEASURE SOCIAL PROGRESS?
The final dimension, Opportunity, measures the degree to which a country’s citizens have personal rights and freedoms and are able to make their own personal decisions as well as whether prejudices or hostilities within a society prohibit individuals from reaching their potential. Opportunity also includes the degree to which advanced forms of education are accessible to those in a country who wish to further their knowledge and skills, creating the potential for wide-ranging personal opportunity.
One of the distinguishing features of the Social Progress Index framework is that it encompasses Opportunity, an aspect of human wellbeing that is often overlooked or separated in thinking about social progress from more foundational and material needs such as nutrition and healthcare.
Each component of the framework comprises between three and five specific outcome indicators. The included indicators are selected because they are measured appropriately, with a consistent methodology, by the same organization, and across all (or essentially all) of the countries in our sample.
Together, this framework aims to capture a broad range of interrelated factors revealed by the scholarly literature and practitioner experience as underpinning social progress.
The overall Social Progress Index score is a simple average of the three dimensions. Each dimension, in turn, is the simple average of its four components. We discuss the reasons to weight each component equally, and the alternatives considered, in the 2015 Methodological Report.
To translate a set of indicators into a component, we use principal component factor analysis to determine the weights of the indicators within each component. This avoids problems of double counting, where two or more indicators within a component may overlap in what they measure. Using this process we found that factor analysis weighted many indicators very near to equal within components, which signals a good selection of indicators to measure the concept of the component. Appendix 2 of the Methodological Report displays the 2015 weights.
34 Social Progress Index 2015 | © Social Progress Imperative 2015Social Progress Index 2015 | © Social Progress Imperative 2015
CHAPTER 1 / WHY MEASURE SOCIAL PROGRESS?
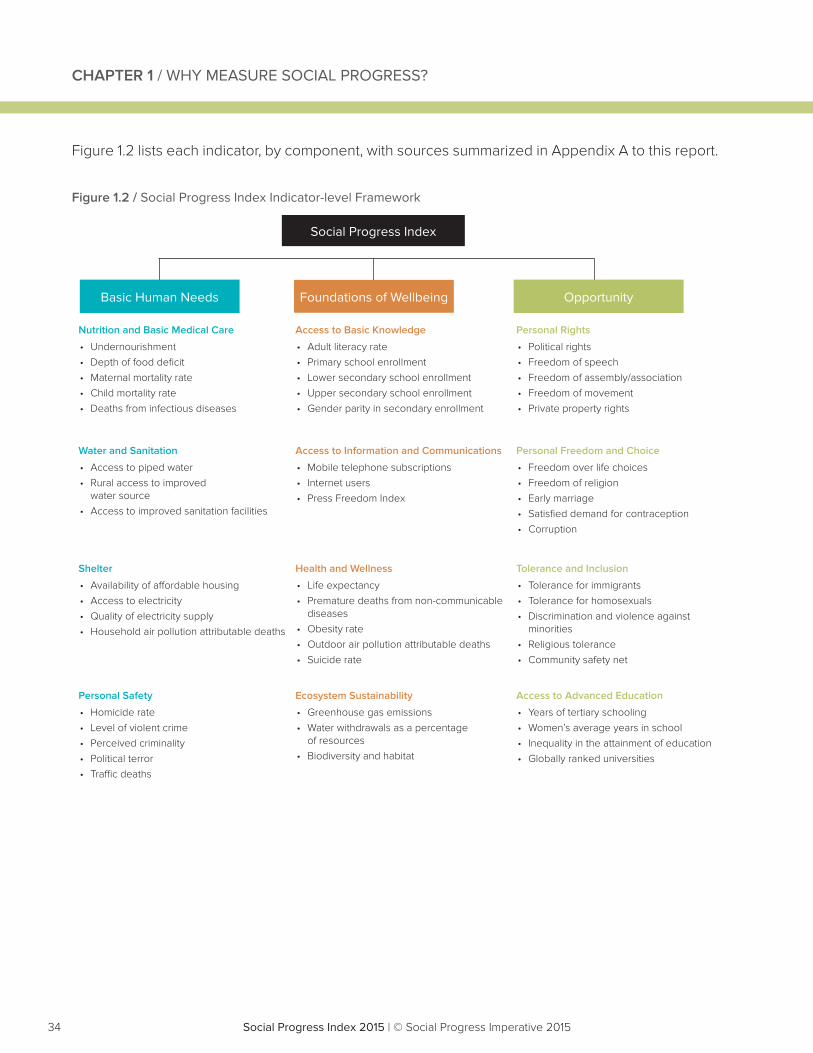
Figure 1.2 lists each indicator, by component, with sources summarized in Appendix A to this report.
Figure 1.2 / Social Progress Index Indicator-level Framework
Nutrition and Basic Medical Care
• Undernourishment • Depth of food deficit • Maternal mortality rate • Child mortality rate• Deaths from infectious diseases
Access to Basic Knowledge
• Adult literacy rate • Primary school enrollment • Lower secondary school enrollment • Upper secondary school enrollment • Gender parity in secondary enrollment
Personal Rights
• Political rights• Freedom of speech• Freedom of assembly/association• Freedom of movement • Private property rights
Water and Sanitation
• Access to piped water• Rural access to improved
water source• Access to improved sanitation facilities
Access to Information and Communications
• Mobile telephone subscriptions • Internet users • Press Freedom Index
Personal Freedom and Choice
• Freedom over life choices • Freedom of religion• Early marriage• Satisfied demand for contraception • Corruption
Shelter
• Availability of affordable housing• Access to electricity • Quality of electricity supply• Household air pollution attributable deaths
Health and Wellness
• Life expectancy • Premature deaths from non-communicable
diseases • Obesity rate• Outdoor air pollution attributable deaths• Suicide rate
Tolerance and Inclusion
• Tolerance for immigrants • Tolerance for homosexuals• Discrimination and violence against
minorities• Religious tolerance• Community safety net
Personal Safety
• Homicide rate • Level of violent crime• Perceived criminality • Political terror • Traffic deaths
Ecosystem Sustainability
• Greenhouse gas emissions• Water withdrawals as a percentage
of resources • Biodiversity and habitat
Access to Advanced Education
• Years of tertiary schooling • Women’s average years in school • Inequality in the attainment of education • Globally ranked universities
Social Progress Index
Basic Human Needs Foundations of Wellbeing Opportunity
35Social Progress Index 2015 | © Social Progress Imperative 2015Social Progress Index 2015 | © Social Progress Imperative 2015
CHAPTER 1 / WHY MEASURE SOCIAL PROGRESS?
Social Progress Index scores at the overall level, dimension level, and component level are all based on a 0-100 scale. This scale is determined by identifying the best and worst absolute global performance on each indicator recorded by any country since 2004, and using these actual performance levels to set the maximum (100) and minimum (0) bounds. Thus, Social Progress Index scores reflect realistic performance rather than abstract measures. This scaling also allows us to track absolute – not just relative – performance of countries over time on each component of the model.
HOW THE SOCIAL PROGRESS INDEX DIFFERS FROM OTHER MEASURES
Since the 1970s, there have been numerous attempts to incorporate alternatives to GDP into measurement of country performance.2 Most of these include only a portion of social progress such as the environment or basic needs, conflate social measures with economic ones, or use more subjective input measures rather than outcomes. The Social Progress Index is the first holistic measure committed to observable outcomes that focus exclusively on social and environmental issues. (For a more detailed discussion, see the 2015 Social Progress Methodology Report.)
In designing the Social Progress Index, we acknowledge the intellectual debt that we owe to other efforts. Our work draws on a rapidly expanding academic and practitioner literature focusing on assessments of social progress. Our aim has been to complement and extend this work.
Most wellbeing indices, such as the Human Development Index and the OECD Your Better Life Index, incorporate GDP or other economic measures directly. These are worthy efforts to measure wellbeing and have laid important groundwork in the field. However, because they conflate economic and social factors, they cannot explain or unpack the relationship between economic development and social progress. The Social Progress Index measures social progress directly, independently of economic development, in a way that is both holistic and rigorous. The Social Progress Index can be used to assess a country’s performance on social and environmental factors relative to its economic peers in a more meaningful and rigorous way than when economic performance is included as a component.
The Social Progress Index has also been designed as a broad measurement framework that goes beyond the basic needs of the poorest countries, so that it is relevant to countries at all levels of income. It is a framework that aims to capture not just present challenges and today’s priorities, but also the challenges that countries will face as their economic prosperity rises.
2 For an insightful framework and contemporary discussion of both the challenges and progress in moving “beyond GDP,” see Marc Fleurbaey and Didier Blanchet, “Beyond GDP: Measuring Welfare and Assessing Sustainability.” Oxford University Press, May 2013.
36 Social Progress Index 2015 | © Social Progress Imperative 2015Social Progress Index 2015 | © Social Progress Imperative 2015
CHAPTER 1 / WHY MEASURE SOCIAL PROGRESS?
CHANGES FROM 2014
The high-level structure of the 2015 Social Progress Index remains unchanged from 2014. Due to changes in data availability, a few modifications were made to the composition of several components. Also, improvements were made to the measurement of Water and Sanitation and Access to Advanced Education.
Changes to components:
• Nutrition and Basic Medical Care: The Stillbirth rate indicator, published once by the World Health Organization in 2009, was removed because it is unlikely that it will be updated.
• Ecosystem Sustainability: Since the three measures in this component do not show a clear relationship using principal components analysis, they are now weighted equally.
• Personal Freedom and Choice: Due to changes in the construction of the Global Slavery Index as well as new data published in the OECD Social Institutions and Gender Index, the previous ‘Modern slavery, human trafficking and child marriage’ indicator (which used data from the Global Slavery Index) has been replaced by a stand-alone indicator of early marriage.
• Tolerance and Inclusion: The question in the Gallup World Poll that served as the basis for the Women treated with respect indicator is no longer included. As no suitable alternative was identified, this indicator has been removed.
Improvements in measurement
• Water and Sanitation: The previous Rural vs. urban access to improved water source indicator was designed to measure inequality in access to water. There were some cases of countries with relatively high access to water scoring low on this indicator, and countries with low access (but little inequality) scoring high. We replaced this indicator by a measure of Rural access to improved water.
• Access to Advanced Education: The Number of globally ranked universities was modified from the number of universities in the country in the top 400 on any of the three main global rankings (grouped into tiers on a 0-5 scale) to a count of all universities on the three rankings. This better reflects the presence of world-class universities in a country.
Changes in country inclusion
New data availability enabled us to add four new countries: Afghanistan, Cyprus, Ethiopia, and Vietnam. However, new data gaps meant that we had to remove Burundi, Sudan, and Trinidad and Tobago from the Index. The net number of countries measured by the Social Progress Index has risen from 132 to 133 in 2015. In addition to the 133 countries for which we have complete data, there are a further 28 countries this year for which we have calculated component and dimension scores. These countries had too many data gaps to be included in the overall Index, but have enough data for at least nine of the twelve components. Including them allows useful benchmarking at this level.
37Social Progress Index 2015 | © Social Progress Imperative 2015Social Progress Index 2015 | © Social Progress Imperative 2015
CHAPTER 1 / WHY MEASURE SOCIAL PROGRESS?
OUTLINE OF THIS REPORT
In Chapter 2, we present the results of the 2015 Social Progress Index in two ways: grouped in six tiers from Very High Social Progress to Very Low Social Progress and by major regional groupings.
Chapter 3 extends this analysis by examining performance on the overall Social Progress Index and its components relative to countries’ GDP per capita. It looks at how the Social Progress Index informs our understanding of the relationship between economic development and social progress.
In Chapter 4, we present another perspective on the 2015 Social Progress Index results, benchmarking countries’ performance on the Social Progress Index relative to countries with similar GDP per capita in order to assess which countries are more and less effective at converting their economic resources into social progress.
Chapter 5 uses Social Progress Index data to explore three important policy issues:
a) Inequality and poverty: The Social Progress Index directly measures inequalities in societies. Indeed, it is impossible for a country to achieve a high Social Progress Index score if significant numbers of people are excluded from access to the basic needs of survival, the building blocks of a better life, and the freedom to pursue their life choices. The Social Progress Index therefore offers a novel and complementary perspective to economic measures of inequality such as Gini coefficient.
b) International aid allocation: GDP per capita thresholds that define countries as ‘low-income’ and ‘middle-income’ are widely used to determine how much aid they should receive from international development organizations. As a measure of national performance that is independent of GDP per capita, the Social Progress Index provides a fresh perspective on whether aid is being allocated where it is needed most.
c) Life satisfaction: Social progress is conceptually distinct from life satisfaction and other measures of happiness, as well as from GDP per capita. We examine the ways in which aspects of social progress have a relationship with life satisfaction, independent of GDP.
Chapter 6 reports on how the Social Progress Index is being used by governments, businesses, and civil society as a tool to advance social progress. This includes the rapid development of sub-national Social Progress Indices, covering regions, cities, and municipalities.

Social Progress Index 2015 | © Social Progress Imperative 2015Social Progress Index 2015 | © Social Progress Imperative 2015
39Social Progress Index 2015 | © Social Progress Imperative 2015Social Progress Index 2015 | © Social Progress Imperative 2015
CHAPTER 2SOCIAL PROGRESS INDEX 2015 RESULTS
40 Social Progress Index 2015 | © Social Progress Imperative 2015Social Progress Index 2015 | © Social Progress Imperative 2015
CHAPTER 2 / SOCIAL PROGRESS INDEX 2015 RESULTS
41Social Progress Index 2015 | © Social Progress Imperative 2015Social Progress Index 2015 | © Social Progress Imperative 2015
CHAPTER 2 / SOCIAL PROGRESS INDEX 2015 RESULTS
SOCIAL PROGRESS INDEX 2015 RESULTS
The 2015 Social Progress Index includes 133 countries covering 94% of the world’s population, plus 28 countries with partial data. This brings coverage to a total of 99% of the world’s population. This year’s Social Progress Index again reveals striking differences across countries in their overall social performance, and across different components of social progress. This chapter provides an overview of the key findings, from two perspectives:
• The global perspective and how the world as a whole performs on different components of social progress.
• Performance by country.
SOCIAL PROGRESS GLOBALLY
The Social Progress Index score is an average across three dimensions: Basic Human Needs, Foundations of Wellbeing, and Opportunity. Each dimension is made up of four equally-weighted, individual components scored on an objective scale from 0 to 100. Higher scores mean higher social progress, and lower mean the reverse. The scale is determined by identifying the best and worst actual global performance on each indicator by any country since 2004, and using these levels to set the maximum (100) and minimum (0) bounds. Thus, the scaling of Social Progress Index scores allows the tracking of absolute performance that can be compared across peers, rather than using abstract, relative measures.
By creating an average of all country scores weighted by population, we can create a tangible measure of the world’s total level of social progress and which aspects of social progress are most and least advanced.
If the world were a country, it would score 64.39 in Social Progress based on a simple average of countries and 61.00 on a population-weighted basis. These averages are the equivalent to countries such as Guatemala and Kazakhstan.
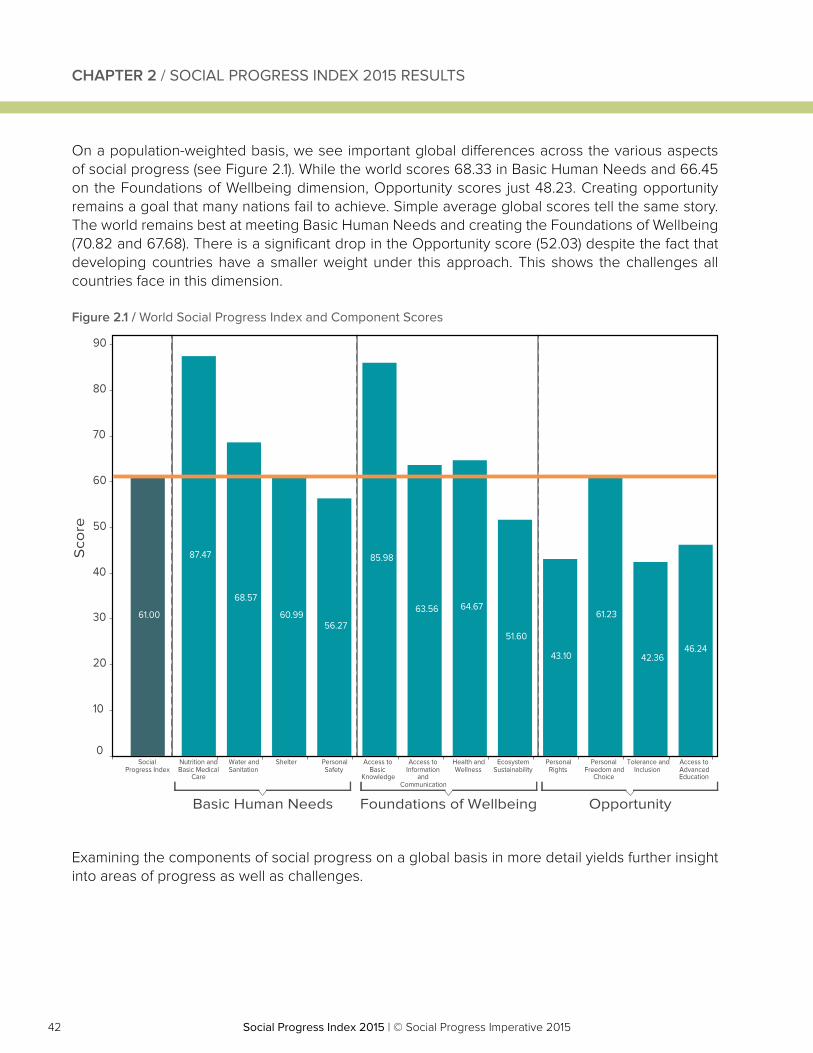
42 Social Progress Index 2015 | © Social Progress Imperative 2015Social Progress Index 2015 | © Social Progress Imperative 2015
CHAPTER 2 / SOCIAL PROGRESS INDEX 2015 RESULTS
On a population-weighted basis, we see important global differences across the various aspects of social progress (see Figure 2.1). While the world scores 68.33 in Basic Human Needs and 66.45 on the Foundations of Wellbeing dimension, Opportunity scores just 48.23. Creating opportunity remains a goal that many nations fail to achieve. Simple average global scores tell the same story. The world remains best at meeting Basic Human Needs and creating the Foundations of Wellbeing (70.82 and 67.68). There is a significant drop in the Opportunity score (52.03) despite the fact that developing countries have a smaller weight under this approach. This shows the challenges all countries face in this dimension.
Examining the components of social progress on a global basis in more detail yields further insight into areas of progress as well as challenges.
Figure 2.1 / World Social Progress Index and Component Scores
Nutrition andBasic Medical
Care
Water andSanitation
Shelter PersonalSafety
Access toBasic
Knowledge
Access toInformation
andCommunication
Health andWellness
EcosystemSustainability
PersonalRights
PersonalFreedom and
Choice
Tolerance andInclusion
Access toAdvancedEducation
0
10
20
30
40
50
60
70
80
90
Sco
re
85.98
60.99
87.47
68.57
56.2761.23
64.67
42.36
63.56
51.60
43.10
SocialProgress Index
61.00
46.24
Basic Human Needs Foundations of Wellbeing Opportunity
43Social Progress Index 2015 | © Social Progress Imperative 2015Social Progress Index 2015 | © Social Progress Imperative 2015
CHAPTER 2 / SOCIAL PROGRESS INDEX 2015 RESULTS
• Basic Human Needs: Average world performance is best on Nutrition and Basic Medical Care (87.47) and Water and Sanitation (68.57). This reflects important progress in global development in areas that have been the focus of the United Nations Millennium Development Goals. The last two and a half decades have seen child mortality fall by 49%3 and access to safe drinking water increase from 76% to 89%4. Shelter, not addressed in the Millennium Development Goals, scores 60.99. The worst performing component is Personal Safety (56.27), also not a Millennium Development Goal.
• Foundations of Wellbeing: Average world performance is best on Access to Basic Knowledge (85.98), an area of focus for the Millennium Development Goals. Primary school enrolment has increased 11 percentage points since 19905. Access to Information and Communications (63.56) and Health and Wellness (64.67) have lower but similar scores. Access to Information and Communications will probably continue to rise with the continued spread of mobile telecommunications. While Health and Wellness has an uneven relationship with economic development and rising wealth (see below). The worst performing component of this dimension is Ecosystem Sustainability (51.60), which remains a problem for countries at all income levels.
• Opportunity: Average world performance is best on Personal Freedom and Choice (61.23) with scores on the other three components significantly lower: Access to Advanced Education (46.24), Personal Rights (43.10), and Tolerance and Inclusion (42.36). Of these, Personal Rights is the area that has the widest variance, with some countries scoring very poorly with scores as low as 2.32, while others perform well with scores as high as 98.84. Tolerance and Inclusion is the worst or second-worst scoring component for one-third of countries. As countries move into middle income status, Tolerance and Inclusion scores often deteriorate before they improve. Access to Advanced Education, on the other hand, tends to improve as countries get richer, first achieving high primary and secondary education levels, and building the proportion of citizens with university training.
SOCIAL PROGRESS BY COUNTRY
With these global averages as context, we now turn to the centerpiece of our analysis: the 2015 Social Progress Index by country (see Table 2.1). We ranked 133 countries with sufficient data to calculate scores for all 12 components. From highest to lowest in terms of social progress, we classify the countries into six tiers from ‘Very High Social Progress’ to ‘Very Low Social Progress.’ Each tier represents a distinct group of social progress scores on a statistical basis6. 3 http://www.childmortality.org/files_v19/download/unicef-2013-child-mortality-report-LR-10_31_14_195.pdf4 http://www.wssinfo.org/fileadmin/user_upload/resources/JMP_report_2014_webEng.pdf5 World adjusted net enrollment rate, primary (% of primary school age children) 1990 to 2012, World Bank6 These tiers are based on K-Means cluster analysis to assess clear breaks in groups of countries based on their Social Progress Index scores. A number of iterations of clusters were run and then the common breaks were decided upon, with six different tiers being the best fit for the Index. We note that although these tiers show similarities among countries in terms of aggregate performance, there is significant variation in each country’s performance across components.
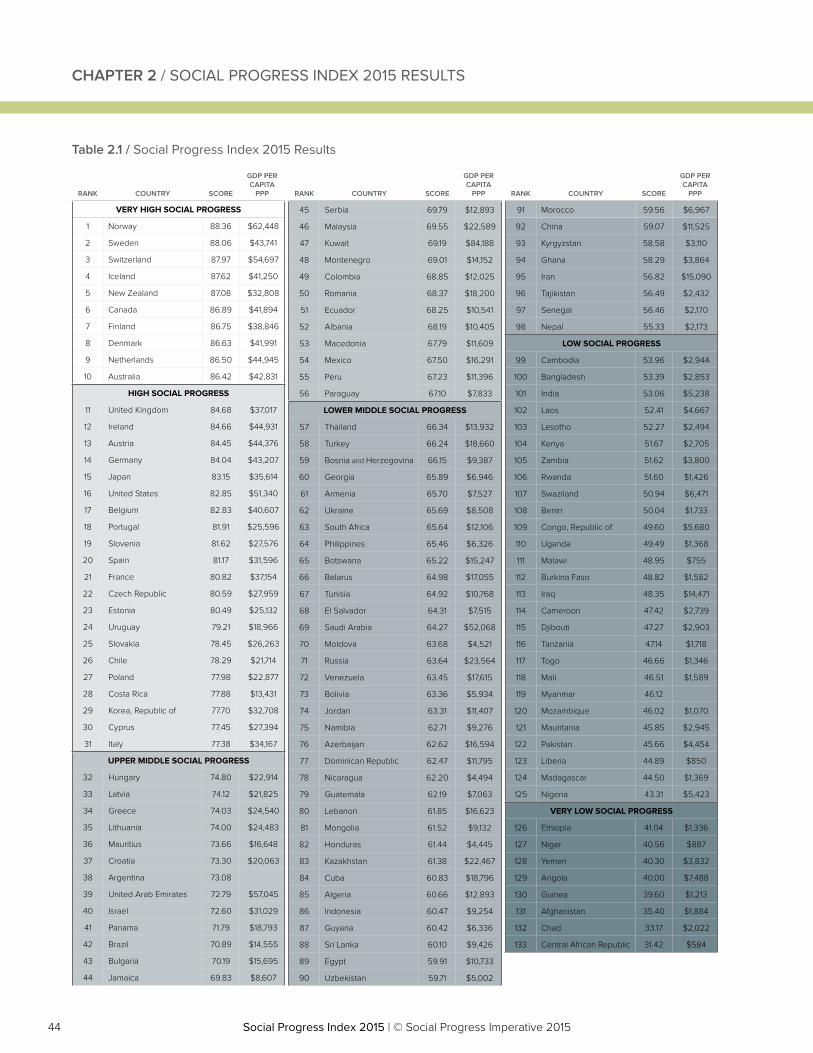
44 Social Progress Index 2015 | © Social Progress Imperative 2015Social Progress Index 2015 | © Social Progress Imperative 2015
CHAPTER 2 / SOCIAL PROGRESS INDEX 2015 RESULTS
Table 2.1 / Social Progress Index 2015 Results
Social Progress Index 2015 results
RANK COUNTRY SCORE
GDP PER CAPITA
PPP
VERY HIGH SOCIAL PROGRESS
1 Norway 88.36 $62,448
2 Sweden 88.06 $43,741
3 Switzerland 87.97 $54,697
4 Iceland 87.62 $41,250
5 New Zealand 87.08 $32,808
6 Canada 86.89 $41,894
7 Finland 86.75 $38,846
8 Denmark 86.63 $41,991
9 Netherlands 86.50 $44,945
10 Australia 86.42 $42,831
HIGH SOCIAL PROGRESS
11 United Kingdom 84.68 $37,017
12 Ireland 84.66 $44,931
13 Austria 84.45 $44,376
14 Germany 84.04 $43,207
15 Japan 83.15 $35,614
16 United States 82.85 $51,340
17 Belgium 82.83 $40,607
18 Portugal 81.91 $25,596
19 Slovenia 81.62 $27,576
20 Spain 81.17 $31,596
21 France 80.82 $37,154
22 Czech Republic 80.59 $27,959
23 Estonia 80.49 $25,132
24 Uruguay 79.21 $18,966
25 Slovakia 78.45 $26,263
26 Chile 78.29 $21,714
27 Poland 77.98 $22,877
28 Costa Rica 77.88 $13,431
29 Korea, Republic of 77.70 $32,708
30 Cyprus 77.45 $27,394
31 Italy 77.38 $34,167
UPPER MIDDLE SOCIAL PROGRESS
32 Hungary 74.80 $22,914
33 Latvia 74.12 $21,825
34 Greece 74.03 $24,540
35 Lithuania 74.00 $24,483
36 Mauritius 73.66 $16,648
37 Croatia 73.30 $20,063
38 Argentina 73.08
39 United Arab Emirates 72.79 $57,045
40 Israel 72.60 $31,029
41 Panama 71.79 $18,793
42 Brazil 70.89 $14,555
43 Bulgaria 70.19 $15,695
44 Jamaica 69.83 $8,607
RANK COUNTRY SCORE
GDP PER CAPITA
PPP
45 Serbia 69.79 $12,893
46 Malaysia 69.55 $22,589
47 Kuwait 69.19 $84,188
48 Montenegro 69.01 $14,152
49 Colombia 68.85 $12,025
50 Romania 68.37 $18,200
51 Ecuador 68.25 $10,541
52 Albania 68.19 $10,405
53 Macedonia 67.79 $11,609
54 Mexico 67.50 $16,291
55 Peru 67.23 $11,396
56 Paraguay 67.10 $7,833
LOWER MIDDLE SOCIAL PROGRESS
57 Thailand 66.34 $13,932
58 Turkey 66.24 $18,660
59 Bosnia and Herzegovina 66.15 $9,387
60 Georgia 65.89 $6,946
61 Armenia 65.70 $7,527
62 Ukraine 65.69 $8,508
63 South Africa 65.64 $12,106
64 Philippines 65.46 $6,326
65 Botswana 65.22 $15,247
66 Belarus 64.98 $17,055
67 Tunisia 64.92 $10,768
68 El Salvador 64.31 $7,515
69 Saudi Arabia 64.27 $52,068
70 Moldova 63.68 $4,521
71 Russia 63.64 $23,564
72 Venezuela 63.45 $17,615
73 Bolivia 63.36 $5,934
74 Jordan 63.31 $11,407
75 Namibia 62.71 $9,276
76 Azerbaijan 62.62 $16,594
77 Dominican Republic 62.47 $11,795
78 Nicaragua 62.20 $4,494
79 Guatemala 62.19 $7,063
80 Lebanon 61.85 $16,623
81 Mongolia 61.52 $9,132
82 Honduras 61.44 $4,445
83 Kazakhstan 61.38 $22,467
84 Cuba 60.83 $18,796
85 Algeria 60.66 $12,893
86 Indonesia 60.47 $9,254
87 Guyana 60.42 $6,336
88 Sri Lanka 60.10 $9,426
89 Egypt 59.91 $10,733
90 Uzbekistan 59.71 $5,002
RANK COUNTRY SCORE
GDP PER CAPITA
PPP
91 Morocco 59.56 $6,967
92 China 59.07 $11,525
93 Kyrgyzstan 58.58 $3,110
94 Ghana 58.29 $3,864
95 Iran 56.82 $15,090
96 Tajikistan 56.49 $2,432
97 Senegal 56.46 $2,170
98 Nepal 55.33 $2,173
LOW SOCIAL PROGRESS
99 Cambodia 53.96 $2,944
100 Bangladesh 53.39 $2,853
101 India 53.06 $5,238
102 Laos 52.41 $4,667
103 Lesotho 52.27 $2,494
104 Kenya 51.67 $2,705
105 Zambia 51.62 $3,800
106 Rwanda 51.60 $1,426
107 Swaziland 50.94 $6,471
108 Benin 50.04 $1,733
109 Congo, Republic of 49.60 $5,680
110 Uganda 49.49 $1,368
111 Malawi 48.95 $755
112 Burkina Faso 48.82 $1,582
113 Iraq 48.35 $14,471
114 Cameroon 47.42 $2,739
115 Djibouti 47.27 $2,903
116 Tanzania 47.14 $1,718
117 Togo 46.66 $1,346
118 Mali 46.51 $1,589
119 Myanmar 46.12
120 Mozambique 46.02 $1,070
121 Mauritania 45.85 $2,945
122 Pakistan 45.66 $4,454
123 Liberia 44.89 $850
124 Madagascar 44.50 $1,369
125 Nigeria 43.31 $5,423
VERY LOW SOCIAL PROGRESS
126 Ethiopia 41.04 $1,336
127 Niger 40.56 $887
128 Yemen 40.30 $3,832
129 Angola 40.00 $7,488
130 Guinea 39.60 $1,213
131 Afghanistan 35.40 $1,884
132 Chad 33.17 $2,022
133 Central African Republic 31.42 $584
45Social Progress Index 2015 | © Social Progress Imperative 2015Social Progress Index 2015 | © Social Progress Imperative 2015
CHAPTER 2 / SOCIAL PROGRESS INDEX 2015 RESULTS
Very High Social Progress Countries
Ten countries in the world represent the “top tier” in terms of social progress and register generally strong performance across all three dimensions. The average dimension scores for this tier are: Basic Human Needs is 94.77, Foundations of Wellbeing is 83.85, and Opportunity is 83.07. These countries show generally strong performance on Personal Freedom and Choice and Tolerance and Inclusion. As with most high-income countries, the top 10 score lowest on Ecosystem Sustainability and Health and Wellness, but they distinguish themselves with slightly better performance on both components than their peers. Nearly all of the top 10 are relatively small countries, with only Canada having a population greater than 25 million.
The top three countries in the world on Social Progress are Norway, Sweden, and Switzerland with closely grouped scores between 88.36 and 87.97. Despite the tightly clustered overall scores, there is variation among the countries in terms of strengths and weaknesses.
Norway, the top country, ranks first in the world on Foundations of Wellbeing (with a score of 88.46), due in part to achieving the highest score on Access to Information and Communications. Norway is 9th in terms of Basic Human Needs and Opportunity.
Sweden, the second place country, registers a more balanced portfolio across the Index. While it does not lead the world on any individual dimension, it ranks 3rd on Foundations of Wellbeing (86.43), 5th in terms of Opportunity (82.93), and 8th on Basic Human Needs (94.83).
Switzerland, the third place country, is 2nd in the world on both Basic Human Needs (95.66) and Foundations of Wellbeing (86.50), and is the top performer in the world on Ecosystem Sustainability. In contrast, Switzerland ranks 10th in terms of Opportunity (81.75), driven by weaker performance on Access to Advanced Education and Tolerance and Inclusion.
The rest of the top ten includes Iceland, New Zealand, Canada (the highest ranking member of the G7), Finland, Denmark, Netherlands, and Australia. These countries are closely bunched, with scores of between 86 and 88. Of this group, Finland recorded the highest scores of all countries on Nutrition and Basic Medical Care and Personal Freedom and Choice, Denmark is the world’s top performer on Shelter, New Zealand tops Personal Rights, and Iceland has the highest performance on Tolerance and Inclusion.
Overall, the findings from the top 10 reveal that there are strong models in the world for advanced social progress. Consistent strength in Basic Human Needs as well as several distinctive areas of strength in Foundations of Wellbeing and Opportunity are the key characteristics of this highest tier.
However, even the strongest countries in terms of social progress have unfinished agendas and areas for improvement. For example, nearly all these countries score low on Ecosystem Sustainability with an average score of only 66.08.
46 Social Progress Index 2015 | © Social Progress Imperative 2015Social Progress Index 2015 | © Social Progress Imperative 2015
CHAPTER 2 / SOCIAL PROGRESS INDEX 2015 RESULTS
High Social Progress Countries
A group of 21 countries, ranging from the United Kingdom (84.68) to Italy (77.38) represent the next tier of countries in terms of social progress. This group includes many rich countries, as would be expected, but also some high performing emerging countries from Europe, Latin America, and Asia. This group includes a number of the world’s leading economies in terms of GDP and population, including the remaining six members of the G7: the United Kingdom, Germany, Japan, the United States, France, and Italy.
The average dimension scores for this tier are: Basic Human Needs is 90.86, Foundations of Wellbeing is 77.83, and Opportunity is 73.82. While the countries of this tier have high scores overall on the Social Progress Index, they generally have one or more components with significantly lower scores. The weakest component for this group as a whole is Ecosystem Sustainability.
The Social Progress Index reveals significant differences among these leading nations.
• The United States leads the world in Access to Advanced Education, making Opportunity (82.18) its highest ranked dimension (8th), but performs weakest in Ecosystem Sustainability and Health and Wellness.
• The United Kingdom demonstrates strength in Opportunity, ranking 6th with a score of 82.78, but ranking only 19th in Basic Human Needs (92.22).
• Germany’s highest ranked dimension is Foundations of Wellbeing (10th) where its score is 81.50, despite its weakest performance relative to others in Health and Wellness.
• Japan’s strength is in the area of Basic Human Needs (95.01; 5th), whereas both Foundations of Wellbeing and Opportunity are below 80 (with ranks of 20th and 19th). Japan tops the world in Access to Basic Knowledge and is weakest on Ecosystem Sustainability. In Opportunity, Japan scores well in Personal Rights (5th) but low in Tolerance and Inclusion (60.31; 42nd).
• France performs best in Basic Human Needs (91.16; 22nd) but faces challenges in the other dimensions due to low scores in Ecosystem Sustainability and Tolerance and Inclusion.
• Italy scores highest in the Basic Human Needs dimension (88.39; 29th) but shows weakness across the Opportunity dimension (66.76; 30th).
The emerging European countries in this tier – Slovenia, Czech Republic, Estonia, Slovakia, and Poland – all score highly in Nutrition and Basic Medical Care, but fail to meet the level of Health and Wellness achieved by the other countries in this group. In contrast, the Latin American countries, Uruguay, Chile, and Costa Rica, have relatively balanced performance across the twelve components, with weakest scores in Access to Advanced Education and Ecosystem Sustainability (see Social Progress Performance by Region and Country Group later in this chapter).
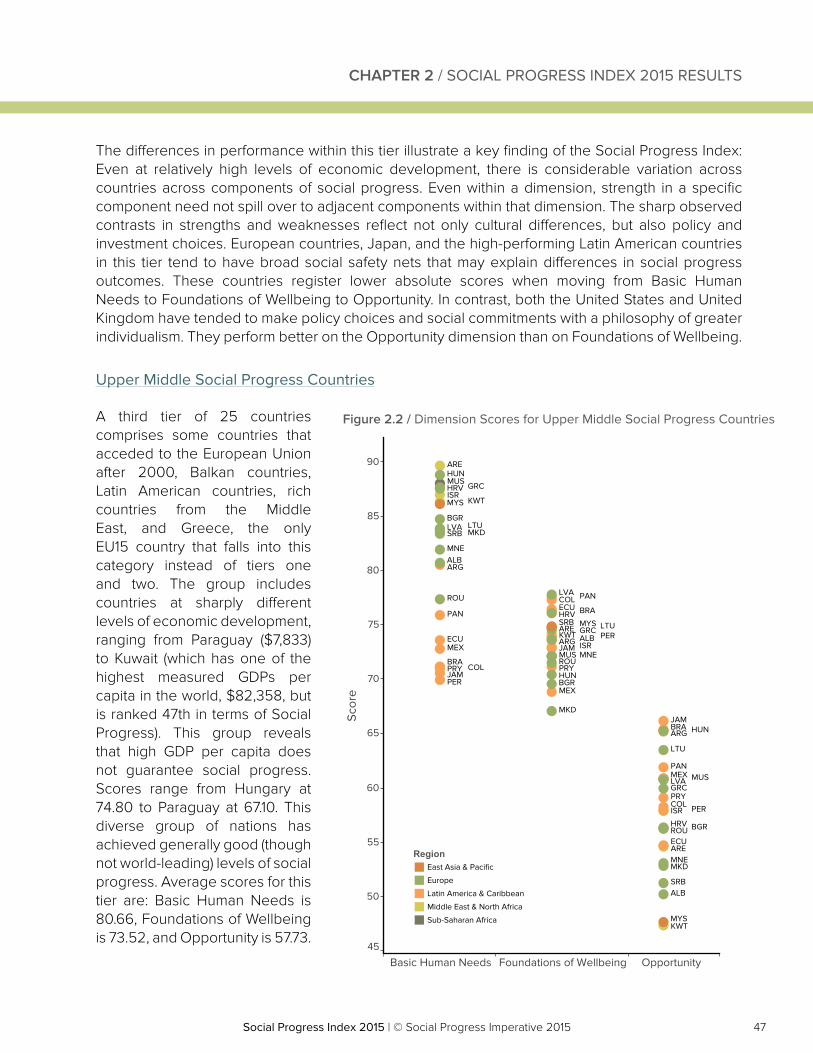
47Social Progress Index 2015 | © Social Progress Imperative 2015Social Progress Index 2015 | © Social Progress Imperative 2015
CHAPTER 2 / SOCIAL PROGRESS INDEX 2015 RESULTS
The differences in performance within this tier illustrate a key finding of the Social Progress Index: Even at relatively high levels of economic development, there is considerable variation across countries across components of social progress. Even within a dimension, strength in a specific component need not spill over to adjacent components within that dimension. The sharp observed contrasts in strengths and weaknesses reflect not only cultural differences, but also policy and investment choices. European countries, Japan, and the high-performing Latin American countries in this tier tend to have broad social safety nets that may explain differences in social progress outcomes. These countries register lower absolute scores when moving from Basic Human Needs to Foundations of Wellbeing to Opportunity. In contrast, both the United States and United Kingdom have tended to make policy choices and social commitments with a philosophy of greater individualism. They perform better on the Opportunity dimension than on Foundations of Wellbeing.
Upper Middle Social Progress Countries
A third tier of 25 countries comprises some countries that acceded to the European Union after 2000, Balkan countries, Latin American countries, rich countries from the Middle East, and Greece, the only EU15 country that falls into this category instead of tiers one and two. The group includes countries at sharply different levels of economic development, ranging from Paraguay ($7,833) to Kuwait (which has one of the highest measured GDPs per capita in the world, $82,358, but is ranked 47th in terms of Social Progress). This group reveals that high GDP per capita does not guarantee social progress. Scores range from Hungary at 74.80 to Paraguay at 67.10. This diverse group of nations has achieved generally good (though not world-leading) levels of social progress. Average scores for this tier are: Basic Human Needs is 80.66, Foundations of Wellbeing is 73.52, and Opportunity is 57.73.
Figure 2.2 / Dimension Scores for Upper Middle Social Progress Countries
Basic Human Needs Foundations of Wellbeing Opportunity45
50
55
60
65
70
75
80
85
90
Scor
e
RegionEast Asia & Pacific
Europe
Latin America & Caribbean
Middle East & North Africa
Sub-Saharan Africa
MUS
MUS
MUS
KWT
KWT
KWT
ISR
ISR
ISR
ARE
ARE
ARE
PRY
PRYPRY
PER
PER
PER
PAN
PAN
PAN
MEX
MEX
MEX
JAM
JAM
JAM
ECU
ECU
ECU
COL
COL
COL
BRA
BRA
BRA
ARG
ARG
ARG
SRB
SRB
SRB
ROU
ROU
ROU
MNE
MNE
MNE
MKD
MKD
MKD
LVA
LVA
LVA
LTU
LTU
LTU
HUN
HUN
HUN
HRV
HRV
HRV
GRC
GRC
GRC
BGR
BGR
BGR
ALB
ALB
ALB
MYS
MYS
MYS
48 Social Progress Index 2015 | © Social Progress Imperative 2015Social Progress Index 2015 | © Social Progress Imperative 2015
A main finding in this group is sharply lower scores on the Opportunity dimension compared to Basic Human Needs and Foundations of Wellbeing. As shown in Figure 2.2, every country in the upper middle social progress group, regardless of region, scores significantly lower on the Opportunity dimension than Basic Human Needs and Foundations of Wellbeing. This trend is most marked for very high income countries, such as UAE and Kuwait, that do well on aspects of social progress that are more correlated with GDP per capita and countries of southeastern Europe, including the former Yugoslavia, where there are specific issues with minorities. Of this tier, Jamaica, Brazil, and Mexico diverge from this trend, showing less variability among their three dimension scores, reflecting a broader positive performance on this dimension by Latin American countries.
Israel, the fourth richest country in this group, ranks 40th in the Social Progress Index with a score of 72.60. Israel’s performance in Nutrition and Basic Medical Care and Water and Sanitation is at the same level as top tier countries. Similarly, it scores high in Access to Basic Knowledge and Access to Advanced Education. However, Israel lags in Personal Safety, Ecosystem Sustainability, and Tolerance and Inclusion.
Lower Middle Social Progress Countries
The fourth tier, comprising 42 countries, is the largest tier, ranging from Thailand at 57th (with a score of 66.34) to Nepal at 98th (with a score of 55.33). A meaningful level of social progress has been realized within this tier, particularly in Basic Human Needs where no country within this tier scores below 55.50. However, no country within this tier scores above 62.38 on Opportunity. The average dimension scores for this tier are: Basic Human Needs is 72.34, Foundations of Wellbeing is 66.90, and Opportunity is 47.14. The countries in this tier are closely bunched in terms of their overall Social Progress Index score, even compared to other tiers, but they have widely differing strengths and weaknesses which lead to diverse social progress agendas.
One group of countries stand out for having weakness in the area of Basic Human Needs, including Latin American countries such as Honduras, Nicaragua, and Venezuela, as well as relatively prosperous African nations such as South Africa. Personal Safety is the lowest scoring component of Basic Human Needs for these countries. Venezuela and South Africa score far below the tier average for this component.
Other groups of countries have weaknesses concentrated in Foundations of Wellbeing or Opportunity. Uzbekistan, for example, has a major weakness in Foundations of Wellbeing, while Iran and Egypt have their greatest weakness in Opportunity. These reflect wider regional patterns, specifically the Middle East and North Africa where Opportunity scores reflect challenges in Personal Rights.
CHAPTER 2 / SOCIAL PROGRESS INDEX 2015 RESULTS
49Social Progress Index 2015 | © Social Progress Imperative 2015Social Progress Index 2015 | © Social Progress Imperative 2015
Low Social Progress
The fifth tier of 27 countries ranges from Cambodia (99th, 53.96) to Nigeria (125th, 43.31) and includes many Sub-Saharan African countries. GDP per capita in this group is quite low, all below $6,500, with the exception of Iraq, which has a much higher GDP per capita. The average dimension scores for this tier are: Basic Human Needs is 50.03, Foundations of Wellbeing is 58.01, and Opportunity is 38.35. It is notable that it is only in this tier and the Very Low Social Progress tier that average Basic Human Needs scores are lower than Foundations of Wellbeing. This suggests that countries in these bottom two tiers have, on average, not yet achieved the level of economic resources to make significant advances in Basic Human Needs.
This group is led by a tightly clustered group of Asian countries: Cambodia (53.96), Bangladesh (53.39), and India (53.06). Cambodia performs best on the Foundations of Wellbeing dimension while India’s highest score is in Basic Human Needs. Foundations of Wellbeing, India’s second highest component, shows strong performance in Access to Basic Knowledge. Bangladesh scores best in Foundations of Wellbeing, with Basic Human Needs a very close second driven by strong performance in Nutrition and Basic Medical Care. Pakistan is the poorest performing Asian country in this group with an overall score of 45.66.
Among the low social progress countries, there are large deviations in scores across the three dimensions, especially among the Sub-Saharan African countries. Djibouti, for example, scores more than 10 points higher than the others in the region on Basic Human Needs (64.18). However, it is the weakest performer on Foundations of Wellbeing (44.02). This incongruence is driven by weak scores in Access to Basic Knowledge, Ecosystem Sustainability, and Access to Information and Communications. Within this group, Rwanda scores relatively strong but has a mixed picture at the dimension and component level, with low scores on Access to Information and Communications and Personal Rights. Nigeria, the bottom country in this group, reveals similarly large contrasts between dimensions. It is one of the weakest performers in Basic Human Needs (39.04) ranking 130th, but performs much better (100th) on Foundations of Wellbeing (61.51).
Iraq’s social progress score is sharply reduced due the ongoing conflict that is causing poor performance on the Personal Safety component and the entire Opportunity dimension (26.67).
The countries in this group face serious development challenges in multiple areas. The Social Progress Index can be used to identify those areas where countries show the greatest need, as well as to identify possible models for success.
CHAPTER 2 / SOCIAL PROGRESS INDEX 2015 RESULTS
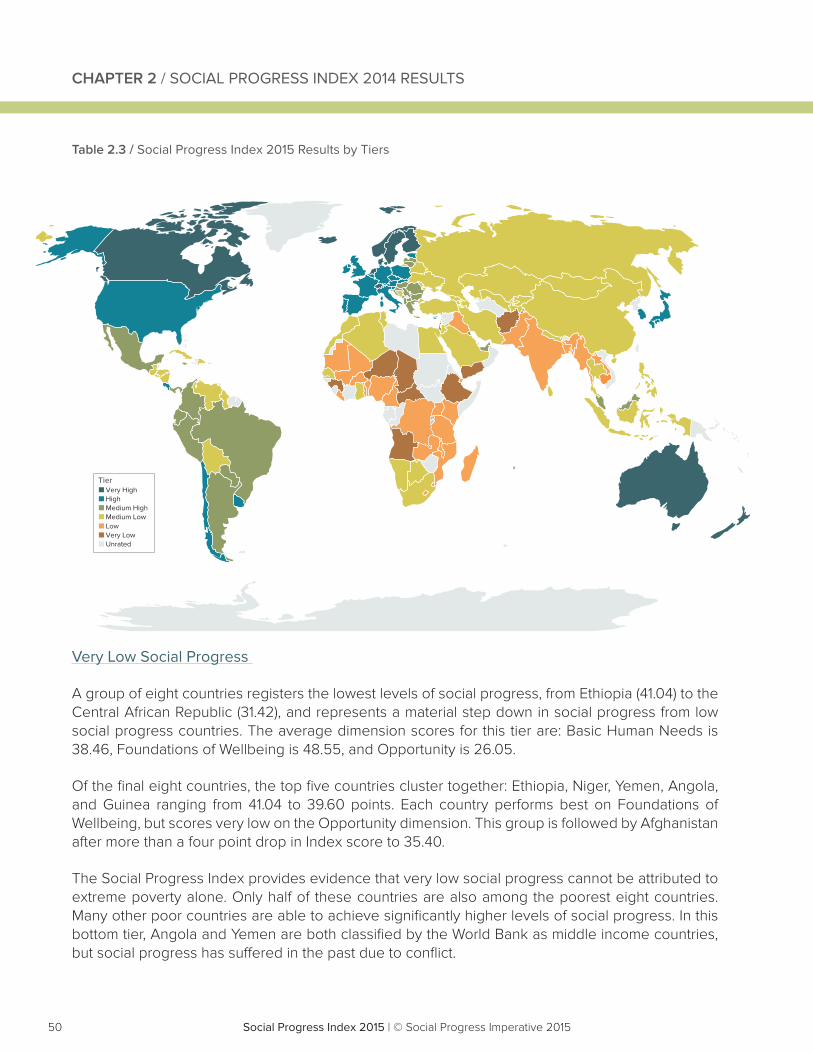
50 Social Progress Index 2015 | © Social Progress Imperative 2015Social Progress Index 2015 | © Social Progress Imperative 2015
CHAPTER 2 / SOCIAL PROGRESS INDEX 2014 RESULTS
Very Low Social Progress
A group of eight countries registers the lowest levels of social progress, from Ethiopia (41.04) to the Central African Republic (31.42), and represents a material step down in social progress from low social progress countries. The average dimension scores for this tier are: Basic Human Needs is 38.46, Foundations of Wellbeing is 48.55, and Opportunity is 26.05.
Of the final eight countries, the top five countries cluster together: Ethiopia, Niger, Yemen, Angola, and Guinea ranging from 41.04 to 39.60 points. Each country performs best on Foundations of Wellbeing, but scores very low on the Opportunity dimension. This group is followed by Afghanistan after more than a four point drop in Index score to 35.40.
The Social Progress Index provides evidence that very low social progress cannot be attributed to extreme poverty alone. Only half of these countries are also among the poorest eight countries. Many other poor countries are able to achieve significantly higher levels of social progress. In this bottom tier, Angola and Yemen are both classified by the World Bank as middle income countries, but social progress has suffered in the past due to conflict.
Table 2.3 / Social Progress Index 2015 Results by Tiers
TierVery HighHighMedium HighMedium LowLowVery LowUnrated
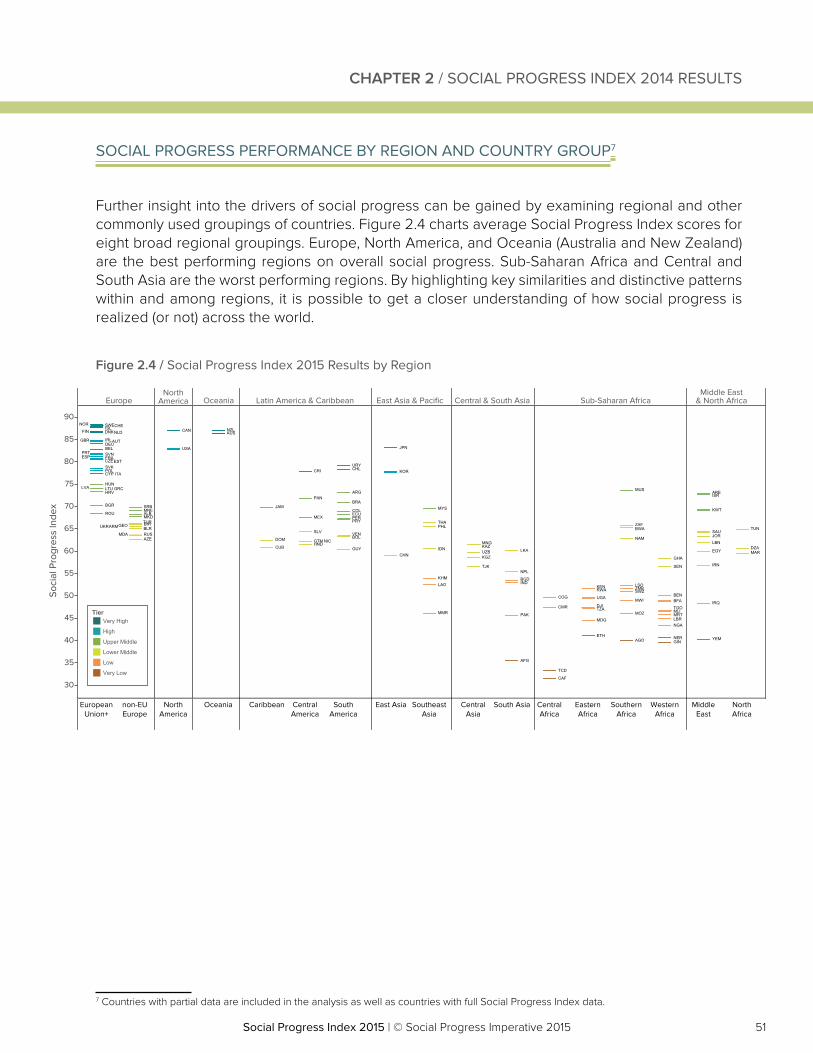
51Social Progress Index 2015 | © Social Progress Imperative 2015Social Progress Index 2015 | © Social Progress Imperative 2015
CHAPTER 2 / SOCIAL PROGRESS INDEX 2014 RESULTS
SOCIAL PROGRESS PERFORMANCE BY REGION AND COUNTRY GROUP7
Further insight into the drivers of social progress can be gained by examining regional and other commonly used groupings of countries. Figure 2.4 charts average Social Progress Index scores for eight broad regional groupings. Europe, North America, and Oceania (Australia and New Zealand) are the best performing regions on overall social progress. Sub-Saharan Africa and Central and South Asia are the worst performing regions. By highlighting key similarities and distinctive patterns within and among regions, it is possible to get a closer understanding of how social progress is realized (or not) across the world.
7 Countries with partial data are included in the analysis as well as countries with full Social Progress Index data.
Figure 2.4 / Social Progress Index 2015 Results by Region
EuropeNorth
America Latin America & Caribbean East Asia & Pacific Central & South Asia
EuropeanUnion+
non-EUEurope
NorthAmerica
Caribbean CentralAmerica
SouthAmerica
East Asia SoutheastAsia
CentralAsia
South Asia
30
35
40
45
50
55
60
65
70
75
80
85
90
Soci
al P
rogr
ess
Inde
x
UKRTUR
RUSMDA
GEOBLRBIH
AZE
ARM
SRBROU
MNEMKD
LVA LTUHUN
HRVGRC
BGR
ALB
SVN
SVK
PRT
POLITA
IRLGBR
FRAEST
ESP
DEU
CZE
CYP
BEL
AUT
SWENOR
NLDISL
FIN DNKCHE
USA
CAN
VENSLV
NICHND
GUY
GTMDOM
CUB
BOL
PRYPER
PAN
MEX
JAM
ECUCOL
BRA
ARG
URYCRI CHL
MMR
LAOKHM
THAPHL
IDNCHN
MYS
KOR
JPN
AFG
PAK
INDBGD
UZB
TJKNPL
MNG
LKAKGZ
KAZ
Middle East & North Africa
MiddleEast
NorthAfrica
YEM
IRQ
TUNSAU
MAR
LBNJOR
IRN
EGYDZA
KWT
ISRARE
Sub-Saharan Africa
CentralAfrica
EasternAfrica
SouthernAfrica
WesternAfrica
TCD
NERGIN
ETH
CAF
AGO
ZMB
UGA
TZA TGO
SWZRWA
NGA
MWI
MRTMOZ MLI
MDG
LSO
LBR
KEN
DJI
COG
CMRBFABEN
ZAF
SEN
NAM
GHA
BWA
MUS
Oceania
Oceania
NZLAUS
TierVery High
High
Upper Middle
Lower Middle
Low
Very Low

52 Social Progress Index 2015 | © Social Progress Imperative 2015Social Progress Index 2015 | © Social Progress Imperative 2015
Europe
Fifteen of the top 20 countries on the Social Progress Index are European. Norway (1st), Sweden (2nd), Switzerland (3rd), and Iceland (4th) lead the region and world. The Nordic countries, culturally progressive with strong social safety nets, are the highest performing area within Europe, with all countries scoring among the top 10 countries in the Index and leading the world in nearly every component. The bottom seven countries in the broad region are all former Soviet Union states: Azerbaijan (76th), Russia (71st), Moldova (70th), Belarus (66th), Ukraine (62nd), Armenia (61st), and Georgia (60th). Luxembourg and Malta do not have sufficient data for an overall Social Progress Index score, but do have scores for many components.
If the 28 countries of the European Union were one country8, they would score 80.78 and would rank 22nd, just below France and just above the Czech Republic The EU-15 countries that preceded the post-2000 enlargement would rank 18th with a score of 82.21, while the new 13 countries as a group would score only 75.33 and rank 32nd in the world. There is generally strong consistency in the scoring and trends within the groups of 15 and 13, but there are also some significant divergences.
Slovenia, Czech Republic, Estonia, Slovakia, and Poland all record higher Social Progress Index scores than Italy (31st). Slovenia (19th) outperforms Spain (20th) and France (21st). Greece, an EU-15 country, performs more like an EU-13 country. This weak performance is not explained by the current economic crisis in Greece, as we discuss further in Chapter 4.
All countries in the European Union and EFTA9 outperform non-EU European countries with the exception of Romania, which trails Serbia and Montenegro. Better EU performance is especially notable in Personal Rights, Personal Freedom and Choice, and Tolerance and Inclusion, which are important issues that countries acceding to the EU need to address. Newer members of the EU such as Romania and Bulgaria lag significantly behind their EU peers.
8 Excluding Luxembourg and Malta, which do not have sufficient data to calculate an overall Social Progress Index score.9 The European Free Trade Association (EFTA) is an intergovernmental organization set up for the promotion of free trade and economic inte-gration to the benefit of its four Member States: Iceland, Liechtenstein, Norway, and Switzerland. All countries but Liechtenstein are included in the Social Progress Index.
Countries: 44*
Social Progress Index
Best: Norway, 88.36 Bottom: Azerbaijan, 62.62 Region Average: 76.16
Basic Human Needs
Best: Denmark, 96.03 Bottom: Russia, 74.10 Region Average: 87.73
Foundations of Wellbeing
Best: Norway, 88.46 Bottom: Ukraine, 61.74 Region Average: 75.81
Opportunity
Best: Ireland, 83.97 Bottom: Bosnia and Herzegovina, 42.33 Region Average: 65.54
*2 with partial data only
EUROPE
CHAPTER 2 / SOCIAL PROGRESS INDEX 2015 RESULTS

53Social Progress Index 2015 | © Social Progress Imperative 2015Social Progress Index 2015 | © Social Progress Imperative 2015
The UK stands out in Europe with a high score on the Opportunity dimension, particularly in the area of Personal Rights and Access to Advanced Education. Italy, on the other hand, performs relatively poorly on Opportunity with low scores on Personal Freedom and Choice and Access to Advanced Education. Italy also ranks lowest among European Union countries on Personal Safety. France and Germany score much better on Basic Human Needs and Foundations of Wellbeing than Opportunity. Both are brought down by Tolerance and Inclusion. Spain outperforms most large EU countries in Tolerance and Inclusion, but performs particularly poorly in Ecosystem Sustainability.
The Social Progress Index data reveals clearly the diverging fortunes of the European countries that made up the former Soviet Union. Estonia (23rd) is the best performer of this group. Latvia (33rd) and Lithuania (35th) are further behind but have still achieved a level of social progress close to that of Greece and well ahead of Russia (71st). These differences in social progress performance cannot be explained by economic development alone. Russia’s social progress lags behind Georgia, Armenia, Ukraine, Belarus, and Moldova, despite Russia’s significantly higher GDP per capita. In part these differences reflect different starting positions – not all Soviet Republics had a similar level of development – but the data suggests that these countries have been on very different social progress trajectories over the last 20 years, with the Baltic republics that acceded to the EU doing the best.
The former communist countries of this region score well on Access to Basic Knowledge and Access to Advanced Education. However, they show particularly poor performance in Opportunity, especially Russia, Belarus, and Azerbaijan. One of the most striking findings in the Social Progress Index data is the poor performance of all the former communist countries on Health and Wellness, particularly former Soviet Republics. Even the former communist countries of the European Union score far below the rest of the EU on Health and Wellness. The legacy of communism in terms of unhealthy lifestyles and poor environmental performance has been difficult to reverse.
Turkey outperforms most former communist (EU and non-EU) on Health and Wellness, but lags on Personal Safety, Access to Information and Communications, and the Opportunity dimension.
Figure 2.5 / Social Progress in Europe
62 64 66 68 70 72 74 76 78 80 82 84 86 88
Social Progress Index
EuropeanUnion+
non-EUEurope UKR TUR
SWESVN
SVK
SRBRUS
ROU
PRT
POL NORNLD
MNEMKD
MDA
LVA
ITALTU
ISLIRL
HUN
HRV GRC
GEO
GBR
FINFRA
DNK
ESPEST DEU
CZECYP CHE
BIH
BLR
BGR BEL
AZE
AUT
ARM ALB
CHAPTER 2 / SOCIAL PROGRESS INDEX 2015 RESULTS
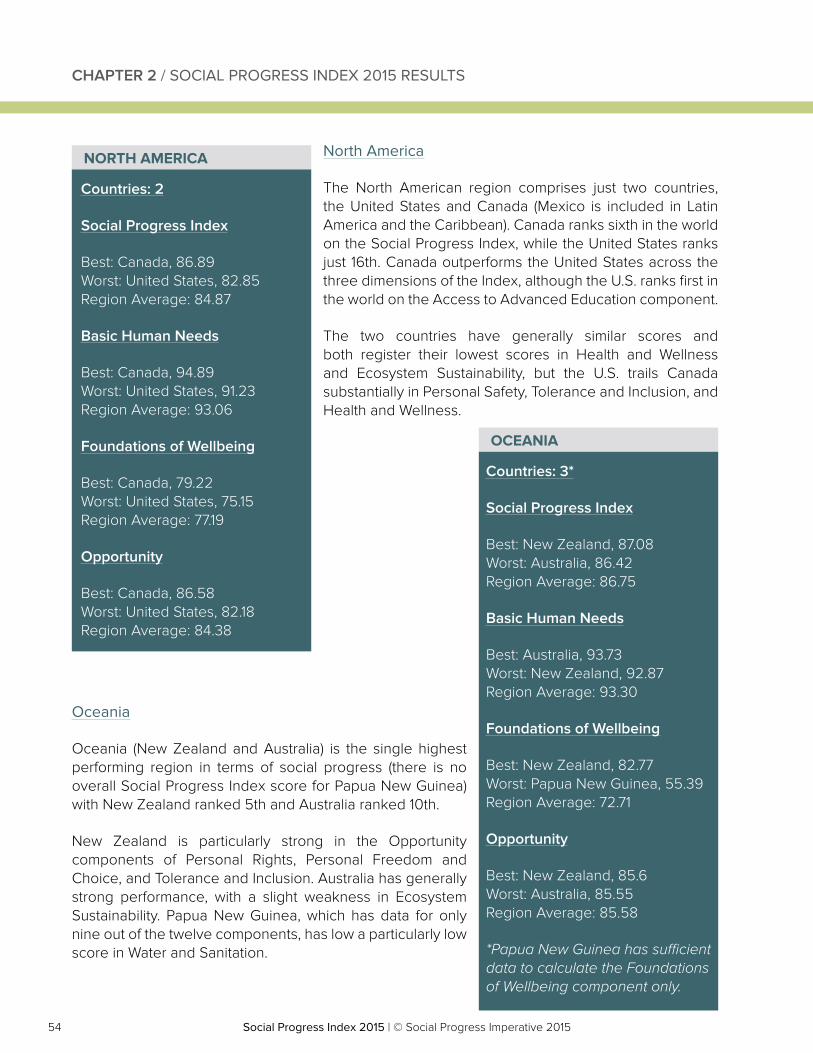
54 Social Progress Index 2015 | © Social Progress Imperative 2015Social Progress Index 2015 | © Social Progress Imperative 2015
North America
The North American region comprises just two countries, the United States and Canada (Mexico is included in Latin America and the Caribbean). Canada ranks sixth in the world on the Social Progress Index, while the United States ranks just 16th. Canada outperforms the United States across the three dimensions of the Index, although the U.S. ranks first in the world on the Access to Advanced Education component.
The two countries have generally similar scores and both register their lowest scores in Health and Wellness and Ecosystem Sustainability, but the U.S. trails Canada substantially in Personal Safety, Tolerance and Inclusion, and Health and Wellness.
Oceania
Oceania (New Zealand and Australia) is the single highest performing region in terms of social progress (there is no overall Social Progress Index score for Papua New Guinea) with New Zealand ranked 5th and Australia ranked 10th.
New Zealand is particularly strong in the Opportunity components of Personal Rights, Personal Freedom and Choice, and Tolerance and Inclusion. Australia has generally strong performance, with a slight weakness in Ecosystem Sustainability. Papua New Guinea, which has data for only nine out of the twelve components, has low a particularly low score in Water and Sanitation.
Countries: 2
Social Progress Index
Best: Canada, 86.89 Worst: United States, 82.85 Region Average: 84.87
Basic Human Needs
Best: Canada, 94.89 Worst: United States, 91.23 Region Average: 93.06
Foundations of Wellbeing
Best: Canada, 79.22 Worst: United States, 75.15 Region Average: 77.19
Opportunity
Best: Canada, 86.58 Worst: United States, 82.18 Region Average: 84.38
NORTH AMERICA
Countries: 3*
Social Progress Index
Best: New Zealand, 87.08 Worst: Australia, 86.42 Region Average: 86.75
Basic Human Needs
Best: Australia, 93.73 Worst: New Zealand, 92.87 Region Average: 93.30
Foundations of Wellbeing
Best: New Zealand, 82.77 Worst: Papua New Guinea, 55.39 Region Average: 72.71
Opportunity
Best: New Zealand, 85.6 Worst: Australia, 85.55 Region Average: 85.58
*Papua New Guinea has sufficient data to calculate the Foundations of Wellbeing component only.
OCEANIA
CHAPTER 2 / SOCIAL PROGRESS INDEX 2015 RESULTS
55Social Progress Index 2015 | © Social Progress Imperative 2015Social Progress Index 2015 | © Social Progress Imperative 2015
Latin America & the Caribbean
The best performing countries in Latin America on the Social Progress Index are Uruguay (24th), Chile (26th), and Costa Rica (28th); the worst performing are Guyana (87th), Cuba (84th), and Honduras (82nd). Belize, Haiti, Suriname, and Trinidad and Tobago only have sufficient data coverage to calculate some of the Social Progress Index components. Overall, South America significantly outperforms Central America, and both outperform the Caribbean.
While each Latin American country has its own strengths and weaknesses, it is interesting to note that Latin American countries as a group tend to have relatively balanced social progress portfolios compared to other regions. At least in part, this balance reflects some common investments across Latin America in social progress. Government and civil society have worked to largely eradicate extreme hunger or homelessness, and provide access to primary and secondary education. And, relative to many other areas of the world, there has been a significant shift towards choices enhancing Opportunity, including a commitment to personal rights as well as broad tolerance.
Despite this, Latin American countries on the whole lag with Personal Safety and Access to Advanced Education compared to other regions, with Venezuela having the lowest score in Personal Safety and Haiti the lowest score in Access to Advanced Education.
Uruguay, Chile, and Costa Rica stand out with particularly strong scores in the Opportunity dimension. Uruguay, Chile, and Costa Rica are among the top countries in the world, with Jamaica and Brazil also ranking very high. Cuba, on the other hand, ranks lowest in the world on Personal Rights. Venezuela is the next lowest in Personal Rights in the region.
Long-term development problems, chronic instability and the devastating earthquake have led Haiti to be an extreme outlier in Basic Human Needs in the region, scoring nearly 30 points below the next lowest country, the Dominican Republic. Globally, Haiti ranks above only Sierra Leone, Chad, and Central African Republic in this dimension.
After decades of isolation, Cuba unsurprisingly scores very low on Access to Information and Communications, ranking not only lowest in the region but above only Djibouti globally. At the same time, it achieves high scores in the Basic Human Needs dimension, ranking first in the region in Personal Safety, second in Nutrition and Basic Medical Care, and second in Access to Basic Knowledge.
Countries: 25*
Social Progress Index
Best: Uruguay, 79.21 Worst: Guyana, 60.42 Region Average: 67.65
Basic Human Needs
Best: Chile, 86.32 Worst: Haiti, 36.02 Region Average: 71.32
Foundations of Wellbeing
Best: Costa Rica, 78.83 Worst: Cuba, 60.51 Region Average: 72.12
Opportunity
Best: Uruguay, 76.41 Worst: Haiti, 36.89 Region Average: 57.24
*4 countries with partial data only
LATIN AMERICA & CARIBBEAN
CHAPTER 2 / SOCIAL PROGRESS INDEX 2015 RESULTS
56 Social Progress Index 2015 | © Social Progress Imperative 2015Social Progress Index 2015 | © Social Progress Imperative 2015
East Asia & Pacific
The East Asia & Pacific region spans a large geography and includes countries of vastly different size, economic development, institutional development, and political organization. Accordingly, it displays an especially wide variation in social progress, with high performing Japan (15th) and South Korea (29th) to low performing Myanmar (119th), Laos (102nd), and Cambodia (99th). Singapore, Timor-Leste, and Vietnam do not have sufficient data to calculate an overall Social Progress Index score.
The one component that shows similarity across the region is Health and Wellness, where East Asia and the Pacific scores high compared to other regions. Japan has the longest life expectancy globally, although Singapore leads on the Health and Wellness component overall in the region. Vietnam and Japan also perform well in the component. China, Myanmar, and Laos trail the rest of the region.
Performance is most varied in the Personal Rights component, with Japan scoring very high, twenty points above the next country in the region, Timor-Leste. On the other extreme, restrictive political systems place China, Myanmar, Vietnam, and Laos near the bottom of all countries globally. Relatedly, Myanmar and Laos also significantly lag the rest of the region in Access to Information and Communications.
There is also wide variation in the Tolerance and Inclusion component, though no countries in the region score high in this component. Singapore leads the region. Myanmar, Indonesia, and China register the lowest scores.
Countries: 13*
Social Progress Index
Best: Japan, 83.15 Worst: Myanmar, 46.12 Region Average: 63.42
Basic Human Needs
Best: Japan, 95.01 Worst: Timor-Leste, 50.55 Region Average: 71.03
Foundations of Wellbeing
Best: Japan, 78.78 Worst: Myanmar, 49.19 Region Average: 67.56
Opportunity
Best: Japan, 75.66 Worst: Myanmar, 30.28 Region Average: 49.20
*3 countries with partial data only
EAST ASIA & PACIFIC
CHAPTER 2 / SOCIAL PROGRESS INDEX 2015 RESULTS
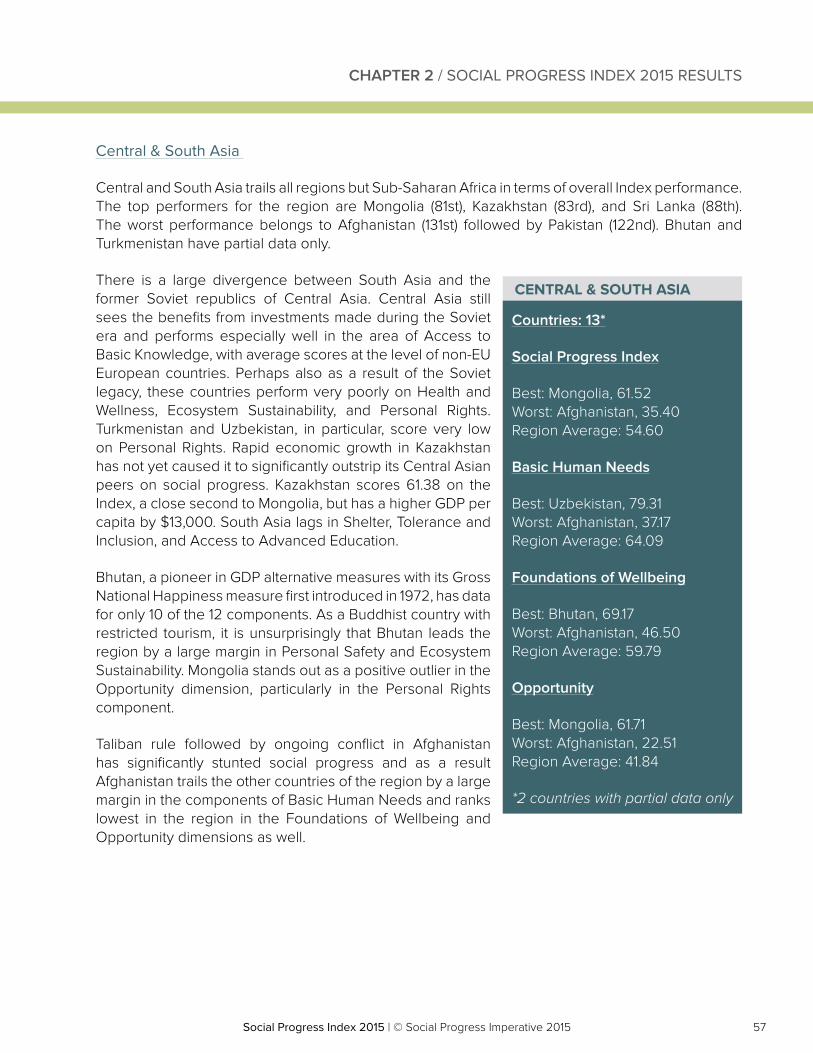
57Social Progress Index 2015 | © Social Progress Imperative 2015Social Progress Index 2015 | © Social Progress Imperative 2015
Central & South Asia
Central and South Asia trails all regions but Sub-Saharan Africa in terms of overall Index performance. The top performers for the region are Mongolia (81st), Kazakhstan (83rd), and Sri Lanka (88th). The worst performance belongs to Afghanistan (131st) followed by Pakistan (122nd). Bhutan and Turkmenistan have partial data only.
There is a large divergence between South Asia and the former Soviet republics of Central Asia. Central Asia still sees the benefits from investments made during the Soviet era and performs especially well in the area of Access to Basic Knowledge, with average scores at the level of non-EU European countries. Perhaps also as a result of the Soviet legacy, these countries perform very poorly on Health and Wellness, Ecosystem Sustainability, and Personal Rights. Turkmenistan and Uzbekistan, in particular, score very low on Personal Rights. Rapid economic growth in Kazakhstan has not yet caused it to significantly outstrip its Central Asian peers on social progress. Kazakhstan scores 61.38 on the Index, a close second to Mongolia, but has a higher GDP per capita by $13,000. South Asia lags in Shelter, Tolerance and Inclusion, and Access to Advanced Education.
Bhutan, a pioneer in GDP alternative measures with its Gross National Happiness measure first introduced in 1972, has data for only 10 of the 12 components. As a Buddhist country with restricted tourism, it is unsurprisingly that Bhutan leads the region by a large margin in Personal Safety and Ecosystem Sustainability. Mongolia stands out as a positive outlier in the Opportunity dimension, particularly in the Personal Rights component.
Taliban rule followed by ongoing conflict in Afghanistan has significantly stunted social progress and as a result Afghanistan trails the other countries of the region by a large margin in the components of Basic Human Needs and ranks lowest in the region in the Foundations of Wellbeing and Opportunity dimensions as well.
Countries: 13*
Social Progress Index
Best: Mongolia, 61.52 Worst: Afghanistan, 35.40 Region Average: 54.60
Basic Human Needs
Best: Uzbekistan, 79.31 Worst: Afghanistan, 37.17 Region Average: 64.09
Foundations of Wellbeing
Best: Bhutan, 69.17 Worst: Afghanistan, 46.50 Region Average: 59.79
Opportunity
Best: Mongolia, 61.71 Worst: Afghanistan, 22.51 Region Average: 41.84
*2 countries with partial data only
CENTRAL & SOUTH ASIA
CHAPTER 2 / SOCIAL PROGRESS INDEX 2015 RESULTS
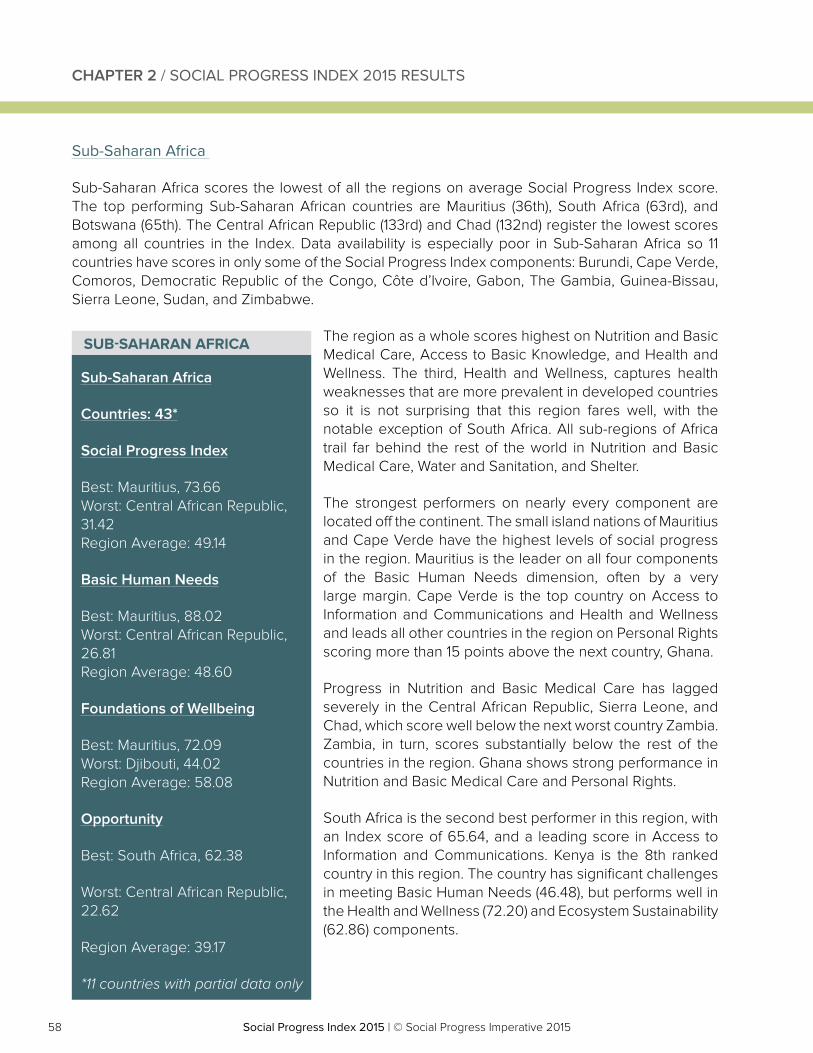
58 Social Progress Index 2015 | © Social Progress Imperative 2015Social Progress Index 2015 | © Social Progress Imperative 2015
Sub-Saharan Africa
Sub-Saharan Africa scores the lowest of all the regions on average Social Progress Index score. The top performing Sub-Saharan African countries are Mauritius (36th), South Africa (63rd), and Botswana (65th). The Central African Republic (133rd) and Chad (132nd) register the lowest scores among all countries in the Index. Data availability is especially poor in Sub-Saharan Africa so 11 countries have scores in only some of the Social Progress Index components: Burundi, Cape Verde, Comoros, Democratic Republic of the Congo, Côte d’Ivoire, Gabon, The Gambia, Guinea-Bissau, Sierra Leone, Sudan, and Zimbabwe.
The region as a whole scores highest on Nutrition and Basic Medical Care, Access to Basic Knowledge, and Health and Wellness. The third, Health and Wellness, captures health weaknesses that are more prevalent in developed countries so it is not surprising that this region fares well, with the notable exception of South Africa. All sub-regions of Africa trail far behind the rest of the world in Nutrition and Basic Medical Care, Water and Sanitation, and Shelter.
The strongest performers on nearly every component are located off the continent. The small island nations of Mauritius and Cape Verde have the highest levels of social progress in the region. Mauritius is the leader on all four components of the Basic Human Needs dimension, often by a very large margin. Cape Verde is the top country on Access to Information and Communications and Health and Wellness and leads all other countries in the region on Personal Rights scoring more than 15 points above the next country, Ghana.
Progress in Nutrition and Basic Medical Care has lagged severely in the Central African Republic, Sierra Leone, and Chad, which score well below the next worst country Zambia. Zambia, in turn, scores substantially below the rest of the countries in the region. Ghana shows strong performance in Nutrition and Basic Medical Care and Personal Rights.
South Africa is the second best performer in this region, with an Index score of 65.64, and a leading score in Access to Information and Communications. Kenya is the 8th ranked country in this region. The country has significant challenges in meeting Basic Human Needs (46.48), but performs well in the Health and Wellness (72.20) and Ecosystem Sustainability (62.86) components.
Sub-Saharan Africa
Countries: 43*
Social Progress Index
Best: Mauritius, 73.66 Worst: Central African Republic, 31.42 Region Average: 49.14
Basic Human Needs
Best: Mauritius, 88.02 Worst: Central African Republic, 26.81 Region Average: 48.60
Foundations of Wellbeing
Best: Mauritius, 72.09 Worst: Djibouti, 44.02 Region Average: 58.08
Opportunity
Best: South Africa, 62.38
Worst: Central African Republic, 22.62
Region Average: 39.17
*11 countries with partial data only
SUB-SAHARAN AFRICA
CHAPTER 2 / SOCIAL PROGRESS INDEX 2015 RESULTS
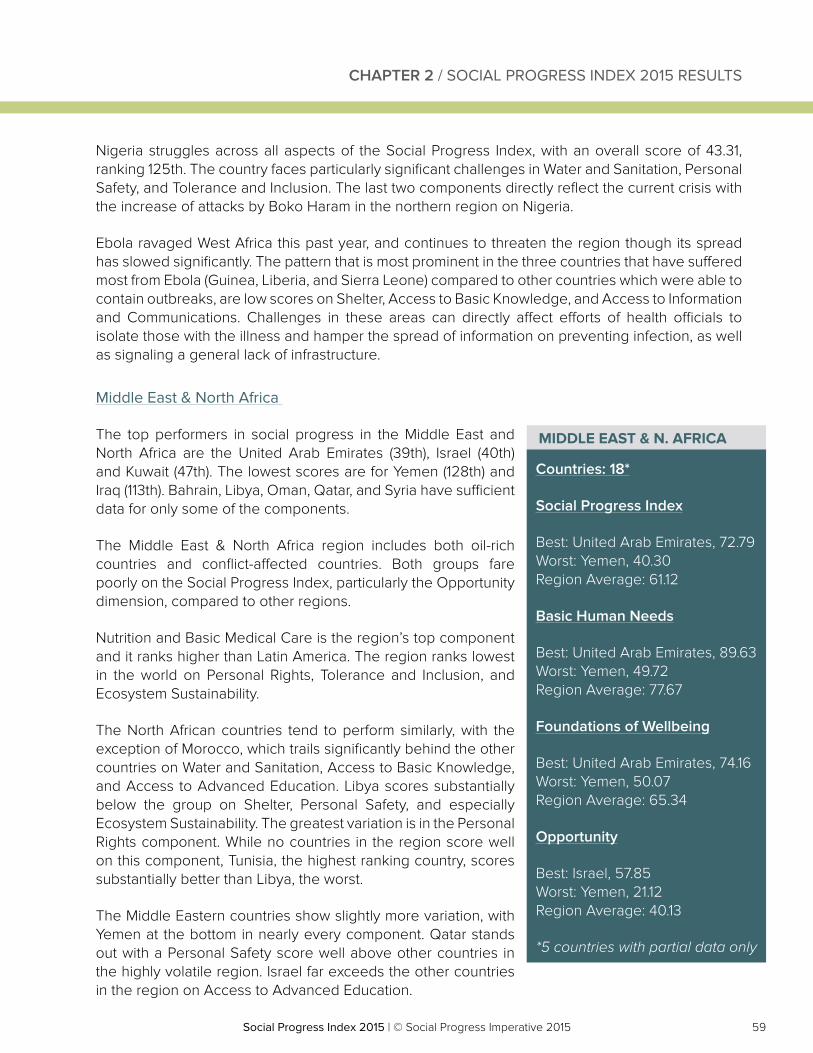
59Social Progress Index 2015 | © Social Progress Imperative 2015Social Progress Index 2015 | © Social Progress Imperative 2015
Nigeria struggles across all aspects of the Social Progress Index, with an overall score of 43.31, ranking 125th. The country faces particularly significant challenges in Water and Sanitation, Personal Safety, and Tolerance and Inclusion. The last two components directly reflect the current crisis with the increase of attacks by Boko Haram in the northern region on Nigeria.
Ebola ravaged West Africa this past year, and continues to threaten the region though its spread has slowed significantly. The pattern that is most prominent in the three countries that have suffered most from Ebola (Guinea, Liberia, and Sierra Leone) compared to other countries which were able to contain outbreaks, are low scores on Shelter, Access to Basic Knowledge, and Access to Information and Communications. Challenges in these areas can directly affect efforts of health officials to isolate those with the illness and hamper the spread of information on preventing infection, as well as signaling a general lack of infrastructure.
Middle East & North Africa
The top performers in social progress in the Middle East and North Africa are the United Arab Emirates (39th), Israel (40th) and Kuwait (47th). The lowest scores are for Yemen (128th) and Iraq (113th). Bahrain, Libya, Oman, Qatar, and Syria have sufficient data for only some of the components.
The Middle East & North Africa region includes both oil-rich countries and conflict-affected countries. Both groups fare poorly on the Social Progress Index, particularly the Opportunity dimension, compared to other regions.
Nutrition and Basic Medical Care is the region’s top component and it ranks higher than Latin America. The region ranks lowest in the world on Personal Rights, Tolerance and Inclusion, and Ecosystem Sustainability.
The North African countries tend to perform similarly, with the exception of Morocco, which trails significantly behind the other countries on Water and Sanitation, Access to Basic Knowledge, and Access to Advanced Education. Libya scores substantially below the group on Shelter, Personal Safety, and especially Ecosystem Sustainability. The greatest variation is in the Personal Rights component. While no countries in the region score well on this component, Tunisia, the highest ranking country, scores substantially better than Libya, the worst.
The Middle Eastern countries show slightly more variation, with Yemen at the bottom in nearly every component. Qatar stands out with a Personal Safety score well above other countries in the highly volatile region. Israel far exceeds the other countries in the region on Access to Advanced Education.
Countries: 18*
Social Progress Index
Best: United Arab Emirates, 72.79 Worst: Yemen, 40.30 Region Average: 61.12
Basic Human Needs
Best: United Arab Emirates, 89.63 Worst: Yemen, 49.72 Region Average: 77.67
Foundations of Wellbeing
Best: United Arab Emirates, 74.16 Worst: Yemen, 50.07 Region Average: 65.34
Opportunity
Best: Israel, 57.85 Worst: Yemen, 21.12 Region Average: 40.13
*5 countries with partial data only
MIDDLE EAST & N. AFRICA
CHAPTER 2 / SOCIAL PROGRESS INDEX 2015 RESULTS
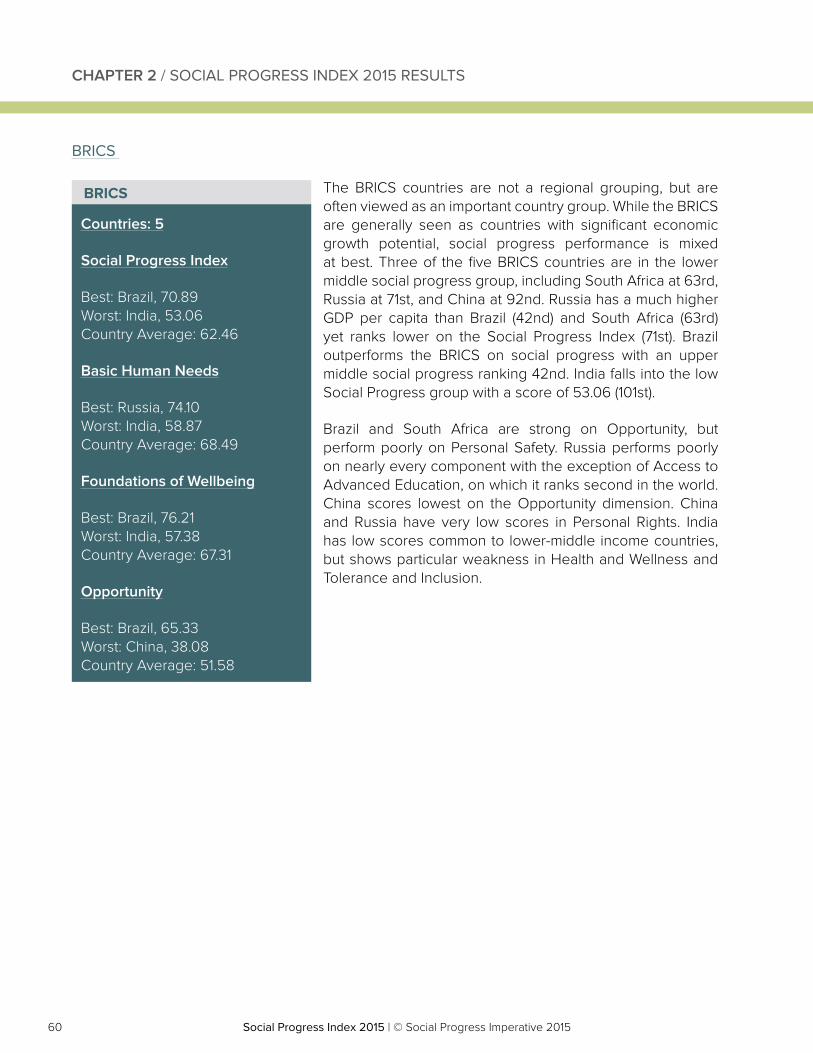
60 Social Progress Index 2015 | © Social Progress Imperative 2015Social Progress Index 2015 | © Social Progress Imperative 2015
BRICS
The BRICS countries are not a regional grouping, but are often viewed as an important country group. While the BRICS are generally seen as countries with significant economic growth potential, social progress performance is mixed at best. Three of the five BRICS countries are in the lower middle social progress group, including South Africa at 63rd, Russia at 71st, and China at 92nd. Russia has a much higher GDP per capita than Brazil (42nd) and South Africa (63rd) yet ranks lower on the Social Progress Index (71st). Brazil outperforms the BRICS on social progress with an upper middle social progress ranking 42nd. India falls into the low Social Progress group with a score of 53.06 (101st).
Brazil and South Africa are strong on Opportunity, but perform poorly on Personal Safety. Russia performs poorly on nearly every component with the exception of Access to Advanced Education, on which it ranks second in the world. China scores lowest on the Opportunity dimension. China and Russia have very low scores in Personal Rights. India has low scores common to lower-middle income countries, but shows particular weakness in Health and Wellness and Tolerance and Inclusion.
Countries: 5
Social Progress Index
Best: Brazil, 70.89 Worst: India, 53.06 Country Average: 62.46
Basic Human Needs
Best: Russia, 74.10 Worst: India, 58.87 Country Average: 68.49
Foundations of Wellbeing
Best: Brazil, 76.21 Worst: India, 57.38 Country Average: 67.31
Opportunity
Best: Brazil, 65.33 Worst: China, 38.08 Country Average: 51.58
BRICS
CHAPTER 2 / SOCIAL PROGRESS INDEX 2015 RESULTS
61Social Progress Index 2015 | © Social Progress Imperative 2015Social Progress Index 2015 | © Social Progress Imperative 2015
CHAPTER 2 / SOCIAL PROGRESS INDEX 2015 RESULTS
MEASURING ECOSYSTEM SUSTAINABILITY
By Clive Bates, Ecosystem Sustainability Adviser
Confucius said, “life is really simple, but we insist on making it complicated.” But Confucius didn’t have to compile the Ecosystem Sustainability component of the Social Progress Index. The challenge is to take something as complex as the natural environment and our multifaceted interactions with it, and to characterise its impact on social progress in just three numbers. The Ecosystem Sustainability component captures climate change, water resources, and biodiversity and habitats.
Atmosphere – greenhouse gas emissions
The index uses greenhouse gas emissions per unit of GDP, or ‘emissions intensity’, an indicator of how efficiently an economy uses a shared atmospheric carbon sink, though not of whether it is overusing it. An emissions per capita measure was rejected because low scores would tend to reflect poverty more than social progress. However, emissions intensity also has several challenges. A country like Qatar has exceedingly high emissions, but much of this arises from its petrochemical and liquefied natural gas industries producing products for export and use in other nations. One option is to use consumption-based measurements of emissions, adjusting for ‘embodied emissions’ in imported and exported goods. For now, data availability remains a barrier to consumption-based measures. In any case it might be reasonable to penalise carbon intensive exporters as that activity may become unsustainable with increasing international efforts to control greenhouse gases. Rich economies gain benefit from importing energy-intensive goods without the emissions that go with them. They also tend to have a higher proportion of their economic activity in services, which have relatively low emissions. Their emission intensity may be lower simply because they are richer and consume more services, not because they have adjusted to more efficient and sustainable energy system. One option to address that would be to estimate a frontier of emissions intensities for economies of different levels of prosperity and measure each country’s performance relative to the frontier. For now we consider that too complicated and arbitrary. Finally, air quality, is an important foundation of wellbeing, and a critical challenge in many emerging mega-cities, and it is included in the health and wellness component.
Water resources – baseline water stress
For water, the index focuses on basic water stress – the ratio of annual demand for water to the annual renewable water supply. While it is a solid good baseline measure, there is much additional complexity in assessing water resources. For example, inter-annual and inter-seasonal variability can present real shortages – a sustainable annual average might conceal an abundance in. winter and shortage in summer, a problem that can be addressed through storage to buffer irregular flows over different timescales. A further water-related aspect of wellbeing is resilience or vulnerability to extreme events such as droughts and floods, which can be managed and mitigated with infrastructure investment. Water quality is also a factor, but not yet part of the index. Excessive abstraction can reduce flows and increase concentrations of pollutants entering the water, while excessive pollution can limit the uses of untreated water and spread disease. The overall index therefore captures both the sustainable management of water and the extent to which society has put it to use in meeting basic needs: access to water supply and sanitation is addressed as part of the Basic Human Needs dimension.
Biodiversity and habitat – focus on protected areas
The index assesses biodiversity and habitat status using data on the proportion of sensitive ecosystems covered by legally designated protected area status. The protection of habitats and biodiversity is a proxy for numerous valuable provisioning, regulating and cultural ‘ecosystem services’ that terrestrial and marine ecosystems provide to humans. The challenge is that the extent of protected areas is an intermediate process measure, rather than an outcome. The outcomes depend on the threats to important biodiversity and habitats, what protective action is actually taken and what happens as a result. The continued advance of remote sensing and the development of better techniques opens the possibility of better outcome measures, but this is not yet in a synthesised form we can use in the index. Finally, we have not addressed other aspects of land use that matter to social progress, like the public realm, or how well spatial planning allocates land for social and economic uses like housing, leisure, infrastructure or industry.
62 Social Progress Index 2015 | © Social Progress Imperative 2015Social Progress Index 2015 | © Social Progress Imperative 2015
LEISURE TIME AND ITS MEASUREMENT
By Patrick O’Sullivan, Grenoble Ecole de Management and University of Warsaw
Among the elements contributing to human well-being which are not captured in any way in GDP and therefore need to be integrated into an appropriately comprehensive measure of social progress, one of the most obvious is the amount of leisure time available to people. However developing an accurate measure of leisure time enjoyed turns out to be extremely challenging both in terms of the conceptualisation of what precisely we are trying to measure and in terms of getting sufficiently accurate data across the range of countries.
Classic economic analysis of the labour supply considers any time not spent working to be leisure time. But some of this time outside of formal work may be devoted to unpaid informal work or to home production of various kinds (including most obviously child care but also for example family farm work in the agricultural sector). These are just other forms of work and should not be considered to be leisure. Also, should sleeping and eating be considered to be a source of happiness or to contribute to a sense of human well-being? Should work time be considered as all “bad” or burdensome and leisure time by contrast as all “good” or fulfilling? In fact for many people, working time is a source of self-satisfaction; while people seeking work may not be happy with the leisure time that unemployment brings.
Even if the minefield of conceptual problems and implicit value judgments can be navigated (and we believe that ultimately that it can), measuring leisure time creates additional challenges. Broadly speaking there have been two approaches to measurement: a macro approach and a micro approach.
In a macro approach, an estimate is made of the total hours worked by the employed population and this is subtracted from the total hours in a year available to that self-same employed population to arrive at an estimate of the total leisure time.a Apart from the obvious limitation that the estimate covers only the employed population and so excludes the leisure class or people not in the work force, non-paid work and home production of all kinds are being counted as leisure as also are sleeping, eating and other personal care time (although these are arguably eligible to be included to some extent in a broad measure of leisure time).
An alternative approach to leisure measurement is the micro approach based on time use studies.b In these studies, data are collected on the detailed allocation of the 24 hours per day available to all people between categories which typically includec formally paid work time and/or study time; unpaid work; personal care; pure leisure time (includes sport, hobbies, attending cultural and sporting events, socialising, watching TV, reading or internet surfing etc); and a small residual “other time use” which includes anything not elsewhere captured (religious observance for example). Such studies can give us a much more detailed and indeed extremely interesting picture of people’s time usage and leisure, even if there remain some conceptual problems about which of the above elements we may want to count as leisure for purposes of measuring social progress. Unfortunately, detailed time use surveys exist for only a very limited number of countries. Even within the OECD, they exist in a reliable form for only 18 of the 30 member states.d
The crucial observation already emerges, however, that there are significant differences in leisure time whether a broad or a narrow definition is used. Hence it is important that for a fully comprehensive measure of social progress we continue to work towards an integration of an appropriate measure of leisure time.
a For an acknowledgement of the limitations of the residual approach, see for example OECD (2009) « Society at a glance 2009: OECD Social Indicators” OECD, Paris– ISBN 978-92-64-04938-3. See chapter 2, especially page 22, and passim.
b These have quite a venerable even if slightly non-mainstream heritage within Economics going back to the early studies of Gary Becker on the microeconomic decisions of individuals regarding the allocation of their time. The locus classicus is of course BECKER, G S, (1965) “A Theory of the Allocation of Time” in The Economic Journal, 75(299) 493-517
CHAPTER 2 / SOCIAL PROGRESS INDEX 2015 RESULTS
63Social Progress Index 2015 | © Social Progress Imperative 2015Social Progress Index 2015 | © Social Progress Imperative 2015
TRENDS IN SOCIAL PROGRESS
Measuring social progress over time is a top priority of the Social Progress Index. In order to compare 2015 results to 2014 results, we created a restated 2014 index, which incorporates minor methodological revisions and restated data from sources. Much like GDP or the Human Development Index, the Social Progress Index will continue to be updated over time and as new data becomes available or data is retroactively changed by the source we will restate our past indexes in order to provide the best measurement possible with a comparable history. Appendix C displays the 2015 and 2014 restated index scores for the 133 countries with complete data.
The key finding from comparing the two indices is that the broad patterns are consistent, showing robustness in the methodology. However, we caution against putting too much stock in year-to-year Index comparison. While some data in the Index changes from year to year, many indicators are updated less frequently. Therefore, a two-year comparison will show only small changes and there is a risk of noise in a single year change measurement. Trends in progress will become clearer as more time-series data is added.
CONCLUSION
The Social Progress Index, based exclusively on indicators of social and environmental outcomes, offers a revealing picture of countries’ levels of development that is independent of traditional economic measures. It shows that countries experience widely differing patterns of social progress and huge differences in social progress achieved by dimensions and components.
Countries at all levels of development can use this data to assess their performance and set priorities for improvement. Most countries will be able to identify specific areas of relative strength, and these are social progress foundations upon which they can build. At the same time, every country exhibits areas of relative and absolute weakness, and identifying these are areas for prioritization and investment. At the same time, setting a social progress agenda will depend on, among other factors, the level of resources available in an economy, and the relationship between Social Progress Index and traditional measures of economic development. In general terms, the Index reveals that richer countries tend to achieve higher social progress than poorer countries. Yet our discussion of individual countries and regions also suggests that this relationship is neither simple nor linear. We therefore explore this issue in depth in the next chapter.
CHAPTER 2 / SOCIAL PROGRESS INDEX 2015 RESULTS

64 Social Progress Index 2015 | © Social Progress Imperative 2015Social Progress Index 2015 | © Social Progress Imperative 2015
65Social Progress Index 2015 | © Social Progress Imperative 2015Social Progress Index 2015 | © Social Progress Imperative 2015
CHAPTER 3SOCIAL PROGRESS AND ECONOMIC DEVELOPMENT
66 Social Progress Index 2015 | © Social Progress Imperative 2015Social Progress Index 2015 | © Social Progress Imperative 2015
CHAPTER 3 / SOCIAL PROGRESS AND ECONOMIC DEVELOPMENT
67Social Progress Index 2015 | © Social Progress Imperative 2015Social Progress Index 2015 | © Social Progress Imperative 2015
SOCIAL PROGRESS AND ECONOMIC DEVELOPMENT
A central objective of the Social Progress Index is to provide the foundation for a better understanding of the relationship between social progress and economic development. The Social Progress Index allows an analysis of how social progress is correlated with measures of economic success, and how this relationship varies by dimension, component, and indicator for various groupings of countries. Overall, the Social Progress Index allows us to evaluate the effectiveness or lack of effectiveness with which a country’s economic success is turned into social progress. The Social Progress Index is a powerful tool for understanding contemporary debates about inclusive growth.
The deficiencies of traditional national income measures, such as GDP, in capturing the true progress of societies have been well documented in reports such as Mismeasuring Our Lives. On the other hand, the evidence of the last half century tells a largely positive story about how economic development has played a crucial role in advancing social progress in terms reducing poverty. The question of when and how economic development advances social progress (and when and how it does not), has been made more poignant by social unrest in relatively prosperous countries, the growing debate about environmental limits to growth, and concerns about inequality. Inclusive growth, rather than growth at all costs, has become a widely-accepted priority for international organizations such as the United Nations, World Bank, as well as for national governments. Yet inclusive growth, or shared prosperity as it is sometimes known, has proven hard to define.
We believe that inclusive growth is the combination of economic and social progress. Social progress is a broad measure of social and environmental performance. Income inequality per se is at best a crude measure of inclusive growth, fraught with complexities (see Chapter 5 for a more in-depth discussion of the relationship between social progress and economic inequality). In contrast, growth that goes hand-in-hand with widely meeting basic needs, improving the foundations for wellbeing, and creating opportunity is what societies should truly care about. Here, citizens have the freedom, access to tools, and opportunity to pursue whatever level of income they seek.
The Social Progress Index, by separating the measurement of social performance from that of economic performance, allows a rigorous empirical understanding of the relationship between economic development and social progress. It can also inform our understanding of how social progress can drive economic growth. We believe that there are important choices in development between economic development and social progress, and there may be trade-offs, at least for a period of time. For example, a development (and investment) path yielding lower economic growth in the short term may be preferable if it enables greater social progress, and if that social progress supports more robust economic growth over the longer term. Understanding these choices and dynamics is a priority for our ongoing research.
In this chapter, we begin with our findings on the aggregate relationship between Social Progress Index scores and GDP per capita. We then disaggregate that analysis to the dimensions and components of the Social Progress Index model to see how these different aspects of social progress have different relationships with economic development.
CHAPTER 3 / SOCIAL PROGRESS AND ECONOMIC DEVELOPMENT
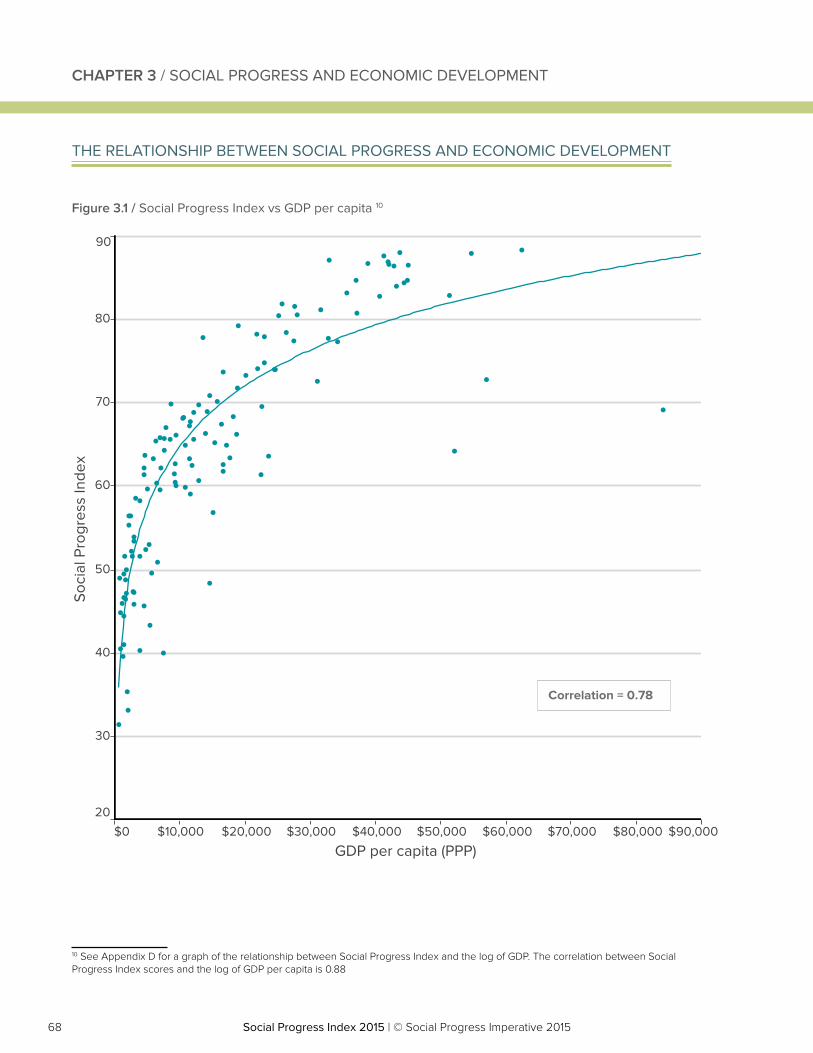
68 Social Progress Index 2015 | © Social Progress Imperative 2015Social Progress Index 2015 | © Social Progress Imperative 2015
THE RELATIONSHIP BETWEEN SOCIAL PROGRESS AND ECONOMIC DEVELOPMENT
10 See Appendix D for a graph of the relationship between Social Progress Index and the log of GDP. The correlation between Social Progress Index scores and the log of GDP per capita is 0.88
CHAPTER 3 / SOCIAL PROGRESS AND ECONOMIC DEVELOPMENT
Figure 3.1 / Social Progress Index vs GDP per capita 10
$0 $10,000 $20,000 $30,000 $40,000 $50,000 $60,000 $70,000 $80,000 $90,000
GDP per capita (PPP)
20
30
40
50
60
70
80
90
Soci
al P
rogr
ess
Inde
x
Correlation = 0.78
69Social Progress Index 2015 | © Social Progress Imperative 2015Social Progress Index 2015 | © Social Progress Imperative 2015
CHAPTER 3 / SOCIAL PROGRESS AND ECONOMIC DEVELOPMENT
Figure 3.1 shows the overall relationship between GDP per capita and overall social progress, a relationship that we have not been able to examine prior to the creation of the Social Progress Index. It reveals several key findings. First, there is a positive but nonlinear relationship between the Social Progress Index and GDP per capita. Countries with higher income tend to have higher social progress: Norway ($62,448 GDP per capita) ranks highest on social progress while the Central African Republic ($584 GDP per capita) ranks lowest.
Second, while the overall relationship is positive (i.e., higher GDP per capita is associated with a higher Social Progress Index score), the relationship between economic development and social progress changes as income rises. At lower income levels, small differences in GDP are associated with large improvements in social progress. As countries reach high levels of income, however, that rate of change slows. Our findings suggest that the easy gains in social progress arising from economic development become exhausted, while economic growth brings new social and environmental challenges.
Despite the correlation between economic progress and social progress, the variability among countries even for a given level of GDP is considerable. Hence, economic performance alone does not fully explain social progress. At any level of GDP per capita there are opportunities for higher social progress and risks of lower social progress. For example, Costa Rica achieves an SPI of 77.88 with a GDP per capita of only $13,431 while Russia, a much larger economy with a GDP per capita of $23,564, only scores 63.64.
There are good reasons to believe that the correlation between economic development and social progress is partly or heavily due to the fact that there are more resources to invest in social issues, in terms of private consumption, private investment, and public investment. However, there may also be a causal relationship in the other direction: better social outcomes in terms of health, education, personal safety, opportunity, and others enable better economic performance. The relationship between economic development and social progress is therefore complex, and causation may go in both directions. Understanding this complex two-way causation is an important agenda for future research.
70 Social Progress Index 2015 | © Social Progress Imperative 2015Social Progress Index 2015 | © Social Progress Imperative 2015
CHANGES FROM 2014
Adjusting for Purchasing Power: 2014 Updates to PPP Ratio
The purchasing power parity (PPP) conversion creates an “international dollar,” which has the same value in all currencies, thereby providing comparability across countries in measuring income. In April 2014, the World Bank released new revised GDP per capita data based on a revision of the PPP ratio. The International Comparison Program of the World Bank updated GDP PPP data to 2011 constant international dollars. The revisions implemented through the International Comparison Program are primarily technical in nature and reflect an attempt to translate domestic indices into GDP statistics that are comparable across a wide range of countries. On net, the revisions have, among other effects, the consequence of increasing the weight associated with more comparable internationally-traded goods, and increasing the estimate of GDP per capita in many less developed countries.*
The revised purchasing power exchange rates result in significantly increased estimated GDP per capita values for nearly every country, but increases were not distributed evenly. The largest percentage changes in GDP per capita due to the PPP ratio revision were in Iraq, Nigeria, Jordan, Kuwait, Indonesia, Guyana, Ghana, and Zambia, and these countries had upward revisions greater than 100%. The largest changes measured in international dollar values were in Kuwait (roughly +$44,000), Saudi Arabia (+$23,000), United Arab Emirates (+$20,000), Norway (+$15,000), and Switzerland (+$12,000). These increases result in all five countries having a GDP per capita above $50,000; previously, no countries in the Index had reached this level. The United States saw a smaller revision in measured GDP (+$5,524) to move above $50,000 as well. Despite changes to the level of GDP per capita for individual countries, the overall relationship between the Social Progress Index and GDP per capita remains qualitatively similar.**
* For more information, see Ravallion, Martin. “An Exploration of the International Comparison Program’s New Global Economic Landscape.” National Bureau of Economic Research No. 20338. 2014. http://econpapers.repec.org/paper/nbrnberwo/20338.htm
** See SPI blog post “What Does Revision of the Purchasing Power Parity (PPP) Ratio Mean for the Social Progress Index?” February 25, 2015. http://www.socialprogressimperative.org/blog/posts/what-does-revision-of-the-purchasing-power-parity-ppp-ratio-mean-for-the-social-progress-index#
CHAPTER 3 / SOCIAL PROGRESS AND ECONOMIC DEVELOPMENT
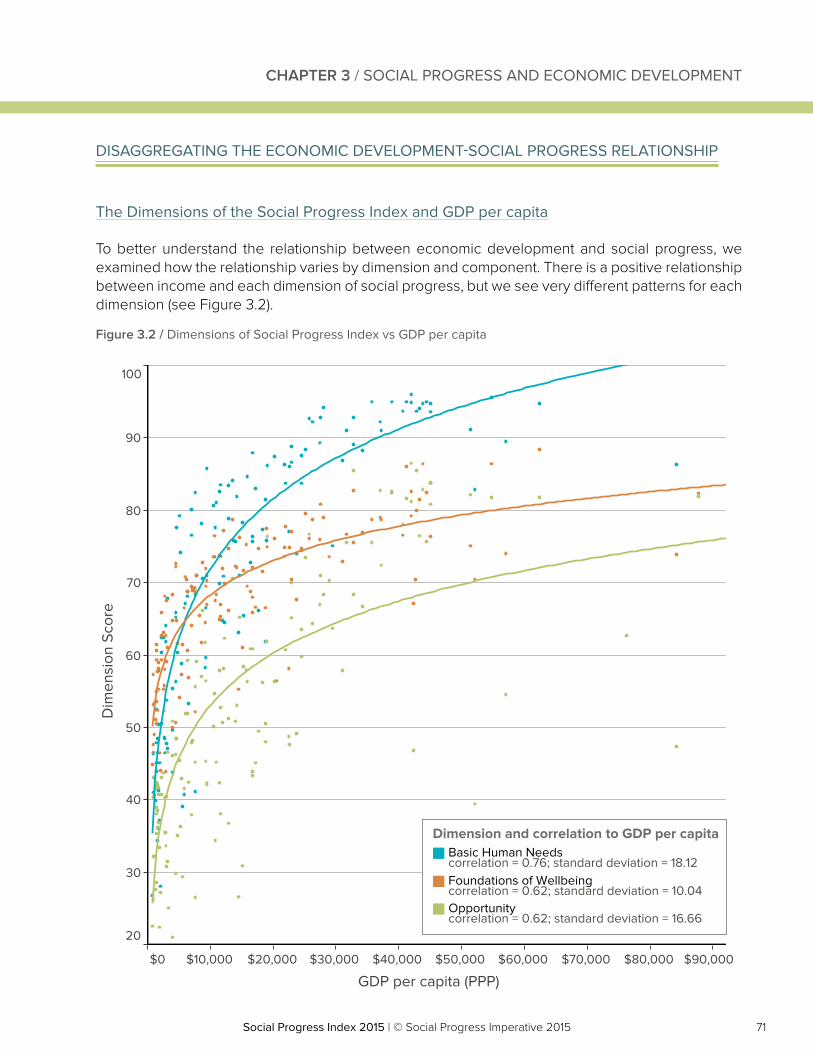
71Social Progress Index 2015 | © Social Progress Imperative 2015Social Progress Index 2015 | © Social Progress Imperative 2015
DISAGGREGATING THE ECONOMIC DEVELOPMENT-SOCIAL PROGRESS RELATIONSHIP
The Dimensions of the Social Progress Index and GDP per capita
To better understand the relationship between economic development and social progress, we examined how the relationship varies by dimension and component. There is a positive relationship between income and each dimension of social progress, but we see very different patterns for each dimension (see Figure 3.2).
Figure 3.2 / Dimensions of Social Progress Index vs GDP per capita
$0 $10,000 $20,000 $30,000 $40,000 $50,000 $60,000 $70,000 $80,000 $90,000
GDP per capita (PPP)
20
30
40
50
60
70
80
90
100
Dim
ensi
on S
core
Dimension and correlation to GDP per capitaBasic Human Needscorrelation = 0.76; standard deviation = 18.12Foundations of Wellbeingcorrelation = 0.62; standard deviation = 10.04Opportunitycorrelation = 0.62; standard deviation = 16.66
CHAPTER 3 / SOCIAL PROGRESS AND ECONOMIC DEVELOPMENT
72 Social Progress Index 2015 | © Social Progress Imperative 2015Social Progress Index 2015 | © Social Progress Imperative 2015
Basic Human Needs has the strongest correlation with GDP per capita (0.76). Basic Human Needs improves rapidly with GDP per capita at relatively low levels of income, and the increase is steep. Once countries reach the upper middle to high income level, the data show that there appear to be sufficient resources to meet most basic needs. Basic Human Needs rises most sharply with income at lower levels, continuing to rise, albeit more slowly, even at high income levels.
However, the relationship is far from automatic. For low income countries, we find that countries with similar incomes show widely different performance on Basic Human Needs. (See Appendix E for complete data on correlations and variance). This suggests that where economic resources are most limited, country efficiency in the use of those resources, related to good governance and absence of conflict, can have a very big impact on how well a country meets its population’s Basic Human Needs.
Foundations of Wellbeing is less highly correlated with GDP per capita (0.62). Performance rises sharply at low levels of GDP per capita and then levels out. Above $10,000 GDP per capita, Foundations of Wellbeing only improves marginally with higher levels of income. As we will discuss, this lower rate of increase in Foundations of Wellbeing scores is due to the fact that economic progress leads to new challenges, such as obesity and environmental degradation, not only benefits.
Opportunity is also less correlated with GDP per capita (0.62). This is perhaps not surprising, since many aspects of Opportunity, such as rights and freedoms, do not necessarily require large resource investments, but rather norms and policies. However, for low-income countries, we observe a narrow range of scores on Opportunity, suggesting that possibilities on Opportunity are constrained at low incomes. Whether that is a consequence or a cause is unclear without data over a longer period of time.
At the middle-income country level, the possibility for greater Opportunity grows but performance widens, with countries over and under-achieving significantly. Opportunity also rises faster with GDP per capita for high income countries than Foundations of Wellbeing.
CHAPTER 3 / SOCIAL PROGRESS AND ECONOMIC DEVELOPMENT
73Social Progress Index 2015 | © Social Progress Imperative 2015Social Progress Index 2015 | © Social Progress Imperative 2015
The Components of the Social Progress Index and GDP per capita
To better understand these broader relationships, we can disaggregate the data further to examine the relationship between the individual components of the model and GDP capita. We find that the components fall into four categories in terms of their relationship with GDP per capita:
1. Components that show rapid improvement with GDP per capita followed by leveling off as countries reach near maximum scores at a relatively low or moderate income. Nutrition and Basic Medical Care, Access to Basic Knowledge, and Water and Sanitation follow this pattern. These are components where performance has the potential to improve with relatively modest investment. Importantly, each of these areas has also been prioritized as part of the Millennium Development Goals, and our findings reflect the significant progress in these components across countries at relatively low levels of economic development.
2. Components that show a steady progression with rising income that does not level off until a much higher level of GDP per capita. Access to Information and Communications, Shelter, Personal Safety, and Access to Advanced Education follow this pattern. Performance on these components improves more slowly with rising GDP per capita because they include more complex and costly problems to address than those captured by components such as Nutrition and Basic Medical Care. As well, many of these areas have been leading priorities for governments, donors, and economic development organizations.
3. Components that include some indicators that improve with GDP per capita and some indicators that tend to decline with GDP per capita. Health and Wellness and Ecosystem Sustainability follow this pattern. In each of these cases, the relationship between social progress and GDP per capita is nuanced. Rising prosperity allows for more resources to be devoted to achieving these aspects of social progress, but economic development itself may erode social progress in these areas.
4. Components that show improvement with GDP per capita although the relationship with income is highly variable. Personal Freedom and Choice, Tolerance and Inclusion, and Personal Rights follow this pattern. Here, it appears that the driver is not income alone, but norms, culture, and policies. Although there is not a necessary link between economic resources and performance on these components, high income countries significantly outperform low and middle income countries.
We explore each of these four patterns in detail below.
CHAPTER 3 / SOCIAL PROGRESS AND ECONOMIC DEVELOPMENT
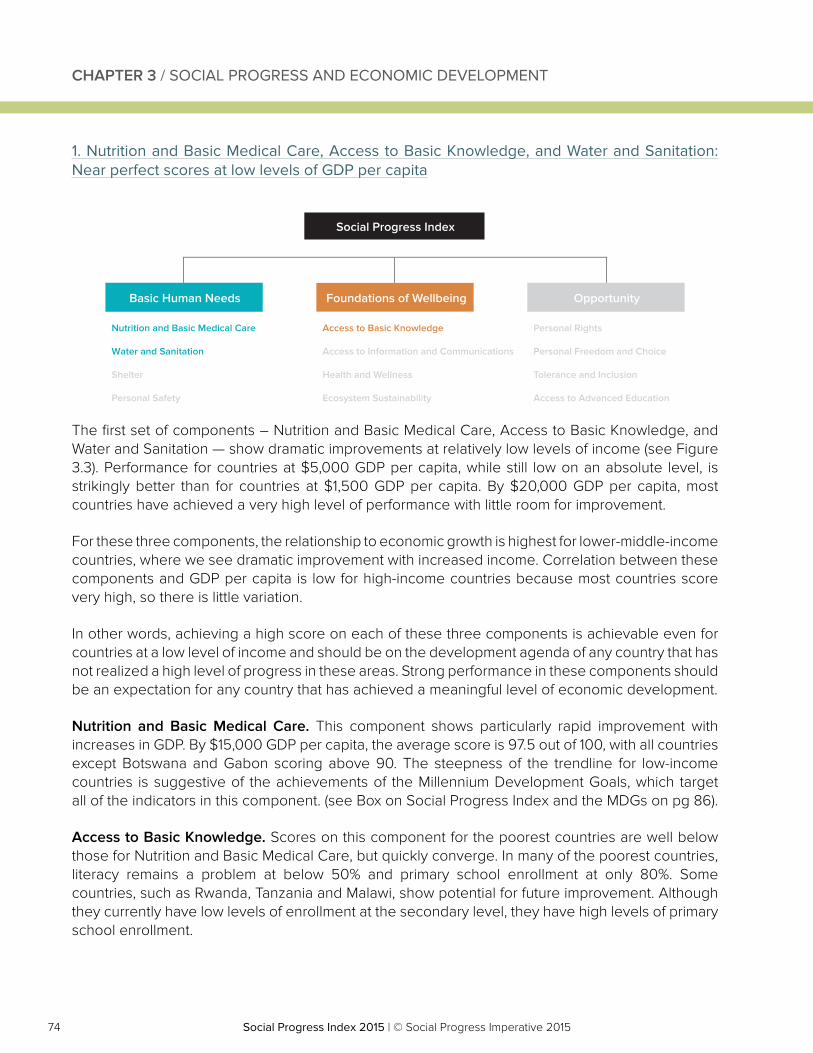
74 Social Progress Index 2015 | © Social Progress Imperative 2015Social Progress Index 2015 | © Social Progress Imperative 2015
1. Nutrition and Basic Medical Care, Access to Basic Knowledge, and Water and Sanitation: Near perfect scores at low levels of GDP per capita
The first set of components – Nutrition and Basic Medical Care, Access to Basic Knowledge, and Water and Sanitation — show dramatic improvements at relatively low levels of income (see Figure 3.3). Performance for countries at $5,000 GDP per capita, while still low on an absolute level, is strikingly better than for countries at $1,500 GDP per capita. By $20,000 GDP per capita, most countries have achieved a very high level of performance with little room for improvement.
For these three components, the relationship to economic growth is highest for lower-middle-income countries, where we see dramatic improvement with increased income. Correlation between these components and GDP per capita is low for high-income countries because most countries score very high, so there is little variation.
In other words, achieving a high score on each of these three components is achievable even for countries at a low level of income and should be on the development agenda of any country that has not realized a high level of progress in these areas. Strong performance in these components should be an expectation for any country that has achieved a meaningful level of economic development.
Nutrition and Basic Medical Care. This component shows particularly rapid improvement with increases in GDP. By $15,000 GDP per capita, the average score is 97.5 out of 100, with all countries except Botswana and Gabon scoring above 90. The steepness of the trendline for low-income countries is suggestive of the achievements of the Millennium Development Goals, which target all of the indicators in this component. (see Box on Social Progress Index and the MDGs on pg 86).
Access to Basic Knowledge. Scores on this component for the poorest countries are well below those for Nutrition and Basic Medical Care, but quickly converge. In many of the poorest countries, literacy remains a problem at below 50% and primary school enrollment at only 80%. Some countries, such as Rwanda, Tanzania and Malawi, show potential for future improvement. Although they currently have low levels of enrollment at the secondary level, they have high levels of primary school enrollment.
Basic Human Needs
Nutrition and Basic Medical Care
Water and Sanitation
Shelter
Personal Safety
Access to Basic Knowledge
Access to Information and Communications
Health and Wellness
Ecosystem Sustainability
Personal Rights
Personal Freedom and Choice
Tolerance and Inclusion
Access to Advanced Education
Foundations of Wellbeing
Social Progress Index
Opportunity
CHAPTER 3 / SOCIAL PROGRESS AND ECONOMIC DEVELOPMENT
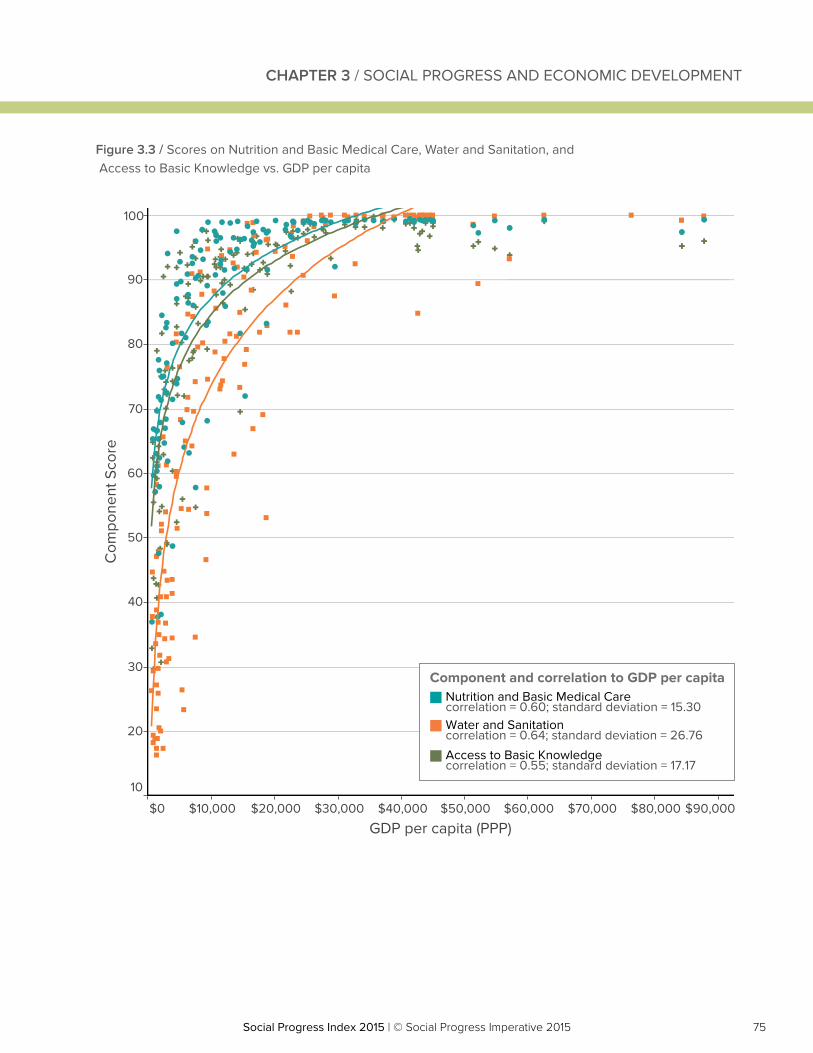
75Social Progress Index 2015 | © Social Progress Imperative 2015Social Progress Index 2015 | © Social Progress Imperative 2015
Figure 3.3 / Scores on Nutrition and Basic Medical Care, Water and Sanitation, and Access to Basic Knowledge vs. GDP per capita
$0 $10,000 $20,000 $30,000 $40,000 $50,000 $60,000 $70,000 $80,000 $90,000
GDP per capita (PPP)
10
20
30
40
50
60
70
80
90
100
Com
pone
nt S
core
Component and correlation to GDP per capitaNutrition and Basic Medical Carecorrelation = 0.60; standard deviation = 15.30Water and Sanitationcorrelation = 0.64; standard deviation = 26.76
Access to Basic Knowledgecorrelation = 0.55; standard deviation = 17.17
CHAPTER 3 / SOCIAL PROGRESS AND ECONOMIC DEVELOPMENT
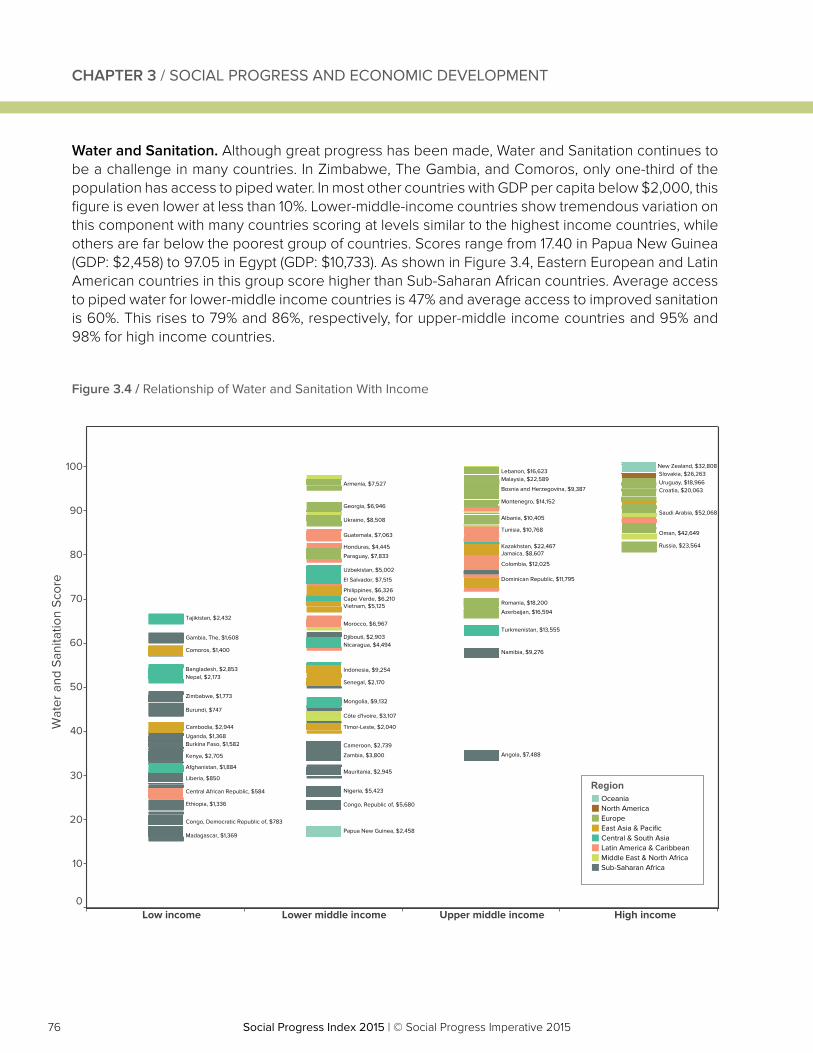
76 Social Progress Index 2015 | © Social Progress Imperative 2015Social Progress Index 2015 | © Social Progress Imperative 2015
Water and Sanitation. Although great progress has been made, Water and Sanitation continues to be a challenge in many countries. In Zimbabwe, The Gambia, and Comoros, only one-third of the population has access to piped water. In most other countries with GDP per capita below $2,000, this figure is even lower at less than 10%. Lower-middle-income countries show tremendous variation on this component with many countries scoring at levels similar to the highest income countries, while others are far below the poorest group of countries. Scores range from 17.40 in Papua New Guinea (GDP: $2,458) to 97.05 in Egypt (GDP: $10,733). As shown in Figure 3.4, Eastern European and Latin American countries in this group score higher than Sub-Saharan African countries. Average access to piped water for lower-middle income countries is 47% and average access to improved sanitation is 60%. This rises to 79% and 86%, respectively, for upper-middle income countries and 95% and 98% for high income countries.
Figure 3.4 / Relationship of Water and Sanitation With Income
Low income Lower middle income Upper middle income High income0
10
20
30
40
50
60
70
80
90
100
Wat
er a
nd S
anita
tion
Scor
e
Congo, Democratic Republic of, $783
Bosnia and Herzegovina, $9,387
Central African Republic, $584
Dominican Republic, $11,795
Congo, Republic of, $5,680
Papua New Guinea, $2,458
New Zealand, $32,808
Turkmenistan, $13,555
Saudi Arabia, $52,068
Kazakhstan, $22,467
Burkina Faso, $1,582
Montenegro, $14,152
Gambia, The, $1,608
Côte d'Ivoire, $3,107
Timor-Leste, $2,040
Bangladesh, $2,853
Madagascar, $1,369
Cape Verde, $6,210
Azerbaijan, $16,594
Uzbekistan, $5,002
Afghanistan, $1,884
Philippines, $6,326
Guatemala, $7,063
El Salvador, $7,515
Colombia, $12,025
Mauritania, $2,945
Cameroon, $2,739
Cambodia, $2,944
Malaysia, $22,589
Nicaragua, $4,494
Indonesia, $9,254
Slovakia, $26,263
Romania, $18,200
Honduras, $4,445
Zimbabwe, $1,773
Lebanon, $16,623
Uruguay, $18,966
Tajikistan, $2,432
Paraguay, $7,833
Morocco, $6,967
Mongolia, $9,132
Comoros, $1,400
Croatia, $20,063
Albania, $10,405
Jamaica, $8,607
Namibia, $9,276
Armenia, $7,527
Georgia, $6,946
Ukraine, $8,508
Tunisia, $10,768
Vietnam, $5,125
Russia, $23,564
Djibouti, $2,903
Senegal, $2,170
Zambia, $3,800
Ethiopia, $1,336
Oman, $42,649
Uganda, $1,368
Nigeria, $5,423
Angola, $7,488Kenya, $2,705
Burundi, $747
Nepal, $2,173
Liberia, $850Region
OceaniaNorth AmericaEuropeEast Asia & PacificCentral & South AsiaLatin America & CaribbeanMiddle East & North AfricaSub-Saharan Africa
CHAPTER 3 / SOCIAL PROGRESS AND ECONOMIC DEVELOPMENT
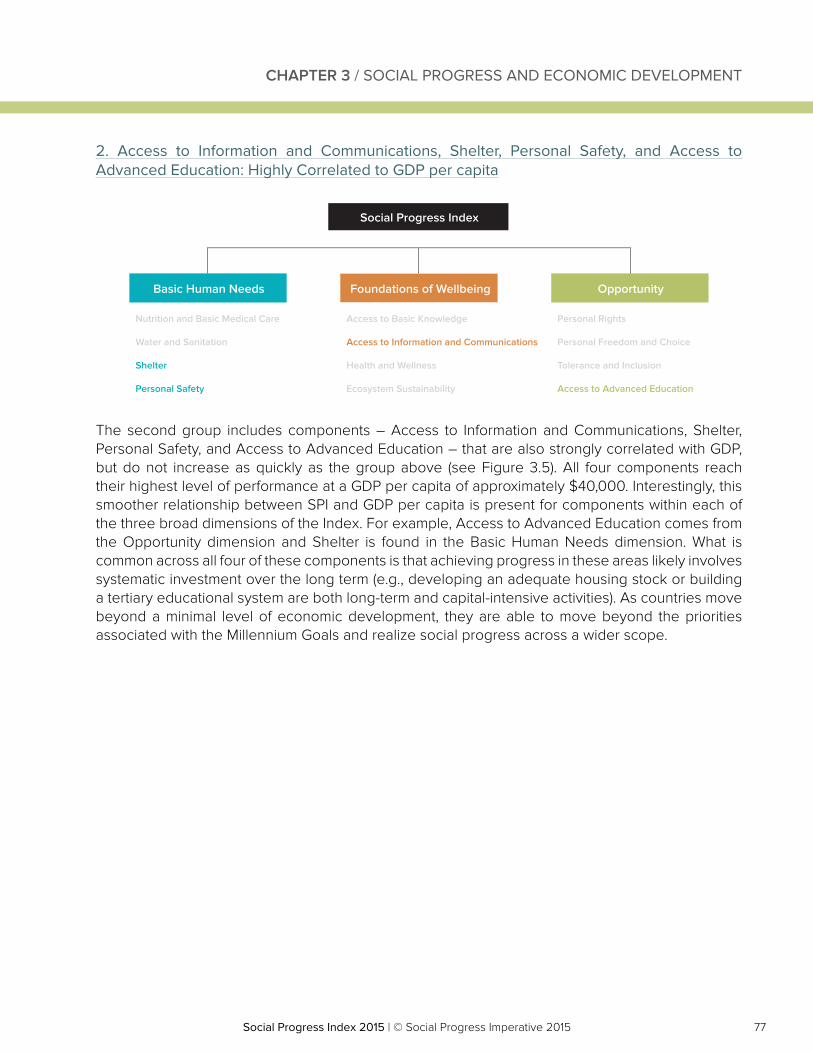
77Social Progress Index 2015 | © Social Progress Imperative 2015Social Progress Index 2015 | © Social Progress Imperative 2015
2. Access to Information and Communications, Shelter, Personal Safety, and Access to Advanced Education: Highly Correlated to GDP per capita
The second group includes components – Access to Information and Communications, Shelter, Personal Safety, and Access to Advanced Education – that are also strongly correlated with GDP, but do not increase as quickly as the group above (see Figure 3.5). All four components reach their highest level of performance at a GDP per capita of approximately $40,000. Interestingly, this smoother relationship between SPI and GDP per capita is present for components within each of the three broad dimensions of the Index. For example, Access to Advanced Education comes from the Opportunity dimension and Shelter is found in the Basic Human Needs dimension. What is common across all four of these components is that achieving progress in these areas likely involves systematic investment over the long term (e.g., developing an adequate housing stock or building a tertiary educational system are both long-term and capital-intensive activities). As countries move beyond a minimal level of economic development, they are able to move beyond the priorities associated with the Millennium Goals and realize social progress across a wider scope.
Basic Human Needs
Nutrition and Basic Medical Care
Water and Sanitation
Shelter
Personal Safety
Access to Basic Knowledge
Access to Information and Communications
Health and Wellness
Ecosystem Sustainability
Personal Rights
Personal Freedom and Choice
Tolerance and Inclusion
Access to Advanced Education
Foundations of Wellbeing
Social Progress Index
Opportunity
CHAPTER 3 / SOCIAL PROGRESS AND ECONOMIC DEVELOPMENT
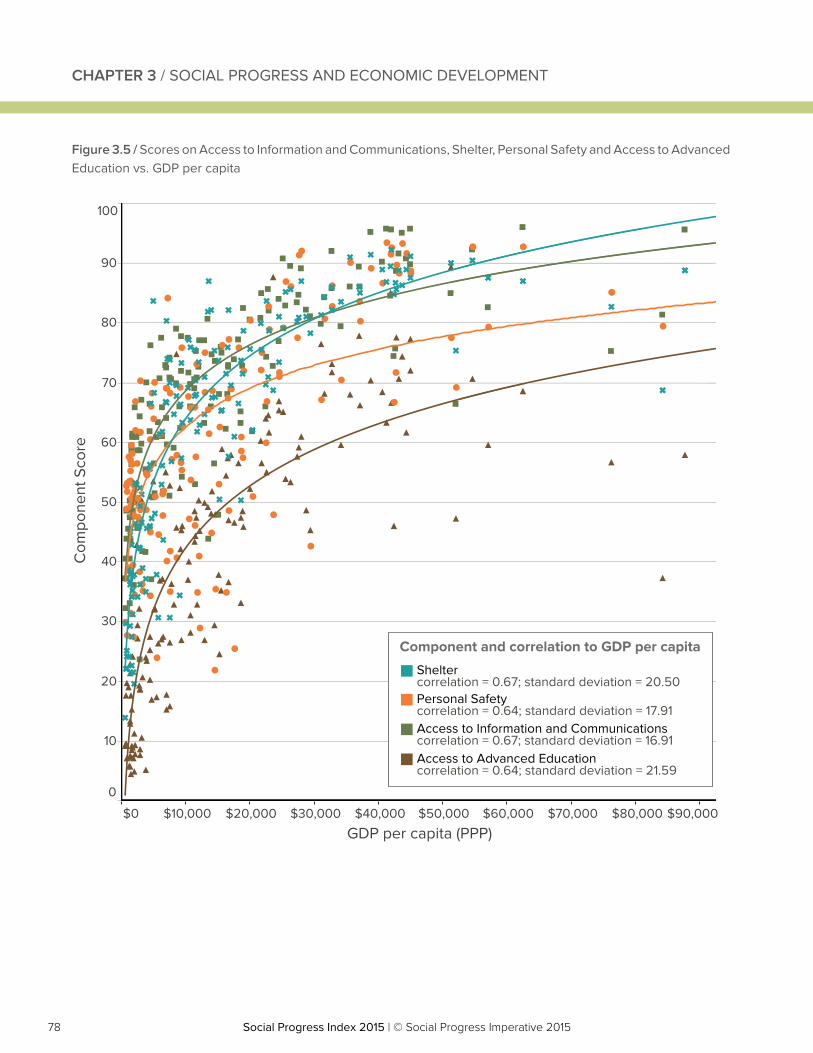
78 Social Progress Index 2015 | © Social Progress Imperative 2015Social Progress Index 2015 | © Social Progress Imperative 2015
Figure 3.5 / Scores on Access to Information and Communications, Shelter, Personal Safety and Access to Advanced Education vs. GDP per capita
$0 $10,000 $20,000 $30,000 $40,000 $50,000 $60,000 $70,000 $80,000 $90,000
GDP per capita (PPP)
0
10
20
30
40
50
60
70
80
90
100
Com
pone
nt S
core
.
.
Component and correlation to GDP per capita
Sheltercorrelation = 0.67; standard deviation = 20.50Personal Safetycorrelation = 0.64; standard deviation = 17.91Access to Information and Communicationscorrelation = 0.67; standard deviation = 16.91Access to Advanced Educationcorrelation = 0.64; standard deviation = 21.59
CHAPTER 3 / SOCIAL PROGRESS AND ECONOMIC DEVELOPMENT
79Social Progress Index 2015 | © Social Progress Imperative 2015Social Progress Index 2015 | © Social Progress Imperative 2015
Access to Information and Communications and Shelter. Both these components show dramatic improvement between the lowest levels of GDP to about $10,000 in GDP and then slower progress at higher levels of income. Access to Information and Communications and Shelter show the strongest correlation to GDP per capita among lower middle income countries. This suggests that as countries move beyond the basic issues prioritized by the Millennium Development Goals, they are able to meet a more diverse set of needs for their population.
Nordic and Eastern European countries generally perform strongly on the Access to Information and Communications component, while most Middle Eastern countries, where press freedom and internet usage are low, underperform.
Although access to and quality of electricity and household air pollution deaths improve dramatically at relatively low levels of GDP per capita, the availability of affordable housing shows little correlation to income. With the exception of Mongolia and Kazakhstan, Asian countries have relatively high scores. Eastern Europe generally underperforms relative to northern and western Europe. Uzbekistan and Thailand perform well on Shelter, with high satisfaction with the availability of affordable housing and near-universal access to electricity.
Personal Safety. High-income countries tend to perform well on Personal Safety, while low-income countries perform poorly. Strikingly, even though Personal Safety is part of the Basic Human Needs dimension, it is at the high-income country level that there is the strongest correlation with GDP per capita for this component. In fact, the improvement in average scores from low income to lower-middle income to upper-middle income is quite small. Whether high GDP per capita is required for high levels of safety or vice versa is unclear. However, there is considerable variation for middle-income countries, with Personal Safety particularly low in the Middle East, Sub-Saharan Africa, and Latin America.
Access to Advanced Education. As would be expected, Access to Advanced Education is highly correlated with income, but scores globally remain low even for high-income countries. Access to Advanced Education is most closely correlated with upper-middle-income countries, suggesting that this is a particular priority for emerging economies. Among low-income countries, average years of schooling for women is highest in Tajikistan (12.2), Zimbabwe (9.4), and Kenya (9.2) and lowest in Afghanistan (0.6). Among high-income countries, the average amount of tertiary education is highest in Russia (1.76) and the United States (1.76) and lowest in Kuwait (0.28) and Uruguay (0.29).
CHAPTER 3 / SOCIAL PROGRESS AND ECONOMIC DEVELOPMENT
80 Social Progress Index 2015 | © Social Progress Imperative 2015Social Progress Index 2015 | © Social Progress Imperative 2015
3. Ecosystem Sustainability and Health and Wellness: Elements That Both Positively and Negatively Correlate with GDP per capita
Two components – Ecosystem Sustainability and Health and Wellness – have a complex relationship with GDP (see Figure 3.6). On one hand, each of these components has individual elements that tend to improve with economic development and other elements that have a flat or even negative relationship with economic development. Consequently, the overall relationship between these components and GDP per capita is uneven. More than all other components in the Index, Ecosystem Sustainability and Health and Wellness highlight the tensions associated with economic development. Responding to poor performance in these components is a policy priority for nearly all high income countries. Low- and lower-middle-income countries that have not yet seen the detrimental effects on personal and environmental health have an opportunity to develop in a healthier, more sustainable way.
Ecosystem Sustainability. There is strong variation in this component with countries showing strong and weak performance regardless of income group or region. Upper-middle-income countries show negative correlation between Ecosystem Sustainability scores and GDP per capita, indicating that for this group, the challenges associated with increased income outweigh the benefits. Lower-middle-income countries, on the other hand, show a small positive relationship to income. High-income countries show the strongest negative correlation in Ecosystem Sustainability, reflecting the environmental stresses that often accompany economic development.
Performance on Ecosystem Sustainability appears to be driven by a country’s environmental endowments, policies, and planning. Switzerland, Norway, and Slovenia score well in this component as do Laos and Uganda. Although Laos and Uganda do not score well on greenhouse gas emissions, they have relatively low stress on water resources and habitats. Libya registers the lowest score of any country on any component, 0.96.
Health and Wellness. As with Ecosystem Sustainability, Health and Wellness is negatively correlated to income for upper-middle-income countries, but to an even greater extent, reflecting the increasing complexity of addressing health challenges as countries become richer. Lower-middle-income countries experience the same effect, but to a lesser degree. High-income countries, however, show the strongest positive correlation between income and Health and Wellness. This indicates that the response to emerging health challenges does improve at higher levels of income.
Basic Human Needs
Nutrition and Basic Medical Care
Water and Sanitation
Shelter
Personal Safety
Access to Basic Knowledge
Access to Information and Communications
Health and Wellness
Ecosystem Sustainability
Personal Rights
Personal Freedom and Choice
Tolerance and Inclusion
Access to Advanced Education
Foundations of Wellbeing
Social Progress Index
Opportunity
CHAPTER 3 / SOCIAL PROGRESS AND ECONOMIC DEVELOPMENT
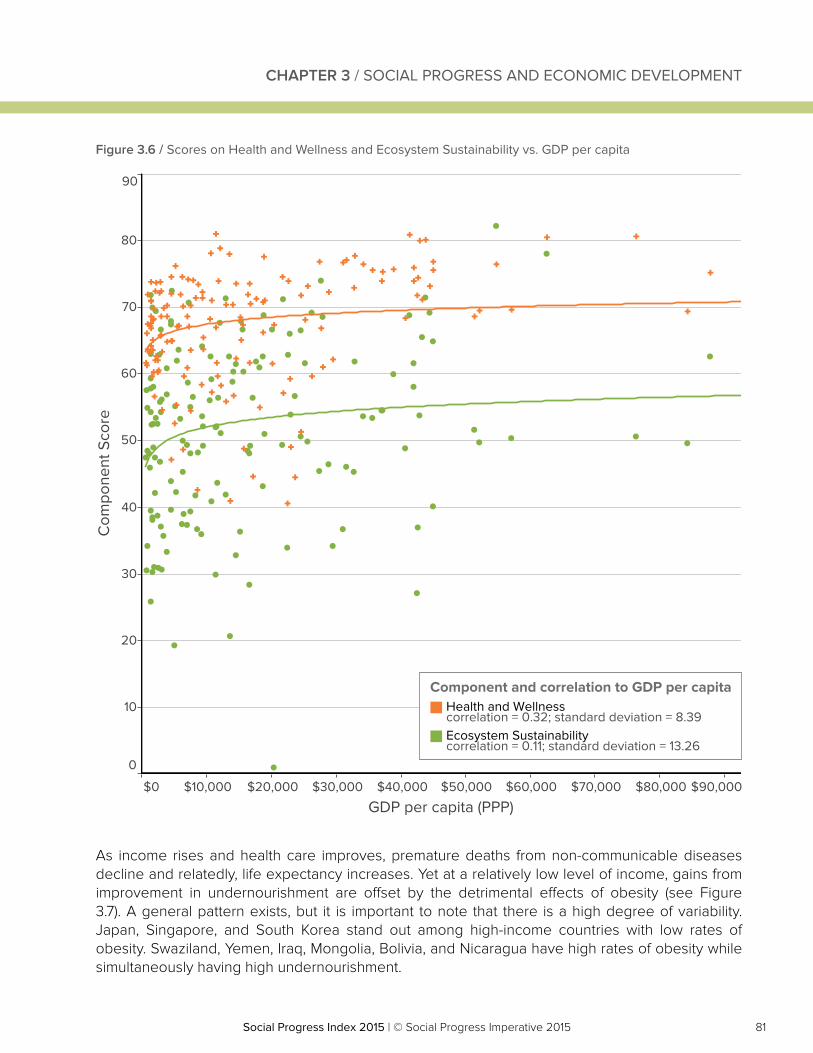
81Social Progress Index 2015 | © Social Progress Imperative 2015Social Progress Index 2015 | © Social Progress Imperative 2015
Figure 3.6 / Scores on Health and Wellness and Ecosystem Sustainability vs. GDP per capita
$0 $10,000 $20,000 $30,000 $40,000 $50,000 $60,000 $70,000 $80,000 $90,000
GDP per capita (PPP)
0
10
20
30
40
50
60
70
80
90
Com
pone
nt S
core
Component and correlation to GDP per capitaHealth and Wellnesscorrelation = 0.32; standard deviation = 8.39Ecosystem Sustainabilitycorrelation = 0.11; standard deviation = 13.26
As income rises and health care improves, premature deaths from non-communicable diseases decline and relatedly, life expectancy increases. Yet at a relatively low level of income, gains from improvement in undernourishment are offset by the detrimental effects of obesity (see Figure 3.7). A general pattern exists, but it is important to note that there is a high degree of variability. Japan, Singapore, and South Korea stand out among high-income countries with low rates of obesity. Swaziland, Yemen, Iraq, Mongolia, Bolivia, and Nicaragua have high rates of obesity while simultaneously having high undernourishment.
CHAPTER 3 / SOCIAL PROGRESS AND ECONOMIC DEVELOPMENT
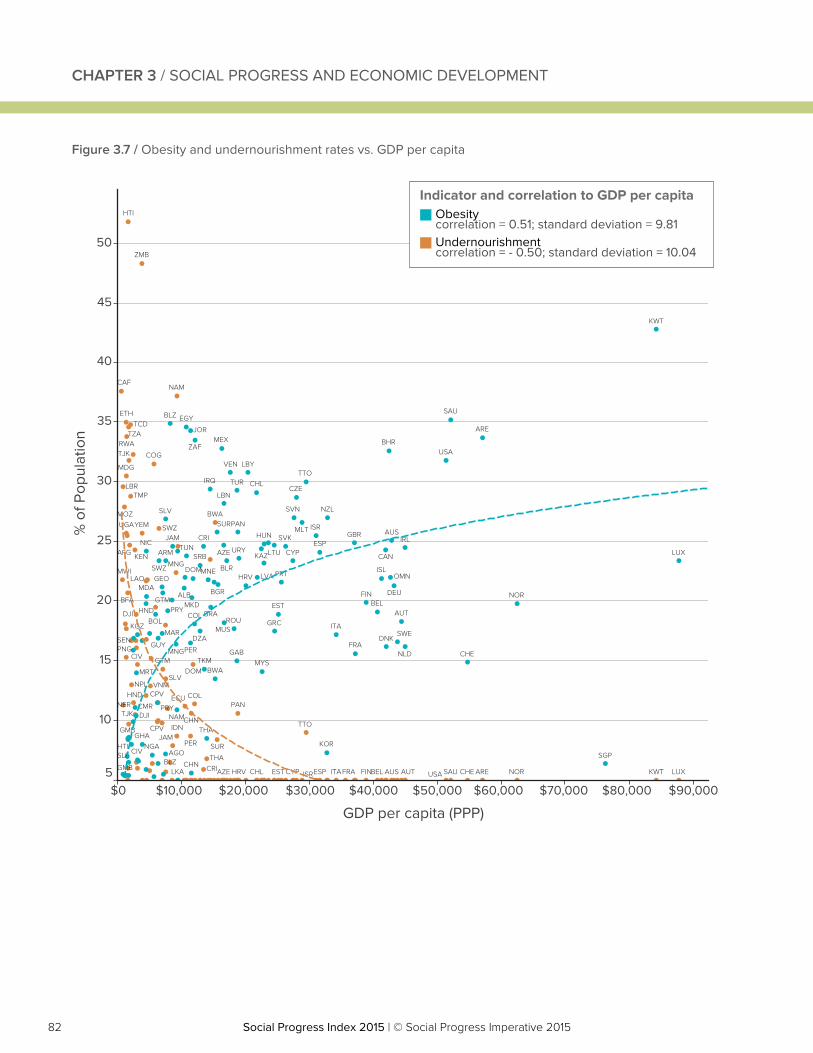
82 Social Progress Index 2015 | © Social Progress Imperative 2015Social Progress Index 2015 | © Social Progress Imperative 2015
Figure 3.7 / Obesity and undernourishment rates vs. GDP per capita
$0 $10,000 $20,000 $30,000 $40,000 $50,000 $60,000 $70,000 $80,000 $90,000
GDP per capita (PPP)
5
10
15
20
25
30
35
40
45
50
% o
f Pop
ulat
ion
AGO
ALB
ARE
ARM
AUS
AUT
AZE
BEL
BGR
BHR
BLR
BLZ
BOLBRA
BWA
CAN
CHE
CHL
CHN
CIV
CMR
COL
CPV
CRI
CYP
CZE
DEU
DJI
DNK
DOM
DZA
EGY
ESP
EST
FIN
FRAGAB
GBR
GEO
GHAGMB
GRC
GTM
GUY
HND
HRV
HTI
HUN IRL
IRQ
ISL
ISR
ITA
JAM
JOR
KAZ
KGZ
KOR
KWT
LBN
LBY
LKA
LTU LUX
LVA
MAR
MDA
MEX
MKD
MLT
MNE
MNG
MRT
MUS
MYS
NAM
NGA
NIC
NLD
NOR
NZL
OMN
PAN
PERPNG
PRT
PRYROU
SAU
SGPSLE
SLV
SRB
SUR
SVK
SVN
SWE
SWZ
THA
TJK
TKM
TTO
TUN
TUR
URY
USA
VEN
ZAF
AFG
AREAUS AUTLEBEZA
BFA
BLZ
BWA
CAF
CHECHL
CHN
CIV
COG
COL
CPV
CRI CYP
DJI
DOM
ECU
ESPEST
ETH
FINFRAGMB
GTM
HND
HRV
HTI
IDN
ISR ITA
JAM
KEN
KWT
LAO
LBR
LUX
MDG
MNG
MOZ
MWI
NAM
NER
NOR
NPL
PAN
PER
PRY
RWA
SAU
SEN
SLV
SUR
SWZ
TCD
THA
TJK
TMP
TTO
TZA
UGA
USA
VNM
YEM
ZMB
Indicator and correlation to GDP per capitaObesitycorrelation = 0.51; standard deviation = 9.81Undernourishmentcorrelation = - 0.50; standard deviation = 10.04
CHAPTER 3 / SOCIAL PROGRESS AND ECONOMIC DEVELOPMENT
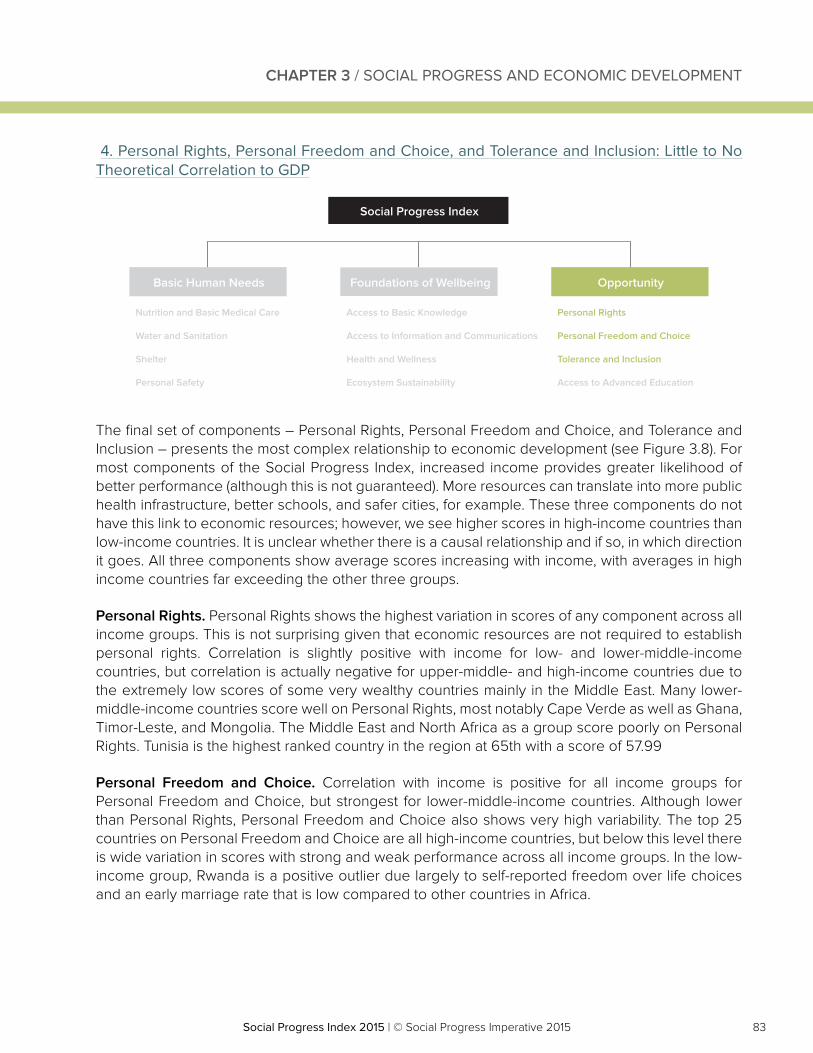
83Social Progress Index 2015 | © Social Progress Imperative 2015Social Progress Index 2015 | © Social Progress Imperative 2015
4. Personal Rights, Personal Freedom and Choice, and Tolerance and Inclusion: Little to No Theoretical Correlation to GDP
The final set of components – Personal Rights, Personal Freedom and Choice, and Tolerance and Inclusion – presents the most complex relationship to economic development (see Figure 3.8). For most components of the Social Progress Index, increased income provides greater likelihood of better performance (although this is not guaranteed). More resources can translate into more public health infrastructure, better schools, and safer cities, for example. These three components do not have this link to economic resources; however, we see higher scores in high-income countries than low-income countries. It is unclear whether there is a causal relationship and if so, in which direction it goes. All three components show average scores increasing with income, with averages in high income countries far exceeding the other three groups.
Personal Rights. Personal Rights shows the highest variation in scores of any component across all income groups. This is not surprising given that economic resources are not required to establish personal rights. Correlation is slightly positive with income for low- and lower-middle-income countries, but correlation is actually negative for upper-middle- and high-income countries due to the extremely low scores of some very wealthy countries mainly in the Middle East. Many lower-middle-income countries score well on Personal Rights, most notably Cape Verde as well as Ghana, Timor-Leste, and Mongolia. The Middle East and North Africa as a group score poorly on Personal Rights. Tunisia is the highest ranked country in the region at 65th with a score of 57.99
Personal Freedom and Choice. Correlation with income is positive for all income groups for Personal Freedom and Choice, but strongest for lower-middle-income countries. Although lower than Personal Rights, Personal Freedom and Choice also shows very high variability. The top 25 countries on Personal Freedom and Choice are all high-income countries, but below this level there is wide variation in scores with strong and weak performance across all income groups. In the low-income group, Rwanda is a positive outlier due largely to self-reported freedom over life choices and an early marriage rate that is low compared to other countries in Africa.
Basic Human Needs
Nutrition and Basic Medical Care
Water and Sanitation
Shelter
Personal Safety
Access to Basic Knowledge
Access to Information and Communications
Health and Wellness
Ecosystem Sustainability
Personal Rights
Personal Freedom and Choice
Tolerance and Inclusion
Access to Advanced Education
Foundations of Wellbeing
Social Progress Index
Opportunity
CHAPTER 3 / SOCIAL PROGRESS AND ECONOMIC DEVELOPMENT
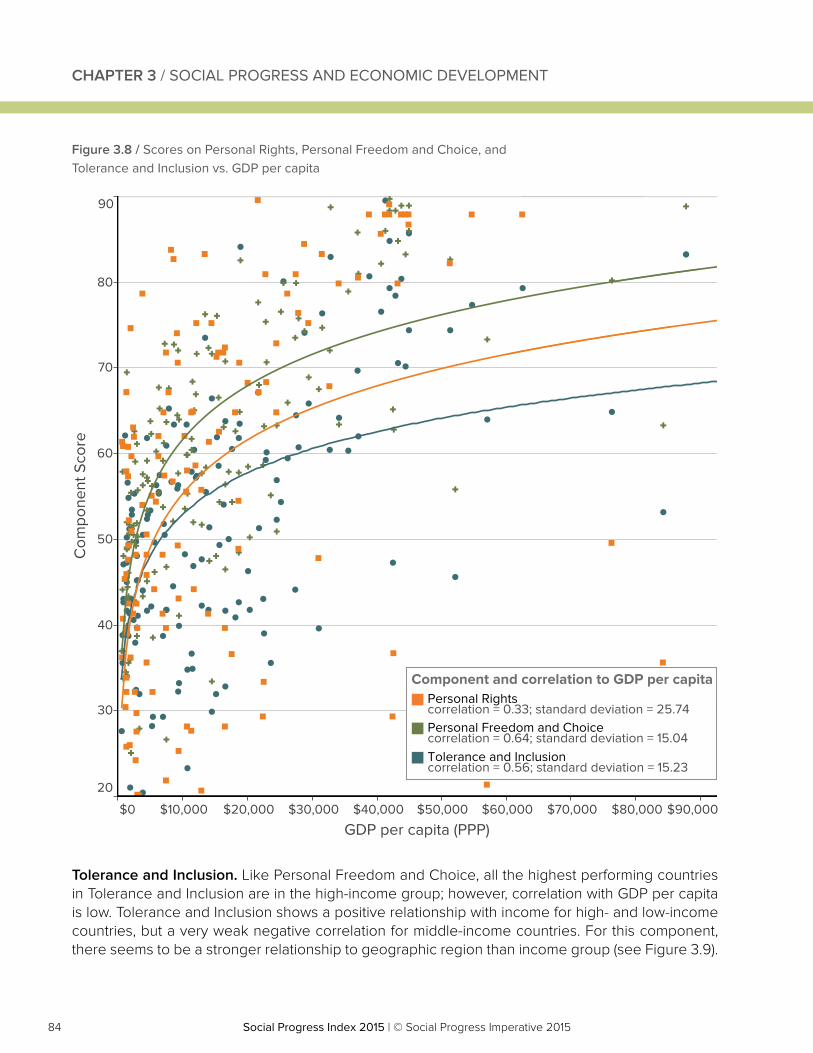
84 Social Progress Index 2015 | © Social Progress Imperative 2015Social Progress Index 2015 | © Social Progress Imperative 2015
Tolerance and Inclusion. Like Personal Freedom and Choice, all the highest performing countries in Tolerance and Inclusion are in the high-income group; however, correlation with GDP per capita is low. Tolerance and Inclusion shows a positive relationship with income for high- and low-income countries, but a very weak negative correlation for middle-income countries. For this component, there seems to be a stronger relationship to geographic region than income group (see Figure 3.9).
Figure 3.8 / Scores on Personal Rights, Personal Freedom and Choice, and Tolerance and Inclusion vs. GDP per capita
$0 $10,000 $20,000 $30,000 $40,000 $50,000 $60,000 $70,000 $80,000 $90,000
GDP per capita (PPP)
20
30
40
50
60
70
80
90
Com
pone
nt S
core
Component and correlation to GDP per capitaPersonal Rightscorrelation = 0.33; standard deviation = 25.74Personal Freedom and Choicecorrelation = 0.64; standard deviation = 15.04Tolerance and Inclusioncorrelation = 0.56; standard deviation = 15.23
CHAPTER 3 / SOCIAL PROGRESS AND ECONOMIC DEVELOPMENT
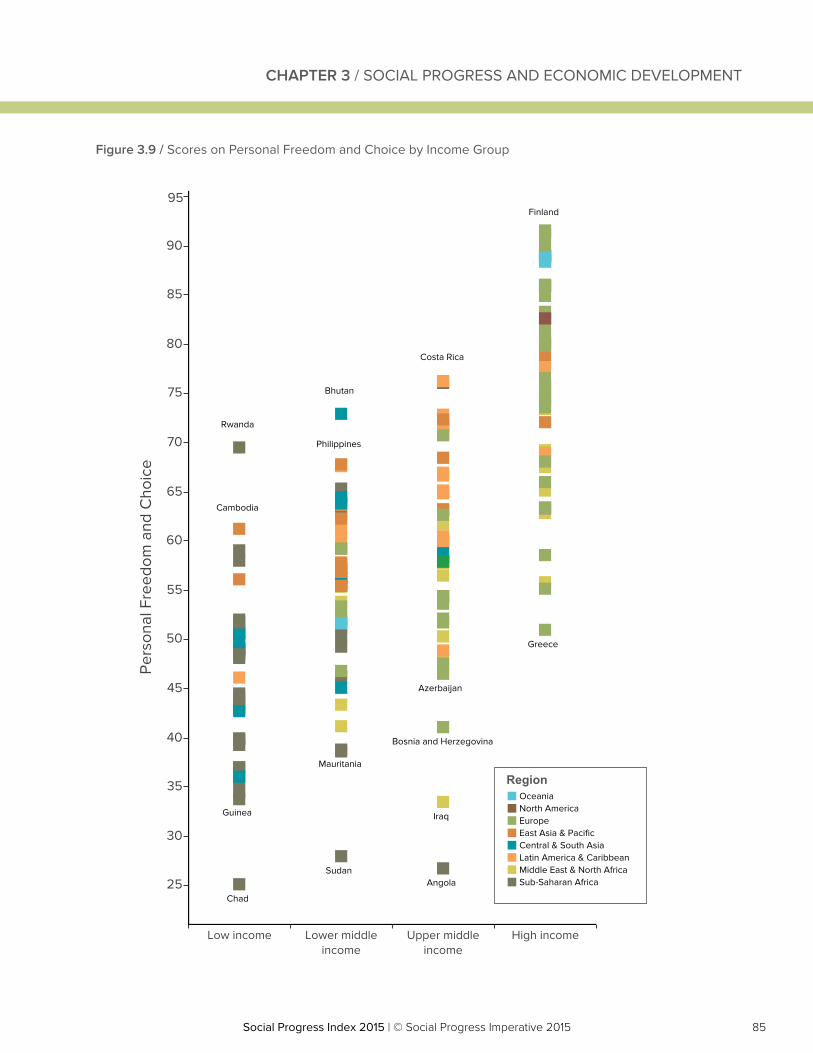
85Social Progress Index 2015 | © Social Progress Imperative 2015Social Progress Index 2015 | © Social Progress Imperative 2015
Figure 3.9 / Scores on Personal Freedom and Choice by Income Group
Low income Lower middleincome
Upper middleincome
High income
25
30
35
40
45
50
55
60
65
70
75
80
85
90
95
Pers
onal
Fre
edom
and
Cho
ice
Rwanda
Guinea
Costa Rica
Bhutan
Philippines
Cambodia
Finland
Sudan
Mauritania
Chad
Angola
Iraq
Greece
Bosnia and Herzegovina
Azerbaijan
RegionOceaniaNorth AmericaEuropeEast Asia & PacificCentral & South AsiaLatin America & CaribbeanMiddle East & North AfricaSub-Saharan Africa
CHAPTER 3 / SOCIAL PROGRESS AND ECONOMIC DEVELOPMENT
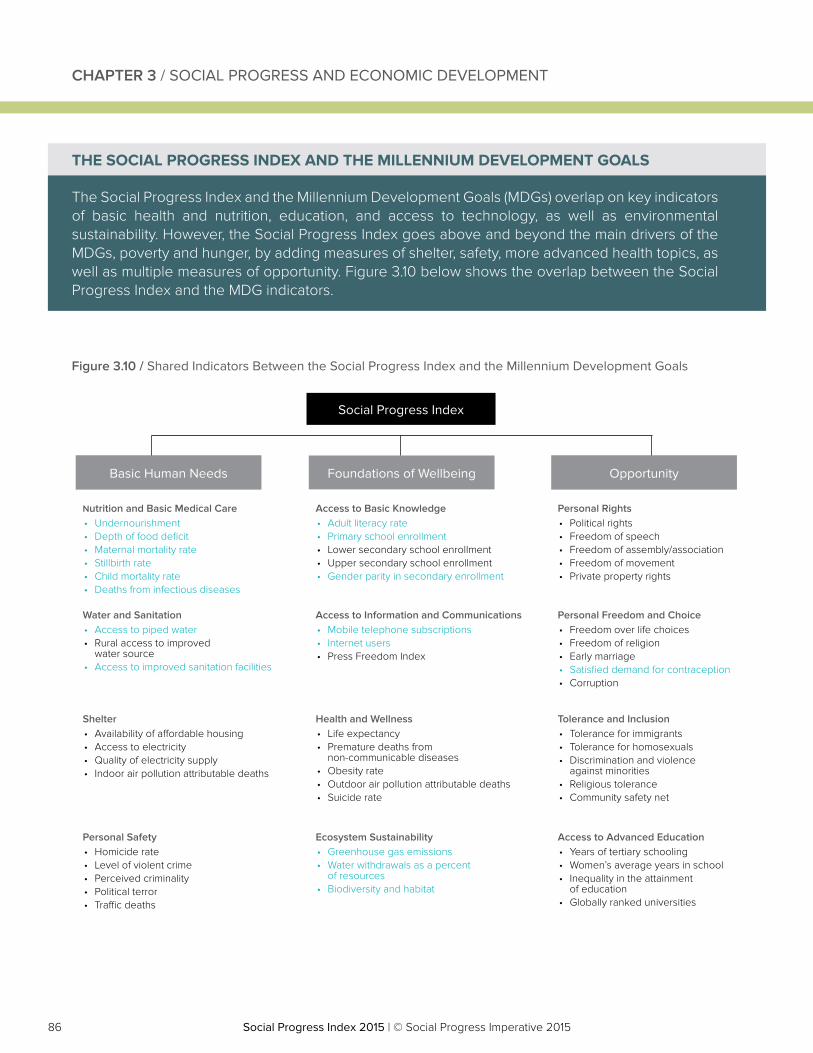
86 Social Progress Index 2015 | © Social Progress Imperative 2015Social Progress Index 2015 | © Social Progress Imperative 2015
CHAPTER 3 / SOCIAL PROGRESS AND ECONOMIC DEVELOPMENT
THE SOCIAL PROGRESS INDEX AND THE MILLENNIUM DEVELOPMENT GOALS
The Social Progress Index and the Millennium Development Goals (MDGs) overlap on key indicators of basic health and nutrition, education, and access to technology, as well as environmental sustainability. However, the Social Progress Index goes above and beyond the main drivers of the MDGs, poverty and hunger, by adding measures of shelter, safety, more advanced health topics, as well as multiple measures of opportunity. Figure 3.10 below shows the overlap between the Social Progress Index and the MDG indicators.
Figure 3.10 / Shared Indicators Between the Social Progress Index and the Millennium Development Goals
Basic Human Needs
Nutrition and Basic Medical Care• Undernourishment • Depth of food deficit • Maternal mortality rate • Stillbirth rate• Child mortality rate• Deaths from infectious diseases
Access to Basic Knowledge• Adult literacy rate • Primary school enrollment • Lower secondary school enrollment • Upper secondary school enrollment • Gender parity in secondary enrollment
Personal Rights• Political rights• Freedom of speech• Freedom of assembly/association• Freedom of movement • Private property rights
Water and Sanitation• Access to piped water• Rural access to improved
water source• Access to improved sanitation facilities
Access to Information and Communications• Mobile telephone subscriptions • Internet users • Press Freedom Index
Personal Freedom and Choice• Freedom over life choices • Freedom of religion• Early marriage• Satisfied demand for contraception • Corruption
Shelter• Availability of affordable housing• Access to electricity • Quality of electricity supply• Indoor air pollution attributable deaths
Health and Wellness• Life expectancy • Premature deaths from
non-communicable diseases • Obesity rate• Outdoor air pollution attributable deaths• Suicide rate
Tolerance and Inclusion• Tolerance for immigrants • Tolerance for homosexuals• Discrimination and violence
against minorities• Religious tolerance• Community safety net
Personal Safety• Homicide rate • Level of violent crime• Perceived criminality • Political terror • Traffic deaths
Ecosystem Sustainability• Greenhouse gas emissions• Water withdrawals as a percent
of resources • Biodiversity and habitat
Access to Advanced Education• Years of tertiary schooling • Women’s average years in school • Inequality in the attainment
of education • Globally ranked universities
Foundations of Wellbeing
Social Progress Index
Opportunity
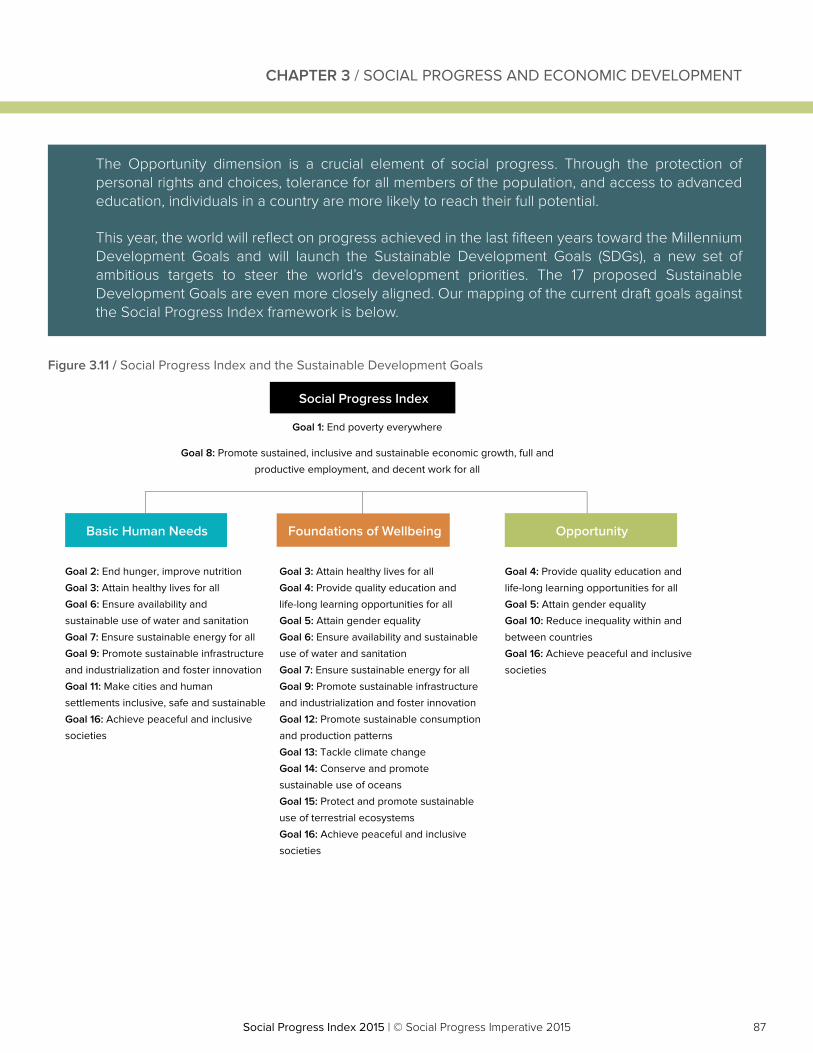
87Social Progress Index 2015 | © Social Progress Imperative 2015Social Progress Index 2015 | © Social Progress Imperative 2015
CHAPTER 3 / SOCIAL PROGRESS AND ECONOMIC DEVELOPMENT
Figure 3.11 / Social Progress Index and the Sustainable Development Goals
Social Progress Index
Basic Human Needs Foundations of Wellbeing Opportunity
Goal 2: End hunger, improve nutrition
Goal 3: Attain healthy lives for all
Goal 6: Ensure availability and
sustainable use of water and sanitation
Goal 7: Ensure sustainable energy for all
Goal 9: Promote sustainable infrastructure
and industrialization and foster innovation
Goal 11: Make cities and human
settlements inclusive, safe and sustainable
Goal 16: Achieve peaceful and inclusive
societies
Goal 3: Attain healthy lives for all
Goal 4: Provide quality education and
life-long learning opportunities for all
Goal 5: Attain gender equality
Goal 6: Ensure availability and sustainable
use of water and sanitation
Goal 7: Ensure sustainable energy for all
Goal 9: Promote sustainable infrastructure
and industrialization and foster innovation
Goal 12: Promote sustainable consumption
and production patterns
Goal 13: Tackle climate change
Goal 14: Conserve and promote
sustainable use of oceans
Goal 15: Protect and promote sustainable
use of terrestrial ecosystems
Goal 16: Achieve peaceful and inclusive
societies
Goal 4: Provide quality education and
life-long learning opportunities for all
Goal 5: Attain gender equality
Goal 10: Reduce inequality within and
between countries
Goal 16: Achieve peaceful and inclusive
societies
Goal 1: End poverty everywhere
Goal 8: Promote sustained, inclusive and sustainable economic growth, full and
productive employment, and decent work for all
The Opportunity dimension is a crucial element of social progress. Through the protection of personal rights and choices, tolerance for all members of the population, and access to advanced education, individuals in a country are more likely to reach their full potential.
This year, the world will reflect on progress achieved in the last fifteen years toward the Millennium Development Goals and will launch the Sustainable Development Goals (SDGs), a new set of ambitious targets to steer the world’s development priorities. The 17 proposed Sustainable Development Goals are even more closely aligned. Our mapping of the current draft goals against the Social Progress Index framework is below.
88 Social Progress Index 2015 | © Social Progress Imperative 2015Social Progress Index 2015 | © Social Progress Imperative 2015
CONCLUSIONS
Our findings suggest important implications for policy-makers. Simply put, development strategies based solely on economic development are incomplete. An inclusive growth strategy must directly target improvements in social progress. See chapter 6 for a case study of how the Government of Paraguay has incorporated this thinking in its National Development Plan for 2030.
The need to focus directly on social progress is essential for countries at all levels of development. Even for poorer countries, where we see a strongly positive relationship between social progress and GDP per capita, we see important divergences in the inclusiveness of development. This has important implications for donors of international development assistance as they set priorities. Much aid allocation is over-reliant on GDP per capita measures as we discuss later (see Chapter 5).
Many medium and higher income countries, even those at relatively modest levels of GDP per capita of $10,000, have achieved near-maximum scores on components such as Access to Basic Knowledge. Our findings suggest that other aspects of development less well correlated to GDP per capita, such as Health and Wellness and Ecosystem Sustainability, become increasingly important as income progresses and require focused solutions, rather than depending on growth alone. Even the countries with the highest levels of social progress have significant room for improvement in these areas.
In the next chapter we extend our analysis of the relationship between the components of the Social Progress Index and GDP to analyzing individual country performance relative to GDP per capita, which is a powerful tool to guide prioritization within national development strategies.
CHAPTER 3 / SOCIAL PROGRESS AND ECONOMIC DEVELOPMENT
89Social Progress Index 2015 | © Social Progress Imperative 2015Social Progress Index 2015 | © Social Progress Imperative 2015
CHAPTER 4BENCHMARKING SOCIAL PROGRESS
90 Social Progress Index 2015 | © Social Progress Imperative 2015Social Progress Index 2015 | © Social Progress Imperative 2015
CHAPTER 4 / BENCHMARKING SOCIAL PROGRESS
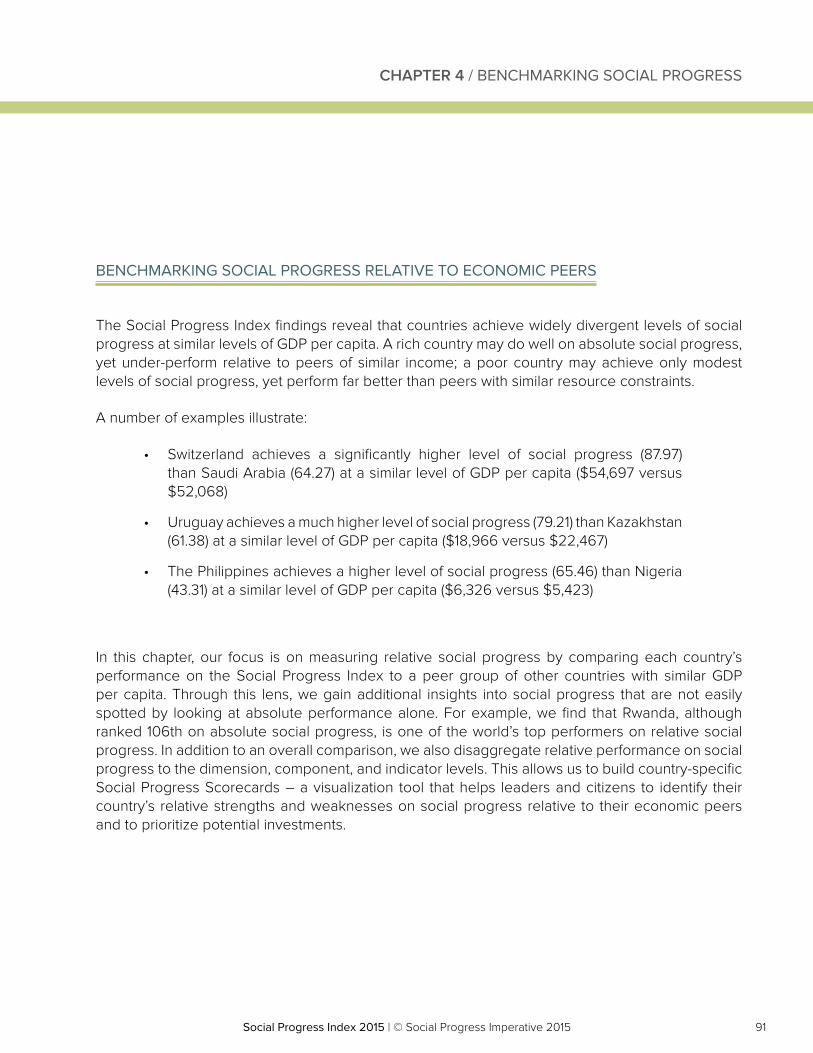
91Social Progress Index 2015 | © Social Progress Imperative 2015Social Progress Index 2015 | © Social Progress Imperative 2015
BENCHMARKING SOCIAL PROGRESS RELATIVE TO ECONOMIC PEERS
The Social Progress Index findings reveal that countries achieve widely divergent levels of social progress at similar levels of GDP per capita. A rich country may do well on absolute social progress, yet under-perform relative to peers of similar income; a poor country may achieve only modest levels of social progress, yet perform far better than peers with similar resource constraints.
A number of examples illustrate:
• Switzerland achieves a significantly higher level of social progress (87.97) than Saudi Arabia (64.27) at a similar level of GDP per capita ($54,697 versus $52,068)
• Uruguay achieves a much higher level of social progress (79.21) than Kazakhstan (61.38) at a similar level of GDP per capita ($18,966 versus $22,467)
• The Philippines achieves a higher level of social progress (65.46) than Nigeria (43.31) at a similar level of GDP per capita ($6,326 versus $5,423)
In this chapter, our focus is on measuring relative social progress by comparing each country’s performance on the Social Progress Index to a peer group of other countries with similar GDP per capita. Through this lens, we gain additional insights into social progress that are not easily spotted by looking at absolute performance alone. For example, we find that Rwanda, although ranked 106th on absolute social progress, is one of the world’s top performers on relative social progress. In addition to an overall comparison, we also disaggregate relative performance on social progress to the dimension, component, and indicator levels. This allows us to build country-specific Social Progress Scorecards – a visualization tool that helps leaders and citizens to identify their country’s relative strengths and weaknesses on social progress relative to their economic peers and to prioritize potential investments.
CHAPTER 4 / BENCHMARKING SOCIAL PROGRESS
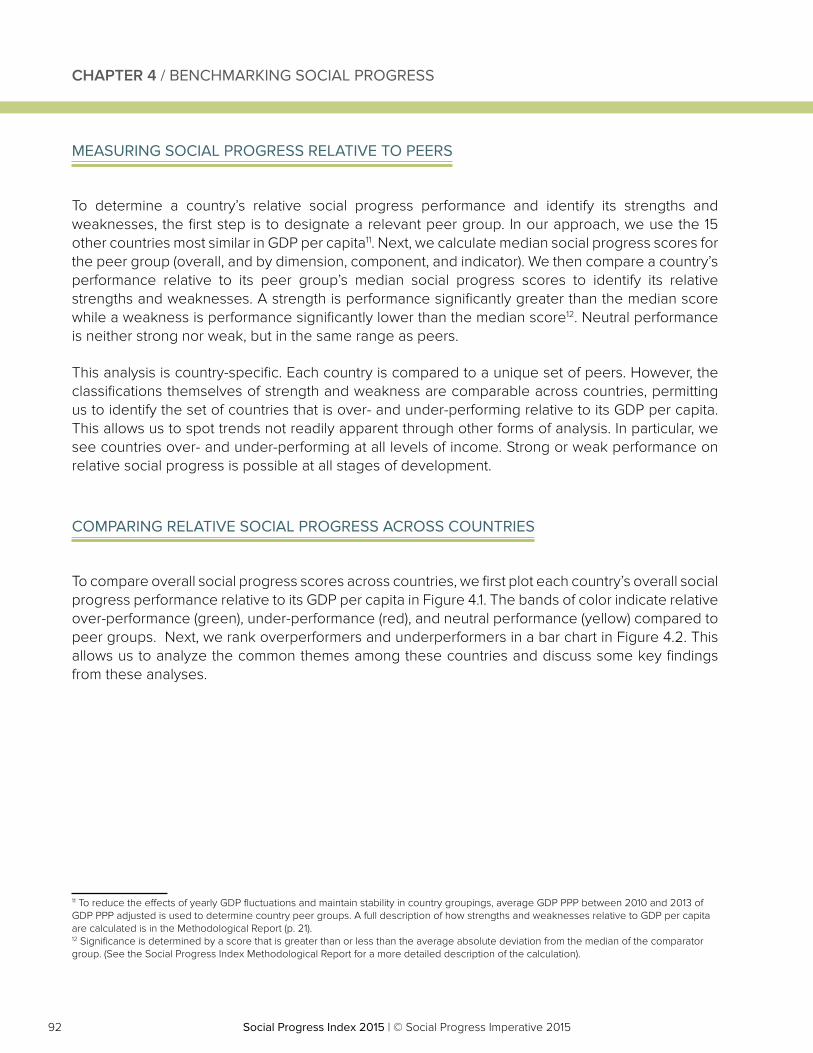
92 Social Progress Index 2015 | © Social Progress Imperative 2015Social Progress Index 2015 | © Social Progress Imperative 2015
MEASURING SOCIAL PROGRESS RELATIVE TO PEERS
To determine a country’s relative social progress performance and identify its strengths and weaknesses, the first step is to designate a relevant peer group. In our approach, we use the 15 other countries most similar in GDP per capita11. Next, we calculate median social progress scores for the peer group (overall, and by dimension, component, and indicator). We then compare a country’s performance relative to its peer group’s median social progress scores to identify its relative strengths and weaknesses. A strength is performance significantly greater than the median score while a weakness is performance significantly lower than the median score12. Neutral performance is neither strong nor weak, but in the same range as peers.
This analysis is country-specific. Each country is compared to a unique set of peers. However, the classifications themselves of strength and weakness are comparable across countries, permitting us to identify the set of countries that is over- and under-performing relative to its GDP per capita. This allows us to spot trends not readily apparent through other forms of analysis. In particular, we see countries over- and under-performing at all levels of income. Strong or weak performance on relative social progress is possible at all stages of development.
COMPARING RELATIVE SOCIAL PROGRESS ACROSS COUNTRIES
To compare overall social progress scores across countries, we first plot each country’s overall social progress performance relative to its GDP per capita in Figure 4.1. The bands of color indicate relative over-performance (green), under-performance (red), and neutral performance (yellow) compared to peer groups. Next, we rank overperformers and underperformers in a bar chart in Figure 4.2. This allows us to analyze the common themes among these countries and discuss some key findings from these analyses.
11 To reduce the effects of yearly GDP fluctuations and maintain stability in country groupings, average GDP PPP between 2010 and 2013 of GDP PPP adjusted is used to determine country peer groups. A full description of how strengths and weaknesses relative to GDP per capita are calculated is in the Methodological Report (p. 21).12 Significance is determined by a score that is greater than or less than the average absolute deviation from the median of the comparator group. (See the Social Progress Index Methodological Report for a more detailed description of the calculation).
CHAPTER 4 / BENCHMARKING SOCIAL PROGRESS
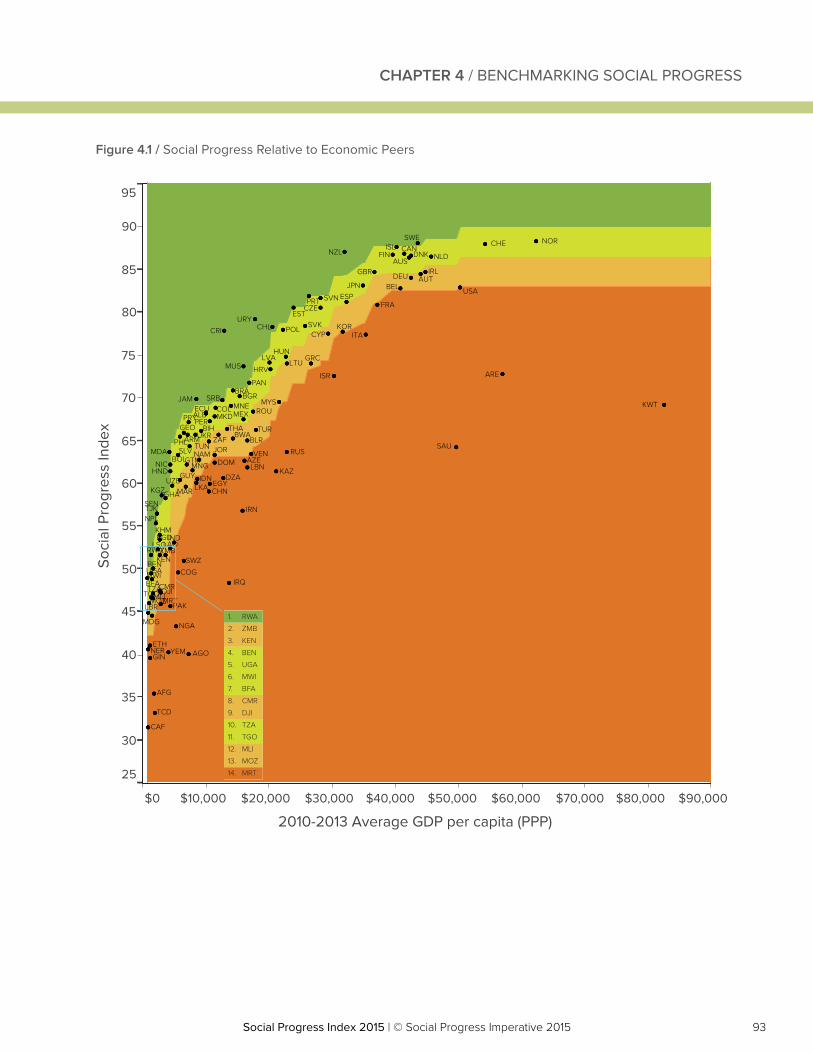
93Social Progress Index 2015 | © Social Progress Imperative 2015Social Progress Index 2015 | © Social Progress Imperative 2015
CHAPTER 4 / BENCHMARKING SOCIAL PROGRESS
$0 $10,000 $20,000 $30,000 $40,000 $50,000 $60,000 $70,000 $80,000 $90,000
2010-2013 Average GDP per capita (PPP)
25
30
35
40
45
50
55
60
65
70
75
80
85
90
95
Soci
al P
rogr
ess
Inde
x
ZMB
ZAF
YEM
VEN
UZB
USA
URY
UKR
UGA
TZA
TUR
TUN
TJK
THA
TGO
TCD
SWZ
SWE
SVN
SVK
SRB
SLV
SEN
SAU
RWA
RUS
ROUPRY
PRT
POL
PHL
PER
PAN
PAK
NZL
NPL
NOR
NLD
NIC
NGA
NER
NAM
MYS
MWI
MUS
MRTMOZ
MNG
MNE
MLI
MKDMEX
MDG
MDA
MAR
LVALTU
LSO
LKA
LBR
LBN
LAO
KWT
KOR
KHM
KGZ
KEN
KAZ
JPN
JOR
JAM
ITA
ISR
ISL
IRQ
IRN
IRL
IND
IDN
HUN
HRV
HND GUY
GTM
GRC
GIN
GHA
GEO
GBR
FRA
FIN
ETH
EST
ESP
EGY
ECU
DZA
DOM
DNK
DJI
DEU
CZE
CYPCRI
COL
COG
CMR
CHN
CHL
CHECAN
CAF
BWA
BRA
BOL
BLR
BIH
BGR
BGD
BFA
BEN
BEL
AZE
AUT
AUS
ARM
ARE
ALB
AGO
AFG
1. RWA
2. ZMB
3. KEN
4. BEN
5. UGA
6. MWI
7. BFA
8. CMR
9. DJI
10. TZA
11. TGO
12. MLI
13. MOZ
14. MRT
Figure 4.1 / Social Progress Relative to Economic Peers
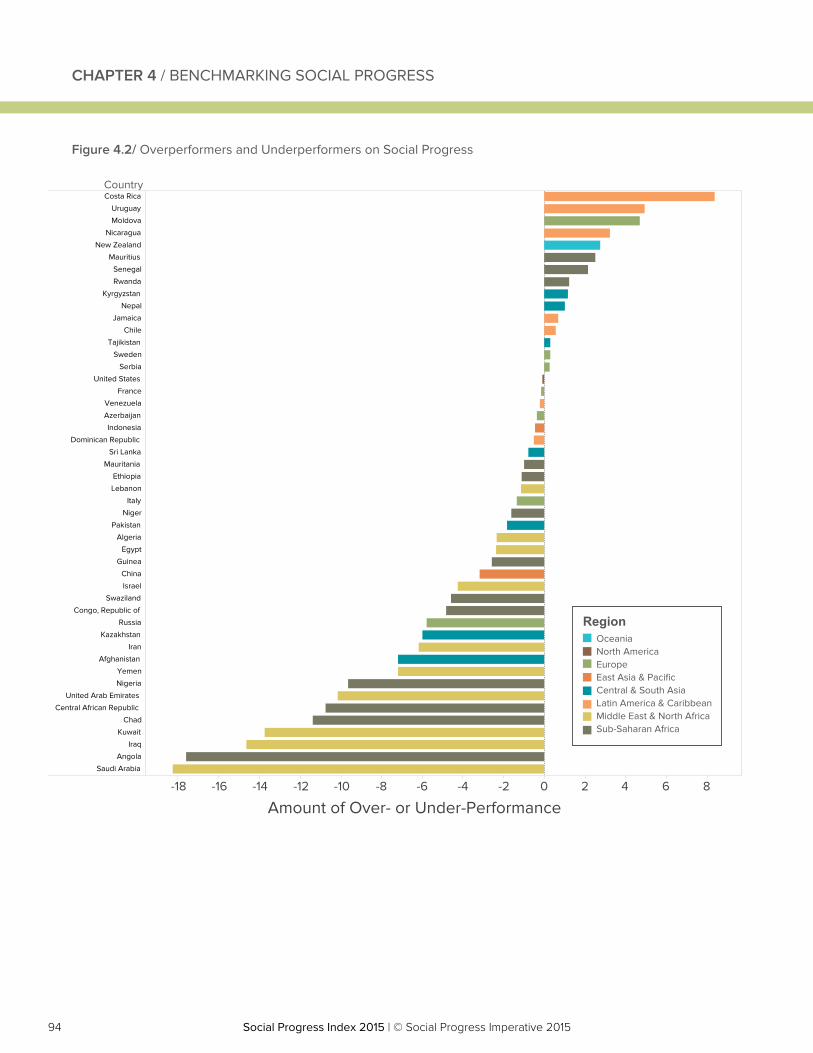
94 Social Progress Index 2015 | © Social Progress Imperative 2015Social Progress Index 2015 | © Social Progress Imperative 2015
Country
-18 -16 -14 -12 -10 -8 -6 -4 -2 0 2 4 6 8
Amount of Over- or Under-Performance
yCosta Rica
Uruguay
Moldova
Nicaragua
New Zealand
Mauritius
Senegal
Rwanda
Kyrgyzstan
Nepal
Jamaica
Chile
Tajikistan
Sweden
Serbia
United States
France
Venezuela
Azerbaijan
Indonesia
Dominican Republic
Sri Lanka
Mauritania
Ethiopia
Lebanon
Italy
Niger
Pakistan
Algeria
Egypt
Guinea
China
Israel
Swaziland
Congo, Republic of
Russia
Kazakhstan
Iran
Afghanistan
Yemen
Nigeria
United Arab Emirates
Central African Republic
Chad
Kuwait
Iraq
Angola
Saudi Arabia
RegionOceaniaNorth AmericaEuropeEast Asia & PacificCentral & South AsiaLatin America & CaribbeanMiddle East & North AfricaSub-Saharan Africa
Figure 4.2/ Overperformers and Underperformers on Social Progress
CHAPTER 4 / BENCHMARKING SOCIAL PROGRESS
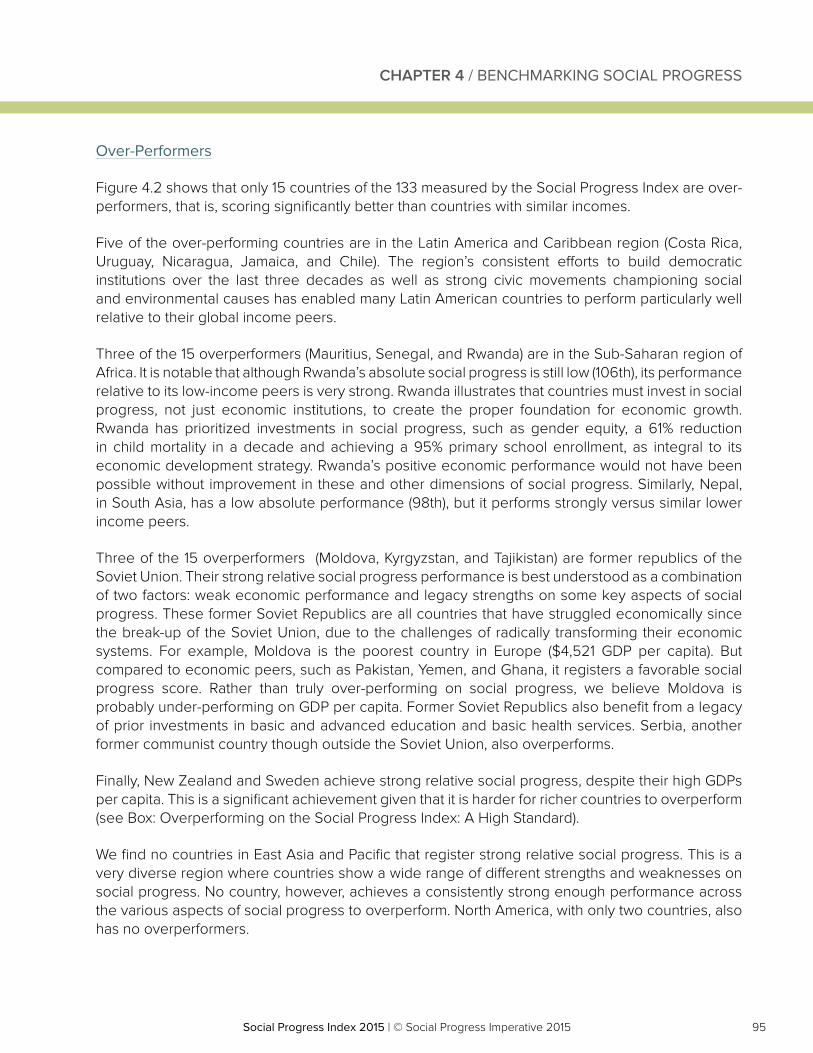
95Social Progress Index 2015 | © Social Progress Imperative 2015Social Progress Index 2015 | © Social Progress Imperative 2015
CHAPTER 4 / BENCHMARKING SOCIAL PROGRESS
Over-Performers
Figure 4.2 shows that only 15 countries of the 133 measured by the Social Progress Index are over-performers, that is, scoring significantly better than countries with similar incomes.
Five of the over-performing countries are in the Latin America and Caribbean region (Costa Rica, Uruguay, Nicaragua, Jamaica, and Chile). The region’s consistent efforts to build democratic institutions over the last three decades as well as strong civic movements championing social and environmental causes has enabled many Latin American countries to perform particularly well relative to their global income peers.
Three of the 15 overperformers (Mauritius, Senegal, and Rwanda) are in the Sub-Saharan region of Africa. It is notable that although Rwanda’s absolute social progress is still low (106th), its performance relative to its low-income peers is very strong. Rwanda illustrates that countries must invest in social progress, not just economic institutions, to create the proper foundation for economic growth. Rwanda has prioritized investments in social progress, such as gender equity, a 61% reduction in child mortality in a decade and achieving a 95% primary school enrollment, as integral to its economic development strategy. Rwanda’s positive economic performance would not have been possible without improvement in these and other dimensions of social progress. Similarly, Nepal, in South Asia, has a low absolute performance (98th), but it performs strongly versus similar lower income peers.
Three of the 15 overperformers (Moldova, Kyrgyzstan, and Tajikistan) are former republics of the Soviet Union. Their strong relative social progress performance is best understood as a combination of two factors: weak economic performance and legacy strengths on some key aspects of social progress. These former Soviet Republics are all countries that have struggled economically since the break-up of the Soviet Union, due to the challenges of radically transforming their economic systems. For example, Moldova is the poorest country in Europe ($4,521 GDP per capita). But compared to economic peers, such as Pakistan, Yemen, and Ghana, it registers a favorable social progress score. Rather than truly over-performing on social progress, we believe Moldova is probably under-performing on GDP per capita. Former Soviet Republics also benefit from a legacy of prior investments in basic and advanced education and basic health services. Serbia, another former communist country though outside the Soviet Union, also overperforms.
Finally, New Zealand and Sweden achieve strong relative social progress, despite their high GDPs per capita. This is a significant achievement given that it is harder for richer countries to overperform (see Box: Overperforming on the Social Progress Index: A High Standard).
We find no countries in East Asia and Pacific that register strong relative social progress. This is a very diverse region where countries show a wide range of different strengths and weaknesses on social progress. No country, however, achieves a consistently strong enough performance across the various aspects of social progress to overperform. North America, with only two countries, also has no overperformers.
96 Social Progress Index 2015 | © Social Progress Imperative 2015Social Progress Index 2015 | © Social Progress Imperative 2015
CHAPTER 4 / BENCHMARKING SOCIAL PROGRESS
OVERPERFORMING ON THE SOCIAL PROGRESS INDEX: A HIGH STANDARD
Only 15 countries overperform on relative social progress whereas 33 underperform. This reflects two factors that make it harder for higher income countries to show relative strength.
First, as we saw in Chapter 3, some aspects of social progress – such as basic medical care and education – show dramatic improvements at relatively low levels of income and reach near maximum 100 scores for many richer countries. At that point, a strong relative performance may become impossible because even a score of 100 lies within the “expected” or neutral performance band.* The ceiling of 100 means that it is mathematically impossible for some countries to overperform on these components of the model, making it more difficult to overperform overall.
Second, since it is possible for a set of rich countries to score worse than less rich countries (e.g. Kuwait, the richest country in the group, scores lower than Jamaica, the 78th richest), the methodology for calculating strengths and weaknesses sets a floor, so that a country is held to at least the standard of less rich countries. For example, Kuwait scores only 53.20 on Tolerance and Inclusion; if a country of similar wealth, such as Norway, were evaluated based on the median of its income peer group including Kuwait, it might appear to overperform, even though a less rich country with the same score but fewer poorly performing peers would not be considered an overperformer. To eliminate such anomalies, we apply a rule that a country of higher income cannot be held to a lower standard of performance than a country of lower income. This effectively sets a floor for the range of possible scores that can be considered overperforming.
Overperformance on the Social Progress Index (or any of its components) is remarkable for any country, but particularly so for higher income countries such as New Zealand. Underperformance, on the other hand, is mathematically possible at all income levels and, in fact, can be rather dramatic for high income countries with high performing income peers. Accordingly, we see many more underperforming countries than overperforming ones.
*Calculated as + 1 average absolute deviation from the median of the scores for the 15 countries closest in GDP per capita
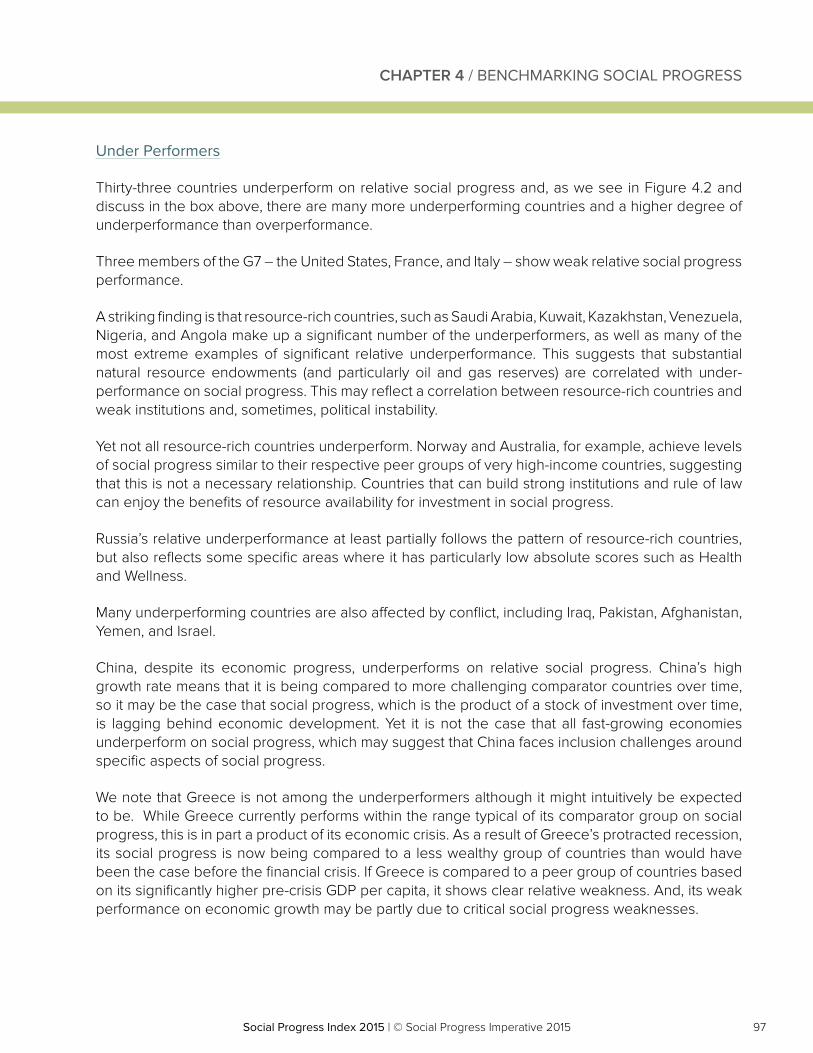
97Social Progress Index 2015 | © Social Progress Imperative 2015Social Progress Index 2015 | © Social Progress Imperative 2015
Under Performers
Thirty-three countries underperform on relative social progress and, as we see in Figure 4.2 and discuss in the box above, there are many more underperforming countries and a higher degree of underperformance than overperformance.
Three members of the G7 – the United States, France, and Italy – show weak relative social progress performance.
A striking finding is that resource-rich countries, such as Saudi Arabia, Kuwait, Kazakhstan, Venezuela, Nigeria, and Angola make up a significant number of the underperformers, as well as many of the most extreme examples of significant relative underperformance. This suggests that substantial natural resource endowments (and particularly oil and gas reserves) are correlated with under-performance on social progress. This may reflect a correlation between resource-rich countries and weak institutions and, sometimes, political instability.
Yet not all resource-rich countries underperform. Norway and Australia, for example, achieve levels of social progress similar to their respective peer groups of very high-income countries, suggesting that this is not a necessary relationship. Countries that can build strong institutions and rule of law can enjoy the benefits of resource availability for investment in social progress.
Russia’s relative underperformance at least partially follows the pattern of resource-rich countries, but also reflects some specific areas where it has particularly low absolute scores such as Health and Wellness.
Many underperforming countries are also affected by conflict, including Iraq, Pakistan, Afghanistan, Yemen, and Israel.
China, despite its economic progress, underperforms on relative social progress. China’s high growth rate means that it is being compared to more challenging comparator countries over time, so it may be the case that social progress, which is the product of a stock of investment over time, is lagging behind economic development. Yet it is not the case that all fast-growing economies underperform on social progress, which may suggest that China faces inclusion challenges around specific aspects of social progress.
We note that Greece is not among the underperformers although it might intuitively be expected to be. While Greece currently performs within the range typical of its comparator group on social progress, this is in part a product of its economic crisis. As a result of Greece’s protracted recession, its social progress is now being compared to a less wealthy group of countries than would have been the case before the financial crisis. If Greece is compared to a peer group of countries based on its significantly higher pre-crisis GDP per capita, it shows clear relative weakness. And, its weak performance on economic growth may be partly due to critical social progress weaknesses.
CHAPTER 4 / BENCHMARKING SOCIAL PROGRESS
98 Social Progress Index 2015 | © Social Progress Imperative 2015Social Progress Index 2015 | © Social Progress Imperative 2015
CHAPTER 4 / BENCHMARKING SOCIAL PROGRESS
RELATIVE PERFORMANCE BY DIMENSION AND COMPONENT
Social Progress Index scores can be disaggregated to show performance by dimension and component. Performance often varies across areas, with most countries showing strengths and weaknesses. We can examine countries relative performance on specific dimensions and components. An overview of the top and bottom performers on relative social progress by dimension and component is shown in Table 4.1 below. The degree of over- or underperformance is shown in terms of points on the Social Progress Index scale. As noted already in Chapter 3, some components have much wider ranges of scores than others, which is reflected in the varying degrees of over- and underperformance shown below. Table 4.1 includes data for countries such as Bhutan and Zimbabwe, for which only partial data is available.
High-income countries rarely feature among the top overperforming countries. This is because, as we saw in Chapter 3, countries can often achieve maximum or near maximum scores for components once they achieve high income status. For example, on Water and Sanitation, 36 high- and upper-middle income countries have achieved a score of at least 98 out of 100. Hence, little room exists to demonstrate relative strength despite strong absolute performance.
The countries that over- and underperform on aggregate social progress are often among the biggest over- and underperformers by dimension and component. Resource-rich and conflict-affected countries feature heavily among the top underperformers. Countries that underperform on relative aggregate social progress can still overperform on particular components. Russia, for example, shows the highest relative performance on Access to Advanced Education. Countries that are overall neutral performers are also found among the strongest and weakest, such as Peru as the greatest overperformer and Ukraine as one of the greatest underperformers on Health and Wellness. Hence, every country will normally have some strengths and weaknesses that can be improved.
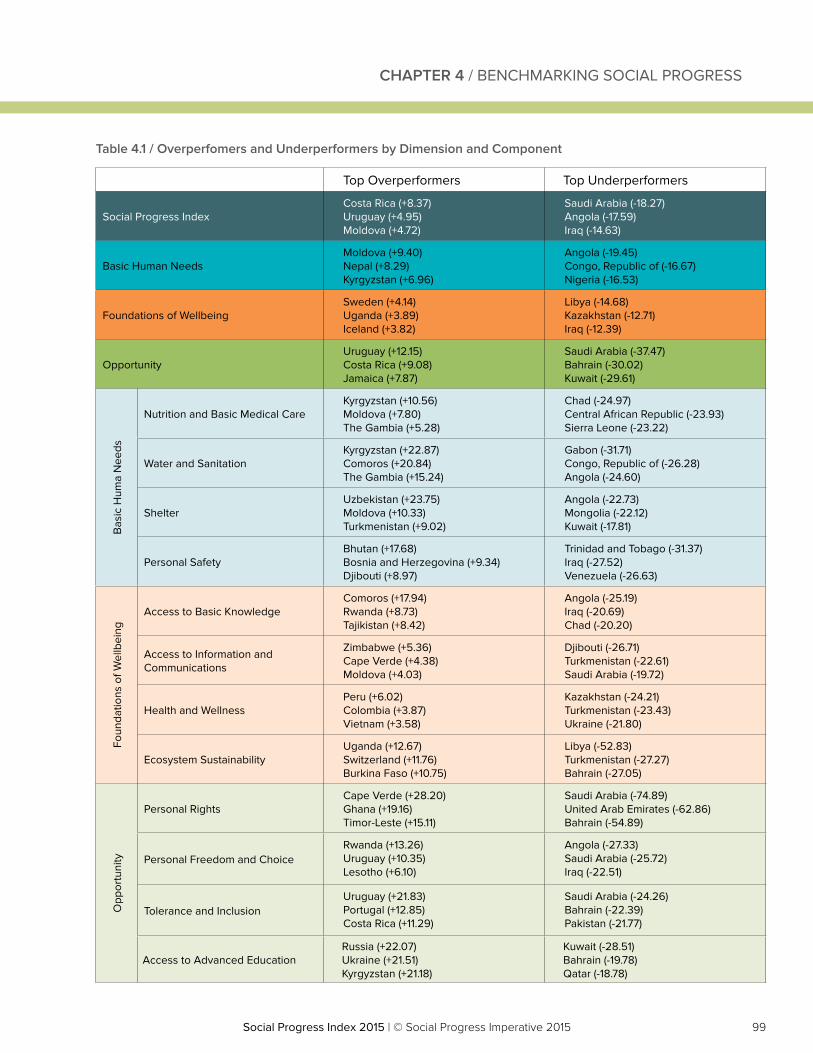
99Social Progress Index 2015 | © Social Progress Imperative 2015Social Progress Index 2015 | © Social Progress Imperative 2015
CHAPTER 4 / BENCHMARKING SOCIAL PROGRESS
Top Overperformers Top Underperformers
Social Progress IndexCosta Rica (+8.37)Uruguay (+4.95)Moldova (+4.72)
Saudi Arabia (-18.27)Angola (-17.59)Iraq (-14.63)
Basic Human NeedsMoldova (+9.40)Nepal (+8.29)Kyrgyzstan (+6.96)
Angola (-19.45)Congo, Republic of (-16.67)Nigeria (-16.53)
Foundations of WellbeingSweden (+4.14)Uganda (+3.89)Iceland (+3.82)
Libya (-14.68)Kazakhstan (-12.71)Iraq (-12.39)
OpportunityUruguay (+12.15)Costa Rica (+9.08)Jamaica (+7.87)
Saudi Arabia (-37.47)Bahrain (-30.02)Kuwait (-29.61)
Bas
ic H
uma
Nee
ds
Nutrition and Basic Medical CareKyrgyzstan (+10.56)Moldova (+7.80)The Gambia (+5.28)
Chad (-24.97)Central African Republic (-23.93)Sierra Leone (-23.22)
Water and SanitationKyrgyzstan (+22.87)Comoros (+20.84)The Gambia (+15.24)
Gabon (-31.71)Congo, Republic of (-26.28)Angola (-24.60)
ShelterUzbekistan (+23.75)Moldova (+10.33)Turkmenistan (+9.02)
Angola (-22.73)Mongolia (-22.12)Kuwait (-17.81)
Personal SafetyBhutan (+17.68)Bosnia and Herzegovina (+9.34)Djibouti (+8.97)
Trinidad and Tobago (-31.37)Iraq (-27.52)Venezuela (-26.63)
Foun
datio
ns o
f Wel
lbei
ng
Access to Basic KnowledgeComoros (+17.94)Rwanda (+8.73)Tajikistan (+8.42)
Angola (-25.19)Iraq (-20.69)Chad (-20.20)
Access to Information and Communications
Zimbabwe (+5.36)Cape Verde (+4.38)Moldova (+4.03)
Djibouti (-26.71)Turkmenistan (-22.61)Saudi Arabia (-19.72)
Health and WellnessPeru (+6.02)Colombia (+3.87)Vietnam (+3.58)
Kazakhstan (-24.21)Turkmenistan (-23.43)Ukraine (-21.80)
Ecosystem SustainabilityUganda (+12.67)Switzerland (+11.76)Burkina Faso (+10.75)
Libya (-52.83)Turkmenistan (-27.27)Bahrain (-27.05)
Opp
ortu
nity
Personal RightsCape Verde (+28.20)Ghana (+19.16)Timor-Leste (+15.11)
Saudi Arabia (-74.89)United Arab Emirates (-62.86)Bahrain (-54.89)
Personal Freedom and ChoiceRwanda (+13.26)Uruguay (+10.35)Lesotho (+6.10)
Angola (-27.33)Saudi Arabia (-25.72)Iraq (-22.51)
Tolerance and InclusionUruguay (+21.83)Portugal (+12.85)Costa Rica (+11.29)
Saudi Arabia (-24.26)Bahrain (-22.39)Pakistan (-21.77)
Access to Advanced EducationRussia (+22.07)Ukraine (+21.51)Kyrgyzstan (+21.18)
Kuwait (-28.51)Bahrain (-19.78)Qatar (-18.78)
Table 4.1 / Overperfomers and Underperformers by Dimension and Component
100 Social Progress Index 2015 | © Social Progress Imperative 2015Social Progress Index 2015 | © Social Progress Imperative 2015
ASSESSING COUNTRY STRENGTHS AND WEAKNESSES: THE SOCIAL PROGRESS
INDEX SCORECARD
We use this data to analyze each country in detail and develop country-level scorecards. Our goal is to help leaders, citizens, and observers identify a country’s relative strengths and weaknesses. These scorecards highlight priorities and urgent areas for potential investments. It is clear that country performance on a particular component may be influenced by numerous factors, including the type, level, and concentration of its natural endowments (such as land, labor, and capital) as well as its institutions. For example, access to Water and Sanitation is relatively easier for small, densely-populated countries with effective government institutions in tropical climates, versus for large, sparsely-populated countries with poorly-functioning governments in arid climates. These factors should be considered to understand relative strengths and weaknesses and when structuring and prioritizing interventions to bolster social progress.
Country scorecards are color-coded to highlight at a glance a country’s areas of strength and weakness relative to its income peers. Red indicates performance significantly below the peer group median; yellow indicates performance consistent with the peer group; and green highlights an area of relative strength.
The scorecard allows a deepening of what we observe from overall social progress rankings. The scorecard for South Africa (see Figure 4.3) provides a good example. Overall, South Africa ranks 63rd on the Social Progress Index and 62nd on GDP per capita, showing average performance on relative social progress. The scorecard highlights the specific components driving these results, and the complex pattern underlying South Africa’s overall average performance. On the Opportunity dimension, the scorecard shows that South Africa over-performs relative to its economic peers, exhibiting particular strengths in Personal Rights and Personal Freedom and Choice. This reflects the priority given to such issues in the post-apartheid constitutional arrangements.
Yet South Africa performs very poorly on Basic Human Needs, with weakness on three of its components: Nutrition and Basic Medical Care, Shelter, and, in particular, Personal Safety. This reflects the legacy of apartheid, since basic infrastructure was inadequate and public investments were not made necessary for the majority of the population. The data also shows that investments since 1994 have not been sufficient to offset this history.
While South Africa shows neutral performance on Foundations of Wellbeing overall, a more nuanced picture emerges at the component level. Nutrition and Basic Medical Care (in the Basic Human Needs dimension) and Health and Wellness (in the Foundations of Wellbeing dimension) are both strikingly weak. This reflects significant struggles in containing the spread of communicable diseases often seen in emerging nations lacking strong health infrastructure (South Africa’s HIV/AIDS epidemic is well-documented and has lowered life-expectancy) as well as the increasing prevalence of health conditions associated with rising incomes (such as non-communicable diseases and obesity). Across these measures of health, South Africa seems to have the worst of both worlds.
CHAPTER 4 / BENCHMARKING SOCIAL PROGRESS
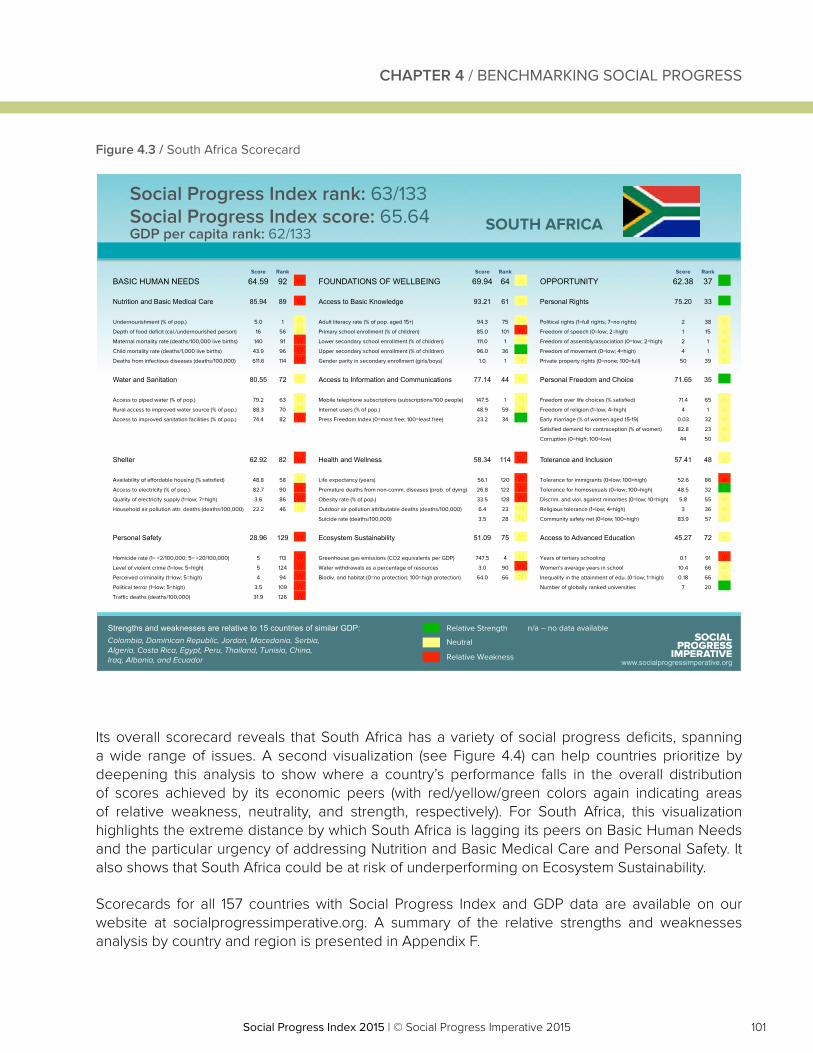
101Social Progress Index 2015 | © Social Progress Imperative 2015Social Progress Index 2015 | © Social Progress Imperative 2015
Its overall scorecard reveals that South Africa has a variety of social progress deficits, spanning a wide range of issues. A second visualization (see Figure 4.4) can help countries prioritize by deepening this analysis to show where a country’s performance falls in the overall distribution of scores achieved by its economic peers (with red/yellow/green colors again indicating areas of relative weakness, neutrality, and strength, respectively). For South Africa, this visualization highlights the extreme distance by which South Africa is lagging its peers on Basic Human Needs and the particular urgency of addressing Nutrition and Basic Medical Care and Personal Safety. It also shows that South Africa could be at risk of underperforming on Ecosystem Sustainability.
Scorecards for all 157 countries with Social Progress Index and GDP data are available on our website at socialprogressimperative.org. A summary of the relative strengths and weaknesses analysis by country and region is presented in Appendix F.
Figure 4.3 / South Africa Scorecard
www.socialprogressimperative.org
Strengths and weaknesses are relative to 15 countries of similar GDP: Relative Strength n/a – no data available
Neutral
Relative Weakness
SOUTH AFRICA
Score Rank Score Rank Score Rank
BASIC HUMAN NEEDS 64.59 92 W FOUNDATIONS OF WELLBEING 69.94 64 N OPPORTUNITY 62.38 37 S
Nutrition and Basic Medical Care 85.94 89 W Access to Basic Knowledge 93.21 61 N Personal Rights 75.20 33 S
Undernourishment (% of pop.) 5.0 1 N Adult literacy rate (% of pop. aged 15+) 94.3 75 N Political rights (1=full rights; 7=no rights) 2 38 N
Depth of food deficit (cal./undernourished person) 16 56 N Primary school enrollment (% of children) 85.0 101 W Freedom of speech (0=low; 2=high) 1 15 N
Maternal mortality rate (deaths/100,000 live births) 140 91 W Lower secondary school enrollment (% of children) 111.0 1 N Freedom of assembly/association (0=low; 2=high) 2 1 N
Child mortality rate (deaths/1,000 live births) 43.9 96 W Upper secondary school enrollment (% of children) 96.0 36 S Freedom of movement (0=low; 4=high) 4 1 N
Deaths from infectious diseases (deaths/100,000) 611.6 114 W Gender parity in secondary enrollment (girls/boys) 1.0 1 N Private property rights (0=none; 100=full) 50 39 N
Water and Sanitation 80.55 72 N Access to Information and Communications 77.14 44 N Personal Freedom and Choice 71.65 35 S
Access to piped water (% of pop.) 79.2 63 N Mobile telephone subscriptions (subscriptions/100 people) 147.5 1 N Freedom over life choices (% satisfied) 71.4 65 N
Rural access to improved water source (% of pop.) 88.3 70 N Internet users (% of pop.) 48.9 59 N Freedom of religion (1=low; 4=high) 4 1 N
Access to improved sanitation facilities (% of pop.) 74.4 82 W Press Freedom Index (0=most free; 100=least free) 23.2 34 S Early marriage (% of women aged 15-19) 0.03 32 N
Satisfied demand for contraception (% of women) 82.8 23 N
Corruption (0=high; 100=low) 44 50 N
Shelter 62.92 82 W Health and Wellness 58.34 114 W Tolerance and Inclusion 57.41 48 N
Availability of affordable housing (% satisfied) 48.8 58 N Life expectancy (years) 56.1 120 W Tolerance for immigrants (0=low; 100=high) 52.6 86 W
Access to electricity (% of pop.) 82.7 90 W Premature deaths from non-comm. diseases (prob. of dying) 26.8 122 W Tolerance for homosexuals (0=low; 100=high) 48.5 32 S
Quality of electricity supply (1=low; 7=high) 3.6 86 W Obesity rate (% of pop.) 33.5 128 W Discrim. and viol. against minorities (0=low; 10=high) 5.8 55 N
Household air pollution attr. deaths (deaths/100,000) 22.2 46 N Outdoor air pollution attributable deaths (deaths/100,000) 6.4 23 N Religious tolerance (1=low; 4=high) 3 36 N
Suicide rate (deaths/100,000) 3.5 28 N Community safety net (0=low; 100=high) 83.9 57 N
Personal Safety 28.96 129 W Ecosystem Sustainability 51.09 75 N Access to Advanced Education 45.27 72 N
Homicide rate (1= <2/100,000; 5= >20/100,000) 5 113 W Greenhouse gas emissions (CO2 equivalents per GDP) 747.5 4 N Years of tertiary schooling 0.1 91 W
Level of violent crime (1=low; 5=high) 5 124 W Water withdrawals as a percentage of resources 3.0 90 W Women's average years in school 10.4 66 N
Perceived criminality (1=low; 5=high) 4 94 W Biodiv. and habitat (0=no protection; 100=high protection) 64.0 66 N Inequality in the attainment of edu. (0=low; 1=high) 0.18 66 N
Political terror (1=low; 5=high) 3.5 109 W Number of globally ranked universities 7 20 S
Traffic deaths (deaths/100,000) 31.9 126 W
Colombia, Dominican Republic, Jordan, Macedonia, Serbia, Algeria, Costa Rica, Egypt, Peru, Thailand, Tunisia, China, Iraq, Albania, and Ecuador
GDP per capita rank: 62/133
Social Progress Index rank: 63/133 Social Progress Index score: 65.64
CHAPTER 4 / BENCHMARKING SOCIAL PROGRESS
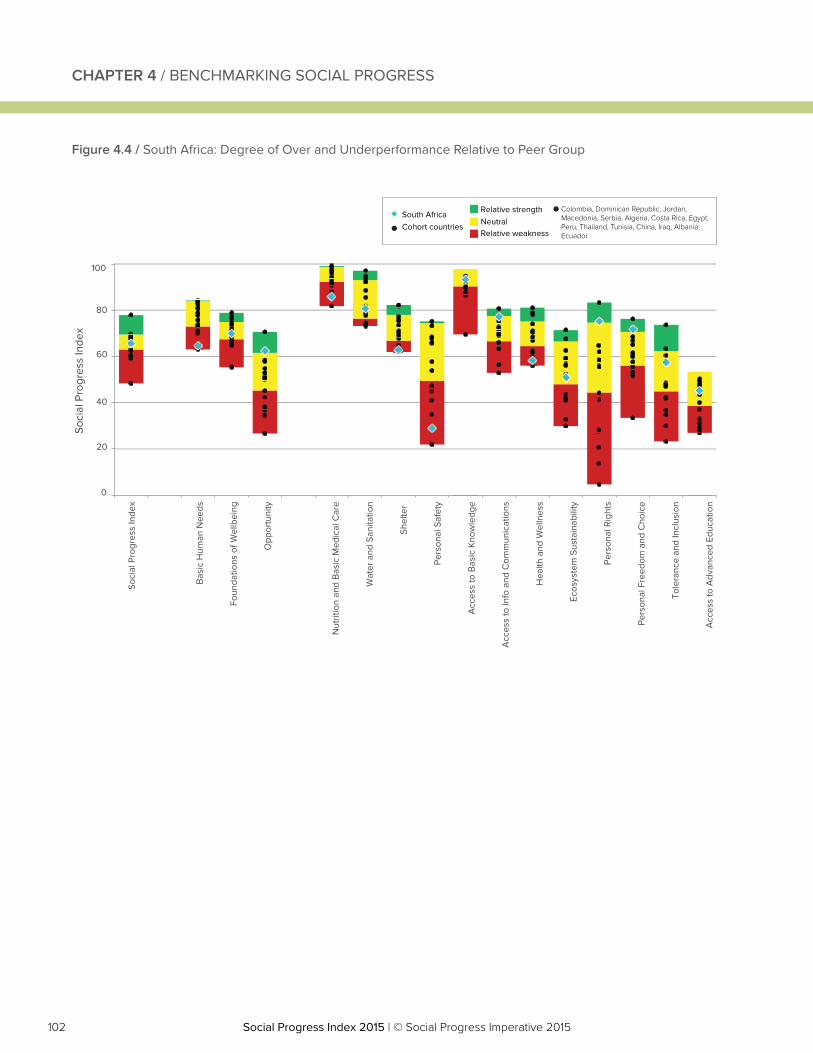
102 Social Progress Index 2015 | © Social Progress Imperative 2015Social Progress Index 2015 | © Social Progress Imperative 2015
Figure 4.4 / South Africa: Degree of Over and Underperformance Relative to Peer Group
0
20
40
60
80
100
Shel
ter
Soci
al P
rogr
ess
Inde
x
Bas
ic H
uman
Nee
ds
Foun
datio
ns o
f Wel
lbei
ng
Opp
ortu
nity
Nut
ritio
n an
d B
asic
Med
ical
Car
e
Wat
er a
nd S
anita
tion
Pers
onal
Saf
ety
Acc
ess
to B
asic
Kno
wle
dge
Acc
ess
to In
fo a
nd C
omm
unic
atio
ns
Hea
lth a
nd W
elln
ess
Ecos
yste
m S
usta
inab
ility
Pers
onal
Rig
hts
Pers
onal
Fre
edom
and
Cho
ice
Tole
ranc
e an
d In
clus
ion
Acc
ess
to A
dvan
ced
Educ
atio
n
Soci
al P
rogr
ess
Inde
x
South AfricaRelative strengthNeutralRelative weakness
Cohort countries
Colombia, Dominican Republic, Jordan, Macedonia, Serbia, Algeria, Costa Rica, Egypt, Peru, Thailand, Tunisia, China, Iraq, Albania, Ecuador
CHAPTER 4 / BENCHMARKING SOCIAL PROGRESS
103Social Progress Index 2015 | © Social Progress Imperative 2015Social Progress Index 2015 | © Social Progress Imperative 2015
SOCIAL PROGRESS ROLE MODELS
In addition to examining their own scorecards, countries should also examine the social progress scorecards of their economic peers, with a particular eye towards identifying those countries that are able, within a given level of income per capita, to realize relative social progress strengths in particular areas. As we have highlighted earlier, Costa Rica offers an instructive example of social progress performance, with particular strengths across all three dimensions of the model and in the Shelter, Access to Information and Communications, Health and Wellness, Personal Rights, Personal Freedom and Choice, and Tolerance and Inclusion components. By looking at what is achievable among their economic peers, countries can prioritize a social progress agenda that is feasible within their resource constraints.
CONCLUSION
By measuring country performance relative to a country’s 15 closest income peers, we gain a deeper understanding of each country’s respective performance and development. We see that even high-income countries can have significant weaknesses relative to their peers, and low-income countries can have significant strengths. Through this finer lens, policymakers can better identify and prioritize areas in need of improvement within their own countries. Scorecards may also surface potential models for improvement by highlighting comparative over-performers.
CHAPTER 4 / BENCHMARKING SOCIAL PROGRESS

Social Progress Index 2015 | © Social Progress Imperative 2015Social Progress Index 2015 | © Social Progress Imperative 2015

105Social Progress Index 2015 | © Social Progress Imperative 2015Social Progress Index 2015 | © Social Progress Imperative 2015
CHAPTER 5APPLICATIONS OF THE SOCIAL PROGRESS INDEX
106 Social Progress Index 2015 | © Social Progress Imperative 2015Social Progress Index 2015 | © Social Progress Imperative 2015
CHAPTER 5 / APPLICATIONS OF THE SOCIAL PROGRESS INDEX
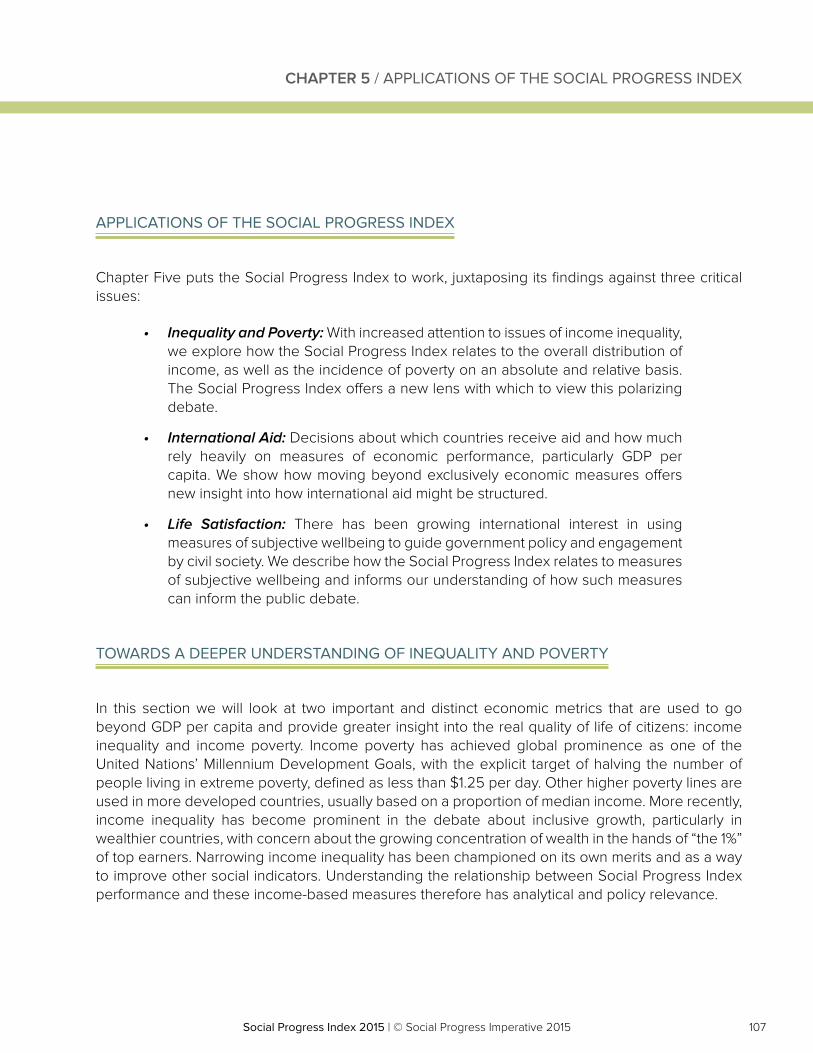
107Social Progress Index 2015 | © Social Progress Imperative 2015Social Progress Index 2015 | © Social Progress Imperative 2015
CHAPTER 5 / APPLICATIONS OF THE SOCIAL PROGRESS INDEX
APPLICATIONS OF THE SOCIAL PROGRESS INDEX
Chapter Five puts the Social Progress Index to work, juxtaposing its findings against three critical issues:
• Inequality and Poverty: With increased attention to issues of income inequality, we explore how the Social Progress Index relates to the overall distribution of income, as well as the incidence of poverty on an absolute and relative basis. The Social Progress Index offers a new lens with which to view this polarizing debate.
• International Aid: Decisions about which countries receive aid and how much rely heavily on measures of economic performance, particularly GDP per capita. We show how moving beyond exclusively economic measures offers new insight into how international aid might be structured.
• Life Satisfaction: There has been growing international interest in using measures of subjective wellbeing to guide government policy and engagement by civil society. We describe how the Social Progress Index relates to measures of subjective wellbeing and informs our understanding of how such measures can inform the public debate.
TOWARDS A DEEPER UNDERSTANDING OF INEQUALITY AND POVERTY
In this section we will look at two important and distinct economic metrics that are used to go beyond GDP per capita and provide greater insight into the real quality of life of citizens: income inequality and income poverty. Income poverty has achieved global prominence as one of the United Nations’ Millennium Development Goals, with the explicit target of halving the number of people living in extreme poverty, defined as less than $1.25 per day. Other higher poverty lines are used in more developed countries, usually based on a proportion of median income. More recently, income inequality has become prominent in the debate about inclusive growth, particularly in wealthier countries, with concern about the growing concentration of wealth in the hands of “the 1%” of top earners. Narrowing income inequality has been championed on its own merits and as a way to improve other social indicators. Understanding the relationship between Social Progress Index performance and these income-based measures therefore has analytical and policy relevance.
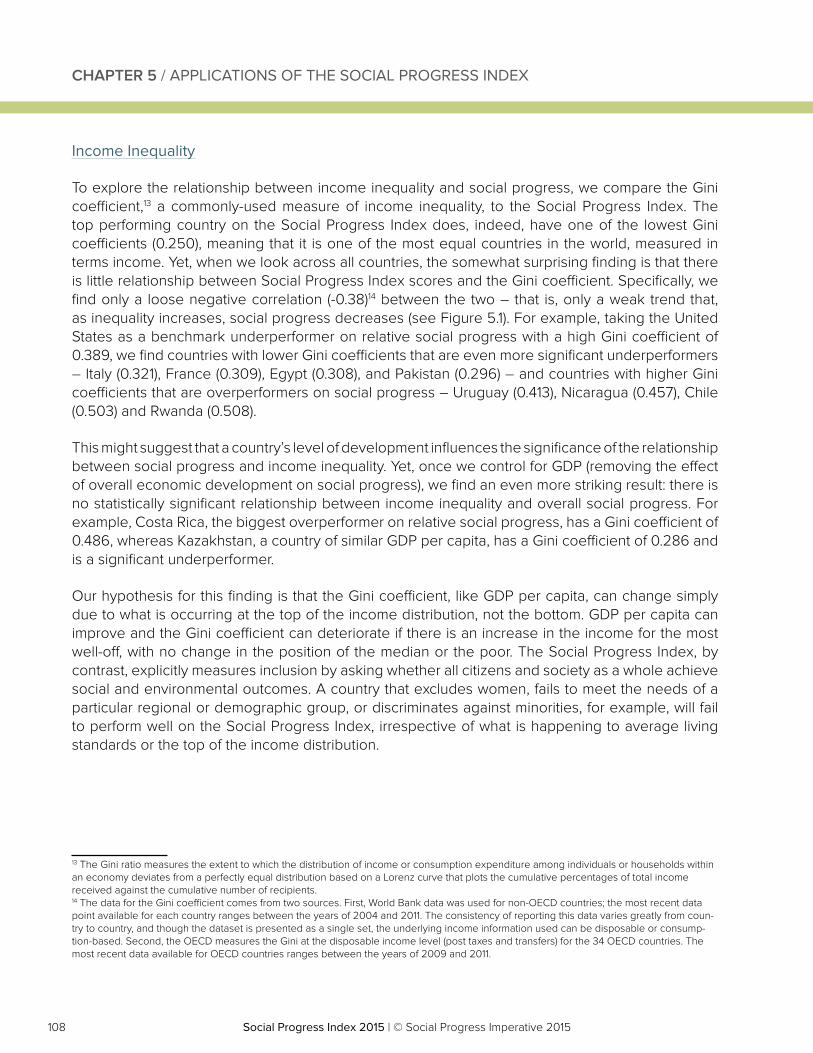
108 Social Progress Index 2015 | © Social Progress Imperative 2015Social Progress Index 2015 | © Social Progress Imperative 2015
CHAPTER 5 / APPLICATIONS OF THE SOCIAL PROGRESS INDEX
Income Inequality
To explore the relationship between income inequality and social progress, we compare the Gini coefficient,13 a commonly-used measure of income inequality, to the Social Progress Index. The top performing country on the Social Progress Index does, indeed, have one of the lowest Gini coefficients (0.250), meaning that it is one of the most equal countries in the world, measured in terms income. Yet, when we look across all countries, the somewhat surprising finding is that there is little relationship between Social Progress Index scores and the Gini coefficient. Specifically, we find only a loose negative correlation (-0.38)14 between the two – that is, only a weak trend that, as inequality increases, social progress decreases (see Figure 5.1). For example, taking the United States as a benchmark underperformer on relative social progress with a high Gini coefficient of 0.389, we find countries with lower Gini coefficients that are even more significant underperformers – Italy (0.321), France (0.309), Egypt (0.308), and Pakistan (0.296) – and countries with higher Gini coefficients that are overperformers on social progress – Uruguay (0.413), Nicaragua (0.457), Chile (0.503) and Rwanda (0.508).
This might suggest that a country’s level of development influences the significance of the relationship between social progress and income inequality. Yet, once we control for GDP (removing the effect of overall economic development on social progress), we find an even more striking result: there is no statistically significant relationship between income inequality and overall social progress. For example, Costa Rica, the biggest overperformer on relative social progress, has a Gini coefficient of 0.486, whereas Kazakhstan, a country of similar GDP per capita, has a Gini coefficient of 0.286 and is a significant underperformer.
Our hypothesis for this finding is that the Gini coefficient, like GDP per capita, can change simply due to what is occurring at the top of the income distribution, not the bottom. GDP per capita can improve and the Gini coefficient can deteriorate if there is an increase in the income for the most well-off, with no change in the position of the median or the poor. The Social Progress Index, by contrast, explicitly measures inclusion by asking whether all citizens and society as a whole achieve social and environmental outcomes. A country that excludes women, fails to meet the needs of a particular regional or demographic group, or discriminates against minorities, for example, will fail to perform well on the Social Progress Index, irrespective of what is happening to average living standards or the top of the income distribution.
13 The Gini ratio measures the extent to which the distribution of income or consumption expenditure among individuals or households within an economy deviates from a perfectly equal distribution based on a Lorenz curve that plots the cumulative percentages of total income received against the cumulative number of recipients.14 The data for the Gini coefficient comes from two sources. First, World Bank data was used for non-OECD countries; the most recent data point available for each country ranges between the years of 2004 and 2011. The consistency of reporting this data varies greatly from coun-try to country, and though the dataset is presented as a single set, the underlying income information used can be disposable or consump-tion-based. Second, the OECD measures the Gini at the disposable income level (post taxes and transfers) for the 34 OECD countries. The most recent data available for OECD countries ranges between the years of 2009 and 2011.
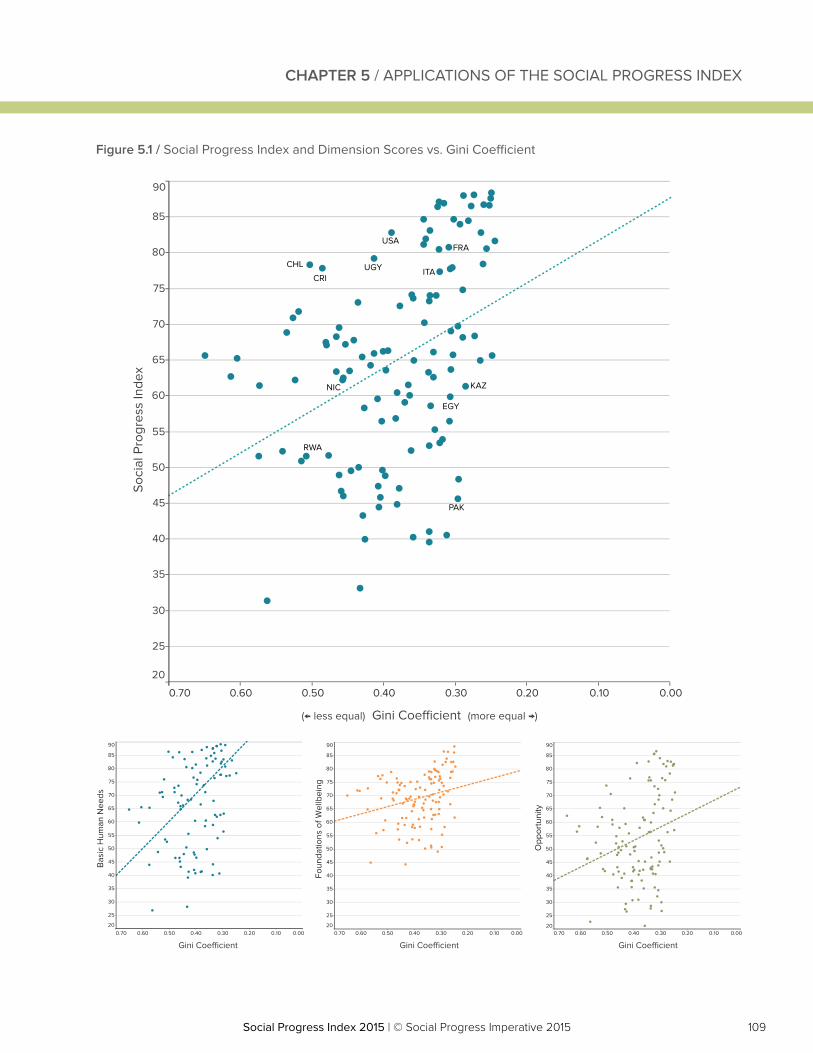
109Social Progress Index 2015 | © Social Progress Imperative 2015Social Progress Index 2015 | © Social Progress Imperative 2015
CHAPTER 5 / APPLICATIONS OF THE SOCIAL PROGRESS INDEX
0.000.100.200.300.400.500.600.70
20
25
30
35
40
45
50
55
60
65
70
75
80
85
90
Soci
al P
rogr
ess
Inde
x
(← less equal) Gini Coe�cient (more equal →)
0.000.100.200.300.400.500.600.70
20
25
30
35
40
45
50
55
60
65
70
75
80
85
90
Bas
ic H
uman
Nee
ds
0.000.100.200.300.400.500.600.70 0.000.100.200.300.400.500.600.70
Gini Coe�cient
20
25
30
35
40
45
50
55
60
65
70
75
80
85
90
Foun
datio
ns o
f Wel
lbei
ng
25
20
30
35
40
45
50
55
60
65
70
75
80
85
90
Opp
ortu
nity
Gini Coe�cient Gini Coe�cient
USAFRA
ITA
EGY
PAK
RWA
KAZNIC
UGYCHL
CRI
Figure 5.1 / Social Progress Index and Dimension Scores vs. Gini Coefficient
110 Social Progress Index 2015 | © Social Progress Imperative 2015Social Progress Index 2015 | © Social Progress Imperative 2015
Disaggregated further to the level of the dimension, we find no statistically significant relationship, controlling for GDP, between Gini coefficient and either Foundations of Wellbeing (-0.26) or Opportunity (-0.27)15. The only dimension where we find a meaningful correlation with income inequality (after controlling for GDP per capita) is with Basic Human Needs (-0.50). As we described in Chapter 3, Basic Human Needs shows the strongest correlation with GDP per capita (0.76) and improves rapidly for poor countries in particular. In other words, even after controlling for the overall level of resources in a society, those countries that have been unable to effectively allow individuals to meet their Basic Human Needs tend also to have a highly unequal distribution of income.
Poverty
Unlike the Gini coefficient, income poverty measures necessarily look at the bottom of the income distribution. To explore the relationship between income poverty and social progress we look at two measures of poverty: absolute and relative.
Absolute extreme poverty is defined by the Millennium Development Goals as $1.25 USD a day. This is a very low bar. In order to give our analysis greater relevance across countries of different levels of development we have therefore used the percentage of the population living on $2.00 USD a day or less16 within low, lower middle, and upper middle income countries.
We find that, as Social Progress Index scores increase, the percentage of those living in extreme poverty falls.17 Poverty is negatively and significantly correlated (-0.84) with social progress (Figure 5.2). This result is statistically significant and holds even when controlling for GDP per capita. It holds for all three dimensions of the Index.
The reasons that low social progress is associated with severe poverty, though perhaps not surprising, are still important to understand. The most direct relationship is that, as we have seen, poor countries tend to have lower social progress and are more likely to have a greater proportion of people living in severe poverty. That is, for some countries, a simple lack of resources is a binding constraint on both social progress and poverty. But that cannot be the entire story since countries with similarly low incomes can have widely different performance on social progress and poverty. Take for example Nigeria and Mozambique, which share a very high poverty rate of 82%, yet vary considerably in GDP per capita (Nigeria $5,423, Mozambique $1,070) and in social progress (Nigeria 43.31, Mozambique 46.02). Low social progress – the inability to achieve social outcomes such as a minimal level of nutrition, housing, or education, among other factors – is a direct manifestation of the inability of citizens within that society to participate successfully in the economy. At low levels of economic development, a proactive social progress agenda will thus be essential to reduce extreme poverty. Equipping citizens with basic assets such as health, primary education, and safety are preconditions for productively engaging in the economy.
15 OLS regressions were used to assess the statistical significance of relationships between the Social Progress Index, its dimensions, and economic inequality measures controlling for GDP, measured as the log of GDP per capita PPP 2011 constant international dollars. There were 118 observations in the sample; significance is measured at the 95% confidence level. We found a similar result when using the Palma ratio to measure income inequality (-0.26 correlation). The Palma ratio is defined as the top 10% of households’ income divided by the bottom 40%, directly measuring the distribution between rich and poor.16 World Bank data; the most recent data point available for each country, ranging from 2005 to 2013, this analysis was restricted to low, lower middle, and upper middle income groups.17 Narrowing the sample to low, lower middle, and upper middle income countries reduces the number of observations to 80. Significance is measured at the 90% confidence level.
CHAPTER 5 / APPLICATIONS OF THE SOCIAL PROGRESS INDEX
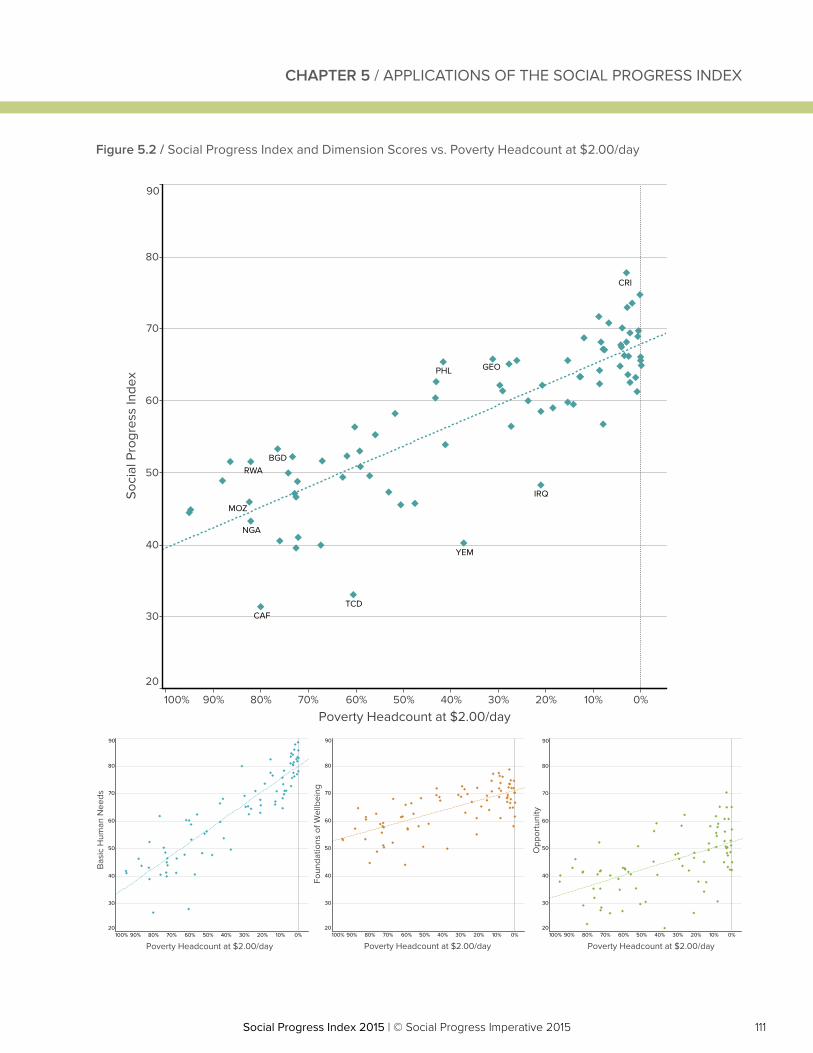
111Social Progress Index 2015 | © Social Progress Imperative 2015Social Progress Index 2015 | © Social Progress Imperative 2015
0%10%20%30%40%50%60%70%80%90%100%
Poverty Headcount at $2.00/day
20
30
40
50
60
70
80
90
Soci
al P
rogr
ess
Inde
x
0%10%20%30%40%50%60%70%80%90%100%
Poverty Headcount at $2.00/day
20
30
40
50
60
70
80
90
Bas
ic H
uman
Nee
ds
0%10%20%30%40%50%60%70%80%90%100%
Poverty Headcount at $2.00/day
20
30
40
50
60
70
80
90
Foun
datio
ns o
f Wel
lbei
ng
0%10%20%30%40%50%60%70%80%90%100%
Poverty Headcount at $2.00/day
20
30
40
50
60
70
80
90
Opp
ortu
nity
MOZ
NGA
CAFTCD
YEM
IRQ
BGD
GEO
CRI
PHL
RWA
Figure 5.2 / Social Progress Index and Dimension Scores vs. Poverty Headcount at $2.00/day
CHAPTER 5 / APPLICATIONS OF THE SOCIAL PROGRESS INDEX
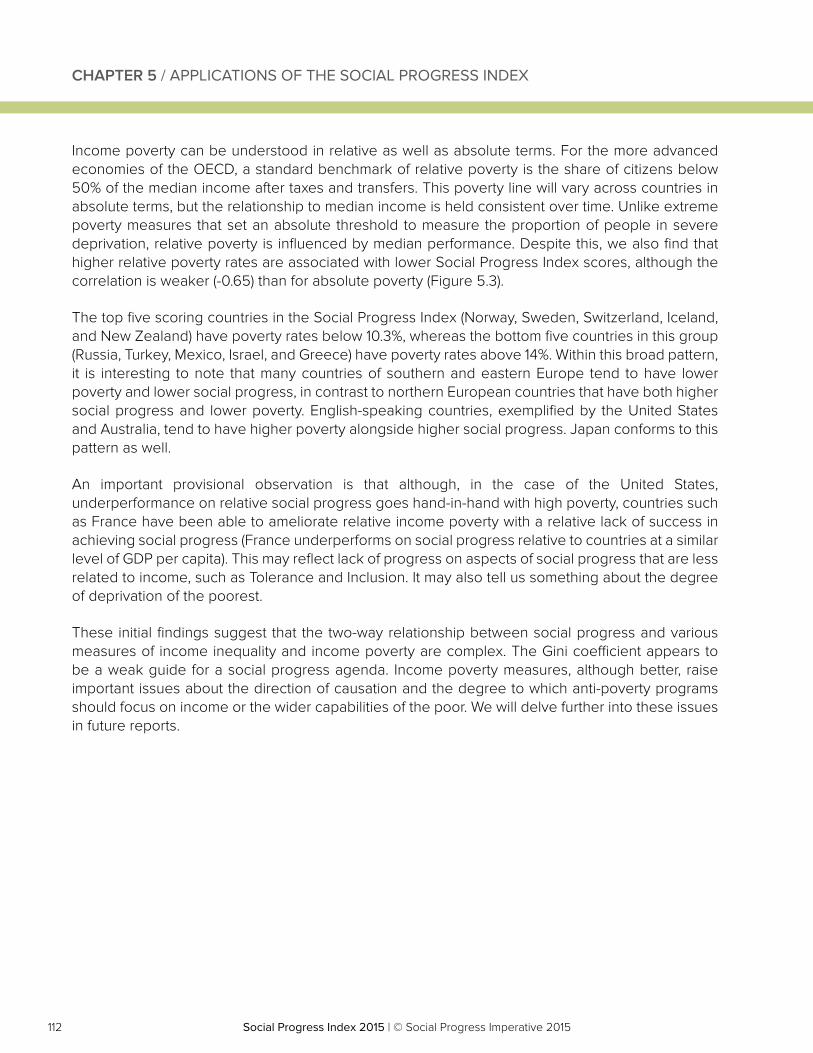
112 Social Progress Index 2015 | © Social Progress Imperative 2015Social Progress Index 2015 | © Social Progress Imperative 2015
Income poverty can be understood in relative as well as absolute terms. For the more advanced economies of the OECD, a standard benchmark of relative poverty is the share of citizens below 50% of the median income after taxes and transfers. This poverty line will vary across countries in absolute terms, but the relationship to median income is held consistent over time. Unlike extreme poverty measures that set an absolute threshold to measure the proportion of people in severe deprivation, relative poverty is influenced by median performance. Despite this, we also find that higher relative poverty rates are associated with lower Social Progress Index scores, although the correlation is weaker (-0.65) than for absolute poverty (Figure 5.3).
The top five scoring countries in the Social Progress Index (Norway, Sweden, Switzerland, Iceland, and New Zealand) have poverty rates below 10.3%, whereas the bottom five countries in this group (Russia, Turkey, Mexico, Israel, and Greece) have poverty rates above 14%. Within this broad pattern, it is interesting to note that many countries of southern and eastern Europe tend to have lower poverty and lower social progress, in contrast to northern European countries that have both higher social progress and lower poverty. English-speaking countries, exemplified by the United States and Australia, tend to have higher poverty alongside higher social progress. Japan conforms to this pattern as well.
An important provisional observation is that although, in the case of the United States, underperformance on relative social progress goes hand-in-hand with high poverty, countries such as France have been able to ameliorate relative income poverty with a relative lack of success in achieving social progress (France underperforms on social progress relative to countries at a similar level of GDP per capita). This may reflect lack of progress on aspects of social progress that are less related to income, such as Tolerance and Inclusion. It may also tell us something about the degree of deprivation of the poorest.
These initial findings suggest that the two-way relationship between social progress and various measures of income inequality and income poverty are complex. The Gini coefficient appears to be a weak guide for a social progress agenda. Income poverty measures, although better, raise important issues about the direction of causation and the degree to which anti-poverty programs should focus on income or the wider capabilities of the poor. We will delve further into these issues in future reports.
CHAPTER 5 / APPLICATIONS OF THE SOCIAL PROGRESS INDEX
113Social Progress Index 2015 | © Social Progress Imperative 2015Social Progress Index 2015 | © Social Progress Imperative 2015
0.000.020.040.060.080.100.120.140.160.180.200.220.24
Poverty Rate
64
66
68
70
72
74
76
78
80
82
84
86
88
Soci
al P
rogr
ess
Inde
x
United States
United Kingdom
Turkey
Switzerland Sweden
SpainSlovenia
Slovak Republic
Russia
Portugal
Poland
Norway
New ZealandNetherlands
Mexico
Korea
Japan
Italy
Israel
Ireland
Iceland
Hungary
Greece
Germany
France
Finland
Estonia
Denmark
Czech Republic
Chile
Canada
Belgium
Austria
Australia
Figure 5.3 / OECD Countries’ Social Progress Index Scores vs GDP per capita
CHAPTER 5 / APPLICATIONS OF THE SOCIAL PROGRESS INDEX
114 Social Progress Index 2015 | © Social Progress Imperative 2015Social Progress Index 2015 | © Social Progress Imperative 2015
SOCIAL PROGRESS AND THE ALLOCATION OF AID
International aid agencies, such as the World Bank; Global Fund for AIDS, Tuberculosis and Malaria; and Gavi, the Vaccine Alliance, rely on measures of economic performance, gross national income (GNI) in particular, to determine which countries should receive aid and how much aid each should receive. Using such measures to allocate resources to the most needy has traditionally directed aid to low-income countries. Yet, such a decision rule is becoming questionable as fewer countries fall into the low-income category. India, for example, which is home to 292 million people living in absolute poverty, is now a lower-middle income country and will receive less aid in the future as a result.18 Indeed, 73% of the world’s poor are now living in middle income countries.19
The use of income cutoffs for aid eligibility creates the risk that countries with many people living in poverty can lose concessional aid all as they graduate from low- and lower-middle income status. Research by Rodrigo Salvado and Julie Walz of the Bill and Melinda Gates Foundation estimates that, between 2013 and 2030, 41 countries will face this transition based on GNI growth projections.20 For India, this will result in the loss of a combined 40% of official development assistance in 2015 from the International Development Association, Gavi, and UK bilateral aid alone. This reduction in resources threatens to blunt progress on poverty reduction.
The Social Progress Index, by offering a perspective on societal outcomes that is independent of economic performance, offers an important new perspective on country aid allocations, for what programs, and in what amounts. In Figure 5.4, we compare the performance of social progress of countries grouped by their World Bank income classifications (low-, lower-middle, upper-middle, and high-income). The median Social Progress Index score for these groups – as expected, given the positive correlation between social progress and GDP per capita – increases at each step. Yet, just as is there is variance in the correlation between GDP per capita and social progress, we see significant overlaps in performance between the income groups.21
This pattern is repeated at the level of the dimension and component. For the Basic Human Needs dimension, again, we see countries in the upper-middle-income group that score in the same range as low-income countries on Basic Human Needs. For example, Angola (41.27), an upper-middle-income country, scores below Tanzania (41.39), a low-income country. Examining the underlying components of Basic Human Needs provides a more nuanced view. Median values in Figure 5.5 indicate that middle-income countries perform much better than low-income countries when it comes to Nutrition and Basic Medical Care. Yet some middle-income countries (Angola, Cameroon, Republic of Congo, Lesotho, Nigeria, Sudan, Swaziland, and Zambia) still perform below the median of low-income countries. For the Water and Sanitation component, the overlap is even greater with many lower middle income countries scoring in a range similar to low-income countries. Papua New Guinea, Congo, Nigeria and Mauritania score below the low-income country median.
18 World Bank population and poverty headcount at $1.25 (PPP) data from 2012.19 http://www.worldbank.org/en/country/mic/overview#120 Rodrigo Cesar Salvado and Julie Walz, “Aid Eligibility and Income per Capita: A Sudden Stop for MICs?” Bill & Melinda Gates Foundation, DPAF Working Paper Series 2013/05, August 2013.21 This variation in social progress also holds when countries are categorized according to the World Bank’s four lending eligibility groups: IDA, Blend, IBRD only, no lending
CHAPTER 5 / APPLICATIONS OF THE SOCIAL PROGRESS INDEX
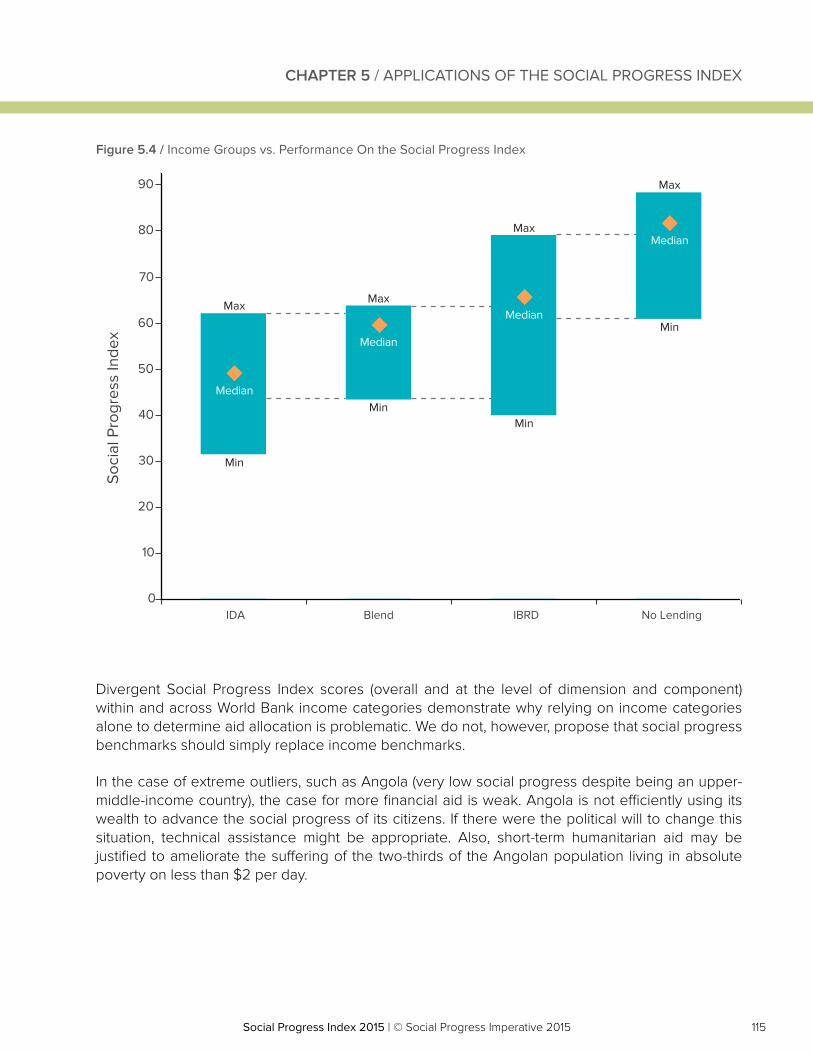
115Social Progress Index 2015 | © Social Progress Imperative 2015Social Progress Index 2015 | © Social Progress Imperative 2015
IDA Blend IBRD No Lending0
10
20
30
40
50
60
70
80
90
Soc
ial P
rogr
ess
Inde
x
Max
Min
Median
Max
Max
Min
Median
Max
Min
Median
Min
Median
Figure 5.4 / Income Groups vs. Performance On the Social Progress Index
Divergent Social Progress Index scores (overall and at the level of dimension and component) within and across World Bank income categories demonstrate why relying on income categories alone to determine aid allocation is problematic. We do not, however, propose that social progress benchmarks should simply replace income benchmarks.
In the case of extreme outliers, such as Angola (very low social progress despite being an upper-middle-income country), the case for more financial aid is weak. Angola is not efficiently using its wealth to advance the social progress of its citizens. If there were the political will to change this situation, technical assistance might be appropriate. Also, short-term humanitarian aid may be justified to ameliorate the suffering of the two-thirds of the Angolan population living in absolute poverty on less than $2 per day.
CHAPTER 5 / APPLICATIONS OF THE SOCIAL PROGRESS INDEX

116 Social Progress Index 2015 | © Social Progress Imperative 2015Social Progress Index 2015 | © Social Progress Imperative 2015
Water and SanitationNutrition and Basic Medical Care
Low Income Lower middleincome
Upper middleincome
High income Low Income Lower middleincome
Upper middleincome
High income0
10
20
30
40
50
60
70
80
90
100
Com
pone
nt S
core
Max
Median
Min
Max
Median
Min
Max
Median
Min
Max
Median
Min
Max
Median
Min
Max
Median
Min
Max
Median
Min
Max
Median
Min
Figure 5.5 / Income Group Performance on Nutrition & Basic Medical Care and Water & Sanitation
Our analysis highlights that countries that have recently crossed from the low- to lower-middle-income group, or will do so soon, are at risk of an abrupt reduction in aid that is not proportionate to their still low level of social progress. In Figure 5.6 we identify all the countries that fall in the low and very low social progress tiers (Social Progress Index score of less than 55), plotted against GDP capita, noting the income group into which they fall. We see clearly that countries such as Cameroon, Mauritania, Djibouti, Lesotho, Zambia, and Yemen still have significant social progress needs despite having achieved lower middle income status. Indeed, even for somewhat richer countries such as India and Nigeria, this suggests that an exit from aid might be premature.
We recognize that aid organizations have tried to ease the burden of crossing the low- to middle-income threshold through transition funding. Yet such transitional arrangements make assumptions about a country’s speed and direction of travel that may not be valid. The Social Progress Index complements income-based aid allocation by offering an independent, holistic measure of a country’s social performance. This will allow aid agencies to better assess country needs and allocate assistance, ensuring that countries’ exit from aid is sequenced more efficiently against the real needs of their citizens.22
22 Andy Sumner and Sergio Tezanos Vazquez, “How Has the Developing World Changed since the Late 1990s? A Dynamic and Multidimen-sional Taxonomy of Developing Countries.” Center for Global Development, Working Paper 375, August 2014.
CHAPTER 5 / APPLICATIONS OF THE SOCIAL PROGRESS INDEX
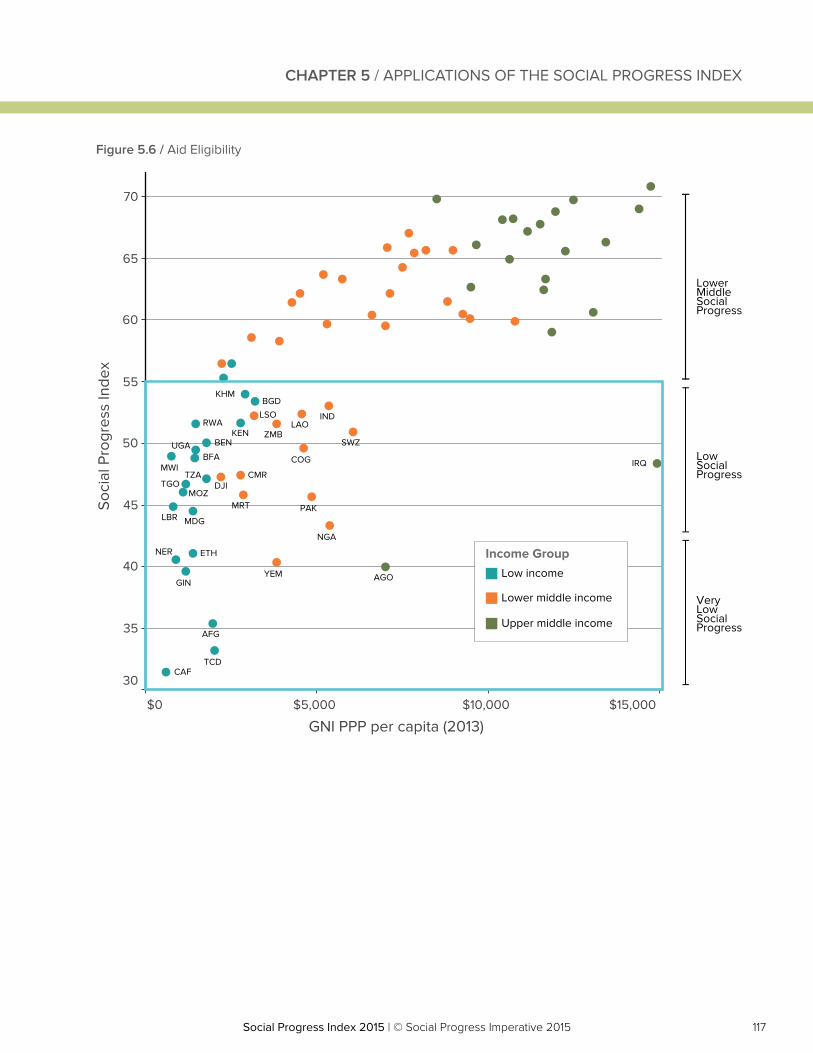
117Social Progress Index 2015 | © Social Progress Imperative 2015Social Progress Index 2015 | © Social Progress Imperative 2015
$0 $5,000 $10,000 $15,000
GNI PPP per capita (2013)
30
35
40
45
50
55
60
65
70
Soci
al P
rogr
ess
Inde
x
AFG
BENKEN
LSO
BFA
BGD
CAF
ETH
GIN
KHM
LBR MDG
MOZ
MWI
NER
RWA
TCD
TGO
UGA
CMRDJI
TZA
COG
INDLAO
MRT
NGA
PAK
SWZ
YEM
ZMB
AGO
IRQ
Income GroupLow income
LowSocialProgress
Very Low Social Progress
Lower Middle Social Progress
Lower middle income
Upper middle income
Figure 5.6 / Aid Eligibility
CHAPTER 5 / APPLICATIONS OF THE SOCIAL PROGRESS INDEX
118 Social Progress Index 2015 | © Social Progress Imperative 2015Social Progress Index 2015 | © Social Progress Imperative 2015
Social Progress and Life Satisfaction
Over the last decade, there has been a renewed interest in measuring subjective wellbeing, in terms of happiness or, more precisely, life satisfaction, as a complement to GDP. We have seen this with the World Happiness Report and the United Kingdom Office of National Statistics’ happiness measurement project. There is also interest in using life satisfaction as a policy tool. The UK Commission on Wellbeing and Policy, for example, has explored how wellbeing analysis can be applied in various aspects of health and social policy. Subjective wellbeing is different from actual social progress and is less clearly actionable. But the two can be complementary and inform each other. This section explores the relationship between subjective wellbeing and social progress, and its implications.
We begin by looking at the overall relationship between social progress and life satisfaction. We know that both are correlated with GDP per capita so it is not surprising that, as Figure 5.7 shows, social progress is highly correlated with life satisfaction. But, the relationship is more robust than this: after controlling for GDP, there is a statistically and quantitatively significant impact of the Social Progress Index on life satisfaction.
However, it is important to note that the relationship between subjective wellbeing and the Social Progress Index is complex. We have undertaken preliminary analysis of the relationship between subjective wellbeing and each dimension of the 2015 Index. Once one controls for GDP, there is no separate impact of the Basic Human Needs or Foundations of Wellbeing dimensions on subjective wellbeing; there is, however, a quite robust and independent impact of Opportunity on life satisfaction. To put this in perspective, it is useful to compare Russia and Mexico. Russia has a significantly higher GDP per capita than Mexico ($23,564 vs $16,291) and both countries score similarly on Basic Human Needs and Foundations of Wellbeing. Yet they diverge on Opportunity (Russia 49.19; Mexico 60.88). On self-reported life satisfaction, Mexico scores 7.03 on a ten-point scale, compared to 5.59 in Russia.
In part, this result is reflecting the interplay between the Social Progress Index and GDP per capita: GDP per capita is correlated with Basic Human Needs and Foundations of Wellbeing, but has only a noisy relationship with Opportunity. This finding raises a more fundamental point: exclusive attention to economic indicators as a means for raising subjective wellbeing has the consequence of distracting attention from aspects of social performance such as Tolerance and Inclusion or Personal Rights which are more loosely linked to traditional measures of economic development.
For countries like the United Kingdom and others, which are looking to measure and evaluate policies in terms of life satisfaction, this finding identifies interventions beyond simply increasing prosperity that are likely to have a positive impact, including rights, freedom of choice, social attitudes towards tolerance, and higher education.
CHAPTER 5 / APPLICATIONS OF THE SOCIAL PROGRESS INDEX
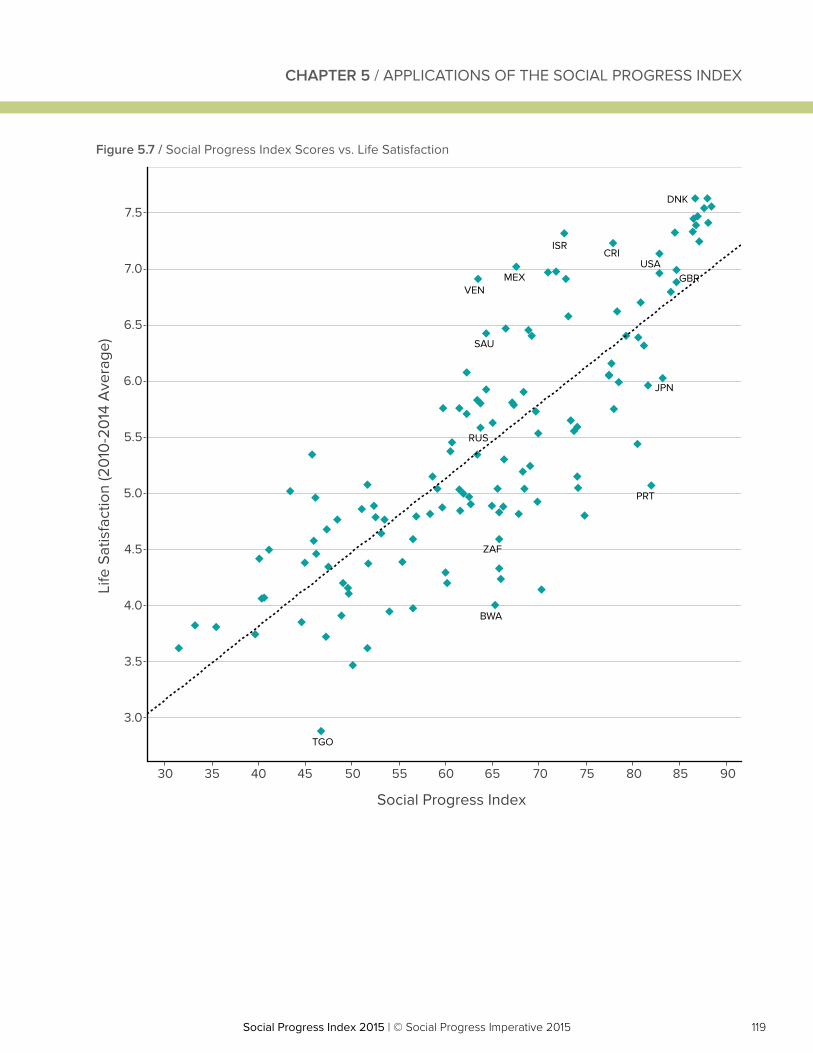
119Social Progress Index 2015 | © Social Progress Imperative 2015Social Progress Index 2015 | © Social Progress Imperative 2015
30 35 40 45 50 55 60 65 70 75 80 85 90
Social Progress Index
3.0
3.5
4.0
4.5
5.0
5.5
6.0
6.5
7.0
7.5
Life
Sat
isfa
ctio
n (2
010
-20
14 A
vera
ge)
MEX
ISRCRI
SAU
VEN
RUS
JPN
PRT
TGO
BWA
ZAF
USA
DNK
GBR
Figure 5.7 / Social Progress Index Scores vs. Life Satisfaction
CHAPTER 5 / APPLICATIONS OF THE SOCIAL PROGRESS INDEX
120 Social Progress Index 2015 | © Social Progress Imperative 2015Social Progress Index 2015 | © Social Progress Imperative 2015
Even for countries that are not deliberately pursuing life satisfaction, the relationship between Opportunity and life satisfaction may be important. It is notable that the countries that experienced the Arab Spring tend to underperform on Opportunity. If life satisfaction is linked to social discontent and civil unrest, countries may wish to mitigate risks of disorder through policies that improve Opportunity and enhance life satisfaction. For businesses too, Opportunity measures may therefore be a useful measure of potential social and political risk. This will require further investigation of the relationship to understand whether Opportunity may be a leading indicator of political instability or the rise of social movements.
CONCLUSION
The Social Progress Index offers a new lens to evaluate a number of pressing policy concerns and initiatives designed to address them. As concerns around inequality and calls for ‘inclusive growth’ have grown stronger in the wake of stagnating middle class incomes in high-income countries and growth in developing countries driven by extractive industries, we see increasing commitment to ‘shared prosperity’ based on intuitive objectives as opposed to empirical data. By providing a rigorous and holistic measure of inclusiveness that is independent of GDP and other economic measures, the Social Progress Index provides a powerful tool for leaders in government, business, and civil society to benchmark performance, identify priorities for action, and to track the impact of interventions.
In Chapter 6, we set out some case studies of how the Social Progress Index is already being used by governments, businesses and civil society organizations to have a positive impact on the lives of millions of people.
CHAPTER 5 / APPLICATIONS OF THE SOCIAL PROGRESS INDEX
121Social Progress Index 2015 | © Social Progress Imperative 2015Social Progress Index 2015 | © Social Progress Imperative 2015
CHAPTER 6THE SOCIAL PROGRESS NETWORK
122 Social Progress Index 2015 | © Social Progress Imperative 2015Social Progress Index 2015 | © Social Progress Imperative 2015
CHAPTER 6 / THE SOCIAL PROGRESS NETWORK
123Social Progress Index 2015 | © Social Progress Imperative 2015Social Progress Index 2015 | © Social Progress Imperative 2015
CHAPTER 6 / THE SOCIAL PROGRESS NETWORK
INTRODUCTION
The Social Progress Imperative empowers social innovators of all sectors by providing innovative measurement tools to build a common language that supports collaboration and drives change. In each country where we work, we promote the formation of a local action network convening government, businesses, academia, and civil society organizations willing to use the Social Progress Index as a tool to improve people’s lives.
Through national partnerships — the growing Social Progress Network — we are building a global “network of networks” promoted by the Social Progress Imperative. Under this umbrella, early adopters are engaging in initiatives that use the conceptual and methodological framework of the Social Progress Index as a starting point for action in their countries.
Through collaborative processes, members of a Social Progress Country Network apply the Social Progress Index methodology to their country and to regions, cities, and communities. The Index helps our partners to identify the most pressing social and environmental needs, describe them in a common language, prioritize resources, align interventions, promote innovative approaches, and measure the impact of those efforts.
The Social Progress Network is united by the principle that what we measure affects the choices we make. Our partners are champions of evidence-based policymaking and results-based management. They have a common understanding that the only way to address the most challenging problems is through collaboration across different sectors. They are all committed to transparency and accountability, empowering citizens through the right to information. They all share the common goal of improving people’s lives, especially those of the most vulnerable populations.
by Antonio Aranibar, Social Progress Imperative Partner Network Director
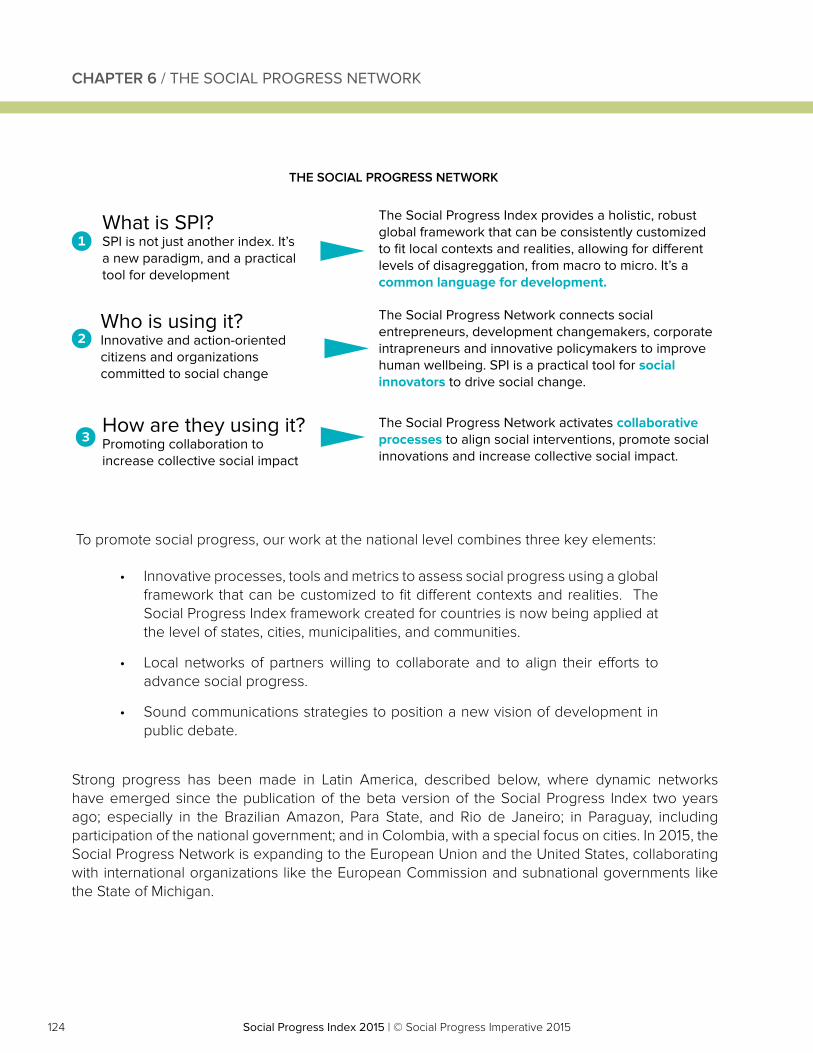
124 Social Progress Index 2015 | © Social Progress Imperative 2015Social Progress Index 2015 | © Social Progress Imperative 2015
To promote social progress, our work at the national level combines three key elements:
• Innovative processes, tools and metrics to assess social progress using a global framework that can be customized to fit different contexts and realities. The Social Progress Index framework created for countries is now being applied at the level of states, cities, municipalities, and communities.
• Local networks of partners willing to collaborate and to align their efforts to advance social progress.
• Sound communications strategies to position a new vision of development in public debate.
Strong progress has been made in Latin America, described below, where dynamic networks have emerged since the publication of the beta version of the Social Progress Index two years ago; especially in the Brazilian Amazon, Para State, and Rio de Janeiro; in Paraguay, including participation of the national government; and in Colombia, with a special focus on cities. In 2015, the Social Progress Network is expanding to the European Union and the United States, collaborating with international organizations like the European Commission and subnational governments like the State of Michigan.
CHAPTER 6 / THE SOCIAL PROGRESS NETWORK
THE SOCIAL PROGRESS NETWORK
How are they using it?Promoting collaboration to increase collective social impact
The Social Progress Network activates collaborative processes to align social interventions, promote social innovations and increase collective social impact.
What is SPI?SPI is not just another index. It’s a new paradigm, and a practical tool for development
The Social Progress Index provides a holistic, robust global framework that can be consistently customized to fit local contexts and realities, allowing for di�erent levels of disagreggation, from macro to micro. It’s a common language for development.
Who is using it?Innovative and action-oriented citizens and organizations committed to social change
The Social Progress Network connects social entrepreneurs, development changemakers, corporate intrapreneurs and innovative policymakers to improve human wellbeing. SPI is a practical tool for social innovators to drive social change.
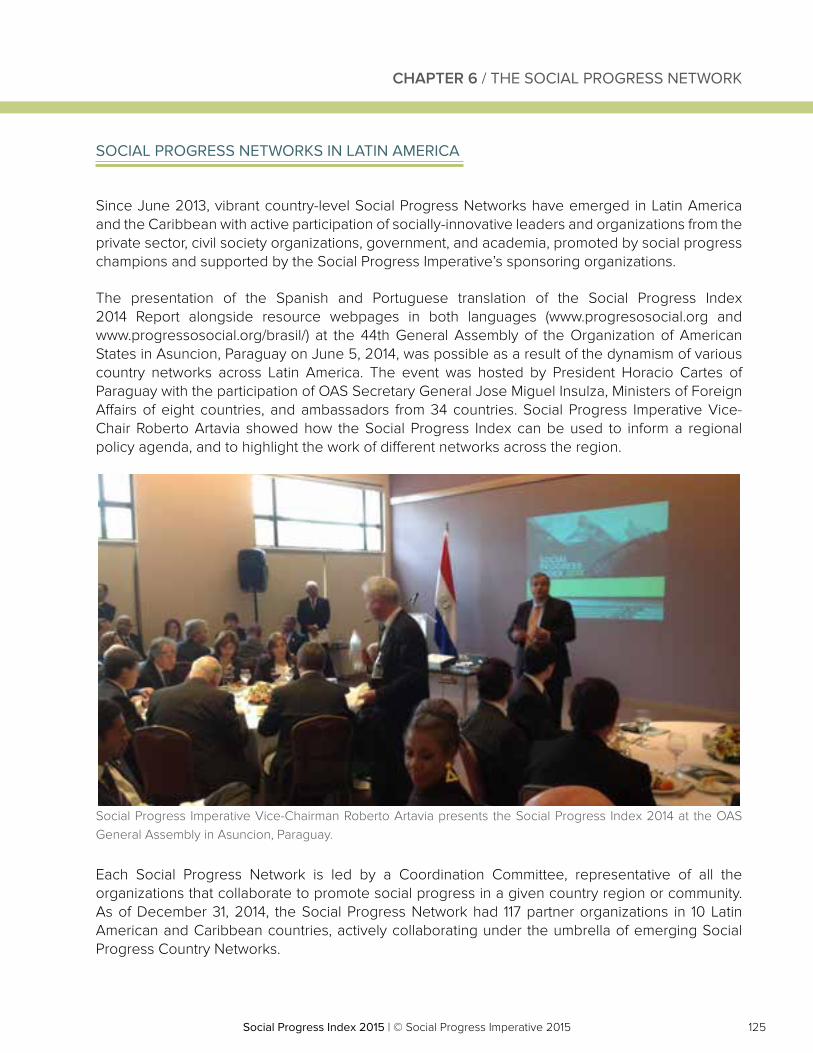
125Social Progress Index 2015 | © Social Progress Imperative 2015Social Progress Index 2015 | © Social Progress Imperative 2015
CHAPTER 6 / THE SOCIAL PROGRESS NETWORK
SOCIAL PROGRESS NETWORKS IN LATIN AMERICA
Since June 2013, vibrant country-level Social Progress Networks have emerged in Latin America and the Caribbean with active participation of socially-innovative leaders and organizations from the private sector, civil society organizations, government, and academia, promoted by social progress champions and supported by the Social Progress Imperative’s sponsoring organizations.
The presentation of the Spanish and Portuguese translation of the Social Progress Index 2014 Report alongside resource webpages in both languages (www.progresosocial.org and www.progressosocial.org/brasil/) at the 44th General Assembly of the Organization of American States in Asuncion, Paraguay on June 5, 2014, was possible as a result of the dynamism of various country networks across Latin America. The event was hosted by President Horacio Cartes of Paraguay with the participation of OAS Secretary General Jose Miguel Insulza, Ministers of Foreign Affairs of eight countries, and ambassadors from 34 countries. Social Progress Imperative Vice-Chair Roberto Artavia showed how the Social Progress Index can be used to inform a regional policy agenda, and to highlight the work of different networks across the region.
Each Social Progress Network is led by a Coordination Committee, representative of all the organizations that collaborate to promote social progress in a given country region or community. As of December 31, 2014, the Social Progress Network had 117 partner organizations in 10 Latin American and Caribbean countries, actively collaborating under the umbrella of emerging Social Progress Country Networks.
Social Progress Imperative Vice-Chairman Roberto Artavia presents the Social Progress Index 2014 at the OAS General Assembly in Asuncion, Paraguay.
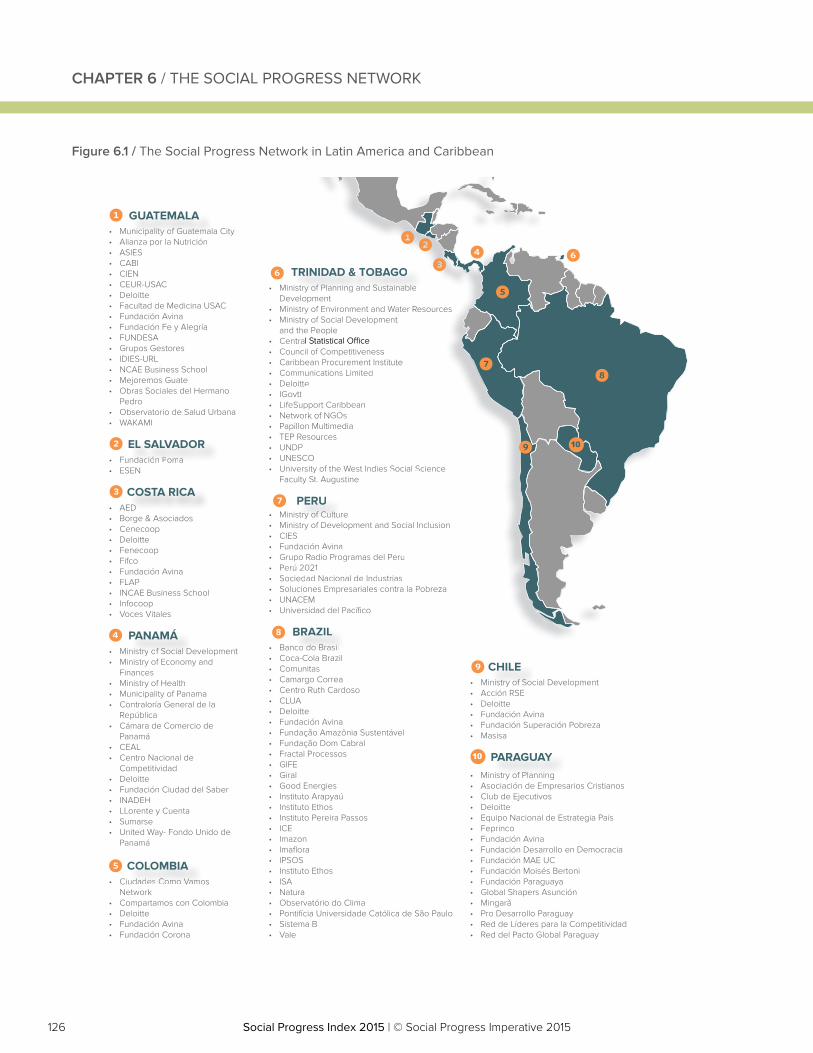
126 Social Progress Index 2015 | © Social Progress Imperative 2015Social Progress Index 2015 | © Social Progress Imperative 2015
Figure 6.1 / The Social Progress Network in Latin America and Caribbean
• Municipality of Guatemala City• Alianza por la Nutrición• ASIES• CABI• CIEN• CEUR-USAC• Deloitte• Facultad de Medicina USAC• Fundación Avina• Fundación Fe y Alegría• FUNDESA• Grupos Gestores• IDIES-URL• NCAE Business School• Mejoremos Guate• Obras Sociales del Hermano
Pedro• Observatorio de Salud Urbana• WAKAMI
niicicipapalilityty ooff GuGuatatememaala
GUATEMALA1
• Fundación Poma• ESEN
nddacacióiónn PPomomaa
EL SALVADOR2
• AED• Borge & Asociados• Cenecoop• Deloitte• Fenecoop• Fifco• Fundación Avina• FLAP• INCAE Business School• Infocoop• Voces Vitales
EDD
COSTA RICA3
• Ministry of Social Development• Ministry of Economy and
Finances• Ministry of Health• Municipality of Panama• Contraloría General de la
República• Cámara de Comercio de
Panamá• CEAL• Centro Nacional de
Competitividad• Deloitte• Fundación Ciudad del Saber• INADEH• LLorente y Cuenta• Sumarse• United Way- Fondo Unido de
Panamá
niststryry ooff SoSocicialal DD
PANAMÁ4
• Ciudades Como Vamos Network
• Compartamos con Colombia• Deloitte• Fundación Avina• Fundación Corona
uddadadeses CComomoo VVamamo
COLOMBIA5
• Ministry of Culture• Ministry of Development and Social Inclusion• CIES• Fundación Avina• Grupo Radio Programas del Peru• Perú 2021• Sociedad Nacional de Industrias• Soluciones Empresariales contra la Pobreza• UNACEM • Universidad del Pacífico
tryryPERU7
• Ministry of Planning and Sustainable Development
• Ministry of Environment and Water Resources• Ministry of Social Development
and the People• • Council of Competitiveness• Caribbean Procurement Institute• Communications Limited• Deloitte• IGovtt• LifeSupport Caribbean• Network of NGOs• Papillon Multimedia• TEP Resources• UNDP• UNESCO• University of the West Indies Social Science
Faculty St. Augustine
isttryry
TRINIDAD & TOBAGO6
• Banco do Brasil• Coca-Cola Brazil• Comunitas• Camargo Correa• Centro Ruth Cardoso• CLUA• Deloitte• Fundación Avina• Fundação Amazônia Sustentável• Fundação Dom Cabral• Fractal Processos• GIFE• Giral• Good Energies• Instituto Arapyaú• Instituto Ethos• Instituto Pereira Passos• ICE• Imazon• Imaflora• IPSOS• Instituto Ethos• ISA• Natura• Observatório do Clima• Pontifícia Universidade Católica de São Paulo• Sistema B• Vale
coo dodo BBrarasisill
BRAZIL8
• Ministry of Planning• Asociación de Empresarios Cristianos• Club de Ejecutivos• Deloitte• Equipo Nacional de Estrategia País• Feprinco• Fundación Avina• Fundación Desarrollo en Democracia• Fundación MAE UC• Fundación Moisés Bertoni• Fundación Paraguaya• Global Shapers Asunción• Mingarã• Pro Desarrollo Paraguay• Red de Líderes para la Competitividad• Red del Pacto Global Paraguay
nistry off PlPlan ining
PARAGUAY10
• Ministry of Social Development• Acción RSE• Deloitte• Fundación Avina• Fundación Superación Pobreza• Masisa
niiststryry ooff SoSoc
CHILE9
rey of Development and Social Inclusion
ción AvinaRadio Programas del Peru021ad Nacional de Industrias
ones Empresariales contra la PobrezaEM sidad del Pacífico
yy ooff CuCultltuuERUERU
y gopmenty of Environment and Water Resourcesy of Social Development e People
il of Competitivenessean Procurement Instituteunications Limitede
pport Caribbeanrk of NGOsn Multimedia
esources
COsity of the West Indies Social Sciencey St. Augustine
yy ooff PlPlananniningng aandnd SSusustataininabablele
INIINIDDAD &AD & DDD TTOBOBAAGOGOAAA
RAZILRAZIL
5
12
34 6
78
9 10
CHAPTER 6 / THE SOCIAL PROGRESS NETWORK
127Social Progress Index 2015 | © Social Progress Imperative 2015Social Progress Index 2015 | © Social Progress Imperative 2015
Types of initiatives in progress include:
1. Positioning the Social Progress Index as a leading measure for national performance;
2. Assessing social progress challenges at the subnational level;
3. Promoting applied research agendas on social progress drivers;
4. Promoting innovative approaches and ideas for public and private social investments; and
5. Promoting sharing of knowledge around successful, innovative ideas and approaches that foster social progress.
Select initiatives currently being implemented in Latin America, with support of Social Progress Country Networks, are:
• Bolivia: Development of a subjective Social Progress Index. Under leadership of the thinktank Ciudadanía, this initiative evaluates citizens’ demands and priorities to assess public policy design in five regions in the department of Cochabamba.
• Brazil: Implementation of a research agenda on development studies and sustainability indicators. Under the leadership of the Group of Future Studies of the Catholic University of Sao Paulo (NEF, PUC-SP), this initiative seeks to harmonize social development indicators commonly used for policy purposes in Brazil.
• Brazil: Development of a Social Progress Index at the community level. Coca-Cola Brasil and Natura joined forces for the first time to illuminate social conditions in Amazon communities. The two companies have already developed social actions with Amazon communities and buy their products. Now, in partnership with the community, they want to better understand their reality and commit to their socioeconomic development. This initiative will provide insight into the wider social impact of business.
• Chile: Development of a Social Progress Index for the Bio-Bio region. Under leadership of Fundaciόn Avina, Masisa and regional organizations, this initiative aims to support the working agenda of the “Sustainability Roundtable” which convenes the regional government alongside community-based organizations and forestry companies, to promote sustainable development in the region.
• Colombia: Development of a Social Progress Index for the city of Bogotá. With co-leadership of three foundations from the private sector and civil society, this initiative aims to inform policy debate and to support public policy implementation analyzing social progress trends at the district level.
CHAPTER 6 / THE SOCIAL PROGRESS NETWORK
128 Social Progress Index 2015 | © Social Progress Imperative 2015Social Progress Index 2015 | © Social Progress Imperative 2015
• Costa Rica: Development of a Social Progress Index for the cooperative sector. Under the leadership of the cooperative movement, this initiative applies the Social Progress Index methodology at the community level to assess the social impact of the cooperatives’ productive model in traditional regions of Costa Rica, to identify pressing social needs of thousands of affiliates of the cooperative movement, and to provide insight into the social impact of various productive sectors.
• El Salvador: Development of an online platform to map social investments. Under the leadership of Fundaciόn Poma, a private foundation, this tool will summarize ongoing social investments according to the 12 components of the Social Progress Index. Fundaciόn Poma is also applying the Social Progress Framework to assess the social impact in rural communities of its leading social program “Libras de Amor.”
• Guatemala: Development of a Social Progress Index for Guatemala City, under leadership of the Municipality of Guatemala (see Box: The Social Progress Network in Guatemala).
THE SOCIAL PROGRESS NETWORK IN GUATEMALA
On November 5, 2014 a new partnership for social progress was born. The Instituto Progreso Social Guatemala (Guatemalan Social Progress Institute), institutional sponsor of #Progreso Social Guatemala (the Guatemalan Social Progress Network), was publicly launched by its founder, Emmanuel Seidner, alongside Guatemalan Minister of Economy Sergio de la Torre, and Social Progress Imperative Vice Chair Roberto Artavia.
Emmanuel Seidner, a businessman, academic, congressman and founder of Instituto Progreso Social Guatemala, said, “This is an exciting step forward. The coming together of this diverse group of senior leaders from across civil society, business, and government has the power to be genuinely transformative: driving social progress improvements across a wide range of areas here in Guatemala.” Raquel Zelaya, chair of ASIES, said, “To include many unrelated data sources into a single framework represents a major challenge in regard to the collection of data, but it also has the major advantage of being less likely to be affected by problems affecting some official data sources.”
The most advanced of several initiatives is being led by the municipal government of Guatemala City in partnership with the Guatemalan Social Progress Institute to produce a subnational index for the biggest city in Central America. The city is heterogeneous in income, culture, and ethnicity, and structured in distinct zones by economic activity. The new Social Progress Index for the Municipality of Guatemala City will cover one million people living in the center of the city, and will help to establish a baseline that shows where future investments are most needed to create major social impact and to encourage the private sector to invest in the zones that need more economic activity.
This initiative is a true multi-sector partnership involving several members of #Progreso Social Guatemala. Research, including construction of a customized set of indicators and components, is led by experts in the city and the region in the municipal government (MUNIGUATE). The project also represents an opportunity for the municipality and the country to advance their use of open data platforms. While multi-sector partnerships are not new in Guatemala, collaborations involving public sharing of data have been rare in Guatemala City.
CHAPTER 6 / THE SOCIAL PROGRESS NETWORK
129Social Progress Index 2015 | © Social Progress Imperative 2015Social Progress Index 2015 | © Social Progress Imperative 2015
• Paraguay: Application of the Social Progress Framework to individual employees of private corporations. Under the leadership of Fundaciόn Paraguaya, a microfinance institution, this initiative seeks to evaluate the living conditions of the workforce of private corporations in order to promote improvements in their quality of life.
• Trinidad and Tobago: Development of a subnational Social Progress Index. Under the co-leadership of the Ministry of Planning and Sustainable Development and the University of West Indies, this initiative will provide a social progress map and a new model for measuring national performance. It seeks to strengthen data production, analyze wellbeing and living conditions of citizens, and provide a framework for public policy and social investments in the country.
BRAZIL: ACTIONABLE METRICS FOR SOCIAL CHANGE
“Whatever the project, we must imagine what its impact on social indices will be, and then think about how we can improve this project so it does not harm these indicators but fosters social advances. Citizens expect that from their government and need concrete answers in this direction.” Simao Jatene, the Governor of the State of Pará in the Brazilian Amazon, speaking to his staff on February 23, 2015, shares his vision for his state’s development plan for the next four years. That plan will be based on the Social Progress Index map of the 144 municipalities in Pará.
Just three months after general and state elections were held in Brazil, this is the first of many initiatives that has been fostered by the publication of the first subnational Social Progress Index for the Brazilian Amazon, or IPS Amazônia, promoted by #Progresso Social Brasil with support of Fundaciόn Avina and authored by the Brazilian nonprofit Imazon.
The IPS Amazônia report employed the same basic methodology as the global Social Progress Index and used 43 indicators to measure the social performance of 772 municipalities and nine states of the Brazilian Amazon. This custom Index combined globally relevant indicators, such as maternal mortality rates, with customized indicators adapted to the local context, such as deforestation rates, malaria incidence, and violence against indigenous people. IPS Amazônia built on analysis of data from different parts of the Brazilian government to identify specific strengths and weaknesses in each municipality and state in the Brazilian Amazon, compared to a national score for Brazil. This approach forms the basis of our Guidelines for Subnational Indices (see Box: Guidelines for Subnational Indices).
CHAPTER 6 / THE SOCIAL PROGRESS NETWORK
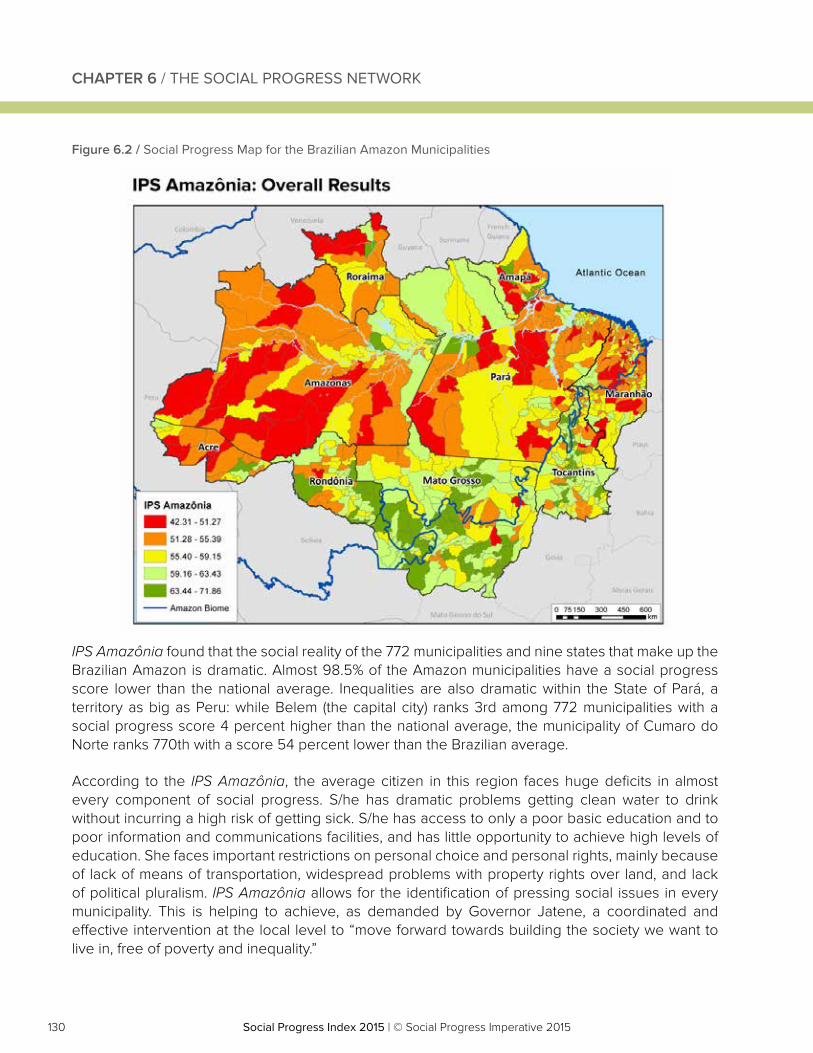
130 Social Progress Index 2015 | © Social Progress Imperative 2015Social Progress Index 2015 | © Social Progress Imperative 2015
IPS Amazônia found that the social reality of the 772 municipalities and nine states that make up the Brazilian Amazon is dramatic. Almost 98.5% of the Amazon municipalities have a social progress score lower than the national average. Inequalities are also dramatic within the State of Pará, a territory as big as Peru: while Belem (the capital city) ranks 3rd among 772 municipalities with a social progress score 4 percent higher than the national average, the municipality of Cumaro do Norte ranks 770th with a score 54 percent lower than the Brazilian average.
According to the IPS Amazônia, the average citizen in this region faces huge deficits in almost every component of social progress. S/he has dramatic problems getting clean water to drink without incurring a high risk of getting sick. S/he has access to only a poor basic education and to poor information and communications facilities, and has little opportunity to achieve high levels of education. She faces important restrictions on personal choice and personal rights, mainly because of lack of means of transportation, widespread problems with property rights over land, and lack of political pluralism. IPS Amazônia allows for the identification of pressing social issues in every municipality. This is helping to achieve, as demanded by Governor Jatene, a coordinated and effective intervention at the local level to “move forward towards building the society we want to live in, free of poverty and inequality.”
Figure 6.2 / Social Progress Map for the Brazilian Amazon Municipalities
CHAPTER 6 / THE SOCIAL PROGRESS NETWORK

131Social Progress Index 2015 | © Social Progress Imperative 2015Social Progress Index 2015 | © Social Progress Imperative 2015
The IPS Amazônia also identifies stories of success: municipalities that have been efficient in transforming economic resources into social progress, while preserving biodiversity and promoting ecosystem sustainability. The study showed that it is not necessary to cut down the rainforest to achieve high levels of social progress. In a meeting at the Federal Ministry of Social Development held in Brasilia prior to the launch of the report, the IPS Amazônia was recognized as a useful and practical tool for policy research and policymaking.
The IPS Amazônia is also becoming a useful tool for leading corporations to identify unmet social needs in their value-chain. In 2014, Coca-Cola and Natura, with technical support from IPSOS and support from other partners of #Progresso Social Brasil, joined together to develop the first ever community-based Social Progress Index. Known as IPS Comunidades, the methodology has been developed and implemented with traditional communities from a specific territory in the Amazon region to present a more holistic view of community needs in a study developed through primary sources.
The SPI methodology was adapted to the community, through a holistic and integrated framework, providing a common language to assess programs run by multiple local stakeholders in the given territory. By aligning measurement tools, different companies, policymakers, social movements, and government agencies will understand better how to jointly increase their collective social impact
As this report goes to press, the IPS Comunidades results are being presented for a full evaluation by the citizens of the territory, in a participatory and accountable process to evaluate needs of the population. The results will be consistent with the broader social progress map of the Brazilian Amazon, allowing for the integration of micro-macro approaches for social investment, and facilitating public-private partnerships for social progress.
Without a new development paradigm that fosters a dramatic and sustained improvement in social conditions of Brazilian Amazon inhabitants, the protection of this vital environmental region will be difficult to safeguard. But as highlighted by Beto Verissimo, named one of the 100 most influential people in 2014 in Brazil by Epoca Magazine for his leadership on the IPS Amazônia, “in the next four years, $20 billion will be invested in the State of Pará according to a new vision of development and a new approach for public policy.” By using the Social Progress Index, #Progresso Social Brasil has an opportunity to make sure that investments such as these lead to real improvements in peoples’ lives.
CHAPTER 6 / THE SOCIAL PROGRESS NETWORK
132 Social Progress Index 2015 | © Social Progress Imperative 2015Social Progress Index 2015 | © Social Progress Imperative 2015
PARAGUAY: REINVENTING THE FUTURE
On December 23, 2014, the President of Paraguay, Horacio Cartes, signed Decree 2794 presenting the 2030 National Development Plan that, when approved by Congress, will guide development in Paraguay for the next 15 years. “The goals are ambitious – aiming to achieve a truly competitive and inclusive country, free from extreme poverty, with equal opportunities for all and social development indicators among the highest in South America,” stated José Molinas Vega, Paraguay’s Minister of Planning.
The plan outlines concrete steps and objectives to drive that country’s economic, social, and international policy. A key feature of this plan for widespread reform is the innovative way the country will measure and monitor its development: the Social Progress Index. The Decree and the plan (translated from the original Spanish) both declare: “To monitor the efficiency of public spending and the effect that it is generating in the population, the methodology proposed by the Social Progress Index will be used. This methodology measures only results in social and environmental issues, in a multi-dimensional way, which will provide a comprehensive overview of social progress in the country and place it in a proper international context.” According to Raul Gauto, of Fundación Avina and a social progress champion in Paraguay, “we aim to evolve from being mere budget spenders to measure change in social progress that these investments generate in our population.”
This ambitious plan to use the Social Progress Index to formally guide a country’s social investments began in 2013, when a Social Progress Index Steering Committee was established in Paraguay acknowledging that while economic growth was an opportunity, it was not sufficient to deliver social progress. The plan arose from “a wide societal consensus about the vision of our country’s future,” according to Minister Molinas. It involved leaders from across the country including social activists, academics, entrepreneurs, and politicians.
Only two years later, thanks to the work of #Progreso Social Paraguay and the commitment of two successive heads of state, the country’s national development plan contains specific and actionable social goals, including improving life expectancy and mental health, ensuring personal safety, reducing environmental hazards, broadening access to the Internet, protecting biodiversity, promoting women’s rights, securing inclusion of least one Paraguayan university in the world’s top 400, and increasing overall access to tertiary education. The country’s government and a broad coalition of actors from different sectors of society believe that these targets, along with a commitment to economic growth, will position Paraguay to be a regional leader by 2030.
CHAPTER 6 / THE SOCIAL PROGRESS NETWORK
133Social Progress Index 2015 | © Social Progress Imperative 2015Social Progress Index 2015 | © Social Progress Imperative 2015
The Government Budget for 2015 has been aligned with the 12 priorities identified by the National Development Plan 2030, and has already been discussed and approved in the National Congress. It includes, for example, important investments in the water sector ($115 million USD to build three sewage treatment plants) and a sharp increase in funds allocated to reduce undernourishment in Paraguay (from $10 million USD in 2014 to $22 million in 2015 and hopefully $40 million in 2016).
Addressing nutrition, for example, will no longer be solely the focus of the government. #Progreso Social Paraguay has collaborated with the Food and Agriculture Organization of the U.N. to create new foods of high nutritional quality. Members of the network have convinced mayors and governors to designate storage facilities in rural areas so that the National Institute for Nutrition could safely store food closer to where it is consumed, reducing spoilage and cost, and making distribution possible even when heavy rains cut road access to remote areas.
To improve housing, the government will underwrite certain risks so that the private sector can finance housing for young married couples in both urban and rural areas. A working group on housing has met with the national union of architects and engineers to develop new models for social housing, to look for alternatives beyond traditional, slow, and expensive brick construction, which many in Paraguay have considered the only option for home construction and which has contributed to a lack of housing.
Thirty-four public and private organizations have been brought together to agree to an action plan through 2017 that details specific goals and initiatives to improve public works in water and sanitation. #Progreso Social Paraguay has also helped connect the ministry of public works with indigenous communities to plan the large Chaco Aqueduct, an infrastructure project backed by the Government of Spain and the Inter-American Development Bank to aid an area where 80 percent of the population does not have access to a stable water source. Previous failures to consult with local communities have led to instances of multiple water systems being built for one community while a neighboring community went without.
Referring to the National Development Plan as “a unique event in the history of our country,” President Cartes said, “2015 will be a big year for Paraguay.”
CHAPTER 6 / THE SOCIAL PROGRESS NETWORK
134 Social Progress Index 2015 | © Social Progress Imperative 2015Social Progress Index 2015 | © Social Progress Imperative 2015
COLOMBIA: BUILDING SOCIAL PROGRESS CITIES
In April 2014, the city of Medellín in Colombia hosted the seventh World Urban Forum, the world’s premier conference on cities convened every two years by UN-Habitat. Over six days, more than 10,000 participants from 160 countries discussed the “most pressing issues facing the world today in the area of human settlements.” The choice of Medellín as host city recognized its status as an “international example of urban transformation through social urbanism,” with policies prioritizing “vulnerable communities with solutions for accessible mobility, inclusive governance and quality education, together with the recovery of public space and green areas throughout the city.”23
Despite many institutional challenges, in the last decade Colombian cities have proven to be fertile places for innovations in urban policies. With 75% of the Colombian population living in urban areas, cities have grown in size, complexity and importance, which have turned them into major centers of resources and skills, with distinct spatial and human dynamics.
One such innovation was promoted by Fundación Corona back in 1997: a robust methodology to promote informed debates about quality of life in Colombian cities, using official data produced by municipal authorities as well as survey data gathered by not-for-profit organizations united in the “Ciudades Como Vamos” network. The model, which counted on the active participation of different stakeholders including media, was quickly exported to different cities in Brazil and other Latin American countries with leadership from Fundación Avina and financial support from the Bill & Melinda Gates Foundation giving birth to the “Ciudades Justas, Democráticas y Sustentables” Network. More recently, the Inter-American Development Bank has been promoting the adoption of the “Como Vamos” methodology in smaller but rapidly growing cities, through an emerging network of “Ciudades Emergentes y Sustentables.” Today, all three networks together reach more than 70 cities in Latin America, the most urbanized region in the developing world.
In 2015, the Ciudades Como Vamos network, in partnership with Fundación Avina, Compartamos Con Colombia, Deloitte, the Social Progress Imperative and other partners will launch #Progreso Social Colombia alongside a new tool to provide useful, relevant and up-to-date information for urban policymakers: a Social Progress Index for Cities.
The first ever intra-city Social Progress Index will be launched in Bogotá, providing a social progress map for 20 districts in a city of eight million inhabitants and allowing for policy-relevant analysis tracking the changes the city has gone through year-by-year from 2009 to 2014. A city-level Social Progress Index will then provide a social progress map of 13 Colombian cities, including Bogotá in an integrated measurement model. These city-level Social Progress Indices will be monitored on a yearly basis providing an in-depth understanding of urban dynamics in Colombian cities.
23 http://wuf7.unhabitat.org/wuf7medellin.
CHAPTER 6 / THE SOCIAL PROGRESS NETWORK
135Social Progress Index 2015 | © Social Progress Imperative 2015Social Progress Index 2015 | © Social Progress Imperative 2015
Those tools will then be widely shared among the more than 70 Latin American cities which are already tracking social progress data and generating innovative urban policies. In 2016, Rio de Janeiro will not only host the Olympics, but will showcase to the world, through the “Pacto Do Rio”24 using a customized Social Progress Index for the city to promote public-private partnerships, that it is a world-class, sustainable, inclusive, and integrated city. A globally-relevant community of practice of social progress cities may soon emerge in Latin America.
THE EUROPEAN UNION: INFORMING REGIONAL POLICY
On October 15, 2014, representatives of the Directorate of Regional and Urban Policy and the Joint Research Centre both of the European Commission, Deloitte Touche, Tohmatsu, the Social Progress Imperative and the Basque Regional Government joined their colleagues of Orkestra — the Basque Institute for Economic Competitiveness — at the University of Deusto in San Sebastian, Spain to assess the relevance and feasibility of a Regional Social Progress Index for the European Union. The group reached three conclusions:
1. Regional governments throughout Europe are demanding sound, consistent and comparable disaggregated data on social and environmental issues to inform broader and more inclusive regional development models.
2. Despite the many technical challenges encountered during the exploratory phase preceding the workshop, computing a Social Progress Index for 272 regions in 28 European countries was deemed not only feasible but highly desirable to inform the next Cohesion Report in 2017.
3. The development of a network of European regions using this data to share knowledge on social progress drivers and expertise on socially innovative policies was identified as a key demand arising from policymakers.
As a result, a three-year collaborative process led by the European Commission, promoted by all the organizations that participated in the workshop and open to every European institution that wants to help advance a regional social progress agenda, was born. Its concrete first step will be to present a beta version of a Social Progress Index at the NUTS-II level for the EU-28 by October 2015, to receive feedback, refine the model and broaden partnerships with regional governments and think tanks. This will help to build a community of practice around regional policies for social progress.
24 The “Pacto Do Rio,” launched on December 2014 with strong leadership of the Instituto Pereira Passos, is a set of articulated commitments between the public and private sectors, academia and civil society on the basis of qualified and shared information to promote and monitor the sustainable development of the city of Rio de Janeiro, Brazil. #Progresso Social Brazil is actively supporting this social pact, by facilitating technical assistance to build a Social Progress Index for the city, and promoting the participation of social progress partnering organizations.
CHAPTER 6 / THE SOCIAL PROGRESS NETWORK
136 Social Progress Index 2015 | © Social Progress Imperative 2015Social Progress Index 2015 | © Social Progress Imperative 2015
THE UNITED STATES: REINVENTING URBAN POLICIES
As the results of the 2015 Social Progress Index clearly convey, the United States is underperforming on social progress despite its economic advantages. In a country the size of the U.S., with cities in various stages of economic revitalization following years of economic decline, changing demographics, and rapid urbanization, the challenges to social progress are diverse. The demand — and need — to measure social progress in cities and regions across the country is clear. The Social Progress Imperative has therefore begun to build a U.S. Partner Network.
Mayor Joseph Curtatone is leading the first application of the Social Progress Index at the subnational level in the United States in Somerville, Massachusetts. A team from SomerStat, the Mayor’s Office of Innovation and Analytics, joined a group of Social Progress Fellows and methodological experts at the MIT Sloan School of Management in February 2015 to present the first version of a customized model for the city. This initiative will produce a baseline of the city’s social progress and will identify key areas of intervention as part of a strategic long-term development plan that aims to tackle some of the city’s most pressing urban issues related to housing, open space, jobs, and mobility.
In the state of Michigan, Rick Snyder began his first term as Governor in 2011 with a 10-point plan to “Reinvent Michigan.” One objective in his 10-point plan is to restore cities. Public Sector Consultants and the Brookings Institute in a 2012 study found that 14 municipal areas in Michigan are home to 82% of the population, 84% of the jobs, 85% of the exports, 85% of post-secondary degree holders, 86% of GDP, and 91% of science and engineering jobs. The Social Progress Imperative is partnering with the Governor’s Director of Urban Initiatives and a coalition of leading business, academic, and civil society institutions. They will consolidate a set of Key Performance Indicators, using the Social Progress Index methodology, to facilitate the implementation and monitoring of an Urban Development Agenda for the major cities across the state. Leading with a four-city pilot, and with a special focus on Detroit, this project will be the first inter-city subnational measurement of Social Progress in the United States.
In California, we are exploring the multiple counties that comprise the San Francisco Bay area and engaging with social innovators among the county and city governments, leading civil society institutions, and major tech firms located there to design a broad measurement of social progress in the country’s center of innovation.
CHAPTER 6 / THE SOCIAL PROGRESS NETWORK
137Social Progress Index 2015 | © Social Progress Imperative 2015Social Progress Index 2015 | © Social Progress Imperative 2015
THE BASQUE COUNTRY LEADING THE WAY
The evolution of the concept of competitiveness can no longer be isolated from social and environmental dimensions: it is increasingly evident that a model of development based on economic development alone is incomplete. Territorial competitiveness should meet the intertwined social and economic needs of a territory. The emergence of a broader and a more inclusive model of development requires new metrics with which policymakers and citizens can compare and monitor their social progress with comparable territories.
The largely autonomous Basque Country has been pursuing an integrated approach to regional development, using a battery of indicators to monitor the development of the region. These indicators, structured around several economic, social, and environmental dimensions, have informed their policy decisions. This experience applying inclusive development policies using advanced indicators can be incorporated into the Social Progress Index to be constructed for the European Union at the regional (NUTS-II) level.
The European Social Progress Index complements the work that Orkestra — The Basque Institute for Economic Competitiveness—has been carrying out researching development policies beyond pure economic factors. Orkestra has developed a framework and tools to analyze diverse economic and innovation indicators and benchmark the position of the Basque Country vis-à-vis other European regions. Researchers in Orkestra have also worked on a methodology to identify regions that are structurally similar. This methodology can be used to select a subgroup of regions to compare. This subset of comparable territories, or other regions that want to improve their citizens’ wellbeing, can learn from each other, broaden the debate, and build a community of practice around social progress in Europe.
CONCLUSION
The movement to complement traditional economic measurement with innovative tools to advance social progress is growing. Applying the Social Progress Index’s conceptual and methodological framework is working as a way to highlight challenges and bring new partners together to drive change in communities around the world. Join our network of partners in government, business, academia, and civil society who are using the Social Progress Index tool as a catalyst for action.
CHAPTER 6 / THE SOCIAL PROGRESS NETWORK

138 Social Progress Index 2015 | © Social Progress Imperative 2015Social Progress Index 2015 | © Social Progress Imperative 2015
139Social Progress Index 2015 | © Social Progress Imperative 2015Social Progress Index 2015 | © Social Progress Imperative 2015
APPENDICES
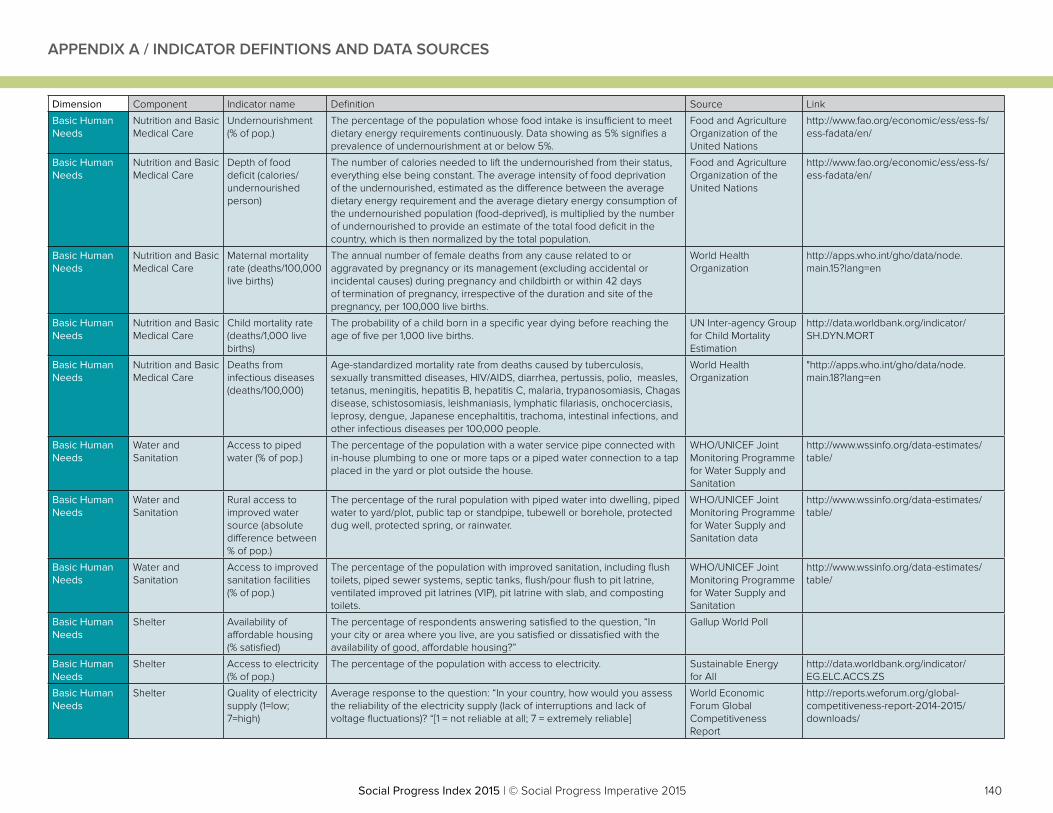
140Social Progress Index 2015 | © Social Progress Imperative 2015
Dimension Component Indicator name Definition Source Link
Basic Human Needs
Nutrition and Basic Medical Care
Undernourishment (% of pop.)
The percentage of the population whose food intake is insufficient to meet dietary energy requirements continuously. Data showing as 5% signifies a prevalence of undernourishment at or below 5%.
Food and Agriculture Organization of the United Nations
http://www.fao.org/economic/ess/ess-fs/ess-fadata/en/
Basic Human Needs
Nutrition and Basic Medical Care
Depth of food deficit (calories/undernourished person)
The number of calories needed to lift the undernourished from their status, everything else being constant. The average intensity of food deprivation of the undernourished, estimated as the difference between the average dietary energy requirement and the average dietary energy consumption of the undernourished population (food-deprived), is multiplied by the number of undernourished to provide an estimate of the total food deficit in the country, which is then normalized by the total population.
Food and Agriculture Organization of the United Nations
http://www.fao.org/economic/ess/ess-fs/ess-fadata/en/
Basic Human Needs
Nutrition and Basic Medical Care
Maternal mortality rate (deaths/100,000 live births)
The annual number of female deaths from any cause related to or aggravated by pregnancy or its management (excluding accidental or incidental causes) during pregnancy and childbirth or within 42 days of termination of pregnancy, irrespective of the duration and site of the pregnancy, per 100,000 live births.
World Health Organization
http://apps.who.int/gho/data/node.main.15?lang=en
Basic Human Needs
Nutrition and Basic Medical Care
Child mortality rate (deaths/1,000 live births)
The probability of a child born in a specific year dying before reaching the age of five per 1,000 live births.
UN Inter-agency Group for Child Mortality Estimation
http://data.worldbank.org/indicator/SH.DYN.MORT
Basic Human Needs
Nutrition and Basic Medical Care
Deaths from infectious diseases (deaths/100,000)
Age-standardized mortality rate from deaths caused by tuberculosis, sexually transmitted diseases, HIV/AIDS, diarrhea, pertussis, polio, measles, tetanus, meningitis, hepatitis B, hepatitis C, malaria, trypanosomiasis, Chagas disease, schistosomiasis, leishmaniasis, lymphatic filariasis, onchocerciasis, leprosy, dengue, Japanese encephaltitis, trachoma, intestinal infections, and other infectious diseases per 100,000 people.
World Health Organization
"http://apps.who.int/gho/data/node.main.18?lang=en
Basic Human Needs
Water and Sanitation
Access to piped water (% of pop.)
The percentage of the population with a water service pipe connected with in-house plumbing to one or more taps or a piped water connection to a tap placed in the yard or plot outside the house.
WHO/UNICEF Joint Monitoring Programme for Water Supply and Sanitation
http://www.wssinfo.org/data-estimates/table/
Basic Human Needs
Water and Sanitation
Rural access to improved water source (absolute difference between % of pop.)
The percentage of the rural population with piped water into dwelling, piped water to yard/plot, public tap or standpipe, tubewell or borehole, protected dug well, protected spring, or rainwater.
WHO/UNICEF Joint Monitoring Programme for Water Supply and Sanitation data
http://www.wssinfo.org/data-estimates/table/
Basic Human Needs
Water and Sanitation
Access to improved sanitation facilities (% of pop.)
The percentage of the population with improved sanitation, including flush toilets, piped sewer systems, septic tanks, flush/pour flush to pit latrine, ventilated improved pit latrines (VIP), pit latrine with slab, and composting toilets.
WHO/UNICEF Joint Monitoring Programme for Water Supply and Sanitation
http://www.wssinfo.org/data-estimates/table/
Basic Human Needs
Shelter Availability of affordable housing (% satisfied)
The percentage of respondents answering satisfied to the question, “In your city or area where you live, are you satisfied or dissatisfied with the availability of good, affordable housing?”
Gallup World Poll
Basic Human Needs
Shelter Access to electricity (% of pop.)
The percentage of the population with access to electricity. Sustainable Energy for All
http://data.worldbank.org/indicator/EG.ELC.ACCS.ZS
Basic Human Needs
Shelter Quality of electricity supply (1=low; 7=high)
Average response to the question: “In your country, how would you assess the reliability of the electricity supply (lack of interruptions and lack of voltage fluctuations)? “[1 = not reliable at all; 7 = extremely reliable]
World Economic Forum Global Competitiveness Report
http://reports.weforum.org/global-competitiveness-report-2014-2015/downloads/
APPENDIX A / INDICATOR DEFINTIONS AND DATA SOURCES
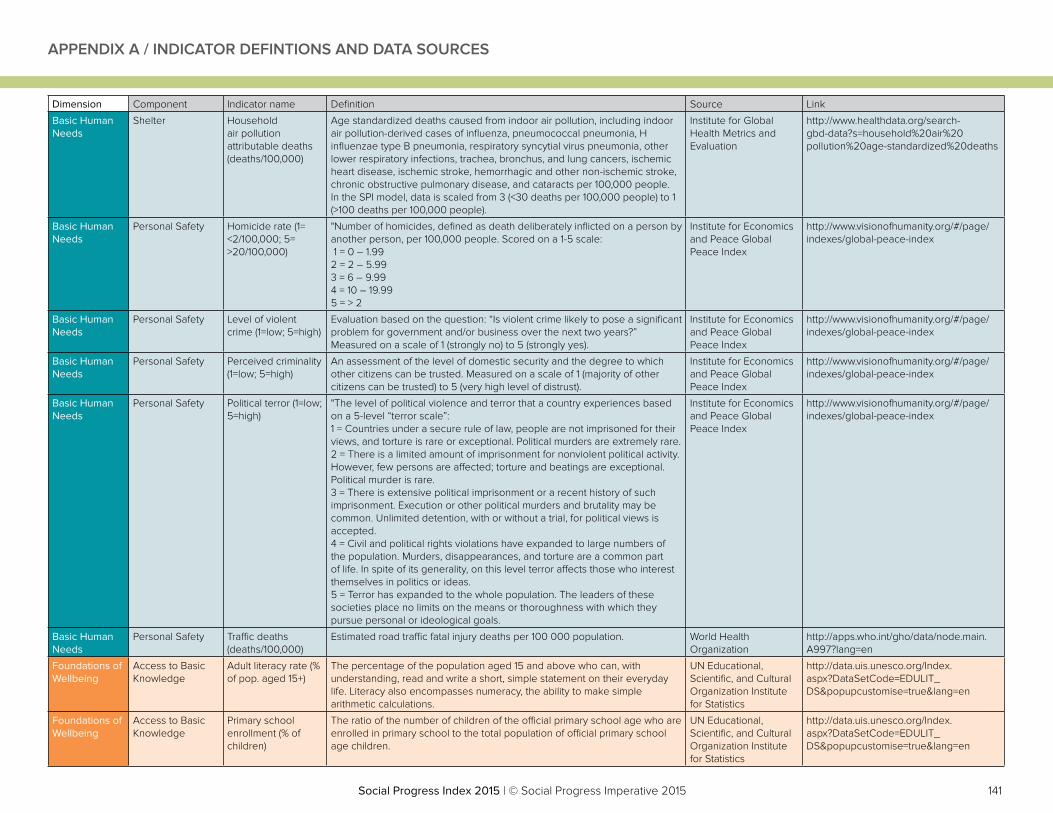
141Social Progress Index 2015 | © Social Progress Imperative 2015
Dimension Component Indicator name Definition Source Link
Basic Human Needs
Shelter Household air pollution attributable deaths (deaths/100,000)
Age standardized deaths caused from indoor air pollution, including indoor air pollution-derived cases of influenza, pneumococcal pneumonia, H influenzae type B pneumonia, respiratory syncytial virus pneumonia, other lower respiratory infections, trachea, bronchus, and lung cancers, ischemic heart disease, ischemic stroke, hemorrhagic and other non-ischemic stroke, chronic obstructive pulmonary disease, and cataracts per 100,000 people. In the SPI model, data is scaled from 3 (<30 deaths per 100,000 people) to 1 (>100 deaths per 100,000 people).
Institute for Global Health Metrics and Evaluation
http://www.healthdata.org/search-gbd-data?s=household%20air%20pollution%20age-standardized%20deaths
Basic Human Needs
Personal Safety Homicide rate (1= <2/100,000; 5= >20/100,000)
"Number of homicides, defined as death deliberately inflicted on a person by another person, per 100,000 people. Scored on a 1-5 scale: 1 = 0 – 1.99 2 = 2 – 5.99 3 = 6 – 9.99 4 = 10 – 19.99 5 = > 2
Institute for Economics and Peace Global Peace Index
http://www.visionofhumanity.org/#/page/indexes/global-peace-index
Basic Human Needs
Personal Safety Level of violent crime (1=low; 5=high)
Evaluation based on the question: “Is violent crime likely to pose a significant problem for government and/or business over the next two years?” Measured on a scale of 1 (strongly no) to 5 (strongly yes).
Institute for Economics and Peace Global Peace Index
http://www.visionofhumanity.org/#/page/indexes/global-peace-index
Basic Human Needs
Personal Safety Perceived criminality (1=low; 5=high)
An assessment of the level of domestic security and the degree to which other citizens can be trusted. Measured on a scale of 1 (majority of other citizens can be trusted) to 5 (very high level of distrust).
Institute for Economics and Peace Global Peace Index
http://www.visionofhumanity.org/#/page/indexes/global-peace-index
Basic Human Needs
Personal Safety Political terror (1=low; 5=high)
"The level of political violence and terror that a country experiences based on a 5-level “terror scale”: 1 = Countries under a secure rule of law, people are not imprisoned for their views, and torture is rare or exceptional. Political murders are extremely rare.2 = There is a limited amount of imprisonment for nonviolent political activity. However, few persons are affected; torture and beatings are exceptional. Political murder is rare.3 = There is extensive political imprisonment or a recent history of such imprisonment. Execution or other political murders and brutality may be common. Unlimited detention, with or without a trial, for political views is accepted.4 = Civil and political rights violations have expanded to large numbers of the population. Murders, disappearances, and torture are a common part of life. In spite of its generality, on this level terror affects those who interest themselves in politics or ideas.5 = Terror has expanded to the whole population. The leaders of these societies place no limits on the means or thoroughness with which they pursue personal or ideological goals.
Institute for Economics and Peace Global Peace Index
http://www.visionofhumanity.org/#/page/indexes/global-peace-index
Basic Human Needs
Personal Safety Traffic deaths (deaths/100,000)
Estimated road traffic fatal injury deaths per 100 000 population. World Health Organization
http://apps.who.int/gho/data/node.main.A997?lang=en
Foundations of Wellbeing
Access to Basic Knowledge
Adult literacy rate (% of pop. aged 15+)
The percentage of the population aged 15 and above who can, with understanding, read and write a short, simple statement on their everyday life. Literacy also encompasses numeracy, the ability to make simple arithmetic calculations.
UN Educational, Scientific, and Cultural Organization Institute for Statistics
http://data.uis.unesco.org/Index.aspx?DataSetCode=EDULIT_DS&popupcustomise=true&lang=en
Foundations of Wellbeing
Access to Basic Knowledge
Primary school enrollment (% of children)
The ratio of the number of children of the official primary school age who are enrolled in primary school to the total population of official primary school age children.
UN Educational, Scientific, and Cultural Organization Institute for Statistics
http://data.uis.unesco.org/Index.aspx?DataSetCode=EDULIT_DS&popupcustomise=true&lang=en
APPENDIX A / INDICATOR DEFINTIONS AND DATA SOURCES
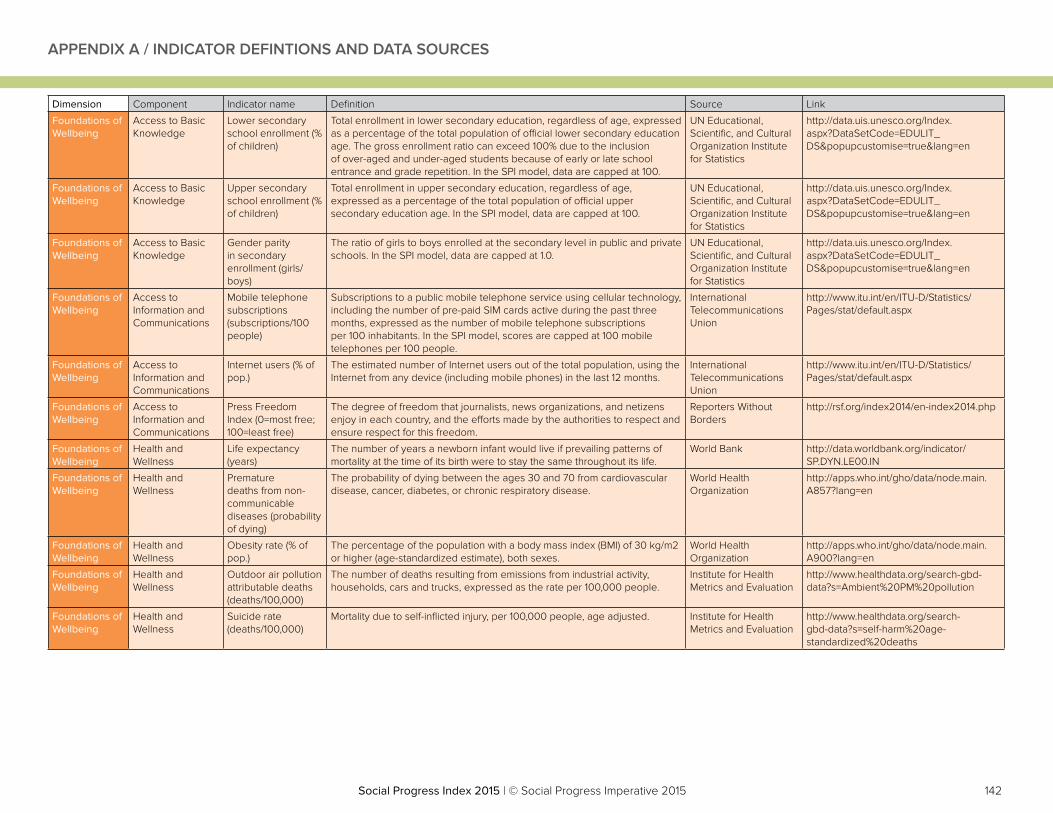
142Social Progress Index 2015 | © Social Progress Imperative 2015
Dimension Component Indicator name Definition Source Link
Foundations of Wellbeing
Access to Basic Knowledge
Lower secondary school enrollment (% of children)
Total enrollment in lower secondary education, regardless of age, expressed as a percentage of the total population of official lower secondary education age. The gross enrollment ratio can exceed 100% due to the inclusion of over-aged and under-aged students because of early or late school entrance and grade repetition. In the SPI model, data are capped at 100.
UN Educational, Scientific, and Cultural Organization Institute for Statistics
http://data.uis.unesco.org/Index.aspx?DataSetCode=EDULIT_DS&popupcustomise=true&lang=en
Foundations of Wellbeing
Access to Basic Knowledge
Upper secondary school enrollment (% of children)
Total enrollment in upper secondary education, regardless of age, expressed as a percentage of the total population of official upper secondary education age. In the SPI model, data are capped at 100.
UN Educational, Scientific, and Cultural Organization Institute for Statistics
http://data.uis.unesco.org/Index.aspx?DataSetCode=EDULIT_DS&popupcustomise=true&lang=en
Foundations of Wellbeing
Access to Basic Knowledge
Gender parity in secondary enrollment (girls/boys)
The ratio of girls to boys enrolled at the secondary level in public and private schools. In the SPI model, data are capped at 1.0.
UN Educational, Scientific, and Cultural Organization Institute for Statistics
http://data.uis.unesco.org/Index.aspx?DataSetCode=EDULIT_DS&popupcustomise=true&lang=en
Foundations of Wellbeing
Access to Information and Communications
Mobile telephone subscriptions (subscriptions/100 people)
Subscriptions to a public mobile telephone service using cellular technology, including the number of pre-paid SIM cards active during the past three months, expressed as the number of mobile telephone subscriptions per 100 inhabitants. In the SPI model, scores are capped at 100 mobile telephones per 100 people.
International Telecommunications Union
http://www.itu.int/en/ITU-D/Statistics/Pages/stat/default.aspx
Foundations of Wellbeing
Access to Information and Communications
Internet users (% of pop.)
The estimated number of Internet users out of the total population, using the Internet from any device (including mobile phones) in the last 12 months.
International Telecommunications Union
http://www.itu.int/en/ITU-D/Statistics/Pages/stat/default.aspx
Foundations of Wellbeing
Access to Information and Communications
Press Freedom Index (0=most free; 100=least free)
The degree of freedom that journalists, news organizations, and netizens enjoy in each country, and the efforts made by the authorities to respect and ensure respect for this freedom.
Reporters Without Borders
http://rsf.org/index2014/en-index2014.php
Foundations of Wellbeing
Health and Wellness
Life expectancy (years)
The number of years a newborn infant would live if prevailing patterns of mortality at the time of its birth were to stay the same throughout its life.
World Bank http://data.worldbank.org/indicator/SP.DYN.LE00.IN
Foundations of Wellbeing
Health and Wellness
Premature deaths from non-communicable diseases (probability of dying)
The probability of dying between the ages 30 and 70 from cardiovascular disease, cancer, diabetes, or chronic respiratory disease.
World Health Organization
http://apps.who.int/gho/data/node.main.A857?lang=en
Foundations of Wellbeing
Health and Wellness
Obesity rate (% of pop.)
The percentage of the population with a body mass index (BMI) of 30 kg/m2 or higher (age-standardized estimate), both sexes.
World Health Organization
http://apps.who.int/gho/data/node.main.A900?lang=en
Foundations of Wellbeing
Health and Wellness
Outdoor air pollution attributable deaths (deaths/100,000)
The number of deaths resulting from emissions from industrial activity, households, cars and trucks, expressed as the rate per 100,000 people.
Institute for Health Metrics and Evaluation
http://www.healthdata.org/search-gbd-data?s=Ambient%20PM%20pollution
Foundations of Wellbeing
Health and Wellness
Suicide rate (deaths/100,000)
Mortality due to self-inflicted injury, per 100,000 people, age adjusted. Institute for Health Metrics and Evaluation
http://www.healthdata.org/search-gbd-data?s=self-harm%20age-standardized%20deaths
APPENDIX A / INDICATOR DEFINTIONS AND DATA SOURCES
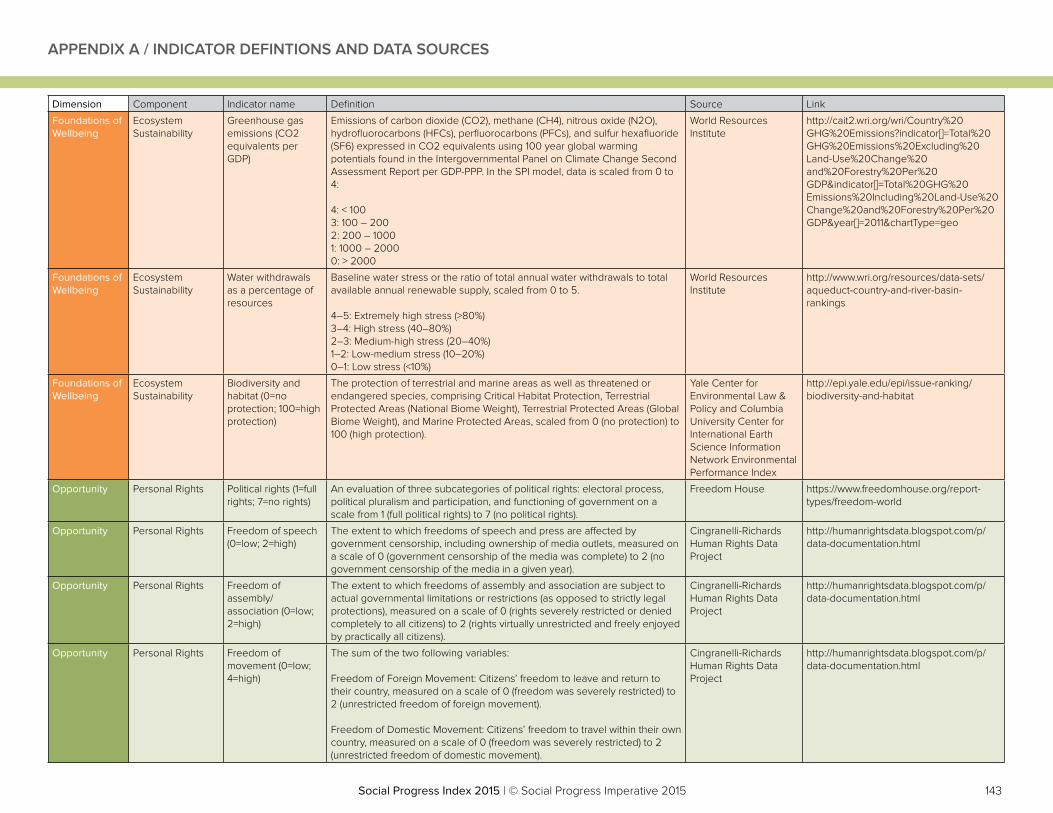
143Social Progress Index 2015 | © Social Progress Imperative 2015
Dimension Component Indicator name Definition Source Link
Foundations of Wellbeing
EcosystemSustainability
Greenhouse gas emissions (CO2 equivalents per GDP)
Emissions of carbon dioxide (CO2), methane (CH4), nitrous oxide (N2O), hydrofluorocarbons (HFCs), perfluorocarbons (PFCs), and sulfur hexafluoride (SF6) expressed in CO2 equivalents using 100 year global warming potentials found in the Intergovernmental Panel on Climate Change Second Assessment Report per GDP-PPP. In the SPI model, data is scaled from 0 to 4:
4: < 1003: 100 – 2002: 200 – 10001: 1000 – 20000: > 2000
World Resources Institute
http://cait2.wri.org/wri/Country%20GHG%20Emissions?indicator[]=Total%20GHG%20Emissions%20Excluding%20Land-Use%20Change%20and%20Forestry%20Per%20GDP&indicator[]=Total%20GHG%20Emissions%20Including%20Land-Use%20Change%20and%20Forestry%20Per%20GDP&year[]=2011&chartType=geo
Foundations of Wellbeing
Ecosystem Sustainability
Water withdrawals as a percentage of resources
Baseline water stress or the ratio of total annual water withdrawals to total available annual renewable supply, scaled from 0 to 5.
4–5: Extremely high stress (>80%)3–4: High stress (40–80%)2–3: Medium-high stress (20–40%)1–2: Low-medium stress (10–20%)0–1: Low stress (<10%)
World Resources Institute
http://www.wri.org/resources/data-sets/aqueduct-country-and-river-basin-rankings
Foundations of Wellbeing
Ecosystem Sustainability
Biodiversity and habitat (0=no protection; 100=high protection)
The protection of terrestrial and marine areas as well as threatened or endangered species, comprising Critical Habitat Protection, Terrestrial Protected Areas (National Biome Weight), Terrestrial Protected Areas (Global Biome Weight), and Marine Protected Areas, scaled from 0 (no protection) to 100 (high protection).
Yale Center for Environmental Law & Policy and Columbia University Center for International Earth Science Information Network Environmental Performance Index
http://epi.yale.edu/epi/issue-ranking/biodiversity-and-habitat
Opportunity Personal Rights Political rights (1=full rights; 7=no rights)
An evaluation of three subcategories of political rights: electoral process, political pluralism and participation, and functioning of government on a scale from 1 (full political rights) to 7 (no political rights).
Freedom House https://www.freedomhouse.org/report-types/freedom-world
Opportunity Personal Rights Freedom of speech (0=low; 2=high)
The extent to which freedoms of speech and press are affected by government censorship, including ownership of media outlets, measured on a scale of 0 (government censorship of the media was complete) to 2 (no government censorship of the media in a given year).
Cingranelli-Richards Human Rights Data Project
http://humanrightsdata.blogspot.com/p/data-documentation.html
Opportunity Personal Rights Freedom of assembly/association (0=low; 2=high)
The extent to which freedoms of assembly and association are subject to actual governmental limitations or restrictions (as opposed to strictly legal protections), measured on a scale of 0 (rights severely restricted or denied completely to all citizens) to 2 (rights virtually unrestricted and freely enjoyed by practically all citizens).
Cingranelli-Richards Human Rights Data Project
http://humanrightsdata.blogspot.com/p/data-documentation.html
Opportunity Personal Rights Freedom of movement (0=low; 4=high)
The sum of the two following variables:
Freedom of Foreign Movement: Citizens’ freedom to leave and return to their country, measured on a scale of 0 (freedom was severely restricted) to 2 (unrestricted freedom of foreign movement).
Freedom of Domestic Movement: Citizens’ freedom to travel within their own country, measured on a scale of 0 (freedom was severely restricted) to 2 (unrestricted freedom of domestic movement).
Cingranelli-Richards Human Rights Data Project
http://humanrightsdata.blogspot.com/p/data-documentation.html
APPENDIX A / INDICATOR DEFINTIONS AND DATA SOURCES
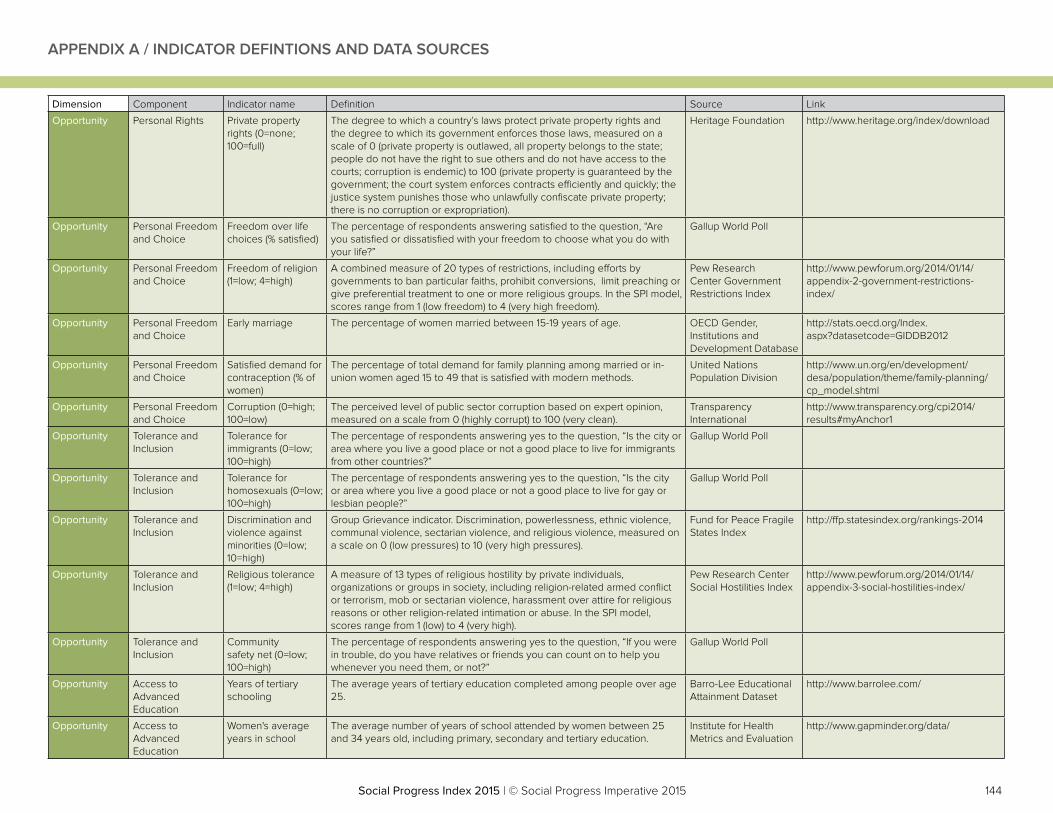
144Social Progress Index 2015 | © Social Progress Imperative 2015
Dimension Component Indicator name Definition Source Link
Opportunity Personal Rights Private property rights (0=none; 100=full)
The degree to which a country’s laws protect private property rights and the degree to which its government enforces those laws, measured on a scale of 0 (private property is outlawed, all property belongs to the state; people do not have the right to sue others and do not have access to the courts; corruption is endemic) to 100 (private property is guaranteed by the government; the court system enforces contracts efficiently and quickly; the justice system punishes those who unlawfully confiscate private property; there is no corruption or expropriation).
Heritage Foundation http://www.heritage.org/index/download
Opportunity Personal Freedom and Choice
Freedom over life choices (% satisfied)
The percentage of respondents answering satisfied to the question, “Are you satisfied or dissatisfied with your freedom to choose what you do with your life?”
Gallup World Poll
Opportunity Personal Freedom and Choice
Freedom of religion (1=low; 4=high)
A combined measure of 20 types of restrictions, including efforts by governments to ban particular faiths, prohibit conversions, limit preaching or give preferential treatment to one or more religious groups. In the SPI model, scores range from 1 (low freedom) to 4 (very high freedom).
Pew Research Center Government Restrictions Index
http://www.pewforum.org/2014/01/14/appendix-2-government-restrictions-index/
Opportunity Personal Freedom and Choice
Early marriage The percentage of women married between 15-19 years of age. OECD Gender, Institutions and Development Database
http://stats.oecd.org/Index.aspx?datasetcode=GIDDB2012
Opportunity Personal Freedom and Choice
Satisfied demand for contraception (% of women)
The percentage of total demand for family planning among married or in-union women aged 15 to 49 that is satisfied with modern methods.
United Nations Population Division
http://www.un.org/en/development/desa/population/theme/family-planning/cp_model.shtml
Opportunity Personal Freedom and Choice
Corruption (0=high; 100=low)
The perceived level of public sector corruption based on expert opinion, measured on a scale from 0 (highly corrupt) to 100 (very clean).
Transparency International
http://www.transparency.org/cpi2014/results#myAnchor1
Opportunity Tolerance and Inclusion
Tolerance for immigrants (0=low; 100=high)
The percentage of respondents answering yes to the question, “Is the city or area where you live a good place or not a good place to live for immigrants from other countries?”
Gallup World Poll
Opportunity Tolerance and Inclusion
Tolerance for homosexuals (0=low; 100=high)
The percentage of respondents answering yes to the question, “Is the city or area where you live a good place or not a good place to live for gay or lesbian people?”
Gallup World Poll
Opportunity Tolerance and Inclusion
Discrimination and violence against minorities (0=low; 10=high)
Group Grievance indicator. Discrimination, powerlessness, ethnic violence, communal violence, sectarian violence, and religious violence, measured on a scale on 0 (low pressures) to 10 (very high pressures).
Fund for Peace Fragile States Index
http://ffp.statesindex.org/rankings-2014
Opportunity Tolerance and Inclusion
Religious tolerance (1=low; 4=high)
A measure of 13 types of religious hostility by private individuals, organizations or groups in society, including religion-related armed conflict or terrorism, mob or sectarian violence, harassment over attire for religious reasons or other religion-related intimation or abuse. In the SPI model, scores range from 1 (low) to 4 (very high).
Pew Research Center Social Hostilities Index
http://www.pewforum.org/2014/01/14/appendix-3-social-hostilities-index/
Opportunity Tolerance and Inclusion
Community safety net (0=low; 100=high)
The percentage of respondents answering yes to the question, “If you were in trouble, do you have relatives or friends you can count on to help you whenever you need them, or not?”
Gallup World Poll
Opportunity Access to Advanced Education
Years of tertiary schooling
The average years of tertiary education completed among people over age 25.
Barro-Lee Educational Attainment Dataset
http://www.barrolee.com/
Opportunity Access to Advanced Education
Women's average years in school
The average number of years of school attended by women between 25 and 34 years old, including primary, secondary and tertiary education.
Institute for Health Metrics and Evaluation
http://www.gapminder.org/data/
APPENDIX A / INDICATOR DEFINTIONS AND DATA SOURCES
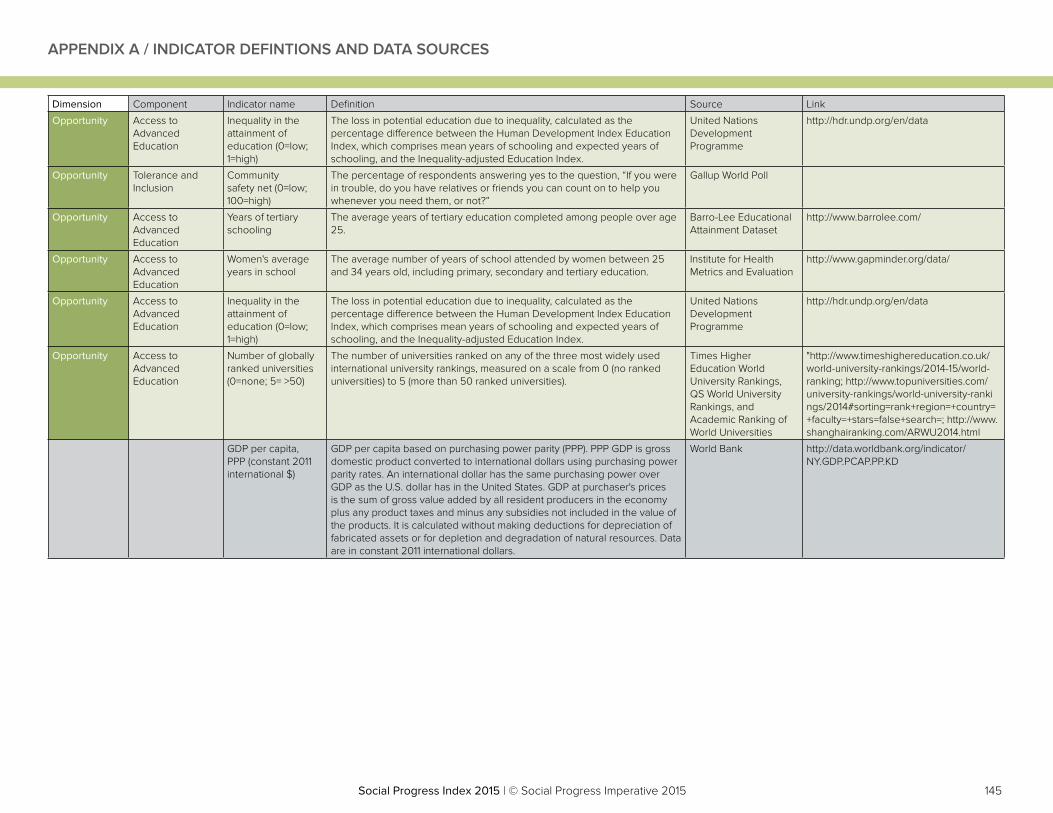
145Social Progress Index 2015 | © Social Progress Imperative 2015
Dimension Component Indicator name Definition Source Link
Opportunity Access to Advanced Education
Inequality in the attainment of education (0=low; 1=high)
The loss in potential education due to inequality, calculated as the percentage difference between the Human Development Index Education Index, which comprises mean years of schooling and expected years of schooling, and the Inequality-adjusted Education Index.
United Nations Development Programme
http://hdr.undp.org/en/data
Opportunity Tolerance and Inclusion
Community safety net (0=low; 100=high)
The percentage of respondents answering yes to the question, “If you were in trouble, do you have relatives or friends you can count on to help you whenever you need them, or not?”
Gallup World Poll
Opportunity Access to Advanced Education
Years of tertiary schooling
The average years of tertiary education completed among people over age 25.
Barro-Lee Educational Attainment Dataset
http://www.barrolee.com/
Opportunity Access to Advanced Education
Women's average years in school
The average number of years of school attended by women between 25 and 34 years old, including primary, secondary and tertiary education.
Institute for Health Metrics and Evaluation
http://www.gapminder.org/data/
Opportunity Access to Advanced Education
Inequality in the attainment of education (0=low; 1=high)
The loss in potential education due to inequality, calculated as the percentage difference between the Human Development Index Education Index, which comprises mean years of schooling and expected years of schooling, and the Inequality-adjusted Education Index.
United Nations Development Programme
http://hdr.undp.org/en/data
Opportunity Access to Advanced Education
Number of globally ranked universities (0=none; 5= >50)
The number of universities ranked on any of the three most widely used international university rankings, measured on a scale from 0 (no ranked universities) to 5 (more than 50 ranked universities).
Times Higher Education World University Rankings, QS World University Rankings, and Academic Ranking of World Universities
"http://www.timeshighereducation.co.uk/world-university-rankings/2014-15/world-ranking; http://www.topuniversities.com/university-rankings/world-university-rankings/2014#sorting=rank+region=+country=+faculty=+stars=false+search=; http://www.shanghairanking.com/ARWU2014.html
GDP per capita, PPP (constant 2011 international $)
GDP per capita based on purchasing power parity (PPP). PPP GDP is gross domestic product converted to international dollars using purchasing power parity rates. An international dollar has the same purchasing power over GDP as the U.S. dollar has in the United States. GDP at purchaser's prices is the sum of gross value added by all resident producers in the economy plus any product taxes and minus any subsidies not included in the value of the products. It is calculated without making deductions for depreciation of fabricated assets or for depletion and degradation of natural resources. Data are in constant 2011 international dollars.
World Bank http://data.worldbank.org/indicator/NY.GDP.PCAP.PP.KD
APPENDIX A / INDICATOR DEFINTIONS AND DATA SOURCES
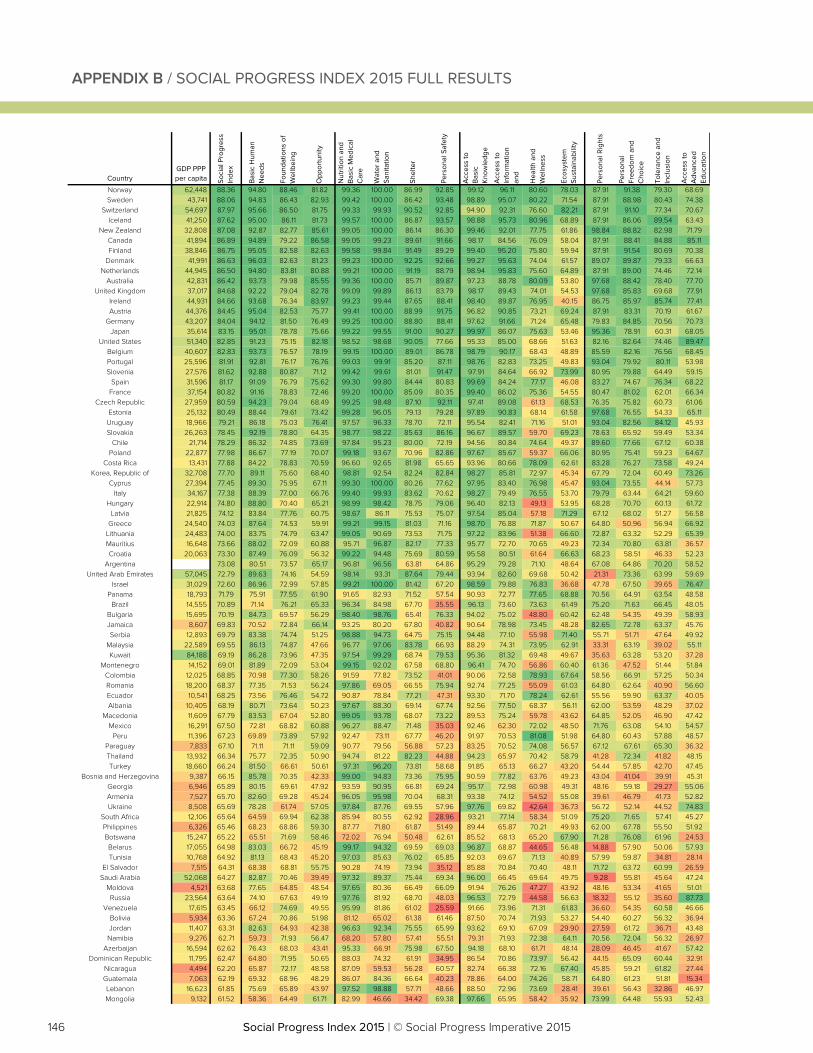
146 Social Progress Index 2015 | © Social Progress Imperative 2015Social Progress Index 2015 | © Social Progress Imperative 2015
CountryGDP PPP per capita So
cial
Pro
gres
s In
dex
Bas
ic H
uman
N
eeds
Foun
datio
ns o
f W
ellb
eing
Opp
ortu
nity
Nut
ritio
n an
d B
asic
Med
ical
C
are
Wat
er a
nd
Sani
tatio
n
Shel
ter
Pers
onal
Saf
ety
Acc
ess
to
Bas
ic
Kno
wle
dge
Acc
ess
to
Info
rmat
ion
and
Hea
lth a
nd
Wel
lnes
s
Ecos
yste
m
Sust
aina
bilit
y
Pers
onal
Rig
hts
Pers
onal
Fr
eedo
m a
nd
Cho
ice
Tole
ranc
e an
d In
clus
ion
Acc
ess
to
Adv
ance
d Ed
ucat
ion
Norway 62,448 88.36 94.80 88.46 81.82 99.36 100.00 86.99 92.85 99.12 96.11 80.60 78.03 87.91 91.38 79.30 68.69Sweden 43,741 88.06 94.83 86.43 82.93 99.42 100.00 86.42 93.48 98.89 95.07 80.22 71.54 87.91 88.98 80.43 74.38
Switzerland 54,697 87.97 95.66 86.50 81.75 99.33 99.93 90.52 92.85 94.90 92.31 76.60 82.21 87.91 91.10 77.34 70.67Iceland 41,250 87.62 95.00 86.11 81.73 99.57 100.00 86.87 93.57 98.88 95.73 80.96 68.89 87.91 86.06 89.54 63.43
New Zealand 32,808 87.08 92.87 82.77 85.61 99.05 100.00 86.14 86.30 99.46 92.01 77.75 61.86 98.84 88.82 82.98 71.79Canada 41,894 86.89 94.89 79.22 86.58 99.05 99.23 89.61 91.66 98.17 84.56 76.09 58.04 87.91 88.41 84.88 85.11Finland 38,846 86.75 95.05 82.58 82.63 99.58 99.84 91.49 89.29 99.40 95.20 75.80 59.94 87.91 91.54 80.69 70.38
Denmark 41,991 86.63 96.03 82.63 81.23 99.23 100.00 92.25 92.66 99.27 95.63 74.04 61.57 89.07 89.87 79.33 66.63Netherlands 44,945 86.50 94.80 83.81 80.88 99.21 100.00 91.19 88.79 98.94 95.83 75.60 64.89 87.91 89.00 74.46 72.14
Australia 42,831 86.42 93.73 79.98 85.55 99.36 100.00 85.71 89.87 97.23 88.78 80.09 53.80 97.68 88.42 78.40 77.70United Kingdom 37,017 84.68 92.22 79.04 82.78 99.09 99.89 86.13 83.79 98.17 89.43 74.01 54.53 97.68 85.83 69.68 77.91
Ireland 44,931 84.66 93.68 76.34 83.97 99.23 99.44 87.65 88.41 98.40 89.87 76.95 40.15 86.75 85.97 85.74 77.41Austria 44,376 84.45 95.04 82.53 75.77 99.41 100.00 88.99 91.75 96.82 90.85 73.21 69.24 87.91 83.31 70.19 61.67
Germany 43,207 84.04 94.12 81.50 76.49 99.25 100.00 88.80 88.41 97.62 91.66 71.24 65.48 79.83 84.85 70.56 70.73Japan 35,614 83.15 95.01 78.78 75.66 99.22 99.55 91.00 90.27 99.97 86.07 75.63 53.46 95.36 78.91 60.31 68.05
United States 51,340 82.85 91.23 75.15 82.18 98.52 98.68 90.05 77.66 95.33 85.00 68.66 51.63 82.16 82.64 74.46 89.47Belgium 40,607 82.83 93.73 76.57 78.19 99.15 100.00 89.01 86.78 98.79 90.17 68.43 48.89 85.59 82.16 76.56 68.45Portugal 25,596 81.91 92.81 76.17 76.76 99.03 99.91 85.20 87.11 98.76 82.83 73.25 49.83 93.04 79.92 80.11 53.98Slovenia 27,576 81.62 92.88 80.87 71.12 99.42 99.61 81.01 91.47 97.91 84.64 66.92 73.99 80.95 79.88 64.49 59.15
Spain 31,596 81.17 91.09 76.79 75.62 99.30 99.80 84.44 80.83 99.69 84.24 77.17 46.08 83.27 74.67 76.34 68.22France 37,154 80.82 91.16 78.83 72.46 99.20 100.00 85.09 80.35 99.40 86.02 75.36 54.55 80.47 81.02 62.01 66.34
Czech Republic 27,959 80.59 94.23 79.04 68.49 99.25 98.48 87.10 92.11 97.41 89.08 61.13 68.53 76.35 75.82 60.73 61.06Estonia 25,132 80.49 88.44 79.61 73.42 99.28 96.05 79.13 79.28 97.89 90.83 68.14 61.58 97.68 76.55 54.33 65.11
Uruguay 18,966 79.21 86.18 75.03 76.41 97.57 96.33 78.70 72.11 95.54 82.41 71.16 51.01 93.04 82.56 84.12 45.93Slovakia 26,263 78.45 92.19 78.80 64.35 98.77 98.22 85.63 86.16 96.67 89.57 59.70 69.23 78.63 65.92 59.49 53.34
Chile 21,714 78.29 86.32 74.85 73.69 97.84 95.23 80.00 72.19 94.56 80.84 74.64 49.37 89.60 77.66 67.12 60.38Poland 22,877 77.98 86.67 77.19 70.07 99.18 93.67 70.96 82.86 97.67 85.67 59.37 66.06 80.95 75.41 59.23 64.67
Costa Rica 13,431 77.88 84.22 78.83 70.59 96.60 92.65 81.98 65.65 93.96 80.66 78.09 62.61 83.28 76.27 73.58 49.24Korea, Republic of 32,708 77.70 89.11 75.60 68.40 98.81 92.54 82.24 82.84 98.27 85.81 72.97 45.34 67.79 72.04 60.49 73.26
Cyprus 27,394 77.45 89.30 75.95 67.11 99.30 100.00 80.26 77.62 97.95 83.40 76.98 45.47 93.04 73.55 44.14 57.73Italy 34,167 77.38 88.39 77.00 66.76 99.40 99.93 83.62 70.62 98.27 79.49 76.55 53.70 79.79 63.44 64.21 59.60
Hungary 22,914 74.80 88.80 70.40 65.21 98.99 98.42 78.75 79.06 96.40 82.13 49.13 53.95 68.28 70.70 60.13 61.72Latvia 21,825 74.12 83.84 77.76 60.75 98.67 86.11 75.53 75.07 97.54 85.04 57.18 71.29 67.12 68.02 51.27 56.58
Greece 24,540 74.03 87.64 74.53 59.91 99.21 99.15 81.03 71.16 98.70 76.88 71.87 50.67 64.80 50.96 56.94 66.92Lithuania 24,483 74.00 83.75 74.79 63.47 99.05 90.69 73.53 71.75 97.22 83.96 51.38 66.60 72.87 63.32 52.29 65.39Mauritius 16,648 73.66 88.02 72.09 60.88 95.71 96.87 82.17 77.33 95.77 72.70 70.65 49.23 72.34 70.80 63.81 36.57Croatia 20,063 73.30 87.49 76.09 56.32 99.22 94.48 75.69 80.59 95.58 80.51 61.64 66.63 68.23 58.51 46.33 52.23
Argentina 73.08 80.51 73.57 65.17 96.81 96.56 63.81 64.86 95.29 79.28 71.10 48.64 67.08 64.86 70.20 58.52United Arab Emirates 57,045 72.79 89.63 74.16 54.59 98.14 93.31 87.64 79.44 93.94 82.60 69.68 50.42 21.31 73.36 63.99 59.69
Israel 31,029 72.60 86.96 72.99 57.85 99.21 100.00 81.42 67.20 98.59 79.88 76.83 36.68 47.78 67.50 39.65 76.47Panama 18,793 71.79 75.91 77.55 61.90 91.65 82.93 71.52 57.54 90.93 72.77 77.65 68.88 70.56 64.91 63.54 48.58
Brazil 14,555 70.89 71.14 76.21 65.33 96.34 84.98 67.70 35.55 96.13 73.60 73.63 61.49 75.20 71.63 66.45 48.05Bulgaria 15,695 70.19 84.73 69.57 56.29 98.40 98.76 65.41 76.33 94.02 75.02 48.80 60.42 62.48 54.35 49.39 58.93Jamaica 8,607 69.83 70.52 72.84 66.14 93.25 80.20 67.80 40.82 90.64 78.98 73.45 48.28 82.65 72.78 63.37 45.76Serbia 12,893 69.79 83.38 74.74 51.25 98.88 94.73 64.75 75.15 94.48 77.10 55.98 71.40 55.71 51.71 47.64 49.92
Malaysia 22,589 69.55 86.13 74.87 47.66 96.77 97.06 83.78 66.93 88.29 74.31 73.95 62.91 33.31 63.19 39.02 55.11Kuwait 84,188 69.19 86.28 73.96 47.35 97.54 99.29 68.74 79.53 95.36 81.32 69.48 49.67 35.63 63.28 53.20 37.28
Montenegro 14,152 69.01 81.89 72.09 53.04 99.15 92.02 67.58 68.80 96.41 74.70 56.86 60.40 61.36 47.52 51.44 51.84Colombia 12,025 68.85 70.98 77.30 58.26 91.59 77.82 73.52 41.01 90.06 72.58 78.93 67.64 58.56 66.91 57.25 50.34Romania 18,200 68.37 77.35 71.53 56.24 97.86 69.05 66.55 75.94 92.74 77.25 55.09 61.03 64.80 62.64 40.90 56.60Ecuador 10,541 68.25 73.56 76.46 54.72 90.87 78.84 77.21 47.31 93.30 71.70 78.24 62.61 55.56 59.90 63.37 40.05Albania 10,405 68.19 80.71 73.64 50.23 97.67 88.30 69.14 67.74 92.56 77.50 68.37 56.11 62.00 53.59 48.29 37.02
Macedonia 11,609 67.79 83.53 67.04 52.80 99.05 93.78 68.07 73.22 89.53 75.24 59.78 43.62 64.85 52.05 46.90 47.42Mexico 16,291 67.50 72.81 68.82 60.88 96.27 88.47 71.48 35.03 92.46 62.30 72.02 48.50 71.76 63.08 54.10 54.57
Peru 11,396 67.23 69.89 73.89 57.92 92.47 73.11 67.77 46.20 91.97 70.53 81.08 51.98 64.80 60.43 57.88 48.57Paraguay 7,833 67.10 71.11 71.11 59.09 90.77 79.56 56.88 57.23 83.25 70.52 74.08 56.57 67.12 67.61 65.30 36.32Thailand 13,932 66.34 75.77 72.35 50.90 94.74 81.22 82.23 44.88 94.23 65.97 70.42 58.79 41.28 72.34 41.82 48.15Turkey 18,660 66.24 81.50 66.61 50.61 97.31 96.20 73.81 58.68 91.85 65.13 66.27 43.20 54.44 57.85 42.70 47.45
Bosnia and Herzegovina 9,387 66.15 85.78 70.35 42.33 99.00 94.83 73.36 75.95 90.59 77.82 63.76 49.23 43.04 41.04 39.91 45.31Georgia 6,946 65.89 80.15 69.61 47.92 93.59 90.95 66.81 69.24 95.17 72.98 60.98 49.31 48.16 59.18 29.27 55.06Armenia 7,527 65.70 82.60 69.28 45.24 96.05 95.98 70.04 68.31 93.38 74.12 54.52 55.08 39.61 46.79 41.73 52.82Ukraine 8,508 65.69 78.28 61.74 57.05 97.84 87.76 69.55 57.96 97.76 69.82 42.64 36.73 56.72 52.14 44.52 74.83
South Africa 12,106 65.64 64.59 69.94 62.38 85.94 80.55 62.92 28.96 93.21 77.14 58.34 51.09 75.20 71.65 57.41 45.27Philippines 6,326 65.46 68.23 68.86 59.30 87.77 71.80 61.87 51.49 89.44 65.87 70.21 49.93 62.00 67.78 55.50 51.92Botswana 15,247 65.22 65.51 71.69 58.46 72.02 76.94 50.48 62.61 85.52 68.13 65.20 67.90 71.28 76.08 61.96 24.53Belarus 17,055 64.98 83.03 66.72 45.19 99.17 94.32 69.59 69.03 96.87 68.87 44.65 56.48 14.88 57.90 50.06 57.93Tunisia 10,768 64.92 81.13 68.43 45.20 97.03 85.63 76.02 65.85 92.03 69.67 71.13 40.89 57.99 59.87 34.81 28.14
El Salvador 7,515 64.31 68.38 68.81 55.75 90.28 74.19 73.94 35.12 85.88 70.84 70.40 48.11 71.72 63.72 60.99 26.59Saudi Arabia 52,068 64.27 82.87 70.46 39.49 97.32 89.37 75.44 69.34 96.00 66.45 69.64 49.75 9.28 55.81 45.64 47.24
Moldova 4,521 63.68 77.65 64.85 48.54 97.65 80.36 66.49 66.09 91.94 76.26 47.27 43.92 48.16 53.34 41.65 51.01Russia 23,564 63.64 74.10 67.63 49.19 97.76 81.92 68.70 48.03 96.53 72.79 44.58 56.63 18.32 55.12 35.60 87.73
Venezuela 17,615 63.45 66.12 74.69 49.55 95.99 81.86 61.02 25.59 91.66 73.96 71.31 61.83 36.60 54.35 60.58 46.66Bolivia 5,934 63.36 67.24 70.86 51.98 81.12 65.02 61.38 61.46 87.50 70.74 71.93 53.27 54.40 60.27 56.32 36.94Jordan 11,407 63.31 82.63 64.93 42.38 96.63 92.34 75.55 65.99 93.62 69.10 67.09 29.90 27.59 61.72 36.71 43.48
Namibia 9,276 62.71 59.73 71.93 56.47 68.20 57.80 57.41 55.51 79.31 71.93 72.38 64.11 70.56 72.04 56.32 26.97Azerbaijan 16,594 62.62 76.43 68.03 43.41 95.33 66.91 75.98 67.50 94.18 68.10 61.71 48.14 28.09 46.45 41.67 57.42
Dominican Republic 11,795 62.47 64.80 71.95 50.65 88.03 74.32 61.91 34.95 86.54 70.86 73.97 56.42 44.15 65.09 60.44 32.91Nicaragua 4,494 62.20 65.87 72.17 48.58 87.09 59.53 56.28 60.57 82.74 66.38 72.16 67.40 45.85 59.21 61.82 27.44Guatemala 7,063 62.19 69.32 68.96 48.29 86.07 84.36 66.64 40.23 78.86 64.00 74.26 58.71 64.80 61.23 51.81 15.34Lebanon 16,623 61.85 75.69 65.89 43.97 97.52 98.88 57.71 48.66 88.50 72.96 73.69 28.41 39.61 56.43 32.86 46.97Mongolia 9,132 61.52 58.36 64.49 61.71 82.99 46.66 34.42 69.38 97.66 65.95 58.42 35.92 73.99 64.48 55.93 52.43
APPENDIX B / SOCIAL PROGRESS INDEX 2015 FULL RESULTS

147Social Progress Index 2015 | © Social Progress Imperative 2015Social Progress Index 2015 | © Social Progress Imperative 2015
CountryGDP PPP per capita So
cial
Pro
gres
s In
dex
Bas
ic H
uman
N
eeds
Foun
datio
ns o
f W
ellb
eing
Opp
ortu
nity
Nut
ritio
n an
d B
asic
Med
ical
C
are
Wat
er a
nd
Sani
tatio
n
Shel
ter
Pers
onal
Saf
ety
Acc
ess
to
Bas
ic
Kno
wle
dge
Acc
ess
to
Info
rmat
ion
and
Hea
lth a
nd
Wel
lnes
s
Ecos
yste
m
Sust
aina
bilit
y
Pers
onal
Rig
hts
Pers
onal
Fr
eedo
m a
nd
Cho
ice
Tole
ranc
e an
d In
clus
ion
Acc
ess
to
Adv
ance
d Ed
ucat
ion
Honduras 4,445 61.44 65.29 72.71 46.32 89.40 81.65 55.67 34.45 86.35 61.91 74.66 67.91 50.48 57.19 52.36 25.24Kazakhstan 22,467 61.38 77.17 58.21 48.75 96.99 81.84 69.75 60.11 92.27 66.02 40.59 33.94 29.25 58.71 43.01 64.02Cuba 60.83 80.08 60.51 41.90 97.71 85.20 63.14 74.29 96.03 24.33 73.29 48.38 2.32 48.89 66.86 49.52Algeria 12,893 60.66 78.88 66.22 36.87 94.41 81.66 70.92 68.54 89.30 63.28 70.46 41.84 20.64 57.69 42.26 26.91Indonesia 9,254 60.47 66.52 69.54 45.35 89.13 53.78 66.38 56.78 90.63 62.36 71.50 53.66 49.28 57.74 32.20 42.18Guyana 6,336 60.42 68.80 60.57 51.89 86.54 84.72 56.14 47.79 87.27 61.00 48.68 45.31 59.63 55.42 55.32 37.21Sri Lanka 9,426 60.10 71.12 67.03 42.14 83.53 74.63 63.43 62.90 96.17 54.22 65.55 52.19 25.23 64.03 33.27 46.02Egypt 10,733 59.91 77.69 67.59 34.47 96.08 97.05 63.77 53.85 87.78 66.03 57.32 59.23 28.09 55.35 23.29 31.13Uzbekistan 5,002 59.71 79.31 54.25 45.56 92.90 76.48 83.76 64.10 94.35 50.71 52.63 19.33 11.56 63.81 53.35 53.51Morocco 6,967 59.56 76.64 64.14 37.89 92.65 64.30 80.44 69.17 77.98 72.54 68.72 37.30 41.29 53.75 38.68 17.85China 11,525 59.07 73.74 65.40 38.08 93.08 73.74 70.39 57.73 94.75 52.93 61.71 52.20 4.64 68.45 34.88 44.34Kyrgyzstan 3,110 58.58 67.87 61.16 46.70 94.15 76.34 51.28 49.71 92.14 67.11 54.68 30.70 39.61 55.74 41.09 50.36Ghana 3,864 58.29 55.50 68.43 50.93 80.17 41.44 45.69 54.69 76.45 70.01 70.37 56.90 78.63 57.56 44.08 23.46Iran 15,090 56.82 78.42 61.14 30.90 96.43 90.40 73.69 53.14 91.89 47.80 68.58 36.30 5.75 48.02 31.94 37.90Tajikistan 2,432 56.49 62.58 63.09 43.79 75.10 65.61 53.02 56.59 90.57 60.94 62.10 38.77 41.29 50.50 40.55 42.80Senegal 2,170 56.46 60.35 65.97 43.07 75.01 51.05 53.26 62.09 54.88 65.84 73.73 69.42 59.67 51.20 53.50 7.89Nepal 2,173 55.33 62.54 62.71 40.74 84.59 52.15 46.47 66.94 81.82 52.82 62.74 53.45 50.96 49.74 52.87 9.39Cambodia 2,944 53.96 53.86 67.52 40.52 83.45 40.92 42.32 48.76 72.27 58.61 72.44 66.74 42.45 61.18 39.75 18.68Bangladesh 2,853 53.39 61.94 62.73 35.50 82.60 53.98 49.37 61.80 74.21 46.99 73.90 55.82 48.17 42.65 32.42 18.75India 5,238 53.06 58.87 57.38 42.93 81.78 54.53 48.10 51.06 80.32 51.43 55.45 42.30 55.07 56.25 28.22 32.19Laos 4,667 52.41 60.43 61.70 35.09 74.73 51.44 47.23 68.32 72.24 37.04 65.05 72.49 13.72 56.83 52.88 16.94Lesotho 2,494 52.27 48.62 55.82 52.35 64.80 44.79 34.19 50.71 73.12 58.67 60.61 30.90 61.95 62.65 55.34 29.46Kenya 2,705 51.67 46.48 68.17 40.36 67.13 34.36 45.97 38.48 76.04 61.59 72.20 62.86 32.16 59.04 37.97 32.27Zambia 3,800 51.62 43.87 64.82 46.19 48.84 34.46 37.21 54.95 74.32 55.47 68.64 60.83 53.92 56.29 50.55 23.99Rwanda 1,426 51.60 52.52 60.63 41.67 66.70 47.08 45.58 50.70 69.83 38.61 71.07 63.01 33.84 69.46 45.64 17.72Swaziland 6,471 50.94 53.34 57.02 42.45 63.22 54.42 43.75 51.96 77.55 51.72 59.78 39.02 19.52 65.28 57.51 27.49Benin 1,733 50.04 50.41 58.96 40.73 75.95 34.93 37.67 53.10 54.22 60.81 68.32 52.50 52.23 50.63 51.19 8.88Congo, Republic of 5,680 49.60 40.67 66.56 41.58 64.08 23.31 30.70 44.61 72.07 63.30 67.26 63.60 44.10 46.17 49.61 26.44Uganda 1,368 49.49 47.91 61.54 39.02 66.67 38.86 36.76 49.33 61.79 45.49 66.97 71.91 39.50 52.02 41.66 22.91Malawi 755 48.95 46.42 57.31 43.12 65.36 37.82 29.69 52.81 64.90 40.58 66.16 57.60 61.36 57.94 35.58 17.60Burkina Faso 1,582 48.82 46.56 57.79 42.11 65.44 36.95 27.47 56.38 42.75 53.32 65.12 69.99 57.35 49.02 54.82 7.27Iraq 14,471 48.35 63.11 55.29 26.67 81.75 73.29 75.48 21.91 69.59 56.39 62.40 32.80 13.80 33.45 29.92 29.49Cameroon 2,739 47.42 48.48 58.15 35.61 68.43 36.73 42.42 46.35 70.15 49.83 65.76 46.87 24.13 49.22 49.75 19.35Djibouti 2,903 47.27 64.18 44.02 33.62 72.56 61.33 52.40 70.43 49.28 23.67 65.98 37.15 29.72 51.87 45.17 7.72Tanzania 1,718 47.14 41.39 58.23 41.79 62.48 20.58 31.22 51.28 65.37 48.60 69.90 49.04 49.27 50.71 42.99 24.18Togo 1,346 46.66 45.11 59.40 35.46 69.69 17.41 36.27 57.08 59.30 50.26 68.66 59.38 32.16 49.08 47.24 13.38Mali 1,589 46.51 48.48 52.45 38.60 71.91 29.69 34.08 58.22 48.20 59.45 63.69 38.45 60.78 35.61 49.43 8.57Myanmar 46.12 58.87 49.19 30.28 80.09 58.38 41.07 55.92 78.02 27.69 62.37 28.70 5.75 56.11 30.19 29.08Mozambique 1,070 46.02 43.13 53.49 41.43 57.23 18.93 38.66 57.70 57.11 45.49 63.32 48.05 45.36 39.21 62.14 19.02Mauritania 2,945 45.85 47.73 59.08 30.73 77.14 30.76 36.18 46.83 49.08 64.34 68.67 54.23 27.56 38.73 48.03 8.61Pakistan 4,454 45.66 56.37 50.71 29.90 74.03 60.31 46.02 45.12 52.56 45.71 64.99 39.57 35.59 45.09 18.66 20.29Liberia 850 44.89 41.15 53.23 40.30 59.78 29.32 22.20 53.29 43.79 48.61 72.03 48.49 60.84 48.10 43.01 9.26Madagascar 1,369 44.50 41.93 53.53 38.04 66.66 16.35 29.35 55.37 63.14 40.57 70.93 39.49 45.88 39.92 45.02 21.35Nigeria 5,423 43.31 39.04 61.51 29.37 67.92 26.38 37.82 24.03 56.09 60.84 67.14 61.98 32.16 38.58 29.32 17.41Ethiopia 1,336 41.04 44.04 50.49 28.59 61.17 23.50 37.85 53.66 40.70 33.09 73.90 54.26 25.76 48.84 34.01 5.74Niger 887 40.56 40.55 48.99 32.15 66.91 18.30 25.10 51.87 29.76 43.78 67.53 54.87 40.72 33.76 47.05 7.09Yemen 3,832 40.30 49.72 50.07 21.12 71.55 43.57 34.98 48.80 60.42 41.57 64.93 33.37 15.52 43.38 20.40 5.16Angola 7,488 40.00 41.27 52.20 26.51 57.90 34.57 30.69 41.93 54.84 51.01 63.64 39.33 21.81 26.66 41.77 15.81Guinea 1,213 39.60 40.00 51.20 27.59 63.14 33.59 24.16 39.13 42.86 48.69 67.33 45.91 30.37 34.51 39.59 5.88Afghanistan 1,884 35.40 37.17 46.50 22.51 67.99 31.73 21.48 27.50 48.36 49.98 56.63 31.04 25.91 35.99 21.03 7.12Chad 2,022 33.17 28.09 44.12 27.30 38.17 20.00 19.66 34.51 30.72 36.14 62.18 47.44 36.17 25.08 43.08 4.89Central African Republic 584 31.42 26.81 44.84 22.62 37.07 26.25 13.93 29.98 32.95 37.19 61.74 47.48 16.68 36.97 27.65 9.19Bahrain 42,428 67.17 46.94 99.74 84.78 66.83 95.29 74.40 71.85 27.15 29.28 65.15 47.32 46.01Belize 8,215 65.56 94.72 91.17 64.69 89.98 59.03 71.50 41.73 83.77 56.73 32.95Bhutan 7,167 69.17 69.62 73.99 84.29 79.03 59.67 67.19 70.78 57.45 72.87 50.50Burundi 747 46.63 32.20 44.69 22.08 48.90 62.42 32.18 61.41 30.51 36.17 44.10 38.87 9.66Cape Verde 6,210 70.50 91.01 69.85 52.92 92.41 77.56 74.59 37.44 94.20 27.14Comoros 1,400 55.01 42.51 58.27 44.50 79.04 47.40 67.73 25.88 67.12 39.77 50.23 12.89Congo, Democratic Republic of 783 47.69 26.26 19.37 24.13 27.75 55.62 37.13 63.82 34.18 5.75 36.95 42.63 19.69Côte d'Ivoire 3,107 47.09 31.58 61.99 43.41 46.65 36.32 59.83 63.43 56.21 20.11 50.37 45.23 10.60Gabon 18,646 61.91 48.07 83.24 53.13 50.30 60.96 63.26 70.79 62.67 48.89 48.44 61.80 33.16Gambia, The 1,608 57.90 55.36 77.65 61.15 42.89 49.90 64.26 58.61 68.24 30.33 42.45 43.34 9.23Guinea-Bissau 1,362 60.46 27.22 31.45 53.37 64.26 57.85 57.93 42.99 7.54Haiti 1,648 36.02 36.89 47.60 25.93 22.58 47.98 56.37 68.16 38.12 47.53 46.07 38.69 15.27Libya 20,371 56.43 62.06 51.09 95.49 61.87 67.42 0.96 10.88 50.25 41.77Luxembourg 87,737 82.42 81.95 99.39 99.90 88.79 96.06 95.69 75.25 62.68 97.68 88.89 83.24 58.01Malta 28,828 73.61 70.38 98.99 100.00 81.15 93.37 82.26 72.35 46.47 84.43 74.36 74.11 48.63Oman 42,649 70.47 84.85 86.76 71.81 94.62 75.70 74.52 37.03 36.68 62.86Papua New Guinea 2,458 55.39 17.40 47.64 63.03 45.69 60.33 52.50 63.06 51.58 27.16Qatar 127,562 70.60 52.15 100.00 85.28 88.22 97.01 82.55 74.81 28.03 29.91 69.17 62.50 47.01Sierra Leone 1,495 34.43 36.16 37.78 18.94 21.41 59.59 43.59 59.78 52.35 39.04 44.44 56.63 4.55Singapore 76,237 62.83 100.00 82.72 85.23 75.32 80.68 50.60 49.50 80.18 64.91 56.74Sudan 3,265 25.14 31.24 38.99 35.30 41.77 69.91 35.72 20.01 27.92 31.91 20.72Suriname 15,556 75.40 58.02 91.75 79.17 65.37 91.51 76.01 67.48 66.62 71.72 66.59 58.57 35.20Syria 56.14 24.25 88.95 67.07 31.24 84.92 34.98 67.57 37.08 7.44 41.14 23.40 25.00Timor-Leste 2,040 50.55 59.34 71.47 40.81 37.93 51.97 75.11 47.58 72.51 42.14 74.58 55.42 11.32Trinidad and Tobago 29,469 75.18 63.83 92.16 87.51 78.37 42.70 81.11 62.20 34.18 75.20 68.91 65.82 45.38Turkmenistan 13,555 75.82 91.85 62.92 87.01 61.52 43.90 41.01 20.68 6.28 58.39 55.58Vietnam 5,125 74.19 36.28 89.80 68.35 68.38 70.22 56.45 76.24 55.12 8.60 62.30 42.14 32.09Zimbabwe 1,773 45.16 33.40 57.93 47.86 35.29 39.58 61.43 60.34 58.14 9.19 51.66 41.40 31.35
APPENDIX B / SOCIAL PROGRESS INDEX 2015 FULL RESULTS
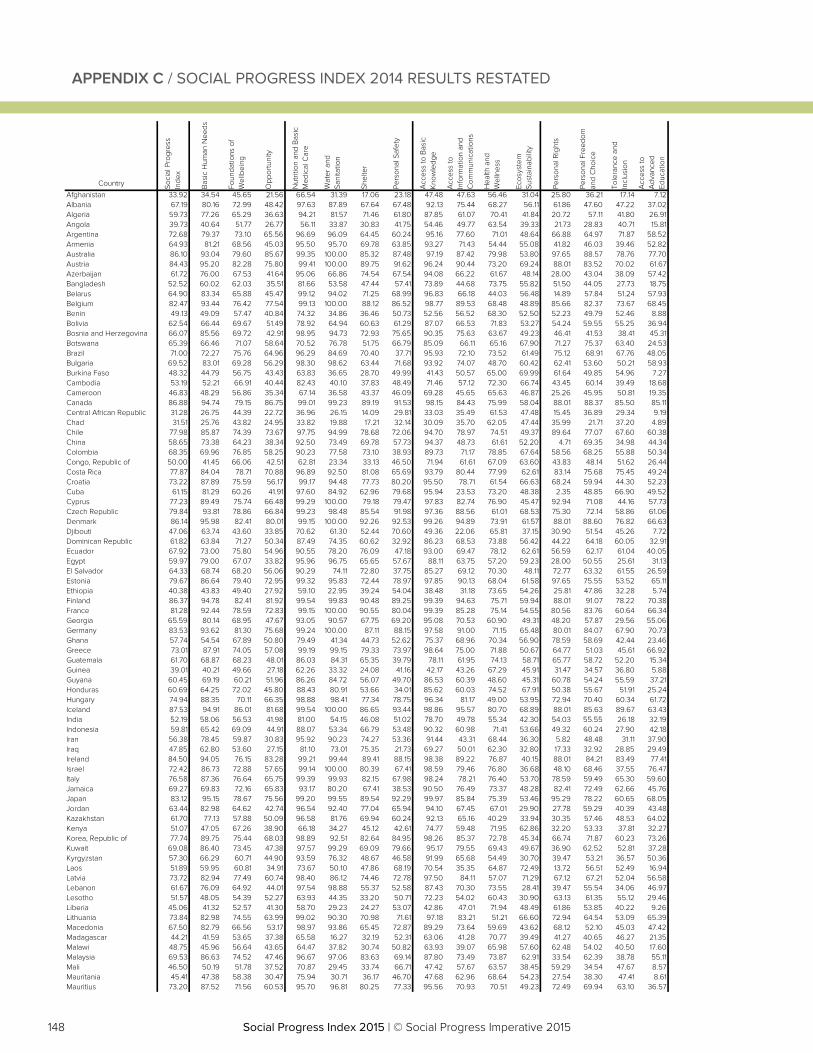
148 Social Progress Index 2015 | © Social Progress Imperative 2015Social Progress Index 2015 | © Social Progress Imperative 2015
Country Soci
al P
rogr
ess
Inde
x
Bas
ic H
uman
Nee
ds
Foun
datio
ns o
f W
ellb
eing
Opp
ortu
nity
Nut
ritio
n an
d B
asic
M
edic
al C
are
Wat
er a
nd
Sani
tatio
n
Shel
ter
Pers
onal
Saf
ety
Acc
ess
to B
asic
K
now
ledg
e
Acc
ess
to
Info
rmat
ion
and
Com
mun
icat
ions
Hea
lth a
nd
Wel
lnes
s
Ecos
yste
m
Sust
aina
bilit
y
Pers
onal
Rig
hts
Pers
onal
Fre
edom
an
d C
hoic
e
Tole
ranc
e an
d In
clus
ion
Acc
ess
to
Adv
ance
d Ed
ucat
ion
Afghanistan 33.92 34.54 45.65 21.56 66.54 31.39 17.06 23.18 47.48 47.63 56.46 31.04 25.80 36.21 17.14 7.12Albania 67.19 80.16 72.99 48.42 97.63 87.89 67.64 67.48 92.13 75.44 68.27 56.11 61.86 47.60 47.22 37.02Algeria 59.73 77.26 65.29 36.63 94.21 81.57 71.46 61.80 87.85 61.07 70.41 41.84 20.72 57.11 41.80 26.91Angola 39.73 40.64 51.77 26.77 56.11 33.87 30.83 41.75 54.46 49.77 63.54 39.33 21.73 28.83 40.71 15.81Argentina 72.68 79.37 73.10 65.56 96.69 96.09 64.45 60.24 95.16 77.60 71.01 48.64 66.88 64.97 71.87 58.52Armenia 64.93 81.21 68.56 45.03 95.50 95.70 69.78 63.85 93.27 71.43 54.44 55.08 41.82 46.03 39.46 52.82Australia 86.10 93.04 79.60 85.67 99.35 100.00 85.32 87.48 97.19 87.42 79.98 53.80 97.65 88.57 78.76 77.70Austria 84.43 95.20 82.28 75.80 99.41 100.00 89.75 91.62 96.24 90.44 73.20 69.24 88.01 83.52 70.02 61.67Azerbaijan 61.72 76.00 67.53 41.64 95.06 66.86 74.54 67.54 94.08 66.22 61.67 48.14 28.00 43.04 38.09 57.42Bangladesh 52.52 60.02 62.03 35.51 81.66 53.58 47.44 57.41 73.89 44.68 73.75 55.82 51.50 44.05 27.73 18.75Belarus 64.90 83.34 65.88 45.47 99.12 94.02 71.25 68.99 96.83 66.18 44.03 56.48 14.89 57.84 51.24 57.93Belgium 82.47 93.44 76.42 77.54 99.13 100.00 88.12 86.52 98.77 89.53 68.48 48.89 85.66 82.37 73.67 68.45Benin 49.13 49.09 57.47 40.84 74.32 34.86 36.46 50.73 52.56 56.52 68.30 52.50 52.23 49.79 52.46 8.88Bolivia 62.54 66.44 69.67 51.49 78.92 64.94 60.63 61.29 87.07 66.53 71.83 53.27 54.24 59.55 55.25 36.94Bosnia and Herzegovina 66.07 85.56 69.72 42.91 98.95 94.73 72.93 75.65 90.35 75.63 63.67 49.23 46.41 41.53 38.41 45.31Botswana 65.39 66.46 71.07 58.64 70.52 76.78 51.75 66.79 85.09 66.11 65.16 67.90 71.27 75.37 63.40 24.53Brazil 71.00 72.27 75.76 64.96 96.29 84.69 70.40 37.71 95.93 72.10 73.52 61.49 75.12 68.91 67.76 48.05Bulgaria 69.52 83.01 69.28 56.29 98.30 98.62 63.44 71.68 93.92 74.07 48.70 60.42 62.41 53.60 50.21 58.93Burkina Faso 48.32 44.79 56.75 43.43 63.83 36.65 28.70 49.99 41.43 50.57 65.00 69.99 61.64 49.85 54.96 7.27Cambodia 53.19 52.21 66.91 40.44 82.43 40.10 37.83 48.49 71.46 57.12 72.30 66.74 43.45 60.14 39.49 18.68Cameroon 46.83 48.29 56.86 35.34 67.14 36.58 43.37 46.09 69.28 45.65 65.63 46.87 25.26 45.95 50.81 19.35Canada 86.88 94.74 79.15 86.75 99.01 99.23 89.19 91.53 98.15 84.43 75.99 58.04 88.01 88.37 85.50 85.11Central African Republic 31.28 26.75 44.39 22.72 36.96 26.15 14.09 29.81 33.03 35.49 61.53 47.48 15.45 36.89 29.34 9.19Chad 31.51 25.76 43.82 24.95 33.82 19.88 17.21 32.14 30.09 35.70 62.05 47.44 35.99 21.71 37.20 4.89Chile 77.98 85.87 74.39 73.67 97.75 94.99 78.68 72.06 94.70 78.97 74.51 49.37 89.64 77.07 67.60 60.38China 58.65 73.38 64.23 38.34 92.50 73.49 69.78 57.73 94.37 48.73 61.61 52.20 4.71 69.35 34.98 44.34Colombia 68.35 69.96 76.85 58.25 90.23 77.58 73.10 38.93 89.73 71.17 78.85 67.64 58.56 68.25 55.88 50.34Congo, Republic of 50.00 41.45 66.06 42.51 62.81 23.34 33.13 46.50 71.94 61.61 67.09 63.60 43.83 48.14 51.62 26.44Costa Rica 77.87 84.04 78.71 70.88 96.89 92.50 81.08 65.69 93.79 80.44 77.99 62.61 83.14 75.68 75.45 49.24Croatia 73.22 87.89 75.59 56.17 99.17 94.48 77.73 80.20 95.50 78.71 61.54 66.63 68.24 59.94 44.30 52.23Cuba 61.15 81.29 60.26 41.91 97.60 84.92 62.96 79.68 95.94 23.53 73.20 48.38 2.35 48.85 66.90 49.52Cyprus 77.23 89.49 75.74 66.48 99.29 100.00 79.18 79.47 97.83 82.74 76.90 45.47 92.94 71.08 44.16 57.73Czech Republic 79.84 93.81 78.86 66.84 99.23 98.48 85.54 91.98 97.36 88.56 61.01 68.53 75.30 72.14 58.86 61.06Denmark 86.14 95.98 82.41 80.01 99.15 100.00 92.26 92.53 99.26 94.89 73.91 61.57 88.01 88.60 76.82 66.63Djibouti 47.06 63.74 43.60 33.85 70.62 61.30 52.44 70.60 49.36 22.06 65.81 37.15 30.90 51.54 45.26 7.72Dominican Republic 61.82 63.84 71.27 50.34 87.49 74.35 60.62 32.92 86.23 68.53 73.88 56.42 44.22 64.18 60.05 32.91Ecuador 67.92 73.00 75.80 54.96 90.55 78.20 76.09 47.18 93.00 69.47 78.12 62.61 56.59 62.17 61.04 40.05Egypt 59.97 79.00 67.07 33.82 95.96 96.75 65.65 57.67 88.11 63.75 57.20 59.23 28.00 50.55 25.61 31.13El Salvador 64.33 68.74 68.20 56.06 90.29 74.11 72.80 37.75 85.27 69.12 70.30 48.11 72.77 63.32 61.55 26.59Estonia 79.67 86.64 79.40 72.95 99.32 95.83 72.44 78.97 97.85 90.13 68.04 61.58 97.65 75.55 53.52 65.11Ethiopia 40.38 43.83 49.40 27.92 59.10 22.95 39.24 54.04 38.48 31.18 73.65 54.26 25.81 47.86 32.28 5.74Finland 86.37 94.78 82.41 81.92 99.54 99.83 90.48 89.25 99.39 94.63 75.71 59.94 88.01 91.07 78.22 70.38France 81.28 92.44 78.59 72.83 99.15 100.00 90.55 80.04 99.39 85.28 75.14 54.55 80.56 83.76 60.64 66.34Georgia 65.59 80.14 68.95 47.67 93.05 90.57 67.75 69.20 95.08 70.53 60.90 49.31 48.20 57.87 29.56 55.06Germany 83.53 93.62 81.30 75.68 99.24 100.00 87.11 88.15 97.58 91.00 71.15 65.48 80.01 84.07 67.90 70.73Ghana 57.74 54.54 67.89 50.80 79.49 41.34 44.73 52.62 75.37 68.96 70.34 56.90 78.59 58.69 42.44 23.46Greece 73.01 87.91 74.05 57.08 99.19 99.15 79.33 73.97 98.64 75.00 71.88 50.67 64.77 51.03 45.61 66.92Guatemala 61.70 68.87 68.23 48.01 86.03 84.31 65.35 39.79 78.11 61.95 74.13 58.71 65.77 58.72 52.20 15.34Guinea 39.01 40.21 49.66 27.18 62.26 33.32 24.08 41.16 42.17 43.26 67.29 45.91 31.47 34.57 36.80 5.88Guyana 60.45 69.19 60.21 51.96 86.26 84.72 56.07 49.70 86.53 60.39 48.60 45.31 60.78 54.24 55.59 37.21Honduras 60.69 64.25 72.02 45.80 88.43 80.91 53.66 34.01 85.62 60.03 74.52 67.91 50.38 55.67 51.91 25.24Hungary 74.94 88.35 70.11 66.35 98.88 98.41 77.34 78.75 96.34 81.17 49.00 53.95 72.94 70.40 60.34 61.72Iceland 87.53 94.91 86.01 81.68 99.54 100.00 86.65 93.44 98.86 95.57 80.70 68.89 88.01 85.63 89.67 63.43India 52.19 58.06 56.53 41.98 81.00 54.15 46.08 51.02 78.70 49.78 55.34 42.30 54.03 55.55 26.18 32.19Indonesia 59.81 65.42 69.09 44.91 88.07 53.34 66.79 53.48 90.32 60.98 71.41 53.66 49.32 60.24 27.90 42.18Iran 56.38 78.45 59.87 30.83 95.92 90.23 74.27 53.36 91.44 43.31 68.44 36.30 5.82 48.48 31.11 37.90Iraq 47.85 62.80 53.60 27.15 81.10 73.01 75.35 21.73 69.27 50.01 62.30 32.80 17.33 32.92 28.85 29.49Ireland 84.50 94.05 76.15 83.28 99.21 99.44 89.41 88.15 98.38 89.22 76.87 40.15 88.01 84.21 83.49 77.41Israel 72.42 86.73 72.88 57.65 99.14 100.00 80.39 67.41 98.59 79.46 76.80 36.68 48.10 68.46 37.55 76.47Italy 76.58 87.36 76.64 65.75 99.39 99.93 82.15 67.98 98.24 78.21 76.40 53.70 78.59 59.49 65.30 59.60Jamaica 69.27 69.83 72.16 65.83 93.17 80.20 67.41 38.53 90.50 76.49 73.37 48.28 82.41 72.49 62.66 45.76Japan 83.12 95.15 78.67 75.56 99.20 99.55 89.54 92.29 99.97 85.84 75.39 53.46 95.29 78.22 60.65 68.05Jordan 63.44 82.98 64.62 42.74 96.54 92.40 77.04 65.94 94.10 67.45 67.01 29.90 27.78 59.29 40.39 43.48Kazakhstan 61.70 77.13 57.88 50.09 96.58 81.76 69.94 60.24 92.13 65.16 40.29 33.94 30.35 57.46 48.53 64.02Kenya 51.07 47.05 67.26 38.90 66.18 34.27 45.12 42.61 74.77 59.48 71.95 62.86 32.20 53.33 37.81 32.27Korea, Republic of 77.74 89.75 75.44 68.03 98.89 92.51 82.64 84.95 98.26 85.37 72.78 45.34 66.74 71.87 60.23 73.26Kuwait 69.08 86.40 73.45 47.38 97.57 99.29 69.09 79.66 95.17 79.55 69.43 49.67 36.90 62.52 52.81 37.28Kyrgyzstan 57.30 66.29 60.71 44.90 93.59 76.32 48.67 46.58 91.99 65.68 54.49 30.70 39.47 53.21 36.57 50.36Laos 51.89 59.95 60.81 34.91 73.67 50.10 47.86 68.19 70.54 35.35 64.87 72.49 13.72 56.51 52.49 16.94Latvia 73.72 82.94 77.49 60.74 98.40 86.12 74.46 72.78 97.50 84.11 57.07 71.29 67.12 67.21 52.04 56.58Lebanon 61.67 76.09 64.92 44.01 97.54 98.88 55.37 52.58 87.43 70.30 73.55 28.41 39.47 55.54 34.06 46.97Lesotho 51.57 48.05 54.39 52.27 63.93 44.35 33.20 50.71 72.23 54.02 60.43 30.90 63.13 61.35 55.12 29.46Liberia 45.06 41.32 52.57 41.30 58.70 29.23 24.27 53.07 42.86 47.01 71.94 48.49 61.86 53.85 40.22 9.26Lithuania 73.84 82.98 74.55 63.99 99.02 90.30 70.98 71.61 97.18 83.21 51.21 66.60 72.94 64.54 53.09 65.39Macedonia 67.50 82.79 66.56 53.17 98.97 93.86 65.45 72.87 89.29 73.64 59.69 43.62 68.12 52.10 45.03 47.42Madagascar 44.21 41.59 53.65 37.38 65.58 16.27 32.19 52.31 63.06 41.28 70.77 39.49 41.27 40.65 46.27 21.35Malawi 48.75 45.96 56.64 43.65 64.47 37.82 30.74 50.82 63.93 39.07 65.98 57.60 62.48 54.02 40.50 17.60Malaysia 69.53 86.63 74.52 47.46 96.67 97.06 83.63 69.14 87.80 73.49 73.87 62.91 33.54 62.39 38.78 55.11Mali 46.50 50.19 51.78 37.52 70.87 29.45 33.74 66.71 47.42 57.67 63.57 38.45 59.29 34.54 47.67 8.57Mauritania 45.41 47.38 58.38 30.47 75.94 30.71 36.17 46.70 47.68 62.96 68.64 54.23 27.54 38.30 47.41 8.61Mauritius 73.20 87.52 71.56 60.53 95.70 96.81 80.25 77.33 95.56 70.93 70.51 49.23 72.49 69.94 63.10 36.57
APPENDIX C / SOCIAL PROGRESS INDEX 2014 RESULTS RESTATED
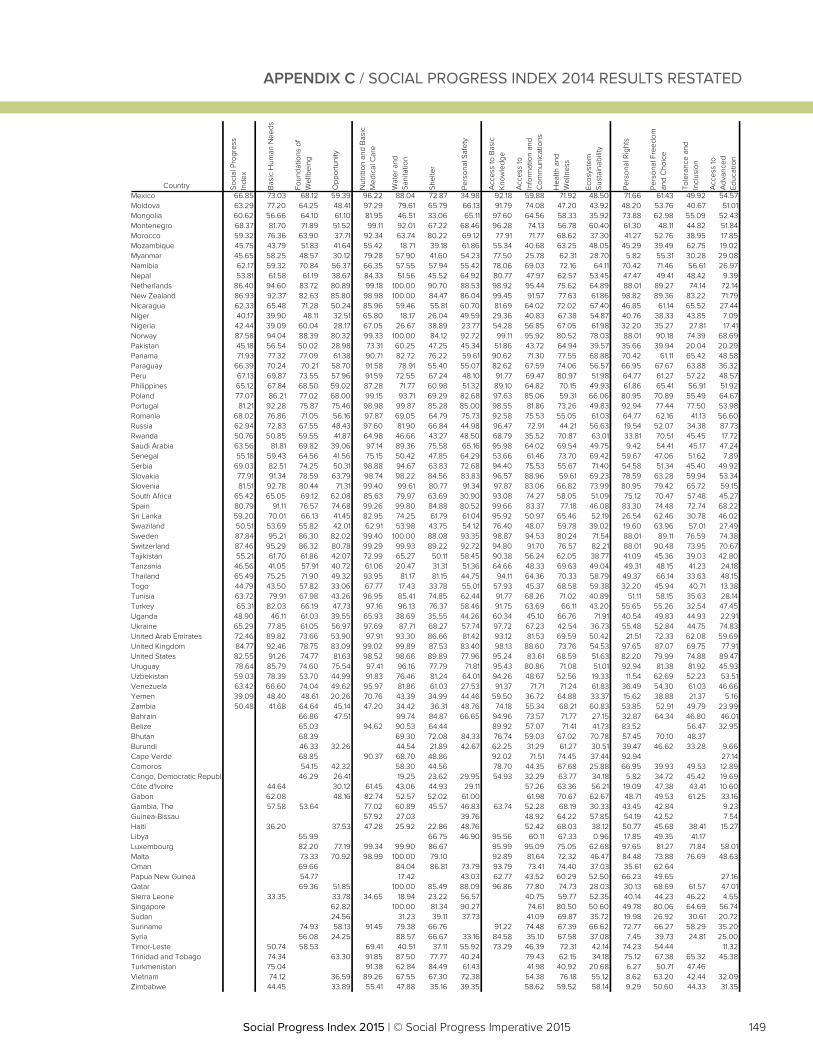
149Social Progress Index 2015 | © Social Progress Imperative 2015Social Progress Index 2015 | © Social Progress Imperative 2015
APPENDIX C / SOCIAL PROGRESS INDEX 2014 RESULTS RESTATED
Country Soci
al P
rogr
ess
Inde
x
Bas
ic H
uman
Nee
ds
Foun
datio
ns o
f W
ellb
eing
Opp
ortu
nity
Nut
ritio
n an
d B
asic
M
edic
al C
are
Wat
er a
nd
Sani
tatio
n
Shel
ter
Pers
onal
Saf
ety
Acc
ess
to B
asic
Kn
owle
dge
Acc
ess
to
Info
rmat
ion
and
Com
mun
icat
ions
Hea
lth a
nd
Wel
lnes
s
Ecos
yste
m
Sust
aina
bilit
y
Pers
onal
Rig
hts
Pers
onal
Fre
edom
an
d C
hoic
e
Tole
ranc
e an
d In
clus
ion
Acc
ess
to
Adv
ance
d Ed
ucat
ion
Mexico 66.85 73.03 68.12 59.39 96.22 88.04 72.87 34.98 92.18 59.88 71.92 48.50 71.66 61.43 49.92 54.57Moldova 63.29 77.20 64.25 48.41 97.29 79.61 65.79 66.13 91.79 74.08 47.20 43.92 48.20 53.76 40.67 51.01Mongolia 60.62 56.66 64.10 61.10 81.95 46.51 33.06 65.11 97.60 64.56 58.33 35.92 73.88 62.98 55.09 52.43Montenegro 68.37 81.70 71.89 51.52 99.11 92.01 67.22 68.46 96.28 74.13 56.78 60.40 61.30 48.11 44.82 51.84Morocco 59.32 76.36 63.90 37.71 92.34 63.74 80.22 69.12 77.91 71.77 68.62 37.30 41.27 52.76 38.95 17.85Mozambique 45.75 43.79 51.83 41.64 55.42 18.71 39.18 61.86 55.34 40.68 63.25 48.05 45.29 39.49 62.75 19.02Myanmar 45.65 58.25 48.57 30.12 79.28 57.90 41.60 54.23 77.50 25.78 62.31 28.70 5.82 55.31 30.28 29.08Namibia 62.17 59.32 70.84 56.37 66.35 57.55 57.94 55.42 78.06 69.03 72.16 64.11 70.42 71.46 56.61 26.97Nepal 53.81 61.58 61.19 38.67 84.33 51.56 45.52 64.92 80.77 47.97 62.57 53.45 47.47 49.41 48.42 9.39Netherlands 86.40 94.60 83.72 80.89 99.18 100.00 90.70 88.53 98.92 95.44 75.62 64.89 88.01 89.27 74.14 72.14New Zealand 86.93 92.37 82.63 85.80 98.98 100.00 84.47 86.04 99.45 91.57 77.63 61.86 98.82 89.36 83.22 71.79Nicaragua 62.33 65.48 71.28 50.24 85.96 59.46 55.81 60.70 81.69 64.02 72.02 67.40 46.85 61.14 65.52 27.44Niger 40.17 39.90 48.11 32.51 65.80 18.17 26.04 49.59 29.36 40.83 67.38 54.87 40.76 38.33 43.85 7.09Nigeria 42.44 39.09 60.04 28.17 67.05 26.67 38.89 23.77 54.28 56.85 67.05 61.98 32.20 35.27 27.81 17.41Norway 87.58 94.04 88.39 80.32 99.33 100.00 84.12 92.72 99.11 95.92 80.52 78.03 88.01 90.18 74.39 68.69Pakistan 45.18 56.54 50.02 28.98 73.31 60.25 47.25 45.34 51.86 43.72 64.94 39.57 35.66 39.94 20.04 20.29Panama 71.93 77.32 77.09 61.38 90.71 82.72 76.22 59.61 90.62 71.30 77.55 68.88 70.42 61.11 65.42 48.58Paraguay 66.39 70.24 70.21 58.70 91.58 78.91 55.40 55.07 82.62 67.59 74.06 56.57 66.95 67.67 63.88 36.32Peru 67.13 69.87 73.55 57.96 91.59 72.55 67.24 48.10 91.77 69.47 80.97 51.98 64.77 61.27 57.22 48.57Philippines 65.12 67.84 68.50 59.02 87.28 71.77 60.98 51.32 89.10 64.82 70.15 49.93 61.86 65.41 56.91 51.92Poland 77.07 86.21 77.02 68.00 99.15 93.71 69.29 82.68 97.63 85.06 59.31 66.06 80.95 70.89 55.49 64.67Portugal 81.21 92.28 75.87 75.46 98.98 99.87 85.28 85.00 98.55 81.86 73.26 49.83 92.94 77.44 77.50 53.98Romania 68.02 76.86 71.05 56.16 97.87 69.05 64.79 75.73 92.58 75.53 55.05 61.03 64.77 62.16 41.13 56.60Russia 62.94 72.83 67.55 48.43 97.60 81.90 66.84 44.98 96.47 72.91 44.21 56.63 19.54 52.07 34.38 87.73Rwanda 50.76 50.85 59.55 41.87 64.98 46.66 43.27 48.50 68.79 35.52 70.87 63.01 33.81 70.51 45.45 17.72Saudi Arabia 63.56 81.81 69.82 39.06 97.14 89.36 75.58 65.16 95.98 64.02 69.54 49.75 9.42 54.41 45.17 47.24Senegal 55.18 59.43 64.56 41.56 75.15 50.42 47.85 64.29 53.66 61.46 73.70 69.42 59.67 47.06 51.62 7.89Serbia 69.03 82.51 74.25 50.31 98.88 94.67 63.83 72.68 94.40 75.53 55.67 71.40 54.58 51.34 45.40 49.92Slovakia 77.91 91.34 78.59 63.79 98.74 98.22 84.56 83.83 96.57 88.96 59.61 69.23 78.59 63.28 59.94 53.34Slovenia 81.51 92.78 80.44 71.31 99.40 99.61 80.77 91.34 97.87 83.06 66.82 73.99 80.95 79.42 65.72 59.15South Africa 65.42 65.05 69.12 62.08 85.63 79.97 63.69 30.90 93.08 74.27 58.05 51.09 75.12 70.47 57.48 45.27Spain 80.79 91.11 76.57 74.68 99.26 99.80 84.88 80.52 99.66 83.37 77.18 46.08 83.30 74.48 72.74 68.22Sri Lanka 59.20 70.01 66.13 41.45 82.95 74.25 61.79 61.04 95.92 50.97 65.46 52.19 26.54 62.46 30.78 46.02Swaziland 50.51 53.69 55.82 42.01 62.91 53.98 43.75 54.12 76.40 48.07 59.78 39.02 19.60 63.96 57.01 27.49Sweden 87.84 95.21 86.30 82.02 99.40 100.00 88.08 93.35 98.87 94.53 80.24 71.54 88.01 89.11 76.59 74.38Switzerland 87.46 95.29 86.32 80.78 99.29 99.93 89.22 92.72 94.80 91.70 76.57 82.21 88.01 90.48 73.95 70.67Tajikistan 55.21 61.70 61.86 42.07 72.99 65.27 50.11 58.45 90.38 56.24 62.05 38.77 41.09 45.36 39.03 42.80Tanzania 46.56 41.05 57.91 40.72 61.06 20.47 31.31 51.36 64.66 48.33 69.63 49.04 49.31 48.15 41.23 24.18Thailand 65.49 75.25 71.90 49.32 93.95 81.17 81.15 44.75 94.11 64.36 70.33 58.79 49.37 66.14 33.63 48.15Togo 44.79 43.50 57.82 33.06 67.77 17.43 33.78 55.01 57.93 45.37 68.58 59.38 32.20 45.94 40.71 13.38Tunisia 63.72 79.91 67.98 43.26 96.95 85.41 74.85 62.44 91.77 68.26 71.02 40.89 51.11 58.15 35.63 28.14Turkey 65.31 82.03 66.19 47.73 97.16 96.13 76.37 58.46 91.75 63.69 66.11 43.20 55.65 55.26 32.54 47.45Uganda 48.90 46.11 61.03 39.55 65.93 38.69 35.55 44.26 60.34 45.10 66.76 71.91 40.54 49.83 44.93 22.91Ukraine 65.29 77.85 61.05 56.97 97.69 87.71 68.27 57.74 97.72 67.23 42.54 36.73 55.48 52.84 44.75 74.83United Arab Emirates 72.46 89.82 73.66 53.90 97.91 93.30 86.66 81.42 93.12 81.53 69.59 50.42 21.51 72.33 62.08 59.69United Kingdom 84.77 92.46 78.75 83.09 99.02 99.89 87.53 83.40 98.13 88.60 73.76 54.53 97.65 87.07 69.75 77.91United States 82.55 91.26 74.77 81.63 98.52 98.66 89.89 77.96 95.24 83.61 68.59 51.63 82.20 79.99 74.88 89.47Uruguay 78.64 85.79 74.60 75.54 97.41 96.16 77.79 71.81 95.43 80.86 71.08 51.01 92.94 81.38 81.92 45.93Uzbekistan 59.03 78.39 53.70 44.99 91.83 76.46 81.24 64.01 94.26 48.67 52.56 19.33 11.54 62.69 52.23 53.51Venezuela 63.42 66.60 74.04 49.62 95.97 81.86 61.03 27.53 91.37 71.71 71.24 61.83 36.49 54.30 61.03 46.66Yemen 39.09 48.40 48.61 20.26 70.76 43.39 34.99 44.46 59.50 36.72 64.88 33.37 15.62 38.88 21.37 5.16Zambia 50.48 41.68 64.64 45.14 47.20 34.42 36.31 48.76 74.18 55.34 68.21 60.83 53.85 52.91 49.79 23.99Bahrain 66.86 47.51 99.74 84.87 66.65 94.96 73.57 71.77 27.15 32.87 64.34 46.80 46.01Belize 65.03 94.62 90.53 64.44 89.92 57.07 71.41 41.73 83.52 56.47 32.95Bhutan 68.39 69.30 72.08 84.33 76.74 59.03 67.02 70.78 57.45 70.10 48.37Burundi 46.33 32.26 44.54 21.89 42.67 62.25 31.29 61.27 30.51 39.47 46.62 33.28 9.66Cape Verde 68.85 90.37 68.70 48.86 92.02 71.51 74.45 37.44 92.94 27.14Comoros 54.15 42.32 58.30 44.56 78.70 44.35 67.68 25.88 66.95 39.93 49.53 12.89Congo, Democratic Republic of 46.29 26.41 19.25 23.62 29.95 54.93 32.29 63.77 34.18 5.82 34.72 45.42 19.69Côte d'Ivoire 44.64 30.12 61.45 43.06 44.93 29.11 57.26 63.36 56.21 19.09 47.38 43.41 10.60Gabon 62.08 48.16 82.74 52.57 52.02 61.00 61.98 70.67 62.67 48.71 49.53 61.25 33.16Gambia, The 57.58 53.64 77.02 60.89 45.57 46.83 63.74 52.28 68.19 30.33 43.45 42.84 9.23Guinea-Bissau 57.92 27.03 39.76 48.92 64.22 57.85 54.19 42.52 7.54Haiti 36.20 37.53 47.28 25.92 22.86 48.76 52.42 68.03 38.12 50.77 45.68 38.41 15.27Libya 55.99 66.75 46.90 95.56 60.11 67.33 0.96 17.85 49.35 41.17Luxembourg 82.20 77.19 99.34 99.90 86.67 95.99 95.09 75.05 62.68 97.65 81.27 71.84 58.01Malta 73.33 70.92 98.99 100.00 79.10 92.89 81.64 72.32 46.47 84.48 73.88 76.69 48.63Oman 69.66 84.04 86.81 73.79 93.79 73.41 74.40 37.03 35.61 62.64Papua New Guinea 54.77 17.42 43.03 62.77 43.52 60.29 52.50 66.23 49.65 27.16Qatar 69.36 51.85 100.00 85.49 88.09 96.86 77.80 74.73 28.03 30.13 68.69 61.57 47.01Sierra Leone 33.35 33.78 34.65 18.94 23.22 56.57 40.75 59.77 52.35 40.14 44.23 46.22 4.55Singapore 62.82 100.00 81.34 90.27 74.61 80.50 50.60 49.78 80.06 64.69 56.74Sudan 24.56 31.23 39.11 37.73 41.09 69.87 35.72 19.98 26.92 30.61 20.72Suriname 74.93 58.13 91.45 79.38 66.76 91.22 74.48 67.39 66.62 72.77 66.27 58.29 35.20Syria 56.08 24.25 88.57 66.67 33.16 84.58 35.10 67.58 37.08 7.45 39.73 24.81 25.00Timor-Leste 50.74 58.53 69.41 40.51 37.11 55.92 73.29 46.39 72.31 42.14 74.23 54.44 11.32Trinidad and Tobago 74.34 63.30 91.85 87.50 77.77 40.24 79.43 62.15 34.18 75.12 67.38 65.32 45.38Turkmenistan 75.04 91.38 62.84 84.49 61.43 41.98 40.92 20.68 6.27 50.71 47.46Vietnam 74.12 36.59 89.26 67.55 67.30 72.38 54.38 76.18 55.12 8.62 63.20 42.44 32.09Zimbabwe 44.45 33.89 55.41 47.88 35.16 39.35 58.62 59.52 58.14 9.29 50.60 44.33 31.35
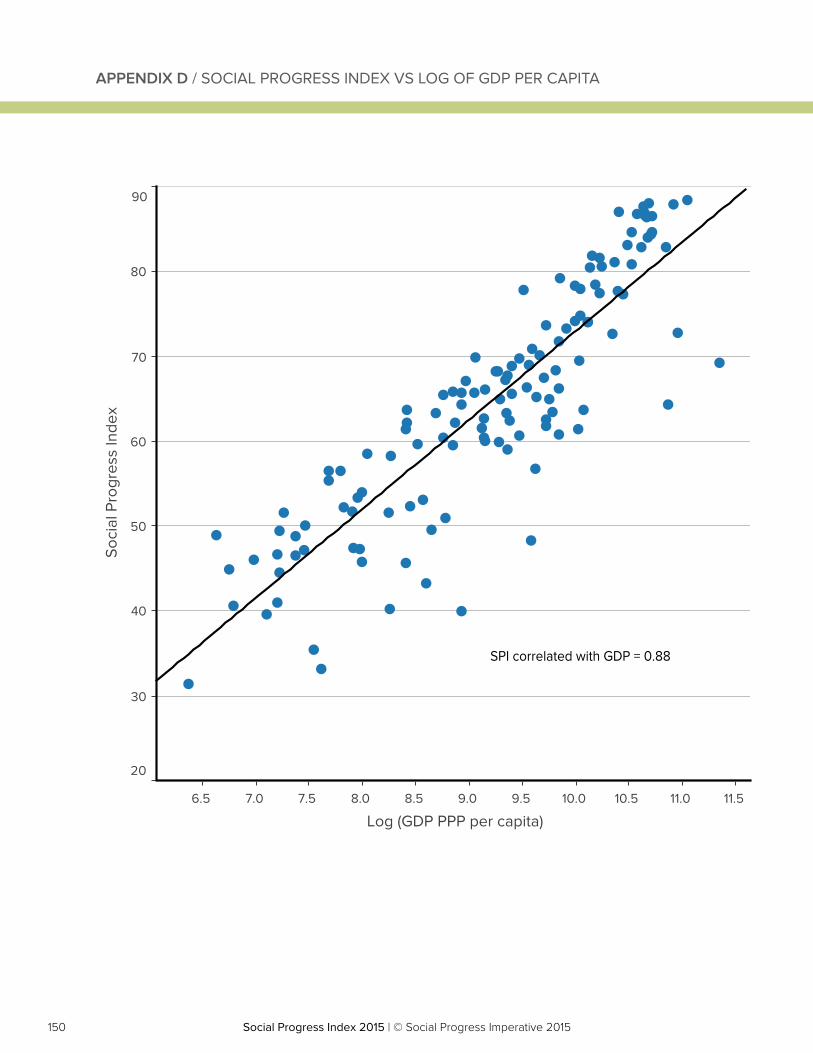
150 Social Progress Index 2015 | © Social Progress Imperative 2015Social Progress Index 2015 | © Social Progress Imperative 2015
6.5 7.0 7.5 8.0 8.5 9.0 9.5 10.0 10.5 11.0 11.5
Log (GDP PPP per capita)
20
30
40
50
60
70
80
90
Soci
al P
rogr
ess
Inde
x
SPI correlated with GDP = 0.88
APPENDIX D / SOCIAL PROGRESS INDEX VS LOG OF GDP PER CAPITA
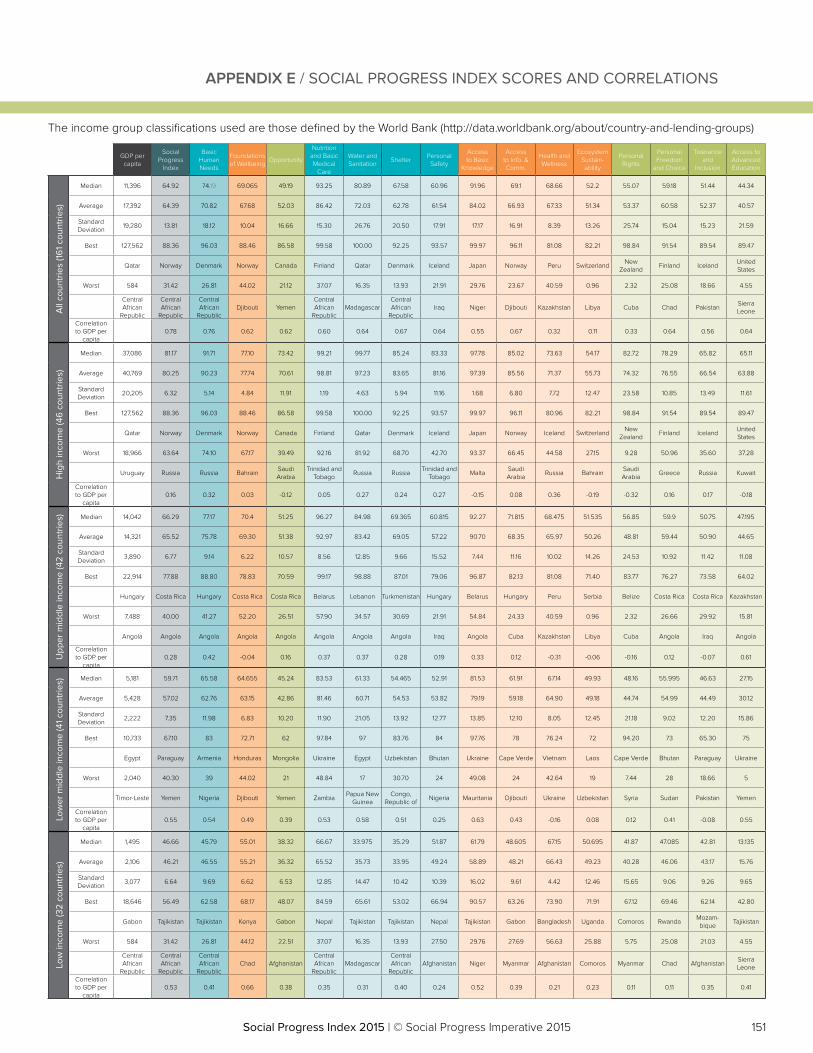
151Social Progress Index 2015 | © Social Progress Imperative 2015Social Progress Index 2015 | © Social Progress Imperative 2015
GDP per capita
Social Progress
Index
Basic Human Needs
Foundations of Wellbeing
Opportunity
Nutrition and Basic Medical
Care
Water and Sanitation
ShelterPersonal
Safety
Access to Basic
Knowledge
Access to Info. & Comm.
Health and Wellness
Ecosystem Sustain-ability
Personal Rights
Personal Freedom
and Choice
Tolerance and
Inclusion
Access to Advanced Education
All
coun
trie
s (16
1 co
untr
ies)
Median 11,396 64.92 74.19 69.065 49.19 93.25 80.89 67.58 60.96 91.96 69.1 68.66 52.2 55.07 59.18 51.44 44.34
Average 17,392 64.39 70.82 67.68 52.03 86.42 72.03 62.78 61.54 84.02 66.93 67.33 51.34 53.37 60.58 52.37 40.57
Standard Deviation
19,280 13.81 18.12 10.04 16.66 15.30 26.76 20.50 17.91 17.17 16.91 8.39 13.26 25.74 15.04 15.23 21.59
Best 127,562 88.36 96.03 88.46 86.58 99.58 100.00 92.25 93.57 99.97 96.11 81.08 82.21 98.84 91.54 89.54 89.47
Qatar Norway Denmark Norway Canada Finland Qatar Denmark Iceland Japan Norway Peru SwitzerlandNew
ZealandFinland Iceland
United States
Worst 584 31.42 26.81 44.02 21.12 37.07 16.35 13.93 21.91 29.76 23.67 40.59 0.96 2.32 25.08 18.66 4.55
Central African
Republic
Central African
Republic
Central African
RepublicDjibouti Yemen
Central African
RepublicMadagascar
Central African
RepublicIraq Niger Djibouti Kazakhstan Libya Cuba Chad Pakistan
Sierra Leone
Correlation to GDP per
capita0.78 0.76 0.62 0.62 0.60 0.64 0.67 0.64 0.55 0.67 0.32 0.11 0.33 0.64 0.56 0.64
Hig
h in
com
e (4
6 c
ount
ries)
Median 37,086 81.17 91.71 77.10 73.42 99.21 99.77 85.24 83.33 97.78 85.02 73.63 54.17 82.72 78.29 65.82 65.11
Average 40,769 80.25 90.23 77.74 70.61 98.81 97.23 83.65 81.16 97.39 85.56 71.37 55.73 74.32 76.55 66.54 63.88
Standard Deviation
20,205 6.32 5.14 4.84 11.91 1.19 4.63 5.94 11.16 1.68 6.80 7.72 12.47 23.58 10.85 13.49 11.61
Best 127,562 88.36 96.03 88.46 86.58 99.58 100.00 92.25 93.57 99.97 96.11 80.96 82.21 98.84 91.54 89.54 89.47
Qatar Norway Denmark Norway Canada Finland Qatar Denmark Iceland Japan Norway Iceland SwitzerlandNew
ZealandFinland Iceland
United States
Worst 18,966 63.64 74.10 67.17 39.49 92.16 81.92 68.70 42.70 93.37 66.45 44.58 27.15 9.28 50.96 35.60 37.28
Uruguay Russia Russia BahrainSaudi Arabia
Trinidad and Tobago
Russia RussiaTrinidad and
TobagoMalta
Saudi Arabia
Russia BahrainSaudi Arabia
Greece Russia Kuwait
Correlation to GDP per
capita0.16 0.32 0.03 -0.12 0.05 0.27 0.24 0.27 -0.15 0.08 0.36 -0.19 -0.32 0.16 0.17 -0.18
Upp
er m
iddl
e in
com
e (4
2 co
untr
ies) Median 14,042 66.29 77.17 70.4 51.25 96.27 84.98 69.365 60.815 92.27 71.815 68.475 51.535 56.85 59.9 50.75 47.195
Average 14,321 65.52 75.78 69.30 51.38 92.97 83.42 69.05 57.22 90.70 68.35 65.97 50.26 48.81 59.44 50.90 44.65
Standard Deviation
3,890 6.77 9.14 6.22 10.57 8.56 12.85 9.66 15.52 7.44 11.16 10.02 14.26 24.53 10.92 11.42 11.08
Best 22,914 77.88 88.80 78.83 70.59 99.17 98.88 87.01 79.06 96.87 82.13 81.08 71.40 83.77 76.27 73.58 64.02
Hungary Costa Rica Hungary Costa Rica Costa Rica Belarus Lebanon Turkmenistan Hungary Belarus Hungary Peru Serbia Belize Costa Rica Costa Rica Kazakhstan
Worst 7,488 40.00 41.27 52.20 26.51 57.90 34.57 30.69 21.91 54.84 24.33 40.59 0.96 2.32 26.66 29.92 15.81
Angola Angola Angola Angola Angola Angola Angola Angola Iraq Angola Cuba Kazakhstan Libya Cuba Angola Iraq Angola
Correlation to GDP per
capita0.28 0.42 -0.04 0.16 0.37 0.37 0.28 0.19 0.33 0.12 -0.31 -0.06 -0.16 0.12 -0.07 0.61
Low
er m
iddl
e in
com
e (4
1 co
untr
ies) Median 5,181 59.71 65.58 64.655 45.24 83.53 61.33 54.465 52.91 81.53 61.91 67.14 49.93 48.16 55.995 46.63 27.15
Average 5,428 57.02 62.76 63.15 42.86 81.46 60.71 54.53 53.82 79.19 59.18 64.90 49.18 44.74 54.99 44.49 30.12
Standard Deviation
2,222 7.35 11.98 6.83 10.20 11.90 21.05 13.92 12.77 13.85 12.10 8.05 12.45 21.18 9.02 12.20 15.86
Best 10,733 67.10 83 72.71 62 97.84 97 83.76 84 97.76 78 76.24 72 94.20 73 65.30 75
Egypt Paraguay Armenia Honduras Mongolia Ukraine Egypt Uzbekistan Bhutan Ukraine Cape Verde Vietnam Laos Cape Verde Bhutan Paraguay Ukraine
Worst 2,040 40.30 39 44.02 21 48.84 17 30.70 24 49.08 24 42.64 19 7.44 28 18.66 5
Timor-Leste Yemen Nigeria Djibouti Yemen ZambiaPapua New
GuineaCongo,
Republic ofNigeria Mauritania Djibouti Ukraine Uzbekistan Syria Sudan Pakistan Yemen
Correlation to GDP per
capita0.55 0.54 0.49 0.39 0.53 0.58 0.51 0.25 0.63 0.43 -0.16 0.08 0.12 0.41 -0.08 0.55
Low
inco
me
(32
coun
trie
s)
Median 1,495 46.66 45.79 55.01 38.32 66.67 33.975 35.29 51.87 61.79 48.605 67.15 50.695 41.87 47.085 42.81 13.135
Average 2,106 46.21 46.55 55.21 36.32 65.52 35.73 33.95 49.24 58.89 48.21 66.43 49.23 40.28 46.06 43.17 15.76
Standard Deviation
3,077 6.64 9.69 6.62 6.53 12.85 14.47 10.42 10.39 16.02 9.61 4.42 12.46 15.65 9.06 9.26 9.65
Best 18,646 56.49 62.58 68.17 48.07 84.59 65.61 53.02 66.94 90.57 63.26 73.90 71.91 67.12 69.46 62.14 42.80
Gabon Tajikistan Tajikistan Kenya Gabon Nepal Tajikistan Tajikistan Nepal Tajikistan Gabon Bangladesh Uganda Comoros RwandaMozam-bique
Tajikistan
Worst 584 31.42 26.81 44.12 22.51 37.07 16.35 13.93 27.50 29.76 27.69 56.63 25.88 5.75 25.08 21.03 4.55
Central African
Republic
Central African
Republic
Central African
RepublicChad Afghanistan
Central African
RepublicMadagascar
Central African
RepublicAfghanistan Niger Myanmar Afghanistan Comoros Myanmar Chad Afghanistan
Sierra Leone
Correlation to GDP per
capita0.53 0.41 0.66 0.38 0.35 0.31 0.40 0.24 0.52 0.39 0.21 0.23 0.11 0.11 0.35 0.41
The income group classifications used are those defined by the World Bank (http://data.worldbank.org/about/country-and-lending-groups)
APPENDIX E / SOCIAL PROGRESS INDEX SCORES AND CORRELATIONS
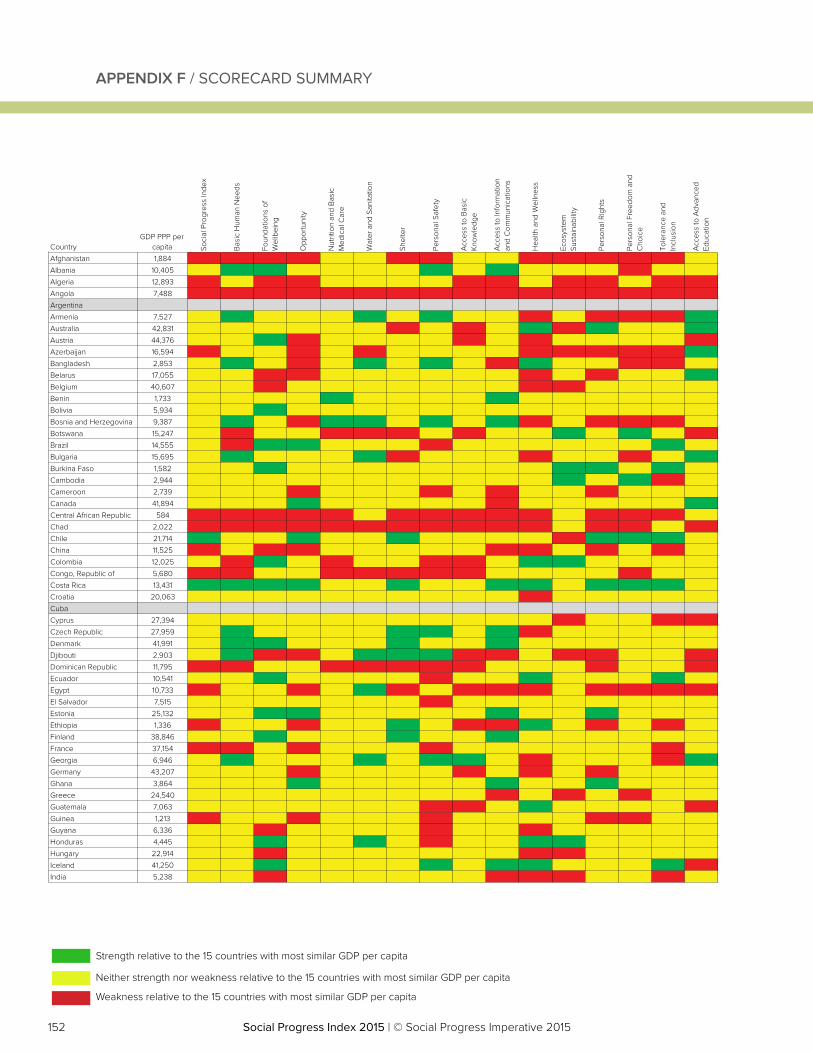
152 Social Progress Index 2015 | © Social Progress Imperative 2015Social Progress Index 2015 | © Social Progress Imperative 2015
CountryGDP PPP per
capita Soci
al P
rogr
ess
Inde
x
Bas
ic H
uman
Nee
ds
Foun
datio
ns o
f W
ellb
eing
Opp
ortu
nity
Nut
ritio
n an
d B
asic
M
edic
al C
are
Wat
er a
nd S
anita
tion
Shel
ter
Pers
onal
Saf
ety
Acc
ess
to B
asic
K
now
ledg
e
Acc
ess
to In
form
atio
n an
d C
omm
unic
atio
ns
Hea
lth a
nd W
elln
ess
Ecos
yste
m
Sust
aina
bilit
y
Pers
onal
Rig
hts
Pers
onal
Fre
edom
and
C
hoic
e
Tole
ranc
e an
d In
clus
ion
Acc
ess
to A
dvan
ced
Educ
atio
n
Afghanistan 1,884 ! ! ! ! " " ! ! " " ! ! ! ! ! "Albania 10,405 " # # " " " " # " # " " " ! " "Algeria 12,893 ! " ! ! " " " " ! ! " ! ! " ! !Angola 7,488 ! ! ! ! ! ! ! ! ! ! ! ! ! ! ! !Argentina
Armenia 7,527 " # " " " # " # " " ! " ! ! ! #Australia 42,831 " " " " " " ! " ! " # ! # " " #Austria 44,376 " " # ! " " " " ! " ! " " " " !Azerbaijan 16,594 ! " " ! " ! " " " " ! ! ! ! ! #Bangladesh 2,853 " # " ! " # " # " ! # " " ! ! "Belarus 17,055 " " ! ! " " " " " " ! " ! " " #Belgium 40,607 " " ! " " " " " " " ! ! " " " "Benin 1,733 " " " " # " " " " # " " " " " "Bolivia 5,934 " " # " " " " " " " " " " " " "Bosnia and Herzegovina 9,387 " # " ! # # " # " # ! " ! ! ! "Botswana 15,247 " ! " " ! ! ! " ! " " # " # " !Brazil 14,555 " ! # # " " " ! " " " " " " # "Bulgaria 15,695 " # " " " # ! " " " ! " " ! " #Burkina Faso 1,582 " " # " " " " " " " " # # " # "Cambodia 2,944 " " " " " " " " " " " # " # ! "Cameroon 2,739 " " " ! " " " ! " ! " " ! " " "Canada 41,894 " " " # " " " " " ! " " " " " #Central African Republic 584 ! ! ! ! ! " ! ! ! ! ! " ! ! ! "Chad 2,022 ! ! ! ! ! ! ! ! ! ! ! " ! ! " !Chile 21,714 # " " # " " # " " " " ! # # # "China 11,525 ! " ! ! " " " " " ! ! " ! " ! "Colombia 12,025 " ! # " ! " " ! ! " # # " " " "Congo, Republic of 5,680 ! ! " " ! ! ! ! ! " " " " ! " "Costa Rica 13,431 # # # # " " # " " # # " # # # "Croatia 20,063 " " " " " " " " " " ! " " " " "Cuba
Cyprus 27,394 " " " " " " " " " " " ! " " ! !Czech Republic 27,959 " # " " " " # # " # ! " " " " "Denmark 41,991 " # # " " " # " " # " " " " " "Djibouti 2,903 " # ! ! " # # # ! ! " ! ! " " !Dominican Republic 11,795 ! ! " " ! ! ! ! ! " " " ! " " !Ecuador 10,541 " " # " " " " ! " " # " " " # "Egypt 10,733 ! " " ! " # ! " ! ! ! " ! ! ! !El Salvador 7,515 " " " " " " " ! " " " " " " " "Estonia 25,132 " " # # " " " " " # " " # " " "Ethiopia 1,336 ! " " ! " " # " ! ! # " ! " ! "Finland 38,846 " " # " " " # " " # " " " " " "France 37,154 ! ! " ! " " " ! " " " " " " ! "Georgia 6,946 " # " " " # " # # " ! " " " ! #Germany 43,207 " " " ! " " " " ! " ! " ! " " "Ghana 3,864 " " " # " " " " " # " " # " " "Greece 24,540 " " " " " " " " " ! " ! " ! " "Guatemala 7,063 " " " " " " " ! ! " # " " " " !Guinea 1,213 ! " " ! " " " ! " " " " ! ! " "Guyana 6,336 " " ! " " " " ! " " ! " " " " "Honduras 4,445 " " # " " # " ! " " # # " " " "Hungary 22,914 " " ! " " " " " " " ! ! " " " "Iceland 41,250 " " # " " " " # " # # " " " # !India 5,238 " " ! " " " " " " ! ! ! " " ! "
Strength relative to the 15 countries with most similar GDP per capita
Neither strength nor weakness relative to the 15 countries with most similar GDP per capita
Weakness relative to the 15 countries with most similar GDP per capita
APPENDIX F / SCORECARD SUMMARY
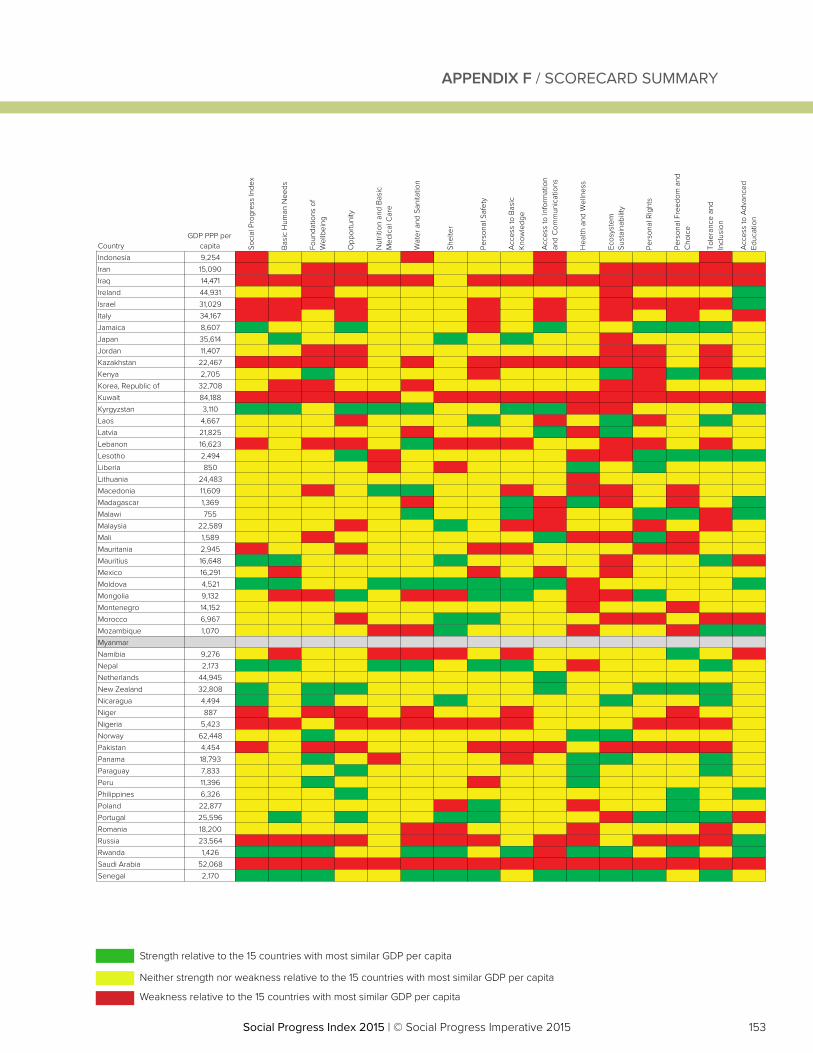
153Social Progress Index 2015 | © Social Progress Imperative 2015Social Progress Index 2015 | © Social Progress Imperative 2015
CountryGDP PPP per
capita Soci
al P
rogr
ess
Inde
x
Bas
ic H
uman
Nee
ds
Foun
datio
ns o
f W
ellb
eing
Opp
ortu
nity
Nut
ritio
n an
d B
asic
M
edic
al C
are
Wat
er a
nd S
anita
tion
Shel
ter
Pers
onal
Saf
ety
Acc
ess
to B
asic
K
now
ledg
e
Acc
ess
to In
form
atio
n an
d C
omm
unic
atio
ns
Hea
lth a
nd W
elln
ess
Ecos
yste
m
Sust
aina
bilit
y
Pers
onal
Rig
hts
Pers
onal
Fre
edom
and
C
hoic
e
Tole
ranc
e an
d In
clus
ion
Acc
ess
to A
dvan
ced
Educ
atio
n
Indonesia 9,254 ! " " " " ! " " " ! " " " " ! "Iran 15,090 ! " ! ! " " " " " ! " ! ! ! ! !Iraq 14,471 ! ! ! ! ! ! " ! ! ! ! ! ! ! ! !Ireland 44,931 " " ! " " " " " " " " ! " " " #Israel 31,029 ! ! ! ! " " " ! " ! " ! ! ! ! #Italy 34,167 ! ! " ! " " " ! " ! " ! " ! " !Jamaica 8,607 # " " # " " " ! " # " " # # # "Japan 35,614 " # " " " " # " # " " ! " " " "Jordan 11,407 " " ! ! " " " " " " " ! ! " ! "Kazakhstan 22,467 ! ! ! ! " ! " ! ! ! ! ! ! " ! "Kenya 2,705 " " # " " " " ! " " " # ! # ! #Korea, Republic of 32,708 " ! ! " " ! " " " " " ! ! " " "Kuwait 84,188 ! ! ! ! ! " ! ! ! ! ! ! ! ! ! !Kyrgyzstan 3,110 # # " # # # " " # # ! ! " " " #Laos 4,667 " " " ! " " " # " ! " # ! " # "Latvia 21,825 " " " " " ! " " " # ! # " " " "Lebanon 16,623 ! " ! ! " # ! ! ! " " ! ! " ! "Lesotho 2,494 " " " # ! " " " " " ! ! # # # #Liberia 850 " " " " ! " ! " " " # " # " " "Lithuania 24,483 " " " " " " " " " " ! " " " " "Macedonia 11,609 " " ! " # # " " ! " ! ! " ! " "Madagascar 1,369 " " " " " ! " " # ! # ! " ! " #Malawi 755 " " " " " # " " # ! " " # # ! #Malaysia 22,589 " " " ! " " # " ! ! " " ! " ! "Mali 1,589 " " ! " " " " " " # ! ! # ! " "Mauritania 2,945 ! " " ! " " " ! ! " " " ! ! " "Mauritius 16,648 # # " " " " # " " " " ! " " # !Mexico 16,291 " ! " " " " " ! " ! " ! " " " "Moldova 4,521 # # " " # # # # # # ! " " " " #Mongolia 9,132 " ! ! # " ! ! # # " ! ! # " " "Montenegro 14,152 " " " " " " " " " " ! " " ! " "Morocco 6,967 " " " ! " " # # " " " ! ! " ! !Mozambique 1,070 " " " " ! ! # " " " ! " " ! # #Myanmar
Namibia 9,276 " ! " " ! ! ! " ! " " " " # " !Nepal 2,173 # # " " # # " # # " ! " " " # "Netherlands 44,945 " " " " " " " " " # " " " " " "New Zealand 32,808 # " # # " " " " " # " " # # # "Nicaragua 4,494 # " # " " " # " " " " # " " # "Niger 887 ! " ! ! " ! " " ! " " " " ! " "Nigeria 5,423 ! ! " ! ! ! ! ! ! " " " ! ! ! "Norway 62,448 " " # " " " " " " " # # " " " "Pakistan 4,454 ! " ! ! " " " ! ! ! " ! ! ! ! "Panama 18,793 " " # " ! " " " ! " # # " " # "Paraguay 7,833 " " " # " " " " " " # " " " # "Peru 11,396 " " # " " " " ! " " # " " " " "Philippines 6,326 " " " # " " " " " " " " " # " #Poland 22,877 " " " " " " ! # " " ! " " # " "Portugal 25,596 " # " # " " # # " " " ! # # # !Romania 18,200 " " " " " ! ! " " " ! " " " ! "Russia 23,564 ! ! ! ! " ! ! ! " ! ! " ! ! ! #Rwanda 1,426 # # # " " # # " # ! # # " # " #Saudi Arabia 52,068 ! ! ! ! ! ! ! ! ! ! ! ! ! ! ! !Senegal 2,170 # # # " " # # # " # # # # " # "
Strength relative to the 15 countries with most similar GDP per capita
Neither strength nor weakness relative to the 15 countries with most similar GDP per capita
Weakness relative to the 15 countries with most similar GDP per capita
APPENDIX F / SCORECARD SUMMARY
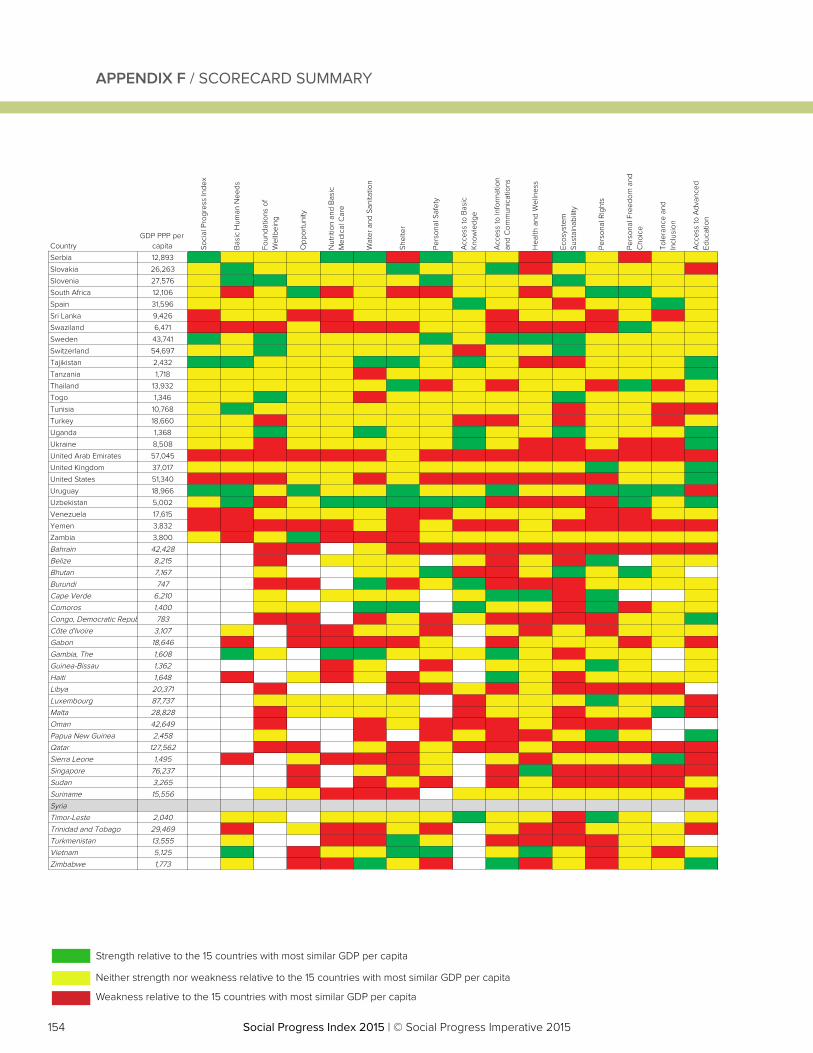
154 Social Progress Index 2015 | © Social Progress Imperative 2015Social Progress Index 2015 | © Social Progress Imperative 2015
CountryGDP PPP per
capita Soci
al P
rogr
ess
Inde
x
Bas
ic H
uman
Nee
ds
Foun
datio
ns o
f W
ellb
eing
Opp
ortu
nity
Nut
ritio
n an
d B
asic
M
edic
al C
are
Wat
er a
nd S
anita
tion
Shel
ter
Pers
onal
Saf
ety
Acc
ess
to B
asic
K
now
ledg
e
Acc
ess
to In
form
atio
n an
d C
omm
unic
atio
ns
Hea
lth a
nd W
elln
ess
Ecos
yste
m
Sust
aina
bilit
y
Pers
onal
Rig
hts
Pers
onal
Fre
edom
and
C
hoic
e
Tole
ranc
e an
d In
clus
ion
Acc
ess
to A
dvan
ced
Educ
atio
n
Serbia 12,893 ! " " " ! ! # ! " " # ! " # " "Slovakia 26,263 " ! " " " " ! " " ! # " " " " #Slovenia 27,576 " ! ! " " " " ! " " " ! " " " "South Africa 12,106 " # " ! # " # # " " # " ! ! " "Spain 31,596 " " " " " " " " ! " " # " " ! "Sri Lanka 9,426 # " " # # " " " " # " " # " # "Swaziland 6,471 # # # " # # # " " # # # # ! " "Sweden 43,741 ! " ! " " " " ! " ! ! ! " " " "Switzerland 54,697 " " ! " " " " " # " " ! " " " "Tajikistan 2,432 ! ! " " " ! ! " ! " # # " " " !Tanzania 1,718 " " " " " # " " " " " " " " " !Thailand 13,932 " " " " " " ! # " # " " # ! # "Togo 1,346 " " ! " " # " " " " " ! " " " "Tunisia 10,768 " ! " " " " " " " " " # " " # #Turkey 18,660 " " # " " " " " # # " # " " # "Uganda 1,368 " " ! " " ! " " ! " " ! " " " !Ukraine 8,508 " " # " " " " " ! " # # " # # !United Arab Emirates 57,045 # # # # # # " # # # # # # # # #United Kingdom 37,017 " " " " " " " " " " " " ! " " !United States 51,340 # # # " " # " # # # # # # " " !Uruguay 18,966 ! ! " ! " " ! " " ! " " ! ! ! #Uzbekistan 5,002 " ! # " ! ! ! ! ! # # # # ! " !Venezuela 17,615 # # " " " " # # " " " " # # " "Yemen 3,832 # # # # # " # " # # " # # # # #Zambia 3,800 " # " ! # # # " " " " " " " " "Bahrain 42,428 # # " # # # # # # # # # #Belize 8,215 # " " " " # " # ! " "Bhutan 7,167 " " " ! # # " ! " ! "Burundi 747 # # ! # " ! # # # " " " "Cape Verde 6,210 " " " " " ! ! # ! "Comoros 1,400 " " ! ! ! " " # ! # " "Congo, Democratic Repub 783 # # # " # " # # # # " " !Côte d'Ivoire 3,107 " # # " " # " # " # " " "Gabon 18,646 # # # # # " # " " " # " #Gambia, The 1,608 ! " ! ! " " " ! " # " " "Guinea-Bissau 1,362 # " # " " " ! " "Haiti 1,648 # " # " # " ! " # " " " "Libya 20,371 # # # " # " # # # #Luxembourg 87,737 " " " " " # " " " ! " " #Malta 28,828 # " " " " # " " # " " ! #Oman 42,649 # # " # # # " # # #Papua New Guinea 2,458 " # # " # # " ! " !Qatar 127,562 # # " # " # # " # # # # #Sierra Leone 1,495 # " # # # " " # " " " ! #Singapore 76,237 # " # " # ! # # # # #Sudan 3,265 # # " # # " # # # # "Suriname 15,556 " " # # # " " " " " " " #SyriaTimor-Leste 2,040 " " " " " " ! " " # ! " "Trinidad and Tobago 29,469 # " # # " # " # # " " " #Turkmenistan 13,555 " # # ! " # # # # " "Vietnam 5,125 ! # " " ! ! " ! " # " # "Zimbabwe 1,773 " # # ! " # ! # " # " " !Senegal 2,170 ! ! ! " " ! ! ! " ! ! ! ! " ! "
Strength relative to the 15 countries with most similar GDP per capita
Neither strength nor weakness relative to the 15 countries with most similar GDP per capita
Weakness relative to the 15 countries with most similar GDP per capita
APPENDIX F / SCORECARD SUMMARY
socialprogressimperative.org
ch 1 photo credit: Fabio Bertolottihttps://www.flickr.com/photos/gothormr/5573644067
ch 2 photo credit: Ross Pollackhttps://www.flickr.com/photos/rossap/6998629018
ch 3 photo credit: Fabio Bertolottihttps://www.flickr.com/photos/gothormr/5161124221/in/photostream/
ch 4 photo credit: Ben Ashmolehttp://bit.ly/1H5qkz0
ch 5 photo credit: Bud Ellisonhttps://www.flickr.com/photos/budellison/16064396131/in/photostream/
ch 6 photo credit: Eric Parkerhttp://bit.ly/1aL3L6s
Cover photo credit: Rajesh flickr.com/photos/himalayan-trails/3209747312/

2101 L Street NW, Suite 800Washington, DC 20037
socialprogressimperative.org@socprogress