social protection systems in the baltic … sections focus on separate parts of the social...
TRANSCRIPT

University of Tartu Faculty of Economics and Business
Administration
SOCIAL PROTECTION SYSTEMS IN THE BALTIC
STATES
Tiiu Paas, Marit Hinnosaar, Jaan Masso, Orsolya Szirko
Tartu 2004

ISSN 1406–5967 ISBN 9985–4–0394–0 Tartu University Press
www.tyk.ut.ee Order No. 317

SOCIAL PROTECTION SYSTEMS IN THE BALTIC STATES Tiiu Paas, Marit Hinnosaar, Jaan Masso, Orsolya Szirko1
Abstract The paper analyses the social protection systems of the Baltic States comparing them to the existing systems of the other European countries and discussing poverty reduction strategies, pension systems, social and unemployment assistance, labour market policies and regulations. The aim is to investigate whether there are relevant differences between the Baltic States
1 Tiiu Paas Ph.D (corresponding author), Professor of Eco-nometrics, University of Tartu, Faculty of Economics and Business Administration, Narva mnt. 4–A208, Tartu 51009, Estonia, phone +372 7 376 341, E-mail [email protected]. Marit Hinnosaar, Ph.D student, University of Tartu, Faculty of Economics and Business Administration, Narva mnt. 4–A110, Tartu 51009, Estonia. Jaan Masso, Ph.D student, University of Tartu, Faculty of Economics and Business Administration, Narva mnt. 4-A110, Tartu 51009, Estonia. Orsolya Szirko, MA student, University of Tartu, Faculty of Economics and Business Administration, Narva mnt. 4–A110, Tartu 51009, Estonia. The paper was prepared within the framework of the 5th EU Framework Programme project HPSE-CT-2001-00084 “The Eastward Enlargement of the Euro-zone (Ezoneplus)” and the project “Structu-ral changes in the Estonian labour market: risks and sustainable development” financed by the Estonian Ministry of Education. The usual disclaimer applies.

Social protection systems in the Baltic States 4
and the EU that might inhibit the integration of the former to the European Union. The rapid transformation processes have created acute social problems such as structural unemployment, poverty, social exclusion and growing inequality, challenging people’s absorptive capacity and endangering social cohesion. We show that by now the Baltic States have worked out their poverty reduction strategies, 3-pillar pension systems, unemployment insurance systems, including both the insurance component and poverty reduction as a target, and labour market institutions necessary for a market economy. The paper concludes that although the expenditure on social protection is smaller in the Baltic States than in the EU and the initially selected labour-market-based approach has been complemented with elements of a liberal system, in the future the system may have a tendency towards converging to the European social model. More attention should be paid to implementing active measures of social protection that support social cohesion.
JEL–Classification: H55, I32, I38, J65
Keywords: social protection, poverty reduction, pension system, social and unemployment assistance, labour market institutions, the Baltic States

CONTENTS Intriduction ............................................................................. 7 1. A General overview of social protection systems ............. 10
1.1. The concept of social protection............................... 10 1.2. The Baltic social protection systems compared with
those of other European countries ............................ 14 2. Poverty Reduction Strategies ............................................ 20
2.1. Poverty and social exclusion .................................... 20 2.2. Poverty assessment................................................... 23 2.3. Poverty reduction strategies in the Baltic States ...... 29
3. Pension Systems................................................................ 32
3.1. Overview of the pension systems in the Baltic States ........................................................................ 32
3.2. Some considerations regarding the pension systems ..................................................................... 37
4. Social and Unemployment Assistance .............................. 39
4.1. Unemployment assistance and insurance................. 39 4.2. Social Assistance...................................................... 45
5. The Role of Labour Market Policies and Institutions for
Social Protection ............................................................... 50 5.1. Active labour market policies................................... 50 5.2. Regulation of dismissals........................................... 52 5.3. Wage bargaining and regulation of low pay as
means of social protection ........................................ 56 6. Conclusions and implications............................................. 61

Social protection systems in the Baltic States 6
References .............................................................................. 64 Kokkuvõte .............................................................................. 73 Appendix ................................................................................ 74

Introduction The EU eastward enlargement will assumably start the conver-gence of the accession countries’ living standards and incomes to the EU level by means of these countries’ faster economic growth. However, at least so far, the average growth rates in the transition economies have been disappointing (with some exceptions, e.g. Estonia) contrary to the optimistic expectations prevailing at the beginning of the transition (Campos and Coricelli 2002) — the expectations were high thanks to the transition countries’ relatively well-educated labour force and adequate level of industrialisation. In actual fact, however, the transition countries are still far below the average living standards of the current EU member states.
A necessary condition for sustainable economic growth is the social cohesion in a society that is to be achieved through social protection systems. Though social protection systems may have some distorting effects, for example, reducing labour supply, generally it is agreed that they protect and improve human capital (Social Protection Sector… 2000). The post-transitional developments have posed a challenge to the social protection systems. The over-a-decade-long structural adjustment and reforms have had serious social consequences and costs that may have a negative impact on the reintegration of the Baltic States into Europe. The transformation processes have often been faster than expected, placing the population under serious pressure. The majority of the population in the transition countries are unable to adjust quickly enough to such rapid changes and the natural consequences are high structural unemployment, poverty, social exclusion, increasing inequality and concurrent problems that are sometimes difficult to solve by poor countries.

Social protection systems in the Baltic States 8
Under the former central planning regime the Baltic States, similarly to the Central and Eastern European (CEE) countries, were characterised by a more egalitarian income distribution than western market economies. This situation changed dramatically after the outset of the transition; by 1999, the income inequality of the Baltic Countries had caught up with the average level of the EU and OECD countries. The people of the post-socialist countries are less willing to tolerate the existing income inequality (see Suhrcke 2001). Thus, apart from absolute poverty, people seriously suffer from the consequences of increasing relative poverty and the feeling of social exclusion. This is very likely to have important implications for the political support of reform policy, emphasising the need to deal seriously with the social consequences of European integration and the transition processes in the Baltic States. The social issues prompt the question about relevant policies towards the people who have been most seriously affected by the rapid economic and political reforms. According to the directions of the European Commission (1997), the main target of improvement of the European social protection system has to be encouraging people to be more active and competitive in the labour markets in order to increase the labour market participation rate of the declining and ageing European population. This target is also important for the Baltic States. Social protection measures can be classified into two types: active and passive ones, and to achieve the abovementioned target, the main attention should be paid to the active measures.
The aim of the present paper is to analyse the social protection system of the Baltic States in the context of the EU enlargement, in order to explain whether there exist relevant differences between the Baltic States and the EU that might inhibit the integration of the former into the European Union. The authors concentrate on poverty reduction strategies, social and unemployment assistance, labour market policies and regulations. The results of the analysis will form a basis for proposals to policymakers about how to develop the social

Tiiu Paas, Marit Hinnosaar, Jaan Masso, Orsolya Szirko 9
protection system within the context of the EU requirements and reforms.
The paper is structured as follows. In Section 2 we discuss the concept of social protection and compare the social protection systems of the Baltic States with those of the European countries. In Section 3 the role of poverty reduction in sustainable human development is analysed and an overview is given of the poverty reduction strategies in the Baltics. The following sections focus on separate parts of the social protection systems. In Section 4 we discuss the pension systems, while Section 5 analyses social and unemployment assistance and Section 6 examines the labour market policies and institutions. The final section draws the conclusions. The empirical part of the paper is mainly based on the data of the Baltic national authorities and international organisations (the World Bank, European Commission, UNDP).

1. A General overview of social
protection systems 1.1. The concept of social protection
The definition of social protection
The concept of social protection is rather new and still evol-ving. In time, its definition has become broader as a larger range of measures has been incorporated under the term. Currently the topic of social protection is again in the centre of attention and economists in different institutions have addressed the issue of redefining the concept in the light of developments such as rising public expenditures, ageing populations, wide-ning of borders, and increasing international competition.
According to the narrow definition, social protection incorpo-rates public measures meant to provide income security to individuals (Holzmann and Jørgensen 2000). There is general agreement that the overall goal of social protection is to improve welfare and also reduce poverty. In the past decades, however, there has not always been consensus about what wel-fare improvement is when taking into account all the indirect effects of policies. Therefore the exact measures used to target the goal have been wide-ranging.
The World Bank’s Social Protection Sector defines the social protection (World Bank Social Protection Sector, 2004) as: “a collection of measures to improve or protect human capital. Social Protection interventions assist individuals, households, and communities to better manage the income risks that leave people vulnerable”. The economic argument could be that in case of decreasing marginal utility individuals’ welfare is increased with smoothing income across different time periods.

Tiiu Paas, Marit Hinnosaar, Jaan Masso, Orsolya Szirko 11
However, individuals themselves might not be able to smooth their income and consumption, for example, due to borrowing constraints, uninsurability against the risk of unemployment. The definition of social protection was reviewed during the preparation of the Social Protection Sectors’s new strategy by the World Bank (Social Protection Sector… 2000) which was firstly aimed at assisting individuals and communities to manage risk better, and secondly to provide support to the critically poor. The idea was that the social protection system should provide a safety net to the poor but also to help them out of poverty and therefore the social protection system can be viewed not as the expenditure on social transfers but primarily as investment into human capital. The goal is that social protec-tion systems should focus more on the causes of poverty rather than the symptoms.
Generally, the social protection measures are thought to belong to four large areas: social insurance, direct transfers, social funds, and labour market institutions. The goal of a social protection system can be tackled mainly in two ways: there are measures which are directed at helping people escaping po-verty, and measures for providing a certain minimum income to those in poverty. Both ways are directed towards avoiding the social exclusion of people and thereby supporting directly or indirectly the preservation or even raising of the human capital. Social insurance (like health insurance, unemployment insu-rance, pension insurance, etc.) as well as most of the direct transfers should provide people with a minimum income. Some labour market regulations, for instance, minimum wage and trade unions’ activities have the same goal — to provide people with a certain income above the minimum level or level considered to be fair. There are also other measures, such as active labour market measures and several other social funds directed at providing people with the possibility to escape poverty by, for example, improving their qualifications. The concept related to social protection is social security that according to Encyclopaedia Britannica (2004) denotes any of the measures established by legislation to maintain individual or

Social protection systems in the Baltic States 12
family income or to provide income when some or all sources of income are disrupted or terminated or when exceptionally heavy expenditures have to be incurred. The key difference between the social security and social protection measures is that the former includes only statutory measures.2
Economic growth and the social protection system
Despite the demand for equity and therefore the need for social protection, the orthodox economic theory talks about a possible trade-off between efficiency and equity and leads to the conclusion that reducing inequality might decrease growth. Finding empirical evidence that there is a relationship between inequality and economic growth has interested economists for many decades. Kuznets 1955 hypothesis of the inverted U-shape relationship (Kuznets 1955), indicating that inequality increases at the beginning of the economic development and declines in its later stages still provokes discussion but is usually rejected. Wan (2002) too rejects Kuznets’ hypothesis when analysing the transition countries’ data. As suggested by evidence, inequality has been increasing both in developing and developed countries (Atkinson et al 1995).
There is still plenty of discussion as well as theoretical and empirical analysis of the relationship between social protection and economic growth. The direct efficiency supporting theory suggests that the social protection system which discourages people from working and reduces investment, decreases also the production level (Atkinson 1999). The opposite view which criticises the position that social protection has a negative
2 In some countries the term social security is used in a narrower sense, for example, in United States social security denotes only the federal social insurance system (Old-Age, Survivors, and Disability Insurance program), sometimes also medical insurance program Medicare is included in the U.S. social insurance definition (Thomp-son 1983).

Tiiu Paas, Marit Hinnosaar, Jaan Masso, Orsolya Szirko 13
impact on economic growth, relies on the following arguments (Arjona et al. 2001):
• social protection leads to a more cohesive society promoting the structural adjustment process;
• social protection prevents social exclusion, which would lead to permanent loss of human capital and potential output3;
• social protection measures are especially important in the economy with liquidity constraints;
• social protection keeping children out of poverty has long-term consequences on the intellectual development of society.
Table A 1 in Appendix gives an overview of the results of empirical studies that examined relationships between eco-nomic growth and social protection expenditure. The argument supporting the positive effect of social protection expenditure on growth usually emphasises the importance of capital markets and political stability (Perotti, 1992, 1994). Most of the studies with a positive impact on growth are based on the datasets dominated by less developed countries (Arjona et al. 2001). However, we could think that even when the relationship with economic growth is hard to prove, social protection could still be desirable for the stability and continuity of society.
When analysing the effect of social protection spending on growth, distinction is made between different types of spending, active and passive spending, where active policies increase employment and passive policies are transfers to reduce differences in consumption (Arjona et al. 2001). Arjona et al. (2001) find that passive measures are associated with a poor growth performance while active spending (including spending on active labour market measures, on family services and “make work pay” policies, which means supplementing family 3 For example, if we consider the importance of hysteresis in the labour market (see Bean 1994 for the role of hysteresis in the European labour markets).

Social protection systems in the Baltic States 14
income with transfers) promotes growth. The expected result of active policies is the reduction of factor income inequality as well as final income inequality4. Their additional positive impact leads to an increase in labour supply. Passive policies, on the other hand, might lead to a change in people’s behaviour and therefore increase factor income inequality, which then has to be offset by the reduction of final income inequality. It should be noted that spending on social protection is not easily divisible into passive and active measures, spending on health care being a case in point. The empirical studies about the relationship between growth and social protection have come to different conclusions and there is currently no consensus about the impact of social protection on growth performance. 1.2. Baltic social protection systems
compared with those of other European countries
The Baltic countries are currently facing the task of developing their social protection systems, which is directly affected by their accession process to the European Union. Therefore the following analysis concentrates on the social protection systems in the European countries and the situation in the Baltic States compared to the European Union.
There exists the concept of the European social protection system, which is characterised by large transfer programmes, expanded public services and legally regulated labour market, and is thus different from the Anglo-Saxon model (Grahl, Teague, 1997). Anton Hemerijck (2002) points out three distinctive features of the European social protection system:
4 Factor income inequality reflects the distribution of income from the supply of production factors (labour and capital services), while final income inequality reflects besides factor income inequality also social transfers.

Tiiu Paas, Marit Hinnosaar, Jaan Masso, Orsolya Szirko 15
1) The system has a common commitment to social justice. It is widely accepted that there exists the aspiration to full employment; universal access to health care and edu-cation; adequate social insurance for sickness, disability, unemployment and old age; minimum resources of social assistance to prevent poverty and reduce social exclusion (Boeri et al. 2001).
2) The system is based on the view that social justice can contribute to economic efficiency, contradicting to the idea of the trade-off between efficiency and justice.
3) The system is characterised by influential interest groups and negotiations between government and social partners.
Within the context of the European social protection system, a variety of social protection subsystems can be distinguished in Europe. It is important to note that despite the expectations, the European Union’s role in coordinating social policy has re-mained modest. Despite the convergence in economic perfor-mance, convergence in social protection systems has not taken place and the EU’s redistributive social policies and labour market regulations are rather limited. Leppik (2001) summa-rises that acquis communitaure in the field of social protection has been limited to the equal treatment of men and women, and to the co-ordination of social security schemes for migrant workers (with the objective of facilitating the freedom of movement of workers). The provisions of the European Code of Social Security are also relatively low compared to the level of social protection in the EU15 member countries.
Generally, the social protection systems of Europe are cate-gorised into three or four different groups by the extent of state intervention. For example, Gösta Esping-Andersen (1990) defines three different social protection systems in Europe iden-tified by three measures: by the extent to which state insti-tutions separate social protection from labour market, influence income distribution and involve non-public institutions. According to these measures, the Scandinavian countries stand out as social democratic welfare regimes aimed at ensuring high

Social protection systems in the Baltic States 16
equality and trying to maintain full employment by active la-bour market measures. The continental Western European countries are characterised by conservative corporatist welfare regimes, where social protection is linked to social insurance and the labour-market-induced differences are preserved. The Anglo-American welfare states represent a liberal welfare regime with means-tested poverty protection and private social protection providers.
Ebbinghaus (1999) distinguishes between four social protection models in Europe. The Nordic countries are described as wel-fare states whose social protection system is highly developed, social expenditures are huge, taxes are high and the labour market strictly regulated. The opposite example in Europe can be Great Britain and Ireland with a rather liberal social protection system. The third model mainly describes the situa-tion in the Central European countries, where social expen-ditures are smaller and social protection lies more in social insurance. The fourth model characterises Southern Europe where social expenditure is comparatively small, the labour market is regulated but there exists a large hidden sector that reduces the effective strictness of the regulations due to the pool of unprotected workers.
Our proposition is that the social protection systems of the Baltic States would not exactly copy any of these three or four social protection models developed by the European countries. Therefore the social protection systems in the Baltic States are discussed in comparison with the European models and the comparisons are summarised in Table 1.

Tab
le 1
. So
cial
pro
tect
ion
and
labo
ur m
arke
t ins
titut
ions
in th
e B
altic
Sta
tes a
nd o
ther
Eur
opea
n co
untr
ies
Sc
andi
navi
an
Cen
tral
Eur
opea
n So
uthe
rn
Eur
opea
n A
nglo
-Sax
on
Bal
tic *
Soci
al
secu
rity
Uni
vers
al w
elfa
re
stat
e, o
rient
ed o
n so
cial
serv
ices
Orie
nted
on
soci
al
insu
ranc
e an
d ta
x tra
nsfe
rs
Orie
nted
on
tax
trans
fers
Li
bera
l wel
fare
st
ate,
incr
ease
d pr
ivat
isat
ion
Libe
ral,
orie
nted
on
soci
al in
sura
nce
and
tax
trans
fers
W
elfa
re s
tate
fin
anci
ng
Hig
h, fi
nanc
ed
mai
nly
by ta
xes
Ave
rage
, fin
ance
d m
ainl
y by
taxe
s on
wag
es
Ave
rage
, fin
ance
d m
ainl
y by
go
vern
men
t deb
t an
d ta
xes o
n w
ages
Ave
rage
, fin
ance
d by
taxe
s and
pr
ivat
e in
vest
men
ts
Ave
rage
, fin
ance
d by
taxe
s on
wag
es
Labo
ur
mar
ket
regu
latio
ns
Reg
ulat
ed, l
ifetim
e em
ploy
men
t R
egul
ated
, life
time
empl
oym
ent
Reg
ulat
ed, h
igh
shar
e of
hid
den
sect
or e
mpl
oym
ent
Der
egul
ated
R
egul
ated
, no
emph
asis
on
life-
time
empl
oym
ent
Bar
gain
ing
syst
em
Coo
rdin
ated
wag
e ne
gotia
tions
, ce
ntra
lised
uni
ons,
high
uni
on d
ensi
ty
“Soc
ial p
artn
ersh
ip”,
co
ordi
nate
d w
age
nego
tiatio
ns,
cent
ralis
ed u
nion
s
Dec
entra
lised
wag
e ne
gotia
tions
, wea
k un
ions
Dec
entra
lised
w
age
nego
tiatio
ns,
smal
l uni
ons
Dec
entra
lised
w
age
nego
tiatio
ns,
smal
l uni
ons
Sour
ce: E
bbin
ghau
s, 19
99; *
aut
hors
’ ow
n co
mpi
latio
n

Social protection systems in the Baltic States 18
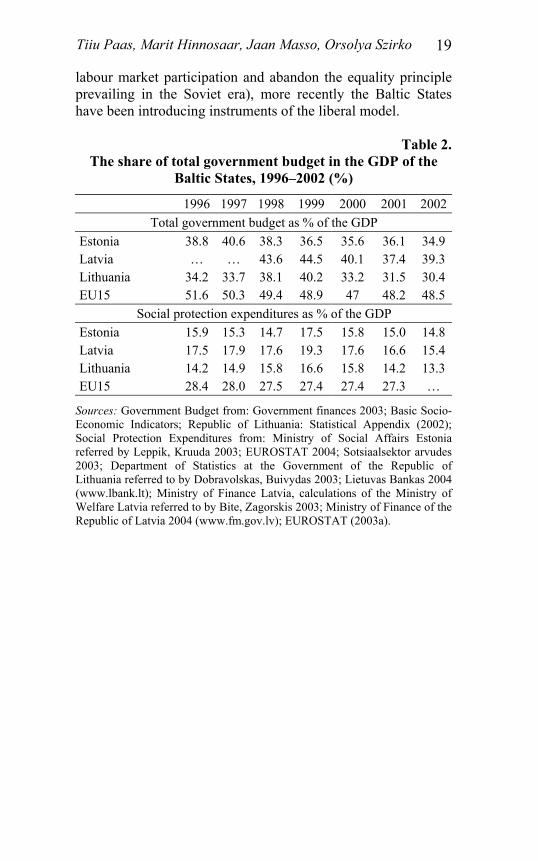
The Baltic States’ social protection systems can be currently described as rather liberal. Their social security system is oriented on tax transfers as well as on social insurance, while the scope of the social security system is rather small. Financing of the welfare state takes place mainly by taxes on wages. The tax burden on wages in Estonia is somewhat higher than the OECD countries’ average, while the tax burden on capital is lower than the EU average (Rõõm, 2003a; Rõõm, 2003b)5. The labour market regulation in Estonia is similar to the European average, while the trade unions are weak and wage negotiations take place mainly at the individual level. Looking at the small size of the government’s total expenditures (see Table 2) in the Baltic States compared to the EU (47 % of the GDP in 2000), the small size of social protection expenditures compared to the EU (27% of the GDP in 2000, see European Social Statistics 2004) and the rather small role of trade unions (see the following sections of the paper), it can be concluded that the social protection system of the Baltic States is liberal. However, the labour market regulations and social security system are similar to the EU as can be seen from the following sections of the paper.
In conclusion, it can be noted that over the last decade the Baltic States have been moving closer to the European social protection system, at least in terms of introducing social insurance systems as well as increasing the minimum wage. The main supportive argument of the European model has been social justice. Similarly, Leppik (2001) argues that, compared to some western European countries, the Estonian social protection system is relatively well aligned with the European Code of Social Security. We can also agree with Bernatas and Guogis (2004), who claimed that even though the Baltic States initially selected a corporative social security model (uninfluenced by labour market partners, seeking to enhance 5 Rõõm (2003a) reports that the average effective tax rate for labour and capital in Estonia were respectively 35.8 and 24.1 % in 1996-2001, while the OECD averages for 1991–1997 were respectively 33.4 and 52.2
Tiiu Paas, Marit Hinnosaar, Jaan Masso, Orsolya Szirko 19
labour market participation and abandon the equality principle prevailing in the Soviet era), more recently the Baltic States have been introducing instruments of the liberal model.
Table 2.
The share of total government budget in the GDP of the Baltic States, 1996–2002 (%)
1996 1997 1998 1999 2000 2001 2002 Total government budget as % of the GDP
Estonia 38.8 40.6 38.3 36.5 35.6 36.1 34.9 Latvia … … 43.6 44.5 40.1 37.4 39.3 Lithuania 34.2 33.7 38.1 40.2 33.2 31.5 30.4 EU15 51.6 50.3 49.4 48.9 47 48.2 48.5
Social protection expenditures as % of the GDP Estonia 15.9 15.3 14.7 17.5 15.8 15.0 14.8 Latvia 17.5 17.9 17.6 19.3 17.6 16.6 15.4 Lithuania 14.2 14.9 15.8 16.6 15.8 14.2 13.3 EU15 28.4 28.0 27.5 27.4 27.4 27.3 …
Sources: Government Budget from: Government finances 2003; Basic Socio-Economic Indicators; Republic of Lithuania: Statistical Appendix (2002); Social Protection Expenditures from: Ministry of Social Affairs Estonia referred by Leppik, Kruuda 2003; EUROSTAT 2004; Sotsiaalsektor arvudes 2003; Department of Statistics at the Government of the Republic of Lithuania referred to by Dobravolskas, Buivydas 2003; Lietuvas Bankas 2004 (www.lbank.lt); Ministry of Finance Latvia, calculations of the Ministry of Welfare Latvia referred to by Bite, Zagorskis 2003; Ministry of Finance of the Republic of Latvia 2004 (www.fm.gov.lv); EUROSTAT (2003a).

Social protection systems in the Baltic States 20
2. Poverty Reduction Strategies 2.1. Poverty and social exclusion The issues of poverty and social exclusion as serious cones-quences of the transition processes that have a significant pressure on the social protection system were recognised as major problems in the Baltic States only in the late 1990s.6 So far the attitude prevailing in economic and social policies was that rather than poverty the transition countries should bother about, raising their general welfare level. The expectation was that with the overall improvement of the economic situation, poverty would disappear automatically, leaving no serious social consequences. Since the end of the 1990s this attitude has changed.
Poverty is mainly related to individuals and households, whe-reas social exclusion is related to society and individuals’ relations with society. Poverty means people’s inability to afford an adequate standard of consumption. On the other hand, the answer to the question about what the adequate standard of consumption is, is still very much a subject for debate and varies significantly between countries and over time. Eco-nomists usually consider poverty in absolute and relative terms, and assessment of poverty consists of objective and subjective
6 The poverty issues assumed new urgency in Western Europe with the slowing of economic growth and rising unemployment in the 1980s. At the beginning of the 1990s nearly 50 million Europeans were living under the poverty line (Eurostat, 1994; p.185). Toward the end of the decade this number had already risen to 60 million Europeans (Eurostat, 2000; Sainsbury and Morissens, 2002, p.3).

Tiiu Paas, Marit Hinnosaar, Jaan Masso, Orsolya Szirko 21
aspects.7 Poverty is generally regarded as a multidimensional concept. At the same time, there is still confusion over the question whether the expression that “poverty is multidimen-sional” implies that (1) poverty itself relates to income but the causes of poverty are multidimensional or (2) the concept of poverty is multidimensional and relates to more than just income. As a matter of fact, poverty characterises a situation where an individual or a group of people finds itself with extremely limited material and social resources. Such people find it difficult to obtain the necessary means for nutritious food, shelter, clothing, medical care, education; they cannot afford to meet cultural and intellectual needs; they feel insecure about future and do not see any prospects of their life improvement, etc. (UNDP, 2000).
Poverty may be a cause as well as a consequence of social exclusion focussing on distributional issues of a society. Social exclusion consists in the danger that poverty is reproducing new poverty and as a consequence part of the population will be excluded from the socio-economic participation in society’s life and both the human capital and competitiveness of countries will seriously decline. Sometimes the terms “poverty” and “social exclusion” have been used synonymously with reference to the multidimensional concept of poverty but usually social exclusion is understood as a broader and more comprehensive concept than poverty.
The concept “social exclusion” was first used in 1985 by Jacques Delors, the then president of the European Commis-sion. Since that time, the concept has also been extended to the 7 Poverty in absolute terms means that consumption is falling below the fixed level of minimal consumption. The level of minimal needs varies between countries and regions. According to the World Bank (2000) estimations, the absolute poverty line is 2.15–4.30 USD (PPP) per capita per day depending on the country’s level of development and its geographical location, etc. Poverty in relative terms means that poverty line is in relation to the prevailing living standards of the society and there is interdependence between the poverty line and the entire income distribution.
Social protection systems in the Baltic States 22
European poverty reduction programmes.8 It is recognised that the concept “social exclusion” is more appropriate for analysing a multitude of current societal problems like, for instance, unemployment, instability of families, shortage of welfare benefits and increasing inequality in a common framework. Social exclusion can be regarded as a property of societies (see also Gore and Figueiredo, 1997; Rodgers, et al, 1995). The causes of social exclusion result from the failure of institutions to integrate individuals but evidently these causes are not limited to institutions’ failure alone. An analysis of various considerations about the causes of social exclusion (Gaudier, 1993; Silver, 1994; Berghman, 1998) allows us to agree with Regina Berger-Schmitt and Heinz-Herbert Noll’s (2000) suggestion, that social exclusion should be conceptualised as the failure of one or more of the following four systems: (1) the democratic and legal system promoting civil integration; (2) the labour market promoting economic integration; (3) the welfare state system promoting social integration; (4) the family and community system promoting interpersonal integration.
The role of social protection systems in reducing poverty is manifold, involving various institutions that help mitigate the consequences of the failure of the above-mentioned systems and support socio-economic participation of the population in society’s life. The poverty reduction strategies as components of social protection systems promote people’s integration into society, supporting the most vulnerable groups of population and encouraging people to improve their human capital.
8 Alleviation of poverty has been an official concern of the European Commission and its member states since the mid-1970s when the first poverty programmes were adopted.
Tiiu Paas, Marit Hinnosaar, Jaan Masso, Orsolya Szirko 23
2.2. Poverty assessment
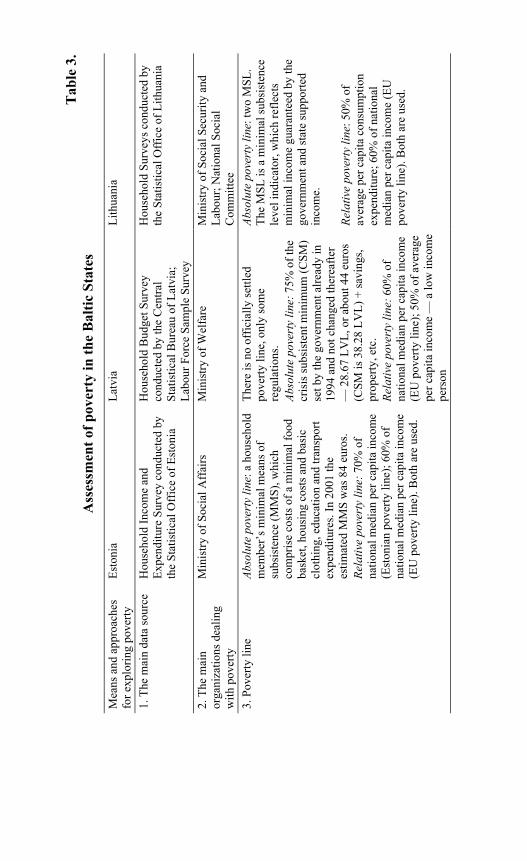
Assessment of poverty can be direct and indirect. Direct assess-ment is based on the households’ self-assessment of their own poverty situation and reflects the subjective aspects of poverty. Indirect assessment of poverty, on the other hand, is based on the use of various poverty indicators, such as absolute and relative poverty lines, poverty level, poverty gap, etc. The assessment of poverty situation forms a basis for the develop-ment of poverty reduction strategies with regard for the international requirements and indicators as well as the countries’ specific situation. Despite the fact that after regaining their independence in 1991, the Baltic States have adhered to almost similar principles in their economic and social policies, there are still some differences in how they define the absolute and relative poverty lines, assess countries’ poverty situation, and develop poverty reduction strategies. Since the late 1990s, numerous studies have been published describing the poverty situation of the Baltic Countries as a consequence of the over-a-decade-long transition processes (Keune, 1998; Kutsar and Trumm (eds), 1999; Sileika and Blaziene, 2000; Trapenciere et al, 2000; Wilder and Viies, 2001; Kuddo, et al, 2002; Lepik and Kruuda, 2003; Bite and Zagorskis 2003; Dobravolskas and Buivydas, 2003). Table 3 sums up the information about the assessment of the poverty situation in the Baltic States.
According to the EU approach to indirect assessment of a country’s poverty situation,, people are living below the poverty line if their annual per capita income after social transfers and taxes is less than 60% of the national median income. This income does not include irregular income and income from selling assets. The average share of the population living below the poverty line was around 17% in 15 EU member states in 1996 (Joint Report ….2001). The respective indicators were 17% for Estonia, 18.5% for Lithuania and 16.2% for Latvia in
Tab
le 3
. A
sses
smen
t of p
over
ty in
the
Bal
tic S
tate
s
Mea
ns a
nd a
ppro
ache
s fo
r exp
lorin
g po
verty
Es
toni
a La
tvia
Li
thua
nia
1. T
he m
ain
data
sour
ce
Hou
seho
ld In
com
e an
d Ex
pend
iture
Sur
vey
cond
ucte
d by
th
e St
atis
tical
Off
ice
of E
ston
ia
Hou
seho
ld B
udge
t Sur
vey
cond
ucte
d by
the
Cen
tral
Stat
istic
al B
urea
u of
Lat
via;
La
bour
For
ce S
ampl
e Su
rvey
Hou
seho
ld S
urve
ys c
ondu
cted
by
the
Stat
istic
al O
ffic
e of
Lith
uani
a
2. T
he m
ain
orga
niza
tions
dea
ling
with
pov
erty
Min
istry
of S
ocia
l Aff
airs
M
inis
try o
f Wel
fare
M
inis
try o
f Soc
ial S
ecur
ity a
nd
Labo
ur; N
atio
nal S
ocia
l C
omm
ittee
3.
Pov
erty
line
Ab
solu
te p
over
ty li
ne: a
hou
seho
ld
mem
ber’
s min
imal
mea
ns o
f su
bsis
tenc
e (M
MS)
, whi
ch
com
pris
e co
sts o
f a m
inim
al fo
od
bask
et, h
ousi
ng c
osts
and
bas
ic
clot
hing
, edu
catio
n an
d tra
nspo
rt ex
pend
iture
s. In
200
1 th
e es
timat
ed M
MS
was
84
euro
s. Re
lativ
e po
vert
y lin
e: 7
0% o
f na
tiona
l med
ian
per c
apita
inco
me
(Est
onia
n po
verty
line
); 60
% o
f na
tiona
l med
ian
per c
apita
inco
me
(EU
pov
erty
line
). B
oth
are
used
.
Ther
e is
no
offic
ially
settl
ed
pove
rty li
ne, o
nly
som
e re
gula
tions
. Ab
solu
te p
over
ty li
ne: 7
5% o
f the
cr
isis
subs
iste
nt m
inim
um (C
SM)
set b
y th
e go
vern
men
t alre
ady
in
1994
and
not
cha
nged
ther
eafte
r —
28.
67 L
VL,
or a
bout
44
euro
s (C
SM is
38.
28 L
VL)
+ sa
ving
s, pr
oper
ty, e
tc.
Rela
tive
pove
rty
line:
60%
of
natio
nal m
edia
n pe
r cap
ita in
com
e (E
U p
over
ty li
ne);
50%
of a
vera
ge
per c
apita
inco
me
— a
low
inco
me
pers
on
Abso
lute
pov
erty
line
: tw
o M
SL.
The
MSL
is a
min
imal
subs
iste
nce
leve
l ind
icat
or, w
hich
refle
cts
min
imal
inco
me
guar
ante
ed b
y th
e go
vern
men
t and
stat
e su
ppor
ted
inco
me.
Re
lativ
e po
vert
y lin
e: 5
0% o
f av
erag
e pe
r cap
ita c
onsu
mpt
ion
expe
nditu
re; 6
0% o
f nat
iona
l m
edia
n pe
r cap
ita in
com
e (E
U
pove
rty li
ne).
Bot
h ar
e us
ed.

Tabl
e 3.
(con
tinua
tion)
4. P
over
ty la
yers
1)
dire
ct p
over
ty (t
he in
com
es p
er
hous
ehol
d m
embe
r are
80%
or
even
less
of t
he a
bsol
ute
pove
rty
line)
; 2) e
ndan
gerin
g su
bsis
tenc
e (th
e in
com
es a
re 8
1–10
0% o
f the
po
verty
line
); 3)
pov
erty
risk
(the
in
com
es a
re 1
01–1
20%
of t
he
pove
rty li
ne)
1) th
e lo
wes
t min
imal
co
nsum
ptio
n th
resh
old:
50%
of
aver
age
cons
umpt
ion
expe
nditu
re
per a
n eq
uiva
lent
con
sum
er; 2
) se
cond
thre
shol
d: 6
0% o
f ex
pend
iture
; 3) t
he h
ighe
st
thre
shol
d: 7
0% o
f exp
endi
ture
1) p
eopl
e be
low
the
rela
tive
pove
rty li
ne; 2
) peo
ple
belo
w th
e ab
solu
te p
over
ty li
ne; 3
) peo
ple
belo
w th
e ex
trem
e po
verty
line
(a
bout
one
MSL
)
Ris
k gr
oups
Fa
mili
es w
ith 3
or m
ore
child
ren;
ho
useh
olds
with
une
mpl
oyed
fa
mily
mem
bers
; sin
gle-
pare
nt
fam
ilies
, dis
able
d pe
rson
s.
Fam
ilies
with
thre
e an
d m
ore
child
ren;
sing
le-p
aren
t fam
ilies
; ho
useh
olds
with
une
mpl
oyed
m
embe
rs; e
lder
ly p
eopl
e, fa
rmer
s an
d ru
ral r
esid
ents
.
Fam
ilies
with
3 a
nd m
ore
child
ren;
ho
useh
olds
with
une
mpl
oyed
fa
mily
mem
bers
; far
mer
s and
rura
l re
side
nts,
peop
le w
ith lo
w
educ
atio
n.
Sour
ces:
Nat
iona
l Sta
tistic
al O
ffic
es o
f the
Bal
tic S
tate
s; N
atio
nal P
over
ty R
educ
tion
Stra
tegi
es o
f the
Bal
tic S
tate
s, Po
verty
Red
uctio
n in
Est
onia
, Lat
via,
and
Lith
uani
a, R
iga:
UN
DP,
200
0; L
epik
and
Kru
uda,
200
3; B
ite a
nd Z
agor
skis
200
3; D
obra
vols
kas
and
Bui
vyda
s, 20
03; A
utho
rs’ c
ompi
latio
ns.

Social protection systems in the Baltic States 26
2001 (Household Living Niveau, 2002; Bite and Zagorskis 2003; Dobravolskas and Buivydas 2003)9.
In calculating Estonia’s absolute poverty line, the levels of a household member’s minimum means of subsistence (MMS) were taken as a starting point. The set of minimum means of subsistence consists of (1) costs of a minimal food basket; (2) housing costs; (3) spending on basic clothing, education and transport.. The settled level of minimum expenditure per household member was 1,306 EEK (about 84 euros) per month in 2001; 49% of these costs (646 EEK, or about 41 euros) cover a minimal food basket. The relative poverty line makes up 70% of the national median per capita income and was 1, 488 EEK (95 euros) in 2001. The following Estonian households are most affected by poverty: households with at least one unemployed member (62% had to cope with direct poverty in 2001); families with three or more children (45% in direct poverty) and single-parent households (37% in direct poverty). (Household living… 2002).
There is no official poverty line in Latvia (Bite and Zagorskis 2003). The crisis subsistence minimum indicator (CSM) was set by the Latvian Government in the amount of 38.23 LVL (about 59 euros) per month already in 1994 and has remained unchan-ged until now. A person is considered to be poor and entitled to social assistance if (1) their income does not exceed 75% of CSM; (2) they have no money savings exceeding 200 LVL (around 305 euros); (3) they own no property valued at 3000
9 When comparing the poverty indicators of the Baltic States with the respective EU and OECD indicators it should be borne in mind that there are some differences in using the equivalence scales for family members. According to the OECD standard equivalence scale, which is 1: 0.7: 0.5, the expenditure of the first adult household member is 1; expenditures of all other persons of 14 years of age and older – 0.7, and of children up to 14 years of age – 0.5. The equi-valence scale used by Eurostat is 1: 0.5 : 0.3. The Estonian poverty studies use the scale 1: 0.8 : 0.8, while Lithuania uses the OECD scale and Latvia the Eurostat scale.

Tiiu Paas, Marit Hinnosaar, Jaan Masso, Orsolya Szirko 27
LVL (around 4577 euros); they have no providers of food (providers are mainly relatives); (4) they have not concluded an agreement to work for food. The average crisis subsistence minimum is calculated regularly by the Central Bureau of Latvia and was 86.93 LVL (around 133 euros) in 2001 (ibid). Persons whose income does not exceed 28.67 LVL are deemed to be poor. A person whose average monthly income is less than 50% of the average disposable income per household member is considered as a low-income person. Poverty is most widespread in rural areas. Also age remains a factor that can increase a person’s risk of falling into poverty. Discrimination in the labour market on the grounds of age can be a serious obstacle for people in their forties and fifties seeking employment. A study on the relationship between ethnicity and poverty has concluded that ethnicity is not of major relevance regarding the distribution of poverty in Latvia. Other personal characteristics, such as education, and rural/urban settlement, are much more important in explaining the differences within the poverty level in Latvia (Poverty Reduction …, UNDP, Riga, 2000).
Lithuania’s absolute poverty line (a minimal subsistence level — MSL) is calculated as a sum of a family’s monthly income which guarantees a minimum subsistence for the family members, including a nutritionally adequate diet and essential non-subsistence requirements. MLS as an indicator of the poverty level was adopted already in autumn 1990 and serves as a basis for the determination of families in urgent need of social support. The absolute poverty line is two MLS. The use of MLS alleviates control over the poverty level through determination and indexing MLS; the related benefits are in accordance with the inflation rate. According to Dobravolskas and Buivydas (2003), the level of poverty counted on the basis of the MSL cannot be considered a good index for the drafting of a long-term poverty strategy in Lithuania in the conditions of very dynamic economic development. Nor is this index suitable for international comparison due to the particulars in calculation. Therefore, indices of relative poverty are more widely applied

Social protection systems in the Baltic States 28
in international comparisons of the Lithuanian poverty situa-tion. The Lithuanian Statistical Office calculates the relative poverty line, which forms an amount equivalent to 50% of average consumption expenditure. Families with three and more children, households with unemployed family members, people with low education, farmers and rural residents — these are the groups of population which are most affected by poverty in Lithuania.
Like in other post-socialist countries, the poverty situation in the Baltic States is influenced by the circumstance that poverty together with a high level of income inequality and unem-ployment are new phenomena for the societies in transition. In addition to absolute poverty, people seriously suffer from subjective poverty. Despite their income being above the relative and/or absolute poverty line, many people have a feeling that they are not able to participate in normal social life For instance, according to the Estonian households’ self-evaluation results, more than a half of the households indicated in 2001 that they were living in very poor conditions or could barely make both ends meet; 35.7% of households could generally cope and only 7.4% of households could afford every-thing needed for a normal life or consume without any restric-tions (Paas and Võrk, 2003). The self-assessment results of the Lithuanian households were similar. Half of all Lithuanian households declared in the Living Conditions Survey that they were neither rich nor poor, 36% pointed out that they lived close to poverty, whereas more than 10% admitted that they were very poor (Lithuania 1999, 2000).
A comparison of the results of the direct and indirect assessments of poverty confirms the opinion that people in the Baltic States have a rather strong feeling of social exclusion. The economic decline that the Baltic States experienced in the first half of the 1990s and the lasting hardships of the transition processes led to a decrease in social protection and posed an increased risk of poverty and social exclusion. As a result, such groups of people as pensioners, disabled, families with small children, people with low education or with the professions

Tiiu Paas, Marit Hinnosaar, Jaan Masso, Orsolya Szirko 29
which were difficult to adapt to the rapid changes in economic structure (particularly professions related to heavy industry and agriculture) faced substantially reduced levels of social guarantees. Thus, the development of poverty reduction strategies within the overall social protection system has a comprehensive target of alleviating poverty and achieving social inclusion of people in order to avert long-lasting serious consequences of social exclusion. Social inclusion is inevitably necessary for sustainable development in the conditions of unfavourable demographic situation where the share of working-age population is declining. 2.3. Poverty reduction strategies in the
Baltic States It was not before the end of the 1990s that the Baltic States started elaborating their poverty reduction strategies and developing their social protection systems in order to alleviate poverty and to support social inclusion. The development of the national poverty reduction strategies within the overall social protection system of the Baltic States is in accordance with the EU’s strategic goal of achieving greater social cohesion in the Union in the period 2001–2010 (see also Joint Report on Social Inclusion, 2001); thus over a decade which includes the years before and after the EU eastward enlargement. The main tasks of poverty reduction in the Baltic States are also set according to the requirements of the international organisations like the UNDP, World Bank, and ILO. These requirements do not depend on which social protection system a country applies.
The poverty reduction strategies of the Baltic States stress the importance of the following issues in poverty reduction: (1) promoting economic growth; (2) investing in human capital; (3) strengthening the social protection system. The poverty reduction initiatives are directed towards guaranteeing a basic coping capacity for those population groups who live below the poverty line, and avoiding and reducing the risk of poverty. A

Social protection systems in the Baltic States 30
great emphasis is laid on strengthening the labour market policies and promoting employment and income generation activities. The main targets of the national poverty reduction strategies could be summarised as follows (see also Table 4): (1) to lessen the social and economic vulnerability of the popu-lation groups living below the poverty line; (2) to reduce poverty risk factors; (3) to create opportunities for lifestyle improvement; (4) to advance and improve the use of human capital.
The main proposed measures of poverty reduction strategies, for instance, the measures of social protection systems, can be divided into two groups. The first group of measures addresses the causes of poverty and supports the development of national economies and increase in the employability of the populations (active measures, including also measures of active labour market policy). The second group of measures is aimed alleviating the social consequences of poverty, for example, implementation of an effective social protection system, which includes housing, health care, educational support and social assistance services (passive measures, including also measures of a passive labour market policy).
Latvia’s and Lithuania’s poverty reduction strategies consist of concrete tasks and deadlines for eliminating poverty and reducing the number of people with very low income. In Estonia’s strategy, the basic areas of poverty reduction are presented via the target groups. These target groups are (1) young families with children; (2) the unemployed and job-seekers, in particular long-term unemployed, (3) the individuals with low incomes (underemployed, involuntary part-time workers, underpaid qualified employees, workers with low professional qualifications); (4) individuals with special needs (people with disabilities and/or chronically ill); (5) elderly people (people over 60 years of age); (6) marginal groups: individuals insufficiently integrated into societal structures (around 50,000–70,000 persons) (National Poverty…, 2000). Since 2002 the following additional new schemes have been introduced in order to support the most vulnerable groups of the

Tiiu Paas, Marit Hinnosaar, Jaan Masso, Orsolya Szirko 31
Table 4. Poverty reduction targets in the Baltic States
Country The basic areas for poverty reduction or/and main targets
Estonia General increase in the population’s material resources. Better access to opportunities provided by the community and guaranteed participation in policies (regional policy, labour policy, social policy). Vertical redistribution of community resources (social policy, tax policy). Development of human resources (culture; education and health policies). Formation and mobilisation of public opinion (information and media policies).
Latvia The number of low-income persons must not exceed 10% of the total population by 2015. The total number of the poor and those with low income must not exceed 25% of the population by 2015.
Lithuania Eliminating extreme poverty by 2003. Anyone suffering from the shortage of food and absence of shelter at night has to be provided with these prerequisite means (to support people below the absolute poverty line, i.e. on the basis of the MSL). Reduction of poverty determined on the basis of the relative poverty line by not less than 13% by 2005. To reduce by 2005 by not less than 20% the poverty of the poorest social groups (single parents with children, large families, jobless, farmers) determined on the basis of the relative poverty line.
Sources: National Poverty Reduction Strategies of the Baltic States; Poverty Reduction in Estonia, Latvia, and Lithuania, UNDP, Riga, 2000

Social protection systems in the Baltic States 32
Estonian population: (1) new schemes for social benefits: (a) family benefits are more targeted to groups with higher poverty risk, i.e. families with small children and large families; (b) social benefits for disabled people are directed to compensate for disability-related costs; (2) the new scheme of unemploy-ment insurance — long-term unemployed are brought into the focus of employment offices, making them eligible for labour market services; (3) the new concept of emergency of social assistance — local municipalities are made responsible for guaranteeing everyone at least food, clothes and shelter.
The implementation of poverty reduction programmes requires systematic collaboration of different institutions and involve-ment of various community levels: public sector (national and local government bodies and their structures), private sector (profit-seeking structures such as insurance companies, private care, training and employment agencies, real estate agents) and third sector (non-governmental, non-profit organisations seeking to reduce poverty, and other community groups , e.g. churches, private charities). 3. Pension Systems 3.1. Overview of the pension systems of the
Baltic States Becoming independent in 1991, Estonia, Latvia and Lithuania inherited an unsatisfactory pension system from the Soviet Union. The system was the same in all the three countries: retirement ages were set at rather low levels, 55 for women and 60 for men. Special allowances for selected occupations further reduced the average effective retirement age. Economists have argued that the main effect of this generous system was to inflate artificially the dependency burden on the working popu-lation (Fox 1997). Had the pension system not been reformed, this burden would have increased further, because the

Tiiu Paas, Marit Hinnosaar, Jaan Masso, Orsolya Szirko 33
population in the Baltic States, like in most industrialised countries, is ageing due to a decreasing fertility rate and increa-sing life expectancy. The age structure of the population in the Baltic States and in the European Union shown in Table 5 indicates a slightly better situation in the Baltic States. However, although the share of old-age population in the Baltic States is below the EU average, the situation may become worse in the future due to a high share of the population in the 40–64 age bracket (Reiljan and Kulu 2003). Reiljan and Kulu (2003) also argue that in the case of Estonia (and we may generalise that to all three Baltic States) the reason for refor-ming the pension system was not only ageing of the population but the decrease in the employment levels during the transition processes — the annual employment growth rate in 1990–1994 was respectively –4.3, –6.4 and –2.5 % for Estonia, Latvia and Lithuania (Cazes and Nesporova 2001).
Table 5. Age structure of the Baltic States’ population in 2001
(% of population)
Region
0–14 years old
15–64 years old
64 years and over
Youth dependency ratio
Old-age depen-dency ratio
Depen-dency ratio
Latvia 17.0 67.6 15.4 25% 23% 48% Estonia 17.6 67.2 15.3 26% 23% 49% Lithuania 19.3 66.6 14.1 29% 21% 50% European Union
average 17.1 66.8 16.1 26% 24% 50%
Source: UNECE (2002); authors’ calculations Note. The youth dependency ratio is the ratio of people aged under 15 to the population in the working age range; old-age dependency ratio is the ratio of people aged 64+ to the population in the working age range; the dependency ratio is the sum of the two. The European Union average was calculated without Ireland where the data was erroneous.

Social protection systems in the Baltic States 34
The increasing number of pensioners in the context of decrea-sing employment made it necessary to reform the pension sys-tems. Based on an analysis of the pension systems in industria-lised countries, the World Bank (1994, cited via Fox, 1997) recommended a combination of pay-as-you-go and funded pen-sion systems. Achieving such an arrangement involves setting up a multi-pillar system that includes the following elements:
• Pillar 1 — a mandatory pay-as-you-go public pension system designed to provide an income floor for all elderly persons;
• Pillar 2 — a mandatory funded and privately managed pension system — one whose current reserves are equal to or greater than the present value of all future pension payment liabilities, based on personal accounts (the Latin American approach) or occupational plans (the OECD approach);
• Pillar 3 — a voluntary system (also funded and privately managed), with strong government regulation, to provide for additional savings and insurance.
The main difference between the Latin American and the OECD approach is that the former is based on individual choi-ces, so workers themselves choose their investment manager, while the latter is based on employers’ or union’ choices in appointing the investment manager for a group. The Latin American approach may have higher administrative and marke-ting costs and workers may be uninformed, but the OECD approach might have the principal-agent problem if employers do not act in their workers’ interest.
The Baltic States’ pension systems are not similar to the pension schemes of the other European countries. All the three Baltic States decided to adopt the three-pillar pension system and chose the Latin American approach. This was first done in Latvia, and followed by Estonia and Lithuania. A short description of the pillars is given in Table 6 together with the starting dates.

Tiiu Paas, Marit Hinnosaar, Jaan Masso, Orsolya Szirko 35
Table 6.
Three-pillar old-age pension systems and starting dates in the Baltic States
1st pillar 2nd pillar 3rd pillar Latvia National defined
contribution pay-as-you-go (NDC PAYG)
pension scheme, launched in
January 1, 1996
The state mandatory
funded pension scheme, launched
in July 1, 2001
Privately-managed
voluntary funded schemes,
launched in July 1, 1998
Estonia State-managed pay-as-you-go
(PAYG) pension scheme, launched in April 1, 2000
Privately-managed
mandatory funded pension
scheme, launched in July 1, 2002
Privately-managed
voluntary funded schemes,
launched in August 1, 1998
Lithuania State-managed pay-as-you-go
(PAYG) pension scheme, launched in April 1, 2000
The state mandatory
funded pension scheme, launched
in January 1, 2004
Privately-managed
voluntary funded schemes,
launched in January 1, 2000
Note. The table was compiled using the following sources: Fox (1997); Koivu (2002); Vanovska (2002); The Report on the Lithuanian… (2004). In addition to the new pension systems, also the retirement age was raised — in Latvia to 62 and in Estonia to 63 years of age for both men and women, in Lithuania to 60 for women and 62,6 for men. In all the three countries the pensionable age is raised gradually by 2–6 months a year and will reach the new levels in several years’ time. By comparison, in most EU count-ries the retirement age was 65 years in the mid-90s (in a few countries 60 years for females; Boldrin et al. 1999). By now the retirement age has also been raised in a number of EU countries. Although a further increase in the retirement age is suggested for Estonia, according to Reiljan and Kulu (2003)

Social protection systems in the Baltic States 36
that may increase joblessness among the elderly due to their poor competitive position in the labour market, which would increase the expenditures on the labour market policies.
The tables in Appendix (Table A 6, Table A 7 and Table A 8) provide some more detailed information about the 3-pillar pension schemes of the Baltic States. In the 1st pillar, all the three countries have introduced some earnings-related compo-nents. The pensions of the 1st pillar are financed with taxes on labour income. In all the three countries early retirement is made possible10. The 2nd pillar is mandatory for younger and voluntary for older employees, the funds in the latter are managed by private assets managers and the placement of contributed pension savings is decided by individuals. All the three countries have provided significant tax incentives for the 3rd pillar to motivate people to join it. However, Raudla and Staehr (2004, p.1) argue for Estonia that the “new pension system implies a substantial lowering of taxes, implemented in a non-transparent way and with unclear distributional cones-quences, while possibly doing little to solve the solvency prob-lems of the pension system ”.
Due to reforms in the field of old-age pension systems, also disability and survivor’s pensions were revised. A review of the disability and survivor’s pensions in the Baltic States is given in Table A 9 and Table A 10 in Appendix. To qualify for a disabi-lity pension, a person must have a minimum social insurance record that differs between the three countries, as can be seen from the table. Benefit systems are also different in details but depend in all the three countries on the loss of capacity to work. In all the Baltic States, qualifying for the survivor’s pension depends on the situation of the deceased — if he/she was a pensioner or had the necessary insurance record. The rate of
10 The only paper we know analysing the effect of early retirement schemes in the Baltic States, Võrk and Uudeküll (2004), finds that in Estonia early retirement has not decreased labour supply; instead, it has offered an alternative income to people experiencing long-term joblessness.
Tiiu Paas, Marit Hinnosaar, Jaan Masso, Orsolya Szirko 37
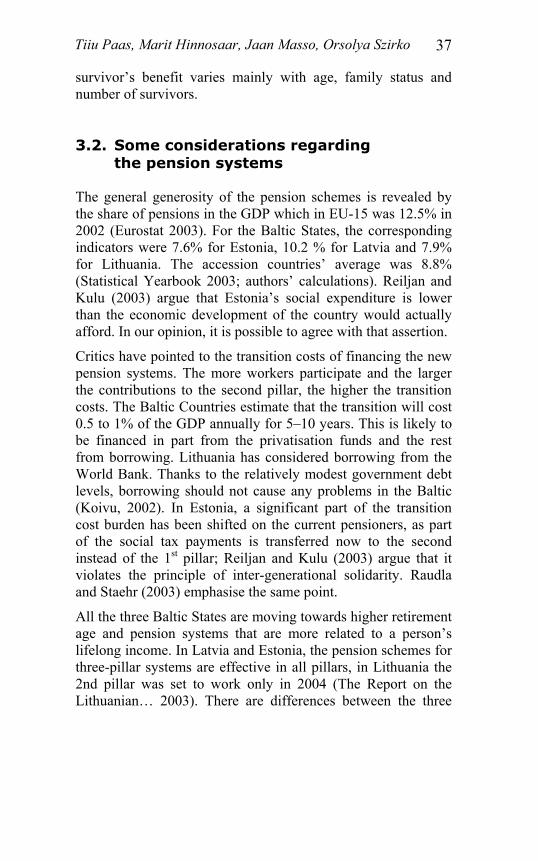
survivor’s benefit varies mainly with age, family status and number of survivors. 3.2. Some considerations regarding
the pension systems The general generosity of the pension schemes is revealed by the share of pensions in the GDP which in EU-15 was 12.5% in 2002 (Eurostat 2003). For the Baltic States, the corresponding indicators were 7.6% for Estonia, 10.2 % for Latvia and 7.9% for Lithuania. The accession countries’ average was 8.8% (Statistical Yearbook 2003; authors’ calculations). Reiljan and Kulu (2003) argue that Estonia’s social expenditure is lower than the economic development of the country would actually afford. In our opinion, it is possible to agree with that assertion.
Critics have pointed to the transition costs of financing the new pension systems. The more workers participate and the larger the contributions to the second pillar, the higher the transition costs. The Baltic Countries estimate that the transition will cost 0.5 to 1% of the GDP annually for 5–10 years. This is likely to be financed in part from the privatisation funds and the rest from borrowing. Lithuania has considered borrowing from the World Bank. Thanks to the relatively modest government debt levels, borrowing should not cause any problems in the Baltic (Koivu, 2002). In Estonia, a significant part of the transition cost burden has been shifted on the current pensioners, as part of the social tax payments is transferred now to the second instead of the 1st pillar; Reiljan and Kulu (2003) argue that it violates the principle of inter-generational solidarity. Raudla and Staehr (2003) emphasise the same point.
All the three Baltic States are moving towards higher retirement age and pension systems that are more related to a person’s lifelong income. In Latvia and Estonia, the pension schemes for three-pillar systems are effective in all pillars, in Lithuania the 2nd pillar was set to work only in 2004 (The Report on the Lithuanian… 2003). There are differences between the three

Social protection systems in the Baltic States 38
countries in all the three pillars of the old-age pension system and also smaller differences in disability and survivor’s pension systems. Even though the Baltic States are situated close to one another and have similar history, we cannot say that they have the same pension schemes. The differences are just as large as between the member states of the European Union (see e.g. Boldrin et al. 1999).
Now that Estonia, Latvia and Lithuania have joined the European Union, the law that residents of one member state working in another can get a pension from both of them will apply to them too. The pension systems as well as retirement ages in the member states of the European Union differ. If a person works or lives in several countries and pays social taxes in more than one country during his lifetime, then his old-age pension will be calculated on the basis of the amount of social tax paid and the years worked in the concrete country. Hence one can receive pensions from many different countries according to the legislations that are in force in these countries. There is the same rule for retirement, disability and survivor’s pensions in the European Union: if a person receives a pension in one of the EU countries, he/she has the right to receive a pension in another member state if he/she lives there (The European Union On-Line… 2002). European Union memberhip expands the opportunities of getting fair pensions for all the citizens the member states, but as Leppik (2001) notes, social security coordination also adds some financial constraints on the pension schemes.
The Baltic States do not exactly belong to any of the previously described four social protection models. But there are similari-ties with some of the models. The 1st pillar with mainly flat-rate pension refers to the Scandinavian model, the 2nd pillar that is provided to be much bigger than the first one refers to the Central European model due to its earnings-related contents, the 3rd pillar is similar to the second one, because people’s savings to voluntary funds are also principally connected with earnings. On the whole, it can be said that in the field of pension systems

Tiiu Paas, Marit Hinnosaar, Jaan Masso, Orsolya Szirko 39
the Baltic States are mostly moving towards the Central European model. 4. Social and Unemployment
Assistance 4.1. Unemployment assistance and insurance In the Soviet economy, unemployment did not exist officially; in fact the Soviet Constitution stipulated that everybody had both the right and obligation to work; consequently there was no support system for the unemployed11. With the emergence of the unemployment problem unemployment benefits were intro-duced in all the three countries in 1991, and reformed in the second half of the 1990s (Latvia 1997, Lithuania 1996, Esto-nia12 2002) with the introduction of unemployment insurance. In our opinion, these recent developments call for thorough studies on their labour market impacts, especially in the case of Estonia we have a unique natural experiment by which pro-tection against unemployment is extended remarkably.
Holmlund (1998) provides an overview of the various impacts of unemployment insurance in theoretical and empirical eco-nomics. The possible impacts (and corresponding areas of research) include the impact on the job-search behaviour of the unemployed, the impact on equilibrium unemployment, the impact on wage setting by the unions, the impact on unem-ployment persistence and the unemployment insurance from the point of welfare economics.
11 Among the former communist economies, only Hungary and Slovenia had a system of income support for the unemployed before the economic transition (Eamets 2001). 12 In Estonia the first payments were made in 2003 because of the minimum insurance record requirement.

Social protection systems in the Baltic States 40
It is somewhat difficult to classify the first benefits system as Unemployment Insurance (UI) or Unemployment Assistance (UA)13, because while a general feature of UA is means-testing, in the Baltic Countries the first unemployment benefits were not means-tested. However, the rates of the benefits were so low that guaranteeing some minimum resources seems to have been a much more realistic goal than income smoothing. Based on this consideration, the benefits introduced in 1991 were labelled UA. It is interesting to note that while Lithuania and Latvia replaced unemployment assistance with insurance, in Estonia both systems continue to exist in parallel. This is probably the reason, too, why Latvia and Lithuania make numerous exceptions14 to the otherwise strict eligibility condi-tion of the required insurance record. These exceptions together with a minimum level of benefits can be viewed as solidarity components of the insurance system.
In Estonia, the minimum contribution record requirement for unemployment insurance is strictly enforced, and the unem-ployed who fail to fulfil this criterion may apply for unem-ployment assistance. Eligibility for assistance requires a record of employment as well, however, there are many exceptions15, much like in the case of Latvian and Lithuanian UI. Like in all 13 Traditionally payments of UI benefits are intended to smooth income by replacing a portion of the eligible worker’s lost wages, while payments of UA benefits are intended to eliminate or reduce poverty among low-income families where unemployment occurs. While both make payments occasioned by unemployment, UI goes to persons as a matter of right, while UA is paid only to families with unemployment whose income and assets fall below designated thresholds (Vroman 2001), i.e. UA is means-tested as a rule. The rate of UA is generally flat and varies only with family size, but in Germany and Austria it depends on previous earnings. 14 For instance, women with pre-school children, persons released from penitentiary; for a full list see Law on Support of the Unem-ployed, Chapter IV for Lithuania, and Social Report (Riga 1998, p. 50) for Latvia. 15 See Social Protection of the Unemployed Act (RT1 I 2000, 57, 371) for a full list.

Tiiu Paas, Marit Hinnosaar, Jaan Masso, Orsolya Szirko 41
EU member states, active job search is one of the eligibility conditions for benefits in all the three Baltic Countries. This includes registration as an unemployed at the local labour office and active search for employment, which means visits to the labour office at least every 30 days in Estonia and Latvia and on appointment in Lithuania. The payment of benefits may be terminated if the person refuses a suitable job offer.
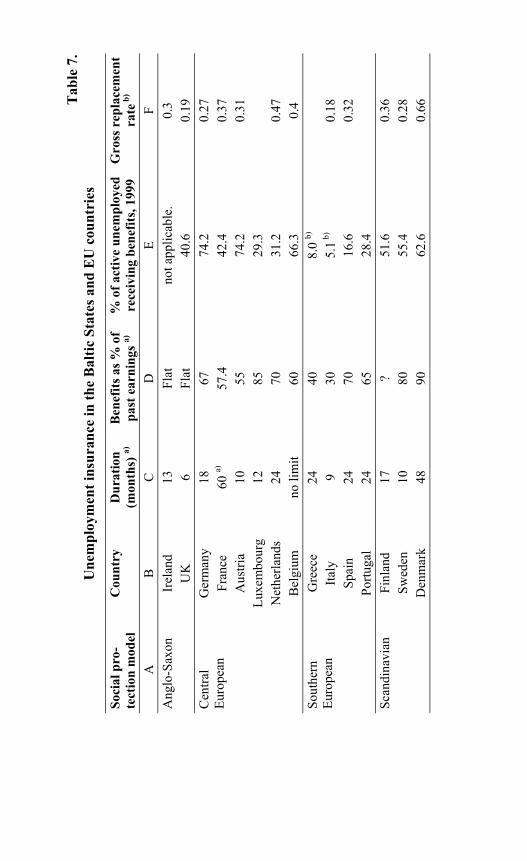
Unemployment insurance systems in the EU countries vary greatly in detail, which makes it hard to summarise them in a comparative manner. In the table below benefit durations and legal gross replacement rates at the beginning of benefit payment are listed (respectively columns C and D). The information on EU member states was drawn from the Mutual Information System on Social Protection in the EU and EEA (MISSOC). The data on the Baltic States were drawn from Annex 1.3, outlining in greater detail the UI and UA systems of the Baltic States.
The duration of UI benefits may vary in the member states either by employment record, insurance record, age, sex, worker’s category, level of previous earnings, stage of the business cycle or length of the unemployment spell. From the table below, it can be seen that the duration varies between 6 and 60 months, putting the Baltic countries into the less gene-rous group. The EU members are grouped by type of the social protection model, but there are considerable differences even within these groups.
Tab
le 7
. U
nem
ploy
men
t ins
uran
ce in
the
Bal
tic S
tate
s and
EU
cou
ntri
es
Soci
al p
ro-
tect
ion
mod
elC
ount
ry
Dur
atio
n (m
onth
s) a)
B
enef
its a
s % o
f pa
st e
arni
ngs a)
%
of a
ctiv
e un
empl
oyed
re
ceiv
ing
bene
fits,
1999
G
ross
rep
lace
men
t ra
te b
) A
B
C
D
E
F Ir
elan
d
13
Flat
no
t app
licab
le.
0.3
Ang
lo-S
axon
U
K
6 Fl
at
40.6
0.
19
Ger
man
y
18
67
74.2
0.
27
Fran
ce
60 a)
57
.4
42.4
0.
37
Aus
tria
10
55
74
.2
0.31
Lu
xem
bour
g
12
85
29.3
Net
herla
nds
24
70
31.2
0.
47
Cen
tral
Euro
pean
Bel
gium
no
lim
it 60
66
.3
0.4
Gre
ece
24
40
8.
0 b)
Italy
9
30
5.1 b
) 0.
18
Spai
n
24
70
16.6
0.
32
Sout
hern
Eu
rope
an
Portu
gal
24
65
28.4
Finl
and
17
?
51.6
0.
36
Swed
en
10
80
55.4
0.
28
Scan
dina
vian
Den
mar
k
48
90
62.6
0.
66

Tabl
e 7
(con
tinua
tion)
Soci
al p
ro-
tect
ion
mod
elC
ount
ry
Dur
atio
n (m
onth
s) a)
B
enef
its a
s % o
f pa
st e
arni
ngs a)
%
of a
ctiv
e un
empl
oyed
re
ceiv
ing
bene
fits,
1999
G
ross
rep
lace
men
t ra
te b
) Es
toni
a (U
I/UA
) 12
/ 9
50 /
flat
– /2
7.7
– / 0
.028
e)
Latv
ia
9 65
24
.5
0.07
9 e)
B
altic
Lith
uani
a 6
not a
pplic
able
11
.6
0.05
4 e)
Sour
ces.
The
unem
ploy
men
t dur
atio
n an
d be
nefit
s as a
per
cent
age
of p
ast e
arni
ngs:
MIS
SOC
, Ann
ex 1
.3; f
or th
e nu
mbe
r of u
nem
ploy
ed
rece
ivin
g be
nefit
s: G
. Sta
ndin
g, 2
000;
Joi
nt A
sses
smen
t Em
ploy
men
t Pol
icy
Prio
ritie
s in
Lith
uani
a, L
atvi
a, a
nd E
ston
ia; f
or th
e gr
oss
repl
acem
ent r
ates
: Sta
ndin
g (2
000)
; ILO
Lab
orst
a; S
tatis
tical
Off
ices
of E
ston
ia a
nd L
ithua
nia;
Soc
ial R
epor
ts.
a)
The
calc
ulat
ions
are
mad
e fo
r the
cas
e of
an
unem
ploy
ed p
erso
n w
ith th
e fo
llow
ing
spec
ific
char
acte
ristic
s: 4
5 ye
ars
old
mar
ried
mal
e w
orke
r with
two
kids
, who
star
ted
his w
orki
ng c
aree
r at t
he a
ge o
f 25
and
has w
orke
d si
nce
that
tim
e w
ithou
t int
erru
ptio
n.
b)
The
gros
s re
plac
emen
t rat
e es
timat
es fr
om S
tand
ing
(200
0) a
re c
alcu
late
d as
the
ratio
of p
aym
ents
of u
nem
ploy
men
t in
sura
nce
bene
fits
to th
e nu
mbe
r of t
he u
nem
ploy
ed, w
ith re
spec
t to
the
aver
age
gros
s pa
y of
all
prod
uctio
n w
orke
rs.
For t
he B
altic
Cou
ntrie
s, th
e re
plac
emen
t rat
e w
as fo
und
as th
e ra
tio o
f the
tota
l ann
ual e
xpen
ditu
re o
n un
empl
oym
ent
bene
fits t
o th
e an
nual
ave
rage
num
ber o
f une
mpl
oyed
and
the
aver
age
gros
s wag
e in
the
econ
omy.
c)
M
axim
um d
urat
ion
d)
1998
e)
A
vera
ges o
f 199
9–20
01
Social protection systems in the Baltic States 44
The benefit rates also vary with different factors — past ear-nings, employment record, age and presence of children. In the Estonian and Latvian unemployment insurance system, benefits are set as a percentage of previous earnings and decrease with the duration of the unemployment spell. In Latvia the percentage additionally depends on the length of the employ-ment record. Lithuanian insurance benefits are not related to previous earnings, but only to the employment record, maximum benefits are received with over 25 years of previous employment.
In order to compare benefit coverage, annual average per-centages of active (ILO) unemployed receiving unemployment benefits was listed in column E of the table above. It can be seen that in the Baltic countries only a relatively small share of the unemployed actually receives benefits, similarly to the Southern European countries. In 1999 only about a quarter of the unemployed received assistance benefits in Estonia and insurance benefits in Latvia, in Lithuania this ratio was as low as 11%. In all the three countries a relatively large share of the ILO unemployed were not registered: in Estonia, Latvia and Lithuania 52%, 37% and 24%, respectively (Joint Assess-ment..., Tallinn 2001, Joint Assessment..., Riga 2001, Joint Assessment ..., Vilnius 2002).
The last column of Table 7 contains OECD estimates of gross replacement rates of unemployment benefits in the EU in 1997 from Standing (2000, p. 34) and the corresponding indicators for the Baltic countries for 1999–2001. This indicator summa-rises the effect of the coverage, duration and rate of benefits. In the Baltic countries, income distribution is relatively unequal, the average wage is relatively far from what unemployed wor-kers are expected to earn on average. Comparing the indicators of the three Baltic countries, Estonia has the least generous system, because of the extremely low rate of UA benefits. This situation will change significantly with the introduction of unemployment insurance. Latvia’s indicators are higher than Lithuania’s because of the longer maximum duration and also the higher average benefit to average wage ratio.
Tiiu Paas, Marit Hinnosaar, Jaan Masso, Orsolya Szirko 45
4.2. Social Assistance The primary aim of social assistance is to protect the most vul-nerable persons in the society from poverty and social exclusion through a range of benefits in cash or kind, financed from government revenues. In the following, we compare some indicators of social assistance in the Baltic States with the EU member states and review studies about the effectiveness of social assistance (SA) in reducing poverty.
Although the SA systems in the EU member states differ greatly in detail, they are less heterogeneous in main principles than the UI systems. Their important common features are the unlimited duration of the benefits (except in France, Spain, Portugal, Italy) and means-testing. Generally, all the income of the household is taken into account in the means test, and in many cases also the assets. The minimum amounts are either determined by the government and local authorities or tied to the unemployment benefit rate, minimum wage or minimum pension. The individual benefits always depend on family composition. (MISSOC, 2002).
Currently, all the Baltic countries have a system of social assistance benefits consisting of various transfers among which the most important one is designed to guarantee minimum income16. The systems in the three countries differ by the degree of centralisation and the role of municipalities in the decision process. The payment and judgement about eligibility are decentralised in all the three countries; cash benefits are financed from municipal budgets. But while Estonia and Lithuania rely on concrete rules for eligibility and calculation of the amounts payable, Latvian local authorities have more dis-cretion over the criteria for entitlement and benefit level (Social Report, Riga 2001).
16 Estonia and Latvia — poor family social assistance benefit’s; Lithuania — social assistance benefits for low-income households.

Social protection systems in the Baltic States 46
There are also considerable differences in the duration of social assistance benefits. In Estonia, the duration is unlimited, like in most EU countries. However, the duration of the current Latvian poor family social assistance benefit is limited to three (six) months if the family has (does not have) members able to work and the average amount granted has been decreasing and the expenditure on different additional benefits is rising (Social Report 2001). Also, in Lithuania social assistance benefits are payable for only six months (sometimes can be extended), so for an unemployed it is possible to receive unemployment insurance payments and social assistance only for a combined period of twelve months (Joint Assessment ..., Vilnius 2001).
Columns C-E of the table below show guaranteed amounts for three different household types as a percentage of the broadly accepted poverty line — 60% of median income (as of 1 Jan. 1999) as a basis for comparing the generosity and effectiveness of social assistance in EU members and the Baltic countries. These amounts include family benefits and housing subsidy if there exists a separate benefit (except in the case of Finland and Denmark, whose average amounts were unavailable). In Italy and Austria benefits vary by region, so minimum and maximum levels are included. In Finland the benefit level depends on the type of the region (I or II). The countries are grouped according to the suggested Models of Social Protection, however there is considerable variation within these groups, which makes it hard to draw strong conclusions.
As the aim of social assistance transfers is to reduce poverty, one approach for measuring the effectiveness of social assistance is to estimate how much of the poverty risk they eliminate. Poverty risk is the share of the population living under the poverty line. Columns F-G in the table below show poverty risk before and after social benefits in EU member states and the Baltic States (for 1999, EUROSTAT 2003b). For Estonia two measures for 2000 were only available, one by EUROSTAT and the other in brackets by Kuddo et al. (2002).

Tab
le 8
. R
elat
ive
leve
ls o
f soc
ial a
ssis
tanc
e an
d ef
fect
on
the
risk
of p
over
ty, 1
999
Soci
al a
ssis
tanc
e as
a %
of p
over
ty li
ne
(60%
of m
edia
n in
com
e)
Ris
k of
pov
erty
So
cial
pro
tect
ion
mod
elC
ount
ry
Sing
le
Cou
ple
with
2
child
ren
Sing
le p
aren
t w
ith 2
chi
ldre
n B
efor
e so
cial
tra
nsfe
rs (%
) A
fter s
ocia
l tra
nsfe
rs (%
) A
B
C
D
E
F G
Ir
elan
d 81
%
175%
13
2%
30
18
Ang
lo-S
axon
U
K
85%
17
4%
139%
30
19
G
erm
any
83%
20
6%
180%
21
11
Fr
ance
64
%
140%
10
0%
24
15
Aus
tria
(min
) 49
%
121%
95
%
Aus
tria
(max
) 64
%
161%
12
5%
23
12
Luxe
mbo
urg
86%
18
5%
139%
24
13
N
ethe
rland
s 74
%
161%
11
7%
21
11
Cen
tral E
urop
ean
Bel
gium
75
%
143%
13
8%
25
13

Tabl
e 8
(con
tinua
tion)
So
cial
ass
ista
nce
as a
% o
f pov
erty
line
(6
0% o
f med
ian
inco
me)
R
isk
of p
over
ty
Soci
al p
rote
ctio
n m
odel
Cou
ntry
Si
ngle
C
oupl
e w
ith 2
ch
ildre
n Si
ngle
par
ent
with
2 c
hild
ren
Bef
ore
soci
al
trans
fers
(%)
Afte
r soc
ial
trans
fers
(%)
Gre
ece
no g
ener
al sc
hem
e 22
21
Ita
ly (m
in)
56%
13
1%
106%
It
aly
(max
) 65
%
206%
16
8%
21
18
Spai
n 55
%
73%
55
%
23
19
Sout
hern
Eur
opea
n
Portu
gal
49%
14
6%
73%
27
21
Fi
nlan
d (I
) 57
%*
172%
* 13
2%*
Finl
and
(II)
54
%*
165%
* 12
7%*
21
11
Swed
en
47%
13
3%
101%
28
9
Scan
dina
vian
Den
mar
k 10
8%*
305%
* 16
1%*
24
11
Esto
nia
48%
19
6%
158%
26
(18.
4)
18 (1
5.5)
La
tvia
no
gen
eral
sche
me
22
16
Bal
tic
Lith
uani
a 63
%
215%
14
0%*
22
17
Sour
ces:
The
Soc
ial S
ituat
ion.
.. (2
002)
; Eur
osta
t (20
03b)
; MIS
SOC
200
2; K
uddo
et a
l (20
02);
Join
t Ass
essm
ent .
.. (2
002)
; Lith
uani
an
Hum
an D
evel
opm
ent R
epor
t 200
1
* H
ousi
ng c
osts
mus
t be
adde
d
Tiiu Paas, Marit Hinnosaar, Jaan Masso, Orsolya Szirko 49
It can be seen from the table above that the social assistance systems in the Southern European countries are the least effective followed by the Baltic Countries.
Evidence from previous studies is that in Latvia and Estonia one reason for the relative ineffectiveness is the poor targeting of social assistance benefits. For Latvia, Milanovic (2000) concludes that the probability that a poor person receives local social assistance is equal to 2% compared to a non-poor’s probability of 1.4%, in terms of money amounts 76.7% is “leakage”; a possible cause being inappropriate implementation of means-testing by some local governments. A reform of social assistance is set by the Concept Paper of Provision of Guaran-teed Minimum Income (approved by government in 2000) by which several types of benefits paid currently will be substi-tuted by a single means-tested benefit in the sum of 21 Lats (37.3 euro) per family member minus the income of the family (Social Report 2001).
For Estonia Kuddo et al (2002) in a comprehensive study of the effects of social assistance systems on the labour market found that poor families receive 32.5% of social assistance, while non-poor families receive 67.5%, caused at least partly by the insufficient means-testing procedure, which only considers the household’s income of the previous month. Another problem found was that for certain types of families the benefit system considerably reduces work incentives even for higher than minimum wages. In a recent study, Hinnosaar (2004) investi-gated the effect of social assistance and unemployment benefits on the duration of unemployment, using data on unemployment assistance. Her findings indicate that even very modest unemployment benefits affect the search intensity of the unem-ployed, and thus prolong unemployment spells.
In Lithuania, the rates of social assistance benefits are low rela-tive to net earnings when in employment. There are, however, some instances where people on social assistance could face disincentives to moving into employment. A person with one adult and two child dependants receiving the maximum level of

Social protection systems in the Baltic States 50
social assistance, for example, would have an income equiva-lent of over 70% of the net income he would receive if earning an average wage. There is concern that inadequate means-testing under social assistance means that those individuals can receive assistance in cash and make use of privileges irrespec-tive of other income and property they have at their disposal; at the same time, long-term unemployed with real needs may be excluded because of the duration limit on receipt of assistance (Joint assessment ...., Vilnius 2002).
In conclusion, after regaining independence, all the three Baltic Countries have started building up their social protection systems by introducing unemployment insurance systems and social assistance benefits. However, the social protection thus provided is limited (the share of the unemployed receiving insurance benefits is rather low in Latvia and Lithuania and the average replacement rates of the benefits are low in all the Baltic States compared to the EU countries) and perhaps even inadequate to support the social cohesion of the society. There-fore, more attention should be paid to developing active measures of the social protection system. 5. The Role of Labour Market
Policies and Institutions for Social Protection
5.1. Active labour market policies In this part we will analyse the labour market policy, in terms of measures directed towards the unemployed (to bring them back to employment) and regulations of labour relations (dismissal of employees, wage agreements and low-wage regulations). The importance of the policies is underscored by the fact that after the large structural reforms in the Baltic States and the resulting loss in the value of many people’s human capital, the measures

Tiiu Paas, Marit Hinnosaar, Jaan Masso, Orsolya Szirko 51
targeted towards training of the unemployed might be the only possibility to bring them back to employment. The active labour market policies as a part of the social protection system could in principle support the preservation and development of human capital, i.e. they may increase labour supply by helping indi-viduals to keep in contact with the world of work and thereby maintaining their motivation and skills (Eamets 2001). Yet the evidence of the western countries often stresses the ineffecti-veness of active labour market policies, i.e. subsidies to employment have large dead weight and displacement effects and hence small net employment gains (Calmfors 1994). Leetma and Võrk (2003) argue that active labour policy mea-sures could be more effective in the transition countries because the rapid changes have caused a large mismatch between the supply and demand of labour, both in skills and location. They also showed for Estonia that so far the active labour market measures have indeed helped the unemployed people to find jobs (Leetmaa and Võrk 2003).
In comparison with the EU countries, active labour market policy measures are less funded in the Baltic States. For example, in 2001 the expenditures on the active labour market measures accounted for 0.06% of the GDP in Estonia, 0.16% in Latvia and 0.12% in Lithuania. This is a very small fraction compared to the respective average rate of 1.12% in the EU (Paas et al. 2003). The modest expenditure on the active labour market measures in the Baltic States may in the long perspec-tive lead to exclusion of some proportion of the unemployed from the labour force.
The small amount of resources spent on active labour market measures becomes evident if we look at the share of the unem-ployed who have access to the active labour market measures. The participation of the unemployed in the programmes provi-ded as active labour market policy measures is very low. There are minor differences among the Baltic States: in 2001, for instance, the involvement of registered unemployed in the active labour market measures was highest in Estonia — 8%, followed by 4% in Latvia and 3% in Lithuania. It should be

Social protection systems in the Baltic States 52
noted that registered unemployment accounts for only about a half of the ILO unemployment in the Baltic States17.
Even worse, it is argued that even these few labour market programmes are not appropriately targeted (Leetmaa and Võrk 2003). The groups involved might not necessarily be those to which greatest priority should be given. Apparently, there is not much analysis done on the effects of these programmes, but there is a need for this kind of analysis, which would serve as a basis for developing well-targeted and successful programmes.
There are some differences in the implementation of active labour market programmes in the Baltic States (see Table A5). Training absorbs the biggest share of funds in all three countries and in terms of participation, training is also the most important active labour market measure in Estonia. Additionally, in Latvia and Lithuania, there exist job clubs (organisations whose aim is to stimulate the initiative of unemployed and teach them job search techniques), which have rather high participation rates. In Latvia and Lithuania, public works also receive a significant proportion of the budget. In Estonia the additional measures are public works, subsidised employment and subsidies to start a business. 5.2. Regulation of dismissals Strict labour market regulations in Europe are generally accused of leading to higher long-term unemployment, youth unemploy-ment and decreasing the adjustment of labour markets to economic shocks (Bentolila and Bertola, 1990; Nickell, 1997). In case of strict dismissal regulations, it is costly for the
17 One reason might be the rather low level of unemployment bene-fits and public employment services that does not motivate people to register themselves as unemployed. On the other hand, the survey-based unemployment measure (the ILO definition) could be too high as people may indicate that they are looking for a job without making any efforts to find one.

Tiiu Paas, Marit Hinnosaar, Jaan Masso, Orsolya Szirko 53
employer to fire workers if the economy and enterprise are not doing well, which leads to less hiring during economic boom periods, as the optimal amount of labour hired is smaller due to the costs of firing. There are different views on the effect of dismissals protection on human capital. On the one hand, the idea of dismissal regulations should be to increase workers’ welfare by giving some warranty and stability about the employment. More stable employment relationships might increase investments in (job-specific) human capital, increase loyalty to firms (Akerloff, 1984), and thereby support the increase of productivity (Ichionowski et al, 1997). The negative effect on human capital could occur through that it may disad-vantage workers who fail to gain access to short-term jobs, increase the chance of long-term unemployment, and thereby worsening the problems of labour market inequality and social exclusion. Because of the reduction in the overall hiring the strict regulation of dismissals may lock the protected workers in poor job-matches (OECD 1999), so possible adverse conesquences are emphasised in the literature.
The Baltic regulations on the termination of labour contract are generally thought to be much stricter than those of the EU countries. The notification period in case of dismissals is 2–4 months in Estonia, 2 months in Lithuania and 1 month in Latvia18. The minimal notification periods in the EU countries start from one week, while the maximum periods might be up to 6–7 months (depending on the number of years worked). The compensation for contract termination varies from 1 to 4 monthly wages in Latvia, from 2 to 4 monthly wages in Estonia and from 1 to 12 monthly wages in Lithuania. The compen-sation is lower than in the Southern European countries, yet rather high, especially in Lithuania, compared to most EU countries. Especially if we take into account that in many EU 18 For details see The Republic of Latvia Labour Law [http://www.ttc.lv/en/default-translations-lr.htm]; Republic of Lithuania Law on the Employment Contract [http://www3.lrs.lt/c-bin/eng/]; The Republic of Estonia Employment Contracts Act [http://lex.andmevara.ee/estlex/]

Social protection systems in the Baltic States 54
countries the compensation is not legally compulsory while it may be written in the work contract.
It should be noted that regulations on dismissals are difficult to compare internationally as various measures should be taken into account. For example, in the case of fixed term contracts it is much easier to fire a person. Therefore several indices have been constructed to measure the strictness of dismissal regu-lations. According to the 1999 OECD index, whose value was calculated for the Baltic States in a paper by Eamets and Masso (2003), dismissal regulations in the Baltic States are somewhat stricter than the average EU level, being similar to Germany and some other Central European countries. As we saw, the strict regulation of dismissals is characteristic of the Central European and especially the Southern-European social protection systems.
0.0
0.5
1.0
1.5
2.0
2.5
3.0
3.5
4.0
4.5
5.0
US
A
UK
Hungary
Pola
nd
Czech
R.
Slo
vakia
CE
EC
Latv
ia
EU
15
Esto
nia
Baltic
s
Germ
any
Lithuania
Fra
nce
Slo
venia
Italy
Port
ugal
Figure 1. Dismissal regulations in the EU, CEE countries and the Baltic States. Source: Eamets, Masso 2003 compiled using calculations from OECD 1999 Their rather strict dismissal regulations make the Baltic States’ labour markets less dynamic. As a result, they might lead the Baltic economies to a higher unemployment rate as they make hiring more costly for the employers. However, this possibility is somewhat undermined by the problems of the enforcement of labour legislation in the Baltics (Eamets and Masso 2003).
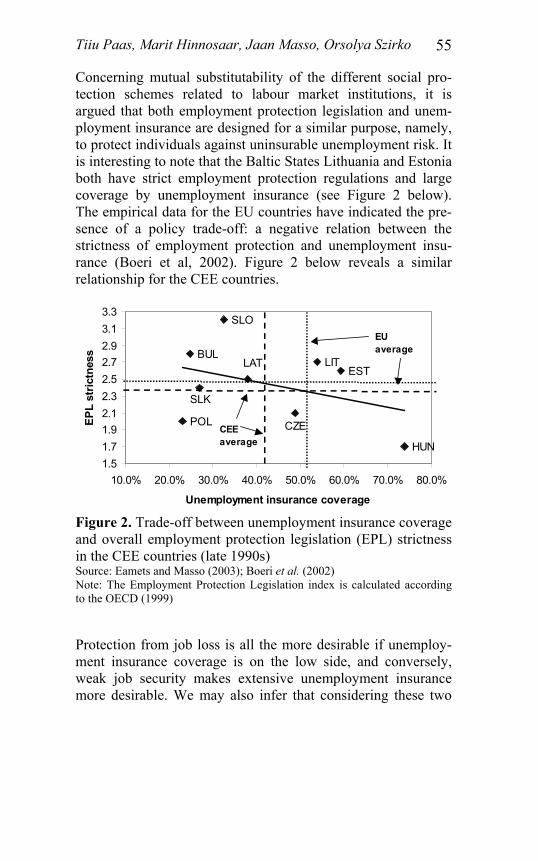
Tiiu Paas, Marit Hinnosaar, Jaan Masso, Orsolya Szirko 55
Concerning mutual substitutability of the different social pro-tection schemes related to labour market institutions, it is argued that both employment protection legislation and unem-ployment insurance are designed for a similar purpose, namely, to protect individuals against uninsurable unemployment risk. It is interesting to note that the Baltic States Lithuania and Estonia both have strict employment protection regulations and large coverage by unemployment insurance (see Figure 2 below). The empirical data for the EU countries have indicated the pre-sence of a policy trade-off: a negative relation between the strictness of employment protection and unemployment insu-rance (Boeri et al, 2002). Figure 2 below reveals a similar relationship for the CEE countries.
LAT LITEST
BUL
CZE
HUN
POL
SLK
SLO
1.51.71.92.12.32.52.72.93.13.3
10.0% 20.0% 30.0% 40.0% 50.0% 60.0% 70.0% 80.0%
Unemployment insurance coverage
EPL
stric
tnes
s
CEE average
EU average
Figure 2. Trade-off between unemployment insurance coverage and overall employment protection legislation (EPL) strictness in the CEE countries (late 1990s) Source: Eamets and Masso (2003); Boeri et al. (2002) Note: The Employment Protection Legislation index is calculated according to the OECD (1999) Protection from job loss is all the more desirable if unemploy-ment insurance coverage is on the low side, and conversely, weak job security makes extensive unemployment insurance more desirable. We may also infer that considering these two

Social protection systems in the Baltic States 56
measures, Slovakia and Bulgaria seem to follow the Southern European social protection model, while Hungary and the Czech Republic are more similar to the Central European countries (France, Germany) with wider unemployment insu-rance coverage and more modest strictness of labour legislation. Also Riboud et al (2002) have argued that when adopting new labour market institutions, the CEE countries may have been more influenced by geographical or cultural proximity than by the desire to imitate a single European model. 5.3. Wage bargaining and regulation of low
pay as a means of social protection Wage bargaining and unions
In most EU countries trade unions play an important role in the labour market. The unions lead to a more equitable income distribution (less wage inequality), strengthening the bargaining power of workers in wage negotiations. At the same time, powerful trade unions may have as their incentive to increase wages without caring much about decrease in employment. Therefore trade unions’ impact may increase the welfare of employed persons and decrease the welfare of those who lose their jobs.
The pertaining literature usually addresses the impact of wage regulations and unions on employment, although there also authors who look at the impact of the institutions on human capital accumulation. Unions and minimum wages are believed to compress wage distribution, i.e. reduce the wages of skilled workers relative to unskilled workers (see e.g. Hibbs and Loc-king 1996, Blau and Kahn 1996), which impacts on human capital accumulation. There are a number of theoretical papers dealing with the impact of unions and minimum wages on investment into human capital and training, and there is no general agreement that the impact should be negative (see, for example, Cahuc and Michel 1996; Agell and Lommerud 1997; Acemoglu and Pischke 1999; Lindquist 2004). For empirical

Tiiu Paas, Marit Hinnosaar, Jaan Masso, Orsolya Szirko 57
results see, for example, Fredriksson (1997), and Bassanini and Brunello (2003).
It is generally argued that the impact of trade unions on em-ployment depends on the centralisation of the wage negotiations (Calmfors and Drifill 1988). In case wage negotiations take place at the sectoral level, the unions have a strong negotiating power, while they may still overlook the possible negative impact on employment. On the other hand, in the negotiations at the national level, unions are more interested in employment and are willing to agree on lower wages.
In the Baltic States, wage bargaining takes place mainly at the individual level. Union membership and collective agreements coverage are low compared to the EU countries (the union membership in 2002 was estimated at no more than 20 % in the Baltic States and coverage by collective agreements not much higher, see Antila and Ylöstalo 2003). At the national level, the minimum wages are determined in the wage bargaining process, but at other levels collective bargaining (sectoral and enterprise levels) is rather uncommon.
The Baltic States introduced national-level bargaining already at the beginning of the transition process. National-level bar-gaining takes place mainly in tripartite bodies which include representatives of the government, employers and unions. One of the main tasks of national-level bargaining is to decide the level of a minimum wage. Among the other questions in the bargaining have been the reforms of the labour market legi-slation, social reforms and pensions.
Regional-level bargaining is not developed in the Baltic States (with the exception of a sectoral-level agreement in the Ida-Viru County of Estonia, which is described by a very high unemployment rate and only a few large enterprises). In ge-neral, the social partners in the Baltic States have a weak regio-nal structure, in some cases there are no local organisations. One of the main reasons for the lack of regional-level bar-gaining in the Baltic States is the small geographical unit, for
Social protection systems in the Baltic States 58
example, Eurostat statistical bulletins consider the countries as one region.
Industry-level bargaining is also rather rare in the Baltic States (Ladó, 2002; Due and Mailand, 2001). The idea of industry-level agreements is usually to provide minimum standards. It is argued that one of the main problems in industry-level bar-gaining is the weakness of employers associations. Most of the industry-level bargaining takes place in the public sector or sectors with large privatised enterprises. For example, Latvia has industry agreements covering such industries as energy, nursing and healthcare, construction, education, culture, fo-restry, food industry, trade and fishing. In Estonia, industry-level agreements exist, for example, in forestry, energy, trans-port, healthcare and education. Lithuanian industry-level agree-ments are the least developed in the Baltic States, there being only a few examples of such agreements in the country (compared to 26 agreements in Latvia and 13 in Estonia in 2000), for example, the agreement in the telecommunication industry (Due and Mailand, 2001).
Besides the national-level agreements, enterprise-level agree-ments are most common in the Baltic States. However, it must be noted that the initiative to bargain is usually taken by the trade unions and that employers are not interested in concluding collective agreements. Indeed, employers are under a legal obligation to conclude the agreement if the employees wish to do so, but in practice there are often disputes where employers attempt to avoid signing agreements. Most of the enterprise-level agreements are concluded in the public sector, in large public sector enterprises or in privatised enterprises. Enterprise-level bargaining is remarkably less developed in foreign compa-nies (Due and Mailand, 2001). Due and Mailand estimate the coverage by enterprise-level agreements to be 6–14% in Estonia, and 10–30% in Lithuania and Latvia. According to the survey results of Antila and Ylöstalo (2003), the coverage by collective agreements in 2002 was 22% in Estonia, and 26% in Lithuania and Latvia. They report the unionisation rate to be 14% in Estonia, 11% in Lithuania, and 20% in Latvia.

Tiiu Paas, Marit Hinnosaar, Jaan Masso, Orsolya Szirko 59
So it can be concluded that wages are mostly bargained at the individual level and the trade unions are weak. For example, a recent study by Eamets and Kallaste (2003) showed that the Estonian unions have not enough bargaining power to receive wage premiums.
The individual-level wage agreements have probably allowed wages in the Baltic States to be flexible and made downward wage adjustments possible during economic downturns19. It can be suggested that such wage flexibility has significantly contri-buted to the rapid overcoming of the economic downturn. Low pay
Th idea of a minimum wage is to prevent working for a certain low wage, which is thought to be inequitable in the society. As soon as a minimum wage is binding (has impact on wage distribution) it has a negative impact on employment, not allowing low-productivity workers to find jobs. In a theoretical framework, a minimum wage might have a positive impact on employment in case of a monopsonistic labour market (Stigler 1946). The empirical results generally show that if minimum wages are high, there exists a negative impact on employment (see e.g. Brown 1999). The question whether minimum wages impact on training has thoroughly been studied in empirical literature, although there is no consensus on the issue (see e.g. Arulampalam et al 2004; Neumark and Wascher 2001). Currently, minimum wages have been set in 9 EU countries (Clare, 2002). To reduce the negative impact, most EU count-ries have diversified minimum wages, for example, by age-groups, so that a minimum wage would not lead to lower employment among young people.
Allthe three Baltic countries have introduced national minimum wages which were set already at the beginning of the transition, then at a similar level to the Western European countries,
19 Paas et al. (2003) showed that wages in some sectors decreased as a result of the Russian crisis in the second half of the 1998.

Social protection systems in the Baltic States 60
considering the ratio to average wages20. During the 1990s, the importance of minimum wages decreased as the average wage increase was faster than the growth of minimum wages. But by the year 2001 the importance of minimum wages had increased again, the share of a minimum wage to the average in Lithuania being 40% (JAP Lithuania 2002), in Latvia 34.5% (JAP Latvia 2003), and in Estonia 29%. In absolute terms, the minimum wages in 2001 and 2003 were respectively in Latvia (since 1st July 2001) 104 euros and 116 euros; in Lithuania continuously 125 euros, in Estonia 103 euros and 138 euros (for the 2003 data see Clare and Paternoster 2003). In Estonia, the importance of a minimum wage should be increasing further: according to the contract between the unions and employers, by 2008 the share of a minimum wage to the average should be 41%. As the average wage is higher than the median, that minimum wage level 41% of the average can be considered to be rather high compared to the EU countries, being similar to the relative minimum wages in Continental Europe. The comparatively high relative minimum wages of the Baltic States are especially surprising in the light of the existing weak unions. However, it should be noted that the Baltic minimum wages in absolute terms are considerably lower than those of the EU countries (for the minimum wages in the EU see Clare and Paternoster 2003).
Leading to less unequal income distribution by reducing the incidence of low pay, minimum wages increase poverty by removing a group of people from the labour market (see Hinnosaar and Rõõm 2003 for the analysis of a minimum wage’s impact on employment and wages in Estonia). The ove-rall impact on income distribution and poverty level is therefore unknown. It should be taken into account that supporting people without jobs puts extra pressure on the budget and through tax increases on the people who are employed. One possibility to 20 Unfortunately in the Baltic States there are no official data about the median wages. And therefore the importance of minimum wages in the Baltic States and EU countries is hard to compare, as in the EU countries the importance of minimum wages is usually measured as the ratio of minimum wages and median wages.
Tiiu Paas, Marit Hinnosaar, Jaan Masso, Orsolya Szirko 61
reduce the negative impact of a minimum wage is using active labour market policy measures and paying more attention to the educational and training programmes to increase the pro-ductivity of the labour force.
We can conclude the section with noting that currently the level of social protection offered by labour market institutions in the Baltic States is rather limited (as we could see, the level of the labour policy expenditures is extremely low and the trade unions’ impact is modest). However, it can be expected that the importance of labour policies and trade unions will grow in the future. 6. Conclusions and implications The European Union’s social protection system is not universal and offers no explicit positive experience to the new member countries for developing a social protection system that would support the population’s adjustment processes to the new economic and political structuresand improve the stabilisation of the labour markets. The current EU member countries apply four models of social protection systems (the Anglo-Saxon or liberal welfare regime, Central European or conservative corporatist regime, Scandinavian or social democratic regime, and the Southern European regime) whose conceptions and policy measures have experienced both success and failure.
The social protection systems of the Baltic States do not exactly copy any of the four social protection models used in the EU and have been quite dynamic over the last decade. At the outset of the transition, the Baltic States mainly used the Central European (corporative, labour-market-based) social security model. In the middle of the 1990s, the elements of a more liberal model (e.g. the 3-pillar pension scheme) were introduced. This model contributes more to the economic efficiency than social cohesion of the society. However, we

Social protection systems in the Baltic States 62
consider the liberal social protection model to be appropriate because the Baltic States are still too poor to afford extensive social protection. In the opposite case, the appropriate goal would have been economic efficiency subject to the constraints set by social needs. Despite the fact that the scope of the EU regulations in the area of social protection is rather limited, we fully expect that in near future the elements of the Central European social protection system will become stronger in the Baltic States, especially in view of the recent introduction of the unemployment insurance system, the expected strengthening of the trade union movement, rising minimum wages and labour policy expenditures.
All the Baltic States have introduced their poverty reduction strategies and 3-pillar pension systems mostly following the example of the Latin-American countries, and unemployment insurance systems including both the insurance component and poverty reduction as a target. Also the necessary labour market institutions have been established in order to protect the em-ployees’ interests in market economy. The expenditures on social protection have been relatively modest as reflected, for instance, by the low replacement rates of the unemployment insurance systems. Because people have not received fully acceptable social support in order to adjust to the rapid changes caused by the transition and European integration processes, social cohesion of the Baltic societies has declined. However, weak social cohesion can make the development of the society unstable and threaten economic growth.
The emergence of social problems has initiated debates about the Baltic States’ social and labour market policies. We suggest that further reforms of the social security system should be targeted at the development of human capital, and thereby the flexibility of the labour market, with sustainable development as the ultimate goal. The employment protection regulations, minimum wages, social benefits and pensions should reduce poverty by decreasing the incidence of low payment. The la-bour market institutions meant to decrease inequality and poverty may reduce the flexibility of labour and increase

Tiiu Paas, Marit Hinnosaar, Jaan Masso, Orsolya Szirko 63
unemployment. In the case of the Baltic States as small transi-tional societies, the controversial role of the social protection system, particularly of institutions and labour policies in reducing poverty could be overcome by increasing the produc-tivity and flexibility of the labour force. The key issues are the development of more innovative skills at lower school levels and of the complex problem-solving techniques at higher school levels, improving the quality of vocational education and increasing the amount of workplace training, as well as expan-ding the active labour market programmes and creating better conditions for lifelong learning.
In summary, averting the possible negative social consequences of the rapid transition and EU eastward enlargement processes in the conditions of declining and ageing European population needs big investments into human capital (education, training and health of people) and implementation of national strategies oriented to sustainable development. This should improve the position of the current generations and, at the same time, in-crease the potential of future generations. The development of the Baltic States’ social protection systems has to be based on a good information system about the real economic situation of all population groups. The social protection measures have to be more targeted on supporting the most vulnerable groups of population and encouraging them to be more active in the labour markets. The role of the human factor increases in step with the roles played by know-how, innovation, organisation and management, and other quality factors of global competi-tiveness. The content of the human factor is changing: indi-vidual characteristics such as the level of education and health (the human capital) are accompanied by the growing impor-tance of social relations shaped by interaction between people (social capital). This implies that social development will play a more important role in social cohesion and inclusion.

REFERENCES Abramovici, G. (2003), “Social protection: expenditure on pensions”,
Statistics in Focus, Population and Social Conditions, Theme 3, 11/2003, EUROSTAT.
Acemoglu, D. and J. Pischke (1999), “The Structure of Wages and Investment in General Training”, Journal of Political Economy, Vol. 107, Is. 3, pp. 539–572.
Agell, J. and K. E. Lommerud (1997), “Minimum wages and the incentives for skill formation”, Journal of Public Economics, Vol. 64, Is. 1, pp. 25–40
Akerloff, G. (1984), “An Economist’s Book of Tales”. Cambridge University Press, Cambridge, UK.
Antila, J. and P. Ylöstalo (1999), “Working Life Parameter in the Baltic Countries 1999”’, Helsinki, Ministry of Labour, Labour Policy Studies No. 214, 245 p.
Antila, J. and P. Ylöstalo, (2003), “Working Life Barometer in the Baltic Countries 2002”, Ministry of Labour Finland, Labour Policy Studies No 247, 325 p.
Arjona, R., Ladaique, M. and M. Pearson. (2001), “Growth, inequality and social protection”, OECD Labour Market and Social Policy Occasional Papers No. 51, 2001, 53 p.
Arulampalam, W., Booth, A. L., Bryan, M. L. (2004), “Training and the new minimum wage”, Economic Journal, Vol. 114, Is. 494, pp. C87–C94.
Atkinson, A. B. (1999), “The Economic Consequences of Rolling Back the Welfare State”, Cambridge, The MIT Press.
Atkinson, A. B., Rainwater, L. and T. M. Smeeding (1995), “Income Distribution in OECD Countries, Evidence from the Luxembourg Income Study”, Paris, OECD.
Bassanini, A., and G. Brunello (2003), “Is Training More Frequent When Wage Compression Is Higher? Evidence from the European Community Household Panel”, IZA Discussion Paper, No. 839, 41 p.
Bean, C. R. (1994), “European Unemployment: A Survey”, Journal of Economic Literature, Vol. 32, No 2, pp. 573–619.

Tiiu Paas, Marit Hinnosaar, Jaan Masso, Orsolya Szirko 65
Bentolila, S. and G. Bertola (1990), “Firing costs and labour demand: how bad is eurosclerosis”, Review of Economic Studies, Vol. 57, No. 3, 1990, pp. 381–402.
Berger-Schmitt, R.; and H. H. Noll (2000), „Conceptual Framework and Structure of a European System of Social Indicators”, Centre for Survey Research and Methodology, Social Indicators Department, Mannheim, EU reporting Working Paper No 9.
Berghman, J. (1998), “Social Protection and Social Quality in Europe”, in W. Beck, van der Meaesen and A. Walker (Eds.) The Social Quality of Europe. Bristol: The Policy Press
Bernatas, D. and A. Guogis (2004), “Evaluation of Social Security in Lithuania, Latvia and Estonia: Achievements and Drawbacks”. Paper prepared based on a study carried out under an international COST A 15 project “Reforming Social Security Systems in Europe” (No.V-057), 19 p.
Bite, I. and V. Zagorskis (2003), “Study on the Social Protection Sys-tems in the 13 Applicant Countries. Latvia. Country Study”, European Commission — Employment and Social Affairs DG
Blau, F. D. and L. M. Kahn (1996), “International Differences in Male Wage Inequality: Institutions versus Market Forces”, Journal of Political Economy, Vol. 104, No. 4, pp. 791–837.
Boeri, T. and Bertola, G. (2002), “EMU Labour Markets Two Years On: Microeconomics Tensions and Instructional Evolution”, in Buti, M. and A. Sapir (Eds.) EMU and Economic Policy in Eu-rope. Edward Elgar.
Boeri, T., Borsh-Supan, A. and G. Tabellini (2001), “Would you like to shrink the welfare state? A survey of European Citizens”, Economic Policy, Vol. 32, 2001, pp. 9–50.
Boldrin, M., Dolado, J. J., Jimeno, J. J. and F. Peracchi (1999), “The Future of Pensions in Europe”, Economic Policy Vol. 29, pp. 289–322.
Brown, C. (1999), “Minimum Wages, Employment and the Distri-bution of Income”, in O. C. Ashenfelter (Ed.), Handbook of Labour Economics, Vol. 3B, pp. 2101–2164.
Cahuc, P. and P. Michel (1996), “Minimum wage unemployment and growth”, European Economic Review, Vol. 40, Is. 7, pp. 1463–1482.
Calmfors, L. (1994), “Active Labour Market Policy and Unem-ployment: the Framework for the Analysis of Crucial Design Features”, in “OECD Economic Studies”, No. 2, pp. 7–47.

Social protection systems in the Baltic States 66
Calmfors, L. and J. Driffill (1988), “Bargaining Structure, Corpo-ratism, and Macroeconomic Performance”, Economic Policy, Vol. pp. 14–61.
Campos N. F. and F. Coricelli (2002), “Growth in Transition: What We Know, What We Don’t and What We Should”, Journal of Economic Literature, Vol. 40, pp. 793–836.
Cazes, S. and A. Nesporova (2001), “Job insecurity in transition eco-nomies: how much is too much”, International Labour Review, Vol. 140, No. 3., 293–325.
Clare, R. (2002), “Minimum Wages in the European Union, 2002”. Statistics in Focus, Population and Social Conditions, Theme 3, 5/2002, Eurostat, 4 p.
Clare, R. and A. Paternoster, (2003), “Minimum Wages. EU Member States and Candidate Countries, January 2003”, Statistics in Fo-cus, Population and Social Conditions, Theme 3, 10/2003, Euro-stat, 8 p.
Dobravolskas A. and B. Romuldas (2003),”Study on the Social Pro-tection Systems in the 13 Applicant Countries. Lithuania. Country Study”, European Commission — Employment and Social Affairs DG.
Due, J. and M. Mailand (2001), “Social Dialogue in the Baltic Sea region — the state of the art”, University of Copenhagen, 16 p.
Eamets R. and J. Masso (2003), “Labour Market Flexibility and the Employment Protection Regulation in the Baltic States”, Tallinn Technical University Working Papers in Economics No. 03/91-03/103, pp. 49–82.
Eamets, R. (2001), “Reallocation of Labour During Transition. Disequilibrium and Policy Issues. The Case of Estonia”. Dissertationes Rerum Oeconomicarum Universitatis Tartuensis No 5. Tartu, Tartu University Press.
Eamets, R. and E. Kallaste (2003), “The Role of Trade Unions in Labour Market Flexibility: The Case of Estonia”, Labour Market Research in Estonia: Papers of the Research Seminar (Tallinn, May 9, 2003), pp. 39–60.
Ebbinghaus, B. (1999), “Does a European Social Model Exist and Can It Survive?”, in G. Huemer, M. Mesch, and F. Traxler (Eds.) The Role of Employer Associations and Labour Unions in the EMU. Institutional Requirements for European Economic Policies, pp. 1–26.. Aldershot: Ashgate.
Esping-Andersen, G. (1990), “The Three Worlds of Welfare Capita-lism”, Oxford, Oxford University Press.
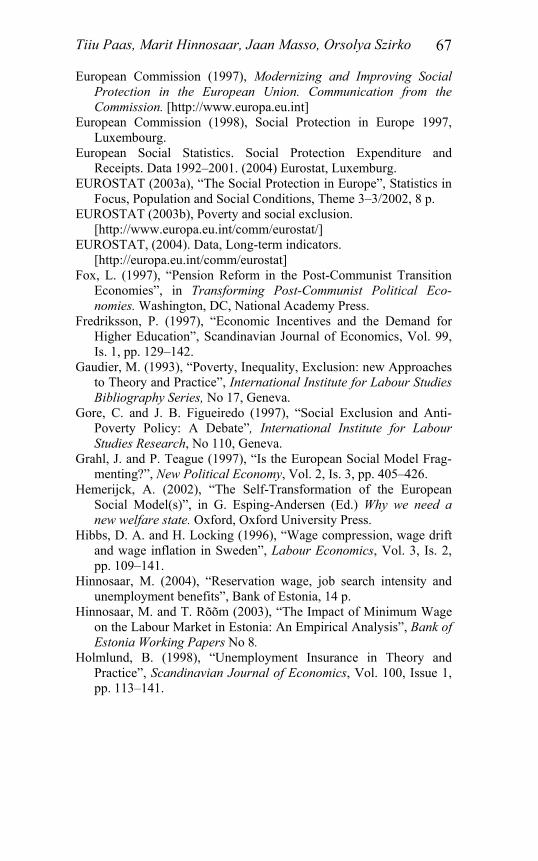
Tiiu Paas, Marit Hinnosaar, Jaan Masso, Orsolya Szirko 67
European Commission (1997), Modernizing and Improving Social Protection in the European Union. Communication from the Commission. [http://www.europa.eu.int]
European Commission (1998), Social Protection in Europe 1997, Luxembourg.
European Social Statistics. Social Protection Expenditure and Receipts. Data 1992–2001. (2004) Eurostat, Luxemburg.
EUROSTAT (2003a), “The Social Protection in Europe”, Statistics in Focus, Population and Social Conditions, Theme 3–3/2002, 8 p.
EUROSTAT (2003b), Poverty and social exclusion. [http://www.europa.eu.int/comm/eurostat/]
EUROSTAT, (2004). Data, Long-term indicators. [http://europa.eu.int/comm/eurostat]
Fox, L. (1997), “Pension Reform in the Post-Communist Transition Economies”, in Transforming Post-Communist Political Eco-nomies. Washington, DC, National Academy Press.
Fredriksson, P. (1997), “Economic Incentives and the Demand for Higher Education”, Scandinavian Journal of Economics, Vol. 99, Is. 1, pp. 129–142.
Gaudier, M. (1993), “Poverty, Inequality, Exclusion: new Approaches to Theory and Practice”, International Institute for Labour Studies Bibliography Series, No 17, Geneva.
Gore, C. and J. B. Figueiredo (1997), “Social Exclusion and Anti-Poverty Policy: A Debate”, International Institute for Labour Studies Research, No 110, Geneva.
Grahl, J. and P. Teague (1997), “Is the European Social Model Frag-menting?”, New Political Economy, Vol. 2, Is. 3, pp. 405–426.
Hemerijck, A. (2002), “The Self-Transformation of the European Social Model(s)”, in G. Esping-Andersen (Ed.) Why we need a new welfare state. Oxford, Oxford University Press.
Hibbs, D. A. and H. Locking (1996), “Wage compression, wage drift and wage inflation in Sweden”, Labour Economics, Vol. 3, Is. 2, pp. 109–141.
Hinnosaar, M. (2004), “Reservation wage, job search intensity and unemployment benefits”, Bank of Estonia, 14 p.
Hinnosaar, M. and T. Rõõm (2003), “The Impact of Minimum Wage on the Labour Market in Estonia: An Empirical Analysis”, Bank of Estonia Working Papers No 8.
Holmlund, B. (1998), “Unemployment Insurance in Theory and Practice”, Scandinavian Journal of Economics, Vol. 100, Issue 1, pp. 113–141.
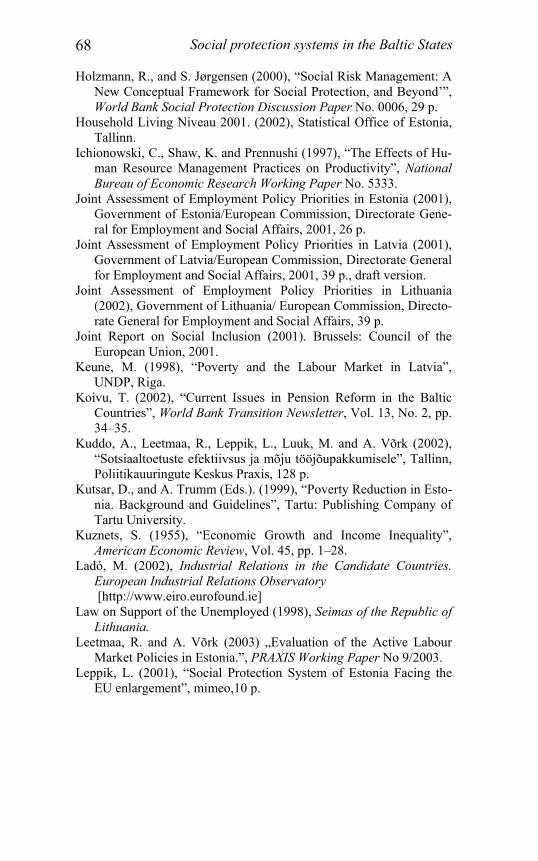
Social protection systems in the Baltic States 68
Holzmann, R., and S. Jørgensen (2000), “Social Risk Management: A New Conceptual Framework for Social Protection, and Beyond’”, World Bank Social Protection Discussion Paper No. 0006, 29 p.
Household Living Niveau 2001. (2002), Statistical Office of Estonia, Tallinn.
Ichionowski, C., Shaw, K. and Prennushi (1997), “The Effects of Hu-man Resource Management Practices on Productivity”, National Bureau of Economic Research Working Paper No. 5333.
Joint Assessment of Employment Policy Priorities in Estonia (2001), Government of Estonia/European Commission, Directorate Gene-ral for Employment and Social Affairs, 2001, 26 p.
Joint Assessment of Employment Policy Priorities in Latvia (2001), Government of Latvia/European Commission, Directorate General for Employment and Social Affairs, 2001, 39 p., draft version.
Joint Assessment of Employment Policy Priorities in Lithuania (2002), Government of Lithuania/ European Commission, Directo-rate General for Employment and Social Affairs, 39 p.
Joint Report on Social Inclusion (2001). Brussels: Council of the European Union, 2001.
Keune, M. (1998), “Poverty and the Labour Market in Latvia”, UNDP, Riga.
Koivu, T. (2002), “Current Issues in Pension Reform in the Baltic Countries”, World Bank Transition Newsletter, Vol. 13, No. 2, pp. 34–35.
Kuddo, A., Leetmaa, R., Leppik, L., Luuk, M. and A. Võrk (2002), “Sotsiaaltoetuste efektiivsus ja mõju tööjõupakkumisele”, Tallinn, Poliitikauuringute Keskus Praxis, 128 p.
Kutsar, D., and A. Trumm (Eds.). (1999), “Poverty Reduction in Esto-nia. Background and Guidelines”, Tartu: Publishing Company of Tartu University.
Kuznets, S. (1955), “Economic Growth and Income Inequality”, American Economic Review, Vol. 45, pp. 1–28.
Ladó, M. (2002), Industrial Relations in the Candidate Countries. European Industrial Relations Observatory
[http://www.eiro.eurofound.ie] Law on Support of the Unemployed (1998), Seimas of the Republic of
Lithuania. Leetmaa, R. and A. Võrk (2003) „Evaluation of the Active Labour
Market Policies in Estonia.”, PRAXIS Working Paper No 9/2003. Leppik, L. (2001), “Social Protection System of Estonia Facing the
EU enlargement”, mimeo,10 p.

Tiiu Paas, Marit Hinnosaar, Jaan Masso, Orsolya Szirko 69
Leppik, L. and R. Kruuda (2003),”Study on the Social Protection Systems in the 13 Applicant Countries: Estonia Country Study”, European Commission — Employment and Social Affairs DG.
Lindquist, M. J. (2004), “The welfare costs of union wage com-pression”, European Economic Review, forthcoming.
Lithuania 1999. Living Conditions. (2000) Ministry of Social Security and Labour, Vilnius.
Lithuania, Latvia and Estonia — Key Indicators 1999–2001 (2001), Statistics Lithuania, 2 p. [http://www.stat.ee/files.aw/id=40246/ lit_lat_est_key_ind_1999_2001.pdf]
Milanovic, B. (2000), “Social Transfers and Social Assistance: an Empirical Analysis Using Latvian Household Survey Data”, World Bank Policy Research Working Paper, No. 2328, 30 p.
Ministry of Social Security and Labour (2003), The Report of the Lithuanian Social Security System, Vilnius, 122 p.
Ministry of Social Security and Labour, Republic of Lithuania (1999), Social Report, Vilnius, 111 p.
Ministry of Social Security and Labour, Republic of Lithuania (2000), Social Report, Vilnius, 114 p.
Ministry of Social Security and Labour, Republic of Lithuania (2001), Social Report, Vilnius, 214 p.
Ministry of Welfare of Republic of Latvia, (1998), Social Report 1998, 96 p.
Ministry of Welfare of Republic of Latvia, (2000), Social Report 1998, 123 p.
Ministry of Welfare of Republic of Latvia, (2001), Social Report 1998, 110 p.
MISSOC (2002), World Bank. [http://www.worldbank.org/html/prddr/ trans/julaugsep02/pgs6-9.htm]
MISSOC. Mutual Information System on Social Protection in the EU member States and the European Economic Area. (2004) [http://europa.eu.int/comm/employment_social/missoc/index_en.html]
National Poverty Reduction Strategy in Estonia. (2000) Tallinn: Ministry of Social Affairs of Estonia.
Neumark, D. and W. Wascher (2001), “Minimum wages and training revisited”, Journal of Labor Economics, Vol. 19, pp. 563–596.
Nickell, S. (1997), “Unemployment and Labour Market Rigidities: Europe versus North America”, Journal of Economic Perspectives, Vol. 11, No. 3, pp. 55–74.
OECD (1999), Employment Outlook, Paris. Paas, T. and A. Võrk (2003), “Social Consequences of Transition:
Who Recognize Themselves To Be Poor in Estonia?” — Eesti

Social protection systems in the Baltic States 70
majanduspoliitika teel Euroopa Liitu. XI teadus- ja koolitus-konverentsi artiklid. Berliin; Tallinn: Verlag Arno Spitz GmbH; Mattimar OÜ, lk. 366–376.
Paas, T., Eamets, R., Masso, J. and M. Rõõm (2003), “Labour Market Flexibility and Migration in the Baltic States: Macro evidences”, University of Tartu, Faculty of Economics and Business Administ-ration Working Paper No 16.
Perotti, R. (1992), “Fiscal policy, income distribution and growth”, Columbia University Working Paper No. 636.
Perotti, R. (1994), “Income distribution and investment”, European Economic Review, Vol. 38, pp. 827–835.
Raudla, K. and K. Staehr (2003), “Pension Reform and Taxation in Estonia”. University of Tartu, unpublished paper.
Reiljan, J. and L. Kulu (2003), “Pensionisüsteemi reformi olulisus Eesti majandusliku ja sotsiaalse arengu tagamisel”, in Estonian economic policy on the way towards the European Union: reports-papers of the XI scientific and educational conference (Tartu — Värska, 26–28 June 2003), pp. 385–400. Berlin/Tallinn: Univer-sity of Tartu.
Report on Social Protection in Europe 1999 (2000). Brussels: Commission of the European Communities, 26 p.
Republic of Lithuania: Statistical Appendix (2002), International Monetary Fund Country Report No. 02/9, 35 p.
Riboud, M., Sánchez-Páramo, C. and C. Silva-Jáuregui (2002), “Does Eurosclerosis matter? Institutional Reform and Labour Market Performance in Central and Eastern European Countries in the 1990s”, World Bank Social Protection Discussion Paper Series No. 0202.
Rodgers, G., Gore, C., and J. B. Figueiredo (1995), “Social Exclusion: Rhetoric, Reality, Responses”. Geneva: International Labour Office.
Rõõm, T. (2003a), “Taxation of production factors and Unemploy-ment in Estonia”, Kroon and Economy, No 1, pp. 36–45.
Rõõm, T. (2003b), “Tootmistegurite maksustamine ja tööpuudus Ees-tis”, Eesti Panga Toimetised 2003, 5, 28 p.
Sainsbury, D. and A. Morissens (2002), “European Anti-Poverty Policies in the 1990s: Toward a Common Safety Net?”, New York, Syracuse University, Maxwell School of Citizenship and Public Affair.
Sileika, A., and I. Blaziene (2000), “The Differentiation in the Popu-lation’s Income and Poverty in Lithuania”, Bank of Lithuania Monetary Studies, Vol. 4, No. 3.

Tiiu Paas, Marit Hinnosaar, Jaan Masso, Orsolya Szirko 71
Silver, H. (1994), “Social Exclusion and Social Solidarity: three Paradigms”, International Institute for Labour Studies (IILS) Discussion Paper No 69, Geneva.
Social Protection Sector Strategy: From Safety Net to Springboard (2000), World Bank Social Protection Sector, 91 p.
Social Security Administration. Estonia. (2002) [http://www.ssa.gov/ statistics/ssptw/2002/ europe/estonia.html]. 20/12/2002.
Social Security Administration. Latvia (2002) [http://www.ssa.gov/ statistics/ssptw/2002/ europe/latvia.html]. 20/12/2002.
Social Security Administration. Lithuania (2002) [http://www.ssa.gov/ statistics/ssptw/ 2002/europe/lithuania.html]. 20/12/2002.
Social security: Issues, challenges and prospects. (2001) International Labour Office. Geneva, 88 p.
Standing, G. (2000), “Unemployment and Income Security”, ILO. Statistical Office of Estonia (2003). Government finances. Statistical
Database of Statistical Office of Estonia [http://www.stat.ee/ statistika]
Stigler, G. (1946), “The Economics of Minimum Wage Legislation”, American Economic Review, Vol. 36, No. 3, pp. 358–365.
Suhrcke, M. (2001), “Preferences for Inequality: East vs. West”, Hamburg International Institute of Economics HWWA Discussion Paper No 150.
The European Union On-Line. Dialogue with Citizens (2002) [http:// europa.eu.int/scadplus/citizens/en/trav_uk.htm#IIe]. 30/11/2002.
Thompson, L. H. (1983), “The Social Security Reform Debate”, Journal of Economic Literature, Vol. 21, pp. 1425–1467.
Trapenciere, I., Rungule, R. Pranka, M., Lace, T. and N. Dudwick (2000), “Listening to the Poor: A Social Assessment of Poverty in Latvia”, UNDP& Ministry of Welfare of the Republic of Latvia
UNDP (2000), Poverty Reduction in Estonia, Latvia, and Lithuania, Riga.
UNECE (2002), Trends in Europe and North America. [http://www.unece.org/stats/trends/]
Vanovska, I. (2002), “Pension reform in Latvia: Achievements and Challenges”, Practical Lessons in Pension Reform: Sharing the Experiences of Transition and OECD Countries Warsaw, May 27–28 2002, 28 p.
Võrk, A. and K. Uudeküll (2004), “Ennetähtaegne vanaduspension ja selle seos tööturukäitumisega Eestis”. University of Tartu, un-published paper.
Vroman, W. (2001), “Unemployment Insurance and Unemployment Assistance”, World Bank

Social protection systems in the Baltic States 72
Wilder L. and M. Viies (2001), “Demographics, Poverty and Poverty Relief in Estonia”, in Ü. Ennuste and L. Wilder (Eds.), Factors of Convergence: A collection for the Analysis of Estonian Socio-Economic and Institutional Evolution, Estonian Institute of Economics, Tallinn, 2001, p. 105–137.
World Bank Social Protection Sector (2004). [http://www1.worldbank.org/sp/]

KOKKUVÕTE Artikli eesmärgiks on võrrelda Balti riikide ning Euroopa Liidu liikmesriikide sotsiaalkaitse süsteeme, et selgitada, kas Balti riikide ja Euroopa Liidu vahel esineb sotsiaalkaitsesüsteemide osas olulisi erinevusi, mis võiksid takistada Balti riikide integreerumist Euroopa Liiduga. Euroopa Liidu riikides raken-datud sotsiaalkaitsesüsteemid ei ole ühtsed. Eristada saab nelja sotsiaalkaitse mudelit: liberaalne, sotsiaal-demokraatlik, konti-nentaal-euroopa ja lõuna-euroopa mudel. Balti riikides ei järgita ühtegi neist täpselt. Siirdeprotsesside alguses liikusid Balti riikide sotsiaalkindlustussüsteemid enam kontinentaal-euroopa sotsiaalkaitse mudeli poole. Seejärel võeti kasutusele mitmeid liberaalse süsteemi elemente (näiteks kolmesambalised pen-sionisüsteemid). Kuigi Euroopa Liiduga ühinemine ei esita Balti riikidele erilisi nõudmisi oma sotsiaalpoliitika muutmiseks on viimasel ajal taas tekkinud vajadus järgida enam konti-nentaal-euroopa sotsiaalkaitse mudelit.
Artiklis pööratakse peamist tähelepanu sellistele sotsiaalkaitse süsteemi elementidele nagu pensionisüsteemid, sotsiaalabi ja töötuskindluste süsteemid, tööturupoliitikad ja institutsioonid. Balti riikides on välja töötatud vaesuse vähendamise strateegiad ning sisse viidud töötajate kaitseks vajalik tööturuinstitutsioon, kolmesambalised pensionisüsteemid (tuginevad Ladina-Amee-rika lähenemisele) ning töötuskindlustuse süsteemid, mis sisal-davad nii kindlustuselementi kui vaesuse vähendamise ees-märki. Läbiviidud analüüsi tulemused kinnitavad arvamust, et Balti riikide inimesed ei saa praegu veel aktsepteeritaval tase-mel sotsiaalset kaitset ning teatud meetmete (näiteks sotsiaal-abi) suunatus tõeliste abivajajatele on nõrk. Seetõttu on edaspidi vajalik arendada nii kontinentaal-euroopa mudelile omaseid passiivseid sotsiaalkaitse meetmeid kui ka senisest enam stimuleerida inimeste tööturualast aktiivsust suurendades eel-kõige investeeringuid inimkapitali.

APPENDIX Table A 1. Social protection expenditure in the growth equations
Authors Countries Period Independent variable
Positive significant effect of social security spending and transfers Cashin (1994) 92 countries,
including 23 developed countries
1971–88 Government transfers, social
security payments
Perotti (1992) 72 countries 1960–85 and 1970–85
Transfers
Sala-i-Martin (1992)
74 countries Transfers
Negative significant effect of transfers Nördstrom (1992)
14 OECD countries
1979–89 Transfers
Negative non-significant effect of transfers Persson, Tabellini (1994)
13 OECD countries
1960–85 Social expenditure over GDP
Source: Arjona, Ladaique, Pearson (2001)
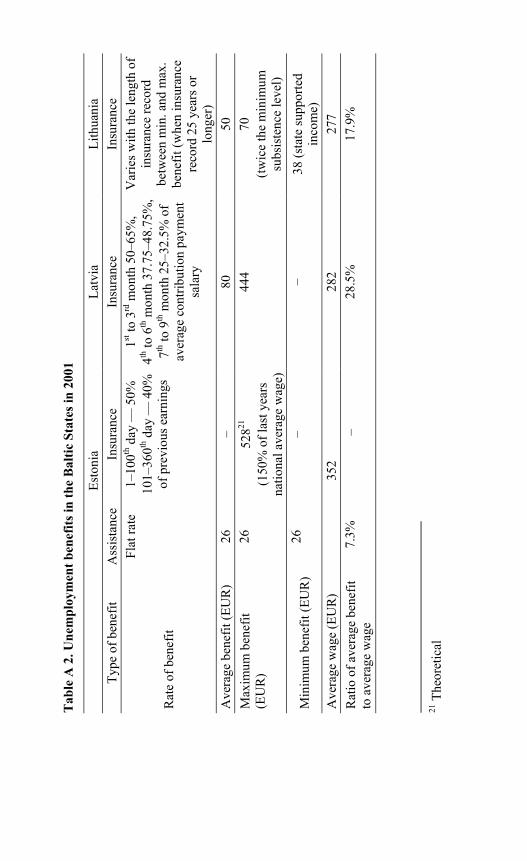
Tab
le A
2. U
nem
ploy
men
t ben
efits
in th
e B
altic
Sta
tes i
n 20
01
Es
toni
a La
tvia
Li
thua
nia
Type
of b
enef
it A
ssis
tanc
e In
sura
nce
Insu
ranc
e In
sura
nce
Rat
e of
ben
efit
Flat
rate
1–10
0th d
ay —
50%
10
1–36
0th d
ay —
40%
of
pre
viou
s ear
ning
s
1st to
3rd
mon
th 5
0–65
%,
4th to
6th
mon
th 3
7.75
–48.
75%
,7th
to 9
th m
onth
25–
32.5
% o
f av
erag
e co
ntrib
utio
n pa
ymen
t sa
lary
Var
ies w
ith th
e le
ngth
of
insu
ranc
e re
cord
be
twee
n m
in. a
nd m
ax.
bene
fit (w
hen
insu
ranc
e re
cord
25
year
s or
long
er)
Ave
rage
ben
efit
(EU
R)
26
– 80
50
M
axim
um b
enef
it (E
UR
)
26
52821
(1
50%
of l
ast y
ears
na
tiona
l ave
rage
wag
e)
444
70
(twic
e th
e m
inim
um
subs
iste
nce
leve
l)
Min
imum
ben
efit
(EU
R)
26
– –
38 (s
tate
supp
orte
d in
com
e)
Ave
rage
wag
e (E
UR
) 35
2 28
2 27
7 R
atio
of a
vera
ge b
enef
it to
ave
rage
wag
e 7.
3%
–
28.5
%
17
.9%
21
The
oret
ical

Ta
ble
A 2
(con
tinua
tion
)
Es
toni
a La
tvia
Li
thua
nia
Max
imum
tim
e Pa
yabl
e 18
0 da
ys
360
days
9
mon
ths
6 m
onth
s
Req
uire
d in
sura
nce/
em
ploy
men
t rec
ord
180
days
of
wor
k du
ring
the
12 m
onth
s prio
r to
bec
omin
g un
empl
oyed
Not
less
than
1 y
ear
durin
g th
e 2
year
s pr
ior t
o re
gist
erin
g
Tota
l ins
uran
ce c
ontri
butio
ns
not l
ess t
han
1
year
, 9 m
onth
s of i
nsur
ance
co
ntrib
utio
ns in
the
12 m
onth
s be
fore
regi
ster
ing
Wor
ked
and
paid
soci
al
cont
ribut
ions
for l
east
24
mon
ths d
urin
g th
e la
st 3
ye
ars
Sour
ce o
f Fu
nds
Insu
red
pers
on:
none
22.
Empl
oyer
: non
e.
Gov
ernm
ent:
tota
l cos
t.
Insu
red
pers
on: 0
.5–
2% o
f wag
es a
nd
othe
r com
pens
atio
ns
(in 2
001
1.5%
) Em
ploy
er: 0
.25–
1%
of p
ayro
ll (in
200
1 0.
5%)
Insu
red
pers
on a
nd e
mpl
oyer
: 1.
90%
of p
ayro
ll.
Gov
ernm
ent:
Con
tribu
tes f
or
activ
e m
ilita
ry p
erso
nnel
and
fo
r ind
ivid
uals
taki
ng c
are
of
child
ren
unde
r 18
mon
ths o
ld.
Insu
red
pers
on: N
one.
Em
ploy
er: 1
.5%
of
payr
oll i
s tra
nsfe
rred
to
the
unem
ploy
men
t fun
d.
Gov
ernm
ent:
Allo
catio
ns fr
om st
ate
budg
et in
cas
e of
def
icit.
Sour
ces:
Tiiu
Paa
s et
al 2
003;
Soc
ial R
epor
t 200
1; L
ithua
nia,
Lat
via
and
Esto
nia
— K
ey I
ndic
ator
s 19
99–2
001;
Law
on
Supp
ort o
f the
Une
mpl
oyed
199
8; T
öötu
skin
dlus
tuse
sead
us 2
001.
22
Insu
ranc
e sy
stem
fund
ed b
y bo
th e
mpl
oyer
and
em
ploy
ee st
arte
d in
200
2 (s
ee te
xt)

Table A 3. Expenditures on passive labour market policy measures
1995 1996 1997 1998 1999 2000 2001 Total budget on passive measures (million EUR)
Estonia 1.7 2.5 3.2 3.6 7.7 7.6 8.2 Latvia 15.3 17.1 21.8 29.8 54.0 47.7 42.2 Lithuania 6.4 10.3 10.9 11.3 14.2 21.9 20.0
Expenditure on passive measures, percentage of total budget on labour policy
Estonia 40.5% 44.8% 47.3% 49.9% 65.3% 63.8% 61.5% Latvia – – – 75.8% 82.2% 80.6% 78.1% Lithuania 46.4% 50.9% 42.9% 33.7% 40.0% 50.7% 41.0%
Sources: Tiiu Paas et al 2003 compiled using data from Estonian Labour Market Board; State Employment Service of Latvia; Social Report, 2001; Ministry of Social Security and Labour of the Republic of Lithuania.
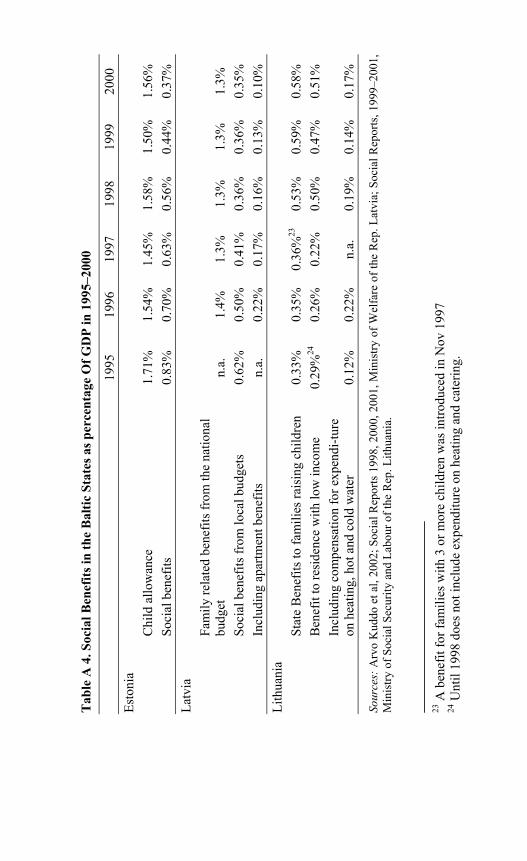
Tab
le A
4. S
ocia
l Ben
efits
in th
e B
altic
Sta
tes a
s per
cent
age
Of G
DP
in 1
995–
2000
1995
19
96
1997
19
98
1999
20
00
Esto
nia
Chi
ld a
llow
ance
1.
71%
1.
54%
1.
45%
1.
58%
1.
50%
1.
56%
Soci
al b
enef
its
0.83
%
0.70
%
0.63
%
0.56
%
0.44
%
0.37
%
Latv
ia
Fa
mily
rela
ted
bene
fits f
rom
the
natio
nal
budg
et
n.a.
1.
4%
1.3%
1.
3%
1.3%
1.
3%
So
cial
ben
efits
from
loca
l bud
gets
0.
62%
0.
50%
0.
41%
0.
36%
0.
36%
0.
35%
Incl
udin
g ap
artm
ent b
enef
its
n.a.
0.
22%
0.
17%
0.
16%
0.
13%
0.
10%
Li
thua
nia
Stat
e B
enef
its to
fam
ilies
rais
ing
child
ren
0.33
%
0.35
%
0.36
%23
0.53
%
0.59
%
0.58
%
B
enef
it to
resi
denc
e w
ith lo
w in
com
e 0.
29%
24
0.26
%
0.22
%
0.50
%
0.47
%
0.51
%
In
clud
ing
com
pens
atio
n fo
r exp
endi
-ture
on
hea
ting,
hot
and
col
d w
ater
0.
12%
0.
22%
n.
a.
0.19
%
0.14
%
0.17
%
Sour
ces:
Arv
o K
uddo
et a
l, 20
02; S
ocia
l Rep
orts
199
8, 2
000,
200
1, M
inis
try o
f Wel
fare
of t
he R
ep. L
atvi
a; S
ocia
l Rep
orts
, 199
9–20
01,
Min
istry
of S
ocia
l Sec
urity
and
Lab
our o
f the
Rep
. Lith
uani
a.
23
A b
enef
it fo
r fam
ilies
with
3 o
r mor
e ch
ildre
n w
as in
trodu
ced
in N
ov 1
997
24 U
ntil
1998
doe
s not
incl
ude
expe
nditu
re o
n he
atin
g an
d ca
terin
g.

Tab
le A
5. A
ctiv
e la
bour
mar
ket p
olic
ies,
1995
–200
1
19
95
1996
19
97
1998
19
99
2000
20
01
Tota
l bud
get o
n ac
tive
labo
ur m
arke
t mea
sure
s (m
illio
ns o
f EU
R)
Esto
nia
1.7
2.2
2.6
2.4
3.0
3.2
3.7
Latv
ia
– –
– 9.
5 11
.8
11.5
11
.8
Lith
uani
a 3.
8 5.
6 9.
0 12
.6
12.9
10
.6
16.6
Ex
pend
iture
on
activ
e m
easu
res,
per c
ent o
f tot
al la
bour
pol
icy
budg
et
Esto
nia
40.5
%
39.7
%
38.3
%
33.5
%
25.7
%
26.6
%
28.0
%
Latv
ia
– –
– 24
.2%
18
.0%
19
.4%
21
.9%
Li
thua
nia
28.1
%
27.4
%
35.4
%
37.5
%
36.2
%
24.6
%
34.1
%
Bre
akdo
wn
of sp
endi
ng o
n ac
tive
mea
sure
s, Es
toni
a La
bour
mar
ket t
rain
ing
64.2
%
66.2
%
68.9
%
72.2
%
67.7
%
65.8
%
73.2
%
Trai
ning
allo
wan
ces
17.3
%
14.4
%
13.3
%
10.7
%
12.8
%
13.2
%
13.2
%
Subs
idy
to e
mpl
oyer
1.
2%
2.3%
2.
3%
2.7%
3.
9%
4.5%
6.
1%
Subs
idy
to st
art a
bus
ines
s 13
.3%
10
.8%
9.
7%
9.6%
8.
9%
9.8%
7.
9%
Publ
ic w
orks
4.
0%
6.3%
5.
7%
4.8%
7.
0%
6.8%
–
Bre
akdo
wn
of sp
endi
ng o
n ac
tive
mea
sure
s, La
tvia
Pu
blic
wor
ks
– –
– 34
.0%
31
.0%
33
.0%
36
.0%
La
bour
mar
ket t
rain
ing
– –
– 62
.0%
65
.0%
62
.0%
60
.0%
Jo
b cl
ubs
– –
– 4.
0%
4.0%
5.
0%
4.0%

Tabl
e A
5 (c
ontin
uatio
n )
19
95
1996
19
97
1998
19
99
2000
20
01
Bre
akdo
wn
of sp
endi
ng o
n ac
tive
mea
sure
s, Li
thua
nia
Ret
entio
n of
jobs
0.
0%
0.4%
0.
6%
0.8%
1.
7%
2.8%
2.
1%
Labo
ur m
arke
t tra
inin
g 69
.8%
63
.1%
52
.3%
48
.5%
52
.2%
43
.9%
42
.2%
Pu
blic
wor
ks
10.3
%
14.6
%
13.6
%
21.9
%
26.2
%
34.1
%
33.7
%
Star
t of o
wn
busi
ness
7.
8%
2.9%
1.
4%
0.8%
0.
3%
0.4%
0.
6%
Supp
ort o
f em
ploy
men
t 12
.1%
19
.3%
31
.9%
27
.7%
19
.3%
16
.7%
18
.2%
Sour
ce:
Tiiu
Paa
s et
al
2003
com
pile
d us
ing
data
fro
m E
ston
ian
Labo
ur M
arke
t B
oard
; St
ate
Empl
oym
ent
Serv
ice
of
Latv
ia; S
ocia
l Rep
ort,
2001
; Min
istry
of S
ocia
l Sec
urity
and
Lab
our o
f the
Rep
ublic
of L
ithua
nia.

Tab
le A
6. O
verv
iew
of t
he 1
st p
illar
of t
he p
ensi
on sy
stem
in th
e B
altic
Sta
tes
E
ston
ia
Lat
via
Lith
uani
a
Fina
ncin
g
Fina
nced
by
soci
al ta
x (3
3 %
of p
ayro
ll w
here
from
20
% g
oes f
or th
e pe
nsio
ns
and
13 %
to h
ealth
insu
ranc
e)
Soci
al in
sura
nce
cont
ribut
ions
in
the
size
of 2
0 %
of p
ayro
ll 25
% o
f wag
es o
f per
sons
cov
ered
by
pen
sion
insu
ranc
e
Paym
ents
3-pa
rt fo
rmul
a: 1
) the
mai
n co
mpo
nent
(f
ound
acc
ordi
ng to
an
inde
xatio
n fo
rmul
a); 2
) a c
ompo
nent
cal
cula
ted
on
the
basi
s of y
ears
of p
ensi
onab
le se
rvic
e un
til 3
1 Ja
nuar
y 19
98; 3
) the
insu
ranc
e co
mpo
nent
dep
endi
ng o
n re
gist
ered
so
cial
tax
paid
(sin
ce 1
999)
The
sum
of t
otal
cap
ital o
n pe
nsio
ners
acc
ount
(c
ontri
butio
ns a
nd th
e re
turn
du
e to
ove
rall
wag
e gr
owth
) di
vide
d by
exp
ecte
d lif
etim
e.
The
pens
ion
is in
dexe
d fo
r pric
e ch
ange
s.
The
sum
of m
inim
um p
ensi
on a
nd
the
earn
ings
-rel
ated
su
pple
men
tary
com
pone
nts t
hose
co
vere
d by
pen
sion
insu
ranc
e (d
epen
ds o
n th
e in
sura
nce
perio
d an
d th
e si
ze o
f per
sona
l ins
uran
ce
cont
ribut
ions
).
Entit
lem
ent
At l
east
15
year
s of e
mpl
oym
ent.
Early
re
tirem
ent i
s pos
sibl
e (u
p to
3 y
ears
be
fore
lega
l ret
irem
ent a
ge p
rovi
ded
at
leas
t 15
year
s of p
ensi
onab
le se
rvic
e; th
e am
ount
of p
ensi
on is
redu
ced
by 0
.4%
for
each
mon
th fa
lling
shor
t of t
he st
ipul
ated
re
tirem
ent a
ge).
As t
o th
e po
stpo
ned
retir
emen
t pen
sion
, the
pen
sion
is
incr
ease
d by
0.9
% fo
r eac
h m
onth
that
a
pers
on p
ostp
ones
his
/her
app
licat
ion
for
the
pens
ion.
10 y
ears
of i
nsur
ance
reco
rd.
Early
retir
emen
t is p
ossi
ble.
If a
pe
rson
retir
es a
t the
age
of 6
0,
the
repl
acem
ent r
ate
is n
ot le
ss
than
40%
of p
re-ta
x ea
rnin
gs
for a
per
son
with
a n
orm
al w
ork
care
er; i
f ret
irem
ent i
s po
stpo
ned
till t
he a
ge o
f 65,
the
repl
acem
ent r
ate
will
be
arou
nd
60%
.
15 y
ears
of p
ensi
on in
sura
nce.
Th
e m
anda
tory
pen
sion
insu
ranc
e pe
riod
for f
ull p
ensi
on is
30
year
s fo
r men
and
28
year
s for
wom
en.
No
spec
ial s
chem
e fo
r ear
ly
pens
ion.
For
def
erre
d pe
nsio
ns
pens
ion
is in
crea
sed
8 %
for e
ach
year
.

Tabl
e A
6 (c
ontin
uatio
n)
E
ston
ia
Lat
via
Lith
uani
a
Exce
ptio
ns
Pub
lic se
rvan
ts h
ave
the
right
to
addi
tiona
l sta
te o
ld-a
ge p
ensi
ons.
The
sum
dep
ends
on
the
year
s of s
ervi
ce: f
or
10–1
5 ye
ars t
he p
ensi
on is
incr
ease
d by
10
%, 1
6–20
yea
rs 2
0%, 2
1–25
yea
rs 2
5%,
26–3
0 ye
ars 4
0% a
nd o
ver 3
0 ye
ars b
y 50
%.
No
spec
ial p
ensi
on o
n ci
vil
serv
ants
. Far
mer
s and
som
e ot
her c
ateg
orie
s of s
elf-
empl
oyed
are
exe
mpt
from
pa
ying
soci
al in
sura
nce
cont
ribut
ions
.
Spec
ial p
ensi
ons f
or st
ate
mili
tary
an
d of
ficia
ls o
f int
erna
l aff
airs
and
pe
nsio
ns fo
r sch
olar
s. Sp
ecia
l st
ate
pens
ions
are
aw
arde
d fo
r di
stin
guis
hed
peop
le a
nd
resi
stan
ce v
ictim
s. A
ll th
ese
pens
ions
are
pai
d al
ong
with
so
cial
insu
ranc
e pe
nsio
ns.
Farm
ers a
nd so
me
othe
r ca
tego
ries o
f sel
f-em
ploy
ed a
re
exem
pt fr
om p
ayin
g so
cial
in
sura
nce
cont
ribut
ions
.
Sour
ce: V
anov
ska
2002
; Koi
vu 2
002;
Rau
dla
and
Stae
hr (2
004)
; MIS
SOC
(200
4)
Not
e. T
he t
able
pro
vide
s on
ly a
sho
rt de
scrip
tion
of t
he i
mpo
rtant
fea
ture
s of
the
pen
sion
sys
tem
. A
mor
e de
taile
d co
mpa
rativ
e ta
bles
can
be
foun
d e.
g. in
MIS
SOC
(200
4)

Tab
le A
7. O
verv
iew
of t
he 2
nd p
illar
of t
he p
ensi
on sy
stem
in th
e B
altic
Sta
tes
E
ston
ia
Lat
via
Lith
uani
a
Paym
ents
Wor
king
per
son
pays
2 %
of s
alar
y;
stat
e ad
ds 4
% o
f the
cur
rent
soci
al
tax
and
reta
ins 2
9 %
The
rate
will
incr
ease
from
2%
of
the
payr
oll t
rans
ferr
ed in
200
1–20
06
to 1
0 %
in 2
010,
reac
hing
the
sam
e pr
opor
tion
for b
oth
1st a
nd 2
nd
5 pe
rcen
tage
poi
nts o
f the
cu
rren
t soc
ial c
ontri
butio
n (th
e la
tter i
s 25
% o
f wag
es)
Man
agem
ent
of fu
nds
Priv
ate
asse
t man
ager
s (ba
nks a
nd
insu
ranc
e co
mpa
nies
) St
ate
Trea
sury
, fro
m 2
003
also
pr
ivat
e as
set m
anag
ers
Priv
ate
asse
t man
ager
s (b
anks
and
insu
ranc
e co
mpa
nies
)
Cov
erag
e
Man
dato
ry fo
r peo
ple
born
198
3 or
la
ter;
volu
ntar
y fo
r peo
ple
born
19
42–1
982;
clo
sed
for p
eopl
e bo
rn
befo
re 1
942
Man
dato
ry fo
r peo
ple
unde
r the
age
of
30
at 1
st Ju
ly 2
001;
vol
unta
ry fo
r pe
ople
30–
49 y
ears
old
; clo
sed
for
peop
le o
ver t
he a
ge o
f 49
Man
dato
ry fo
r peo
ple
up to
40
, vol
unta
ry fo
r per
sons
in
40–5
0 ye
ars o
ld, c
lose
d fo
r pe
ople
old
er th
an 5
0
Paym
ents
at
retir
emen
t
The
pers
on c
an c
hang
e th
e va
lue
of
units
in p
ensi
on fu
nd fo
r per
iodi
c pa
y-m
ents
thro
ugh
an in
sura
nce
cont
ract
. If t
he c
alcu
late
d an
nuity
is
less
than
25
% o
f nat
iona
l pen
sion
ra
te, t
he p
erso
n is
ent
itled
for p
erio
dic
fund
ed p
ensi
on p
aym
ents
from
a
man
dato
ry p
ensi
on fu
nd n
ot e
xcee
-di
ng 2
5 %
of n
atio
nal p
ensi
on ra
te.
Add
the
capi
tal i
n th
e 2n
d pi
llar w
ith
the
capi
tal a
t the
1st
pill
ar o
r tra
nsfe
r th
e ca
pita
l to
life
insu
ranc
e co
mpa
ny
in re
turn
for a
life
ann
uity
Ben
efits
will
be
paid
afte
r th
e in
sure
d pe
rson
has
re
ache
d th
e re
tirem
ent a
ge.
Sour
ce: V
anov
ska
2002
; Koi
vu 2
002;
Rau
dla
and
Stae
hr (2
004)
; MIS
SOC
(200
4)
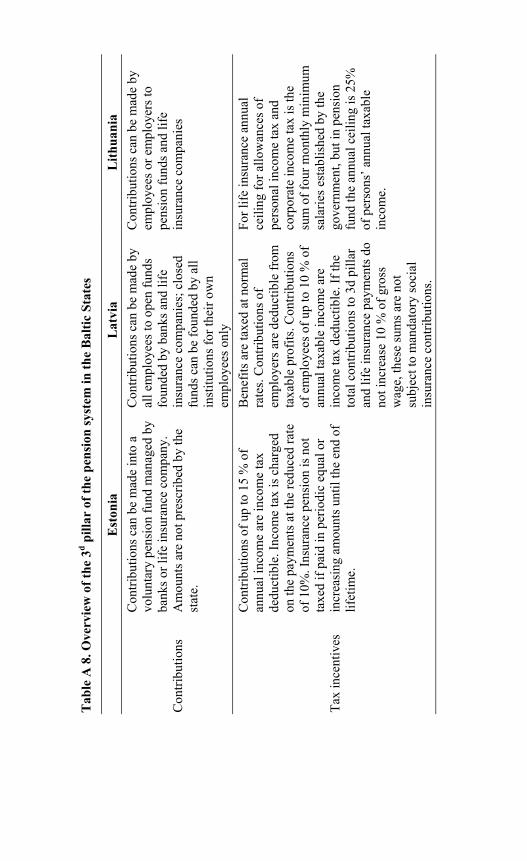
Tab
le A
8. O
verv
iew
of t
he 3
d pill
ar o
f the
pen
sion
syst
em in
the
Bal
tic S
tate
s
E
ston
ia
Lat
via
Lith
uani
a
Con
tribu
tions
Con
tribu
tions
can
be
mad
e in
to a
vo
lunt
ary
pens
ion
fund
man
aged
by
bank
s or l
ife in
sura
nce
com
pany
. A
mou
nts a
re n
ot p
resc
ribed
by
the
stat
e.
Con
tribu
tions
can
be
mad
e by
al
l em
ploy
ees t
o op
en fu
nds
foun
ded
by b
anks
and
life
in
sura
nce
com
pani
es; c
lose
d fu
nds c
an b
e fo
unde
d by
all
inst
itutio
ns fo
r the
ir ow
n em
ploy
ees o
nly
Con
tribu
tions
can
be
mad
e by
em
ploy
ees o
r em
ploy
ers t
o pe
nsio
n fu
nds a
nd li
fe
insu
ranc
e co
mpa
nies
Tax
ince
ntiv
es
Con
tribu
tions
of u
p to
15
% o
f an
nual
inco
me
are
inco
me
tax
dedu
ctib
le. I
ncom
e ta
x is
cha
rged
on
the
paym
ents
at t
he re
duce
d ra
te
of 1
0%. I
nsur
ance
pen
sion
is n
ot
taxe
d if
paid
in p
erio
dic
equa
l or
incr
easi
ng a
mou
nts u
ntil
the
end
of
lifet
ime.
Ben
efits
are
taxe
d at
nor
mal
ra
tes.
Con
tribu
tions
of
empl
oyer
s are
ded
uctib
le fr
om
taxa
ble
prof
its. C
ontri
butio
ns
of e
mpl
oyee
s of u
p to
10
% o
f an
nual
taxa
ble
inco
me
are
inco
me
tax
dedu
ctib
le. I
f the
to
tal c
ontri
butio
ns to
3d
pilla
r an
d lif
e in
sura
nce
paym
ents
do
not i
ncre
ase
10 %
of g
ross
w
age,
thes
e su
ms a
re n
ot
subj
ect t
o m
anda
tory
soci
al
insu
ranc
e co
ntrib
utio
ns.
For l
ife in
sura
nce
annu
al
ceili
ng fo
r allo
wan
ces o
f pe
rson
al in
com
e ta
x an
d co
rpor
ate
inco
me
tax
is th
e su
m o
f fou
r mon
thly
min
imum
sa
larie
s est
ablis
hed
by th
e go
vern
men
t, bu
t in
pens
ion
fund
the
annu
al c
eilin
g is
25%
of
per
sons
’ ann
ual t
axab
le
inco
me.

Tabl
e A
8 (c
ontin
uatio
n )
E
ston
ia
Lat
via
Lith
uani
a
Pens
ions
Paym
ent s
tarts
at t
he d
ate
agre
ed in
a
cont
ract
but
not
ear
lier t
han
at th
e ag
e of
55
Min
imum
age
is 5
5. A
vaila
ble
optio
ns: 1
) lum
p-su
m p
aym
ent;
2) th
e an
nuity
pol
icy
with
a
life-
insu
ranc
e co
mpa
ny is
pu
rcha
sed;
3) t
he a
ccum
ulat
ed
capi
tal i
s tra
nsfe
rred
to th
e St
ate
Soci
al In
sura
nce
Fund
an
d co
mbi
ned
with
the
1st
pilla
r
Paym
ents
can
’t st
art e
arlie
r th
an 5
yea
rs b
efor
e th
e 1s
t pi
llar p
ensi
on a
ge. A
vaila
ble
optio
ns: l
ump-
sum
pay
men
t; an
nuity
with
life
-insu
ranc
e co
mpa
ny is
acq
uire
d; th
e ac
cum
ulat
ed c
apita
l is p
aid
out
perio
dica
lly (a
t lea
st o
nce
in 3
m
onth
)
Sour
ce: V
anov
ska
2002
; Koi
vu 2
002;
Rau
dla
and
Stae
hr (2
004)
; MIS
SOC
(200
4)

Tab
le A
9. D
isab
ility
pen
sion
in th
e B
altic
Sta
tes
Dis
abili
ty p
ensi
on
Q
ualif
ying
con
ditio
ns
Ben
efits
La
tvia
3
year
s of i
nsur
ance
. G
rant
ed a
ccor
ding
to th
ree
cate
gorie
s of d
isab
ility
. C
ateg
ory
I: 0.
45 ti
mes
the
aver
age
wag
e in
3 c
onse
cutiv
e of
last
5 y
ears
, pl
us a
vera
ge w
age
times
ratio
of a
ctua
l con
tribu
tion
year
s to
tota
l po
ssib
le n
umbe
r of y
ears
bet
wee
n ag
e 15
and
retir
emen
t. M
inim
um is
1.
6 tim
es th
e m
inim
um st
ate
soci
al se
curit
y be
nefit
. C
ateg
ory
II: 0
.4 ti
mes
the
aver
age
wag
e in
3 c
onse
cutiv
e of
last
5 y
ears
, pl
us a
vera
ge w
age
times
ratio
of a
ctua
l con
tribu
tion
year
s to
tota
l po
ssib
le n
umbe
r of y
ears
bet
wee
n ag
e 15
and
retir
emen
t. M
inim
um is
1.
4 tim
es th
e m
inim
um st
ate
soci
al se
curit
y be
nefit
. C
ateg
ory
III :
Min
imum
stat
e so
cial
secu
rity
bene
fit (3
0 la
ts).
Esto
nia
Age
d 16
to 6
3 w
ith 1
yea
r to
14
year
s of i
nsur
ance
cov
erag
e or
cr
edite
d pe
nsio
nabl
e se
rvic
e de
pend
ing
on th
e ag
e of
pen
sion
cl
aim
ant.
Bas
ed o
n th
e ol
d-ag
e pe
nsio
n an
d co
rres
pond
ing
to th
e lo
ss o
f cap
acity
fo
r wor
k be
twee
n 40
–100
%.
Lith
uani
a D
isab
ility
invo
lvin
g ei
ther
pe
rman
ent o
r pro
long
ed in
capa
city
fo
r wor
k. D
epen
ding
on
age,
per
son
mus
t hav
e m
inim
al so
cial
insu
ranc
e w
ork
reco
rd.
Var
ies a
ccor
ding
to d
egre
e of
dis
abili
ty.
Sour
ce: S
ocia
l Sec
urity
Adm
inis
tratio
n. E
ston
ia; L
atvi
a; L
ithua
nia.
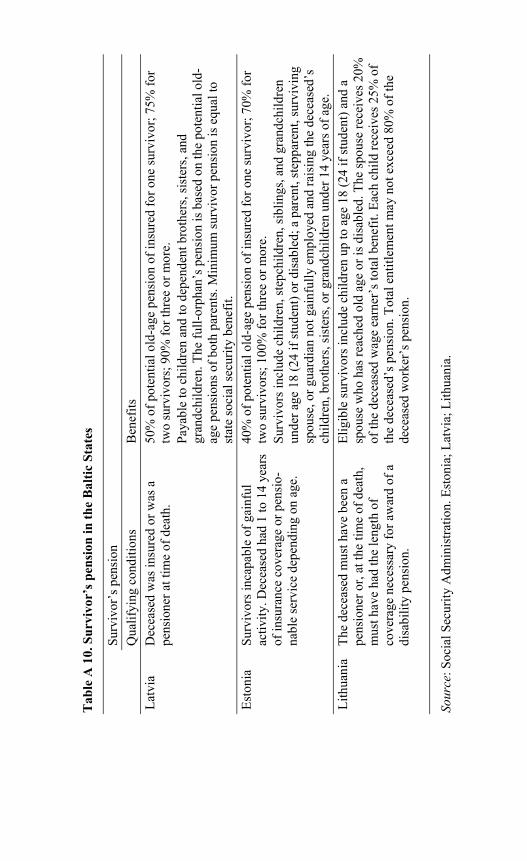
Tab
le A
10.
Sur
vivo
r’s p
ensi
on in
the
Bal
tic S
tate
s
Surv
ivor
’s p
ensi
on
Q
ualif
ying
con
ditio
ns
Ben
efits
La
tvia
D
ecea
sed
was
insu
red
or w
as a
pe
nsio
ner a
t tim
e of
dea
th.
50%
of p
oten
tial o
ld-a
ge p
ensi
on o
f ins
ured
for o
ne su
rviv
or; 7
5% fo
r tw
o su
rviv
ors;
90%
for t
hree
or m
ore.
Pa
yabl
e to
chi
ldre
n an
d to
dep
ende
nt b
roth
ers,
sist
ers,
and
gran
dchi
ldre
n. T
he fu
ll-or
phan
’s p
ensi
on is
bas
ed o
n th
e po
tent
ial o
ld-
age
pens
ions
of b
oth
pare
nts.
Min
imum
surv
ivor
pen
sion
is e
qual
to
stat
e so
cial
secu
rity
bene
fit.
Esto
nia
Surv
ivor
s inc
apab
le o
f gai
nful
ac
tivity
. Dec
ease
d ha
d 1
to 1
4 ye
ars
of in
sura
nce
cove
rage
or p
ensi
o-na
ble
serv
ice
depe
ndin
g on
age
.
40%
of p
oten
tial o
ld-a
ge p
ensi
on o
f ins
ured
for o
ne su
rviv
or; 7
0% fo
r tw
o su
rviv
ors;
100
% fo
r thr
ee o
r mor
e.
Surv
ivor
s inc
lude
chi
ldre
n, st
epch
ildre
n, si
blin
gs, a
nd g
rand
child
ren
unde
r age
18
(24
if st
uden
t) or
dis
able
d; a
par
ent,
step
pare
nt, s
urvi
ving
sp
ouse
, or g
uard
ian
not g
ainf
ully
em
ploy
ed a
nd ra
isin
g th
e de
ceas
ed’s
ch
ildre
n, b
roth
ers,
sist
ers,
or g
rand
child
ren
unde
r 14
year
s of a
ge.
Lith
uani
a Th
e de
ceas
ed m
ust h
ave
been
a
pens
ione
r or,
at th
e tim
e of
dea
th,
mus
t hav
e ha
d th
e le
ngth
of
cove
rage
nec
essa
ry fo
r aw
ard
of a
di
sabi
lity
pens
ion.
Elig
ible
surv
ivor
s inc
lude
chi
ldre
n up
to a
ge 1
8 (2
4 if
stud
ent)
and
a sp
ouse
who
has
reac
hed
old
age
or is
dis
able
d. T
he sp
ouse
rece
ives
20%
of
the
dece
ased
wag
e ea
rner
’s to
tal b
enef
it. E
ach
child
rece
ives
25%
of
the
dece
ased
’s p
ensi
on. T
otal
ent
itlem
ent m
ay n
ot e
xcee
d 80
% o
f the
de
ceas
ed w
orke
r’s p
ensi
on.
Sour
ce: S
ocia
l Sec
urity
Adm
inis
tratio
n. E
ston
ia; L
atvi
a; L
ithua
nia.