social studies collection 33 - edición digital home ... · with this study, the social studies...
TRANSCRIPT

Pres
enta
tio
n
33Social Studies Collectionno. 33
Colectivo ioé (Carlos Pereda, Miguel Ángel de Prada Walter actis)
Disability and Social Inclusion
Welfare ProjeCtS. the SPIrIt of ”la CaIxa”.

Social Studies Collection no. 33
Disability and Social Inclusion
Colectivo ioé (Carlos Pereda, Miguel Ángel de Prada Walter actis)

Publication:
”la Caixa” Welfare Projects
author:
Colectivo ioé (Carlos Pereda, Miguel Ángel de Prada and Walter actis)
translated by:
Jed rosenstein
Design and layout:
Cege
Coordination of publication:
Fellowship Programs and social studies
© Colectivo ioé (Carlos Pereda, Miguel Ángel de Prada, Walter actis)
© ”la Caixa” Welfare Projects, 2012
av. Diagonal, 621 - 08028 Barcelona
the Colectivo Ioé is an independent social research team formed in 1982 by the three authors of this study. since then they have been studying and analysing social transformation in Spain, particularly in the field of health and disability. They have published numerous papers and given courses in their areas of research. since 2008 they have also maintained the website, the Barómetro Social de España [social Barometer of spain]. the Colectivo Ioé has worked for different national and international, public and non-profit institutions and has served on the boards of the following journals: Documentación Social, Revue Européenne des Migrations Internationales; Revista de Educación; Cuadernos de Trabajo Social; and RECEI, Revista Científica de Estudios sobre Interculturalidad [Scientific Journal of Studies on interculturalism].
CarLos PereDa oLarte has a degree in political science and sociology from the Universidad Complutense de Madrid and did graduate work in Paris.
MigUeL ÁngeL De PraDa JUnQUera has a degree in political science and sociology and a degree in information sciences from the Universidad Complutense de Madrid.
WaLter aCtis MaZZoLa has a degree in political science and sociology from the Universidad Complutense de Madrid.
Pres
enta
tio
n
Presentation
one of the best indicators of the level of development reached by a society is its ability to successfully integrate persons with different levels of functioning, offering them opportunities to lead a fulfilling life free from discrimination.
the presence of individuals or groups with different types and degrees of disability, who have problems carrying out certain daily activities and in participating in social tasks and situations, raises an important challenge. While traditional approaches have focused on rehabilitating those affected, the approach today is more comprehensive. this new perspective includes offering technical assistance and adapting environments so that persons with disabilities can function effectively.
adaptation refers not only to improving physical access and eliminating physical barriers, but it also means changing social attitudes toward persons with disabilities and developing comprehensive social services and benefits. The intention is to facilitate the integration of individuals with certain functional limitations into adult life, without forgetting the indispensable help of those who provide care and assistance – generally the family.
Great strides have been made in this field in recent decades. The number and type of actions taken have multiplied and, since 2006, the Dependency Law has reinforced this effort. However, given the current serious economic crisis we must be vigilant; the assistance being provided to those who live with limitations must be extended and improved, but the future sustainability of what has already been achieved must also be assured.
the study we present here is not only opportune, but necessary. the authors provide a detailed analysis of disabilities in spain. Based on data from the Disabilities, independence and Dependency situations survey (2008), they provide information on the extent and characteristics of disabilities and compare the current situation with that of a decade ago.
in addition, special attention is given to the systems for integrating persons with disabilities into adult life: education and training, participation in the labour market and other sources of income, family relationships and friendships and, lastly, degree of involvement in associations and leisure time activities. the study closes with an assessment of the evolution and current status of
Pres
enta
tio
n
disability in spain, followed by proposals for action based on this data.
With this study, the social studies Collection of the ”la Caixa” Foundation intends to provide information for reflection on the conditions and needs of persons with disabilities. Based on the indicators provided and a more accurate picture of the situation of those with disabilities, we can evaluate the improvements of recent years, but also define the road that lies ahead and the challenges faced by this social group. only through such analysis
will it be possible to take the steps needed to guarantee the sustainability of social protection systems, leading to a more egalitarian society.
jaime lanaspa Gatnauexecutive Director of ”la Caixa”
social Projects and Chief executive officer of the ”la Caixa” Foundation
Barcelona, January 2012

intr
oD
UC
tio
n
introDUCtion
this study describes the situation of a broad social sector (almost one-tenth of the population in Spain), whose definition has been the subject of much debate: in recent decades referred to successively as ‘the handicapped’, ‘the disabled’, ‘persons with disabilities’ and ‘persons with functional diversity’. our main objective is to examine the ways that persons with disabilities are integrated into society, placing the information they have provided in a comprehensive framework including their individual lives as well as the social historical and institutional context in which they live.
Building on the latest official macro-survey on disabilities carried out by spain’s national statistics institute (ine) in 2008 and available for analysis since 2010, we have systematised the information available on the prevalence and characteristics of disabilities, the factors that trigger them and the forms of treatment. in addition, we address the paths of socialisation and the social and economic integration of this group, specifying, where possible, the circumstances involved, as well as changes that have taken place in the last decade (using data from the previous 1999 macro-survey). the main dimensions we examine
are education and occupational level, economic activity (employment and unemployment, housework, pensions and other economic benefits, etc.), family life, friendship networks and associative activity. We also give special attention to the three million persons that provide care to persons with disabilities – the majority, women taking care of persons in their own families.
along with the descriptive panorama regarding disabilities, we examine the contexts that have the greatest impact on the integration of persons with disabilities. among these we look at the following: changes in the family, gender roles and the provision of care; the economic juncture and the labour market, which has entered into a period of deep crisis in recent years, and the impact of general and specific social policy, in particular the Dependency Law passed in 2007 and its development up to the present through the system for autonomy and Care for Dependency (SAAD). The final chapter includes some proposals that emerge from this study and which could help in better planning the policies that affect this sector.

intr
oD
UC
tio
n
Different approaches to disability
the history of how differences in functioning – both physical and psychological – have been treated in different cultures from antiquity until the present illustrates the plurality of responses to what are apparently common phenomena.1 Within Western culture we find a non-linear evolution from a religious/demonological conception, essentially based on segregation and stigmatisation, to a medical conception, focused on treatment and rehabilitation, and finally, to a social model, which considers the causes of disabilities to be the same as those that lead to social exclusion in other areas of life.
this new orientation originated in the treatment of individuals with mental disabilities, precisely those who had the greatest difficulties in integrating into society. Leadership was provided by the american association on Mental retardation (currently the american association on intellectual and Developmental Disabilities), which designed a new form of classification and treatment whose central idea was ‘approaching the construct of mental retardation not as an absolute trait expressed solely by the person, but as an expression of the functional impact of the interaction between the person with limited intellectual and adaptive skills and that person’s environment’ (schalock, 1995: 13).
in the 1960s the ‘model of independent living’ emerged in anglo-saxon countries, promoted by persons who had disabilities, who ‘see themselves as human beings oppressed by social, political,
1 on the history of disabilities, see, among others, aguado, 1995; Foucault, 1976; Dörner, 1974 and rosen, 1974.
economic and cultural structures; human beings that want to live actively and, as a result, definitively reject the social role traditionally assigned to them (the role of ‘patients’), in order to become “agents”, actors or protagonists in their own lives’ (arnau, 2009: 77-78). the main institutional expression of this movement was the Disabled Peoples’ international (DPi), established in 1981 in open confrontation with the rehabilitation international (ri), a body of professionals in the field of treating disabilities with an individualistic and medical focus (Driedger, 1989).
in europe, this social focus was also promoted by authors that defended the importance of providing individuals with functional differences with ‘confidence, practical and intellectual skills, and opportunities necessary to live outside institutional settings’ (Barnes, 1990). it was about replacing traditional labels, based on quasi- natural and unchanging parameters, with a diagnosis of the contributing elements that occur in each case and the support needed by each person to achieve a normalised integration, under conditions of equality with others (Barnes and Mercer, 2003; abberley, 2008).
it was oliver (1990) who coined the expression ‘the social model of disability’ to critique an understanding of disability based on classifying, stigmatising and integrating a significant part of the population into a circuit of specialised institutions and services. For rosato and angelino (2009), implicit in the concept of deficient is the concept of normal, and the social production of what is normal is concomitant with the social production of what is deficient. social conditions modify and explain processes of inequality in the health sphere as well as in the distribution of income, working conditions and citizen participation, which implies the
intr
oD
UC
tio
n
need to ‘introduce eco-social variables to explain the aetiology of disabilities’ (ravaud et al., 1994: 142).
in spain, in addition to the institutional bibliography,2 there has been significant debate regarding theoretical issues – debate in which both academics and networks of persons with disabilities have participated and whose results can be followed in different publications and websites.3 For our part, in 1998 the Colectivo ioé, along with CiMoP, and on behalf of inserso, carried out an extensive – fundamentally qualitative – exploratory study through focus groups and life-stories on the processes of social inclusion and exclusion of persons with disabilities. this study provided us with a general picture of the attitudes and opinions of the spanish population. the picture included four interrelated positions – which we refer to as traditional, clientelist, competitive and alternative – that allow us to explain the most common approaches and behavioural patterns in spanish society at that time regarding disabilities (Colectivo ioé and CiMoP, 1998).
an issue which has been closely examined in spain is the manner of understanding and defining those persons whose functioning and body structures present a significant deviation from the statistical norm of the population. this collective, as already mentioned, has been referred to by many names throughout history, which have been questioned one after another. the terminology which has been used includes ‘incapacity/invalidity’, still used in the work sphere; ‘handicapped’, a central concept
2 aside from different studies based on the 1986 and 1999 macro-surveys, those promoted and carried out by the Real Patronato de Personas con Discapacidad should be emphasised, as well as the study elaborated by the Consejo económico y social [economic and social Council (Ces)] (2004).
3 see DisCatiF; siiD; CeDD; saaD; and the observatorio estatal de la Discapacidad, of spain’s Ministry of Health and social Policy. two recent books on the issue should also be mentioned: rodríguez, 2011 and Ferreira, 2010.
when the existing Law on the Social Integration of the Handicapped [Ley de integración social del Minusválido (LisMi)] was approved in 1982; ‘disability’, introduced by the World Health organization (WHO) – and used – in the classificatory systems of 1980 and 2001, although with different meanings; and, most recently, ‘functional diversity’, an expression proposed in 2005 by the independent Living Forum and which has achieved significant acceptance among some specialists (Palacios and romañach, 2006).
this new expression refers to the philosophical and ideological principle that the functioning and capacities of individuals differ and that these differences must be accepted as the basis for living together in equality, just as occurs with other differences (sex, ethnicity, etc.): ‘Persons with functional diversity can contribute to the community just as other men and women without functional diversity, but always from a position valuing and respecting their condition as different persons.... this model calls for the autonomy of individuals with functional diversity to make decisions regarding their own lives, and in order to do this, it focuses on eliminating any barriers to equal opportunity’ (Palacios and romañach, 2008: 38). this is an approach linked to the anglo-saxon tradition of the model of independent living and the Disabled Peoples’ international that we have already mentioned. as pointed out in their manifesto in spain, ‘there are no disabled persons, only societies that are inaccessible to those who are different’.4
4 Manifesto for the First March for the Visibility of Functional Diversity, which took place in Madrid, 15 september 2007, organised by the Foro de Vida independiente. Various feminist groups joined the march which, together with the Foro, organised a conference in the Casa Pública de Mujeres eskalera Karakola. the presentations from this conference were published by the agencia de asuntos Precarios todas aZien and the Foro de Vida independiente (2011).

intr
oD
UC
tio
n
some authors have seen this new term – functional diversity – as a form of ‘linguistic protection’ from other terms that are insulting or stigmatising: ‘in the face of criticisms that have befallen the traditional concepts (disability, handicap, incapacity), but above all the discomfort of those who classify and the resistance of those who are classified, the paradigm of diversity seems to have come to the rescue’ (almeida et al., 2010: 31) (the expression, ‘linguistic protection’, applied to the successive names of this group comes from Veiga, 2001). For these authors, the concept of ‘functional diversity’ is a new euphemism ideologically related to liberal multiculturalism and which may conceal power relations and the processes of production of differences and exclusion that continue to be a part of social practices: ‘as if the world is a type of multicultural kaleidoscope where individuals with a diversity of experiences live in harmonious celebration of these differences. [...] However, “diversity” hides social actors that construct their differences in fields mined with conflicts and power relations. in other words, the processes of naturalisation and political correctness erase the traces of concrete historical processes that produce differences’ (almeida et al., 2010: 32-36). according to other authors, this new social focus emerged in the anglo-saxon context from different contributions and rapidly distanced itself from functionalist and social interactionist theories (a brief review of the different currents of this ‘social focus’ can be found in oliver, 1998).
in a more conciliatory tone, Ferreira suggests that the new concept of functional diversity ‘is an ideological tool that this group itself has decided on in order to assert itself against terms and concepts imposed from the outside and to fight against its own discrimination. From this position we must then determine
the cornerstones on which to re-locate our understanding of disability and develop adequate practices’ (Ferreira, 2010: 59). this new term is a relative advance, but remains inadequate in the sense that it continues to be, implicitly, based on a division between a different body and certain condition of normality, from which this body deviates.
in this book, we will generally use the concept of ‘disability’, consistent with the current official definition in Spain. This definition includes all persons with important limitations in carrying out the activities of daily life in the absence of assistance. However, we take into account the new approach of the WHo and the criticisms raised by the Disabled Peoples’ international (in spain, the Foro de Vida Independiente) in order to refine or reinterpret some of the conclusions that arise from this definition. in any case, we emphasise the relative nature of these terms and share the aspiration of Colin Barnes, a key author on the social model, that ‘both disability and unequal social and economic development on a global level will only be of historical interest’, in other words, that they will be replaced by social relations based on cooperation and social justice (Barnes, 2010: 22).
the most recent macro-survey on disabilities. Methodological notes
our primary source of information is the Disabilities, independence and Dependency situations survey (DiDss-2008), carried out in successive stages between the fourth quarter of 2007 and the first quarter of 2008, and available for analysis since 2010. This is
intr
oD
UC
tio
n
the third macro-survey coordinated by spain’s national statistics institute (ine) to obtain a precise picture of the population with disabilities; the previous surveys were in 1986 and 1999. this is the most extensive survey to be carried out in spain, with a preliminary survey of several hundred thousand persons, which served as a filter for subsequent interviews with persons with disabilities. the questionnaire contains over 600 questions and is considerably complex, as the number of limitations and impairments varies greatly in each case; in addition it includes a wide battery of questions on the history, living conditions and opinions of the individuals surveyed.
The DIDSS-2008 first gathered information on 271,000 individuals (questionnaires used in 96,000 households and in 800 residential centres) and subsequently focused on the target population (specific questionnaires used with 23,000 individuals with disabilities of six years of age and older, and from 0 to five years of age). it should be noted that the household questionnaire gathers data regarding the general population, such as household income or individuals in the household with disability certificates, etc., which are of great interest in the comparison of households with and without persons affected by disabilities. in addition, a complementary questionnaire was used for the principal caregivers of persons with disabilities in three quarters of the corresponding households.
The sample design of the different surveys, the precise definition of their variables and the fieldwork method is explained in detail in the methodological report on the DiDss-2008, and can be
consulted on the ine website.5 the comprehensiveness of the filtering surveys and the final surveys aimed to ensure a sufficient degree of reliability in the results, broken down into important groups geographically (down to the provincial level) and based on the diverse characteristics of the population being studied. on the ine website, the report on ‘sampling errors’ includes seven tables which provide the margin of error for the main results of the survey (the variance or coefficient of variation, in percentages, of the estimator of a specific characteristic). The margin of error was calculated based on the Jack-knife method and determines the confidence interval within which – with a probability of 95% – the true value of the estimated characteristic is found. on our part, we have followed the ine recommendation of not considering data from populations of less than 5,000 persons, as they may have a high sampling error.
the DiDss-2008, analysed in detail from micro data,6 is a comprehensive and representative source of data from a statistical perspective, but with certain limitations that should be taken into account. First, by not using the same definitions as in the earlier surveys, comparison is difficult. This is particularly true in regard to the first survey in 1986, which defined certain very common limitations among the elderly as disabilities and as a result practically doubled the population of the group being studied. When the second survey (1999) did not take these limitations
5 the sample design has increased the representation of certain segments of the population (for example, households which include minors) with the goal of increasing the reliability of the corresponding results. the final calibration of the elevation factors of the sample has been carried out through the CaLMar framework of the spanish and French national statistics institutes (ine and insee, respectively).
6 the ine presents the micro data corresponding to the different questionnaires separately. to facilitate joint analysis of the data in an sPss programme, we have pooled the micro data corresponding to the questionnaires on households, disabilities and primary caregivers in one file. if not specifically indicated, our data on the population with disabilities refers to all those person of 6 years of age or older that responded to the questionnaire on disabilities.

intr
oD
UC
tio
n
into consideration, particularly ‘not being able to run fifty meters in double time’ – which affected four million individuals – the size of this group decreased from 15% to 9% of the general population, in a period when the clear trend toward the ageing of the population should have translated into a significant increase in the population with disabilities. Based on a comparative study of the 1986 and 1999 surveys, based on the evolution of seven important disabilities, an overall increase of 43% between those years was verified (Jiménez et al., 2001: 86-89 and Jiménez et al., 2003: 30-39).
a second limitation of the DiDss-2008 is that the conceptual basis of the survey does not adequately take into account the new system established in 2001 by the WHo to classify functioning and disability (WHo, 2001); instead, it continues to be anchored in some of the approaches of the old WHO classification (WHO, 1983). as a result, disabilities are understood as the negative and lasting consequences of an initial traumatic moment (illness, accident or other health disorder), which leads to a triple sequence of organic (impairments), functional (disabilities themselves) and social (handicaps) effects. the DiDss-2008, as with the two previous surveys, only accurately reflects that initial moment (illness, accident or other health disorder) and the two first sequences of classification (impairments and disabilities) and barely includes elements of the third (handicaps). In this way, the quantification of impairments and disabilities permits us to establish an objective and hierarchical classification on the level of the individual, but without including social factors (either environmental or personal) involved in the process, particularly the strategies adopted by the individuals affected, by their families and other agents and institutions that address disabilities. However, the DiDss-2008
includes enough complementary information on the situation of respondents (education, employment, social relations, health care, assistance received, discrimination experienced, etc.) to assist us in composing a picture of the processes of social inclusion and exclusion associated with disability.
The 2001 WHO classification broadened the concept of disability to refer to any alteration in an individual’s state of health that can generate pain, suffering or interference with daily activities. Well-being includes multiple dimensions, one of which is health, within which we find the complementary concepts of functioning and disability: ‘Functioning is a generic term for body functions, body structures, activities and participation. it denotes the positive aspects of the interaction between an individual (with a health condition) and that individual’s contextual factors (environmental and personal factors)... Disability is an umbrella term for impairments, activity limitations and participation restrictions. it denotes the negative aspects of the interaction between an individual (with a health condition) and that individual’s contextual factors (environmental and personal factors)’ (WHo, 2001: 231). This new classification includes – like two sides of the same coin – both the positive and negative aspects of the person’s state of health and explicitly refers to the contextual factors which impact on their ability to realise themselves, whatever their health condition.
Lasting alterations of health that affect functioning continue to be called disabilities and include three levels, reminiscent of the earlier classification: the body (impairments of bodily structure), the individual (limitations of activity) and the social (limitations of opportunities to take part in society on an equal level with
intr
oD
UC
tio
n
others). However, the major change is that contextual factors (environmental and personal) are considered and are decisive in explaining the degree of functioning or disability of persons at all stages. a dialectic is introduced between both aspects in such a way that if functioning (performing and participating in the activities of daily life) exists, there is no disability (limitations of activity and restrictions in participation). thus, the old approach – which labelled individuals for life by determining that they had a disability regardless of whether or not they had the resources, techniques or support necessary to carry out specific activities – is overcome.
the DiDss-2008 maintains the old system and continues to consider that ‘a person has a disability, even if the disability is overcome with the use of external technical assistance or with the assistance or supervision of another person’ (ine, 2010: 34).7 this results, as we will see, in the incongruous situation of more than 600,000 individuals in Spain being certified as ‘disabled’ and receiving the corresponding benefits (according to the DIDSS household survey), although they no longer have any disability. in addition, the number of persons with disabilities would significantly decline if we took into account that the degree of severity of their disabilities becomes moderate or disappears in 43.5% of the cases thanks to the technical and personal assistance they receive.
The new International Classification of Functioning, Disability and Health (iCF) incorporates into the concepts of activities and participation, not only the traditional activities of daily life, which are focused on the micro-context of the individual (aptitudes
7 the DiDss, as with previous macro surveys, establishes an exception in the case of visual impairments, which are not considered disabilities when they are corrected through the use of glasses or contact lenses.
or skills to carry out daily activities), but also activities which involve effective participation in social life: such as in the areas of education, work, community, political participation and human rights, expressly including the ‘right to self-determination or autonomy and the right to control over one’s own destiny’. the typology of disabilities in the DiDss-2008 coincides closely with the five types from the ICF (communication, mobility, self-care, domestic life and interpersonal interactions); three types from the DiDss-2008 (vision, hearing and learning and applying knowledge) are concentrated in one type in the iCF (learning and applying knowledge); and the iCF includes three new types not included in the DiDss-2008: general tasks and demands, major life areas, and community, social and civic life. if these activities were included in defining disability, the number of disabled persons would increase significantly.
The WHO classification also incorporates ‘the physical, social and attitudinal environment in which people live and conduct their lives’. among the environmental factors are products, technology, available facilities, environmental conditions, personal relations and support, attitudes, ideologies and prejudices in the larger population, and services, administrative systems and general policies at the local, regional, national and international levels.
A third limitation of the DIDSS-2008 is that it does not sufficiently take into account new theoretical developments based on the ‘social model’ that has been developing in recent decades and which is attempting to overcome the stigmatising perspectives of the past, such as the medical or healthcare bias of the models proposed by the WHo, although it must also be recognised that these have marked an important advance in many ways.
intr
oD
UC
tio
n
Structure of the study
The first three chapters provide a general overview of the population with disabilities in spain and developments in the past decade. among other issues, we address the prevalence and characteristics of each type of disability and impairment, the triggering factors and the measures adopted to address them. in addition, we present a comparative analysis of persons with disabilities, persons with officially recognised disabilities and those that have benefited from the System for Personal Autonomy and Care of Dependent Persons (saaD), segments of the population that often overlap. The analysis will look at the most significant differences based on sex, age, household socio-economic level, habitat (rural or urban), region, national origin, etc.
the fourth chapter provides a picture of the three million persons that provide care (the majority, women providing care within their own families) to the 60% of persons with disabilities who need personal assistance. Based on a typology of the persons that provide care, we describe the tasks they carry out and the main problems and needs they have, as well as the importance of this group in the application of the Dependency Law.
The fifth chapter analyses the education level attained (or in progress) in the population with disabilities. as only a minority acquires a disability before reaching 16 years of age, it follows that the low level of education in this group in comparison to the general population (almost half have not finished primary education) is not due specifically to disability, but to the fact that the majority come from homes with low levels of education and income.
Chapter six analyses the economic activity of working age persons with disabilities. this includes paid employment, which only 28% of this population had at the time of the DIDSS-2008 survey, pensions (41% and the majority, men) and housework (34% of women). In particular, we describe the changes which occur at the onset or worsening of disability, access to normal and sheltered employment, the main branches of activity and occupations, working conditions, the situation of unemployed persons with disabilities (a rate more than twice that of the general population), the causes for the low rate of economic activity, and the specific situations of those who receive pensions and who do housework.
Chapter seven provides an analysis of social relations, participation in associations and leisure activities, paying particular attention to family relations and discrimination in interactions with other persons.
The final chapter offers a summary of the main results of the study and some proposals to not only improve the living conditions of persons with disabilities but also to highlight general policies of a preventive nature that could have an impact on the contextual factors (environmental and personal) that cause disability and social exclusion.

PreV
aLe
nC
e a
nD
ty
Pes
oF
Dis
aBi
Lity
in s
Pain
Based on the criteria established by spain’s Instituto Nacional de Estadística (ine) [national statistics institute], the most recent survey on Disabilities in spain (2008) showed that 3.8 million people, or 8.34% of the population, have some type of limitation.1 If we compare these figures with those from the previous INE survey, which was carried out in 1999, there are 320,000 more persons with disabilities; however, the percentage out of the total population has decreased by more than half a point, from 8.99% to 8.34%, due to a population increase of nearly 7 million persons (more than 75% immigrants, who are slightly younger on average and have fewer disabilities than the native population).
It is difficult to evaluate if the relative decrease in the number of persons with disabilities between 1999 and 2008 is the result of a real trend or due to changes in the definition of certain disabilities and changes in the survey questionnaire, as will be seen. nevertheless, there are fewer differences than there were between the surveys of 1986 and 1999, when the percentage of
1 as we explained in the introduction, the Disabilities, independence and Dependency situations survey (DiDss) establishes its own definition of “disability”, which does not coincide with the conceptual framework of the World Health organization.
persons with disabilities declined from 14.98% of the population to 8.99% due to changes in methodology.
1.1. tyPeS of DISabIlIty
the 2008 survey includes 44 disabilities or ‘important limitations in carrying out everyday activities’. on average, persons with disabilities are affected by eight limitations, which means that they can carry out the 36 remaining capacities or faculties normally, which allows them to compensate for those limitations. in 1999, there was an average of six types of disability per person (two less than in 2008). the increase since then is related to ‘the continuous decreasing trend of mortality rates, which has caused not only an increase in life expectancy, but also an increase in the rates of impairment and disability that reflect a change in the relationship between morbidity and mortality’ (ine 2010: 53). Health sciences have been able to extend people’s lives – lower mortality rates – at the cost of higher morbidity rates (higher rates of disease, health problems, impairments and disabilities in those additional years of life).
i. PreVaLenCe anD tyPes oF DisaBiLity in sPain

PreV
aLe
nC
e a
nD
ty
Pes
oF
Dis
aBi
Lity
in s
Pain
However, having a disability does not mean not being able to carry out the activity corresponding to the limitation (seeing, hearing, getting dressed, going out of the home, etc), which only occurs in a minority of cases (not seeing at all, not hearing at all, depending completely on others to get dressed or go out, etc). except in a minority of cases (normally at an advanced age or with severe mental impairment), disabilities represent partial limitations that need not prevent a normal and healthy lifestyle. What can cause equal or even greater problems are social limitations, such as a lack of education, employment or basic rights of citizenship, which are considered ‘disabilities’ by the World Health organization (WHo) when they are associated with some type of impairment or health problem (WHo, 2001: 177-186); these, however, are not included in the survey conducted in spain.
The classifications used in the 2008 survey are similar to those used in 1999, which allows us to compare the evolution of the prevalence of disability in the past decade: the ten main categories of disability in 1999 became eight in 2008 by combining three categories of disabilities related to mobility into one (the number of specific mobility disabilities continues to be nine, with minor changes in this survey of little importance); visual and hearing impairments remain almost identical; disabilities related to communication, self-care, and interpersonal interactions and relationships have increased in number, and their concrete content has changed significantly; those related to learning include the same four limitations, but have changed significantly in content; finally, disabilities related to home life have been reduced from five to three types, two remaining the same (acquisition of goods and services and preparing meals) with three others merging (washing and ironing, cleaning the house, taking care of the family) into ‘doing housework’.
graph 1.1 shows the number of persons with each type of disability (eight general categories), revealing which are the most common and their prevalence by age.
GraPh 1.1: number of persons affected by type of disability, by age
0 100 200 300
65 y más años
16-64 años
6-15 años
Relaciones personales
Aprendizaje
Comunicación
Visión
Audición
Autocuidado
Vida doméstica
Movilidad
65 and over16-64 6-15
6-15 años 16-64 años 65 y más añosMovilidad 26,300 902,800 1.615,000Vida doméstica 11,900 693,200 1.390,200Autocuidado 34,200 504,900 1.295,500Audición 11,700 291,300 761,600Visión 10,400 295,600 673,200Comunicación 46,900 247,800 442,500Aprendizaje 43,300 217,700 369,100Relaciones personales 23,400 280,200 317,300
0
PERSONAL RELATIONSHIPS
LEARNING
COMMUNICATION
VISION
HEARING
SELF-CARE
HOME LIFE
MOBILITY
1,000,000 2,000,000 3,000,000
1.1.
note: a person may be in more than one category.source: Based on the Disability, independence and Dependency situations survey, 2008 (DiDss).
in the next section we present the main types of disability, highlighting their prevalence by sex, age group and region. We will also examine some of the characteristics related to social integration and integration into the labour market of persons with disabilities of working age (16-64 years of age).

PreV
aLe
nC
e a
nD
ty
Pes
oF
Dis
aBi
Lity
in s
Pain
1. VISual
this category includes four disabilities that affect a total of nearly one million people, two-thirds of whom are over 64 years of age. Visual impairments are more common in extremadura (with a prevalence rate of 55% above the Spanish national average), while the lowest prevalence rates are found in the Balearic and Canary Islands (37% below the average in each of these regions). there are three basic types of visual disability: • Total blindness in both eyes, which affects 58,000 people or
0.13% of the total population (0.11% men and 0.15% women): In comparison to ten years ago, the prevalence of total blindness has decreased significantly (0.15% in 1999).
• Inability to perform detailed visual tasks, defined as any ‘difficulty in seeing words and letters of a newspaper even when wearing glasses or contact lenses’2: this is the most common visual impairment and affects 673,000 people (nearly twice as many women as men, 1.99% compared to 1.11%). The prevalence in 2008 is similar to that found in 1999.
• Inability to perform overall visual tasks, defined as ‘difficulty in seeing someone’s face from across the street (4 metres) even when wearing glasses or contact lenses, including those who are blind in one eye and who do not have problems with the other eye’. this condition affects 662,000 people and is more prevalent in women, as with the previous case. its prevalence has increased in the past decade from 1.35% to 1.53% of the total population.
one per cent of the population between 16 and 64 years of age has visual disabilities, of this group only one out of twenty is totally blind (14,000 persons, or 0.05% of this age group). However, approximately 200,000 have serious difficulties with detailed or overall visual tasks.
2
2 text in quotes is taken directly from the questionnaire used in the 2008 survey on disabilities.
2. hearInG
this category includes three disabilities that affect over one million persons; of these, 72% are over 64 years of age. The regions with the highest prevalence of hearing problems are Castilla y León and Extremadura (66% and 39% above the national average), and those with the lowest prevalence are Cantabria and the Balearic Islands (42% and 37% below the national average). there are three basic types of hearing impairment:• Total deafness is the most serious hearing impairment
and affects practically the same number of people as total blindness: 60,000 persons or 0.14% of the population, but has decreased dramatically since 1999, when the prevalence was almost double (0.26%). By sex, total deafness affects men and women equally.
• Severe difficulty in understanding speech (‘to understand what is said in a conversation with various people without a hearing aid or other type of external hearing device, including those who are deaf in one ear but who do not have problems with the other ear’) is much more common and affects almost one million people, especially women (2.3% compared to 1.9% of men). This type of partial deafness has increased significantly in the past decade, from 2.1% to 2.6% of the population.
• Inability to hear loud sounds, such as sirens, alarms, etc. without a hearing aid or other type of external hearing device affects nearly 400,000 people and is the type of hearing impairment that has increased the most since 1999, when there were 230,000 people affected. this type of impairment also affects women more than men.
among the working age population there are nearly 300,000 people affected by hearing impairments (0.9%), with a slightly higher incidence among men than among women. in this age group, there are 12,000 men and 9,000 women who are totally deaf.

PreV
aLe
nC
e a
nD
ty
Pes
oF
Dis
aBi
Lity
in s
Pain
3. CoMMunICatIon
this category includes six disabilities that affect 737,000 people (1.8% of women and 1.6% of men). The typology has changed significantly in comparison to the 1999 survey, when there were four types. therefore, it is difficult to evaluate if the increase in prevalence since then (from 1.3% to 1.7%) is due to changes in methodology. in general, this category includes problems with speech such as complete absence of voice (muteness) or stuttering, or others related to the ability to produce spoken or written language or to communicate through gestures or other devices such as the telephone. these limitations may have various origins, including mental disorders that prevent the individual from communicating with others. By region, these types of disabilities are more common in Galicia (49% above the national average) and less frequent in Cantabria and the Canary Islands (29% and 28% below the national average).
among 16 to 64 year olds, limitations in communication affect a quarter of a million persons, with a frequency among men (1%) almost twice as high as among women (0.6%). Among the different disabilities, the most common in this age group are difficulties in the ability to express or understand written language (160,000 people), carry on a conversation or an exchange of ideas with others due to some form of mental impairment (154,000), and speaking in an understandable way without the use of external devices (also 154,000).
4. learnInG, aPPlICatIon of knoWleDGe anD DeVeloPMent
of taSkS
this category refers to significant limitations in acquiring or applying knowledge due to problems of a cognitive or intellectual nature (developmental delay, dementia, mental illness). the prevalence of these disabilities in 2008 (1.45% of the population, 630,000 people) was the same as that registered in 1999. By region, these types of disabilities are more common in Galicia (47% above the national average) and less frequent in Madrid and La Rioja (24% below the national average in both of these regions).
the types of learning disabilities include the following:• Intentional use of the senses; that is, individuals who have difficulties
concentrating when watching or listening. this affects 287,000 people or 0.7% of the population.
• Problems with basic learning: when “an individual has significant difficulties in learning to do simple tasks such as copying, reading, writing, adding or subtracting, or learning to use every day objects and utensils due to a cognitive problem’. this affects 434,000 persons or one out of a hundred.
• Carrying out simple tasks without assistance, ‘for example, getting something out of a closet, pouring a glass of water...’: 320,000 persons are affected.
• Carrying out complex tasks without assistance, ‘for example, running an errand, going to an appointment...’: this is the most frequent disability in this category and affects 526,000 persons. This disability, like the three previous ones, affects women (1.7%) much more than men (1.2%).
one-third of the population with disabilities related to learning, the application of knowledge and development of tasks are of working age (16-64 years of age). this inevitably limits their possibilities of integrating into the labour force, at least in the ordinary labour market. although in the general population these types of disabilities affect women more than men, among the working age population there is a higher prevalence among men (0.8%, compared to 0.6% among women).


PreV
aLe
nC
e a
nD
ty
Pes
oF
Dis
aBi
Lity
in s
Pain
• Taking care of parts of the body, “for example, combing one’s hair, cutting one’s nails...”: Persons who are unable to do these self-care tasks often have the previous disability. there are 1.2 million persons with this type of disability.
• Getting dressed and undressed: There are over one million persons with problems carrying out these tasks (2.3% of the population). this disability was defined in almost the same way in 1999 and at that time affected 1.5% of the population, revealing a considerable increase in the past decade.
• Looking after one’s own health: following medical prescriptions. this disability, recognised for the first time in spain, refers to those who have ‘significant difficulty in following medical prescriptions without help and supervision, for example, taking medication correctly, following a specific diet, going to the doctor...’; 865,000 persons are affected, and of these, 193,000 are of working age (in this age group the majority are men).
Half a million persons of working age have difficulties with self-care, with a similar prevalence among men (1.5%) and women (1.7%). However, with the population 65 years of age and over the prevalence among women (20.5%) is almost double that of men (12.1%).
3
3 the tasks included in this type of disability are especially affected by the unequal division between men and women of domestic labour and the provision of care. However, the DiDss 2008 only considers a disability to exist when the potential difficulty in carrying out a corresponding task has its origin in an impairment.
7. hoMe lIfe: DIffICultIeS DoInG houSeWork
this category groups household tasks into three types, in contrast to the 1999 survey, which distinguished five different tasks. overall, this is the second most common block of disabilities, with a prevalence rate of 4.8% (over two million people) and a much higher incidence among women (6.8%) than men (2.9%).3 three out of four persons with these limitations are 65 years of age or over (and one out of three over 80). By region, their prevalence is greater in galicia and asturias (42% and 21% above the national average), and lower in La Rioja and Madrid (31% and 25% below the national average). With respect to the data from 1999, these disabilities have increased significantly: from 4.2% to 4.8% (from 1.6 million to 2 million persons). The three types are listed below in order of frequency: • Acquisition of goods and services: when one has ‘significant
difficulty in planning, going shopping and carrying shopping home; for example, buying clothes, food, household products...’. this is the most common disability cited among the 44 included in the survey. It affects 1.87 million people; 71% of whom are women. this disability was the third most common in 1999, after ‘mobility outside the home’ and ‘cleaning the house’ (now included in the category ‘doing housework’).
• Doing housework, ‘for example, cleaning, washing clothes, using appliances’: this disability affects 1.67 million people; the vast majority are women (72%), just as with the previously examined disability.
• Preparing meals: This limitation affects 1.2 million persons; 66% are women.
among the working age population, disabilities related to household tasks affect 2.8% of women (440,000 persons) and 1.6% of men (254,000), similar to the distribution found in the total population. Difficulties in acquiring goods and services and in doing housework are the two most common disabilities among the spanish population of working age.

PreV
aLe
nC
e a
nD
ty
Pes
oF
Dis
aBi
Lity
in s
Pain
8. InterPerSonal InteraCtIonS anD relatIonShIPS
the 2008 survey includes six types of disability in this category. this represents significant changes with respect to the 1999 classifications, which only included three types. in total, difficulty in maintaining personal relationships affects 600,000 people and is fairly evenly distributed by sex (affecting 1.4% of men and 1.5% of women). The prevalence of these types of disability remained almost unchanged over the ten years between the 1999 and 2008 surveys, at around 1.5% of the population; however, methodological changes make it difficult to compare the data. By regions, these disabilities are more common in Galicia and Asturias (37% and 22% above the national average) and less common in Madrid and Navarre (24% and 20% below the national average).the category of disabilities regarding interpersonal interactions and relationships includes the following types: • Intimate relationships, in other words, having ‘major difficulty in
initiating and maintaining intimate or sexual relationships’: More than 420.000 people experience this disability, with a similar prevalence among men and women (approximately one out of a hundred). among the working age population, the problem is more common among men, while after the age of 65, it is much more common among women.
• Relating to strangers, defined as ‘major difficulty in relating with strangers (for example, in asking for directions, when shopping)’: More than 410,000 people suffer this disability, with a distribution by sex very similar to the previous disability.
• Family relationships, defined as ‘major difficulty in forming a family and maintaining family relationships’: there are more than 345,000 persons with this disability; it is more common among men up to the age of 64, and after this age more common among women.
Difficulty in relating to others appears in 280,000 people of working age (0.9%); the most typical forms this takes are in intimate and family relationships. it is striking that at these ages such difficulties affect men (1.1%) more often than women (0.7%), while the opposite is the case in the population 65 years of age and over (men, 3.2%; women, 4.9%).
1.2. PreValenCe by aGe anD Sex
age is the most important factor in terms of frequency of disabilities, as shown in graph 1.2: Disabilities increase significantly in the latter stages of life. the DiDss-2008 allows us to compare the average age in the overall population (the 271,000 people interviewed in the first phase), which was 40.1 years of age, to the average age of disabled persons (23,000 people), which was 64.9 years of age (25 years older). the proportion of those with at least one disability went from 2% among 0 to 15 year olds to 4.7% among those of working age (16 to 64 years old) and to 29.2% among those 65 years of age and older. therefore, close to two-thirds of persons with disabilities (57.9%, 2.2 million persons) are of retirement age, a very small proportion (3.6%, 139,000 persons) are children and adolescents, and the rest, somewhat more than one-third (38.5%, 1.5 million persons) are of working age.
among the elderly, the prevalence of disability increases with age: 14 points between 65 and 75 years of age; 28 points between 75 and 85. After 85 years of age, 58% experience some type of disability. on the opposite extreme, the progression is the reverse: children under six have a disability rate of 2.2%, which is slightly higher than in the next three age groups, as can be seen in the graph. regarding individuals of working age, the rate increases as individuals age, particularly after 45 years of age. the distribution of the prevalence of disabilities by age is very similar to that found in 1999.

PreV
aLe
nC
e a
nD
ty
Pes
oF
Dis
aBi
Lity
in s
Pain
GraPh 1.2: Proportion of persons with at least one disability, by age (percentage of the spanish population)
57.91
40.70
29.58
20.68
15.84
11.01
6.52
3.75
2.15
1.59
1.81
2.17
0 10 20 30 40 50 60
Tasa
De 0 a 5 años
De 6 a 15 años
De 16 a 24 años
De 25 a 34 años
De 35 a 44 años
De 45 a 54 años
De 55 a 64 años
De 65 a 69 años
De 70 a 74 años
De 75 a 79 años
De 80 a 84 años
Más de 84 años
TasaMás de 84 años 57,91De 80 a 84 años 40,70De 75 a 79 años 29,58De 70 a 74 años 20,68De 65 a 69 años 15,84De 55 a 64 años 11,01De 45 a 54 años 6,52De 35 a 44 años 3,75De 25 a 34 años 2,15De 16 a 24 años 1,59De 6 a 15 años 1,81De 0 a 5 años 2,17
0
10 20 30 40 50 60
0-5
6-15
16-24
25-34
35-44
45-54
55-64
65-69
70-74
75-79
80-84
OVER 85
1.2.
source: Based on the Disability, independence and Dependency situations survey, 2008 (DiDss).
By sex, there are many more women with disabilities (2.3 million) than men (1.5 million), which leads to significant differences in prevalence rates: 9.9% and 6.8%, respectively. As can be seen in graph 1.3, the proportion of persons with disabilities increases as individuals age for both sexes, the same as in the population overall, but at different rates:
• During childhood, there are more boys with disabilities than girls (43% more up until five years of age; 74% more between six and fifteen years of age).
• The higher prevalence of disabilities among males gradually decreases until the age of 44, at which time the tables are turned
during the last stretch of working life, when women present higher rates of disability than men (24% higher between 45 and 54 years of age; 34% higher between 55 and 64 years of age).
GraPh 1.3 : Percentage of women and men with disabilities by age
05
101520253035404550556065 Mujeres
Hombres
85 y más65-8445-6416-446-150-5 años
PERCENTAGE OF PERSONS WITH DISABILITIES
C. Públicos C. PrivadosE. Infantil 81,60 18,30E. Primaria 83,70 16,20ESO 80,70 19,20Bachillerato 83,60 16,30Ciclos Formativos 78,10 21,80Garantia Social 71,40 28,50E. Especial 65,30 34,60
Men Women
65-84 85 AND OVER45-6416-446-15AGE 0-5
Hombres Mujeres0-5 años 2,54 1,786-15 2,28 1,3116-44 2,83 2,4045-64 7,39 9,6265-84 20,46 28,8485 y más 52,95 60,12
05
101520253035404550556065
1.3.
source: Based on the Disability, independence and Dependency situations survey, 2008 (DiDss).
• Finally, this trend is more accentuated beginning at 65 years of age, the stage of life in which the prevalence of disabilities is clearly higher among women (35 out of 100) than men (23 out of 100). in other words, women of retirement age and over, have a rate of disability 43% higher than men. However, it is striking that in the final stage, that of persons 85 years of age and older, the rate of disability for women and men is closer (60% and 53%, respectively), which seems to indicate that men reach retirement age in a better state of health than women but that starting at this moment, they experience a more accelerated process

PreV
aLe
nC
e a
nD
ty
Pes
oF
Dis
aBi
Lity
in s
Pain
of decline. this would explain both the similarity of morbidity rates and the higher mortality rate (life expectancy for men is six years less than for women).
1.3. DISabIlItIeS are ConCentrateD In Poor houSeholDS
an additional factor that has a direct impact on the frequency of disabilities is the level of household income. if we look at data from the ine 2008 survey on 96,000 households (271,000 people, with and without disabilities), the prevalence rate of persons with disabilities between 0 and 64 years of age by income level varies from 1.7% in households with high levels of income (over 5,000 euros per month) to 11.3% in those households with the lowest income levels (under 500 euros per month), with a constant progression by income groups (graph 1.4). While the average income of households with persons with disabilities under 65 years of age was 1,433 euros/month,4 the average income of households which did not include a person with disabilities was 25% higher (1,784 euros/month).
4 the average household income has been calculated by transforming each range found in the survey at its mid-point, as follows: ‘less than 500 euros”’= 250; ‘500 to 900 euros’ = 750; ‘1,000 to 1,499 euros’ = 1,250; ‘1,500 to 1,999 euros’ = 1.750; ‘2,000 to 2,499’ = 2,250; ‘2,500 to 2,999’ = 2.750; ‘3,000 to 4,999 euros’ = 4,000; ‘5.000 to 6,999 euros’ = 6,000; ‘7,000 to 8,999 euros’ = 8,000; and ‘9,000 or more euros’ = 12.000. the average income in spain is obtained from a total sample of 96,000 households; the average income of households which include a person with disabilities is obtained from the sub-sample corresponding to this group.
GraPh 1.4 : Percentage of persons under 65 with disabilities, by level of household income
0
2
4
6
8
10
12 Tasa
5.000 y más €2.500-4.999 €1.500-2.499 €1.000-1.499 €500-999 €Menos de 500 €
PERCENTAGE OF PERSONS WITH DISABILITIES UNDER 65 YEARS OF AGE
MONTHLY HOUSEHOLD INCOME
C. Públicos C. PrivadosE. Infantil 81,60 18,30E. Primaria 83,70 16,20ESO 80,70 19,20Bachillerato 83,60 16,30Ciclos Formativos 78,10 21,80Garantia Social 71,40 28,50E. Especial 65,30 34,60
€5,000 AND OVER€1,500-2,499 €2,500-4,499€1,000-1,499€500-999 UNDER €500
TasaMenos de 500 € 11,3500-999 € 8,01.000-1.499 € 5,11.500-2.499 € 3,12.500-4.999 € 2,45.000 y más € 1,7
0
2
4
6
8
10
12 11.3
8.0
5.1
3.12.4
1.7
Tasa 11,3 8,0 5,1 3,1 2,4 1,7
1.4.
source: Based on the Disability, independence and Dependency situations survey, 2008 (DiDss).
as was found in the 1999 survey, and in studies of social health in general,5 the higher prevalence of disabilities in poor households is due to several inter-related factors: First, living in precarious economic conditions has an impact on health, leading to a higher risk of contracting diseases or suffering from accidents; in addition, persons with disabilities living in households with scarce economic resources have fewer possibilities for rehabilitation.
examining disability prevalence rates by age, we can see that differences based on income are most acute among those of working age (16 to 64), decrease substantially among those 65 years of age and over and are somewhere in the middle during
5 see, among others, Benach and Muntaner, 2010; Whitehead and Dahlgren, 2006; and the Commission on social Determinants of Heath, 2008.
PreV
aLe
nC
e a
nD
ty
Pes
oF
Dis
aBi
Lity
in s
Pain
childhood and adolescence (0-15 years of age). overall, the prevalence rate increases with age, but differences based on income decrease once retirement age is reached.
thus, while households of persons 65 and older with income less than 1,500 euros/month have a 12% higher disability prevalence rate than those in households from income brackets above that threshold, in households with children and adolescents, the disability prevalence rate is 46% higher for this lower income group, and in working age households, 115% higher. the explanation for this is quite simple and correlates with the pattern already described for the general population: in old age declining health affects all social classes, whereas in childhood and at working age, unhealthy living and working conditions have a greater impact on lower socio-economic classes, who, in addition, have fewer resources to cope with these conditions.
1.4. extra exPenSeS Due to DISabIlIty anD PrIMary SourCeS of InCoMe: neW benefItS anD the DePenDenCy laW
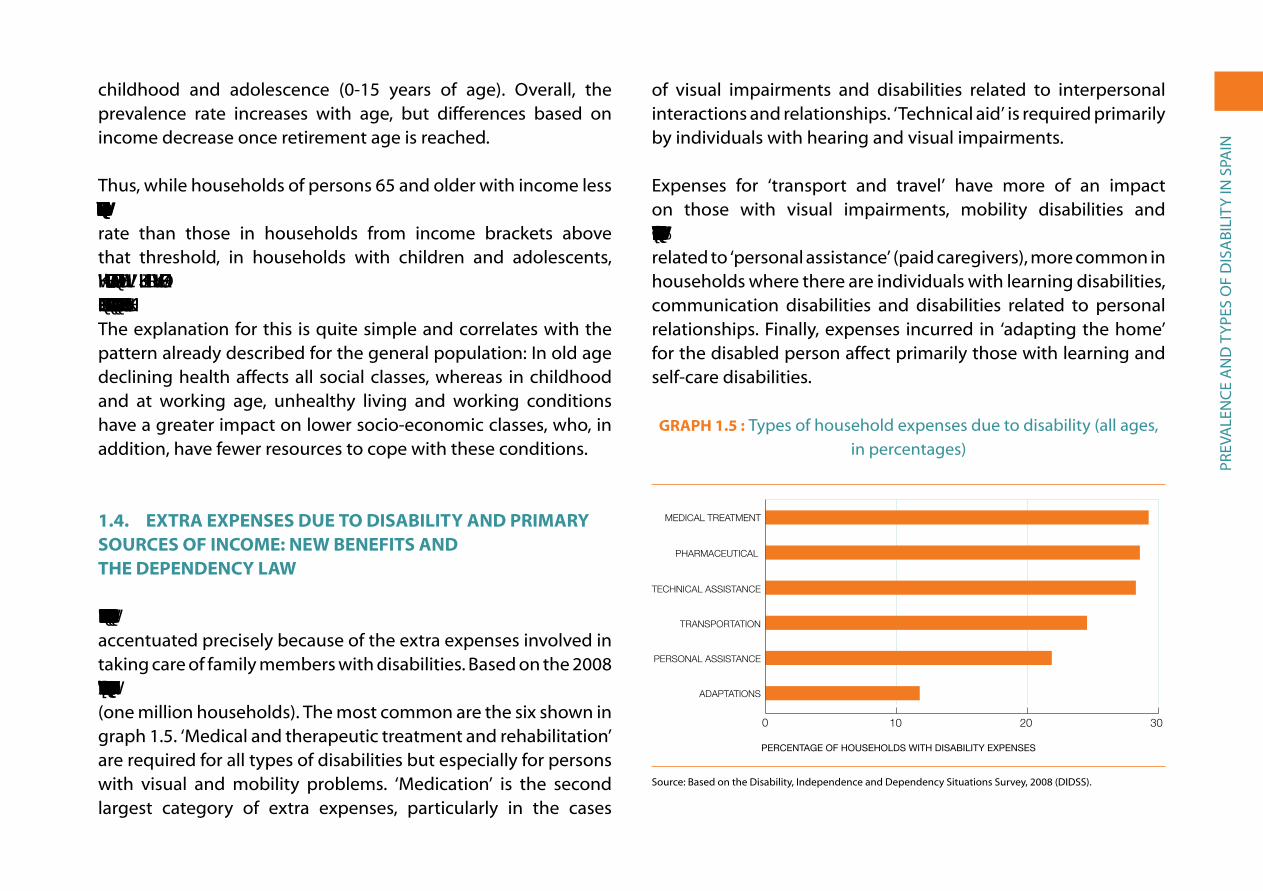
The economic difficulties referred to in the previous section are accentuated precisely because of the extra expenses involved in taking care of family members with disabilities. Based on the 2008 survey, these types of expenses are found in 30.7% of the cases (one million households). the most common are the six shown in graph 1.5. ‘Medical and therapeutic treatment and rehabilitation’ are required for all types of disabilities but especially for persons with visual and mobility problems. ‘Medication’ is the second largest category of extra expenses, particularly in the cases
of visual impairments and disabilities related to interpersonal interactions and relationships. ‘technical aid’ is required primarily by individuals with hearing and visual impairments.
expenses for ‘transport and travel’ have more of an impact on those with visual impairments, mobility disabilities and disabilities related to home life. In fifth place are those expenses related to ‘personal assistance’ (paid caregivers), more common in households where there are individuals with learning disabilities, communication disabilities and disabilities related to personal relationships. Finally, expenses incurred in ‘adapting the home’ for the disabled person affect primarily those with learning and self-care disabilities.
GraPh 1.5 : types of household expenses due to disability (all ages, in percentages)
0 10 20 30
Adaptaciones
Asistencia personal
Transporte
Ayudas técnicas
Fármacos
Tratamiento médico
PERCENTAGE OF HOUSEHOLDS WITH DISABILITY EXPENSES
Tratamiento médico 29,0Fármacos 28,3Ayudas técnicas 28,0Transporte 24,3Asistencia personal 21,6Adaptaciones 11,7
0
10 20 30
ADAPTATIONS
MEDICAL TREATMENT
PHARMACEUTICAL
TECHNICAL ASSISTANCE
TRANSPORTATION
PERSONAL ASSISTANCE
1.5.
source: Based on the Disability, independence and Dependency situations survey, 2008 (DiDss).


PreV
aLe
nC
e a
nD
ty
Pes
oF
Dis
aBi
Lity
in s
Pain
Cantabria, La rioja, andalusia, Castilla y Leon and the Basque Country; the lowest in the Canary islands, Valencia, the Balearic islands, galicia and Madrid. in addition, it is interesting to see that only 0.36% of the beneficiaries are foreign, although they represent over 13% of the total population.
GraPh 1.6 : Percentage of persons receiving services or dependency benefits by region (per thousand inhabitants)
25.6
24.3
23.2
21.3
19.3
19.2
18.2
17.6
16.6
15.7
15.7
13.0
12.8
12.8
11.8
11.5
9.3
8.6
4.8
0,0 0,6 1,2 1,8 2,4 3,0Canarias
Cdad. ValencianaBaleares
GaliciaMadrid
Ceuta y MelillaNavarra Asturias ESPAÑA
CataluñaExtremadura
AragónMurcia
Castilla-La ManchaPaís Vasco
Castilla y LeónAndalucía
La RiojaCantabria
RECIPIENTS PER THOUSAND INHABITANTS
Cantabria 2.6La Rioja 2.4Andalucía 2.3Castilla y León 2.1País Vasco 1.9Castilla-La Mancha 1.9Murcia 1.8Aragón 1.8Extremadura 1.7Cataluña 1.6ESPAÑA 1.6Asturias 1.3Navarra 1.3Ceuta y Melilla 1.3Madrid 1.2Galicia 1.1Baleares 0.9Cdad. Valenciana 0.9Canarias 0.5
0 105 15 302520
CANARY ISLANDS
VALENCIA
BALEARIC ISLANDS
GALICIA
MADRID
CEUTA AND MELILLA
NAVARRE
ASTURIAS
SPAIN
CATALONIA
EXTREMADURA
ARAGON
MURCIA
CASTILLA-LA MANCHA
BASQUE COUNTRY
CASTILLA-LEON
ANDALUSIA
LA RIOJA
CANTABRIA
1.6.
CANTABRIA LA RIOJA ANDALUSIA CASTILLA-LEON BASQUE COUNTRY CASTILLA-LA MANCHA MURCIA ARAGON EXTREMADURA CATALONIA SPAIN ASTURIAS NAVARRE CEUTA AND MELILLA MADRID GALICIA BALEARIC ISLANDS VALENCIA CANARY ISLANDS
Source: Based on the SAAD survey (2011): Statistics for the first four years under the Dependency Law, Madrid, Ministry of Health, social Policy and equality in www.mapsies.es, and the Continuous Population register.
one of the most serious problems in implementing the Dependency Law continues to be the delay that occurs between the filing of applications for services or benefits and determining eligibility, and then between the formal recognition of eligibility
and actually receiving the services and benefits. Thus, in September 2011, along with the 733,000 people receiving this assistance, there were 100,000 cases pending and another 307,000 on the waiting list after their case had been resolved. this problem was so controversial that even the royal Decree of 20 May 2010, which enacted extraordinary measures to reduce the public deficit, set a deadline of no more than six months for resolving applications and receiving the corresponding benefits.
1.5. DIfferenCeS by SIze of MunICIPalIty
in a review of the survey results by size of habitat or municipalities and by regions we find that there are relatively significant differences, which are often associated with other already identified variables, such as age and income level.
in towns with fewer than 10,000 inhabitants, the percentage of persons with disabilities (10.5% of the population) is 17% higher than the percentage of persons with disabilities in the general population as a whole (8.9%), which is undoubtedly due to the higher concentration of the elderly in small towns. this is exactly what the 1999 survey showed, although at that time the percentage of persons with disabilities was 18.1% higher. in addition to age, the level of household income may also have an influence, the average in small towns (1,667 euros in 2008) being 12% less than in cities (1,891 euros). As stated in a report on disability in rural areas, where almost a quarter of the spanish population resides, the ageing and masculinisation of the population in rural municipalities explain the differences observed between regions, with a higher percentage of persons

PreV
aLe
nC
e a
nD
ty
Pes
oF
Dis
aBi
Lity
in s
Pain
with disabilities in extremadura, Castilla-La Mancha, navarre and Castilla y León (Cirem Foundation, 2005).
as for the cities, the percentage of persons with disabilities decreases with increasing size, except in the case of cities of over 100,000 inhabitants, in which case the percentage increases significantly, but without reaching the level of small towns (graph 1.7). the differences between cities from 10,000 to 100,000 inhabitants can be explained again by differences in the age structure of the population and income of each habitat: as the size of municipalities increases, average age decreases (38.8 years of age in towns between 10,000 and 20,000; 38 in those between 20,000 and 50,000; and 37.4 in those between 50,000 and 100,000), while income increases (1,817, 1,838 and 1,950 euros, respectively). the trend is reversed regarding age (average of 40.6 years of age), but not income (1,962 euros per household) in municipalities with more than 100,000 inhabitants.
these differences based on size of habitat were also found in the 1999 survey and, as was the case then, we can consider an additional environmental explanation particularly in the case of the two large metropolitan areas of Madrid and Barcelona: increased susceptibility to disease, accidents and disabilities resulting from increased pollution and more stressful and less healthy living conditions could help explain higher rates of disability. in particular it is striking that the two regions with the highest proportion of persons suffering from ‘respiratory problems’ are Madrid and Catalonia, both with rates 25% higher than the national average.
GraPh 1.7: Percentage of persons with disabilities by size of municipality
0
2
4
6
8
10
12
Más de 100.00050.000-100.00020.000-50.00010.000-20.000Menos de 10.000
PERCENTAGE OF PERSONS WITH DISABILITIES
C. Públicos C. PrivadosE. Infantil 81,60 18,30E. Primaria 83,70 16,20ESO 80,70 19,20Bachillerato 83,60 16,30Ciclos Formativos 78,10 21,80Garantia Social 71,40 28,50E. Especial 65,30 34,60
SIZE OF MUNICIPALITY OF RESIDENCE
OVER 100,000
50,000-100,00020,000-50,00010,000-20,000LESS THAN 10,000
Menos de 10.000 10,510.000-20.000 8,720.000-50.000 8,150.000-100.000 7,4Más de 100.000 9,0
0
2
4
6
8
10
12
8.78.1
7.4
9.0
10.5
1.7.
source: Based on the Disability, independence and Dependency status survey, 2008 (DiDss).
Differences between towns and cities in the percentage of persons with disabilities exist to different degrees for all types of disabilities. However, in the case of disabilities related to interpersonal interactions and relationships the difference is minimal. This suggests that difficulties in relating to others is less of a problem in the small towns than in the cities.
1.6. DIfferenCeS by reGIon
There are significant differences in the percentage of the population with disabilities among spain’s autonomous regions: the region with the highest percentage of persons with disabilities

PreV
aLe
nC
e a
nD
ty
Pes
oF
Dis
aBi
Lity
in s
Pain
is Galicia (11.3%); the lowest percentage is 6.2% in La Rioja. Map 1.1 groups the regions based on the prevalence of persons with disabilities. as in 1999, galicia and Castilla y León remain the regions with the highest prevalence (over 10%); again in this group are extremadura, asturias and the autonomous cities of Ceuta and Melilla, while andalusia and Murcia are no longer part of this group. At the other extreme, we find La Rioja and Madrid with the lowest percentage of disability; also included in this group are Cantabria, the Balearic islands and the Canary islands. the other autonomous regions remain in an intermediate position as was the case in 1999.
the same two variables, once again, can explain these differences: age and household monthly income. these two factors explain most of the differences, with some exceptions, as can be seen in table 1.1.
MaP 1.1: Prevalence of persons with disabilities, by region
Over 10%
9.1%-10%
7.6%-9%
Under 7.5%
source: Based on the Disability, independence and Dependency situations survey (DiDss), 2008.

PreV
aLe
nC
e a
nD
ty
Pes
oF
Dis
aBi
Lity
in s
Pain
table 1.1 : Percentage of persons with disabilitites by region and in relation to average age and average income level in each region
PerCentage oF Persons WitH
DISABILITIES (%)
DiFFerenCe FroM nationaL
AVERAGE (%)
aVerage age oF PoPULation
(years)
DiFFerenCe FroM nationaL
AVERAGE (%)
aVerage HoUseHoLD
inCoMe (€/MONTH)
DiFFerenCe FroM nationaL
AVERAGE (%)
andalusia 9.6 +6.8 38.2 –4.7 1,558 –16.4
aragon 9.2 +2.4 42.3 +5.6 1,895 +1.7
asturias 10.4 +15.6 44.7 +11.5 1,981 +6.4
Balearic islands 7.1 –20.9 38.3 –4.4 2,071 +11.2
Canary islands 7.1 –20.5 37.7 –5.9 1,666 –10.6
Cantabria 7.0 –21.9 42.1 +5.0 1,779 –4.5
Castilla y Leon 10.9 +21.1 43.7 +9.1 1,665 –10.6
Castilla-La Mancha 9.9 +10.3 40.1 +0.2 1,629 –12.6
Catalonia 7.6 –15.2 40.2 +0.3 2,134 +14.6
C. Valencia 9.9 +10.6 39.6 –1.2 1,783 –4.3
extremadura 11.0 +22.5 40.6 +1.3 1,387 –25.5
galicia 11.3 +25.9 43.5 +8.7 1,717 –7.8
Madrid 7.6 –15.4 39.1 –2.5 2,275 +22.1
Murcia 9.8 +9.3 37.1 –7.3 1,633 –12.4
navarre 7.4 –17.3 40.8 +1.7 2,299 +23.4
Basque Country 8.5 –5.8 42.5 +6.1 2,163 +16.1
La rioja 6.2 –31.3 41.2 +2.8 1,949 +4.6
Ceuta and Melilla 11.3 +26.2 35.5 –11.4 1,826 –2.0
Spain 9.0 0.0 40.1 0.0 1,863 0.0
source: Based on the Disability, independence and Dependency situations survey (DiDss), 2008. the data on average ages and household income were obtained from the DiDss-2008 household survey.
PreV
aLe
nC
e a
nD
ty
Pes
oF
Dis
aBi
Lity
in s
Pain
in general, the regions with higher percentages of persons with disabilities are those with the oldest and/or poorest populations. With the exception of Cantabria, all the regions with an average age above the overall average for spain and average income levels below the national average have a percentage of persons with disabilities above the average (galicia, extremadura, Castilla y Leon and Castilla- La Mancha). on the opposite end, the two communities with average ages below the national average and higher average income levels (Madrid and the Balearic islands) have a disability prevalence rate below the average. the remaining regions have various age and income compositions that largely explain their disability rates, although with some exceptions:
• Andalusia has a slightly lower average age than the Spanish average, but the next to the lowest ranking in average income level – only above extremadura – which explains a disability rate 7% above the national average. The same goes for the regions of Valencia and Murcia, where the impact of low income outweighs that of having a younger population and leads to disability rates above the national average. However, in the Canary islands age has a greater impact – the average age of the population being 6% below the national average – than their low income level, resulting in a disability rate 21% below the national average. Finally, Ceuta and Melilla reveal the same pattern (younger population and lower income level) giving rise to the highest rates of disability in spain, along with galicia.
• Six other regions have a higher average age than the national average (which would imply higher disability rates) and higher average income levels (which imply lower disability rates). two of them have a prevalence rate above the national average,
notably higher in the case of Asturias (16% higher) and slightly higher in the case of Aragon (2% higher). In the other four regions – Catalonia, La rioja, navarre and the Basque Country – disability rates are below the national average, above all in La rioja, which has the lowest rate in spain.
• With an average age 5% above the national average and average income level 5% lower, Cantabria is the only community where the relationship we have proposed does not appear to be confirmed. the disability rate should be slightly above the national average; however, it is 16% lower, so there appear to be other variables that have a positive effect on the quality of health of its population.
1.7. feWer PerSonS WIth DISabIlItIeS aMonG the IMMIGrant PoPulatIon
the DiDss-2008 includes information on the country of birth and nationality of the 271,000 people interviewed in the household survey. More than 25,000 were immigrants, thus providing solid information about this group in relation to the autochthonous population. We find, for example, that the disability rate among immigrants is almost four times lower than among the native population (graph 1.8). this difference is mainly due to differences in the age distribution between these two population groups; 17.7% of the autochthonous population is 65 and over, while only 3.8% of the immigrant population is.6 the same graph shows disability rates for immigrants from different countries.
6 82.7% of those born outside of Spain are of working age (compared to 66.4% of the native population) and 10.6% are between six and fifteen years of age (compared to 9.3% of the native population); however, the percentage of those from birth to five years of age represents only 2.9% of the foreign-born population, compared to 6.6% of the native population).

PreV
aLe
nC
e a
nD
ty
Pes
oF
Dis
aBi
Lity
in s
Pain
GraPh 1.8 : Percentages of persons with disabilities, by country of birth
0
2
4
6
8
10
12
MarruecosColombiaEcuadorRumania y BulgariaUE-25Otro paísEspaña
PERCENTAGE OF PERSONS WITH DISABILITIES
C. Públicos C. PrivadosE. Infantil 81,60 18,30E. Primaria 83,70 16,20ESO 80,70 19,20Bachillerato 83,60 16,30Ciclos Formativos 78,10 21,80Garantia Social 71,40 28,50E. Especial 65,30 34,60
COUNTRY OF BIRTH
MOROCCOROMANIA & BULGARIA
ECUADOR COLOMBIAUE-25OTHER COUNTRYSPAIN
España 9,7Otro país 2,8UE-25 4,9Rumania y Bulgaria 0,8Ecuador 1,6Colombia 3,3Marruecos 3,1
0
2
4
6
8
10
12
9.7
2.8
4.9
0.81.6
3.3 3.1
1.8.
source: Based on the Disability, independence and Dependency status survey, 2008 (DiDss).

org
an
iC a
nD
FU
nC
tio
na
L iM
Pair
Men
ts: t
rig
ger
ing
Fa
Cto
rs
II. ORGANIC AND FUNCTIONAL IMPAIRMENTS: TRIGGERING FACTORS
‘mild intellectual impairment’ and ‘borderline intelligence’; and ‘dementia’ became ‘dementia’ and ‘mental illness’).
2.1. DeSCrIPtIon of IMPaIrMentS (IntelleCtual, SenSory anD PhySICal)
The 2008 survey identifies 35 impairments, classified into eight categories, which in turn are divided into three major groups (intellectual, sensory and physical).1 each impairment can be the cause of several limitations or disabilities, which explains why the average number of limitations or disabilities per person (8.1) is much higher than the average number of impairments (1.5). graph 2.1 shows the prevalence rate by sex of the eight major types of impairment. We can see that in all cases, except for language, speech and voice impairments, women have higher rates than men; the frequency of osteoarticular impairments stands out, as the rate among women (4.6%) is almost triple that among men (1.8%).
1 the new iCF identifies 13 bodily functions, organised in eight categories, and 55 bodily structures also organised in eight categories.
according to the methodology applied in the DiDss-2008, all disabilities have their origin in an impairment of an organ or a function. as was explained in the introduction, this is based on the conceptualisation of the 1980 WHO classification, applied in the 1986 and 1999 surveys. the 2008 survey does not incorporate the new 2001 WHO classificatory system (ICF-2001), according to

org
an
iC a
nD
FU
nC
tio
na
L iM
Pair
Men
ts: t
rig
ger
ing
Fa
Cto
rs
GraPh 2.1 : Main types of impairment, by sex (all ages, in percentages)
0 1 2 3 4 5
Varones
Mujeres
Otras de�ciencias
De�ciencias viscerales
De�ciencias del sistema nervioso
De�ciencias osteoarticulares
De�ciencias del lenguaje, habla y voz
De�ciencias de oído
De�ciencias visuales
De�ciencias mentales
Mujeres VaronesDe�ciencias mentales 1,8 1,39De�ciencias visuales 2,14 1,32De�ciencias de oído 2,25 1,7De�ciencias del lenguaje, habla y voz 0,17 0,26De�ciencias osteoarticulares 4,6 1,84De�ciencias del sistema nervioso 1,25 0,92De�ciencias viscerales 1,5 1,04Otras de�ciencias 1 0,4
PERCENTAGE OF PEOPLE WITH IMPAIRMENTS
Women Men
0 1 2 3 4 5
OTHER IMPAIRMENTS
VISERAL IMPAIRMENTS
NERVOUS SYSTEM IMPAIRMENTS
OSTEOARTICULAR IMPAIRMENTS
LANGUAGE, SPEECH, AND VOICE IMPAIRMENTS
HEARING IMPAIRMENTS
VISUAL IMPAIRMENTS
MENTAL IMPAIRMENTS
2.1
source: Based on the Disability, independence and Dependency situations survey, 2008 (DiDss).
in what follows we will describe the principal impairments and their frequency by sex, age and other characteristics of the individuals affected by them. in a second stage we break them down into their main types.
1. Mental IMPaIrMentS
this category groups together eight types of impairments that in total affect more than 700,000 individuals (54% of whom are 65 years of age or over). the most striking characteristic of the impairments in this category is that they trigger the most disabilities: exactly 10.4 per person among men and 12.5 among women. By region, these impairments are most frequent in the Balearic and Canary islands (30% above the national average).
the major types of mental impairments are:• Intellectual impairment, which can be: — Profound and severe (persons with an i.Q. between 0 and 34):
these are persons unable to care for themselves in feeding, elimination, hygiene and dress, and who need constant assistance from another person;
— Moderate (persons with an i.Q. between 35 and 49): these are persons that can learn social and occupational skills in sheltered workshops, although they cannot pass the second grade of primary education;
— Mild (i.Q. between 50 and 60): these are individuals that can acquire practical skills and academic knowledge up to the level of sixth grade of primary education, with the possibility of achieving a notable degree of autonomy and ability to work in special employment centres or in ordinary employment with support.
— Borderline intelligence (i.Q. between 70 and 85): these are individuals with difficulties in adapting to the demands of their surroundings and competitive environments, but that are capable of acquiring almost total independence in adult life, although with occasional support. (Persons with this type of intellectual impairment do not usually obtain a certificate of disability, and in fact, in many cases this impairment does not lead to disability; as a result, the number of persons with this impairment recorded in the survey is the lowest of the four types described).
among the working age population (16 to 64 years of age), intellectual impairments affect more than 100,000 individuals: 37,000 with profound or severe impairment, 43,000 with moderate impairment, 20,000 with mild impairment, and 9,000 with borderline intelligence. these are similar numbers to those recorded ten years before.

org
an
iC a
nD
FU
nC
tio
na
L iM
Pair
Men
ts: t
rig
ger
ing
Fa
Cto
rs
• Dementia refers to the progressive loss of the cerebral functions that affect memory and, to different degrees, behaviour, learning and communication. there are many types, including alzheimer’s and senile dementia, which most frequently affect the elderly. the prevalence rate for this impairment in the Spanish population (0.7%: 320,000 persons) is the highest among the mental impairments. Women are much more affected than men (rate of 1% in comparison to 0.4%, respectively). These impairments are almost exclusively concentrated among person of 65 years of age and over (97%). By region, their frequency is greater in relative terms in the Balearic islands and galicia. Less than 10,000 individuals of working age are diagnosed with disabilities generated by dementia, slightly more than in 1999.
• Mental illnesses refer to other mental alterations that last longer than two years and that interfere with or prevent the development of basic capacities in family, work and social spheres and require specialised treatment. they include schizophrenia and other schizoid disorders, paranoid disorders and other affective disorders (bipolar disorder, chronic depression, etc.). Mental illness affects around 145,000 individuals in spain and, in contrast to dementia, it is concentrated in the working age population (76%), with a similar frequency among men and women. Fifty-seven thousand individuals between 16 and 44 years of age suffer mental illness and 52,000 between the ages of 45 and 64.2 By region, it is more common in the Canary islands and Catalonia.
• Other mental and behavioural disorders refer to diverse mental impairments such as organic mental disorders, autism, phobias, obsessions, hypochondria, mood disorders, anxiety disorders, adaptive and personality disorders, etc. 123,000 individuals with these disorders were identified, more men than women, and half of them of working age.
2 in the 1999 survey, mental illnesses were included in the broader section of ‘other mental disorders’, as a result, we are unable to follow their evolution since then.
2. SenSory IMPaIrMentS
Visual, hearing and language, speech and voice impairments are traditionally grouped together as ‘sensory impairments’ and together affect more than one and half million individuals. the prevalence rates for the total population are 1.7% for visual impairments, 1.9% for hearing impairments, and 0.2% for language, speech and voice impairments. Visual and hearing impairments affect women much more than men, while language, speech and voice impairments are more frequent among men. these three types of impairment produce fewer disabilities or limitations in daily life among those that suffer them: visual impairments trigger an average of 2.5 disabilities per person; hearing impairments trigger 1.6 disabilities per person; and language, speech and voice, 2.4. in total, there is a greater presence of individuals with sensory impairments in Castilla y Leon and Castilla-La Mancha.
• Visual impairments result from functional impairments of the visual organs and their associated structures and functions, including the eyelids. there are two types: total blindness, the impact of which has already been set out in discussing the corresponding disability; and poor eyesight, which refers to severe impairments in visual acuity. the latter is more frequent and affects three quarters of a million individuals, of these, 30% are of working age.
• Hearing impairments refer to individuals with functional and structural hearing problems. they are the most common sensory impairments and affect almost one million persons; of these, more than two thirds are 65 years of age and over. there are four types of hearing impairments:
— Prelocution deafness refers to deafness that manifests prior to language acquisition. this includes deaf-muteness where muteness is a consequence of prelocution deafness.
— Postlocution deafness refers to individuals with total hearing loss who cannot benefit from the use of hearing aids.
— Hard of hearing refers to individuals with different degrees of hearing loss.
— Balance disorders are a consequence of labyrinthine vertigo, dizziness and locomotor defects due to vestibular disorders.

org
an
iC a
nD
FU
nC
tio
na
L iM
Pair
Men
ts: t
rig
ger
ing
Fa
Cto
rs
Of these four types, the third (hard of hearing) accounts for 92% of hearing impairment and affects 335,000 persons of working age. • Language, speech and voice impairments include two types:
muteness (not through deafness) that is the consequence of brain damage to speech centres, mental disorders, certain types of autism, etc.; and difficult or incomprehensible speech, caused by the effects of trauma or injury (such as aphasia, dysphasia, dysarthria and cerebrovascular accidents which affect the language centres of the brain). Muteness is the impairment that affects the fewest individuals in spain (only 2,000 according to the most recent survey), while 84,000 persons suffer from difficult speech, the majority men and more than one third of them of working age.
3. PhySICal IMPaIrMentS
there are three basic types of physical impairments: osteoarticular, nervous system and visceral impairments. these impairments are the most common as they affect more than two million people (two thirds of whom are women). the prevalence rates for the spanish population are 3.2% for osteoarticular impairments (12.7% of whom are over 64 years of age), 1.3% for nervous system impairments (3.4% among the elderly), and 1.1% for visceral impairments (5.3% among those over 64 years of age). the most disabling are impairments of the nervous system, which cause an average of 10.2 disabilities per person. such impairments affect 56,000 persons of working age. osteoarticular impairments lead to 5.3 disabilities per person and visceral impairments, 3.7.• Osteoarticular impairments refer to mechanical and motor alteration
of the head, neck and limbs, as well as the absence of limbs. there are four types:
— impairments of the head, caused by malformations or structural or functional defects of the bones and articulations of the head and/or the face. These impairments affect 6,000 persons;
— impairments of the spinal column, caused by congenital or acquired malformations, alterations of the vertebrae, arthritis, etc. They affect three quarter of a million persons; of these 37% are working age (278,000, the majority women);
— impairments of the upper limbs due to congenital or acquired anomalies of the shoulder, arms and hands. they affect slightly more than half a million persons, of these three fourths are women and 35% are of working age;
— impairments of the lower limbs are caused by congenital or acquired anomalies of the pelvis, legs, knees, ankles and feet and affect 640,000 persons, with a much higher prevalence rate among women (2% of the female population) than among men (0.8% of the male population) and a lower presence than impairments of the upper limbs among persons of working age (25%: 160,000 persons).
By region, osteoarticular impairments are more common in relative terms in Murcia and galicia.• Nervous system impairment refers to severe anomalies of the
structures and/or functions of the central and peripheral nervous systems that affect the musculoskeletal system and the articulations. it includes several types:
— Paralysis of an upper or lower limb, the total or partial loss of mobility of arms, hands, legs or feet (in both cases it affects 30,000 persons, one third of working age);
— Paraplegia and tetraplegia refer to the total loss of mobility of both lower limbs or of all four limbs, respectively. Paraplegia affects 26,000 persons (two thirds of working age), and tetraplegia affects 13,000 (half of whom are working age);
— Motor control and/or muscular tone disorders refer to impairments of the central nervous system, which produce a lack of coordination of movements, tics and alterations of balance; also included are other illnesses of the central nervous system (Parkinson’s disease, multiple sclerosis, epilepsy, etc.). these are the most common physical impairments, affecting more than 300,000 persons (0.7% of the population, 0.5% of men and 0.8% of women), of these almost half are of working age.
By region, impairments of the nervous system are most common in La rioja and the Canary islands.

org
an
iC a
nD
FU
nC
tio
na
L iM
Pair
Men
ts: t
rig
ger
ing
Fa
Cto
rs
• Visceral impairments include six types: — impairments of the respiratory system, with severe anomalies in
respiratory function. these affect 70,000 persons, the majority men over 64 years of age;
— impairments of the cardiovascular system, with severe problems or malformations in cardiac functions (which at times requires the use of devices such as artificial valves and pacemakers). these impairments affect approximately 170,000 persons of both sexes, one fourth are of working age;
— impairments of the digestive system, which refer to severe impairments in the functioning or structures of the different sections of the digestive tract, as well as other attached organs (the gall bladder, liver and pancreas). these impairments affect more than 50,000 persons, 40% are of working age and there are slightly more women affected than men;
— impairments of the genitourinary system, which refer to severe impairments affecting the kidneys, bladder, ureters and the male and female organs, including severe disorders in reproductive functioning, which are the most frequent of visceral impairments, affecting 220,000 persons (0.3% of men and 0.3% of women). only one out of five persons suffering these impairments is of working age;
— impairments of the endocrine-metabolic system, which refer to severe disorders of the endocrine glands and congenital problems in metabolic functioning. these impairments affect slightly less than 100,000 persons; of these, two thirds are women and almost 40% are of working age;
— impairments of the haematopoietic system and immune system, which refer to congenital or acquired disorders of the corresponding functions. these impairments affect more than 25,000 persons, the majority women and more than half are of working age.
By region, visceral impairments are relatively more common in the Canary islands and Catalonia.
4. other IMPaIrMentS
this category refers to impairments of the skin, multiple impairments and those not classified in other categories. in total, these affect 325,000 persons (0.7% of the population), in their majority women (prevalence rate of 1% in comparison to 0.4% for men).
• Impairments of the skin refer to functional or structural disorders of the skin, nails, hair and glands attached to the skin. these impairments affect 5,000 persons with similar frequency between men and women;
• Multiple impairments affect several organs or organ systems and can be congenital or acquired. 290,000 persons are affected by such impairments, of these three fourths are women and more than 95% are 65 years of age or over (the prevalence rate is 4.6% for women of 65 years of age or over, and 2.3% for men of the same ages).
2.2. aGe at onSet of IMPaIrMentS
If we consider all the individuals with disabilities identified in 2008, the onset of impairment occurs most often after reaching 65 years of age (44% suffered disability after reaching this age, for 37.7% the onset of disability was between 30 and 64 years of age, for 11% between 1 and 30 years of age and for 7%, in the perinatal stage – referring to the period during gestation and through the first year of life).
among persons 75 years of age or older with disabilities, less than 1% developed their disability in the perinatal stage (which suggests a higher mortality among individuals who start life with disabilities) and 79% were diagnosed after reaching 64; among persons between 65 and 74 years of age the corresponding percentages are 2.4% and 33.3%.

org
an
iC a
nD
FU
nC
tio
na
L iM
Pair
Men
ts: t
rig
ger
ing
Fa
Cto
rs
if we look at individuals of working age (16 to 64 years of age), in 15.7% of the cases the impairments that lead to disability begin in perinatal ages, in 25.6% of the cases during childhood or young adulthood (between 1 and 29 years of age), and in 58.7% when individuals are in adult stages of working life (30 to 64 years of age). Comparing these results with those of 1999, as can be seen in graph 2.2, indicates that disabilities of perinatal origin have declined by more than one fourth in relative terms. this is a positive advance as it indicates improved treatment of disorders and illnesses in neonatal stages and the first year of life.
GraPh 2.2 : age of onset of impairment among working-age persons with disabilities (1999 and 2008, in percentages)
0
25
50
75 ño 2008
ño 1999
Edad adultaInfancia-JuventudPerinatal
PERCENTAGE OF WORKING AGE PERSONS
C. Públicos C. PrivadosE. Infantil 81.60 18.30E. Primaria 83.70 16.20ESO 80.70 19.20Bachillerato 83.60 16.30Ciclos Formativos 78.10 21.80Garantia Social 71.40 28.50E. Especial 65.30 34.60
20081999
1999 2008Perinatal 22.1 15.7Infancia-Juventud 24.3 25.6Edad adulta 53.8 58.7
0
25
50
22.1
15.7
24.3 25.6
53.858.7
75
ADULTHOODCHILDHOOD- YOUTHPRE-NATAL
2.2.
soUrCe: based on the Disabilities and impairments survey, 1999 and the Disability, independence and Dependency situations survey, 2008 (DiDss).
2.3. CauSeS of DISabIlItIeS: PerInatal DISorDerS, aCCIDentS anD IllneSS
among the external causes of impairments, three major categories can be identified: perinatal disorders (accounting for 7% of the total), accidents (9%), and illnesses (60%). The rest are due to ‘other’ causes (16%) or are ‘not known’ (8%).3 a distinction is made between perinatal disorders which are congenital (5.9%) and those related to childbirth (1.2%). Of accidents, a distinction is made between workplace accidents (2.5%), domestic accidents (1.9%) and traffic accidents (1.8%). However, the predominant cause of impairment is illness, including common illnesses (57.1%) and occupational illnesses (4.1%). Specifically, as we will see, 80% of persons with disabilities have some type of chronic illness or health disorder, a much higher percentage than in the general population.
graph 2.3 shows the reasons or external causes for each impairment. We can see that for all of them, the most frequent origin is lifelong illness, particularly in the case of visceral impairments (83%), followed by nervous system impairments (76.5%) and osteoarticular impairments (71.8%). Perinatal disorders are very common in the population with mental impairments (18% of the cases) and, to a lesser extent, in those with language, speech and voice impairments (9.9%) and visual impairments (8.3%). Regarding accidents, they most frequently appear as causes in osteoarticular impairments (16.2%) and, to a lesser extent, in visual impairments (7.1%) and nervous system impairments (6.9%).
3 these percentages refer to the total number of impairments recorded (4.3 million), not to the total number of persons affected (3.8 million).

org
an
iC a
nD
FU
nC
tio
na
L iM
Pair
Men
ts: t
rig
ger
ing
Fa
Cto
rs
GraPh 2.3 : Causes of various types of impairments (all ages, in percentages)
0 10 20 30 40 50 60 70 80 90 100
Otras y no consta
Enfermedad
Accidente
Perinatal
Otras deficiencias
Defic. viscerales
Del sistema nervioso
Defic. osteoarticulares
Lenguaje, habla y voz
Deficiencias de oído
Deficiencias visuales
Deficiencias mentales
Mujeres VaronesDeficiencias mentales 1,8 1,39Deficiencias visuales 2,14 1,32Deficiencias de oído 2,25 1,7Deficiencias del lenguaje, habla y voz 0,17 0,26Deficiencias osteoarticulares 4,6 1,84Deficiencias del sistema nervioso 1,25 0,92Deficiencias viscerales 1,5 1,04Otras deficiencias 1 0,4
2.3
0% 20% 40% 60% 80% 100%
Pre-natal Accident Illness Other and unknown
OTHER IMPAIRMENTS
VISCERAL IMPAIRMENTS
NERVOUS SYSTEM IMPAIRMENTS
OSTEOARTICULAR IMPAIRMENTS
LANGUAGE, SPEECH ANDVOICE IMPAIRMENTS
HEARING IMPAIRMENTS
VISUAL IMPAIRMENTS
MENTAL IMPAIRMENTS
source: Based on the Disability, independence and Dependency situations survey, 2008 (DiDss).
Based on a 1996 eUrostat survey of 14 eU countries, spain was the country that showed the greatest increase in prevalence of disabilities as age increased: from having a prevalence rate three times below that of the community average for the population between 16 and 29 years of age, it rose to above the community average for the population 60 years of age and over. Based on this, and considering that the majority of functional limitations have their immediate origin in illness or accidents, it would follow that the standard of living and working conditions are more unhealthy and cause more disabilities than in the rest of the european Union (eUrostat, 2001). six years later (2002), another european survey, also coordinated by eUrostat, found the same but more attenuated trend: between 16 and 24 years of age, the prevalence of persons with disabilities in spain was exactly half that found in the eU and 16% lower between the ages of 55 and 64 (APPLICA et al., 2007: 47).
as has been mentioned, the high morbidity of the spanish population is closely related to family income level and social class, as noted by López and ortún (1998: 100-104): ‘Within the family unit the level of health improves rapidly as the population moves away from poverty and low education levels.... individuals’ socioeconomic situation, their social class, measured by income, education, occupation, or some combination of these, has greater impact on health – mortality and morbidity – in developed countries than any other known risk factor’.
regarding accidents, workplace accidents are more common than traffic accidents (which have declined significantly) and accidents in the home. Until the year 2000, there was a steady increase in workplace accidents and occupational illnesses. However, though these have now declined, spain stands out in europe for its high rate of workplace accidents, which has been linked to ‘the increase in temporary employment beginning in 1985, the spread of contracts for specific projects, as well as the growth and lengthening of the subcontracting chain’ (Bilbao, 1997: 183).
2.4. health of PerSonS WIth DISabIlItIeS. hIGher MorbIDIty aMonG WoMen
Less than one-third of persons with disabilities judge their state of health to be poor (22.8%) or very poor (6.5%), and only 3.2% (120,000) are permanently bedridden. Persons who are bedridden tend to have multiple disabilities, most common among those who suffer the most debilitating disorders (mental impairments, impairments of the nervous system and language,
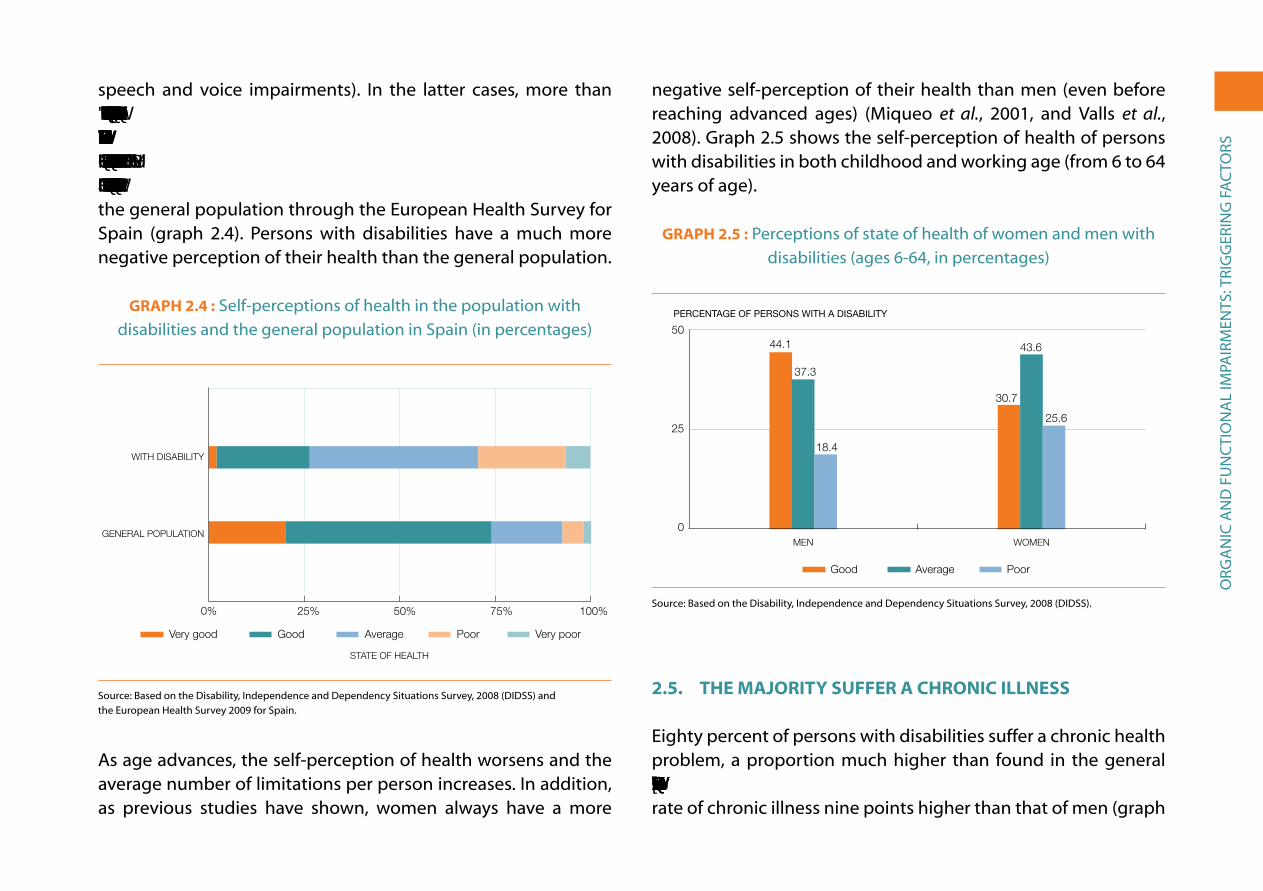
org
an
iC a
nD
FU
nC
tio
na
L iM
Pair
Men
ts: t
rig
ger
ing
Fa
Cto
rs
speech and voice impairments). in the latter cases, more than 8% are permanently bedridden. Less than half of persons with disabilities describe their state of health as fair or average (44%); one fourth considers their health to be good (24.3%) or very good (2.1%). We can compare these perceptions with those of the general population through the european Health survey for spain (graph 2.4). Persons with disabilities have a much more negative perception of their health than the general population.
GraPh 2.4 : self-perceptions of health in the population with disabilities and the general population in spain (in percentages)
0 10 20 30 40 50 60 70 80 90 100
Muy malo
Malo
Regular
Bueno
Estado de salud muy bueno
STATE OF HEALTH
Very good Good Average Poor Very poor
Estado de salud muy bueno 20,2 2,1Bueno 53,8 24,3Regular 18,5 44,0Malo 5,5 22,8Muy malo 2,0 6,5
0% 75%25% 50% 100%
GENERAL POPULATION
WITH DISABILITY
2.4
source: Based on the Disability, independence and Dependency situations survey, 2008 (DiDss) and the european Health survey 2009 for spain.
as age advances, the self-perception of health worsens and the average number of limitations per person increases. in addition, as previous studies have shown, women always have a more
negative self-perception of their health than men (even before reaching advanced ages) (Miqueo et al., 2001, and Valls et al., 2008). graph 2.5 shows the self-perception of health of persons with disabilities in both childhood and working age (from 6 to 64 years of age).
GraPh 2.5 : Perceptions of state of health of women and men with disabilities (ages 6-64, in percentages)
0
25
50 Malo
Regular
Bueno
MujeresHombres
PERCENTAGE OF PERSONS WITH A DISABILITY
WOMENMEN
Hombres Mujeres Bueno 44.1 30.7 Regular 37.3 43.6 Malo 18.4 25.6
0
25
5044.1
37.3
18.4
30.7
43.6
25.6
Good Average Poor
2.5
source: Based on the Disability, independence and Dependency situations survey, 2008 (DiDss).
2.5. the MajorIty Suffer a ChronIC IllneSS
eighty percent of persons with disabilities suffer a chronic health problem, a proportion much higher than found in the general population (around 50%). By sex, women with disabilities have a rate of chronic illness nine points higher than that of men (graph

org
an
iC a
nD
FU
nC
tio
na
L iM
Pair
Men
ts: t
rig
ger
ing
Fa
Cto
rs
2.6). if we limit ourselves to the working age population, the rate of chronic illness of those who suffer disability is 74% (women 79%, men 81%), while it rises to 84% for those 65 years of age and older (women 86%, men 81%).
arthritis and osteoarthritis affect 1.7 million persons with disabilities, 46% of the total population with disabilities (29% among those under 65 years of age and 58% among those 65 or older). the second most common chronic illness is depression, which affects nearly one million persons, approximately one fourth of this population. Depression appears more often among those under 65 (29%) than among those 65 and over (22%).
GraPh 2.6 : Men and women with disabilities and chronic illnesses (all ages) and comparison with the general population
(in percentages)
0102030405060708090
100 %
Mujeres con discapacidadesHombres con discapacidadesPersonas con discapacidadesPoblación general
MEN WITH DISABILITIES
WOMEN WITHDISABILITIES
PERSONS WITHDISABILITIES
GENERAL POPULATION
51%
0
100
80%74%
83%
Menos de 10.000 10,510.000-20.000 8,720.000-50.000 8,150.000-100.000 7,4Más de 100.000 9,0
2.6
source: Based on the Disability, independence and Dependency situations survey, 2008 (DiDss) and the european Health survey 2009 for spain.
there are 17 chronic illnesses that affect more than 100,000 persons, as can be seen in graph 2.7.
GraPh 2.7 : the most common chronic illnesses among persons with disabilities, by age (number of persons affected)
0 50 100 150
Menos de 65 años
65 y más años
Lesión MedularParkinson
Miopía magnaEnfermedades raras
Retinopatía diabéticaGlaucoma
Otras demenciasDemencia tipo Alzheimer
Daño cerebral adquiridoInsu�ciencia renalDistro�a muscular
Accid. cerebrovascularesInfarto. CardiopatíaArtritis reumatoide
CataratasDepresión
Artritis / Artrosis
65 and older Under 65
Menos de 65 años 65 y más añosLesión Medular 62.900 45.400Parkinson 10.900 104.600Miopía magna 60.400 56.700Enfermedades raras 82.200 35.200Retinopatía diabética 32.000 97.300Glaucoma 41.300 118.300Otras demencias 38.800 124.800Demencia tipo Alzheimer 5.000 162.700Daño cerebral adquirido 94.800 82.500Insu�ciencia renal 54.700 137.600Distro�a muscular 138.200 148.100Accid. cerebrovasculares 84.100 245.400Infarto. Cardiopatía 82.400 345.600Artritis reumatoide 204.300 486.000Cataratas 96.900 750.400Depresión 444.200 494.300Artritis / Artrosis 451.000 1.283.200
0 500,000 1,000,000 1,500,000
SPINAL CORD INJURY
PARKINSON
MYOPIA
RARE DISEASES
DIABETIC RETINOPATHY
GLAUCOMA
OTHER DEMENTIAS
ALZHEIMER
ACQUIRED BRAIN DAMAGE
KIDNEY FAILURE
MUSCULAR DYSTROPHY
CEREBROVASCULAR ACCIDENT
MYOCARDIAL INFARCTION/HEART DISEASE
RHEUMATOID ARTHRITIS
CATARACTS
DEPRESSION
ARTHITIS/OSTEOARTHRITIS
2.7
source: Based on the Disability, independence and Dependency situations survey, 2008 (DiDss).

org
an
iC a
nD
FU
nC
tio
na
L iM
Pair
Men
ts: t
rig
ger
ing
Fa
Cto
rs
the majority affect women more often than men (higher morbidity among women than men, as in the general population), and they occur much more frequently among the elderly population (65 years of age and over). among the working age population, in addition to osteoarthritis and depression, rheumatoid arthritis and muscular dystrophy are common. there are four chronic health problems that occur more frequently among the working age population than among the elderly (affecting more than 100,000 persons). they are: acquired brain injury, degenerative myopia, spinal cord injury and rare illnesses.
We cannot analyze the evolution of chronic illnesses between 1999 and 2008 due to changes introduced into the classificatory system. in particular, in 1999 depression and arthritis-osteoarthritis were not considered chronic illnesses; as a result, the total percentage of persons with disabilities with chronic illnesses was only 43%.
ass
ista
nC
e, B
eneF
its
an
D s
erV
iCes
iii. assistanCe, BeneFits anD serViCes
or equipment used by or intended for a person with disabilities to compensate for, relieve or neutralise the disability. Personal assistance is considered to be any type of direct assistance offered by another person to a person with disabilities to help him or her carry out everyday activities. of the total population of persons with functional disabilities, seven out of ten (2.5 million people: 71.4%)1 receive some type of assistance.
Women receive more support (75.4%) than men (65.3%). By age group, a much higher percentage of persons 65 and over receives assistance (80.2%) than those between 6 and 64 years of age (58.8%).
of the 2.5 million persons with disabilities who receive assistance, 82.5% receive personal assistance, and 56.5% receive technical assistance, while 39% receive both types. Technical assistance is the only form of aid available for those with vision2 and hearing
1 to calculate this and the following figures, we have not included the cases (249,000) where it is unknown if aid was received.
2 We have already indicated that the use of glasses in cases of poor vision – in contrast to hearing aids or wheelchairs, etc. – is an exception in the definition of disabilities in the DiDss-2008; a person who can see normally with glasses is not considered to have a disability.
The severity of a disability refers to the degree of difficulty in carrying out the basic activities of daily living (aDLs). in this regard, the 2008 survey differentiates between the degree of difficulty for persons with disabilities when receiving assistance (both technical and personal assistance) and when not. in this way, we can see to what extent potential limitations are (or are not) overcome thanks to assistance. respondents in the survey also assessed their level of satisfaction with the assistance received, or in the case of those not receiving assistance, whether they felt they were in need of it or not. Persons with disabilities and poor health receive treatment more often than the general population, and one third of them look for official recognition of their disability (a disability certificate) in order to gain access to available resources.
3.1. DeGree of Se
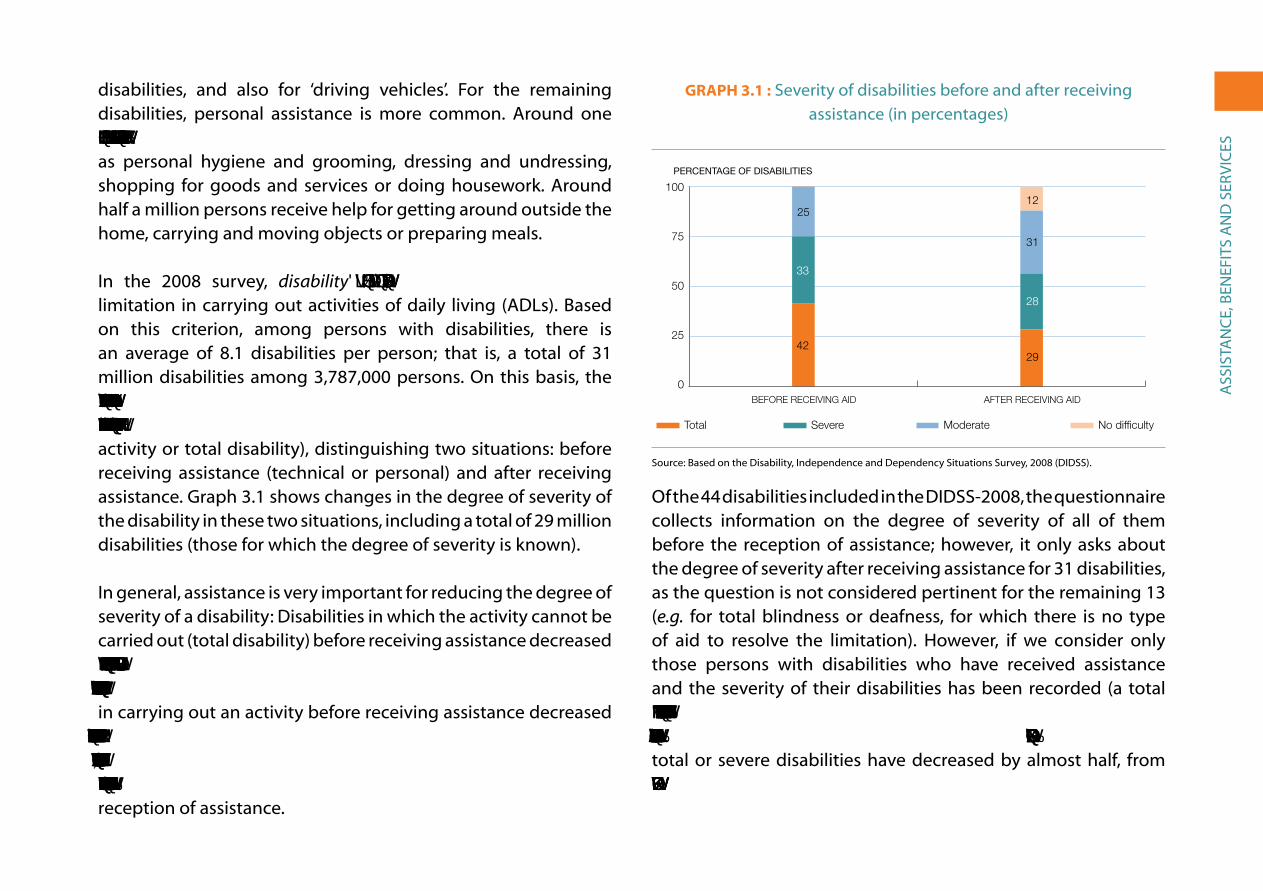
ass
ista
nC
e, B
eneF
its
an
D s
erV
iCes
disabilities, and also for ‘driving vehicles’. For the remaining disabilities, personal assistance is more common. around one million people receive help for certain specific activities, such as personal hygiene and grooming, dressing and undressing, shopping for goods and services or doing housework. around half a million persons receive help for getting around outside the home, carrying and moving objects or preparing meals.
in the 2008 survey, disability is defined as any ‘important’ limitation in carrying out activities of daily living (aDLs). Based on this criterion, among persons with disabilities, there is an average of 8.1 disabilities per person; that is, a total of 31 million disabilities among 3,787,000 persons. on this basis, the survey introduces three degrees of difficulty for each limitation (moderate difficulty, severe difficulty and cannot carry out the activity or total disability), distinguishing two situations: before receiving assistance (technical or personal) and after receiving assistance. graph 3.1 shows changes in the degree of severity of the disability in these two situations, including a total of 29 million disabilities (those for which the degree of severity is known).
in general, assistance is very important for reducing the degree of severity of a disability: Disabilities in which the activity cannot be carried out (total disability) before receiving assistance decreased by more than one-third, from 41.7% to 28.6% of all disabilities, after receiving assistance; those characterised by severe difficulty in carrying out an activity before receiving assistance decreased from 33.4% to 27.9%; while those of moderate difficulty increased by a quarter, from 25% of all disabilities to 31.5%. In addition, just over one-tenth of disabilities (12%) posed no difficulty after the reception of assistance.
GraPh 3.1 : severity of disabilities before and after receiving assistance (in percentages)
0
25
50
75
100 Sin di�cultad
Severidad moderada
Severidad grave
Severidad total
Después de las ayudasAntes de las ayudas
PERCENTAGE OF DISABILITIES
No difficultySevere Total Moderate
AFTER RECEIVING AIDBEFORE RECEIVING AID
Antes de las ayudas Después de las ayudas Severidad total 41,7 28,6 Severidad grave 33,4 27,9 Severidad moderada 25,0 31,5 Sin di�cultad 0,0 12,0
0
25
50
75
100
3.1
25
33
42
12
31
28
29
source: Based on the Disability, independence and Dependency situations survey, 2008 (DiDss).
of the 44 disabilities included in the DiDss-2008, the questionnaire collects information on the degree of severity of all of them before the reception of assistance; however, it only asks about the degree of severity after receiving assistance for 31 disabilities, as the question is not considered pertinent for the remaining 13 (e.g. for total blindness or deafness, for which there is no type of aid to resolve the limitation). However, if we consider only those persons with disabilities who have received assistance and the severity of their disabilities has been recorded (a total of 16,100 disabilities), in just over one-fifth of the cases (21.7%) the difficulty has been completely resolved (i.e. no difficulty), and total or severe disabilities have decreased by almost half, from 79.1% to 45.6% of the total.
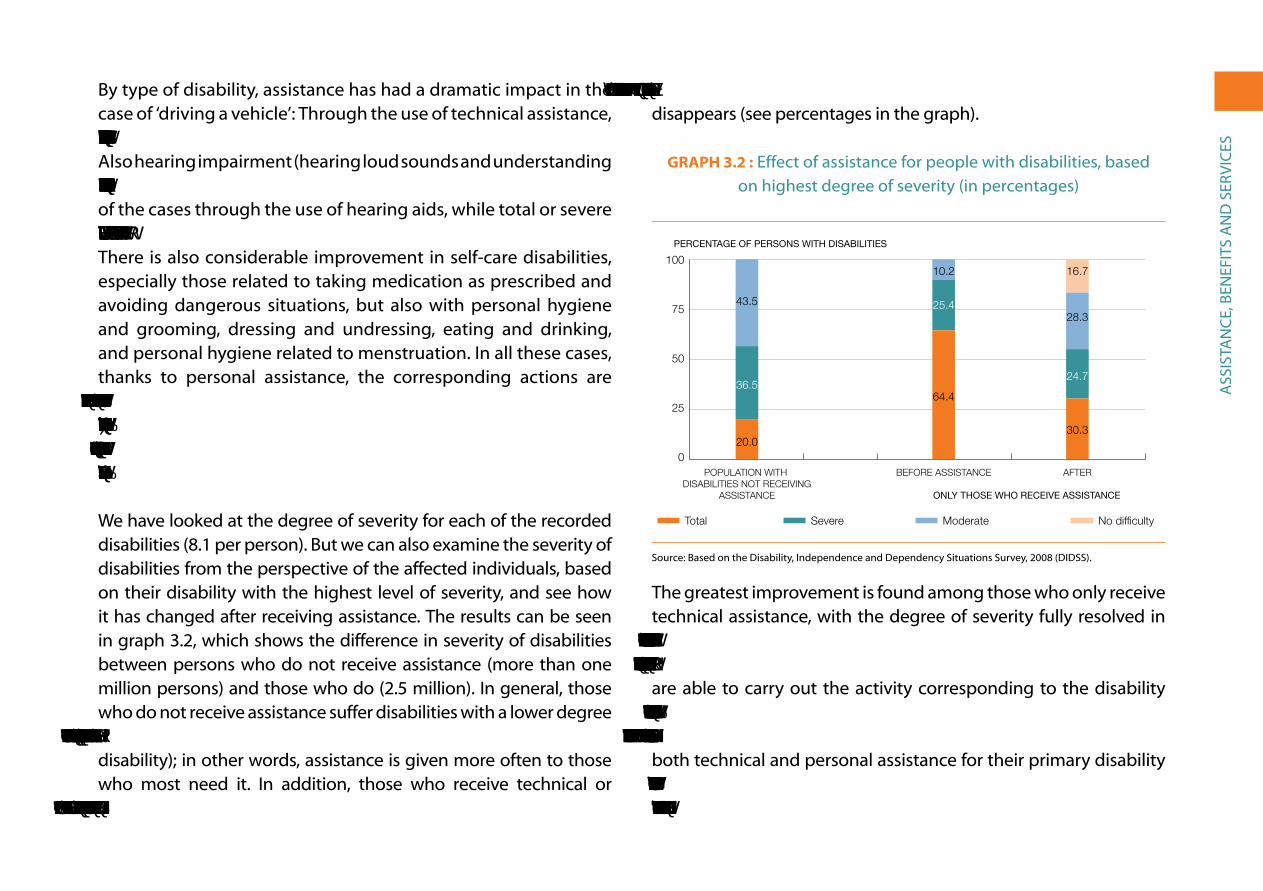
ass
ista
nC
e, B
eneF
its
an
D s
erV
iCes
By type of disability, assistance has had a dramatic impact in the case of ‘driving a vehicle’: through the use of technical assistance, difficulty with driving practically disappears in 65% of the cases. also hearing impairment (hearing loud sounds and understanding speech) is largely resolved, practically disappearing in over 40% of the cases through the use of hearing aids, while total or severe disability is reduced by almost four-fifths (from 75% to 20%). there is also considerable improvement in self-care disabilities, especially those related to taking medication as prescribed and avoiding dangerous situations, but also with personal hygiene and grooming, dressing and undressing, eating and drinking, and personal hygiene related to menstruation. in all these cases, thanks to personal assistance, the corresponding actions are carried out without difficulty in over 20% of the cases, and cases of total or severe disability are significantly reduced. Finally, thanks to the support of other persons, difficulty in ‘acquiring goods and services’ also significantly decreases.
We have looked at the degree of severity for each of the recorded disabilities (8.1 per person). But we can also examine the severity of disabilities from the perspective of the affected individuals, based on their disability with the highest level of severity, and see how it has changed after receiving assistance. the results can be seen in graph 3.2, which shows the difference in severity of disabilities between persons who do not receive assistance (more than one million persons) and those who do (2.5 million). in general, those who do not receive assistance suffer disabilities with a lower degree of severity (43.5% moderate severity and only one in five with total disability); in other words, assistance is given more often to those who most need it. in addition, those who receive technical or personal assistance improve significantly: Total disability is reduced
by more than half, and in 16.7% of the cases the difficulty practically disappears (see percentages in the graph).
GraPh 3.2 : effect of assistance for people with disabilities, based on highest degree of severity (in percentages)
0
25
50
75
100 Sin di�cultad
Severidad moderada
Severidad grave
Severidad total
DespuésAntes de las ayudasPoblación con discapacidades que no recibe ayudas
PERCENTAGE OF PERSONS WITH DISABILITIES
ONLY THOSE WHO RECEIVE ASSISTANCE
No difficultySevere Total Moderate
AFTERPOPULATION WITH DISABILITIES NOT RECEIVING
ASSISTANCE
BEFORE ASSISTANCE
Población con discapacidades que no recibe ayudas Antes de las ayudas Después Severidad total 20,0 64,4 30,3 Severidad grave 36,5 25,4 24,7 Severidad moderada 43,5 10,2 28,3 Sin di�cultad 16,7
0
25
50
75
100
3.2
20.0
43.5
36.5
10.2
64.4
25.4
16.7
28.3
24.7
30.3
source: Based on the Disability, independence and Dependency situations survey, 2008 (DiDss).
the greatest improvement is found among those who only receive technical assistance, with the degree of severity fully resolved in 31.9% of the cases. Cases of total or severe disability are reduced from 78.4% to 31.8%. Those who only receive personal assistance are able to carry out the activity corresponding to the disability without difficulty in 21.3% of the cases, while those with total or severe disability decrease from 88.2% to 50.2%. Those who receive both technical and personal assistance for their primary disability have disabilities with a higher level of severity (96.8% with total or severe disability), which is reduced to 73.1% after receiving
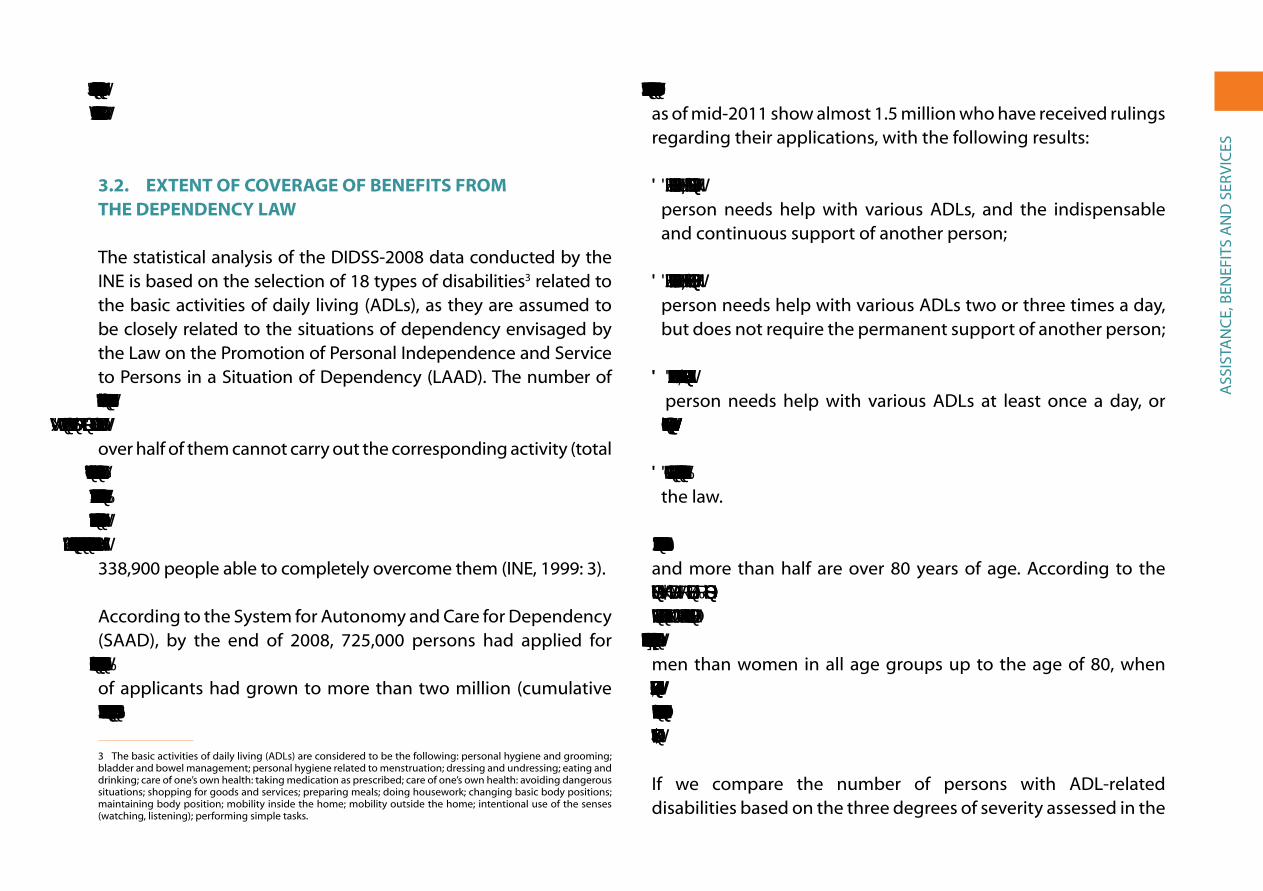
ass
ista
nC
e, B
eneF
its
an
D s
erV
iCes
assistance, while only 5% are able to perform the corresponding activity without difficulty.
3.2. extent of CoVeraGe of benefItS froM the DePenDenCy laW
the statistical analysis of the DiDss-2008 data conducted by the ine is based on the selection of 18 types of disabilities3 related to the basic activities of daily living (aDLs), as they are assumed to be closely related to the situations of dependency envisaged by the Law on the Promotion of Personal independence and service to Persons in a situation of Dependency (LaaD). the number of people who have difficulty carrying out certain basic everyday activities totalled 2.8 million, 6.7% of Spain’s population in 2008. Just over half of them cannot carry out the corresponding activity (total disability, 52.3%), one-quarter have severe difficulty (26.5%), and one-fifth, moderate difficulty (21.2%). However, through various types of assistance, which 81.7% received in 2008, the degree of the severity of their limitations has been reduced significantly, with 338,900 people able to completely overcome them (ine, 1999: 3).
according to the system for autonomy and Care for Dependency (saaD), by the end of 2008, 725,000 persons had applied for benefits or services due to dependency; by mid-2011 the number of applicants had grown to more than two million (cumulative figures). Of these, rulings on 1.9 million cases have been made,
3 the basic activities of daily living (aDLs) are considered to be the following: personal hygiene and grooming; bladder and bowel management; personal hygiene related to menstruation; dressing and undressing; eating and drinking; care of one’s own health: taking medication as prescribed; care of one’s own health: avoiding dangerous situations; shopping for goods and services; preparing meals; doing housework; changing basic body positions; maintaining body position; mobility inside the home; mobility outside the home; intentional use of the senses (watching, listening); performing simple tasks.
and 1,175,000 have obtained the right to benefits. Current figures as of mid-2011 show almost 1.5 million who have received rulings regarding their applications, with the following results:
• 30.1% were classified as Degree III (major dependency): the person needs help with various aDLs, and the indispensable and continuous support of another person;
• 30.6% were classified as Degree II (severe dependency): the person needs help with various aDLs two or three times a day, but does not require the permanent support of another person;
• 25% were classified as Degree I (moderate dependency): the person needs help with various aDLs at least once a day, or needs intermittent support for his/her personal autonomy, and
• 14% did not obtain the minimum qualification prescribed by the law.
Of the beneficiaries, four out of five are 65 years of age or older, and more than half are over 80 years of age. according to the government, ‘the majority of beneficiaries of dependency benefits are women (67%). This is a result of their longer life expectancy. But if we analyze beneficiaries by age, there are more men than women in all age groups up to the age of 80, when there is a greater percentage of women. In fact, 63.8% of women beneficiaries are over 80 years of age, whereas among men less than half are over 80 (40.8%)’ (SAAD, 2011: 3).
if we compare the number of persons with aDL-related disabilities based on the three degrees of severity assessed in the
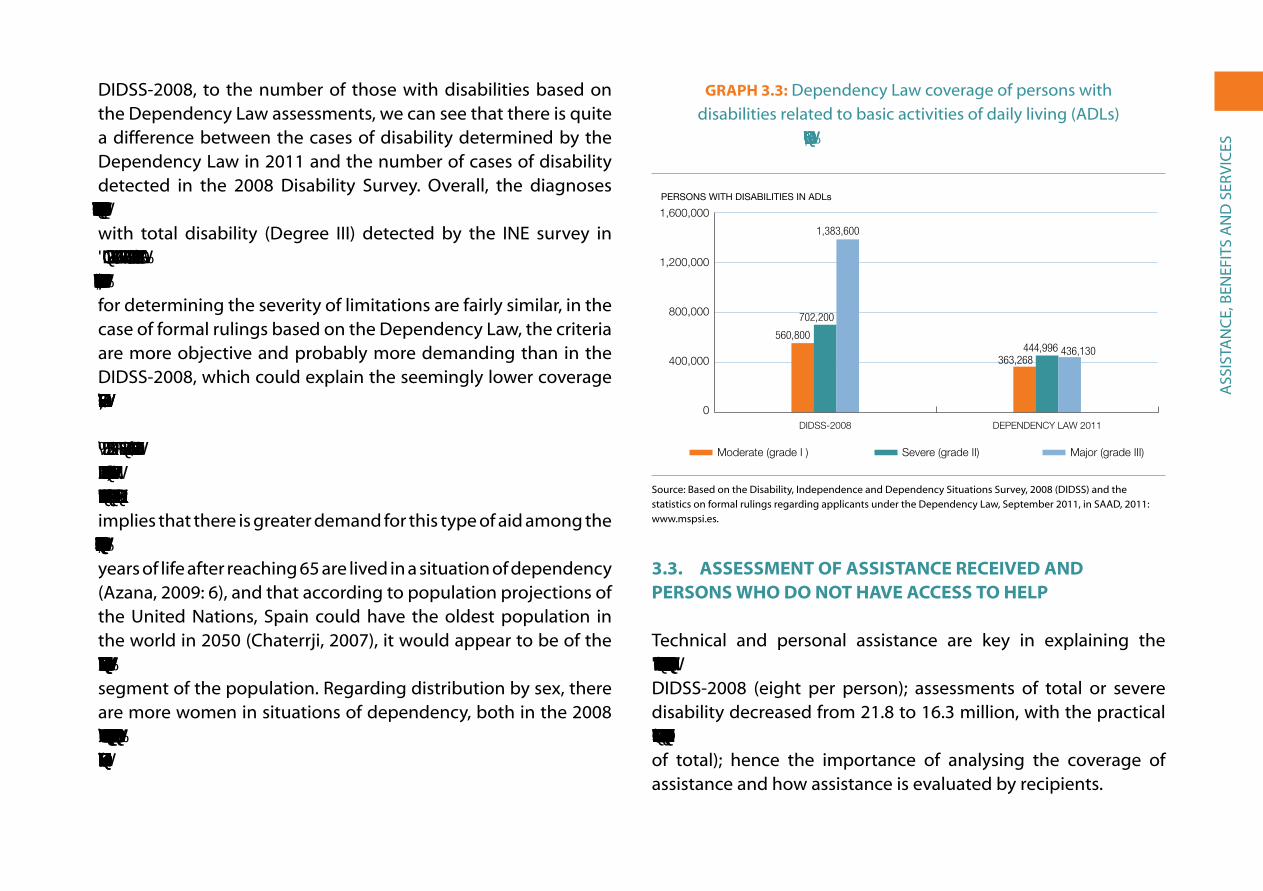
ass
ista
nC
e, B
eneF
its
an
D s
erV
iCes
DiDss-2008, to the number of those with disabilities based on the Dependency Law assessments, we can see that there is quite a difference between the cases of disability determined by the Dependency Law in 2011 and the number of cases of disability detected in the 2008 Disability survey. overall, the diagnoses based on the law cover less than one third (31.5%) of the persons with total disability (Degree iii) detected by the ine survey in 2008 and two thirds of those detected with severe difficulty (Degree II) or moderate difficulty (Degree I). Although the criteria for determining the severity of limitations are fairly similar, in the case of formal rulings based on the Dependency Law, the criteria are more objective and probably more demanding than in the DiDss-2008, which could explain the seemingly lower coverage of cases of total disability/Degree III.
By age group, 63.3% of persons with ADL-related disabilities were 65 or over according to the DIDSS-2008; while 80% of the beneficiaries of dependency benefits were 65 and over, which implies that there is greater demand for this type of aid among the elderly. If we consider that a significant number of the remaining years of life after reaching 65 are lived in a situation of dependency (azana, 2009: 6), and that according to population projections of the United nations, spain could have the oldest population in the world in 2050 (Chaterrji, 2007), it would appear to be of the utmost importance to ensure basic services and benefits for this segment of the population. regarding distribution by sex, there are more women in situations of dependency, both in the 2008 survey (65%) and among recipients in 2011 of the benefits and services based on the Dependency Law (67%).
GraPh 3.3: Dependency Law coverage of persons with disabilities related to basic activities of daily living (aDLs)
identified in the DIDSS-2008
0
40
80
120
160 Severidad total (Grado III)
Severidad grave (Grado II)
Severidad moderada (Grado I)
Ley Dependencia 2011EDAD-2008
PERSONS WITH DISABILITIES IN ADLs
DEPENDENCY LAW 2011DIDSS-2008
Hombres Mujeres Bueno 44,1 30,7 Regular 37,3 43,6 Malo 18,4 25,6
0
400,000
560,800
702,200
1,383,600
363,268444,996 436,130
800,000
1,600,000
Moderate (grade I ) Severe (grade II) Major (grade III)
1,200,000
3.3source: Based on the Disability, independence and Dependency situations survey, 2008 (DiDss) and the statistics on formal rulings regarding applicants under the Dependency Law, september 2011, in saaD, 2011: www.mspsi.es.
3.3. aSSeSSMent of aSSIStanCe reCeIVeD anD PerSonS Who Do not haVe aCCeSS to helP
technical and personal assistance are key in explaining the 25% decrease in the severity of all disabilities diagnosed in the DiDss-2008 (eight per person); assessments of total or severe disability decreased from 21.8 to 16.3 million, with the practical disappearance of disability in 3.5 million diagnosed cases (12% of total); hence the importance of analysing the coverage of assistance and how assistance is evaluated by recipients.

ass
ista
nC
e, B
eneF
its
an
D s
erV
iCes
First of all, 28.4% of those who say they need technical assistance do not receive or use it, which represents 554,000 persons who are unattended (of which 354,000 are women and 200,000 men).4 the percentage of persons who do not receive or use such assistance, although it is needed, is much greater in the working age population (39%) than the population 64 years of age and over (23%), and in all cases, women receive less assistance than men; this difference is very pronounced before age 65 and less so after.
Secondly, regarding personal assistance, 10.3% of those who feel they need personal care do not receive it, in numerical terms nearly a quarter of a million people. Lack of personal care is greater in the working age population (13%) than after retirement (9%), and women are the ones who most lack the support of others. as for who should provide such care, more than a third (41% of men with disabilities, 36% of women) said that support should come exclusively from professionals in the field (public or private), and a similar proportion (27% of men, 36% of women) said that support should come from non-professionals, normally their own family members. The remaining 30% believe that it could be provided by either (formal or informal care).
graph 3.4 shows the numbers of persons with disabilities of both sexes who do not receive technical or personal assistance but who believe they need it.
4 an additional million and half persons who do not receive technical assistance feel that they do not need it; in most cases this is because their degree of disability is moderate.
GraPh 3.4: Men and women with disabilities who do not receive technical or personal assistance,
even though they say they need it (totals)
0
100
200
300
400 Mujeres
Hombres
Sin cuidados personalessin ayudas técnicas
NUMBER OF PERSONS WITH DISABILITIES
Men Women
NO PERSONAL ASSISTANCENO TECHNICAL ASSISTANCE
Hombres Mujeressin ayudas técnicas 199,800 354,100Sin cuidados personales 74,400 164,900
0
100,000
199,800
354,100
74,400
164,900200,000
400,000
300,000
3,4
source: Based on the Disability, independence and Dependency situations survey, 2008 (DiDss).
in view of the improvement that assistance represents for its recipients, it is easy to see how important it would be to expand assistance –both technical and personal, formal and informal – for those who need it and not only for those who currently receive it. in addition, we can conclude that women experience more discrimination in terms of both types of assistance.
graph 3.5 shows the percentage of persons with disabilities receiving technical and/or personal assistance to offset or alleviate their limitations. the reference this time is the total number of persons with disabilities (3.8 million); over one quarter does not receive any type of assistance.

ass
ista
nC
e, B
eneF
its
an
D s
erV
iCes
GraPh 3.5: Persons with disabilities in relation to technical and personal assistance (in percentages)
No help
28.6%
Only person
31.1%
Only technical
12.5%
Both types of help
27.8%
Sólo ayuda técnica
Ambos tipos de ayuda
Sólo ayuda personal
Sin ayudas
Sin ayudas 28.6Sólo ayuda personal 31.1Sólo ayuda técnica 12.5Ambos tipos de ayuda 27.8
Sin ayudas 28.6Sólo ayuda personal 31.1Sólo ayuda técnica 12.5Ambos tipos de ayuda 27.8
3.5
source: Based on Disability, independence and Dependency situations surveys, 2008 (DiDss).
Of those who receive personal assistance, almost one third (32.1%) consider it to be ‘insufficient’. This complaint is more common among women (33.4%) than among men (29.5%). We find similar percentages when we look at the differences between men and women by age group.
Of those who receive technical assistance, 38.3% consider it to be ‘insufficient’. Among the working age population, 40% are ‘dissatisfied’, with a very similar incidence of dissatisfaction among both men and women. From 65 years of age on, dissatisfaction is somewhat higher among women (38.7%) than men (35.3%).
3.4. healthCare, rehabIlItatIon anD SoCIal SerVICeS uSeD In the PreVIouS tWo WeekS
More than half of persons with disabilities stated they had used some healthcare service – public or private – in the two weeks
prior to the survey. In particular, 30.3% had received medical or nursing care, and 17.4% had had a diagnostic test. In addition, 29.1% had received care in a hospital in the previous year. These frequency rates are much higher than those found in the general population and correspond to the greater frequency of health problems in this population group.
GraPh 3.6: Persons with disabilities who received rehabilitation services in the two weeks prior to the survey
(under 65 and 65 and over)
012345678 65 y más años
6-64 años
PodologíaPsicológica, salud mentalOrtoprotésicaLenguaje - logopediaMédico-funcional
PERCENTAGE OF PERSONS WITH DISABILITIES
Ages 6-64 65 and over
MEDICAL-FUNCTIONAL
LANGUAGE/SPEECH
ORTHOTIC/PROSTHETIC
6-64 años 65 y más añosMédico-funcional 5,58 2,32Lenguaje - logopedia 2,05 0,24Ortoprotésica 1,35 0,55Psicológica, salud mental 6,95 1,41Podología 2,06 3,87
0
4
3
2
1
8
7
6
5
PSYCHOLOGICAL/MENTAL HEALTH
PODIATRY
3.6
source: Based on the Disability, independence and Dependency situations survey, 2008 (DiDss).
of particular interest are specialised rehabilitation services, which in most cases are aimed at improving specific problems resulting from disability. except for podiatry services, other services are used much more by young people and those in the working age population than by those 65 years of age and older (graph 3.6).

ass
ista
nC
e, B
eneF
its
an
D s
erV
iCes
Psychological and/or mental health services are the most frequently used: 108,000 persons of working age and 32,000 persons 65 years of age and older had used these services in the two weeks prior to the survey. the next most frequently used rehabilitation service was medical-functional rehabilitation (used by 87,000 and 52,000 persons in those age groups respectively).
social services (such as telephone assistance, programmed home care and home help) were used much more often by elderly people with disabilities than by other age groups, especially by women (graph3.7).
GraPh 3.7: Men and women with disabilities aged 65 and older who used social services in the two weeks prior
to the survey (in percentages)
0
1
2
3
4
5
6
7 Mujeres
Hombres
Ayuda a domicilioAtención domiciliaria programadaTeleasistencia
PERCENTAGE OF PERSONS WITH DISABILITIES AGED 65 AND OLDER
SERVICES USED IN PREVIOUS TWO WEEKS
Men Women
TELEPHONE ASSISTANCE PROGRAMMED HOME CARE
Hombres MujeresTeleasistencia 1,49 2,99Atención domiciliaria programada 3,14 4,43Ayuda a domicilio 2,67 4,15
0
4
3
2
1
7
6
5
HOME HELP
3.7
source: Based on the Disability, independence and Dependency situations survey, 2008 (DiDss).
Most rehabilitation and social services were provided by the state free of charge, particularly for those over 64 years of age. However, in the working age population, podiatry services were paid for privately in more than half of the cases, and medical-functional rehabilitation, speech-language therapy and ortho-prosthetic rehabilitation in over a third of the cases. Psychological and mental health services were more frequently provided by the public sector: 79% of those with disabilities in the working age population received these services free of charge. telephone assistance and home care were mainly provided by the public sector; only one out of ten users paid private providers for this type of care, while one out of twenty paid through a mixed payment system or co-payment. Finally, home care for those of working age with disabilities was free in 63% of the cases, provided through direct payment in 13%, and a mixed payment system in 23% of the cases.
a quarter of a million persons with disabilities, primarily women, indicate that at some time they have needed some type of healthcare or social service but have not received it. among the many reasons given to explain this, the following stand out: waiting lists (31%); not having money to pay for the service (21%); the service they need not being available in their area (15%), and not meeting all of the requirements for gaining access to services (9%).
3.5. DISabIlIty CertIfICate
The official system established in Spain to determine that a person has a ‘handicap’ dates from 1984 and was intended to fit the conceptualisation developed by the World Health organization

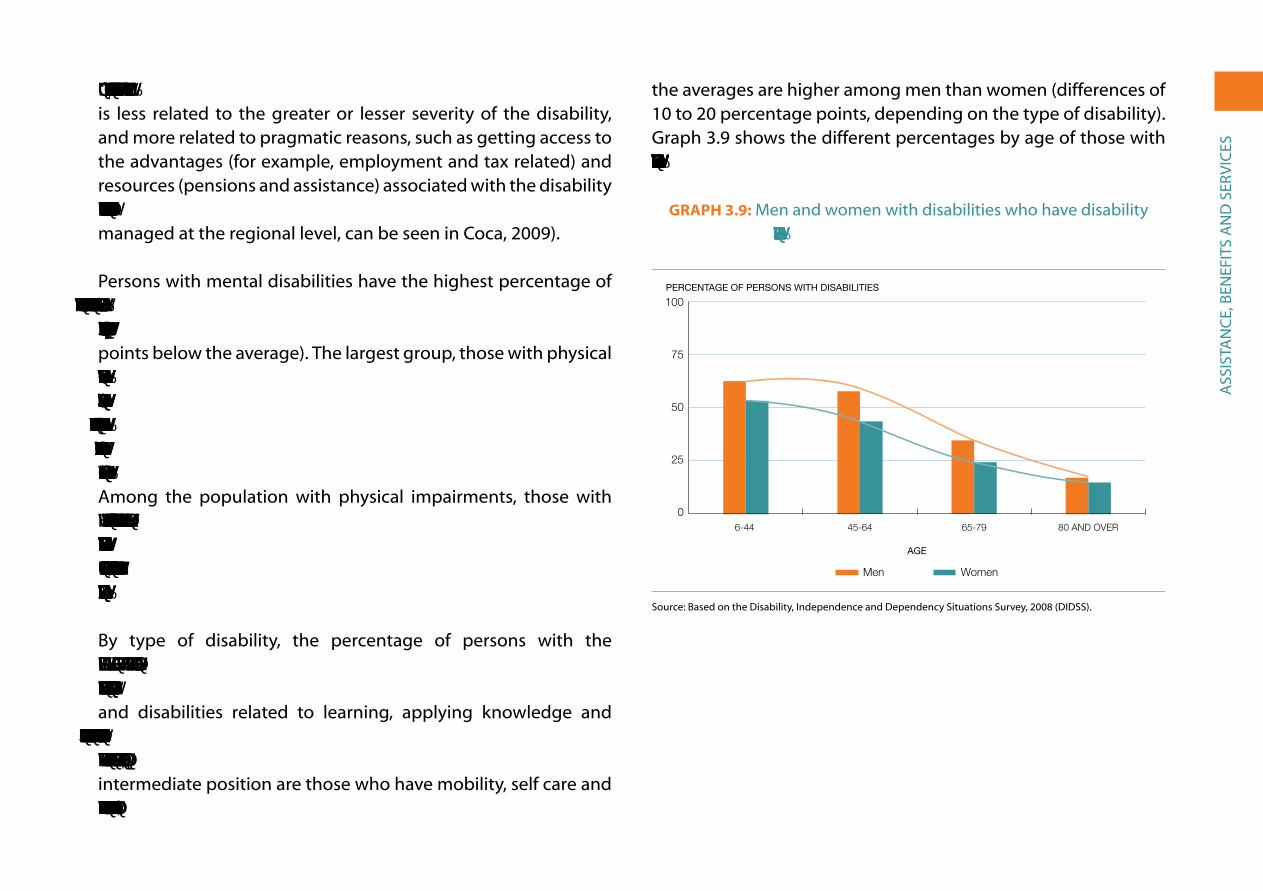
ass
ista
nC
e, B
eneF
its
an
D s
erV
iCes
and 60%, respectively). In both cases, access to the certificate is less related to the greater or lesser severity of the disability, and more related to pragmatic reasons, such as getting access to the advantages (for example, employment and tax related) and resources (pensions and assistance) associated with the disability certificate (a complete list of aid and specialised services, partly managed at the regional level, can be seen in Coca, 2009).
Persons with mental disabilities have the highest percentage of disability certificates (49%, 14 points above the average), and those with sensory impairments have the lowest percentage (29%, six points below the average). the largest group, those with physical impairments, receives the certificate at a rate close to the overall average (36%). Among those with sensory impairments with the certificate, those who have language, speech and voice problems have the highest proportion (48%), followed by those with visual problems (30%) and finally those with auditory problems (25%). among the population with physical impairments, those with the highest percentage of certificates are those with nervous system disorders (52%) followed by the viscerally affected (32%) and osteoarticular problems (31%). In all cases, there are more men with the certificate than women.
By type of disability, the percentage of persons with the certificate is higher among those who have trouble forming affective relationships (55%), communication disabilities (49%) and disabilities related to learning, applying knowledge and developing tasks (also 49%). The percentage is much lower among those with hearing (25%) and visual (31%) impairments. In an intermediate position are those who have mobility, self care and domestic life-related disabilities (in all three cases 37%). Again,
the averages are higher among men than women (differences of 10 to 20 percentage points, depending on the type of disability). graph 3.9 shows the different percentages by age of those with different types of disabilities that have the disability certificate.
GraPh 3.9: Men and women with disabilities who have disability certification, by age (in percentages)
0
25
50
75
100 Mujeres
Hombres
80 y +65-7945-646-44
PERCENTAGE OF PERSONS WITH DISABILITIES
Men Women
80 AND OVER65-7945-64
AGE
6-44
Hombres Mujeres6-44 62,6 53,245-64 57,8 43,365-79 34,4 24,380 y + 16,9 14,7
0
25
50
75
100
3.9source: Based on the Disability, independence and Dependency situations survey, 2008 (DiDss).
Ca
re F
or
Pers
on
s W
itH
Dis
aBi
Liti
es
iV. Care For Persons WitH DisaBiLities
the DiDss-2008 survey reveals the main characteristics of those who provide care for persons with disabilities. the applied questionnaire asks general questions about all the caregivers, without distinguishing the specific characteristics of each case, while the specific questionnaire focuses only on the primary caregivers. (Disabled persons residing in institutions are not considered.)
as seen in the previous chapter, assistance provided by others is vital for persons with disabilities to be able to perform those actions affected by their disability. approximately, 2.1 million persons receive such care, nearly 60% of all those with limiting disabilities. In what follows, we shall attempt to profile these caregivers, mostly female relatives who try to ease others’ lives often at the expense of their own health, their career goals and their leisure time. First, we will provide a general overview of all caregivers, who number approximately three million, and then we will focus on primary caregivers, around two million persons.
4.1. Care WIthIn anD froM outSIDe the hoMe
Care is provided by close relatives within the home in two-thirds of the cases: the parents when the disabled person is their own child, spouses or partners when the other spouse or partner has a disability, or adult children when the person who requires care is an elderly parent. siblings, grandparents and other relatives who reside in the family home may also provide complementary care. this constitutes informal, family care, to which we must add the 65,000 professionals who also provide in-home care (75% of whom are women) and who work and reside full time in the family home to carry out their jobs. in this group, there are 1.27 million beneficiaries of these services and 1.57 million persons providing care, as in many cases there are multiple caregivers that provide assistance. In total, family members account for 96% of this care, with the rest coming from live-in employees.
in addition, there are caregivers who do not reside in the home of the person with disabilities, accounting for approximately one-third of the cases of personal support (625,000 beneficiaries, attended by 977,000 caregivers according to the survey). again, the majority
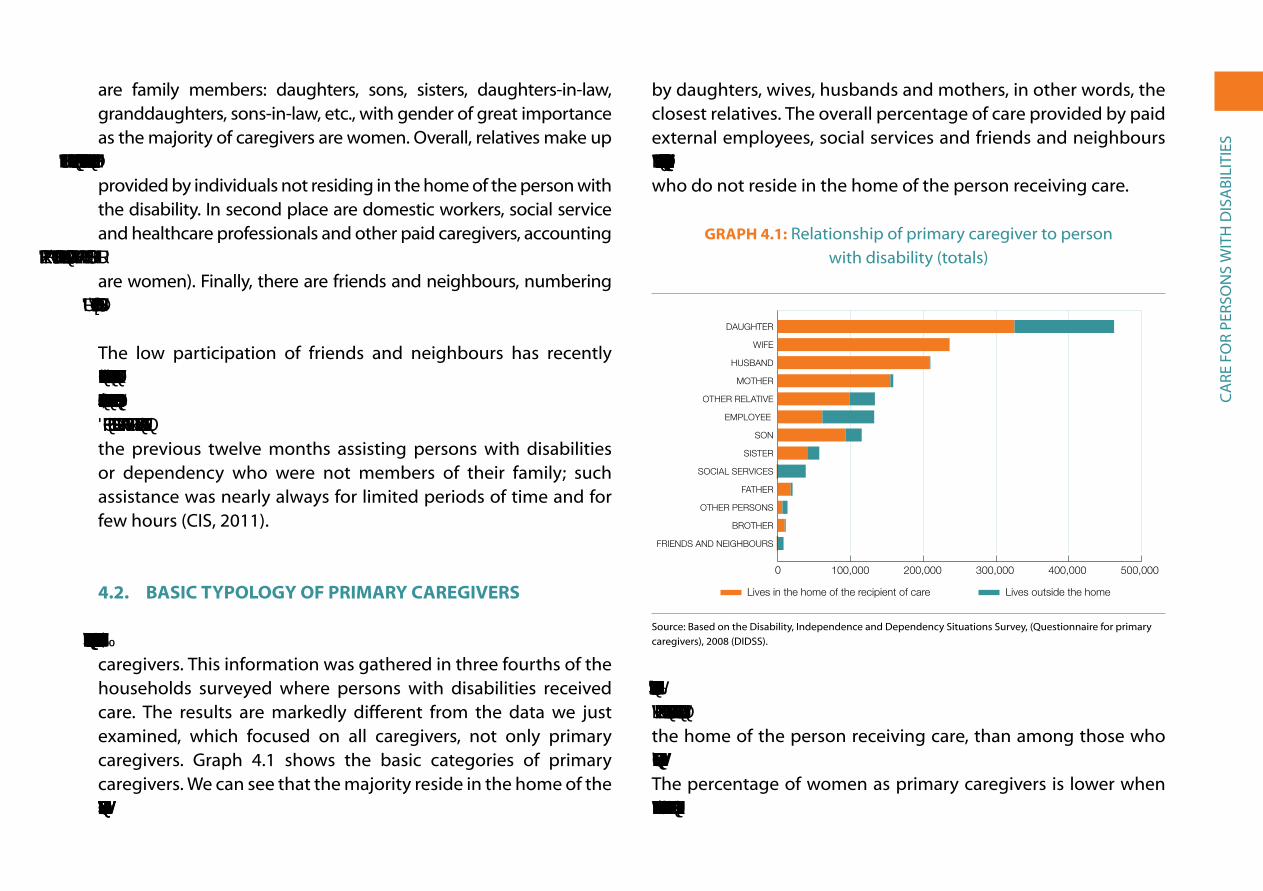
Ca
re F
or
Pers
on
s W
itH
Dis
aBi
Liti
es
are family members: daughters, sons, sisters, daughters-in-law, granddaughters, sons-in-law, etc., with gender of great importance as the majority of caregivers are women. overall, relatives make up 632,000 caregivers in this category, accounting for 65% of the care provided by individuals not residing in the home of the person with the disability. in second place are domestic workers, social service and healthcare professionals and other paid caregivers, accounting for 310,000 people or 31% of the total in this category (90% of whom are women). Finally, there are friends and neighbours, numbering approximately 35,000 or 4%.
the low participation of friends and neighbours has recently been verified by a survey conducted by the CIS in March 2011. According to this survey only 4.4% of adults (4.9% women and 3.8% men) had carried out some form of volunteer work in the previous twelve months assisting persons with disabilities or dependency who were not members of their family; such assistance was nearly always for limited periods of time and for few hours (Cis, 2011).
4.2. baSIC tyPoloGy of PrIMary CareGIVerS
A specific survey was carried out to collect information on primary caregivers. this information was gathered in three fourths of the households surveyed where persons with disabilities received care. the results are markedly different from the data we just examined, which focused on all caregivers, not only primary caregivers. graph 4.1 shows the basic categories of primary caregivers. We can see that the majority reside in the home of the person receiving care (78,5%) and that most support is provided
by daughters, wives, husbands and mothers, in other words, the closest relatives. the overall percentage of care provided by paid external employees, social services and friends and neighbours is 11%; rising to 34% percent when only considering caregivers who do not reside in the home of the person receiving care.
GraPh 4.1: relationship of primary caregiver to person with disability (totals)
0 100 200 300 400 500
Resid fuera
Resid Hogar
Amigos y vecinosHermano
Otras personasPadre
Servicios socialesHermana
HijoEmpleada-o
Otro parienteMadre
MaridoEsposa
Hija
Lives in the home of the recipient of care Lives outside the home
Resid Hogar Resid fueraHija 326,300 137,400Esposa 236,600 300Marido 209,600 700Madre 155,100 4,000Otro pariente 98,600 35,200Empleada-o 61,300 71,500Hijo 93,200 22,400Hermana 40,500 16,600Servicios sociales 0 38,400Padre 17,700 300Otras personas 6,200 7,100Hermano 9,400 1,400Amigos y vecinos 0 7,800
0 100,000 200,000 300,000 400,000 500,000
FRIENDS AND NEIGHBOURS
BROTHER
OTHER PERSONS
FATHER
SOCIAL SERVICES
SISTER
SON
OTHER RELATIVE
EMPLOYEE
MOTHER
HUSBAND
WIFE
DAUGHTER
4.1
source: Based on the Disability, independence and Dependency situations survey, (Questionnaire for primary caregivers), 2008 (DiDss).
Three quarters of primary care is provided by women. This figure is much higher (90%) among caregivers who do not reside in the home of the person receiving care, than among those who do (73%). Seventy two percent of related caregivers are women. the percentage of women as primary caregivers is lower when the care is provided by a spouse (53% are women) and higher
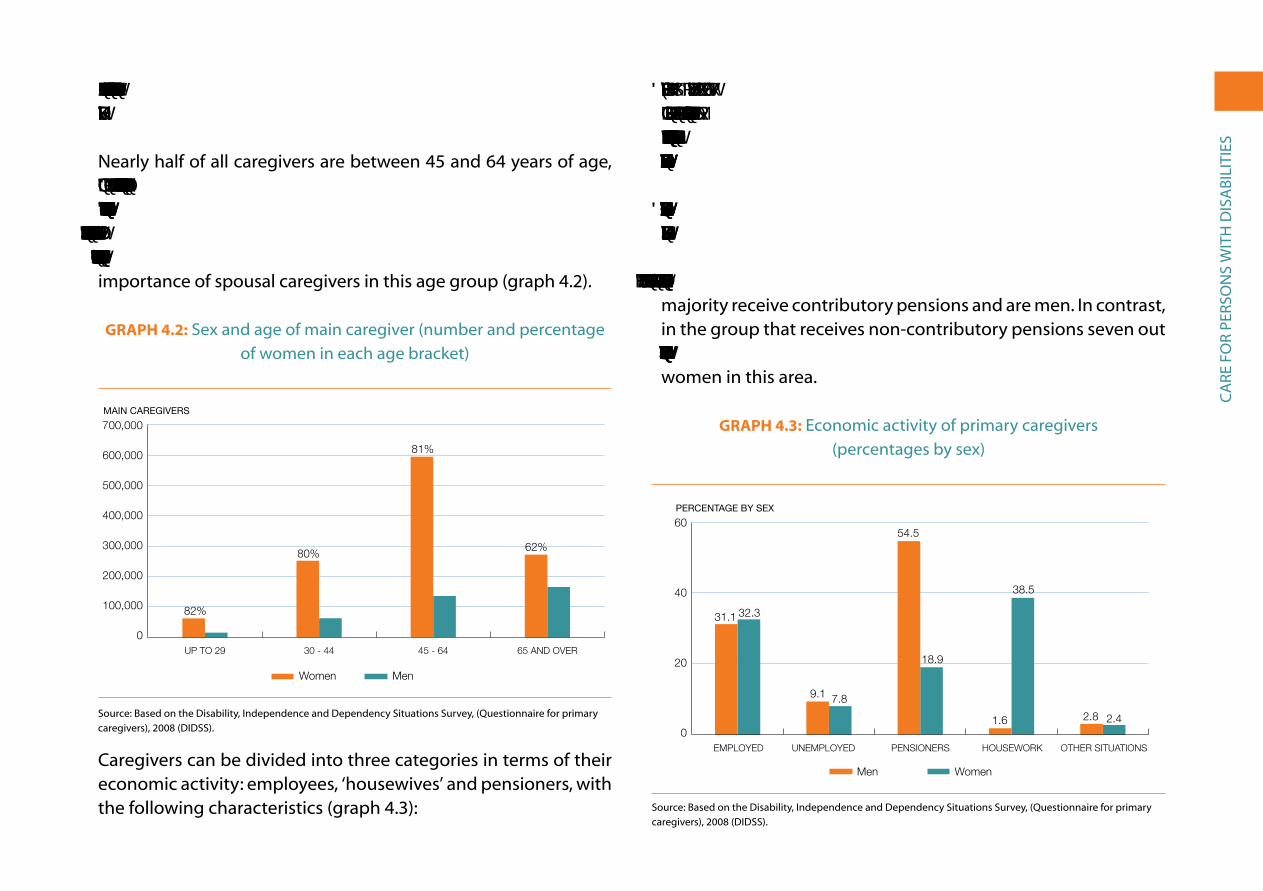
Ca
re F
or
Pers
on
s W
itH
Dis
aBi
Liti
es
when it is provided by children (80% are daughters) or parents (90% are mothers).
nearly half of all caregivers are between 45 and 64 years of age, and 81% in this age group are women. One-fourth are under 45 years of age and, again, women represent slightly over 80%. Lastly, 28% are 65 years of age or over and here the percentage of men increases to 38%, in all probability because of the increased importance of spousal caregivers in this age group (graph 4.2).
GraPh 4.2: sex and age of main caregiver (number and percentage of women in each age bracket)
0
100
200
300
400
500
600
700 Mujeres
Hombres
65 y más añosDe 45 a 64De 30 a 44Hasta 29 años
MAIN CAREGIVERS
Women Men
65 AND OVER45 - 6430 - 44UP TO 29
Mujeres HombresHasta 29 años 58,200 13,000De 30 a 44 249,800 62,400De 45 a 64 593,900 134,90065 y más años 269,300 161,900
0
400,000
300,000
200,000
100,000
500,000
600,000
82%
80%
81%
62%
700,000
4,2
source: Based on the Disability, independence and Dependency situations survey, (Questionnaire for primary caregivers), 2008 (DiDss).
Caregivers can be divided into three categories in terms of their economic activity: employees, ‘housewives’ and pensioners, with the following characteristics (graph 4.3):
• Employees make up 32% of caregivers, to which we must add another 8% among the population searching for a job. This implies an unemployment rate of 20%, nearly double the Spanish average, which at the time of the survey was 11.3%.
• Those ‘dedicated to housework’ represent 29% and women are the overwhelming majority (98.7%).
• Pensioners represent 28%, mostly in the 65 and up age group. The majority receive contributory pensions and are men. in contrast, in the group that receives non-contributory pensions seven out of eight are women, which again reflects discrimination against women in this area.
GraPh 4.3: economic activity of primary caregivers (percentages by sex)
0
20
40
60Mujeres
Hombres
Otra situaciónLabores hogarPensionistasEn paroCon empleo
PERCENTAGE BY SEX
Men Women
OTHER SITUATIONSPENSIONERSUNEMPLOYED EMPLOYED HOUSEWORK
Hombres MujeresCon empleo 31.1 32.3En paro 9.1 7.8Pensionistas 54.5 18.9Labores hogar 1.6 38.5Otra situación 2.8 2.4
0
20
40
31.1 32.3
9.1 7.8
54.5
18.9
1.6
38.5
2.8 2.4
60
4.3
source: Based on the Disability, independence and Dependency situations survey, (Questionnaire for primary caregivers), 2008 (DiDss).
Ca
re F
or
Pers
on
s W
itH
Dis
aBi
Liti
es
4.3. Work-relateD anD fInanCIal ProbleMS. benefItS DerIVeD froM the DePenDenCy laW
over half of those who are primary caregivers say they face work-related or financial problems resulting from providing care. The most common is not being able to work outside the home, which affects 46% of those who say they have problems. Furthermore, nearly one-fourth (23%) have had to quit their jobs as a result of having to provide care. the second most common problem is an increase in household financial difficulties, affecting 40%. other problems are the negative repercussion on caregivers’ careers (21%), problems complying with work schedules (16%) and having to reduce the number of hours worked (16%). The intensity of these problems differs depending on the profile of the caregiver:
• Caregiving mothers are those that most often acknowledge problems (71%). Not being able to work outside the home (57%) and financial difficulties (42%) are the two most common problems.
• The percentage of caregiving fathers that have problems as a result of providing care is close to the general average (54%). What most stands out for this group of caregivers is that one-third of them say that their professional careers have suffered.
• Spousal caregivers acknowledge having problems less often than other caregivers, although there are significant differences
between men (without problems in 70% of the cases) and women (without problems in 52% of the cases). The most common issue for both is economic hardship; husbands mention having to quit their jobs, while women refer to not being able to work outside the home.
• Caregiving daughters have more problems than their male counterparts, 64% vs. 50%. The most important problem for daughters is not being able to work outside the home, and for sons, increased financial difficulties.
• Sibling caregivers have fewer problems than the average. For sisters, the most frequently mentioned problem is not being able to work outside the home, while brothers more often cite financial difficulties.
In its first five years (2007-2011) the Dependency Law has contributed to alleviating the economic hardship many caregiving families face by providing economic benefits to a growing number of caregivers. according to information supplied by social security, in september 2011 there were 168,710 persons benefiting from the Special Agreement for Non-Professional Caregivers of Dependent Persons, although this is only a small percentage (9.5%) of the total of 1.8 million familial primary caregivers. Ninety three percent of those benefiting from this agreement are women, and by age there is a relatively significant percentage among older persons: 22% being 60 years of age and over and 34% being between 51 and 60 years of age.

Ca
re F
or
Pers
on
s W
itH
Dis
aBi
Liti
es
4.4. MoSt CoMMon taSkS anD aMount of tIMe SPent ProVIDInG Care
the most common tasks performed by caregivers are related to personal hygiene and care (dressing and undressing, bathing and grooming), followed by housework (cooking, shopping and other tasks), tasks related to medical attention (administering medication, visiting the doctor) and those related to mobility (climbing and descending stairs, going outdoors and getting in and out of bed).
graph 4.4 shows a ranking of the main tasks and their distribution according to the age of the persons with disabilities being cared for. Persons 65 years of age and over receive 72% of the assistance provided, while those between 6 and 64 receive the remaining 28%. In turn, persons over 80 receive 47% more assistance than those between the ages of 65 and 79. only assistance with one of the recorded tasks –managing money– is provided more frequently to those under 65 years of age than to those who are over 65.
Care is provided for more than 8 hours a day in nearly half of the cases, between 3 and 8 hours a day in one-third of the cases, and less than 3 hours a day in one-fifth. The average number of hours dedicated to caring for men is higher than for women (6.9 hours per day versus 6.6 hours). Furthermore, care dedicated to men is over 8 hours a day in 52% of the cases, while for women in only 47%. This is further evidence of discrimination; women provide more care and receive less.
GraPh 4.4: Most common types of assistance provided by main caregiver, by age group of persons with disability (totals)
6-64 65-79 80 and over
6-64 años 65-79 años 80 y más añosVestirse/Desvestirse 188,5 191,3 318,4Bañarse/Ducharse 171,3 191,7 313,3Asearse/Arreglarse 170,6 183,9 303,9Preparar comidas 169,8 152,7 224,9Hacer compras 170,9 170,8 181,6Otras tareas domésticas 154,1 158,4 174,1Tomar medicación (control) 112,6 103,9 171,6Ir al médico 104,7 110,2 125Subir o bajar escaleras 76 104,9 154Salir/desplazarse por la calle 96,8 94,8 107,8Acostarse/Levantarse cama 69,2 76,5 127,3Comer 72,2 63,2 133Desplazarse por la casa 52 76,3 139,3Cambiar pañales 26,6 47,9 139,1Hacer gestiones 62,8 54,8 60,3Utilizar el transporte público 37,6 26,7 20,7Administrar el dinero 42,8 18 22,3Abrocharse los zapatos 31,8 23,8 16,6Utilizar el baño a tiempo 19,9 18 23,9Utilizar el teléfono 17,7 13 16
0 250
PERSONS WITH DISABILITIES IN THOUSANDS
500 750
0 250 500 750
80 y más años
65-79 años
6-64 años
Utilizar el teléfonoUtilizar el baño a tiempo
Abrocharse los zapatosAdministrar el dinero
Utilizar el transporte públicoHacer gestiones
Cambiar pañalesDesplazarse por la casa
ComerAcostarse/Levantarse cama
Salir/desplazarse por la calleSubir o bajar escaleras
Ir al médicoTomar medicación (control)
Otras tareas domésticasHacer compras
Preparar comidasAsearse/ArreglarseBañarse/Ducharse
Vestirse/Desvestirse
USING THE TELEPHONE
GETTING TO THE BATHROOM ON TIME
TYING SHOELACES
MANAGING MONEY
PUBLIC TRANSPORTATION
DEALING WITH PAPERWORK
CHANGING DIAPERS
GETTING AROUND THE HOUSE
EATING
GETTING IN AND OUT OF BED
GOING OUTSIDE/ GETTING ABOUT ON THE STREET
NEGOTIATING STAIRS
GOING TO DOCTOR
TAKING MEDICATION (SUPERVISION)
OTHER DOMESTIC CHORES
SHOPPING
FOOD PREPARATION
PERSONAL HYGIENE
BATHING/SHOWERING
DRESSING/UNDRESSING
4.4source: Based on the Disability, independence and Dependency situations survey, (Questionnaire for primary caregivers), 2008 (DiDss).
4.5. MaIn ProbleMS In the CareGIVInG relatIonShIP
Forty three percent of those who provide care state that they have no special difficulties in doing so. However, 57% admit to facing difficulties, among which a lack of ‘physical strength’ stands out; nearly 70% who say they have difficulties mention this

Ca
re F
or
Pers
on
s W
itH
Dis
aBi
Liti
es
as a problem. two other frequent problems are ‘having doubts about how to do it’ (27%) and ‘needing more specialised training’ (26%). Moreover, a quarter of those who experience difficulties believe that the person they care for ‘doesn’t collaborate or resists attempts to help’. this points to a problem in the caregiving relationship, which we will address shortly.
among the different types of caregivers, those who experience fewer problems in the caregiving relationship are mothers, fathers, spouses and siblings; in other words, direct family members of the same or older generation than the person being cared for. The caregiving relationship is more difficult for children and for sons in particular. However, those who most frequently say they have problems in providing care are non-family caregivers, such as social service professionals, employees, neighbours and friends (three-quarters of non-family caregivers experience difficulties in the caregiving relationship (graph 4.5)). This data reveals that there are fewer conflicts when the caregivers are related to the recipient of care. the case of mothers, who have the fewest problems as caregivers, marks a striking contrast with that of social service professionals (whether employees of public or non-profit agencies), who experience the most difficulties. We might hypothesise that these professionals do not have the necessary skills and are not up to the necessary standards for them to perform their job successfully (their most frequent complaints are about their lack of physical strength, resistance from the person they provide care to and their lack of necessary knowledge). it is also possible that social service professionals attend to a higher proportion of severe cases, which are more likely to present difficulties.
GraPh 4.5: Caregivers who experience special difficulties in the caregiving relationship (in percentages)
0 10 20 30 40 50 60 70 80 90 100
Sin di�cultades
Tiene di�cultades en la relación de ayuda
Servicios sociales
Amigos y vecinos
Empleadas/os
Hijo
Hija
Hermana
Cónyuge o pareja
Padre
Hermano
Madre
Tiene di�cultades en la relación de ayuda Sin di�cultadesMadre 29,8 70,2Hermano 36,0 64,0Padre 37,0 63,0Cónyuge o pareja 39,7 60,3Hermana 40,9 59,1Hija 41,6 58,4Hijo 51,3 48,7Empleadas/os 69,0 31,0Amigos y vecinos 69,4 30,6Servicios sociales 75,6 24,4
0%
20% 40% 60% 80% 100%
SOCIAL SERVICES
FRIENDS ANDNEIGHBOURS
EMPLOYEES
SON
DAUGHTER
SISTER
SPOUSE OR PARTNER
FATHER
BROTHER
MOTHER
4.5
Does not have difficultiesHas difficulties
source: Based on the Disability, independence and Dependency situations survey, (Questionnaire for primary caregivers), 2008 (DiDss).
neither the DiDss-2008 nor the survey conducted on primary caregivers address the problems that can arise in the relationship between persons with disabilities and their caregivers (most often a female family member). a CireM Foundation study concludes that family members sometimes interfere with the development of an independent life for the family member they are caring for: ‘We have seen that families may prioritise their own interests over those of the person with the disability, making unilateral decisions and refusing to engage in constructive dialogue on issues related to their achieving greater independence (for example, related to maintaining sexual, intimate or romantic relationships)’ (CireM

Ca
re F
or
Pers
on
s W
itH
Dis
aBi
Liti
es
Foundation, 2004: 187). Based on this analysis, it would be preferable to encourage families to employ someone to provide ‘personal assistance’; as a result, both parties, caregiver and the recipient of care, would not be bound by emotional ties and would have greater independence: in the case of the person receiving care, independence to develop as an equal to others and in the case of the caregiver, independence in carrying out their work in a professional manner (Lobato, 2005 and arnau et al., 2007).
4.6. ProbleMS relateD to free tIMe, faMIly lIfe anD health
three quarters of those who provide care experience problems related to leisure and family relations. the most common problem is not having enough free time (mentioned by 85% of those who suffer problems), followed by not being able to go on vacation (64%) and not having time to see friends (56%). These are followed by two paradoxical problems: caring for someone else does not allow them to take care of themselves (42%) or other persons (27%). Lastly, there are three less common problems, all associated with familial issues: spousal conflicts (9%), not being able to form a family (4%) and not being able to have children (3%).
the impact of these three types of problems (not having enough leisure time, neglect of oneself or others and family conflicts) differs depending on the caregiver’s sex and other characteristics. graph 4.6 shows the percentages for each of these problems for men and women. in general, problems related to free time and family conflicts are more prevalent among men, whereas women are more concerned about not having time to care for themselves and others. if we look at the types of caregivers, the most common
problem in all cases is the lack of free time. in general, problems are distributed fairly equally. the only noteworthy differences are that wives and daughters complain more often than husbands and sons about not being able to help others, and both sons and daughters and brothers and sisters complain more frequently about not being able to form a family.
two-thirds of all caregivers claim to have suffered health problems directly related to providing care. the most frequent health problem is fatigue, which affects 78% of those who have problems, followed by general deterioration of health (53%), and depression (47%); 25% have needed treatment to handle the caregiving situation, and 15% suffer a variety of different health problems.
GraPh 4.6: Problems related to free time and family life among caregivers, by sex (in percentages)
0 10 20 30 40 50 60 70 80 90 100
Mujeres
Hombres
Problemas de ocio
Descuido de sí o de otros/as
Con�ictos y problemas familiares
Women Men
Hombres MujeresCon�ictos y problemas familiares 6,1 5,1Descuido de sí o de otros/as 17,1 25,5Problemas de ocio 76,8 69,4
0 25 50 75 100
PROBLEMS RELATED TO LEISURE
NEGLECT OF ONESELF AND OTHERS
FAMILY CONFLICTS/PROBLEMS
PERCENTAGES FOR EACH PROBLEM BY SEX (TOTAL= 100)
4.6
source: Based on the Disability, independence and Dependency situations survey, (Questionnaire for primary caregivers), 2008 (DiDss).
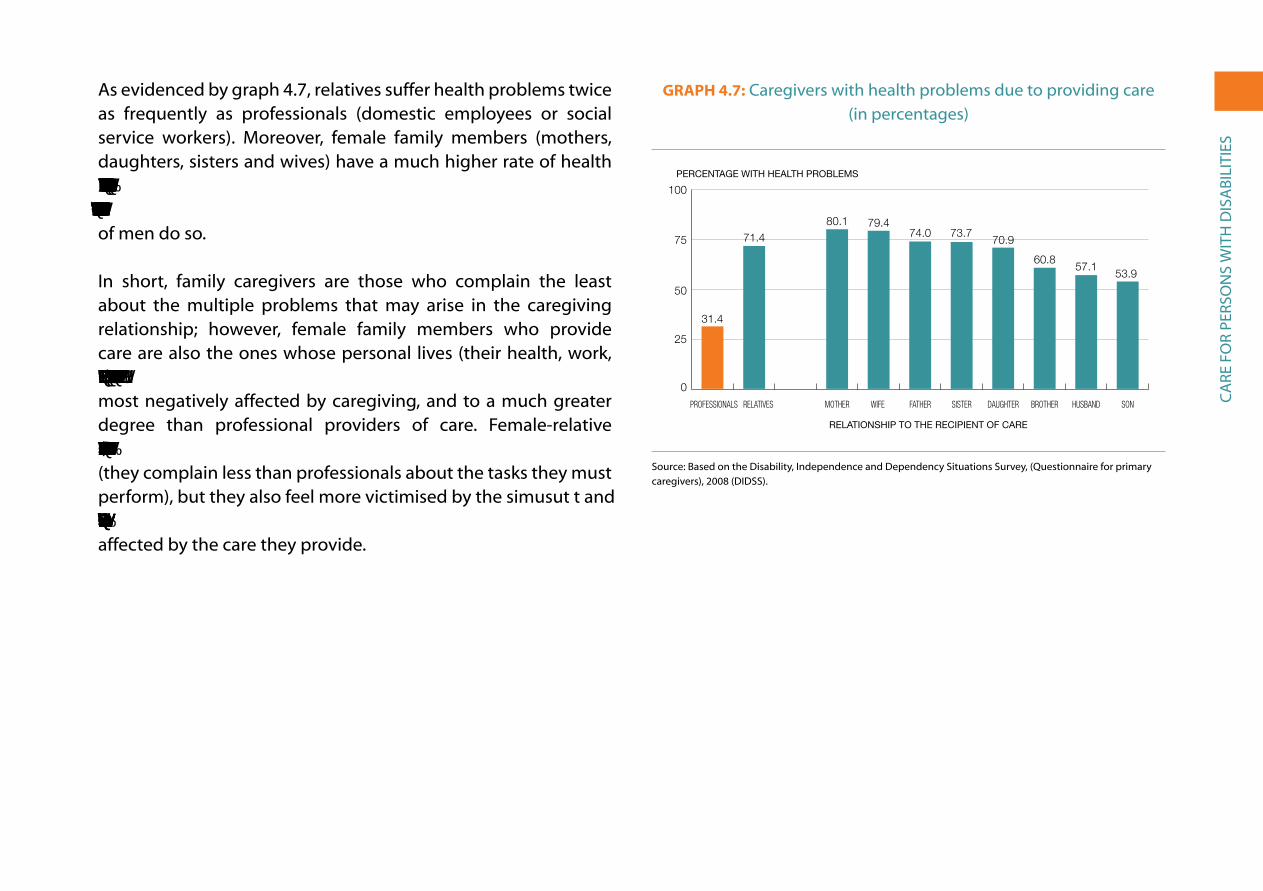
Ca
re F
or
Pers
on
s W
itH
Dis
aBi
Liti
es
as evidenced by graph 4.7, relatives suffer health problems twice as frequently as professionals (domestic employees or social service workers). Moreover, female family members (mothers, daughters, sisters and wives) have a much higher rate of health issues than their male counterparts. Specifically, 75% of women caregivers suffer care-related health problems, whereas only 59% of men do so.
in short, family caregivers are those who complain the least about the multiple problems that may arise in the caregiving relationship; however, female family members who provide care are also the ones whose personal lives (their health, work, finances, personal and family relationships, free time, etc.) are most negatively affected by caregiving, and to a much greater degree than professional providers of care. Female-relative caregivers ‘shoulder the burden’ with a greater spirit of sacrifice (they complain less than professionals about the tasks they must perform), but they also feel more victimised by the simusut t and they more readily admit that their personal lives are significantly affected by the care they provide.
GraPh 4.7: Caregivers with health problems due to providing care (in percentages)
0
25
50
75
100
HijoEsposoHermanoHijaHermanaPadreEsposaMadreParientesProfesionales
PERCENTAGE WITH HEALTH PROBLEMS
C. Públicos C. PrivadosE. Infantil 81,60 18,30E. Primaria 83,70 16,20ESO 80,70 19,20Bachillerato 83,60 16,30Ciclos Formativos 78,10 21,80Garantia Social 71,40 28,50E. Especial 65,30 34,60
RELATIONSHIP TO THE RECIPIENT OF CARE
Profesionales 31,4Parientes 71,7Madre 80,1Esposa 79,4Padre 74,0Hermana 73,7Hija 70,9Hermano 60,8Esposo 57,1Hijo 53,9
0
25
50
75
100
SONHUSBANDBROTHERDAUGHTERSISTERFATHERWIFE MOTHERRELATIVES PROFESSIONALS
4.7
31.4
71.480.1 79.4
74.0 73.770.9
60.857.1
53.9
source: Based on the Disability, independence and Dependency situations survey, (Questionnaire for primary caregivers), 2008 (DiDss).
eDU
Cat
ion
aL
Pro
FiLe
oF
Pers
on
s W
itH
Dis
aBi
Liti
es
V. eDUCationaL ProFiLe oF Persons WitH DisaBiLities
education level is primarily determined by the education obtained in childhood, adolescence and the early years of adult life, though it may be subsequently supplemented by additional formal or non-formal studies throughout life. in the case of the population analyzed in this study, only a minority (14%) had a disability before the age of 15, which means that the initial schooling of the vast majority was not affected by their disability. given these circumstances, in this chapter we first offer an overview of the general education level of persons with disabilities and then differentiate between two groups: those who had disabilities before 16 years of age (just over half a million persons) and those whose disabilities began after age 16. then, we look at the education level of persons with disabilities of working age (16-64 years). thirdly, we examine the type of studies that were being pursued by those over 15 years of age with disabilities at the time of the survey (115,000 persons). Finally, we describe the educational pathways followed by children between six and 15 years of age with disabilities (just under 80,000 persons).
5.1. eDuCatIon leVel In General anD by aGe at the onSet of DISabIlIty
the 2008 survey (like that of 1999) revealed that the education level of persons with disabilities was much lower than that of the general population in spain. For example, the illiteracy rate among those with disabilities (10.9%) was nearly five times that of the overall national average in 2008 (2.4%). In terms of primary school education, the percentage of persons with disabilities that did not complete primary school is four times that of the general population (34.2% vs. 8.9%); at the opposite end of the spectrum, the number of persons with disabilities who have pursued university studies is three times below the national average (7.3% vs. 22.8%). Age may cause an important bias in terms of the previous comparisons, as the proportion of persons with disabilities over 64 years of age (57.4% of this group) is much higher than their proportion in the general population (16.5%). it is therefore of greater interest to compare the education levels of the working age population (between 16 and 64 years of age), which we will do in the following section.

eDU
Cat
ion
aL
Pro
FiLe
oF
Pers
on
s W
itH
Dis
aBi
Liti
es
education levels vary greatly by sex: the illiteracy rate among women with disabilities is much higher (13.1%) than that of men (7.3%), and the proportion of men with university degrees is significantly higher (9%) than that of women (5.8%).
if we consider the origin of disabilities, the lowest levels of education are found among those with multiple impairments (59% have not finished primary school), mental impairments (56%) and language, speech and voice impairments (53%). In all three cases, the percentage of women that have not finished primary school is over 60%, while that of men is around 50%. At the opposite end of the spectrum, the highest levels of education are found among those with nervous system impairments (9% have university degrees, with equal levels among men and women) and with hearing impairments; in this case, there is a significant difference between men (10% with a university degree) and women (5%).
schooling occurs almost exclusively in childhood and adolescence; thus, it is appropriate to distinguish between the level of educational attainment for those who already had disabilities in childhood and adolescence (half a million persons) and those who did not (3 million). the latter group, in principle, should have average education levels similar to those of the population without disabilities. as indicated in the qualitative study previously cited from the ioé Collective and CiMoP (spanish acronym for Communication, image and Public opinion), ‘in the cases of acquired disability (after 16 years of age), family and educational socialisation has already taken place; in addition, in many cases prior to the onset of disability, the individuals have
already consolidated their career and formed a family. thus, the construction of individual identity is not ‘marked’ by disability, as it was previously established in childhood’ (ioé Collective and CIMOP, 1998: 233). Fifty eight percent of the cases of congenital/childhood disability appeared at birth or during the first year of life, and the remaining 42%, after the first year of life and before age 16. therefore, the majority of persons with disabilities in this group began schooling already living with a disability.
graph 5.1 shows the education level of both groups (the population with congenital/ childhood disabilities and that with disabilities acquired after age 15) along with that for the general population. the illiteracy rate of those with congenital or acquired disabilities in childhood is twice that of those whose disabilities began in adulthood; however, a higher percentage of the former complete the different stages of secondary school and have university degrees. the higher illiteracy rate is the result of the severity of certain perinatal disabilities, which affect mental capability; in other cases, however, disability has not been an obstacle in attaining an education level beyond the average for persons with disabilities acquired after age 15 (though still far from the average education level of the general population). Perinatal and childhood disabilities are less influenced by the socio-economic status of households than the cases of disability occurring in adulthood, which are more closely linked to illness and accidents, the prevalence of which is higher in lower socio-economic classes, which also have lower education levels.

eDU
Cat
ion
aL
Pro
FiLe
oF
Pers
on
s W
itH
Dis
aBi
Liti
es
GraPh 5.1: education level of persons with disabilities, by age of onset of disability (before or after 16 years of age, in percentages)
0
10
20
30
40 Población general
Congénita-infantil (<16 años)
Con discapacidad sobrevenida (>15 años)
Estudios SuperioresSecundaria 2ª etapaSecundaria 1ª etapaPrimaria completaPrimaria incompletaAnalfabetos/as
PERCENTAGE OF THE POPULATION
Con discapacidad sobrevenida (>15 años) Congénita-infantil (<16 años) Población general Total_PcD Analfabetos/as 9,9 17,1 2,4 10,9 358,0 4,580050893Primaria incompleta 36,4 20,2 8,9 34,2 283,0 3,829897309Primaria completa 30,0 25,3 20,8 29,3 41,2 1,411587697Secundaria 1ª etapa 8,9 13,8 25,0 9,6 -61,7 2,613347651Secundaria 2ª etapa 8,2 12,6 20,1 8,8 -56,4 2,292499242Estudios Superiores 6,7 11,0 22,8 7,3 -68,1 3,13854383
0
10
20
30
40
General populationCongenital-infancy (before age 16)
With disabilities acquired (after age 15)
HIGHEREDUCATION
SECONDARY3ND CYCLE
SECONDARY1ST CYCLE
PRIMARYCOMPLETED
PRIMARYINCOMPLETE
ILLITERATE
5.1
source: Based on the Disability, independence and Dependency situations survey, 2008 (DiDss) for persons with disabilities aged six years and older and the economically active Population survey (eaPs) for the general population aged 16 and over, averages 2008.
5.2. eDuCatIon leVel of PerSonS WIth DISabIlItIeS of WorkInG aGe: one-fourth haVe not fInISheD PrIMary eDuCatIon
the education level of persons of working age (16-64 years old) with disabilities is still much lower than that of the general population, although the education level of both groups has significantly improved with respect to ten years earlier (table 5.1). the gap between the two has been reduced, especially in regards to the percentage of persons with higher education: in 1999, the percentage of persons with disabilities of working age with a higher education degree was three times lower than the percentage for the general population; in 2008, it was 2.2 times lower. similarly, differences in secondary education graduation rates have been reduced by more than one-third. However, inequality has increased in the sector of the population that has not finished primary school, in other words, those who dropped out of school early: early dropout rates were three times higher in 1999, and in 2008 five times higher.
table 5.1: education Level of the working age population with disabilities and comparison with the general population in spain (1999 and 2008, in percentages)
iLLiterate PriMary inCoMPLete
PriMary CoMPLeteD
seConDary 1st CyCLe
seConDary 2nD CyCLe*
HigHer eDUCation* total
Persons with disabilities (16-64)
Men 2008 6.5 16.0 31.5 16.7 17.7 11.6 (703,697)
Women 2008 6.9 19.2 31.1 15.8 14.9 12.1 (778,277)
total 2008 6.7 17.6 31.3 16.2 16.3 11.9 (1,481,974)

eDU
Cat
ion
aL
Pro
FiLe
oF
Pers
on
s W
itH
Dis
aBi
Liti
es
Differences by sex are less significant: Among persons with disabilities as well as the general population, there are a lot more women of working age with higher education degrees than men. Particularly striking has been the increase in the number of persons with disabilities who have university degrees; the rate of increase from 1999 to 2008 was more than double that of the general population (graph 5.2).
the education level of persons with disabilities of working age varies greatly by region. We have developed an index of educational attainment (based on education level completed) on a scale from zero to ten with the following criteria: illiterate, zero points; primary incomplete, two points; primary complete, four points; 1st cycle of secondary education, six points; 2nd cycle of secondary education, eight points, and higher education, 10 points. the regions with the highest point scores are Madrid (5.89 points), the Basque Country and navarre (both with 5.82 points),
Cantabria (5.66 points) and aragon (5.38 points). the Basque Country and Cantabria are those with the highest percentage of this population with university education (20% in both cases), and Madrid is the region that has highest percentage of persons who have finished the 2nd cycle of secondary education (22%).
the regions where persons with disabilities of working age have the lowest levels of education are the Canary islands (4.39 points), Murcia (4.45 points), Castilla-La Mancha (4.49) and extremadura (4.50).
educational attainment is positively correlated with municipal population size. the average score on our index is higher in provincial capitals and in cities with over 100,000 inhabitants (5.46 points). in cities with a population between 10,000 and 100,000 inhabitants, scores average 4.80 points, and fall to 4.52 points in municipalities with less than 10,000 inhabitants. in particular, the percentage of persons with university degrees increases linearly as a function of
(Continue)
total 1999 10.8 24.1 37.0 13.7 9.2 5.2 (1,309,821)
Diference 1999-2008 –37.8 –26.8 –15.4 18.3 76.7 128.4
General population of Spain (16-64)
Men 2008 0.9 3.5 15.5 31.2 23.2 25.6 (15,582,000)
Women 2008 1.1 4.3 15.4 27.8 24.1 27.3 (15,211,500)
total 2008 1.0 3.9 15.5 29.5 23.6 26.4 (30,793,300)
total 1999 1.3 9.7 32.6 19.3 20.3 16.9 (28,981,922)
Diference 1999-2008 –21.8 –59.8 –52.5 53.0 16.5 56.4
source: Based on the Disability, independence and Dependency situations survey (DiDss), 2008 and the survey on Disabilities and impairments, 1999, for the persons with disabilities; and the economically active Population survey for the general population (annual averages for 1999 and 2008). (*) secondary 2nd cycle includes the baccalaureate and the intermediate level vocational training programme; Higher education includes the advanced level of technical-professional studies and university.

eDU
Cat
ion
aL
Pro
FiLe
oF
Pers
on
s W
itH
Dis
aBi
Liti
es
population size: 6.7% in villages; 8.4% in the municipalities with 10,000 to 20,000 inhabitants; 10.7% in those from 20,001 to 50,000 inhabitants; 12.2% in those from 50,001 to 100,000, and 15.5% in the provincial capitals and cities of over 100,000.
GraPh 5.2: Percentages of people with disabilities without primary education and with university degrees in comparison to the general
population (1999 and 2008)
0
25
50 Personas con discapacidad
Población general
A2008A1999A2008A1999
PRIMARY EDUCATION INCOMPLETE WITH HIGHER EDUCATION
General population People with disabilities
2008199920081999
1999 2008 1999 2008Población general 11,0 4,9 16,9 26,4Personas con discapacidad 34,9 24,4 5,2 11,9
5.2
11.0
34.9
4.9
24.4
16.9
5.2
26.4
11.9
0
50
source: Based on the Disability, independence and Dependency situations survey, 2008 (DiDss) for persons with disabilities aged six years and older; and the economically active Population survey for the general population aged 16 and over, averages 2008.
But the closest correlation occurs between the level of educational attainment and the income level of households in which persons with disabilities of working age live. Households with an average monthly income below € 1,500 score an average of 4.39 points on the index; those with €1,500 to €2,500, an average of 5.65 points, and more than €2,500, 6.95 points. graph 5.3 shows
the distribution of the different levels of education by income level. the proportion of persons with a university degree in households with the highest income (36.6%) is nearly triple that of middle-income households (13.8%) and six times higher than in lower-income households (5.7%). At the opposite end of the education spectrum, the proportion of persons from lower-income households who have not finished primary education (31.1%), including those who cannot read and write, is three times greater than in high income households (10.9%) and twice as high as found in middle-income households (16.1%).
GraPh 5.3: education level of persons with disabilities aged 16 to 64, by household income level (in percentages)
0
25
50
75
100 Estudios Superiores
Secundaria 2ª etapa
Secundaria 1ª etapa
Primaria completa
Primaria incompleta
Analfabetos/as
Más de 2.500 €De 1.500 a 2.500 €Menos de 1.500 €
AVERAGE HOUSEHOLD INCOME (EUROS PER MONTH)
1st cycle secondary 2nd cycle secondary Higher educationPrimary incomplete Illiterate Primary completed
OVER €2,500UNDER €1,500 €1,500-2,500
Menos de 1.500 € De 1.500 a 2.500 € Más de 2.500 €Analfabetos/as 8,6 4,3 3,4Primaria incompleta 22,5 11,8 7,5Primaria completa 33,7 30,4 20,1Secundaria 1ª etapa 16,9 17,8 12,8Secundaria 2ª etapa 12,5 21,9 19,7Estudios Superiores 5,7 13,8 36,6
0%
100%
5.3
source: Based on the Disability, independence and Dependency situations survey, 2008 (DiDss).
Finally, the higher academic qualifications of the immigrant population with disabilities between 16 and 64 years of age in

eDU
Cat
ion
aL
Pro
FiLe
oF
Pers
on
s W
itH
Dis
aBi
Liti
es
comparison to the autochthonous population are also noteworthy. the overall average score on our index for the autochthonous population is 5.05 points, compared to a score of 6.32 for those born outside of spain. By groups of countries or demographic region, the highest score recorded is for those born in Canada and the U.s. (6.96 points), followed by those from Latin america (6.94 points) and europe, excluding spain, (6.43 points). Below the spanish average are those from asia (4.89 points) and africa (3.99 points). of the two Latin american countries representing the two largest immigrant groups in spain in 2008 (ecuador and Colombia), no one interviewed was illiterate, while Colombia stands out for the percentage of higher education degrees (28.6%) and Ecuador for secondary school graduates (45.8%). As for immigrants from european countries, the average score of those from the eU25 is slightly higher (6.08 points) than those from romania and Bulgaria (5.67).
5.3. ContInuInG eDuCatIon: loW attenDanCe rateS
According to the 2008 survey, 7.7% of working age persons with disabilities (both men and women) were enrolled in some type of educational programme (formal or non-formal), in absolute numbers approximately 115,000 people. this rate is much lower than that for the general population in spain, which, according to the Economically Active Population Survey that year, was 19.5% (almost three times higher). Graph 5.4 reflects these differences, distinguishing between the proportion in formal and non-formal studies.
GraPh 5.4: adults with disabilities in formal and non-formal education in comparison to the general population
(2008, in percentages)
0
5
10
15
20
25 Estudios no reglados
Estudios reglados
Personas con discapacidadPoblación general
PERCENTAAGE OF ADULT POPULATION
Non- formal educationFormal education
PERSONS WITH DISABILITIESGENERAL POPULATION
Estudios reglados Estudios no regladosPoblación general 10.3 9.2Personas con discapacidad 3.2 4.6
0
5
10
15
20
25
5.4
19.5%
7.7%
source: Based on the Disability, independence and Dependency situations survey (DiDss), 2008 for persons with disabilities aged 16 - 64 and the economically active Population survey for the general population 16 to 55 years of age, 2008 averages.
non-formal education is more common among persons with disabilities (59% of whom continue studying) than among the general population (47%). Almost half of the studies are courses lasting less than six months, just over one-third last longer than six months, and one-fifth are occupational training courses. The proportion of men and women is similar in all cases except in professional occupational training, where there are more men.
the most frequent forms of formal education are: studying in university (15,000 people or 35% of those with disabilities); intermediate-level vocational training cycles (17%); compulsory

eDU
Cat
ion
aL
Pro
FiLe
oF
Pers
on
s W
itH
Dis
aBi
Liti
es
secondary education (16%), and specific special education programmes (13%). In each of these, there is a general balance between men and women, except in compulsory secondary education, where there are more men.
among the population with disabilities, persons with mental impairments and language, speech and voice impairments have higher rates of enrolment in continuing education courses (especially in non-formal education for the former, and primarily formal education for the latter); those with visceral impairments or multiple impairments have lower enrolment rates, and all the other groups have average rates of enrolment.
5.4. SChoolInG of ChIlDren WIth DISabIlItIeS betWeen SIx anD fIfteen yearS of aGe
in the 2008 survey 78,000 children and adolescents between six and fifteen years of age had some type of disability; in other words, 1.8% of the total population in this age group (corresponding to the age of compulsory education). regarding distribution by sex, there were more boys (51,000, 2.3% of boys of this age group) than girls (27,000 or 1.3%).
Of school-age children with disabilities, 97.2% were enrolled in school, which means that 2.8% (approximately 2,000) did not attend school for various reasons. the percentage of those not attending school rose to over 10% in the following cases: 14% of boys with visual disabilities; 12% of girls with problems in carrying out household tasks; 14% of boys with nervous system impairments, and 22% of girls with language, speech and voice
impairments. although the absolute numbers in each of these cases are low, this is a critical issue, as the possibility for the successful social integration of these children when they become adults is affected.
the majority of students with disabilities attend public schools (70%) and publically-subsidised private schools (27.9%); only 1.9% attend fully private schools. By sex, there is a slightly higher proportion of girls in public schools (73.4%) and boys in publically-subsidised private schools (29.1%). In terms of the overall percentage in Spain in 2008, 67.3% of students attended public schools, 2.7 points less than the percentage for children with disabilities.
schooling can take three basic forms: mainstream schools without any special support (32%); mainstream schools with an integration programme providing special support (46%), and special education schools or classrooms (19%). There is a greater proportion of boys in mainstream schools without support than girls (37%, compared to 24%), and girls in mainstream schools with an integration programme (53%, compared to 42%). Enrolment in special education schools is approximately the same for both sexes (one in five). Graph 5.5 shows the differences.
Unlike many other countries, spanish education policy encourages the integration of students with disabilities into mainstream schools, with the support and adaptations required: “Whenever possible, students with special educational needs must be integrated into regular classroom environments and, according to the principles of standardisation and sectorialisation, in the school that corresponds to him or her or that is the closest to

eDU
Cat
ion
aL
Pro
FiLe
oF
Pers
on
s W
itH
Dis
aBi
Liti
es
where he or she lives. Enrolment in specific special education centres will only occur when the student’s needs cannot be met in mainstream school, and will last only as long as the impairment or disability makes integration impossible” (economic and social Council, 2004: 69).
GraPh 5.5: type of schooling of boys and girls with disabilities aged 6 - 15 years (in percentages)
0
25
50
75
100 Centro ordinario sin apoyos
Centro ordinario con apoyos
Centro de Educación Especial
ChicasChicos
Mainstream with support
Special education Mainstream without support
GIRLSBOYS
Chicos ChicasCentro de Educación Especial 18,5 19,9Centro ordinario con apoyos 41,9 53,0Centro ordinario sin apoyos 36,7 24,3
0
25
50
75
100
5.5
source: Based on the Disability, independence and Dependency situations survey (DiDss), 2008.
By type of disability, those who most rely on special education schools or classrooms are children with difficulties carrying out household tasks (37%), difficulties with interpersonal relationships (34%), and with mobility and self-care disabilities (31% and 30%, respectively). in contrast, those who have hearing and vision disabilities are more often enrolled in mainstream schools without any special support (52% and 43%, respectively). Enrolment in mainstream schools with integration programmes is more
common among those with communication and interpersonal relationship disabilities.
By type of impairment, most of those with osteoarticular impairments (69%) and more than half of students with hearing and visual impairments are in mainstream schools without any special support. in contrast, nearly half of those with multiple impairments, which affect several organs at once (42%), and a quarter of those affected by mental and nervous system impairments are in special education schools or classrooms.
School absenteeism due to disability is high (defined as more than a month without going to school in the previous year) in 14.5% of cases, and less severe (between one week and one month absence) in 23%. The remaining two-thirds missed less than a week of school throughout the whole school year. absenteeism due to disability was slightly higher among girls (43% missed more than one week of school) than boys (35%).
reLa
tio
n t
o e
Co
no
MiC
aC
tiV
ity
Vi. reLation to eConoMiC aCtiVity
the economic integration of persons with disabilities in adult life takes place primarily through participation in one of three interrelated systems: paid employment, housework and pensions. the majority of the population – with or without disabilities – achieves autonomy and recognition within the family through one of these paths, whether it be work (in the market or in the home) or some other system of coverage against risk (contributory and non-contributory pensions).1
in addition, other activities or subsystems for integration exist: education, which is more typical during childhood and adolescence and can be understood as a stage for preparation for subsequent integration into the labour market; unemployment, which is a negative relationship with economic activity characterised by the ‘job search’ and at times leading to certain economic benefits; and ‘permanent disability’, which refers to persons who are unable to work, although they receive a pension. Permanent disability is included as a category in the economically active Population
1 another means of integration and economic recognition is the management of assets, whether financial or property. However, this category, although of macroeconomic importance, is not included in statistics on economic activity, perhaps because it involves so few persons.
Survey (EAPS) as a specific form of ‘inactivity’. The DIDSS-2008 includes the category ‘performing unpaid social or charitable work’, which includes 0.1% of the population of working age (around 2000 persons), and ‘other situation’, which includes 2.8% (the EAPS identifies 1.4% in ‘others’).
if we restrict ourselves to the working age population (16 to 64 years of age in 2008), the basic forms of economic integration of persons with disabilities differ notably from those of the general population. While paid work is the most frequent form of integration in adult life in the general population (66%, thirteen points more than in 1999), only 28% of persons with disabilities report being employed (four points more than in 1999) and with significant differences by sex (33% of men and only 16% of women). the unemployment rate, understood as the ratio of unemployed persons to the total working age population, is slightly higher in the population with disabilities (7.2%) than in the general population (6.7%), but this difference is more than double (20.3 vs. 9.2%) if we calculate the unemployment rate based on the number of economically active persons (employed plus unemployed).

reLa
tio
n t
o e
Co
no
MiC
aC
tiV
ity
the pension system is considered to be the ‘principal economic activity’ for 41% of the working age population with disabilities (44% in 1999), while the population without disabilities uses it almost exclusively upon reaching 65 years of age (with the exception of cases of early retirement).
In third place, housework is also of significant importance as the ‘principle’ activity in adult live, both among persons with disabilities and in the general population; although this activity is almost exclusively concentrated among women (one of every four women of working age). the question on the DiDss-2008 regarding ‘the main activity the week before’, with only a single response possible, prioritised ‘pensions’ over ‘housework’, which is likely to have caused an undercount in this category.
the percentage of students among the population with disabilities is approximately one-third the percentage among the general population, while the percentage of persons with ‘permanent disability’ is more than double (see graph 6.1).
it should be noted that the activities described are not exclusive, as the same person can participate in several. For example, an individual can receive a pension while working, or be employed and be responsible for housework, or be studying and working, etc. However, the DiDss-2008 asks respondents about their ‘main economic activity during the previous week’, which requires them to choose one, based on an order in which the two ‘canonical’ forms of economic activity (‘working’ and ‘unemployed’) appear first, followed by those of inactivity, in the following order: pensions (contributory retirement pensions or for permanent disability and ‘other type of pension’); being ‘incapacitated to work’; ‘studying’;
‘mainly dedicated to housework’; ‘carrying out unpaid social work or charitable activities’; and ‘other situation’. in contrast to the 1999 survey, the 2008 survey does not allow us to accurately capture any overlapping between different forms of activity, particularly those related to housework (about which no additional questions are asked) and pensions (about which additional questions are asked, but the number responding with ‘no answer’ is very high).
GraPh 6.1: economic activity of working age persons with disabilities in comparison to the general population (in percentages)
0
25
50
75 Población general
Personas con discapacidades
Incapacidad permanenteEn paroEstudiosPensionesTrabajo domésticoTrabajo remunerado
PERCENTAGE OF POPULATION 16 - 64
Persons with disabilities General population
ON PERMANENT DISABILTY
PENSIONSHOUSEWORKPAID EMPLOYMENT
STUDYING UNEMPLOYED
Personas con discapacidades Población generalTrabajo remunerado 28,3 66,3Trabajo doméstico 12,4 13,2Pensiones 41,0 2,2Estudios 2,3 7,6En paro 7,2 6,7Incapacidad permanente 5,9 2,6
0
25
50
75
6,1
28.3
66.3
12.413.2
41.0
2.2 2.37.6 7.2 6.7 5.9
2.6
source: Based on the Disability, independence and Dependency situations survey, 2008 (DiDss) for population with disabilities and the Economically Active Population Survey, fourth quarter of 2007 and the first quarter of 2008 averages, for the general population.
in what follows we analyse the economic activity of the population with disabilities, focusing on the working age population of persons with disabilities (16-64 years of age) and the following aspects:

reLa
tio
n t
o e
Co
no
MiC
aC
tiV
ity
• The impact that the appearance or aggravation of the disability has. For more than one-third of the working age population with disabilities this led to a modification in the form of previous integration.
• The employment situation of persons with paid employment: access to standard and secure employment, occupational sectors, areas and concrete occupations, working conditions, etc.
• Unemployment: time on unemployment, methods for looking for work, reasons for not finding it, employment expectations, etc. estimate of the unemployment rate as a result of the current economic crisis.
• Housework: characteristics of those who dedicate themselves to housework and taking care of the home (the majority women).
• Pensions: types of pensions and characteristics of the persons (the majority men) that define their main economic activity as receiving a pension.
6.1. ChanGeS In aCtIVIty WIth the onSet of DISabIlIty
More than one-third of the 1.48 million working age persons with disability (266,000 men and 230,000 women, representing 42% and 32% of each sex respectively) said that they had to modify their economic activity or employment when their disability appeared or became worse. this percentage is much lower among
young people from 16 to 29 years of age, as only 14% in this age group had to change their activity. This percentage reaches 34% among those between 30 and 44 years of age, and 41% among those between 45 and 64 years of age. this gradual progression indicates that the impact on economic activity is greater in cases of acquired disability in adult life than in those of congenital or childhood origin (the proportion of which is greater among young people with limitations).
The change in activity was in most cases (85%) giving up paid employment and becoming the recipient of a pension (41%), being declared ‘incapacitated to work’ (25%), becoming unemployed (13%) or engaging in household activities (3%). in addition to these changes in activity, one out of 20 persons with disabilities between 16 and 65 years of age were able to maintain paid employment but had to change their occupation or profession. accordingly, regarding the main activity, the appearance or worsening of disability has had a very strong impact in one direction – abandoning the labour market and becoming unemployed (65,000 persons) or ‘inactive’: unable to work (123,000 persons); receiving a contributory pension (180,000 persons) or a non-contributory pension (21,000), or engaging in ‘housework’ (15,000 persons, almost all women) (see graph 6.2).
Changes in activity affected 430,000 persons, while another 66,000 had to change their jobs because of their disability, a situation affecting men (45,000) more than women (21,000), as more men are economically active than women. if we look at the 10 most common jobs before and after disability, only two remain on the list after (shop assistant and waiter/waitress). With other jobs

reLa
tio
n t
o e
Co
no
MiC
aC
tiV
ity
we see a change from manual labour in construction, industry and transport to jobs in the service sector (retail, administration, cleaning, etc.).
GraPh 6.2: Changes in economic activity of working age persons at the time disability appeared or worsened (in percentages)
From employment to unemployment
Change in employmentNo change in economic activity or employment
Change to another type of activity(not employment)From employment to housework
From employment to incapacitated to work
From employment to pension
Cambio a otra actividad (no empleo)
Del empleo a tareas del hogar
Del empleo a incapacidad para trabajar
Del empleo a pensionista
Del empleo al paro
Cambio de empleo
Sin cambio de actividad o empleo
Sin cambio de actividad o empleo 857940 63,76Cambio de empleo 66214 4,92Del empleo al paro 65202 4,85Del empleo a pensionista 201677 14,99Del empleo a incapacidad para trabajar 123168 9,15Del empleo a tareas del hogar 15062 1,12Cambio a otra actividad (no empleo) 16294 1,21
6,2
source: Based on the Disability, independence and Dependency situations survey (DiDss), 2008.
the most common occupations of persons who change jobs
BeFore tHe onset or Worsening oF DisaBiLity: Persons
1. Bricklayer 3,795
2. shop assistant 3,083
3. Waiter/waitress 2,801
4. Mechanic 2,392
5. Labourer in construction 2,294
6. Lorry driver 2,051
7. iron worker and the like 1,886
8. Food, beverage and tobacco industry worker 1,723
9. Cook 1,438
(Continue)
10. Mechanic of electrical and electronic equipment 1,325
aFter tHe onset or aggraVation oF DisaBiLity:
1. Cashier, teller and other similar personnel in direct contact with the public 6,058
2. security guard and the like 4,070
3. shop assistant 3,825
4. administrative assistant, without customer service tasks 3,360
5. Concierge, window cleaner and the like 3,065
6. employee in information and reception services 2,754
7. Cleaning personnel 2,629
8. travelling salesperson and the like 1,503
9. administrative assistant, with customer service tasks 1,347
10. Waiter/waitress 1,263
the onset or worsening of mobility disabilities has the greatest impact on economic activity and occupation, and they are closely correlated with two types of impairments that are at the origin of these disabilities: impairments of the nervous system and osteoarticular impairments. in contrast, hearing and communication disabilities have less impact on economic activity.
in short, more than one-third of working age persons with disabilities stated that they had to change their economic activity due to their disability, a change that generally took the form of giving up paid work. this affected 420,000 persons, almost the same number that were still working at the time of the survey (419,000). in other words, half of the persons with disabilities had to leave their jobs. However, the two previous figures only refer

reLa
tio
n t
o e
Co
no
MiC
aC
tiV
ity
to slightly more than half of the working age population with disabilities, which, as we have seen, is 1.48 million persons. this means that there are 640,000 persons with disabilities that do not have jobs. of these, we know from the survey that 225,000 have never had a paid job during their lives, while the other 415,000 stopped working for different reasons, not directly attributable to the appearance or worsening of their disabilities.
in fact, the 2008 survey asked respondents without employment what the main reason for leaving work was. the responses came from both those who attributed this to their disability and those who indicated other causes (in total, more than 800,000 persons). as can be seen in graph 6.3, the most common reason given was ‘health reasons’, which may or may not be related to disability,2 and the second most common was ‘early retirement because of disability’ (the former is mentioned equally by both sexes, while men gave the latter answer twice as often as women). However, the remaining reasons are not directly connected to disabilities, but rather to other circumstances, such as family responsibilities (which affect women more) or labour market instability (which has resulted in the loss of jobs for a significant part of the male and female labour force, with or without disabilities): ‘wanting to dedicate time exclusively to family’ and ‘unable to balance work and family responsibilities’ (15% of women and 1% of men), ‘becoming unemployed when job contract ended’ and ‘being laid off’ (9% among both sexes), ‘early retirement’ (3%, majority men), ‘by choice’ (2.5%, majority women) and ‘other reasons’ (9%).
2 in the traditional terminology used in the DiDss-2008, chronic health problems are the main cause of the impairments that cause disabilities, but there are also many temporary health problems that do not produce permanent limitations.
GraPh 6.3: Main reason why working age persons with disabilities stopped working (totals)
0 50 100 150 200
Hombres
Mujeres
Otras razones
No podía compatibilizar trabajo y familia
Por propia voluntad
Prejubilación-jubilación anticipada forzosa
Por despido
Se quedó en desempleo al acabar el contrato
Querer dedicarse exclusivamente a su familia
Jubilación anticipada por discapacidad
Razones de salud
MenWomen
Hombres MujeresOtras razones 29,061 31,590No podía compatibilizar trabajo y familia 2,674 13,609Por propia voluntad 5,255 11,848Prejubilación-jubilación anticipada forzosa 14,825 5,584Por despido 10,520 9,971Se quedó en desempleo al acabar el contrato 17,407 23,877Querer dedicarse exclusivamente a su familia 0,261 42,040Jubilación anticipada por discapacidad 76,916 45,846Razones de salud 157,014 186,099
0 50,000 100,000 150,000 200,000
PERSONS WITH DISABILITIES WITHOUT EMPLOYMENT
OTHER REASONS
NOT ABLE TO BALANCE WORK AND FAMILY
BY CHOICE
INVOLUNTARY EARLY RETIREMENT
BECAME UNEMPLOYED WHEN CONTRACT ENDED
WANTING TO DEDICATE ONESELF EXCLUSIVELY TO FAMILY
EARLY RETIREMENT DUE TO DISABILITY
HEALTH REASONS
6,3
WAS LAID OFF
source: Based on the Disability, independence and Dependency situations survey (DiDss), 2008.
6.2. fInDInG PaID eMPloyMent
Persons with disabilities that were working in 2008 found their employment in two main ways: through friends and family or by applying for a job directly with the employer. Both sources account for more than half the cases among both men and
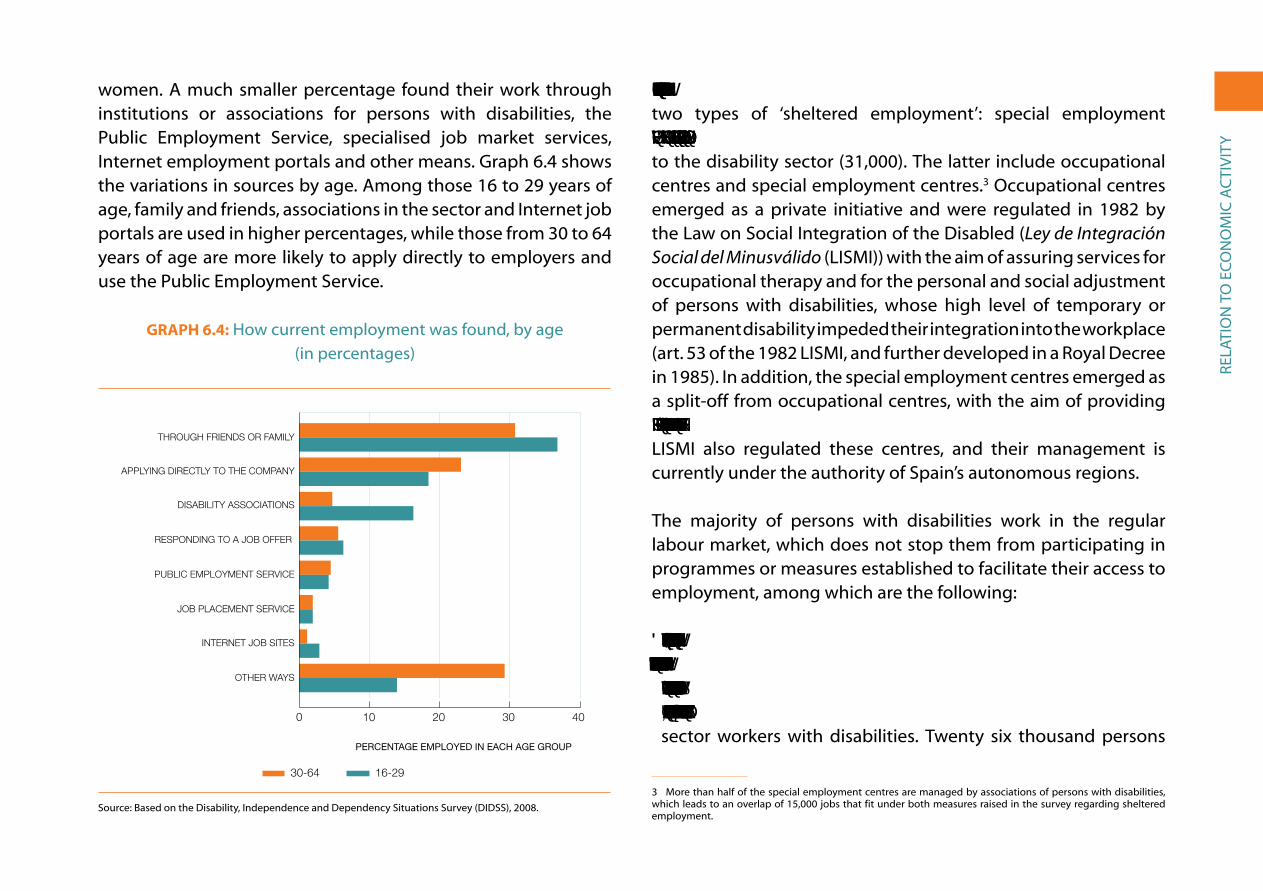
reLa
tio
n t
o e
Co
no
MiC
aC
tiV
ity
women. a much smaller percentage found their work through institutions or associations for persons with disabilities, the Public employment service, specialised job market services, internet employment portals and other means. graph 6.4 shows the variations in sources by age. among those 16 to 29 years of age, family and friends, associations in the sector and internet job portals are used in higher percentages, while those from 30 to 64 years of age are more likely to apply directly to employers and use the Public employment service.
GraPh 6.4: How current employment was found, by age (in percentages)
0 10 20 30 40
16-29 años
30-64 años
Otra vía
Portales de empleo internet
Servicio inserción laboral
Servicio público de empleo
La empresa le/la llamó
Asociaciones del sector
Yendo a la empresa
Un amigo o familiar
30-64 16-29
16-29 años 30-64 añosOtra vía 13,8 29,2Portales de empleo internet 2,8 1,1Servicio inserción laboral 1,9 1,9Servicio público de empleo 4,1 4,4La empresa le/la llamó 6,3 5,4Asociaciones del sector 16,2 4,6Yendo a la empresa 18,3 22,9Un amigo o familiar 36,7 30,6
0
10 20 30 40
PERCENTAGE EMPLOYED IN EACH AGE GROUP
OTHER WAYS
INTERNET JOB SITES
JOB PLACEMENT SERVICE
PUBLIC EMPLOYMENT SERVICE
RESPONDING TO A JOB OFFER
DISABILITY ASSOCIATIONS
APPLYING DIRECTLY TO THE COMPANY
THROUGH FRIENDS OR FAMILY
6,4
source: Based on the Disability, independence and Dependency situations survey (DiDss), 2008.
More than one-tenth of those who work (11.5%) do so through two types of ‘sheltered employment’: special employment centres (25,000 persons) and non-profit organisations linked to the disability sector (31,000). the latter include occupational centres and special employment centres.3 occupational centres emerged as a private initiative and were regulated in 1982 by the Law on social integration of the Disabled (Ley de Integración Social del Minusválido (LisMi)) with the aim of assuring services for occupational therapy and for the personal and social adjustment of persons with disabilities, whose high level of temporary or permanent disability impeded their integration into the workplace (art. 53 of the 1982 LisMi, and further developed in a royal Decree in 1985). in addition, the special employment centres emerged as a split-off from occupational centres, with the aim of providing more normalised employment to more efficient workers. The LisMi also regulated these centres, and their management is currently under the authority of spain’s autonomous regions.
the majority of persons with disabilities work in the regular labour market, which does not stop them from participating in programmes or measures established to facilitate their access to employment, among which are the following:
• ‘Reservation quotas’: Established by Spanish legislation, these quotas require that 2% of the workforce of businesses with more than 50 employees must be persons with certified disabilities. In addition, the same 2% quota exists for the hiring of public sector workers with disabilities. twenty six thousand persons
3 More than half of the special employment centres are managed by associations of persons with disabilities, which leads to an overlap of 15,000 jobs that fit under both measures raised in the survey regarding sheltered employment.

reLa
tio
n t
o e
Co
no
MiC
aC
tiV
ity
with disabilities have been hired as a result of these quotas, approximately 7% of the employed in 2008 in this population (15,000 men and 11,000 women). of these persons, more are employed by the public sector (14,200) than by the private sector (11,900), which is indicative of the fact that there is not sufficient administrative oversight to ensure that private enterprises follow the law. the percentage of persons employed thanks to these quotas has grown considerably in comparison to 1999, when the percentage was only 3.7%. Originally, the LISMI envisaged the obligatory participation of all workplaces with more than 50 employees in the quota system, but in view of the flagrant disregard for the regulation, alternative measures of exceptional character were established in 2000 that permitted employers to avoid compliance, such as favouring hiring in special employment centres or hiring the self-employed with disabilities, or by providing monetary donations aimed at encouraging integration in the labour market and the creation of jobs for persons with disabilities.
• Incentives for hiring or reductions in social security payments: These have benefited 13,600 persons (3.7% of the total number of persons with disabilities employed in 2008), and a more or less equal number of men and women. the total number for 2008 is higher than ten years before, when only 2.7% of the employed in this population benefited from these measures.
• Employment with support, labour enclaves, etc.: Only 1.6% of persons with disabilities that are employed (approximately 6,000 persons) state that they received assistance through these mechanisms. two thirds are men, and the application of these measures is more common among those 16 to 29 years
of age (6%) than among those between 30 and 64 years of age (1.2%).
If we add up the beneficiaries of all these measures, including occupational centres and special employment centres, we see that they helped integrate approximately 20% of the population with disabilities that were employed into the labour market in 2008 (over 400,000 persons), or a more modest 7% if we consider the total population of working age persons with disabilities (1.38 million persons).
6.3. eConoMIC SeCtorS, branCheS of aCtIVIty anD eMPloyMent StatuS
the distribution by economic sectors of persons with disabilities is similar to that found among the rest of the population: a similar percentage in industry (16.8% in comparison to 16.3% for the overall spanish population) and somewhat higher percentages in agriculture (5.3% vs. 4.2%) and the service sector (70.3% vs. 66.4%), but a significantly lower percentage in construction (7.6% vs. 13.1%).
Distribution by sex reveals differences that are similar to those found in the general population: men have a greater presence in construction and industry, and women in services; however, more men are employed in agriculture than women (6.5% vs. 3.8%), the opposite of what occurs in the general population (2% of men vs. 2.8% of women). Graph 6.5 allows us to compare the sectors in which men and women with disabilities were employed at the time of the 2008 survey, with the total employed population in
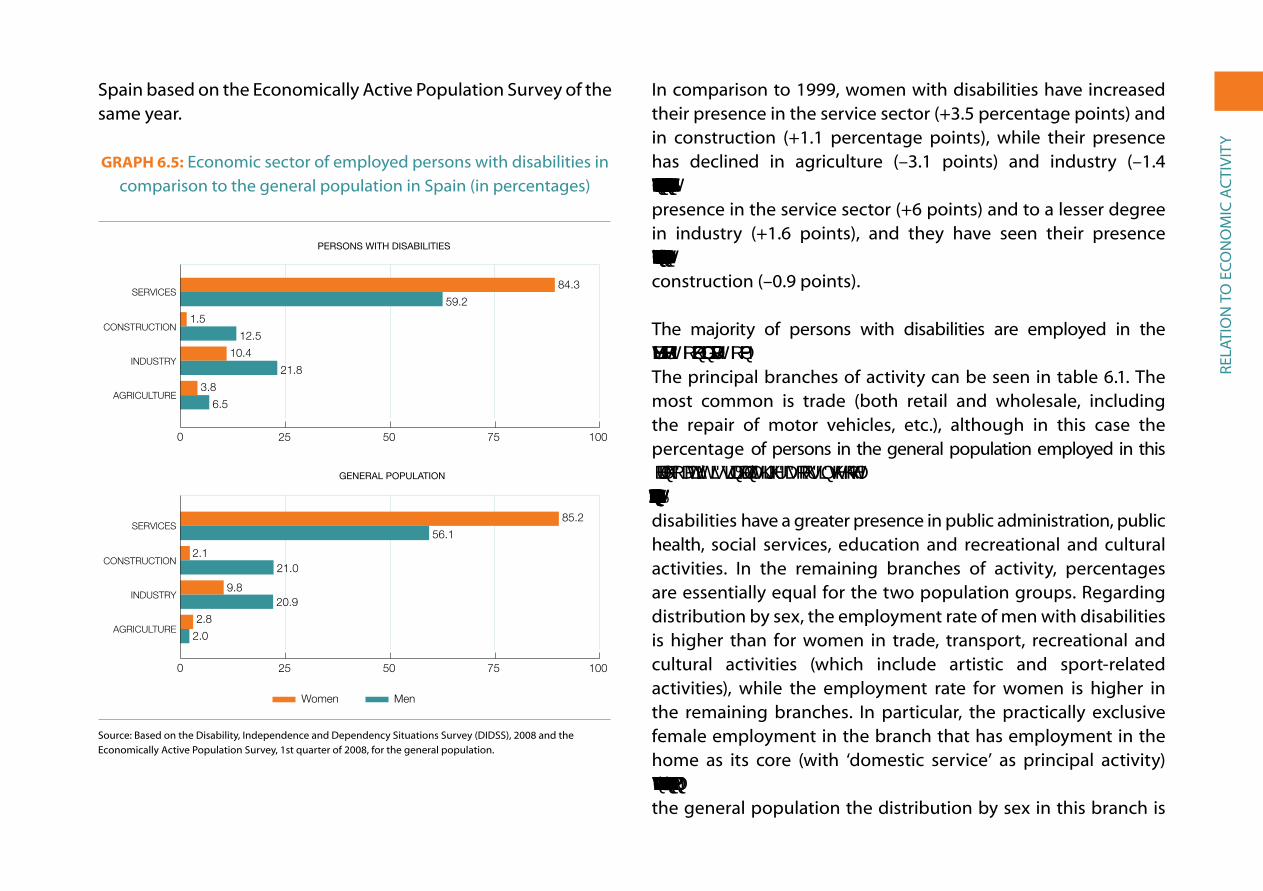
reLa
tio
n t
o e
Co
no
MiC
aC
tiV
ity
spain based on the economically active Population survey of the same year.
GraPh 6.5: economic sector of employed persons with disabilities in comparison to the general population in spain (in percentages)
84.3
59.2
1.5
12.5
10.4
21.8
3.8
6.5
85.2
56.1
21.0
20.9
2.8
2.0
0 25 50 75 100
Hombres
Mujeres
Agricultura
Industria
Construcción
Servicios
Agricultura
Industria
Construcción
Servicios
Personas con discapacidad Hombres MujeresAgricultura 6.5 3.8Industria 21.8 10.4Construcción 12.5 1.5Servicios 59.2 84.3
Población generalAgricultura 2.0 2.8Industria 20.9 9.8Construcción 21.0 2.1Servicios 56.1 85.2
0 25 50 75 100
AGRICULTURE
INDUSTRY
CONSTRUCTION
SERVICES
AGRICULTURE
INDUSTRY
CONSTRUCTION
SERVICES
6.5
MenWomen
0 25 50 75 100
PERSONS WITH DISABILITIES
GENERAL POPULATION
2.1
9.8
source: Based on the Disability, independence and Dependency situations survey (DiDss), 2008 and the economically active Population survey, 1st quarter of 2008, for the general population.
in comparison to 1999, women with disabilities have increased their presence in the service sector (+3.5 percentage points) and in construction (+1.1 percentage points), while their presence has declined in agriculture (–3.1 points) and industry (–1.4 points). Regarding men, they have significantly increased their presence in the service sector (+6 points) and to a lesser degree in industry (+1.6 points), and they have seen their presence decrease significantly in agriculture (–6.7 points) and slightly in construction (–0.9 points).
the majority of persons with disabilities are employed in the service sector: 84% of women and almost 60% of men. the principal branches of activity can be seen in table 6.1. the most common is trade (both retail and wholesale, including the repair of motor vehicles, etc.), although in this case the percentage of persons in the general population employed in this branch of activity is significantly higher, as occurs in the hotel and restaurant sector and in finance and insurance. Persons with disabilities have a greater presence in public administration, public health, social services, education and recreational and cultural activities. in the remaining branches of activity, percentages are essentially equal for the two population groups. regarding distribution by sex, the employment rate of men with disabilities is higher than for women in trade, transport, recreational and cultural activities (which include artistic and sport-related activities), while the employment rate for women is higher in the remaining branches. in particular, the practically exclusive female employment in the branch that has employment in the home as its core (with ‘domestic service’ as principal activity) stands out: 7.4% of employed women and only 0.7% of men; in the general population the distribution by sex in this branch is

reLa
tio
n t
o e
Co
no
MiC
aC
tiV
ity
even more polarised: employing 8.2% of women who work and only 0.4% of the men. The presence of women with disabilities in education is triple that of men and more than double in health and social services.
table 6.1: Main branches of activity in the service sector, by sex (in percentages)
Persons WitH DisaBiLitiesgeneraL
PoPULationBotH seXes Men WoMen
trade 12.0 12.6 11.3 15.7
Public administration 9.8 9.0 10.8 6.0
Business services 9.1 8.7 9.6 9.3
Health and social services 8.3 5.2 12.3 5.8
education 7.3 3.8 11.8 5.7
Hotels, restaurants and catering 4.9 3.8 6.3 6.8
transport 4.5 5.1 3.7 4.7
Domestic personnel 3.7 0.7 7.4 3.7
recreational and cultural activities 3.0 3.5 2.3 1.4
other personal services 2.8 2.4 3.4 2.1
Financial and insurance activities 1.8 1.8 1.8 2.5
other branches in service sector 3.1 2.5 3.6 2.7
(Continue)
employment rate in services 70.3 59.2 84.3 66.4
number employed (291,886) (137,454) (154,432) (13,445,000)
source: Based on the Disability, independence and Dependency situations survey (DiDss), 2008 and the economically active Population survey, 1st quarter 2008, for the general population.
the employment status of the population with disabilities varies little from that of the overall population: the vast majority are employees (83.1% in comparison with 82.4% for the overall population), and more are self-employed (9.2% among the disabled and 5.6% among the general population) than employers of other persons (5.9% among the disabled and 5.6% of the general) population. in comparison with the data from 10 years before, the number of wage-earners among persons with disabilities has increased by 5 percentage points, but the most striking increase has been among those who are employers, the percent almost doubling, from 3.3% to 5.9%. In contrast, the number of self-employed has declined (from 15.5% in 1999 to 9.2% in 2008) as has the number of persons whose economic support comes from working in the family business (from 1.5% to 0.6%).
Employment status by sex shows some significant variations, both among persons with disabilities as well as the general population. there are more women employees and more men who are employers. the fundamental difference in comparison to the previous decade is the growth of employers, as has been indicated. graph 6.6 shows the distribution of employers by sex: the percentage of men doubling that of women, which in both cases is slightly higher among persons with disabilities.

reLa
tio
n t
o e
Co
no
MiC
aC
tiV
ity
GraPh 6.6: employers with disabilities compared to the spanish general public, by sex (in percentages)
0
10 Mujeres
Hombres
Personas con discapacidadPoblación general
C. Públicos C. PrivadosE. Infantil 81.60 18.30E. Primaria 83.70 16.20ESO 80.70 19.20Bachillerato 83.60 16.30Ciclos Formativos 78.10 21.80Garantia Social 71.40 28.50E. Especial 65.30 34.60
WomenMen
Hombres MujeresPoblación general 7.2 3.3Personas con discapacidad 7.5 4.0
0
10
PERSONS WITH DISABILITIESGERNERAL POPULATION
6.6
7.2%
3.3%
7.5%
4.0%
source: Based on the Disability, independence and Dependency situations survey (DiDss), 2008 and the economically active Population survey, 1st quarter 2008, for the general population.
6.4. MaIn oCCuPatIonS
The DIDSS-2008 gathers information on 200 specific occupations that appear in the economically active Population survey. With this information we can compare the general population and the population with disabilities. the occupations are grouped in ten major categories, which provide an initial picture of these populations. We will then provide more detailed information regarding specific occupations.
Unlike what we have seen in the distribution by sectors, branches and employment status, the distribution of occupations among
persons with disabilities and in the general population varies substantially. the former are more present in un-skilled jobs and less in business management and public administration, or in the two technical and professional categories. regarding intermediate occupations, they have a greater relative presence in those of an administrative nature, in operators of installations and machinery and in agriculture, and less in skilled jobs in manufacturing, construction and mining, as well as in trade, hotel and restaurant and personal services (graph 6.7).
GraPh 6.7: Main categories of occupations of persons with disabilities in comparison to the general population in spain
(in percentages)
22.614.4
18.39.1
15.316.2
14.79.3
10.412.7
6.615.7
5.77.7
3.312.1
2.92.4
0.1 0.5
0 5 10 15 20 25
Población general
Personas con discapacidad
Fuerzas armadas
Trabajadores cuali�cados en agricultura y pesca
Técnicos y profesionales de apoyo
Dirección de las empresas y de la administr, pública
Trabaj. cuali�cados industria, construcción y minería
Técnicos y profesionales cientí�cos e intelectuales
Operadores de instalaciones y maquinaria
Trabaj. de restauración, comercio y serv. personales
Empleados de tipo administrativo
Trabajadores no cuali�cados
Persons with disabilitiesGeneral population
Población general Personas con discapacidadFuerzas armadas 0,5 0,1Trabajadores cuali�cados en agricultura y pesca 2,4 2,9Técnicos y profesionales de apoyo 12,1 3,3Dirección de las empresas y de la administr, pública 7,7 5,7Trabaj. cuali�cados industria, construcción y minería 15,7 6,6Técnicos y profesionales cientí�cos e intelectuales 12,7 10,4Operadores de instalaciones y maquinaria 9,3 14,7Trabaj. de restauración, comercio y serv. personales 16,2 15,3Empleados de tipo administrativo 9,1 18,3Trabajadores no cuali�cados 14,4 22,6
0 5 201510 25
ARMED FORCES
WORKERS SKILLED IN AGRICULTURE AND FISHING
TECHNICIANS AND SUPPORT PROFESSIONALS
BUSINESS MANAGEMENT AND PUBLIC ADMINISTRATION
PERCENTAGE OF WORKING POPULATION
SKILLED WORKERS IN MANUFACTURING, CONSTRUCTION AND MINING
SCIENTIFIC TECHNICIANS, PROFESSIONALS AND INTELLECTUALS
OPERATORS OF FIXED AND MOBILE MACHINERY
RESTAURANT, SALES AND PERSONAL SERVICES
ADMINISTRATIVE AND OTHER OFFICE EMPLOYEES
UNSKILLED WORKERS
6,7
source: Based on the Disability, independence and Dependency situations survey (DiDss), 2008; and the economically active Population survey, 1st quarter 2008, for the general population.

reLa
tio
n t
o e
Co
no
MiC
aC
tiV
ity
the differences by sex are also important in both groups, almost always in the same direction: more women in technical and professional occupations, in administrative jobs, in trade and hotel-restaurant services and in unskilled jobs; more men in business management and in senior management in public administration, and skilled jobs in agriculture, industry and construction. the only exception to this general rule is in the category of ‘support technicians and professionals’, where men with disabilities are more numerous (3.8%) than women (2.7%), while in the general population it is the opposite. Each group/gender stands out for one of the ten types of occupations, where approximately one-fourth of the individuals carry out their economic activity:
• 24.7% of women in the general population work in restaurant, trade and personal services. the next largest category for this group is that of unskilled workers (19.5%).
• 25.9% of women with disabilities are unskilled workers. The next largest category is restaurant, trade and personal services (20.9%).
• 25.5% of men in the general population are workers in industry, construction and mining. in second place are installation and machinery operators (13.8%).
• 20.8% of men with disabilities are installation and machinery operators, followed by unskilled workers (19.9%).
in what follows we will look at the main occupations of persons with disabilities in each of the ten categories. We will also look at the differences between the sexes and based on age.
Business management and public administration
one out of twenty persons with disabilities has an occupation in this category (in absolute numbers: 15,000 men and 9,000 women). the proportion of individuals that occupy management positions increases with age: 1.3% among the 16 to 29 years of age bracket, 5% among those from 30 to 44 years of age, and 7% among those from 45 to 64 years of age.
in this category the majority manage businesses with fewer than ten employees: retail trade (14%, a majority of whom are women), catering and restaurant service (12%, majority women), hostelry (5%, balanced between both sexes), wholesale trade (3%, majority men) and other diverse businesses stand out, always with fewer than 10 employees (19%, majority men).
the next block corresponds to the management of shops, restaurants and other businesses without employees (23%), where the percentage of women is higher (with the exception, again, of wholesale trade, in which men dominate).
a small sector works in general management or as chief executives of large companies (7%) or manages specialised areas or departments (8%). In both cases, the percentage of men is double that of women, clear evidence of discrimination in positions of power in large companies.
Lastly, an even smaller sector is in management positions in the administration of central, regional (4%, majority women) and local governments (2%, majority men).
reLa
tio
n t
o e
Co
no
MiC
aC
tiV
ity
Scientific technicians and professionals and intellectuals
In this category we find slightly more than one-tenth of the total number of employed persons with disabilities (25,000 women and 18,500 men). Overall, 8% of employed persons with disabilities from 16 to 29 years of age hold occupations in this category, 11% of those from 30 to 44 years of age, and 10% of those from 45 to 64 years of age.
the largest block within this category is formed by teachers, including teachers in secondary school (15%, equal number by sex), primary and pre-school (12%, almost all of whom are women) and university (4%, equal number by sex).
In second place are different specialisations in the field of healthcare: medicine and dentistry (8%, majority men), nursing (7%, majority women) and other occupations with percentages below 2% (pharmacists, veterinarians, etc.).
Following this are the higher professional levels of public administration (9%), computer programmers (5%), engineers (4%), a heterogeneous group of sociologists, historians, philosophers, philologists, psychologists and the like (3.4%), lawyers and prosecutors (3.1%), professionals in business organisation and management (3.1%), economists (2.7%), etc.
technicians and support professionals
This category accounts for 3.3% of the total jobs among persons with disabilities (9,000 women and 5,000 men), with a similar percentage in the three age groups. it includes mid-level
professionals, in particular professionals in finance and trade stand out (35% of the women in this category and 16% of the men). among the rest of the specialists, women stand out in pre-school and special education (14%) and as healthcare professionals (11%); men in the physical sciences, chemistry and engineering (16%), as operators of optical and electronic equipment (14%), computer technicians (13%) and draftsmen and technical designers (12%).
Accountancy, administrative and other office employees
this is the second largest category of occupations accounting for almost one-fifth of the jobs held by persons with disabilities (38,500 women and 38,000 men) and with similar percentages in the three different age groups.
the overall presence of men and women in this category is similar, although there are noticeable differences among the different occupations.
among women, administrative assistants with customer service tasks (21%) and those without customer service tasks (17%) stand out, followed by support professionals in administrative management (16%). Among men, the most common occupations are cashier, teller and other similar jobs with direct contact with the public (23%), accounting and financial assistants (14%), sales representatives and sales technicians (13%) and administrative assistants with customer service tasks (11%).
among both sexes, the jobs of cashier, teller and other similar personnel stand out, as 18% of persons with disabilities employed in this category are in these jobs, followed by administrative

reLa
tio
n t
o e
Co
no
MiC
aC
tiV
ity
assistants without customer service tasks (14%). However, in the general population the most common occupation in this category is that of administrative assistant with customer service tasks (27.5%); 13% are employed as cashiers or tellers.
Catering, personal and protection services employees and salespersons
The third largest group of occupations employs one out of five women with disabilities (41,000 persons) and one out of ten men (23,000 persons). the percentage of persons employed in this category is higher among those 16 to 29 years of age, above all in the case of women (29% of women), and stabilises at around 15% beginning at 30 years of age.
By occupation, what stands out among both sexes is that of clerk in shops, warehouses, stands or markets (32% of women in this category and 29% of men). These occupations are followed, among women, by that of nursing assistants (18%), employees hired to look after other persons (12%), cooks (12%) and waitresses (11%); and among men, waiters (16%), employees hired to look after other persons (10%), nursing assistants and police (7%).
Workers skilled in agriculture and fishing
Only 3% of persons with disabilities that work have occupations in this category (8,500 men and 3,500 women); this percentage is higher in the youngest age group (6% among those 16 to 29 years of age).
The most common occupation is work in agricultural activities (67% of the women and 64% of the men), followed by livestock activities
(18% in both sexes) and fishing and fish farming activities (6%, more women than men). in the case of agricultural occupations, half are individuals that are self-employed (predominantly persons over 45 years of age) and half are employees (the majority under 30 years of age).
Workers qualified for the manufacturing, construction and mining industries
these jobs have much less weight among persons with disabilities than in the general population and traditionally have been carried out by men (95%). Their presence among the male population with disabilities is important (11%, 26,000 men) but is almost non-existent among women (0.7%, 1,300 women). By occupation, builders and masons (36% of the sector), carpenters (16%), painters (11%) and electricians (10%) stand out among men. Among women, two out of three are painters, electricians or specialists in finishing work.
Operators of fixed and mobile machinery
this is the second largest category of occupations among men with disabilities (49,000), and the fifth largest among women (13,000). the percentage employed in these occupations is somewhat higher in the youngest age bracket (22% of men between 16 and 29 years of age, 11% of women) than among those 30 years of age and older (20% of men and 6% of women).
the occupations are very diverse; among men, four in particular stand out: machinery mechanic and adjuster (11% of the group), lorry driver (10%), moulder, welder and auto-body worker (9%)
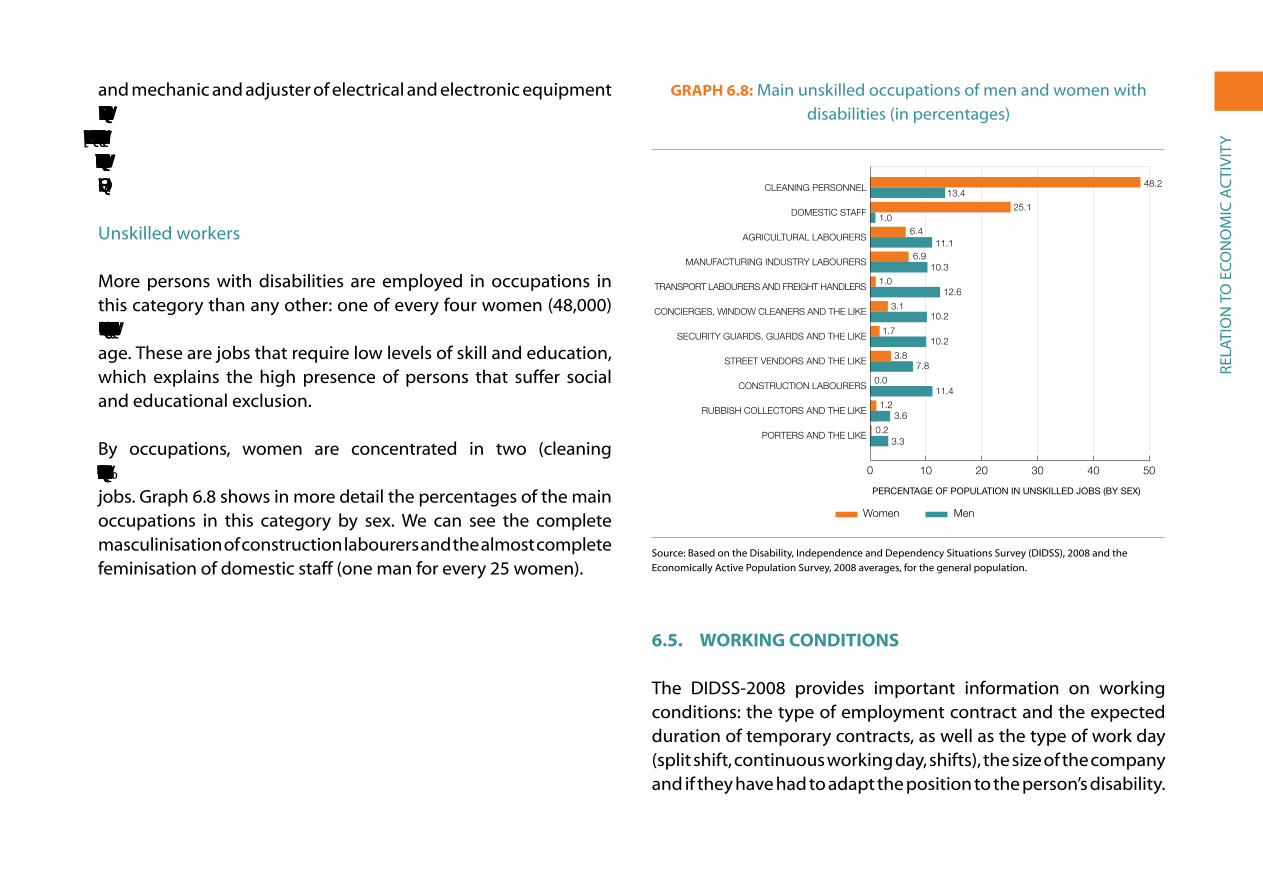
reLa
tio
n t
o e
Co
no
MiC
aC
tiV
ity
and mechanic and adjuster of electrical and electronic equipment (7%). Three occupations that stand out among women are food, beverage and tobacco industry worker (17%), worker in the textile industry, tailoring and similar (14%) and mounting and assembly personnel (11%).
Unskilled workers
More persons with disabilities are employed in occupations in this category than any other: one of every four women (48,000) and one of every five men (46,500), with similar percentages by age. these are jobs that require low levels of skill and education, which explains the high presence of persons that suffer social and educational exclusion.
By occupations, women are concentrated in two (cleaning personnel and domestic staff ), while men have more diversified jobs. graph 6.8 shows in more detail the percentages of the main occupations in this category by sex. We can see the complete masculinisation of construction labourers and the almost complete feminisation of domestic staff (one man for every 25 women).
GraPh 6.8: Main unskilled occupations of men and women with disabilities (in percentages)
0 10 20 30 40 50
Hombres
Mujeres
Mozos/as de equipaje y asimilados
Recogida de basura y asimilados
Peones de la construcción
Vendedores/as ambulantes y asimilados
Vigilantes, guardianes y asimilados
Conserjes, limpiacristales y asimilados
Peones de transporte y descarga
Peones de industrias manufactureras
Peones agrícolas
Empleadas/os del hogar
Personal de limpieza
Women Men
Hombres MujeresMozos/as de equipaje y asimilados 3,3 0,2Recogida de basura y asimilados 3,6 1,2Peones de la construcción 11,4 0,0Vendedores/as ambulantes y asimilados 7,8 3,8Vigilantes, guardianes y asimilados 10,2 1,7Conserjes, limpiacristales y asimilados 10,2 3,1Peones de transporte y descarga 12,6 1,0Peones de industrias manufactureras 10,3 6,9Peones agrícolas 11,1 6,4Empleadas/os del hogar 1,0 25,1Personal de limpieza 13,4 48,2
PERCENTAGE OF POPULATION IN UNSKILLED JOBS (BY SEX)
0 10 403020 50
PORTERS AND THE LIKE
RUBBISH COLLECTORS AND THE LIKE
CONSTRUCTION LABOURERS
STREET VENDORS AND THE LIKE
SECURITY GUARDS, GUARDS AND THE LIKE
CONCIERGES, WINDOW CLEANERS AND THE LIKE
TRANSPORT LABOURERS AND FREIGHT HANDLERS
MANUFACTURING INDUSTRY LABOURERS
AGRICULTURAL LABOURERS
DOMESTIC STAFF
CLEANING PERSONNEL
6,8
48.213.4
25.11.0
6.411.1
6.910.3
1.012.6
3.110.2
1.710.2
3.87.8
0.011.4
1.23.6
0.23.3
source: Based on the Disability, independence and Dependency situations survey (DiDss), 2008 and the economically active Population survey, 2008 averages, for the general population.
6.5. WorkInG ConDItIonS
the DiDss-2008 provides important information on working conditions: the type of employment contract and the expected duration of temporary contracts, as well as the type of work day (split shift, continuous working day, shifts), the size of the company and if they have had to adapt the position to the person’s disability.
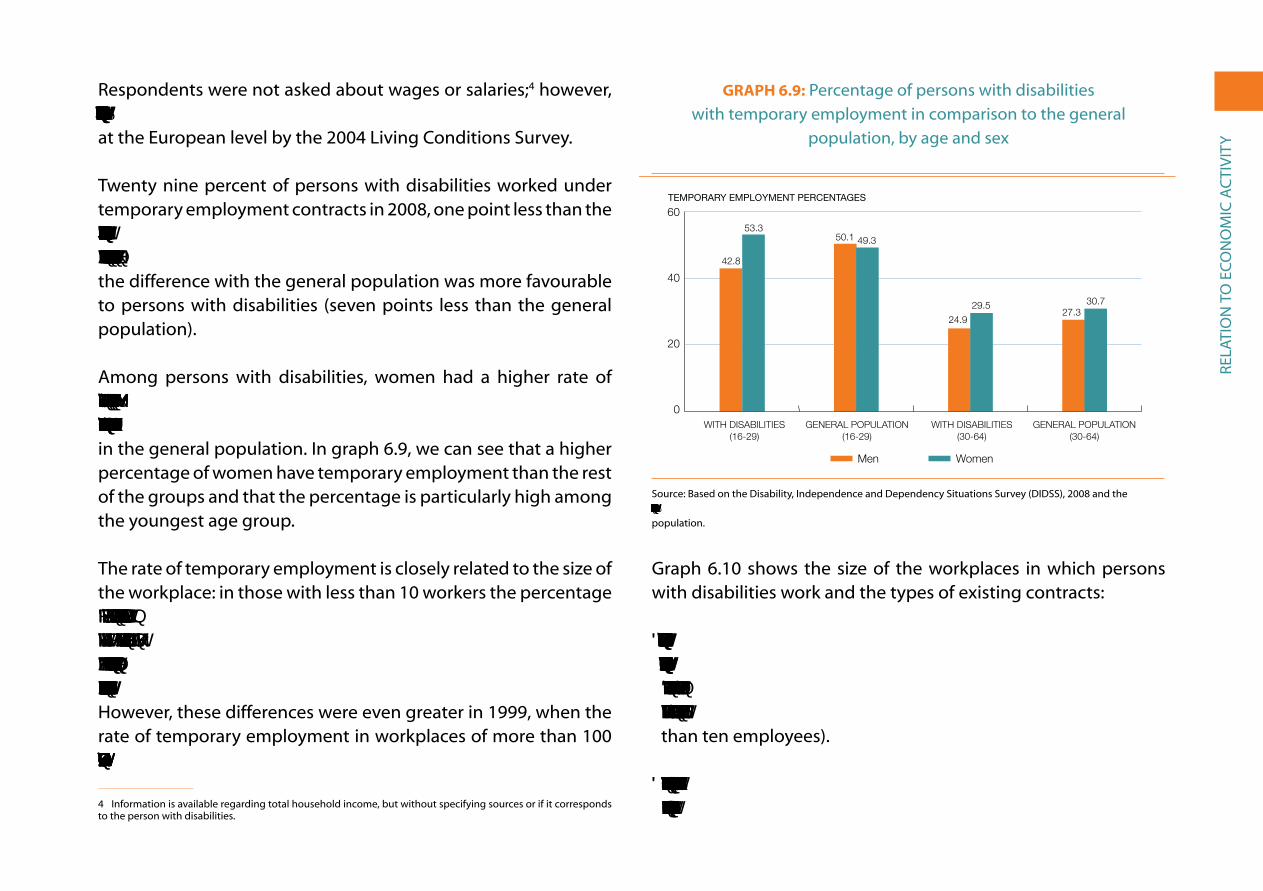
reLa
tio
n t
o e
Co
no
MiC
aC
tiV
ity
respondents were not asked about wages or salaries;4 however, this information gap can be rectified using information gathered at the european level by the 2004 Living Conditions survey.
twenty nine percent of persons with disabilities worked under temporary employment contracts in 2008, one point less than the average for the employed population in Spain (30.1%). This rate was five points higher than that recorded in 1999 (25%), when the difference with the general population was more favourable to persons with disabilities (seven points less than the general population).
among persons with disabilities, women had a higher rate of temporary employment than men in 2008 (32% versus 28.7%, respectively), with significant differences by age, as also occurs in the general population. in graph 6.9, we can see that a higher percentage of women have temporary employment than the rest of the groups and that the percentage is particularly high among the youngest age group.
the rate of temporary employment is closely related to the size of the workplace: in those with less than 10 workers the percentage of temporary jobs among persons with disabilities is 43%; in those with 10 to 19 workers the percentage is 39%; in those with 20 to 100 workers the percentage declines to 25%, and in workplaces with more than 100 workers the percentage is 20%. However, these differences were even greater in 1999, when the rate of temporary employment in workplaces of more than 100 employees was only 9%, less than half that of 2008.
4 information is available regarding total household income, but without specifying sources or if it corresponds to the person with disabilities.
GraPh 6.9: Percentage of persons with disabilities with temporary employment in comparison to the general
population, by age and sex
0
20
40
60 Mujeres
Hombres
Población general (30-64 años)Con discapacidad (30-64 años)Población general (16-29 años)Con discapacidad (16-29 años)
TEMPORARY EMPLOYMENT PERCENTAGES
C. Públicos C. PrivadosE. Infantil 81.60 18.30E. Primaria 83.70 16.20ESO 80.70 19.20Bachillerato 83.60 16.30Ciclos Formativos 78.10 21.80Garantia Social 71.40 28.50E. Especial 65.30 34.60
WomenMen
Hombres MujeresCon discapacidad (16-29 años) 42.8 53.3Población general (16-29 años) 50.1 49.3Con discapacidad (30-64 años) 24.9 29.5Población general (30-64 años) 27.3 30.7
0
20
40
60
GENERAL POPULATION(16-29)
WITH DISABILITIES(16-29)
GENERAL POPULATION(30-64)
WITH DISABILITIES(30-64)
6.9
42.8
53.350.1 49.3
24.9
29.527.3
30.7
source: Based on the Disability, independence and Dependency situations survey (DiDss), 2008 and the Economically Active Population Survey, fourth quarter of 2007 and first quarter of 2008 averages for the general population.
graph 6.10 shows the size of the workplaces in which persons with disabilities work and the types of existing contracts:
• There are 38,500 permanent, civil service contracts and they are concentrated in large workplaces (21% in those with more than 100 employees, 13% in those with 20 to 99 employees, 6% in those with 10 to 19 employees, and 3.7% in those with fewer than ten employees).
• Contracts of indefinite duration in the private sector make up more than 170,000 jobs and account for more than 50% of the

reLa
tio
n t
o e
Co
no
MiC
aC
tiV
ity
jobs in every size workplace, with the highest percentage in those of 20 to 99 employees (62%) and the lowest in the smallest (54%).
• Workers without a contract or only with verbal agreements account for less than 10,000 persons (3% of the total employed), but they represent up to 10% of the workforce with disabilities in small size businesses.
• The remaining temporary contracts total 75,000, making up 35% of the employees with disabilities in businesses of less than 20 employees and 23% and 19% in those of with 20 to 99 employees and 100 or more employees, respectively.
GraPh 6.10: types of contracts held by employed persons with disabilities, by size of company (totals)
0
25
50
75
100
125 Funcionarios/as
Otros indefinidos
Verbal o sin contrato
Otros temporales
100 y másA 20-99A10-19Menos de 10
NUMBER OF EMPLOYEES WITH DISABILITIES
NUMBER OF EMPLOYEES IN THE WORKPLACE
Other temporary contracts
Other permanent contracts
Civil servants Verbal contract/no contract
100 AND OVERUNDER 10 20-99
Menos de 10 10-19 20-99 100 y más Otros temporales 21.859 15.045 15.831 22.692,0 Verbal o sin contrato 6.963 728 1.342 287,0 Otros indefinidos 36.232 22.666 41.836 70.262,0 Funcionarios/as 2.510 2.446 8.826 24.795,0
0
25,000
50,000
75,000
100,000
125,000
10-19
Menos de 10 A10-19 A 20-99 100 y más Otros temporales 21,859 15,045 15,831 22,692 Verbal o sin contrato 6,963 0,728 1,342 0,287 Otros indefinidos 36,232 22,666 41,836 70,262 Funcionarios/as 2,510 2,446 8,826 24,795
6,10
source: Based on the Disability, independence and Dependency situations survey (DiDss), 2008.
The length of temporary contracts varies: 8% are for no more than six months and 12% are for between six months and three years. These percentages are higher in the general population, 17% and 16%, respectively. Along the same line, time working in the same job for persons with disabilities is higher: based on the survey, 16% have been in their current jobs less than one year in comparison to 20% of the general population, and 8% have been in their jobs between one and two years (11% for the general population).
The working day is split in 41% of the cases, is continuous in 30%, is by shifts in 12%, irregular or variable depending on the day in 10%, and reduced in only 2.8% (12% in the general population in 2008, according to the eaPs). the split shift is much more common among men (48%) than among women (32%). In the case of the continuous working day, the immense majority work in the morning/afternoon and only 0.9% work at night (1.3% of men and 0.4% of women). Shift work – morning, afternoon and night – affects women more than men (12.4% and 10.9%, respectively), as does working reduced days (5.2% of women and 1% of men). By age groups, the differences in working day are not very significant with the exception of working shifts, which is much more common among young people with disabilities (18% of those from 16 to 29 years of age) than in older adults (11% of those 30 years of age and older).
If we take into account the flexibility implied in part-time or reduced working days for persons with disabilities, particularly for persons that cannot work long hours, it is surprising that a much lower percentage are employed in jobs with such schedules than in the general population, as can be seen in graph 6.11.

reLa
tio
n t
o e
Co
no
MiC
aC
tiV
ity
GraPh 6.11: Part-time workers among persons with disabilities and in the general population, by sex (in percentages)
0
30 Mujeres
Hombres
Población general Con discapacidad
Men Women
GENERAL POPULATIONWITH DISABILITIES
Hombres MujeresCon discapacidad 1,0 5,2Población general 4,0 22,8
0
30
1.0%
5.2%4.0%
22.8%
6,11
source: Based on the Disability, independence and Dependency situations survey (DiDss), 2008 and the Economically Active Population Survey, the fourth quarter of 2007 and the first quarter 2008 averages for the general population.
Only 8% of persons with disabilities that are employed have some form of technical adaptation available in their workplace to help them carry out their tasks in a manner that is best adapted to their personal characteristics. this assistance is most frequently used by those with mobility disabilities (15%) and difficulties in carrying out domestic tasks (13%). A qualitative study ‘reveals significant ignorance [on the part of employers] regarding disabilities and the technical and organisational solutions available (technical and human resources) to support and take advantage of the abilities of these workers... particularly in regards to the economic costs of introducing these means and resources. But what is most serious, is that employers are often unaware of the very existence of aid for adapting the workplace’ (Fundación CireM, 134).
Lastly, the information gathered on the gross income of employed persons who ‘suffer some chronic or long-term limitation’ is based on the 2004 Living Conditions survey, coordinated by eurostat. As a group, the income of these persons was 8.5% below the average income of employed persons without limitations, but with significant differences by sex and age. While women earned 25.9% less than the general average for the Spanish without disabilities, the men earned 7% more, and this difference increases significantly by age. We cannot compare these results with information from the DiDss-2008, which gathered no information on wages and salaries; however, as we have mentioned, there are indicators in the survey, such as the lower percentage of men with disabilities with temporary contracts and reduced workdays in the older age group, which would imply higher salaries.
the results of the comparison of earnings in spain with the whole of the european Union in 2004 (14 countries responded to the survey by eurostat) are clear, yet surprising, since spain presents the best results in terms of the earnings of men with disabilities in comparison to the average income of both sexes of those without disabilities in the respective country. In contrast, women are in fifth place, behind Finland, Portugal, France and italy (aPPLiCa et al., 2007: 160). graph 6.12 shows the difference between the earnings of employed women and men with disabilities compared to the average income of persons of both sexes without disabilities in spain and the european Union as a whole. the average earnings of men in Spain is 44% greater than that of women, a difference that decreases to 22% in the EU-14; this is explained in part by the extraordinary rise in male income after 40 years of age.
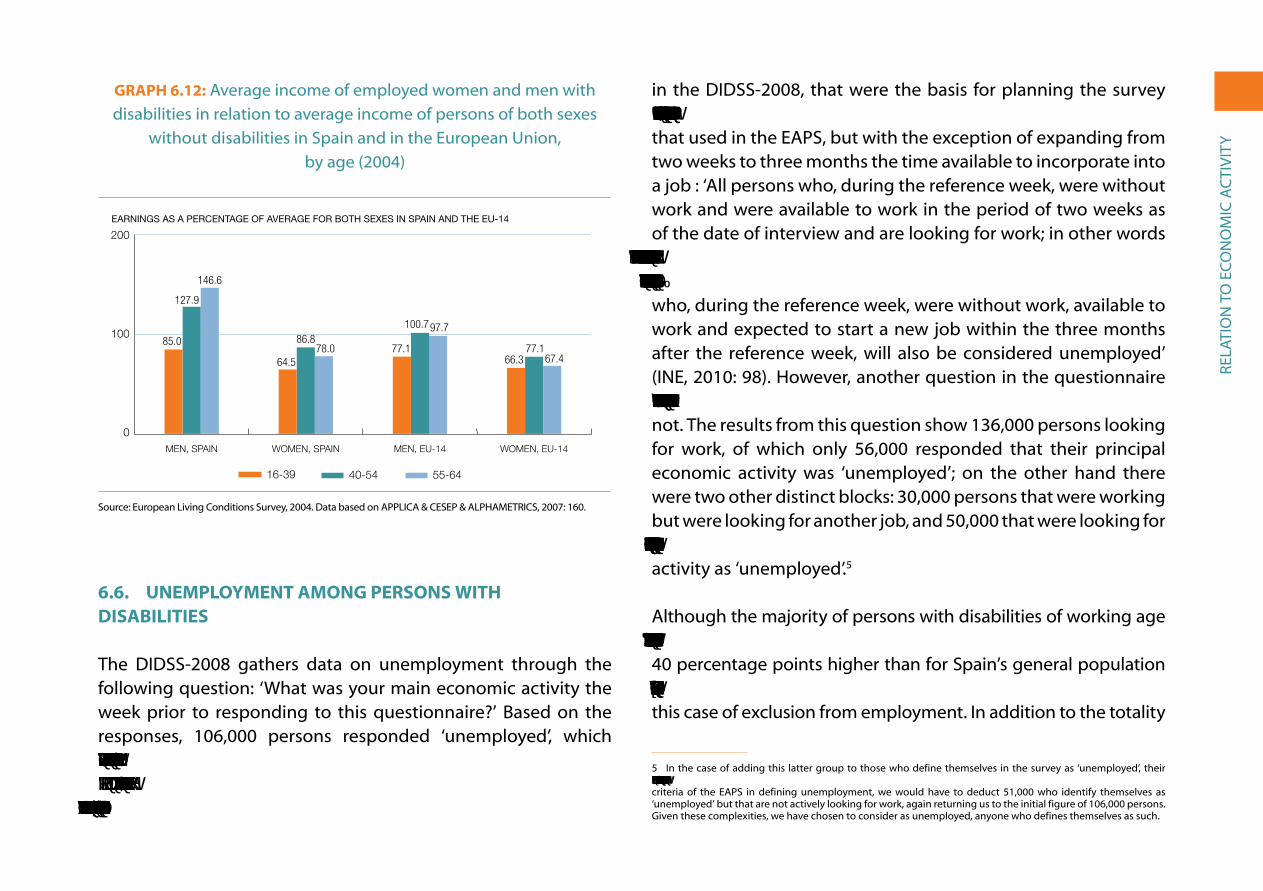
reLa
tio
n t
o e
Co
no
MiC
aC
tiV
ity
GraPh 6.12: average income of employed women and men with disabilities in relation to average income of persons of both sexes
without disabilities in spain and in the european Union, by age (2004)
0
100
20055-64 años
40-54 años
16-39 años
Mujeres UE-14Hombres UE-14Mujeres EspañaHombres España
EARNINGS AS A PERCENTAGE OF AVERAGE FOR BOTH SEXES IN SPAIN AND THE EU-14
Hombres España Mujeres España Hombres UE-14 Mujeres UE-1416-39 años 85,0 64,5 77,1 66,340-54 años 127,9 86,8 100,7 77,155-64 años 146,6 78,0 97,7 67,4
0
100
200
55-64 40-54 16-39
WOMEN, EU-14MEN, EU-14WOMEN, SPAINMEN, SPAIN
6,12
85.0
127.9
146.6
64.5
86.878.0 77.1
100.797.7
66.377.1
67.4
source: european Living Conditions survey, 2004. Data based on aPPLiCa & CeseP & aLPHaMetriCs, 2007: 160.
6.6. uneMPloyMent aMonG PerSonS WIth DISabIlItIeS
the DiDss-2008 gathers data on unemployment through the following question: ‘What was your main economic activity the week prior to responding to this questionnaire?’ Based on the responses, 106,000 persons responded ‘unemployed’, which represents 7.2% of the working age population (16 to 64 years of age in 2008), and 20.3% of ‘active’ persons (the sum of the employed and unemployed). In the definition of the variables used
in the DiDss-2008, that were the basis for planning the survey field work, ‘unemployed’ is defined in a very similar manner to that used in the eaPs, but with the exception of expanding from two weeks to three months the time available to incorporate into a job : ‘all persons who, during the reference week, were without work and were available to work in the period of two weeks as of the date of interview and are looking for work; in other words those who have taken specific measures over the last four weeks to find a job working for someone or for themselves,... those persons who, during the reference week, were without work, available to work and expected to start a new job within the three months after the reference week, will also be considered unemployed’ (ine, 2010: 98). However, another question in the questionnaire specifically asks whether the respondent is looking for work or not. the results from this question show 136,000 persons looking for work, of which only 56,000 responded that their principal economic activity was ‘unemployed’; on the other hand there were two other distinct blocks: 30,000 persons that were working but were looking for another job, and 50,000 that were looking for work and did not have any, but who did not define their principal activity as ‘unemployed’.5
although the majority of persons with disabilities of working age are capable of working, the rate of inactivity for this group is 65%, 40 percentage points higher than for spain’s general population of working age (25%). This indicates a form of social exclusion, in this case of exclusion from employment. in addition to the totality
5 in the case of adding this latter group to those who define themselves in the survey as ‘unemployed’, their number would be 157,000, which would lead to an unemployment rate of 27.2%. However, if we maintain the criteria of the eaPs in defining unemployment, we would have to deduct 51,000 who identify themselves as ‘unemployed’ but that are not actively looking for work, again returning us to the initial figure of 106,000 persons. given these complexities, we have chosen to consider as unemployed, anyone who defines themselves as such.
reLa
tio
n t
o e
Co
no
MiC
aC
tiV
ity
of active persons, we have also seen how the unemployment rate in 2008 for persons with disabilities was double that found in the general population (20.3% versus 9.2%), a situation which in all likelihood has worsened for both groups because of the current economic crisis. if the increase in the unemployment rate for persons with disabilities maintained the same ratio in relation to the general population as in 1999 (26.1/15.8%), the unemployment rate of the former would be 35%, and if it maintained the same ratio in relation to 2008 (20.3/9.2%), it would be 46%.
this section looks at the characteristics and circumstances of only those persons with disabilities that define themselves as ‘unemployed’ in the DiDss-2008, although we know that there are many others persons that would like to find work if it were possible, rather than being relegated to early retirement (through pensions based on a certified disability - above all men) or confined to housework (above all women). As a result, we will analyse the following points:
• The unemployment rate in function of the characteristics and circumstances of the population with disabilities, such as sex, age, education level, type of disability and impairment, household income level, habitat, region of residence, nationality, etc.
• The amount of time being unemployed, also in function of different characteristics.
• The most common methods used to look for work.
• The reasons given for explaining the difficulty finding work, particularly up to what point disability is considered the cause of exclusion from work.
• Lastly, we will look at the reasons why persons with disabilities that could work have stopped looking for work.
Unemployment rate by sex, age, education level and types of disability
There was a significantly higher unemployment rate among women with disabilities than men in 2008 (24% versus 17.2%), but the difference in the unemployment rates between men and women had decreased by four percentage points in comparison with 1999 (when rates were 33.1% and 22.1% respectively). In addition, as with the general population, the unemployment rate among young people with disabilities (27.6%) – those 16 to 29 years of age – was higher than for the rest of the adult population with disabilities. (the unemployment rate in 2008 for this age group in the general population was 14.7%).
Looking at the unemployment rate by education level, we find that it is four times higher for those who have no education (those that cannot read or write or that have not finished primary school) than for those with university educations, while those with intermediate levels of education (see graph 6.13) have an unemployment rate that falls between these two. this same correlation can also be seen, but in the opposite direction, in the rate of economic activity, which is much higher among those who have university studies (62%) than among those who have no education (17%). Again, those with intermediate levels of education have rates in the mid-range: for those with a primary school education, the rate is 31%; for those that have completed compulsory education, 40%; for those who have completed the baccalaureate, 50%; and for those who have completed intermediate or higher levels of vocational training, 51% and 54% respectively.

reLa
tio
n t
o e
Co
no
MiC
aC
tiV
ity
GraPh 6.13: Unemployment rate of persons with disabilities, by education level (in percentages)
0
40Tasa
Superiores IntermediosSin estudios
TasaSin estudios 32,7Intermedios 20,7Superiores 8,8
0
40
HIGHER LEVELINTERMEDIATE LEVELNO EDUCATION
6,13
32.7
20.7
8.8
source: Based on the Disability, independence and Dependency situations survey (DiDss), 2008.
of the eight major types of disabilities, only persons with hearing limitations had an unemployment rate below that of the overall Spanish population in 2008 (12.6% versus 14.6%). The highest unemployment rates are among persons with disabilities that involve limitations in interpersonal interactions and relationships (39.1%), as well as those that have difficulties in learning and the application of knowledge and development of tasks (37.6%). These are specifically the persons with disabilities that have their origin in mental impairments (multiple, language and intellectual impairments).
Unemployment is higher in low-income households
in households with persons with disabilities that have an average income of over 1,500 euros a month, the unemployment rate is
below the Spanish average, and it is very low (3.8%) when household income is over 2,500 euros a month. in contrast, in homes with monthly incomes below 1,000 euros, the unemployment rate is twice the overall average, and in those with incomes below 500 euros, the rate is 60% (graph 6.14). These inequalities exist in all the different age groups, whether the persons with disabilities are young or old. to explain this we suggest two hypotheses: 1) given that paid employment is the main form of income for families, it is logical that household income will be lower in homes where there are unemployed persons; 2) the chronic poverty of excluded social sectors is multidimensional and leads to, among other effects, higher unemployment rates among those who are part of these sectors. What is most likely is that both hypotheses explain in part the strong correlation between unemployment and poverty.
GraPh 6.14: Unemployment rate of persons with disabilities, by household income level (in pecentages)
0
10
20
30
40
50
60
70 Tasa
Más de 2.5002.000-2.499 €1.500-1.999 €1.000-1.499 €500-999 €Menos de 500 €
UNEMPLOYMENT RATE (%)
C. Públicos C. PrivadosE. Infantil 81,60 18,30E. Primaria 83,70 16,20ESO 80,70 19,20Bachillerato 83,60 16,30Ciclos Formativos 78,10 21,80Garantia Social 71,40 28,50E. Especial 65,30 34,60
MONTHLY HOUSEHOLD INCOME
€2,500 AND OVER€1,500-1,999€1,000-1,499€500-999LESS THAN € 500 €2,000-2,499
TasaMenos de 500 € 60,7500-999 € 35,41.000-1.499 € 23,81.500-1.999 € 13,62.000-2.499 € 7,4Más de 2.500 3,8
0
20
10
30
40
50
60
70
6,14
60.7
35.4
23.8
13.6
7.43.8
source: Based on the Disability, independence and Dependency situations survey (DiDss), 2008.
reLa
tio
n t
o e
Co
no
MiC
aC
tiV
ity
regional differences
the unemployment rate for working age persons with disabilities varies significantly by region, and is particularly high in the Canary Islands (42.1%) and Extremadura (36.3%). At the opposite extreme, with the lowest unemployment rates in 2008 and below the Spanish average are the regions of La Rioja (7.7%), Aragon (9.1%), the Basque Country (10.5%) and Navarre (12.9%). The remaining regions fall in intermediate positions, as can be seen in map 6.1.
MaP 6.1: Unemployment rate of persons with disabilities, by region Over 35%
20%-35%
15%-20%
Under 15%
Source: Based on the Disability, Independence and Dependency Situations Survey (DIDSS), 2008.In
the
majority
of
cases
the
rate
of
economic
activity
is
higher
in
the
regions
with
less
unemployment.
T
his
situation
encourages
persons
with
disabilities
to
look
for
employment,
and,
as
a
consequence, further increases the rate of activity. Such is the case
of Aragon and Navarre, which, along with Madrid, are the regions
with the highest economic activity rates.T
he
size
of
municipality
also
affects
the
unemployment
rate;
�L�W�©�L�V�©�O�R�Z�H�U�©�L�Q�©�F�L�W�L�H�V�©�Z�L�W�K�©�P�R�U�H�©�W�K�D�Q�©���������������©�L�Q�K�D�E�L�W�D�Q�W�V�©���������������©
�D�Q�G�©�L�Q�©�V�P�D�O�O�©�W�R�Z�Q�V�©�R�I�©�O�H�V�V�©�W�K�D�Q�©�������������©�L�Q�K�D�E�L�W�D�Q�W�V�©�����������������©�D�Q�G�©
�K�L�J�K�H�U�© �L�Q�© �L�Q�W�H�U�P�H�G�L�D�W�H�© �V�L�]�H�© �F�L�W�L�H�V�© �����������������©�,�Q�© �D�G�G�L�W�L�R�Q���© �J�H�Q�G�H�U�©
inequality
in
unemployment
rates
(higher
unemployment
among
women),
is
present
in
all
cases,
though
much
higher
in
small
towns
(8.3
percentage
point
difference
between
male
and
female
unemployment
rates)
than
in
large
cities
(a
difference
of
5.3 percentage points), as can be seen in graph 6.15.
lastly,
the
unemployment
rate
for
foreign
residents
with
disabilities
was
similar
to
that
for
the
Spanish
population
with
�G�L�V�D�E�L�O�L�W�L�H�V���© �D�O�W�K�R�X�J�K�© �Z�L�W�K�© �V�L�J�Q�L�½�F�D�Q�W�© �G�L�I�I�H�U�H�Q�F�H�V�© �E�D�V�H�G�© �R�Q�©
nationalities:
while
the
population
from
other
eu
countries
has
�D�Q�©�X�Q�H�P�S�O�R�\�P�H�Q�W�©�U�D�W�H�©�K�D�O�I�©�W�K�D�W�©�R�I�©�6�S�D�L�Q�©���������©�Y�H�U�V�X�V�©�����������©�W�K�H�©
rate
for
persons
from
outside
the
eu
was
2
points
higher
than
�W�K�H�© �D�Y�H�U�D�J�H�© �������������© �,�Q�© �W�K�L�V�© �J�U�R�X�S���© �W�K�H�© �X�Q�H�P�S�O�R�\�P�H�Q�W�© �U�D�W�H�© �I�R�U�©
�Z�R�P�H�Q�©�Z�D�V�©�D�O�P�R�V�W�©�I�R�X�U�©�W�L�P�H�V�©�J�U�H�D�W�H�U�©�����������©�W�K�D�Q�©�I�R�U�©�P�H�Q�©�����������©
In
other
words,
gender
inequality
in
access
to
employment
for
persons
with
disabilities
is
particularly
high
among
the
non-eu
population.
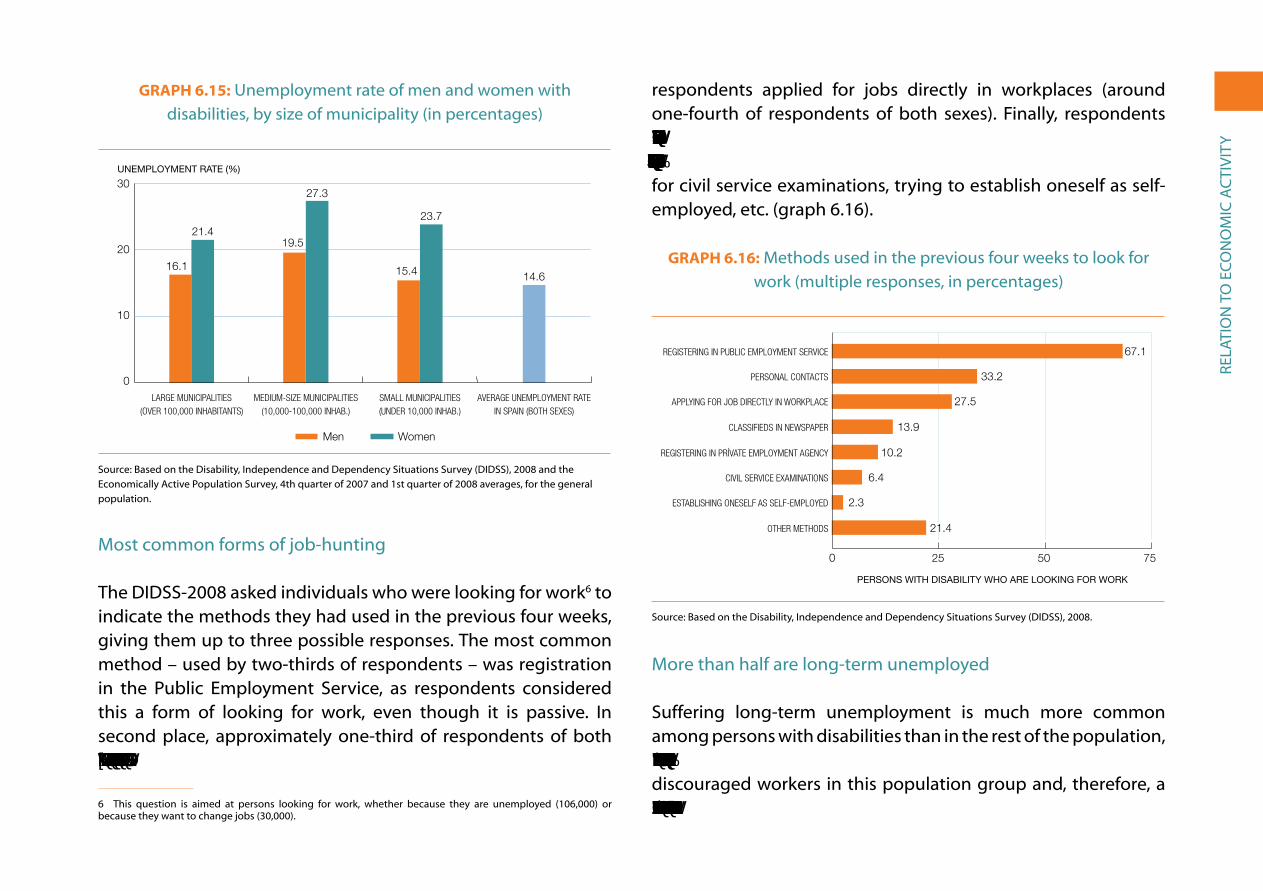
reLa
tio
n t
o e
Co
no
MiC
aC
tiV
ity
GraPh 6.15: Unemployment rate of men and women with disabilities, by size of municipality (in percentages)
0
10
20
30 Mujeres
Hombres
Tasa de paro media en España (ambos sexos)Municipios pequeños (Menos de 10.000 hab.)Municipios intermedios (10.000-100.000 hab.)Municipos grandes (más de 100.000 habitantes)
UNEMPLOYMENT RATE (%)
C. Públicos C. PrivadosE. Infantil 81,60 18,30E. Primaria 83,70 16,20ESO 80,70 19,20Bachillerato 83,60 16,30Ciclos Formativos 78,10 21,80Garantia Social 71,40 28,50E. Especial 65,30 34,60
WomenMen
Hombres MujeresMunicipos grandes (más de 100.000 habitantes) 16,1 21,4Municipios intermedios (10.000-100.000 hab.) 19,5 27,3Municipios pequeños (Menos de 10.000 hab.) 15,4 23,7Tasa de paro media en España (ambos sexos) 14,6
0
10
20
30
MEDIUM-SIZE MUNICIPALITIES(10,000-100,000 INHAB.)
LARGE MUNICIPALITIES(OVER 100,000 INHABITANTS)
AVERAGE UNEMPLOYMENT RATEIN SPAIN (BOTH SEXES)
SMALL MUNICIPALITIES(UNDER 10,000 INHAB.)
6,15
16.1
21.419.5
27.3
15.4
23.7
14.6
source: Based on the Disability, independence and Dependency situations survey (DiDss), 2008 and the economically active Population survey, 4th quarter of 2007 and 1st quarter of 2008 averages, for the general population.
Most common forms of job-hunting
the DiDss-2008 asked individuals who were looking for work6 to indicate the methods they had used in the previous four weeks, giving them up to three possible responses. the most common method – used by two-thirds of respondents – was registration in the Public employment service, as respondents considered this a form of looking for work, even though it is passive. in second place, approximately one-third of respondents of both sexes turned to personal contacts to find work. In third place,
6 this question is aimed at persons looking for work, whether because they are unemployed (106,000) or because they want to change jobs (30,000).
respondents applied for jobs directly in workplaces (around one-fourth of respondents of both sexes). Finally, respondents also used a range of other means, such as the media/newspaper classifieds, registering in private employment services, preparing for civil service examinations, trying to establish oneself as self-employed, etc. (graph 6.16).
GraPh 6.16: Methods used in the previous four weeks to look for work (multiple responses, in percentages)
0 25 50 75
Tasa
Otros métodos
Gestiones para establecerse por su cuenta
Prepara oposiciones
Inscripción o�cina de empleo privada
A través de la prensa
Se ha dirigido a empresas
Utilizando relaciones personales
Inscripción en un servicio público de empleo
TasaOtros métodos 21.4Gestiones para establecerse por su cuenta 2.3Prepara oposiciones 6.4Inscripción o�cina de empleo privada 10.2A través de la prensa 13.9Se ha dirigido a empresas 27.5Utilizando relaciones personales 33.2Inscripción en un servicio público de empleo 67.1
PERSONS WITH DISABILITY WHO ARE LOOKING FOR WORK
6.16
0 25 50 75
OTHER METHODS
ESTABLISHING ONESELF AS SELF-EMPLOYED
CIVIL SERVICE EXAMINATIONS
REGISTERING IN PRÍVATE EMPLOYMENT AGENCY
CLASSIFIEDS IN NEWSPAPER
APPLYING FOR JOB DIRECTLY IN WORKPLACE
PERSONAL CONTACTS
REGISTERING IN PUBLIC EMPLOYMENT SERVICE 67.1
33.2
27.5
13.9
10.2
6.4
2.3
21.4
source: Based on the Disability, independence and Dependency situations survey (DiDss), 2008.
More than half are long-term unemployed
suffering long-term unemployment is much more common among persons with disabilities than in the rest of the population, a circumstance which probably creates a significant number of discouraged workers in this population group and, therefore, a low rate of economic activity (35.5%, less than half the rate for

reLa
tio
n t
o e
Co
no
MiC
aC
tiV
ity
the general population: 73% in 2008). Thus, if we understand as ‘long-term unemployed’ those persons that have been out of work for more than one year, we find that more than half of the unemployed with disabilities are in this situation (56.9%), in comparison to one-fifth of the general unemployed population (21.3%). In 1999, the percent that were long-term unemployed was even higher (58.1%), but the difference with the general population was much less (8 percentage points in 1999 in comparison to 25 points in 2008).
Long-term unemployment is higher among women (graph 6.17), which can cause them to become discouraged when looking for work, leading to a rate of economic activity 10 points below that of men (31.2% versus 41.3%). Long-term unemployment is also higher with age: 33% among those16-29 years of age, 47% among those 30 to 44 years of age and 70.6% among those from 45 to 64. the difference is even more extreme regarding the unemployed who have been looking for work for five years or more: 2% among youth and young adults, 16% among the intermediate age group and 31% among those in the oldest age group.
Why is it so difficult for persons with disabilities to find work? The majority of respondents provided the following two reasons: ‘because of their disability’ (45.9%) and because ‘finding work is difficult for anyone’ (20.7%). The former refers to exclusion from the labour market as a result of disability, with men giving this answer more often than women (55.1% and 37.6%, respectively). the latter refers to a situation faced by all workers, and is a response given by both sexes equally. in addition to these reasons, two others are also mentioned: lack of education (5.4%), whether meaning ‘not having enough education to get a job’ (women,
6.6%; men, 1.6%) or simply meaning ‘having no education’ (1.2%); and the ‘lack of work experience’ (4.6%, equally among both sexes) (graph 6.18).
GraPh 6.17: Long-term unemployment (more than one year) among men and women with disabilities and in comparison to the average for the general population (in percentages)
0
25
50
75 Más de 2 años
De 1 a 2 años
Población general (ambos sexos)Hombres con discapacidadMujeres con discapacidad
LONG-TERM UNEMPLOYMENT (%)
More than 2 yearsFrom 1 to 2 years
GENERAL POPULATION (BOTH SEXES)
WOMEN WITH DISABILITIES
Mujeres con discapacidad Hombres con discapacidad Población general (ambos sexos) De 1 a 2 años 17.2 17.4 11.3 Más de 2 años 43.6 34.9 11.1
0
25
50
75
MEN WITH DISABILITIES
Menos de 10 A10-19 A 20-99 100 y más Otros temporales 21.859 15.045 15.831 22.692 Verbal o sin contrato 6.963 0.728 1.342 0.287 Otros inde�nidos 36.232 22.666 41.836 70.262 Funcionarios/as 2.510 2.446 8.826 24.795
6.17
43.6
17.2
34.9
17.4
11.1
11.3
source: Based on the Disability, independence and Dependency situations survey (DiDss), 2008 and the economically active Population survey, 4th quarter of 2007 and 1st quarter of 2008 averages, for the general population.
if we analyse the above responses based on origin of disability, the main reason given in all cases for not finding work is disability, with one exception: those that have vision problems respond more often that ‘finding work is difficult for anyone’ (30%). The impact of disability on finding work is pervasive in those with nervous system impairments (67%) and multiple impairments (61%), but appears less often in the responses of those with hearing

reLa
tio
n t
o e
Co
no
MiC
aC
tiV
ity
impairments (33%), language, speech and voice impairments (39%), and, as just mentioned, in those with visual impairments (25%). ‘Lack of work experience’ is raised primarily by those with mental or multiple impairments (7% in both cases).
GraPh 6.18: Main reasons for not being able to find a job (in percentages)
0
10
20
30
40
50
60 Mujeres
Hombres
Sin experiencia laboralBaja formaciónEs difícil para cualquieraPor su discapacidad
PERSONS WITH DISABILITIES WHO ARE LOOKING FOR WORK (%)
REASON CANNOT FIND WORK
C. Públicos C. PrivadosE. Infantil 81.60 18.30E. Primaria 83.70 16.20ESO 80.70 19.20Bachillerato 83.60 16.30Ciclos Formativos 78.10 21.80Garantia Social 71.40 28.50E. Especial 65.30 34.60
WomenMen
Hombres MujeresPor su discapacidad 55.1 37.6Es difícil para cualquiera 20.4 20.8Baja formación 2.7 8.0Sin experiencia laboral 4.3 4.9
0
20
30
10
40
50
60
IT IS DIFFICULT FOR ANYONE
BECAUSE OF DISABILITY NO WORK EXPERIENCELOW EDUCATION LEVEL
6.18
55.1
37.6
20.4 20.8
2.7
8.04.3 4.9
source: Based on the Disability, independence and Dependency situations survey (DiDss), 2008.
6.7. CauSeS of the loW rate of eConoMIC aCtIVIty
Almost 70% of working age persons with disabilities (536,000 women and 473,000 men) are not employed and are not looking for employment. the answers to a question about why they are not looking for work in the 2008 survey provided 15 possible
responses, of which respondents could choose up to three. Based on the results shown in graph 6.19, answers could be grouped in the following manner:
• The main reason given is ‘cannot work’ (64.4%), to which can be added these three: ‘early retirement’ (11.2%), ‘receiving a cash benefit’ (7.1%) and ‘laid off’ (0.4%). In other words, these diverse reasons account for why approximately 80% ‘cannot work’, reasons which we will return to below.
• The second main reason is that ‘because they are disabled, they believe it will be difficult to find work’ (24.6%), to which we can add three additional causes: ‘believes he/she will not find work, never looked for it’ (2.1%), ‘believes he/she will not find work, looked for work before’ (1.8%) and ‘does not believe work is available’ (1.4%). Combined, these account for 30% of the responses.
• Two reasons refer to those who do not look for work because they already have a principal activity: ‘studying or receiving training’ (2.6%) and ‘personal or family reasons’ (8.6%): the latter response is given primarily by women who work in the home. Another reason given by 4.6%, ‘I don’t need to work’, could be related to the fact that these respondents are working in the home (two-thirds are ‘homemakers’), or it could be because they receive pensions and do not need another source of income (one-fifth are pensioners).
• The remaining reasons are barely mentioned by respondents (all receiving less than 1% of responses) and refer to circumstantial conditions in the labour market (‘waiting for seasonal work’, ‘waiting to hear about prior job applications’, ‘expecting to

reLa
tio
n t
o e
Co
no
MiC
aC
tiV
ity
resume self-employment’) or to persons that ‘do not know where to go to find work’.
if we leave out the reasons that refer to having another primary activity in which they spend their time (studying, 18,000 persons, almost all of them young, as we have mentioned in chapter 4; and domestic tasks, 155,000, almost all of them women and which will be the focus of the next section), the real causes of the lack of employment among persons with disabilities are the two reasons cited first: ‘cannot work’ and ‘because they are disabled, they believe it will be difficult to find work’. With the exception of some minor responses of no statistical significance, the rest of the responses are really related to these two reasons.
GraPh 6.19: reasons given by working age persons with disabilities for not looking for employment (in percentages)
0 10 20 30 40 50 60 70
Espera reanudar actividad por cuenta propia
Espera los resultados de solicitudes anteriores
Espera la estación de mayor actividad
Por estar afectado por regulación de empleo
No sabe donde dirigirse para encontrarlo
No cree que haya alguno disponible
Cree que no lo encontrará, buscó antes
Cree que no lo encontrará, no buscó nunca
Cursa estudios-recibe formación
No necesita trabajar
Por percibir una prestación económica
Razones personales o familiares
Está jubilado
Está discapacitado,sería difícil encontrarlo
No puede trabajar
TasaNo puede trabajar 64,4Está discapacitado,sería difícil encontrarlo 24,6Está jubilado 11,2Razones personales o familiares 8,6Por percibir una prestación económica 7,1No necesita trabajar 4,6Cursa estudios-recibe formación 2,6Cree que no lo encontrará, no buscó nunca 2,1Cree que no lo encontrará, buscó antes 1,7No cree que haya alguno disponible 1,4No sabe donde dirigirse para encontrarlo 0,7Por estar afectado por regulación de empleo 0,4Espera la estación de mayor actividad 0,3Espera los resultados de solicitudes anteriores 0,2Espera reanudar actividad por cuenta propia 0,2
0 2010 30 50 6040 70
PLANNING TO RESUME SELF-EMPLOYMENT
WAITING ON JOB APPLICATIONS
WAITING FOR SEASONAL WORK
WAS LAID OFF
DOESN’T KNOW WHERE TO LOOK
THERE IS NO WORK
BELIEVES IT’S IMPOSSIBLE TO FIND/LOOKED IN PAST
BELIEVES IT’S IMPOSSIBLE TO FIND/NEVER LOOKED
STUDYING/IN TRANING PROGRAMME
DOES NOT NEED TO WORK
RECEIVES A CASH BENEFIT
PERSONAL OR FAMILY REASONS
RETIRED
DISABILITY WOULD MAKE IT DIFFICULT TO FIND A JOB
CANNOT WORK
6,19
PERSONS BETWEEN 16 AND 64 WHO ARE NOT LOOKING FOR WORK (%)
source: Based on the Disability, independence and Dependency situations survey (DiDss), 2008.
the primary reason for not looking for work: ‘i cannot work’
the primary reason given for not looking for work is ‘cannot work’, which should not be understood to mean an inability or incapacity to work, something that occurs in a minority of cases (only 6% of respondents in the DiDss-2008 stated that they were ‘unable to work’). the response, ‘cannot work’ is generally associated with individuals that are receiving ‘permanent disability pensions’, which do not permit them to also carry out paid work. in fact, 77% of those who say they are not looking for work because they ‘cannot work’, are individuals that define their principal activity as receiving a contributory pension (259,000, majority men) or non-contributory pension (94,000, majority women) or who believe that they are ‘unable to work’ (60,000, equal numbers of men and women). to these groups we must add those that responded that they could not work because they had accepted early retirement or were receiving some type of economic assistance, as well as 14% that indicated that they could not work outside of the home because they were completely occupied with domestic responsibilities (77,000 – all of them women!).
the DiDss-2008 does not specify the number of working age persons that receive pensions. there is a question in the survey which asks respondents if they have received a pension in the previous 12 months, but the rate of ‘no response’ is very high; however, thanks to the question regarding the main economic activity of respondents in the previous week, we know that 695,000 persons define themselves as pensioners or unable to work (see section 6.1). in addition, there are segments of the population that do not define their main activity as receiving a pension, yet they may be recipients of
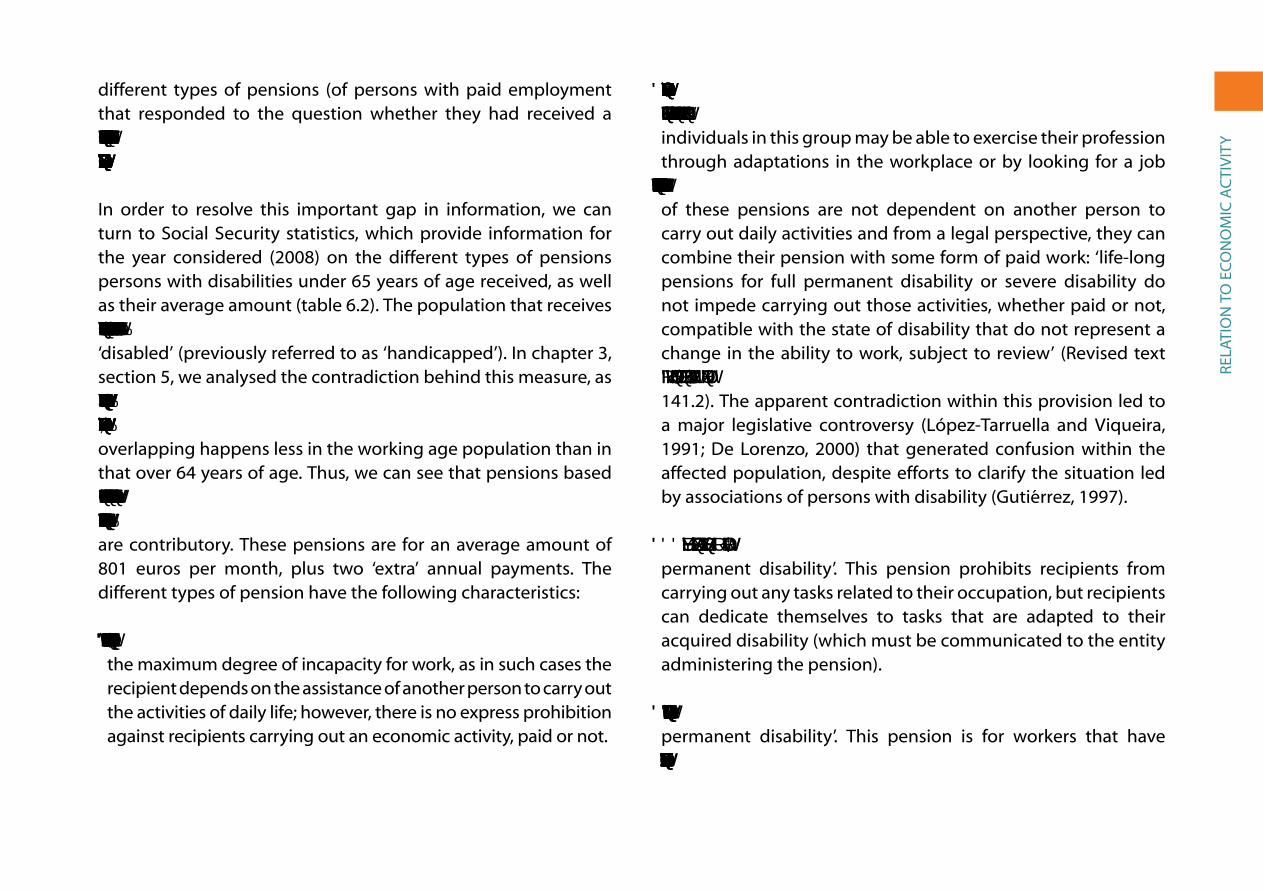
reLa
tio
n t
o e
Co
no
MiC
aC
tiV
ity
different types of pensions (of persons with paid employment that responded to the question whether they had received a pension in the previous 12 months, 34% said they had received a contributory pension and 27%, a non-contributory pension).
in order to resolve this important gap in information, we can turn to social security statistics, which provide information for the year considered (2008) on the different types of pensions persons with disabilities under 65 years of age received, as well as their average amount (table 6.2). the population that receives pensions based on a disability has to previously be certified as ‘disabled’ (previously referred to as ‘handicapped’). in chapter 3, section 5, we analysed the contradiction behind this measure, as a segment of the persons with certification are not disabled and others with disabilities do not have certification. In any case, this overlapping happens less in the working age population than in that over 64 years of age. thus, we can see that pensions based on some type of impairment cover 75% of the population with disabilities of working age and that four-fifths of these pensions are contributory. these pensions are for an average amount of 801 euros per month, plus two ‘extra’ annual payments. the different types of pension have the following characteristics:
• 2.9% of the pensions (31,650 persons) are for ‘severe disability’, the maximum degree of incapacity for work, as in such cases the recipient depends on the assistance of another person to carry out the activities of daily life; however, there is no express prohibition against recipients carrying out an economic activity, paid or not.
• 34.5% (381,940 persons) receive a contributory pension for ‘full permanent disability’. Despite the finality of the formulation, individuals in this group may be able to exercise their profession through adaptations in the workplace or by looking for a job more appropriate to their circumstances/specificities. Recipients of these pensions are not dependent on another person to carry out daily activities and from a legal perspective, they can combine their pension with some form of paid work: ‘life-long pensions for full permanent disability or severe disability do not impede carrying out those activities, whether paid or not, compatible with the state of disability that do not represent a change in the ability to work, subject to review’ (revised text of the General Law on Social Security, 1/1994 20 June, art. 141.2). the apparent contradiction within this provision led to a major legislative controversy (López-tarruella and Viqueira, 1991; De Lorenzo, 2000) that generated confusion within the affected population, despite efforts to clarify the situation led by associations of persons with disability (gutiérrez, 1997).
• 44.5% (492,090) receive contributory pensions for ‘total permanent disability’. this pension prohibits recipients from carrying out any tasks related to their occupation, but recipients can dedicate themselves to tasks that are adapted to their acquired disability (which must be communicated to the entity administering the pension).
• 0.1% (1,160 persons) receive a contributory pension for ‘partial permanent disability’. this pension is for workers that have suffered a decline in functioning of no less than 33% and which
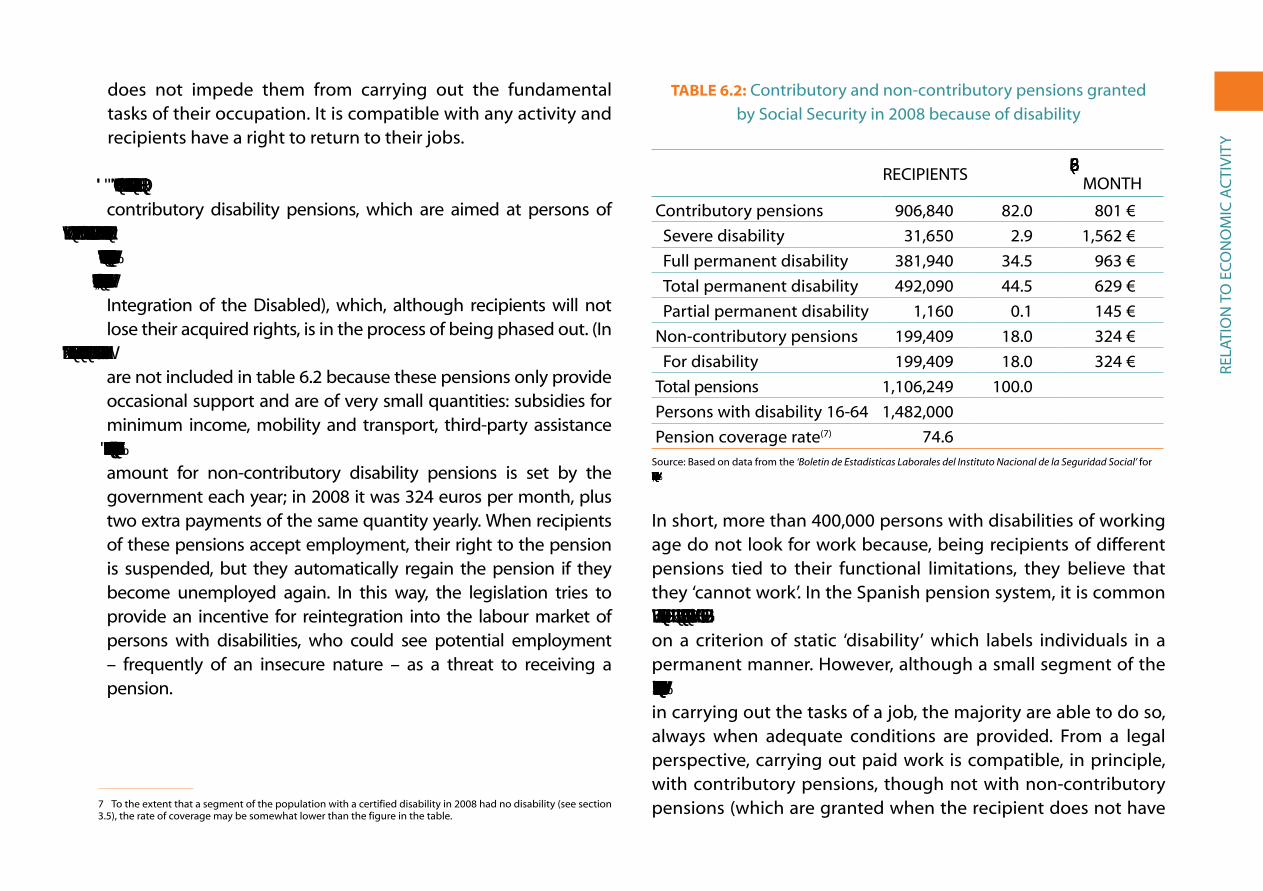
reLa
tio
n t
o e
Co
no
MiC
aC
tiV
ity
does not impede them from carrying out the fundamental tasks of their occupation. it is compatible with any activity and recipients have a right to return to their jobs.
• 18% (199,409 persons, the majority women) receive non-contributory disability pensions, which are aimed at persons of working age that have a disability equal to or above 65% and that lack sufficient income within their household. These pensions substituted the prior benefit from the LISMI (Law on the Social integration of the Disabled), which, although recipients will not lose their acquired rights, is in the process of being phased out. (in 2008, there were still 45,891 persons receiving these benefits who are not included in table 6.2 because these pensions only provide occasional support and are of very small quantities: subsidies for minimum income, mobility and transport, third-party assistance and healthcare and pharmaceutical assistance.) The financial amount for non-contributory disability pensions is set by the government each year; in 2008 it was 324 euros per month, plus two extra payments of the same quantity yearly. When recipients of these pensions accept employment, their right to the pension is suspended, but they automatically regain the pension if they become unemployed again. in this way, the legislation tries to provide an incentive for reintegration into the labour market of persons with disabilities, who could see potential employment – frequently of an insecure nature – as a threat to receiving a pension.
7 to the extent that a segment of the population with a certified disability in 2008 had no disability (see section 3.5), the rate of coverage may be somewhat lower than the figure in the table.
table 6.2: Contributory and non-contributory pensions granted by social security in 2008 because of disability
reCiPients % EUROS/PER MontH
Contributory pensions 906,840 82.0 801 €
severe disability 31,650 2.9 1,562 €
Full permanent disability 381,940 34.5 963 €
total permanent disability 492,090 44.5 629 €
Partial permanent disability 1,160 0.1 145 €
non-contributory pensions 199,409 18.0 324 €
For disability 199,409 18.0 324 €
total pensions 1,106,249 100.0
Persons with disability 16-64 1,482,000
Pension coverage rate(7) 74.6source: Based on data from the ‘Boletin de Estadisticas Laborales del Instituto Nacional de la Seguridad Social’ for 2008: Does not include non-contributory subsidies and benefits from LISMI.
in short, more than 400,000 persons with disabilities of working age do not look for work because, being recipients of different pensions tied to their functional limitations, they believe that they ‘cannot work’. in the spanish pension system, it is common that pensions are of an indefinite length, as they are based on a criterion of static ‘disability’ which labels individuals in a permanent manner. However, although a small segment of the population with disabilities may face insurmountable difficulties in carrying out the tasks of a job, the majority are able to do so, always when adequate conditions are provided. From a legal perspective, carrying out paid work is compatible, in principle, with contributory pensions, though not with non-contributory pensions (which are granted when the recipient does not have

reLa
tio
n t
o e
Co
no
MiC
aC
tiV
ity
sufficient income). As was mentioned, approximately one-third of employed persons with disabilities receive contributory assistance.
a qualitative study, based on discussion groups with individuals with disabilities about their life experiences, gathered a wide range of discursive positions regarding disability pensions that were closely related to personal and environmental circumstances, such as the type and degree of disability, the ideological position of the subject and his/her family, previous economic and occupational status, sex and age of the person affected and the conditions of the local labour market (Colectivo ioé and CiMoP, 1998: 303-320). this set of conditions, interacting with the capacity for manoeuvre of the persons involved, leads to a typology of recipients of disability pensions that includes three categories:
• Recipients of relatively high contributory pensions that had previously had stable and skilled employment (majority men). in these cases, when the recipient stops working, a change in identity takes place (from worker to pensioner) that has little impact on his/her social role, as the amount of the pension permits the recipient to continue to make a sufficient contribution to family income. The affected person, if his/her disability permits, can carry out other activities (those related to free time or volunteering) and may even carry out paid work, compatible with receiving a pension (in such a case, a persons income may even be higher than when they were not disabled).
• Recipients of low contributory pensions, as a result of having contributed for a limited number of years or because of having worked in low paying jobs (majority men). in these cases,
recipients are more likely to suffer a loss of identity, associated not only with a decline in economic and occupational status, but with the increased precarious situation of the family, due to the low pension not covering the needs of the family at the previously accustomed to level. an alternative to this situation is to find paid work that will increase the income from the pension, whether in the ordinary labour market (regular or irregular) or in sheltered employment (as do the visually impaired who sell lottery tickets, adding what they obtain to the contributory pensions they receive as a result of their employment prior to their impairment).
• Recipients of non-contributory pensions, a benefit associated with unemployment and not conditioned upon having previously contributed to social security as a worker, specifically aimed at persons unable to integrate into the ordinary labour market (majority women). recipients of these pensions, given these conditions, are often negatively affected and feel stigmatised, seeing their dependency on family reinforced and other employment alternatives that could place the pension at risk blocked. nevertheless, there are cases of persons with disabilities (for example, housewives in poor families) for whom a non-contributory pension is an important and non-stigmatising supplement that reinforces their identity within the family.
second reason for not looking for work: disability is an obstacle
the second most common reason or argument for not looking for work is that ‘because they are disabled, they believe it will be difficult to find work’. This refers to individuals that have stopped looking for work because, in their opinion, society and, more

reLa
tio
n t
o e
Co
no
MiC
aC
tiV
ity
concretely, the labour market discriminate against them and place obstacles in their path that are difficult to overcome. There were actually several reasons respondents gave that could fit into this framework and that were subscribed to by more than one quarter of a million persons, almost one-third of a whom did not look for work in 2008 (of these, more than half were recipients of pensions and another important segment was women dedicated to housework). implicitly, this argument implies a critique of the functioning of the labour market, which has gone from a socially regulated model to a neoliberal model. in this context, the most disadvantaged social sectors (among them, many persons with disabilities) are negatively affected and employment policy aimed at encouraging their employment has been inadequate.
in effect, the evolution of the spanish labour market in recent decades is characterised by an increase in competitiveness and segmentation, which, up until the arrival of the recent economic crisis, permitted a significant increase in productivity and employment, but at the cost of the development of a dual labour market, in which two distinct business practices in terms of employment coexist (Castillo, 2008; recio, 2009):
• One based on positive motivations involving ‘jobs with continuity’ (based on stable contracts agreed between employers and trade unions, as well as the progressive increase of salaries and internal career advancement) on which the stability of businesses or the public administration of services depend (the labour market’s so-called primary sector).
• One based on negative motivations involving low-skilled jobs (that entail the risk of losing employment and becoming
unemployed again, with the resulting threat of social exclusion) or jobs that do not affect the stability of the productive system or public services (the secondary sector of the labour market). in this case, individual temporary contracts, sub-contracting, self-employment and the submerged economy dominate. the salaries are low and unstable, while piecework, commissions for productivity and tips are common.
in the current spanish situation we can say that this dual model of labour relations prevails. Policies developed over the last 30 to 40 years have led a transformation from a ‘protective’ model of positive motivations (taking into account the peculiarities of the introduction into spain of the welfare state in the 1960s and 70s) to a neoliberal model of competitive individualism, characterised by the existence of a ‘pure and simple’ market that began to impose its hegemony beginning in the 1980s. in this sense, we have seen the gradual decay of a socioeconomic model based on a state that regulated and protected the national labour market, and its slow substitution for a market model in which the competitive logic of large transnational private corporations prevails; corporations whose main focus is obtaining maximum economic efficiency based on the formula, ‘high yield/low costs’. In the words of Luis enrique alonso, the Keynesian pact and the welfare state, which had developed in europe after the second World War had entered into crisis and had given way to ‘the constitution of a new disciplinary cycle as a process of reactivation and extending the market and competition as absolute authorities (that dictate norms and define rationality). A parallel process of deregulation also exists in association with this general remarketisation...’ (alonso, 2007: 240).

reLa
tio
n t
o e
Co
no
MiC
aC
tiV
ity
this new labour market model creates a clear distinction between potential employees who are considered qualified and profitable to employ, giving them access to well-paying jobs, and those who are less qualified and less profitable to employ, for whom only low paying jobs under poor working conditions remain (or not). this type of labour market expands considerably during boom stages, such as the one from 1994 to 2007, a cycle in which temporary employment grew, and then shrinks during stages of crisis, such as the one we are currently living through, with more than 2 million jobs lost, the majority of them low-paying. according to albert recio, ‘while the spanish labour market destroys more jobs than any other european country during recessions, it also generates more jobs than any other in periods of growth... observing the evolution of employment we would have to conclude that spain has a very flexible labour market, as employment adjusts in a very elastic manner to market conditions’ (recio, 2009: 90).
the social groups more likely to belong to the secondary sector of the labour market are women, young people, non-eU immigrants, those looking for work over 45 years of age and persons with disabilities. Under current labour market conditions, employment policies aimed at encouraging the employment and promotion of these sectors (both general policies, through successive labour reforms, as well more specific policies aimed at promoting employment) have not been able to resolve or alleviate the discriminatory effects of this dual labour market model. in fact, such measures have in general reinforced the insecurity and marginalisation of these groups, forcing them in the most extreme cases to accept minimum benefits, almost in the form of welfare, which tie them into situations of dependency or into traditional forms of family solidarity (the household economy),
instead of promoting decent jobs based on their skills and with possibilities for professional advancement.
6.8. houSeWork anD the ProVISIon of Care
in the context of Western countries, social integration through housework is a modality that has been chiefly assigned to women, although this is a decreasing trend. although women’s work in the home is without monetary compensation, it should be highly valued as it is of great importance for the cohesion and reproduction of the social system; however, doing housework enjoys little prestige and the negative image of the ‘housewife’, a popular expression with sexist connotations, continues to be so widespread that it encourages young women to leave home and find paid employment. In fact, the rate of economic activity among women has not stopped growing in the last 15 years: from 38% in 1995, 42% in 2000 and 46% in 2005, to 52% in 2010.
in spain, the 2002-2003 time Use survey, carried out by the national statistics institute within the framework of a european wide effort coordinated by eurostat,8 shows that if we add up the hours of paid work and the hours spent carrying out domestic tasks, women worked 20% more than men and domestic tasks took up 12% more time than paid work. Regarding the division of tasks, women dedicate 71.8% of their time to housework, while men dedicate 70.8% of their time to paid work. In short, of the total amount of time dedicated to domestic tasks, women did 75% of it and men 25%.
8 a broad survey of more than 20,000 households by regions. see the methodology and results at www.ine.es.

reLa
tio
n t
o e
Co
no
MiC
aC
tiV
ity
as the percentage of women in paid employment grows, maintaining the unequal division of domestic labour tends to reduce the time women have available for leisure, rest and social relations. this explains why the majority of women with ‘double shifts’ (working both inside and outside the home) state that their normal pace of life is ‘rushed’ (for 83%), that they ‘don’t have enough time to achieve the things they want’ (71%) and that there are ‘negative physical and psychological effects on their health’ (63%) (Colectivo Ioé, 1996). These effects are even greater for women who are poor and with low job skills, circumstances which are much more common, as we have seen, in the population with disabilities.
in this context, an important gap in the DiDss-2008 must be noted, as it does not permit an accurate assessment to be made of the degree to which women continue to be in charge of housework and the degree of involvement of men. From the question asking respondents what their main economic activity was in the week prior to the survey, we know that 23.5% of working age women (182,500 in total) checked the ‘housework’ box (only 0.2% of men); however, respondents could only check one box, which means that we do not know how many of those who checked other responses (‘pensions’, ‘working’, ‘on unemployment’, or ‘studying’) were also doing all or some of the housework.
the survey carried out a decade earlier – more accurate on this point – shows that, in addition to those that identified ‘housework’ as their main occupation, there were 31% that combined housework with a job, unemployment, a pension or studying. if we apply the same proportion to the data from the 2008 survey, we could conclude that in that year 34% of women
with disabilities of working age worked in the home (265,000 in total). this percentage is considerably lower than the percentage ten years earlier (51.9%). However, while recognising this positive change, we need to keep in mind that this is an estimate, and it is still far from the corresponding percentage for the overall female population in spain (see graph 6.20): according to the 2008 eaPs, there were 15.1 million women between 16 and 64 years of age, and of these, 3.7 million were considered ‘inactive’ under the category ‘housework’.
GraPh 6.20: Working age women with disabilities who are responsible for housework and in comparison to the average
in spain (in percentages)
0
10
20
30
40
50
60 Tasa
Mujeres en España 2008Mujeres con discapacidad 2008Mujeres con discapacidad 1999
WOMEN BETWEEN 16 AND 64 (%)
C. Públicos C. PrivadosE. Infantil 81,60 18,30E. Primaria 83,70 16,20ESO 80,70 19,20Bachillerato 83,60 16,30Ciclos Formativos 78,10 21,80Garantia Social 71,40 28,50E. Especial 65,30 34,60
WOMEN IN SPAIN2008
WOMEN WITH DISABILITIES2008
WOMEN WITH DISABILITIES1999
TasaMujeres con discapacidad 1999 51,9Mujeres con discapacidad 2008 34,0Mujeres en España 2008 24,4
0
60
6,20
52%
34.0
24.4
source: Based on the survey on Disabilities and impairments, 1999; the Disability, independence and Dependency situations survey (DiDss), 2008 and the economically active Population survey of 2008 (average for the four quarters) for the general population. the data for women with disabilities in 2008 is estimated.
the participation of women in housework follows a broad typology, which ranges from complete dedication to domestic
reLa
tio
n t
o e
Co
no
MiC
aC
tiV
ity
chores to doing none, with various positions in between. We will take as the basis for a synthesis of these different situations, the qualitative study carried out by the Colectivo ioé and CiMoP already mentioned (pp. 291-302):
• One sector of women ‘housewives’ without employment outside the home – the most numerous sector among women with disabilities – is actually quite diverse internally. at one end are women that hold traditional views, assigning the private space of the home to women and the outside public and work spheres to men. these women identify with the role of providers of care to other members of the family and feel relatively satisfied with this role. However, another sector of women ‘housewives’ (above all younger women and with higher levels of job skills and qualifications) experience housework as an obligation forced on them by circumstances and by the difficulty of integrating into the paid labour market. evidently, for these women, work in the home is a form of exclusion, as they are unable to achieve what they want outside of the home.
• At the opposite extreme, a minority of women with disabilities have managed to develop professional careers in the competitive labour market to the point that their careers are essentially incompatible with housework, which is assigned to other persons (normally, women domestic workers). this situation involves important costs and sacrifices for the woman, above all if she cannot overcome the aggressive-competitive model that characterises social relations in the labour market.
• Women that carry out both types of activities in successive phases are situated in an intermediate position: before having
children working outside the home and after having children, staying at home and raising the children, to finally return to paid employment in the ‘empty nest’ stage. this path involves certain problems regarding satisfactory social inclusion: first, the interruption of a professional career to raise children is a form of discrimination, above all in the case of skilled work in the primary sector; secondly, women’s expectations regarding reinsertion in the labour market when older often collide with the barriers they face in an increasingly competitive and polarised labour market.
• In another intermediate position are women that try to balance work and family responsibilities throughout their adult lives. this is perhaps the most common trend among mothers today – with or without disabilities – who want to work outside the home but cannot or do not want to give up their role as housewives. these are women who work the so-called ‘double shift’, leading, over time, to situations of stress and physical exhaustion (trying to be ‘supermoms’), accentuated in cases of disability, which involve added limitations.
soC
iaL
reLa
tio
nsH
iPs,
ass
oC
iati
on
s a
nD
Lei
sUre
aC
tiV
itie
s
Vii. soCiaL reLationsHiPs, assoCiations anD LeisUre aCtiVities
this chapter deals with a set of issues having to do with the relationships formed by persons with disabilities, both within their own families and the rest of society. in particular, we will look at friendships, social networks and associations, hobbies and free time. We will also address the problem of discrimination, examining the reasons behind it and the circumstances in which it occurs.
7.1. MarItal StatuS anD tyPe of houSeholD
one sign of young people’s emancipation upon reaching adulthood is leaving the parental home to form a new home; this is traditionally associated with marriage and a change in civil status from single to married. The definition of spouse/partner in the DiDss-2008 includes ‘both the legal spouse, by religious or civil marriage ceremony to the person with disabilities, and the non-legalised partner, provided the person with disabilities has lived with this person continuously (not occasionally or sporadically) in the same home’ (ine, 2010: 92).
In the final stages of life, civil status once again changes with the increase in cases of widowhood after the death of a spouse. However,
small sectors of the population remain single throughout life or their status changes, sometimes temporarily, to legally separated or divorced. Up to 25 years of age most of the general population is single and lives in the parental home (90%); afterwards, the majority live with a partner, normally with children, (around 75%), and finally, in the more advanced stages of life, the spouse/partner finds him or herself alone, becoming a widow/widower upon the death of the spouse (more common among women). these changes in civil status also take place among people with disabilities, but with some distinctive features: in general, there are more single and fewer married persons with disabilities up to 65 years of age, and there are more widows from this age on.
graph 7.1 compares the proportion of persons with disabilities and without disabilities that are married by different age groups. Persons without disabilities between 21 and 45 years of age are much more likely to be married than persons with disabilities of the same age group, this indicates a much lower emancipation rate from the parental home for those with disabilities: between 21 and 25 years of age the percentage of persons without disabilities that are married is more than double that of the percentage with disabilities; it is 51% higher between 26 and 35 years of age, and

soC
iaL
reLa
tio
nsH
iPs,
ass
oC
iati
on
s a
nD
Lei
sUre
aC
tiV
itie
s
47% higher between 36 and 45 years of age. In the population over 45 years of age the differences are not as great; this is due to the continual incorporation of persons that are already married into the population with disabilities. the percentage that are married for the population between 46 and 55 years of age is only 22% higher for those without disabilities in comparison for those with disabilities, for the population between 56 and 64 y ears of age this difference is even less, 14%. Finally, in the group over 65 years of age, the proportion of persons with disabilities increases with advancing age, leading to a much higher rate of widowhood (44%) in this population than among the population of the same age without disabilities (26%).
GraPh 7.1: Proportion of married persons by age in the population over 20 years of age with and without disabilities (in percentages)
0
25
50
75
100 Sin discapacidad
Con discapacidad
65 y más56-6446-5536-4526-3521-25 años
MARRIED PERSONS (%)
AGE GROUPS
C. Públicos C. PrivadosE. Infantil 81.60 18.30E. Primaria 83.70 16.20ESO 80.70 19.20Bachillerato 83.60 16.30Ciclos Formativos 78.10 21.80Garantia Social 71.40 28.50E. Especial 65.30 34.60
With disabilities Without disabilities
65 AND OVER56-6446-5536-4526-3521-25
Con discapacidad Sin discapacidad21-25 años 3.5 7.226-35 27.8 41.836-45 48.1 70.446-55 65.0 79.156-64 69.8 79.665 y más 47.2 64.1
0
25
50
75
100
7.1
3.57.2
27.8
41.848.1
70.465.0
79.1
69.8
79.6
47.2
64.1
source: Based on the Disability, independence and Dependency situations survey, 2008 (DiDss).
Marital status varies considerably by sex among both the population with and without disabilities. Up to 50 years of age, the proportion of women that are married is higher than that of men, a situation that is reversed after 50. graph7.2 shows the proportion of men and women with disabilities that are married by different age groups. a much higher proportion of women are married than men up to 55 years of age, but with a difference that declines until this age, when the proportion begins to drop.
GraPh 7.2: Proportion of married women and men by age in the population with disabilities (in percentages)
0
25
50
75
100 Mujeres
Hombres
65 y más56-6446-5536-4526-3521-25 años
PERSONS WITH DISABILITIES (%)
AGE GROUPS
C. Públicos C. PrivadosE. Infantil 81,60 18,30E. Primaria 83,70 16,20ESO 80,70 19,20Bachillerato 83,60 16,30Ciclos Formativos 78,10 21,80Garantia Social 71,40 28,50E. Especial 65,30 34,60
Men Women
65 AND OVER56-6446-5536-4526-3521-25
Hombres Mujeres21-25 años 0,9 7,526-35 20,5 37,436-45 38,4 58,446-55 61,9 67,456-64 73,8 66,965 y más 71,0 34,9
0
25
50
75
100
0.97.5
20.5
37.4 38.4
58.461.9
67.473.8
66.971.0
34.9
source: Based on the Disability, independence and Dependency situations survey, 2008 (DiDss).
the decline in the percentage of women with disabilities that are married after 56 years of age is due to the increase in the number of separated/divorced women and, above all, the number of widows in this age group. Between 56 and 65, persons who are

soC
iaL
reLa
tio
nsH
iPs,
ass
oC
iati
on
s a
nD
Lei
sUre
aC
tiV
itie
s
separated or divorced (9.5%) or widowed (13.9%) account for almost a quarter of the female population, but only one out of ten men in the same age group (7.2% separated/divorced and 3.6% widowed). This difference is accentuated after 65, not by the rate of separations/divorces (which decrease and balance out between the sexes, 1.7%), but by the rate of widowhood, which reaches 55.9% among women but only 20.1% among men with disabilities. there are many explanations to interpret the different trends between the sexes, including: women getting married at younger ages to older men, who die before them (as a result of being older and the higher male mortality rate),1 resulting in the increase in widows; and the greater propensity of men to marry a second or third time, which would explain the higher rate of separations/divorces between 36 and 65 years of age.
a greater proportion of persons with disabilities are single at all stages of life, although the percentage decreases with age as a side effect of the incorporation of married persons with acquired disability. the proportion of persons with disabilities between 26 and 35 years of age that are unmarried is 69.5% (55.3% for those without disabilities); between 36 and 45, 42.4% (21.9% for those without disabilities); between 46 and 55, 20% (10.5% for those without disabilities); between 56 and 64, 12.1% (7.5% for those without disabilities), and for those 65 and over, 7.4% (7.2% for those without disabilities).
Being single is much more common among men than among women before 65 years of age, corresponding to the trends of married people in each age group. in particular, the proportion of single men between 35 and 45 stands out, reaching 54.4%;
1 Life expectancy of women in spain in 2008 was 84.3 years; 6.1 years greater than for men (78.2 years).
this seems to be a clear sign of the problems men have in emancipating themselves (the proportion of single women in this age group is 29.4%). One explanation for this difference is the higher incidence of men under 65 who have disabilities related to difficulties in maintaining personal relationships (intimate relationships, relating to strangers and forming a home or maintaining family relationships); 1.1% of men or around 175,000 individuals, compared to 0.7% of women or 105,000 individuals. in addition, communication disabilities, which affect a quarter of a million persons between 16 and 64, are much higher among men (1%) than women (0.6%).
The types of households/homes in which persons with disabilities live do not vary much with respect to the general population:
• Half live with a partner, either ‘with children’ (25.6%) or ‘without children’ (25%); these percentages are very close to the overall averages in spain.
• 16% live in single person households (18% among the general population); this situation is more common among women with disabilities (20%) than men (11%). These figures do not differ much from overall national averages.
• The greatest difference occurs in the number of single parent households, with either a mother or father with a child or children; persons with disabilities are five times as likely to be the head of a single parent household as the general population, 10.2% vs. 2%. More women with disabilities live in this type of household (11.9%) than men (7.7%). To explain this difference, we have to take into account the greater number of women who remain

soC
iaL
reLa
tio
nsH
iPs,
ass
oC
iati
on
s a
nD
Lei
sUre
aC
tiV
itie
s
separated, divorced or widowed, as well as the tendency to have custody of the children in the event of separation or divorce.
• Finally, there is the category “other type of household” which accounts for 23% of those with disabilities and 31% of the general population (see figure 7.3).
GraPh 7.3: Household type of men and women with disabilities and in the general population of spain (in percentages)
0 25% 50% 75% 100%
0 10 20 30 40 50 60 70 80 90 100
Otro tipo
H. monoparental
Hogar unipersonal
Par. sin hijos
Pareja con hijos
Mujeres con discapacidad
Hombres con discapacidad
Personas con discapacidad
Población general
Couple with children Single person householdSingle-parent household
Couple without childrenOther
Mujeres con discapacidad Hombres con discapacidad Personas con discapacidad Población generalPareja con hijos 20,8 32,8 25,6 26,3Par. sin hijos 21,6 30,0 25,0 22,3Hogar unipersonal 19,6 10,6 16,0 18,0H. monoparental 11,9 7,7 10,2 2,0Otro tipo 26,0 18,9 23,1 31,3
WOMEN WITH DISABILITIES
MEN WITH DISABILITIES
PERSONS WITH DISABILITIES
GENERAL POPULATION
7,3
source: Based on the Disability, independence and Dependency situations survey, 2008 (DiDss) for persons with disabilities and the Household Budget survey 2008 for the general population.
There are also some significant variations in types of household in terms of the types of disability. Persons with vision and hearing disabilities are more likely to live in single person households than those from other groups; persons with disabilities related to learning and application of knowledge and development of tasks, communication and interpersonal interactions and relationships are more likely to live in single parent households.
the household type of ‘couples with or without children’ is found evenly distributed by type of disability.
7.2. faMIly relatIonShIPS
social relationships revolve primarily around the family for the majority of people. For those who live in a couple, the most important relationship is with their partner; situation of half of the people with disabilities over 20 years of age. But the family includes many other members; among them parents and parents-in-law, siblings, children, sons and daughters in-law, grandchildren and grandparents, cousins, and so on, with whom relationships of varying intensity are maintained.
According to the 2008 survey, 99.9% of persons with disabilities said that they had relatives. in other words, less than 3,000 people – 0.1% of the total, two-thirds of them over 75 – said they had no family. another 10,000 persons with disabilities (0.26% of the total) – two thirds of them women – indicated that the only bond of kinship that they had left was their spouse. in all of these cases, the presence of friends is especially important: half of those who had no relatives and two-thirds of those who only had their partner said that they had friends.
in this section we will look at some of the information collected on the family relationships of the population with disabilities. First, we will look at the different family members they have relationships with, where they live and how often they see them (face-to-face contact, telephone contact and contact by mail). in
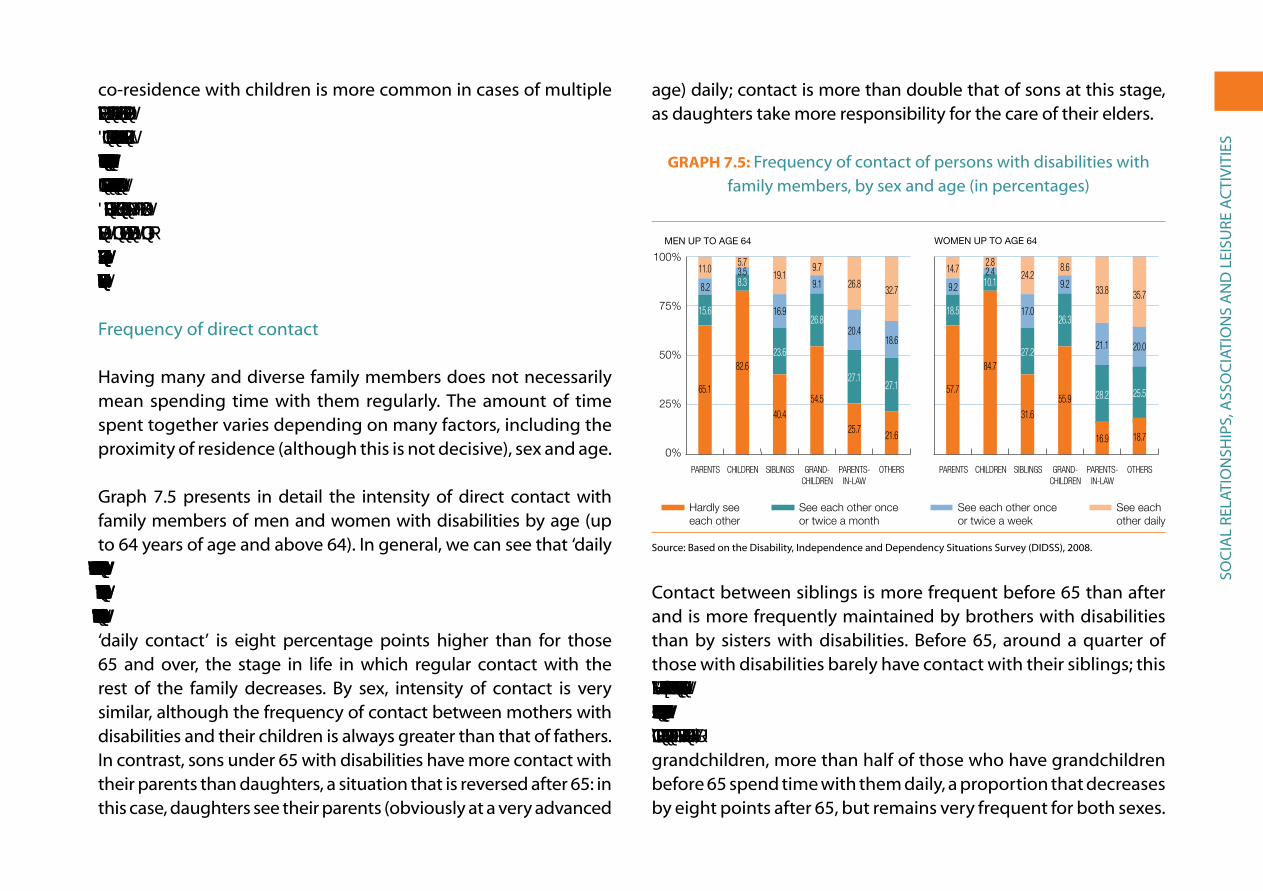
soC
iaL
reLa
tio
nsH
iPs,
ass
oC
iati
on
s a
nD
Lei
sUre
aC
tiV
itie
s
co-residence with children is more common in cases of multiple impairments (47%), language, speech and voice impairments (45%) and visceral impairments (also 45%); co-residence with parents in cases of mental impairment (29%), language, speech and voice impairments (17%) and nervous system impairment (15%); co-residence with grandchildren in cases of multiple impairments (19%) and mental impairment (14%), and co-residence with siblings in cases of mental impairment (21%) and language, speech and voice impairments (15%).
Frequency of direct contact
Having many and diverse family members does not necessarily mean spending time with them regularly. the amount of time spent together varies depending on many factors, including the proximity of residence (although this is not decisive), sex and age.
graph 7.5 presents in detail the intensity of direct contact with family members of men and women with disabilities by age (up to 64 years of age and above 64). in general, we can see that ‘daily contact’ is the most common (overall average 42%), followed by ‘hardly see each other’ (23%), ‘once or twice a week’ (21%), and ‘once or twice a month’ (13%). By age group, for those under 65 ‘daily contact’ is eight percentage points higher than for those 65 and over, the stage in life in which regular contact with the rest of the family decreases. By sex, intensity of contact is very similar, although the frequency of contact between mothers with disabilities and their children is always greater than that of fathers. in contrast, sons under 65 with disabilities have more contact with their parents than daughters, a situation that is reversed after 65: in this case, daughters see their parents (obviously at a very advanced
age) daily; contact is more than double that of sons at this stage, as daughters take more responsibility for the care of their elders.
GraPh 7.5: Frequency of contact of persons with disabilities with family members, by sex and age (in percentages)
MEN UP TO AGE 64
Hardly see each other
See each other once or twice a month
See each other once or twice a week
See each other daily
0%
25%
50%
75%
100%
OTHERSPARENTS-IN-LAW
GRAND-CHILDREN
SIBLINGSCHILDRENPARENTS
7.5
WOMEN UP TO AGE 64
HOMBRES 65 Y MÁS AÑOS
0
25
50
75
100
OTROSSUEGROSNIETOSHERMANOSHIJOSPADRES
MUJERES 65 Y MÁS AÑOS
OTROSSUEGROSNIETOSHERMANOSHIJOSPADRES
7.5
32.7
18.6
27.1
21.6
26.8
20.4
27.1
25.7
9.7
9.1
26.8
54.5
19.1
16.9
23.6
40.4
5.73.58.3
82.6
11.0
8.2
15.6
65.1
35.7
20.0
25.5
18.7
33.8
21.1
28.2
16.9
8.6
9.2
26.3
55.9
24.2
17.0
27.2
31.6
2.82.410.1
84.7
14.7
9.2
18.5
57.7
OTHERSPARENTS-IN-LAW
GRAND-CHILDREN
SIBLINGSCHILDRENPARENTS
source: Based on the Disability, independence and Dependency situations survey (DiDss), 2008.
Contact between siblings is more frequent before 65 than after and is more frequently maintained by brothers with disabilities than by sisters with disabilities. Before 65, around a quarter of those with disabilities barely have contact with their siblings; this rises to 43% for both sexes from 65 on. Contact with parents-in-law is more frequent among men with disabilities (26% have daily contact) than women (17%) for those under 65. As for grandchildren, more than half of those who have grandchildren before 65 spend time with them daily, a proportion that decreases by eight points after 65, but remains very frequent for both sexes.

soC
iaL
reLa
tio
nsH
iPs,
ass
oC
iati
on
s a
nD
Lei
sUre
aC
tiV
itie
s
By type of disability, contact with close relatives (parents, siblings and children) is more frequent among those who have disabilities related to ‘interpersonal interactions and relationships’, ‘communication’, and ‘learning and application of knowledge and development of tasks’. in such cases – precisely those in which respondents have disabilities affecting relationships – their closest relatives maintain more frequent contact with them (between 10 and 20 percentage points higher than in cases of persons with the remaining types of disabilities: vision, hearing, mobility, self care and domestic life). in contrast, contact with grandchildren is very similar, and always frequent, in all cases. it is similar in terms of relationships with parents-in-law, but in this case with an overall frequency much lower than with other relatives (the only exceptions are for those with vision disabilities, whose daily contact with parents-in-law is much higher than the average, and those with disabilities related to ‘interpersonal interactions and relationships’ with daily contact well below the average).
Contact by telephone and by mail
among persons with disabilities, contact by telephone and by mail with different relatives is less frequent than face-to-face contact but reveals the same patterns of distribution: the highest levels of contact with children (54%, ‘every day or almost every days’), less with parents (39%), followed by contact with grandchildren (28%), siblings (17%), in-laws (15%) and other relatives (9%).
the main difference with face-to-face contact is that the frequency of contact by telephone and by mail of women with disabilities is significantly higher than that of men, except in relation to parents-in-law; in this case the frequency of contact is the same
for both sexes (graph 7.6). the difference by sex occurs in both age groups, which confirms that women are the main source of family contact, solidarity and mutual support.
GraPh 7.6: Frequency of contact by telephone and letter between persons with disabilities and their relatives (in percentages)
0% 25% 50% 75% 100%
OTHER RELATIVES
GRANDCHILDREN
CHILDREN
SIBLINGS
PARENTS-IN-LAW
PARENTS
0% 25% 50% 75% 100%
Daily 1-2 times per week 1-2 times per month Less frequent
OTHER RELATIVES
GRANDCHILDREN
CHILDREN
SIBLINGS
PARENTS-IN-LAW
PARENTS
MEN WITH DISABILITIES
WOMEN WITH DISABILITIES
RELATIVES WITH WHOM THEY HAVE CONTACT BY TELEPHONE/MAIL
RELATIVES WITH WHOM THEY HAVE CONTACT BY TELEPHONE/MAIL
source: Based on the Disability, independence and Dependency situations survey, 2008 (DiDss).
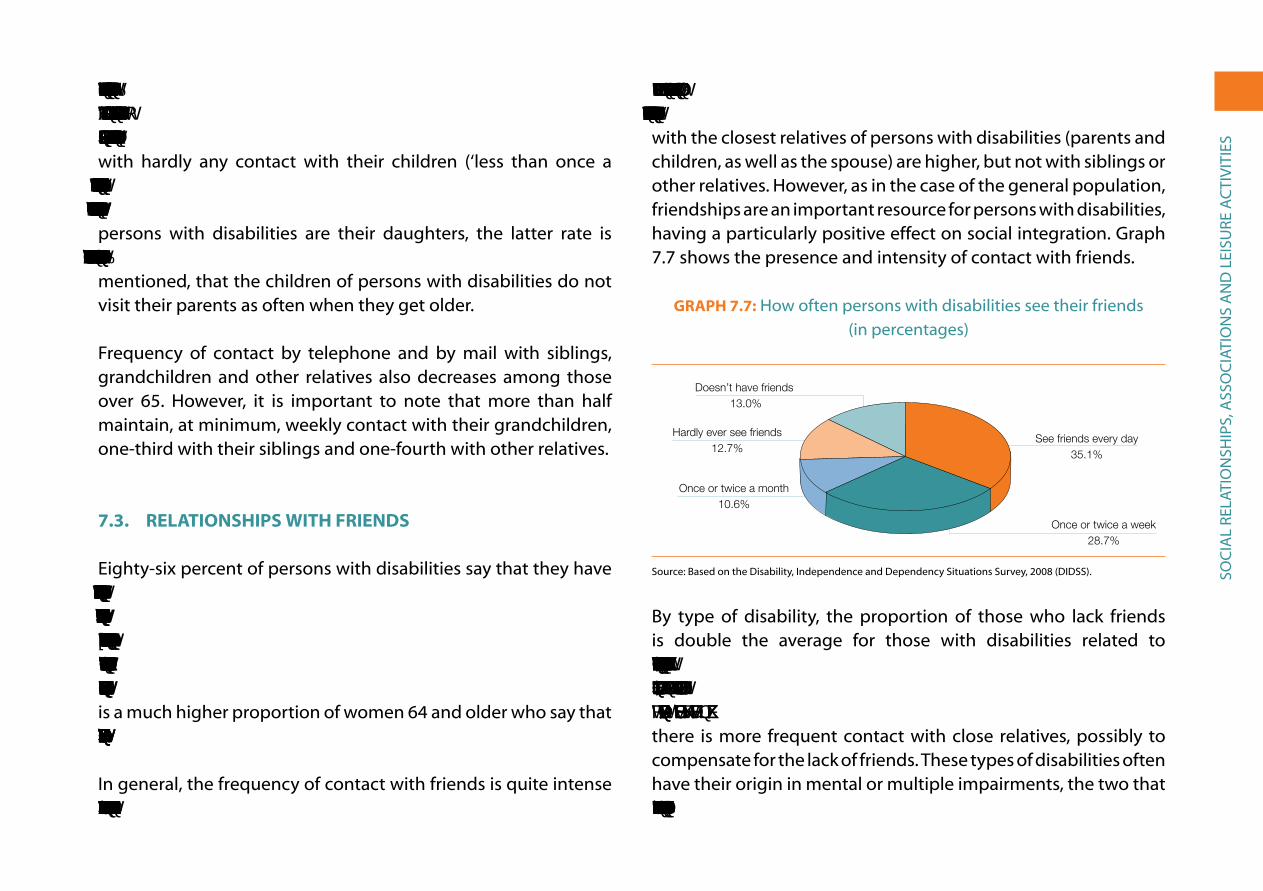
soC
iaL
reLa
tio
nsH
iPs,
ass
oC
iati
on
s a
nD
Lei
sUre
aC
tiV
itie
s
Contact by telephone and mail decreases significantly after 65. Thus, daily contact with children decreases from 60% to 51% (among women, 65% to 53%), while the proportion of persons with hardly any contact with their children (‘less than once a month’) increases from 21% to 23% (among women, from 17% to 23%). If we consider that the principal providers of care for elderly persons with disabilities are their daughters, the latter rate is especially significant because it coincides with the data previously mentioned, that the children of persons with disabilities do not visit their parents as often when they get older.
Frequency of contact by telephone and by mail with siblings, grandchildren and other relatives also decreases among those over 65. However, it is important to note that more than half maintain, at minimum, weekly contact with their grandchildren, one-third with their siblings and one-fourth with other relatives.
7.3. relatIonShIPS WIth frIenDS
eighty-six percent of persons with disabilities say that they have friends, almost always living in the same municipality (65% in the same neighbourhood or town and 12% in the same building). By sex, a higher proportion of women lack friends (15%) than men (11%) and, by age, the proportion of persons over 65 years who lack friends is higher (15%) than for those under 65 (10%). There is a much higher proportion of women 64 and older who say that they lack friends (17%) than men in this age group (11%).
in general, the frequency of contact with friends is quite intense throughout life. There is daily contact in 35% of the cases, once
or twice a week in 29%, once or twice a month in 11%, and at intervals of over a month in 13% of the cases. The rates of contact with the closest relatives of persons with disabilities (parents and children, as well as the spouse) are higher, but not with siblings or other relatives. However, as in the case of the general population, friendships are an important resource for persons with disabilities, having a particularly positive effect on social integration. graph 7.7 shows the presence and intensity of contact with friends.
GraPh 7.7: How often persons with disabilities see their friends(in percentages)
Hardly ever see friends12.7%
Doesn’t have friends 13.0%
Once or twice a month10.6%
See friends every day35.1%
Once or twice a week28.7%
No tiene amigos
Con menor frecuencia
Una o dos veces al mes
Una o dos veces por semana
Todos los días o casi todos los días
%
%Todos los días o casi todos los días 35.1Una o dos veces por semana 28.7Una o dos veces al mes 10.6Con menor frecuencia 12.7No tiene amigos 13.0
7.7
source: Based on the Disability, independence and Dependency situations survey, 2008 (DiDss).
By type of disability, the proportion of those who lack friends is double the average for those with disabilities related to ‘interactions and interpersonal relationships’ (24%), those with ‘learning’ disabilities (24%) and those with disabilities related to “communication” (23%), precisely those cases in which there is more frequent contact with close relatives, possibly to compensate for the lack of friends. these types of disabilities often have their origin in mental or multiple impairments, the two that are most closely linked to the absence of friends (23% and 19%

soC
iaL
reLa
tio
nsH
iPs,
ass
oC
iati
on
s a
nD
Lei
sUre
aC
tiV
itie
s
respectively). in contrast, persons suffering from osteoarticular, hearing and visual impairments have more friends and maintain regular contact with them (three-quarters seeing their friends daily or at least once a week).
social relations are slightly more intense in reverse relation to the size of municipality: in the smallest municipalities, with less than 10,000 inhabitants, 90.1% of persons with disabilities have a relative or friend they see every day; 88.9% in towns with populations between 10,000 and 50,000; 86.9% in those that have between 50,000 and 100,000 and finally dropping to 84.1% in provincial capitals and municipalities with over 100,000 inhabitants.
sixteen percent of persons with disabilities have daily contact with friends by telephone, mail or email, with similar proportions among men and women; however, there are significant differences by age (21% before 65, 12% for those 65 and over). Just over one-third use these forms of communication at least once a month and almost half less often. it is a normal form of communication for elderly persons with disabilities (58% of men and 54% of women).
Finally, the 2008 survey sought to explore whether or not people with disabilities had had the opportunity to spend time with friends or make new friends in the previous year. twelve percent said they were not able to spend time with friends (4%) or that they had found it difficult to do so (8%). At the opposite extreme, almost two thirds (61% of men, 56% of women) said it was ‘very easy’ and one-third indicated that they had “few opportunities” (32% of women, 29% of men). By age group, the percentage
of those under 65 years of age that said that it was easy to find opportunities to spend time with others was around 15 points higher than for those 65 years of age and over.
When asked if they had had opportunities to make new friends, most said no, either because they could not (6%) or because they had ‘little’ or ‘no’ opportunity to do so (40% and 30%, respectively). Only one-quarter, more men than women (28% versus 20%) said that it was easy to find opportunities to make new friends. More men than women also said that in the previous year they had had many opportunities to communicate with people they did not know (33% and 28%, respectively), although the majority said they were not able to develop new relationships (5%) or that they had ‘no’(20%) or ‘few’(47%) opportunities to do so. In these cases, it is the elderly and above all, women who have the most difficulties.
regarding types of disabilities, those with sensory disabilities (hearing, vision) and mobility disabilities find it easier to spend time with friends and to make new friends, while those who suffer disabilities related to language comprehension, learning and inter-personal relationships find it significantly more difficult. in an intermediate position are persons with the two remaining types of disabilities (self-care and home life).
7.4. PartICIPatIon In aSSoCIatIonS
Participation in disability sector associations has been an important means of expression, organisation and involvement for persons with disabilities in spain and around the world. Within the
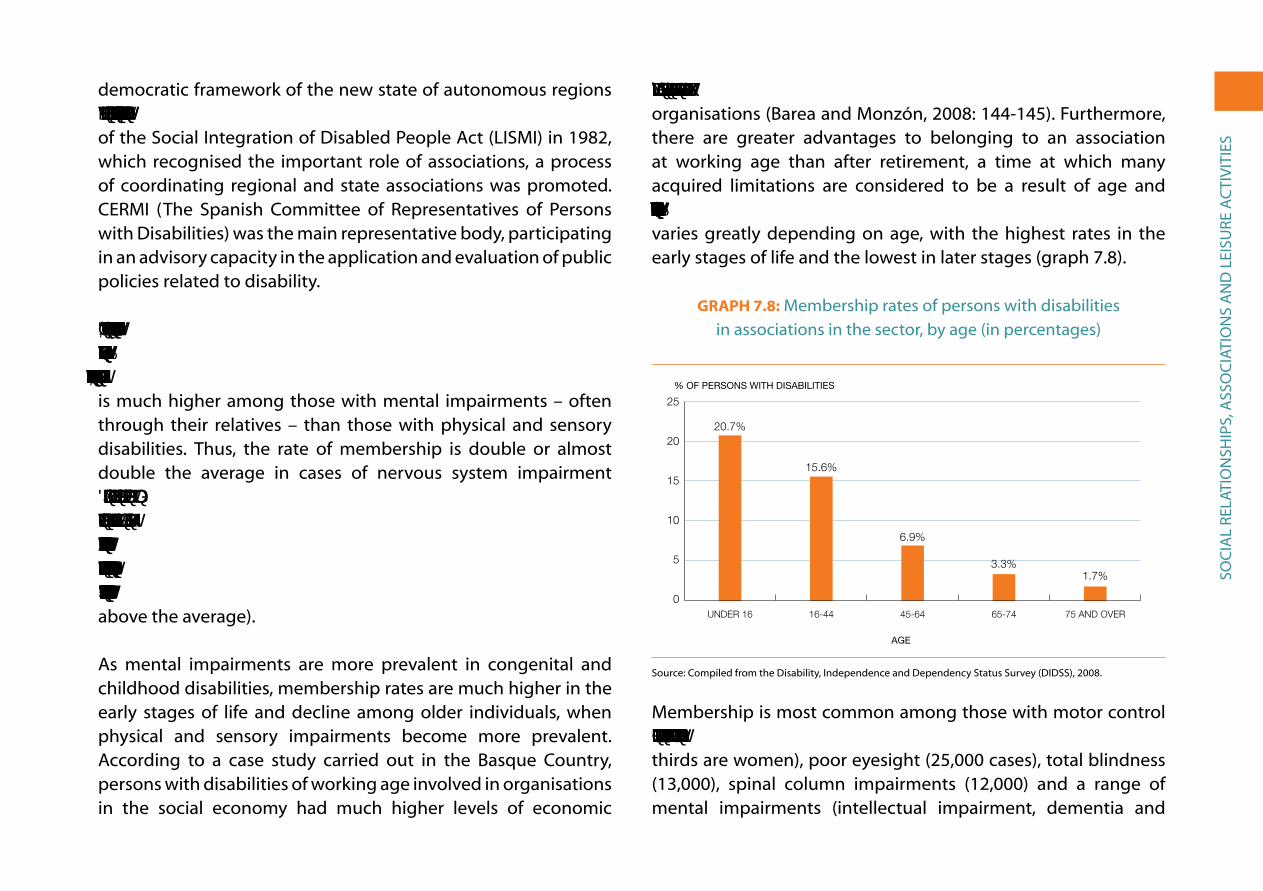
soC
iaL
reLa
tio
nsH
iPs,
ass
oC
iati
on
s a
nD
Lei
sUre
aC
tiV
itie
s
democratic framework of the new state of autonomous regions (as defined in the 1978 Constitution) and after the enactment of the social integration of Disabled People act (LisMi) in 1982, which recognised the important role of associations, a process of coordinating regional and state associations was promoted. CerMi (the spanish Committee of representatives of Persons with Disabilities) was the main representative body, participating in an advisory capacity in the application and evaluation of public policies related to disability.
In 2008, only one out of twenty persons with disabilities (5.6%, almost 200,000 persons) was affiliated with an association in the sector (6.7% of men and 4.9% of women). In general, membership is much higher among those with mental impairments – often through their relatives – than those with physical and sensory disabilities. thus, the rate of membership is double or almost double the average in cases of nervous system impairment (12.2%), language, speech and voice impairment (9.1%) and mental impairment (8.9%); while it is only 2.6% among those with osteoarticular impairment, 3.7% among those with visceral impairment, 3.3% among those with hearing impairments, and 6.1% among those with visual impairments (in this case, slightly above the average).
as mental impairments are more prevalent in congenital and childhood disabilities, membership rates are much higher in the early stages of life and decline among older individuals, when physical and sensory impairments become more prevalent. according to a case study carried out in the Basque Country, persons with disabilities of working age involved in organisations in the social economy had much higher levels of economic
activity and employment than those not affiliated with such organisations (Barea and Monzón, 2008: 144-145). Furthermore, there are greater advantages to belonging to an association at working age than after retirement, a time at which many acquired limitations are considered to be a result of age and almost inevitable. As a consequence, affiliation with associations varies greatly depending on age, with the highest rates in the early stages of life and the lowest in later stages (graph 7.8).
GraPh 7.8: Membership rates of persons with disabilities in associations in the sector, by age (in percentages)
0
5
10
15
20
25 Tasa
75 y más65-7445-6416-44Menos de 16
% OF PERSONS WITH DISABILITIES
C. Públicos C. PrivadosE. Infantil 81.60 18.30E. Primaria 83.70 16.20ESO 80.70 19.20Bachillerato 83.60 16.30Ciclos Formativos 78.10 21.80Garantia Social 71.40 28.50E. Especial 65.30 34.60
75 AND OVER65-7445-6416-44UNDER 16
TasaMenos de 16 20.716-44 15.645-64 6.965-74 3.375 y más 1.7
0
5
10
15
20
25
AGE
20.7%
15.6%
6.9%
3.3%1.7%
source: Compiled from the Disability, independence and Dependency status survey (DiDss), 2008.
Membership is most common among those with motor control and/or muscular tone disorders (34,000 cases, more than two thirds are women), poor eyesight (25,000 cases), total blindness (13,000), spinal column impairments (12,000) and a range of mental impairments (intellectual impairment, dementia and

soC
iaL
reLa
tio
nsH
iPs,
ass
oC
iati
on
s a
nD
Lei
sUre
aC
tiV
itie
s
mental illness), which together account for 50,000 affiliated persons (majority men). Based on the 2008 survey, the associations with the highest number of members are:
Men WoMen totaLonCe (spanish organisation of the blind) 23,485 22,449 45,934
FeDer (rare diseases) 5,435 10,689 16,124
CoCeMFe (physical disabilities) 5,321 8,985 14,306
FeaPs (persons with cognitive disabilities) 8,639 4,918 13,557
red Cross 4,440 6,051 10,491
asPaCe (aid for persons with cerebral palsy) 3,901 3,271 7,172
FeLeM (multiple sclerosis) 1,707 4,472 6,179
Cnse (organisation of the deaf ) 2,658 2,083 4,741
Fundación alzheimer españa 1,131 3,440 4,571
asPayM (spinal cord injuries and severe physical disabilities) 2,802 1,707 4,509
Down syndrome 1,727 2,479 4,206
aeCC (cancer) 547 3,068 3,615
FeaFes (mental illness) 2,068 985 3,053
FiaPas (families of the deaf ) 1,153 1,313 2,466
aLCer (kidney disease) 1,540 867 2,407
Federación española de Parkinson 765 713 1,478
FeDaCe (brain damage) 587 724 1,311
Finally, if we compare rates of membership in 2008 with those in 1999, we find that there was a significant increase. The percentage of working age persons who participated in disability sector organisations rose from 7.5% to 10% (from 8.5% to 10.9% for men and from 6.5% to 9.2% for women). However, graph 7.9 shows that
the vast majority of persons with disabilities remain unaffiliated with organisations in the sector (which does not mean that they do not take advantage of their services).
GraPh 7.9: rates of membership in associations in the sector of persons with disabilities (1999 and 2008, in percentages)
0
25
50
75
100 A2008
A1999
Sin a�liaciónA�liados/as
PERCENTAGE OF WORKING AGE PERSONS WITH DISABILITIES (16-64)
1999 2008
NOT AFFILIATEDAFFILIATED
1999 2008A�liados/as 7,5 10Sin a�liación 92,5 90
0
25
50
100
75
source: Based on the survey on Disabilities and impairments, 1999 and the Disability, independence and Dependency situations survey (DiDss) 2008.
7.5. leISure anD free-tIMe aCtIVItIeS
the 2008 survey asked persons with disabilities what their main free-time activities were (with a maximum of three responses allowed). they were also asked about the types of activity they would like to do in their spare time but, because of their disability, were unable to. the main responses are shown in graph 7.10; these responses are also compared with the results obtained for
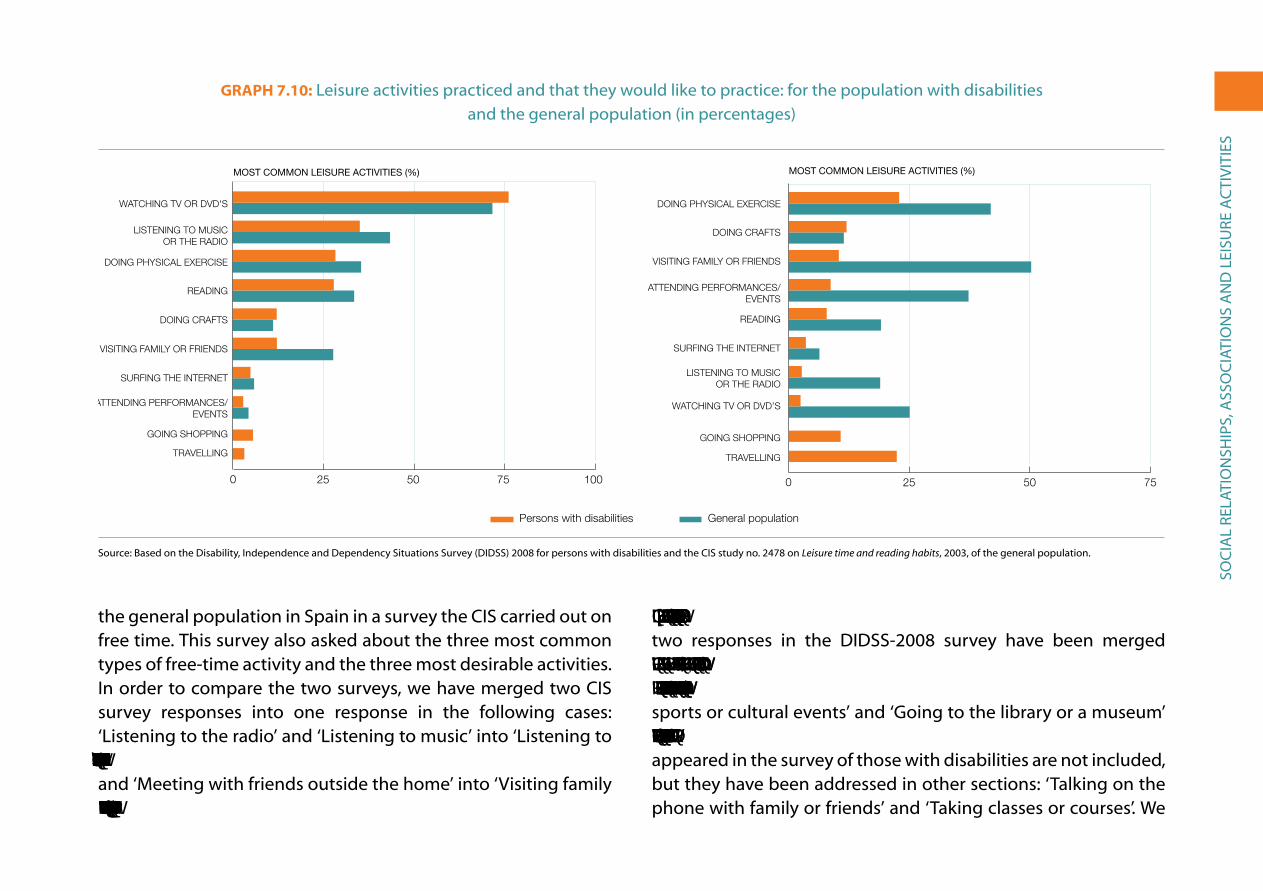
soC
iaL
reLa
tio
nsH
iPs,
ass
oC
iati
on
s a
nD
Lei
sUre
aC
tiV
itie
s
the general population in spain in a survey the Cis carried out on free time. this survey also asked about the three most common types of free-time activity and the three most desirable activities. in order to compare the two surveys, we have merged two Cis survey responses into one response in the following cases: ‘Listening to the radio’ and ‘Listening to music’ into ‘Listening to the radio or music’; ‘Going out for a drink with my partner/family’ and ‘Meeting with friends outside the home’ into ‘Visiting family or friends’; and ‘Attending performances/events’ and ‘Going to
an exhibit’ into ‘Attending performances/events’. In addition, two responses in the DiDss-2008 survey have been merged into one in these cases: ‘Surfing the Internet’ and ‘Chatting or sending e-mails’ into ‘Surfing the Internet’; and ‘Attending sports or cultural events’ and ‘going to the library or a museum’ into ‘Attending performances/events’. Two activities that only appeared in the survey of those with disabilities are not included, but they have been addressed in other sections: ‘talking on the phone with family or friends’ and ‘taking classes or courses’. We
GraPh 7.10: Leisure activities practiced and that they would like to practice: for the population with disabilities and the general population (in percentages)
Visitar familia o amigos
Escuchar radio o música
0 25 50 75 100
Persons with disabilities General population
MOST COMMON LEISURE ACTIVITIES (%)
0 25 50 75
MOST COMMON LEISURE ACTIVITIES (%)
TRAVELLING
GOING SHOPPING
ATTENDING PERFORMANCES/EVENTS
SURFING THE INTERNET
VISITING FAMILY OR FRIENDS
DOING CRAFTS
READING
DOING PHYSICAL EXERCISE
LISTENING TO MUSICOR THE RADIO
WATCHING TV OR DVD'S
TRAVELLING
GOING SHOPPING
WATCHING TV OR DVD’S
LISTENING TO MUSICOR THE RADIO
SURFING THE INTERNET
READING
ATTENDING PERFORMANCES/EVENTS
VISITING FAMILY OR FRIENDS
DOING CRAFTS
DOING PHYSICAL EXERCISE
source: Based on the Disability, independence and Dependency situations survey (DiDss) 2008 for persons with disabilities and the Cis study no. 2478 on Leisure time and reading habits, 2003, of the general population.
soC
iaL
reLa
tio
nsH
iPs,
ass
oC
iati
on
s a
nD
Lei
sUre
aC
tiV
itie
s
do include ‘shopping’ and ‘travel’ even though these activities do not appear in the results of the Cis survey; therefore, they are shown at the bottom of the graph.
Persons with disabilities spend a lot of time in two leisure activities: watching television and listening to the radio, and far less in the remaining activities included in the surveys. What is especially striking is that persons with disabilities spent less than half the time visiting family or friends as the general population.
regarding leisure activities that they would most like to do, what accounts for the lower percentages among persons with disabilities (except for ‘doing crafts’) may be that the question was limited to activities they are unable to do ‘because of disability’. among the activities they would most like to do, two stand out: ‘Doing physical exercise’ and ‘travelling’. ‘Doing crafts’, ‘shopping’ and ‘Visiting family and friends’ received fewer responses. in contrast, the activities the general population would like to do more of include: visiting family and friends, exercising and attending performances/events.
in the group with disabilities, differences in activities by sex not are very great, but men are more likely to listen to the radio or music (38%), exercise (36%), surf the internet (6%) and attend performances/events (5%). Women are more likely to watch television (77%), read (28%), do crafts (14%) and shop (6%). The remaining activities are done with the same frequency by both sexes.
By age, those aged 65 and over watch more television (80%) and do more physical exercise (28%), while those under 65 listen to the radio or music (40%), read more (33%), visit family and friends
more often (14%), and, above all, surf the internet (10% versus 0.7% of the elderly).
By type of disability, the differences are not great. those who have hearing disabilities listen to the radio or music the least, but they read, travel, exercise and do crafts the most. People with vision impairments stand out for visiting family and friends and going shopping. those with disabilities related to mobility, self-care and home life spend more time watching television and less time doing physical exercise.
Finally, there is significant similarity regarding the activities that persons with disabilities would most like to do (but that cannot be done because of disability) by type of impairment, although, of course, there is greater emphasis on activities related to the specific impairment: those who have vision impairments are more likely to want to watch television; persons who are deaf would like to be able to listen to the radio or music, and those affected by osteoarticular impairments would like to be able to do physical exercise.
7.6. DISCrIMInatIon anD the reSPonSe to It
eighty-eight per cent of persons with disabilities said they had not felt discriminated against in the twelve months prior to the survey. For those under 65 the proportion was ten points less (78%), with very similar percentages among both men and women. of the 420,000 people (12%) who said they felt discriminated against, two thirds said they experienced discrimination ‘sometimes’ (8%), and one-third, ‘many times’ (3%) or ‘constantly’ (1%). Only one in twenty persons over 64 felt they had been discriminated

soC
iaL
reLa
tio
nsH
iPs,
ass
oC
iati
on
s a
nD
Lei
sUre
aC
tiV
itie
s
against because of their disability, but almost one-fourth of those 64 and under felt that they had been; this is the group in which social exclusion is most concentrated (see graph 7.11).
GraPh 7.11: Persons with disabilities between the ages of 6 and 64 who have felt discriminated against in the previous 12 months
(in percentages)
14.8%
5.1%
2.3%
0
25 Constantemente
Muchas veces
Alguna veces
Tasa
Often Sometimes All the time
TasaAlguna veces 14.8Muchas veces 5.1Constantemente 2.3
0
25
source: Based on the Disability, independence and Dependency situations survey (DiDss)2008.
By type of disability, and for all age groups, the experience of discrimination among persons with disabilities related to interactions and interpersonal relationships (21%), learning and application of knowledge and development of tasks (18%) and communication (also 18%) is approximately double that of those with mobility (8%), hearing (8%), vision (10%), self-care (12%) and home life (12%) disabilities. As with other issues, problems of marginalisation and social exclusion occur more often among those with mental impairments (19%) or nervous system impairments (17%) and less often among those with sensory and osteoarticular impairments (less than 10% in both cases).
By household type, discrimination is experienced more often by those from households with children – whether two parent (19%) or single-parent households (17%) – and less often by those from households with spouses/partners living alone (8%), single-person households (9%) and other types of households (9%). This suggests
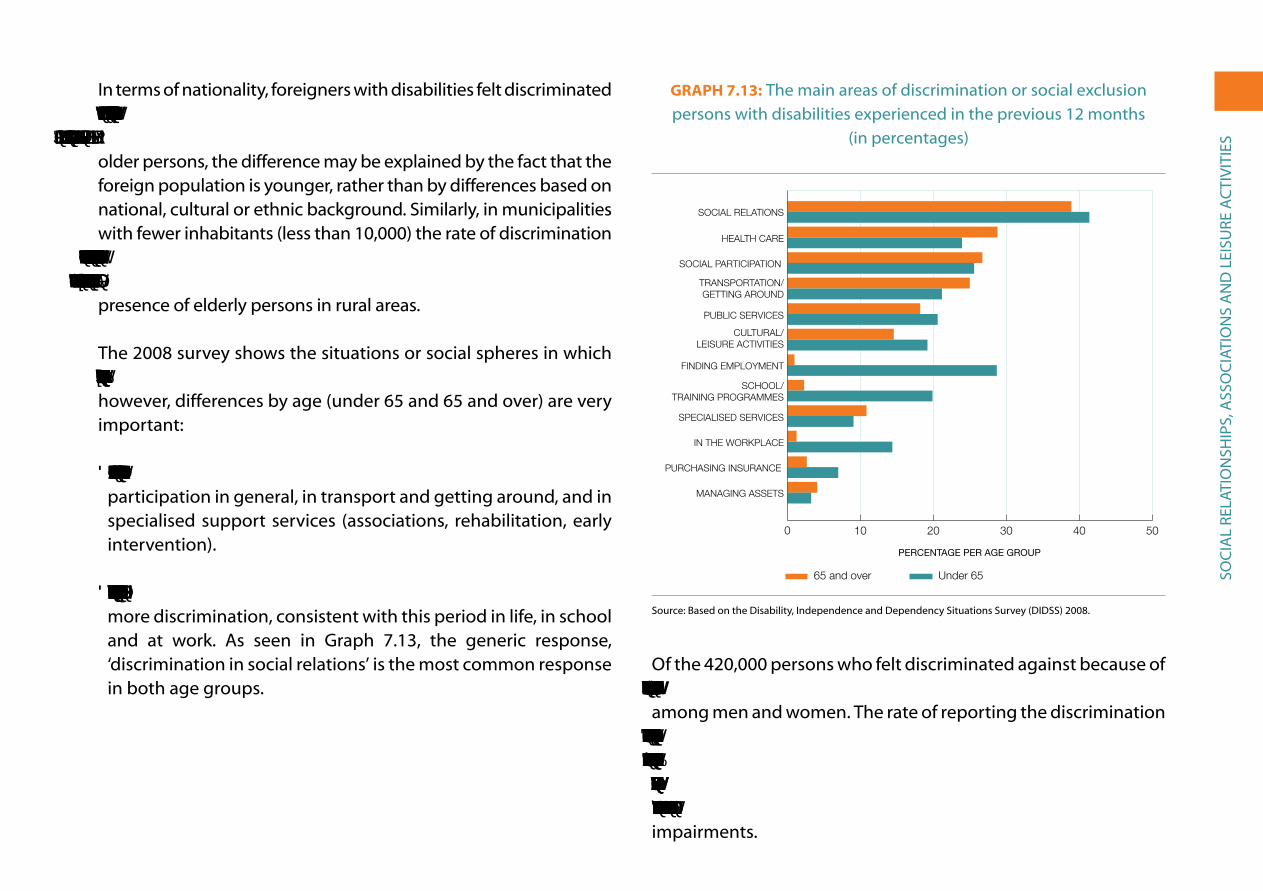
soC
iaL
reLa
tio
nsH
iPs,
ass
oC
iati
on
s a
nD
Lei
sUre
aC
tiV
itie
s
in terms of nationality, foreigners with disabilities felt discriminated against more often (18%) than the autochthonous population (12%). However, if we consider that discrimination decreases among older persons, the difference may be explained by the fact that the foreign population is younger, rather than by differences based on national, cultural or ethnic background. similarly, in municipalities with fewer inhabitants (less than 10,000) the rate of discrimination is three points lower (10%) than in larger municipalities (between 12% and 13%); this difference can also be explained by the greater presence of elderly persons in rural areas.
the 2008 survey shows the situations or social spheres in which discrimination occurs. Differences by sex are not very significant; however, differences by age (under 65 and 65 and over) are very important:
• Older persons suffer more discrimination in health care, social participation in general, in transport and getting around, and in specialised support services (associations, rehabilitation, early intervention).
• Children/youth and persons of working age (6-64) experience more discrimination, consistent with this period in life, in school and at work. as seen in graph 7.13, the generic response, ‘discrimination in social relations’ is the most common response in both age groups.
GraPh 7.13: the main areas of discrimination or social exclusion persons with disabilities experienced in the previous 12 months
(in percentages)
0 10 20 30 40 50
Menos de 65 años
65 y más años
Decidir sobre patrimonio
Contratar seguros
En el puesto de trabajo
Servicios especializados
En la escuela/formación
Para encontrar empleo
Activ. culturales, ocio
Administración pública
Transporte, desplazam.
En la particip. social
En la atención sanitaria
En las relac. sociales
65 and over Under 65
Menos de 65 años 65 y más añosDecidir sobre patrimonio 3,2 4,0Contratar seguros 6,9 2,6En el puesto de trabajo 14,3 0,6Servicios especializados 9,0 10,8En la escuela/formación 19,8 2,2Para encontrar empleo 28,6 0,9Activ. culturales, ocio 19,1 14,5Administración pública 20,5 18,1Transporte, desplazam. 21,1 24,9En la particip. social 25,5 26,6En la atención sanitaria 23,8 28,7En las relac. sociales 41,3 38,7
0
302010 40 50
MANAGING ASSETS
PURCHASING INSURANCE
IN THE WORKPLACE
SPECIALISED SERVICES
SCHOOL/TRAINING PROGRAMMES
FINDING EMPLOYMENT
CULTURAL/LEISURE ACTIVITIES
PUBLIC SERVICES
TRANSPORTATION/GETTING AROUND
SOCIAL PARTICIPATION
HEALTH CARE
SOCIAL RELATIONS
PERCENTAGE PER AGE GROUP
source: Based on the Disability, independence and Dependency situations survey (DiDss) 2008.
of the 420,000 persons who felt discriminated against because of their disability, only 32,000 (8%) reported it, in similar proportions among men and women. the rate of reporting the discrimination is 9% among those under 65, and is 5% among those 65 and over. There are no significant differences by type of impairment: from a high of 10% reporting discrimination among those with nervous system impairments to a low of 5% among those with hearing impairments.
soC
iaL
reLa
tio
nsH
iPs,
ass
oC
iati
on
s a
nD
Lei
sUre
aC
tiV
itie
s
according to the euro barometer on Discrimination for 2008, 1% of the Spanish population admitted to having personally suffered discrimination or harassment in the previous 12 months because of their disability, compared to 2% in the EU-27. This means that about 350,000 persons (9% of those with disabilities) experienced discriminatory treatment. On the other hand, 5% of the Spanish population and 7% of Europeans say they have witnessed discrimination against or harassment of persons with disabilities, which means that nearly six million spanish people have witnessed direct discrimination. However, it is positive to note that according to the euro barometer, the segregation rate of persons with disabilities in spain is lower on average than european rates (european Commission, 2008).
one form of indirect discrimination against persons with disabilities is difficult access to the public assistance needed for social inclusion. according to the Vi report of the Foessa Foundation (2008), difficulties experienced by persons with disabilities in gaining access to resources and support services to foster social inclusion are based on an objective situation of discrimination, which remains invisible to the larger community. For example, the report refers to a survey conducted in Barcelona which revealed that the benefits received due to disability only cover one quarter of the total extra costs incurred by persons with disabilities (Fundación Foessa, 2008).
all studies agree that persons with mental disabilities (especially if they have several) suffer the most from discrimination or social segregation. according to an epidemiological study of the World Mental Health Consortium, 13.5% of individuals with mental impairments feel stigmatised because of their illness; the
percentage is double among those who have more than one mental impairment (such as anxiety and depression). this is the first international study that has evaluated the stigma associated with mental impairment based on the perceptions of the individuals who suffer from these disorders. the questionnaire was administered to 80,000 adults with mental impairments (not including patients with schizophrenia and other psychotic disorders) or certain chronic mental disabilities, representative of the general population from 27 countries, including spain (association of Perceived stigma and Mood and anxiety Disorders, 2008: 305-314). the results of this survey for spain reveal that 44% of persons suffering from an acute or chronic mental illness feel discriminated against in the workplace; 43% feel excluded among their friends, and 38% say that they feel rejected by their own family.

Co
nC
LUsi
on
Viii. ConCLUsion
Human life is not only characterised by diversity, but also by conflict and limitations. At times the limitations we face are associated with biological differences, such as those related to age or sex; other times they are the result of environmental factors, which lead to problems sustaining our material well-being, forms of coexistence and health conditions. in any case, life is not characterised by perfection or plenitude, but rather by the potential that opens up when we recognize limits and have the will to overcome them. thus, it could be said that it is what we are lacking that make us subjects in process within the particular social context in which our personal and collective projects unfold.
However, diversity and limitations often become the grounds for discrimination. this occurs when certain differences (e.g. being a woman, having Down syndrome, being an african immigrant) or limitations (e.g. being unemployed, suffering from depression, being unable to walk) are stigmatised and deemed characteristics of inferiority. in such cases, it is not the difference or limitation that causes inequality or exclusion, but the mechanisms of inferiorisation associated with them.
there are different approaches to functional limitations (both physical and mental), whose theoretical bases we have discussed in the introduction, each of which leads to different intervention strategies:
• The more traditional position views disability as a deficit, stigmatising the identity of the individual and making it difficult for the person to develop social relationships; thus, the individual ends up being confined within the family or segregated in specialised institutions.
• The medical model focuses on the treatment and rehabilitation of individuals, based on the recommendations of experts considered to be the holders of knowledge and standards; this would include World Health Organisation classification criteria as well as policies set by public health and social protection systems.
• The so-called social model, supported for several decades by the Disabled Peoples’ international and professionals in the field, shifts the focus from the individual and the physiological
Co
nC
LUsi
on
to society and the political; it sees disability as a form of social exclusion imposed on the individual, which must be overcome through a process of personal and collective emancipation.
The language chosen to define this group corresponds in part to the approaches described: ‘invalid/incapacitated’ corresponds to the traditional position; ‘handicapped/disabled’ to the medical model and ‘functional diversity’ to the social model, although in the latter case there is no definitive agreement, and new formulations are being sought. We believe that the social model offers the greatest potential, although the primary source of information we have used, the last Disability, independence and Dependency situations survey (DiDss-2008) is closer to the medical model.
in the population with disabilities, there is a distinction that should first be made regarding age. Slightly over half the persons with disabilities (2.2 million people, 58% of the group) are over 64 years of age, and two-thirds of this group suffered their disability after reaching this age. this explains why the percentage of the population with functional limitations increases exponentially in the later stages of life (30% of those between 75 and 79 years of age, 41% between 80 and 84, and 58% after 85). In these cases, disabilities are considered to be a normal part of ageing and there is no sense of belonging to a distinct group of ‘persons with disabilities’. Consequently, those who acquired disabilities late in life rarely feel discriminated against socially, and they hardly ever apply for the disability certificate, which provides access to types of assistance beyond what is normally available for the elderly (pensions, free health care, home care, etc.).
on the other hand, those who acquired a disability before the age of 65 – and especially those who had not reached that age at the time of the DiDss-2008 (790,000 men and 830,000 women) – are conscious of belonging to a distinct group that faces specific problems. throughout our study we have examined in detail how these persons are incorporated into society in the areas of education, the family, social relationships/friendships and work, as well as through access to general assistance programmes or other programmes designed specifically for persons with disabilities. However, before summarising the results in each of these areas, it is important to draw some general conclusions.
8.1. the relatIonShIP betWeen DISabIlIty anD SoCIal exCluSIon
there is a strong association between disabilities acquired before the age of retirement and the precarious living and working conditions of the lower socio-economic classes (i.e. those with lower incomes and less education). this is made very clear in the rates of disability by level of household income: in households with incomes below 1,000 euros per month, the rate of disability is four times higher (8.4%) than in those with incomes above 2,500 euros per month (2.4%), revealing a systematic correlation between these two variables: the lower the household income, the higher the rate of disability.
the greater probability of members of poor families having some type of mental or physical impairment did not change between the 1999 survey and that of 2008. this is an additional expression of the inequality in the distribution of income and wealth in spain
Co
nC
LUsi
on
and therefore, in access to the resources needed to live a life with dignity and cope with the limitations and problems that arise throughout life.
there are a number of structural conditions that favour such inequality: limited progressive taxation, especially regarding capital income and financial assets; average wage/income stagnation in the last fifteen years, in contrast to the 340% increase in corporate share value over the same time period, and gender inequality in terms of wages, pensions, and risk of poverty.1
Despite the significant contribution from more than one million disability pensions, median household income among those with disabilities is 25% lower than in households of persons without disabilities, as these contributions do not compensate for the low level of economic activity of this group (almost three times lower than the national average). in addition, the extra cost to families resulting from disabilities (for medical treatments, medications, technical assistance, transportation, personal assistance, etc.), which reduces the disposable income of an additional million homes, must also be considered. on the positive side, however, we have to include new services and economic benefits resulting from the passage of the Dependency Law. These grew significantly between 2007 and 2009, though their growth stagnated in 2010 as a result of the economic crisis. in addition, inequalities between men and women with disabilities in access to employment and in income are among the highest in the european Union, as has been revealed by several eUrostat surveys.
1 official data that can be compared in the social Barometer of spain, indicators 4, 5, 11 and 13 on income and Property, 8 on employment and 5, 23, 25 and 26 on gender equality. see www.barometrosocial.es.
in this study a person is considered to have a disability when, prior to receiving personal or technical assistance (except glasses), he or she has one or more of the 44 important limitations in carrying out every day activities that are included in the DiDss-2008. However, as we have seen, one-fourth of total or severe disabilities become mild or disappear thanks to assistance, meaning that persons no longer have a disability, but are instead functioning: ‘[functioning] denotes the positive aspects of the interaction between an individual (with a health condition) and that of the individual’s contextual factors’, according to the latest classification established by the World Health Organisation (ITC-2001).
8.2. loW leVelS of eDuCatIon but WIth IMProVeMentS In the PaSt DeCaDe
the education level of the population with disabilities is much lower than that of the general population. if we focus on the million and half persons with disabilities who are of working age (16-64 years), we find the following: 7% are illiterate (compared to 1% of the general population); one-fourth did not complete primary education, and more than half did not obtain the secondary school diploma; 16% managed to complete secondary education, and 12% have completed higher education (compared to 24% and 26% of the general population, respectively). Furthermore, in 2008 only 8% of working age persons with disabilities were enrolled in some type of continuing education (formal or non-formal), a much lower percentage than for the general population (20%).
Co
nC
LUsi
on
taking into consideration that for the majority of this population, the onset of disability occurred after reaching the age of 16, we must conclude that lower levels of education are due less to disability than to the precarious socio-economic situation of their families. In fact, 37% of those with disabilities from households with incomes over €2,500/month have completed higher education (compared to a national average of 26%). This percentage is almost three times higher than that found among persons with disabilities from middle income households (between 1,500 and 2,500 euros/month: 14%), and it is six times higher than that for persons with disabilities from households with lower incomes (6%).
the illiteracy rate of those whose disability appeared before 16 (more than half at birth or in the first year of life) is twice as high as the overall average for persons with disabilities, but a higher percentage of this group graduates from secondary and tertiary education. the high illiteracy rate is due to the severity of certain perinatal disabilities, which affect mental capacity. the higher rate of graduation from secondary and tertiary education is related to the socio-economic level of the households, which is somewhat higher than in the cases of disabilities acquired at working age.
in the past decade, the education level of the population with disabilities improved at a similar rate to that of the general population, thus maintaining the same levels of inequality between the two groups. in the case of the population with disabilities, improvement has been greatest in relative terms in access to higher education (the percentage more than doubling from 5% to 12% and higher among women than men) and
less among those who could not finish primary education (the percentage has gone down by a quarter from 24% to 18%).
Finally, we have analysed the educational status of children with disabilities who were between six and fifteen years of age in 2008 (accounting for 2% of the children in Spain). The majority are enrolled in public schools with an integration programme or special support; another significant group does not require any kind of support and, finally, one-fifth are enrolled in special education schools or classrooms. the latter situation occurs most frequently among those affected by mental and nervous system impairments or with multiple impairments. those who have limited mobility, vision or hearing disabilities are usually enrolled in mainstream schools without any special support. Almost 3% (2,000 children) were not attending school at the time of the survey. absenteeism due to disability affected one-third of this group.
8.3. loW leVelS of eManCIPatIon froM the Parental hoMe: IMPortant role of faMIly SuPPort
if we compare the civil status of persons with disabilities with that of the general population by age group, we find that the former get married at a much lower rate, suggesting that emancipation from the family is more difficult. There are significant differences by sex: the percentage of women with disabilities who are married is much higher than that of men before 55 years of age, although it falls sharply thereafter, when the number of separated, divorced and widowed women tends to increase. this also explains the very high rate of single-parent households headed by women among those with disabilities (12% compared to an average of

Co
nC
LUsi
on
2% in the general population). Men remain single more often than women up to 55 years of age, when the situation reverses; there is a particularly high percentage of unmarried men between 35 and 45, 54%, compared to 29% of women. This difference can be explained in part by the higher percentage of men with disabilities related to communication and maintaining personal relationships (including intimate relationships).
Nearly all persons with disabilities have relatives (99.9%). The vast majority maintain regular contact with their relatives either through co-residence or visits, phone calls, mail or e-mail. two-thirds of the 0.1% (3,000 persons) who say they have no relatives are over 75 years of age; another 0.2% (10,000 persons) say that their spouse is their only relative and that they try to compensate for lack of family through friendships.
Up to 64 years of age, 50% of persons with disabilities live with their spouse, 45% with their children, 28% with their parents and 17% with their siblings; from 65 on, 47% live with their spouse, 39% with their children, 16% with grandchildren and 4% with siblings. in addition even when they do not live under the same roof, relations are maintained with many relatives, who, in more than half the cases, live in the same municipality. in short, the majority of persons with disabilities have a great deal of contact with other members of their family.
one aspect of family relationships is the personal assistance families members provide to the person with disability so that he or she can carry out everyday activities. according to the DiDss-2008, 1.5 million persons lived with a family member with disabilities and provided such assistance. this support is most
commonly provided by the spouse, the mother or father, and the children, depending on the age of the person with disabilities. in addition, more than 600,000 relatives not living with the person with disabilities participated daily in these tasks: in this case, the children and sisters of the person with disabilities were the most involved. Overall, 85% of those providing assistance are relatives, most often women.
8.4. SySteMS for the InteGratIon of PerSonS WIth DISabIlItIeS In aDult lIfe: PenSIonS, eMPloyMent anD houSeWork
the principal forms of ‘economic activity’ of persons with disabilities between 16 and 64 differ substantially from those of the general population. to compare both groups we used the DiDss-2008 and the economically active Population survey from the same year. While paid employment was the most frequent activity for the general Spanish population (66%), this was the case for only 28% of persons with functional disabilities. Receiving a pension (relied on by retired persons in the general population) was the primary activity for 48% of men and 35% of women with disabilities. Finally, housework was the third form of integration into adult life, an activity carried out almost exclusively by women, with a frequency much higher among those with disabilities (34%) than among the general female population (24%).
one-third of the group studied had to change their main activity due to their disability. in most cases this meant having to leave work, a situation which affected more than 400,000 persons, approximately the same number as those that were working at
Co
nC
LUsi
on
the time of the DiDss-2008 survey. in other words, half of those with jobs had to give up their employment because of disability. another 225,000 had never had a job at any time in their life, and the rest (about half a million) had worked, but were not working at the time of the survey for various reasons, not directly attributable to the onset or worsening of their disabilities. in short, more than two thirds of working age persons with disabilities have renounced or been excluded from the most common and standard form of economic integration during this stage of life: paid employment.
according to social security statistics from 2008, we know that the majority of persons with disabilities receive a pension: just over 900,000 receive a contributory pension, for an average amount of 801 euros/month, and 200,000 receive a non-contributory pension, for an average of 324 euros/month. Both of these combined cover 75% of working age persons with disabilities. These figures are not inconsistent with the figures given above, as the different forms of economic activity can overlap (it is possible to receive a pension while being employed or while looking after the home/family).
Under the current system in spain, almost all contributory pensions are of indefinite duration, as they are based on a criterion of permanent ‘incapacity’, as suggested by the official labels: major disability, permanent absolute incapacity and permanent total incapacity. However, although a minor sector of this population faces effectively insurmountable obstacles to work, most could do so if assistance were provided. But the most common response to the difficulties encountered has been to stop looking for employment.
the majority of contributory pensions are for men who were previously employed, while most non-contributory pensions are received by women. as a result, those who previously did housework, receive three times less than those who had a paid job, another indication of the more precarious position of women.
8.5. feWer jobS anD More PreCarIouS eMPloyMent
as has already been indicated, the employment rate among persons with disabilities was three times lower than that of the general population, while the unemployment rate in the same year of reference - 2008 - was more than double: 20.3% compared to 9.2%. in addition, long-term unemployment (over a year looking for a job) was much higher in this group (57%) than among the general unemployed population (21%), a fact that probably explains in large part the widespread discouragement in this population in finding employment and its low rate of economic activity.
Unfortunately we cannot know how the economic crisis of the last few years has affected the employment status/situation of the population with disabilities, because disability is still not included as a variable in official employment and unemployment statistics. However, taking into account the difference that existed between the unemployment rates among the general population and the population with disabilities in 1999 and 2008, we estimate that the unemployment rate for persons with functional limitations in 2011 may have been between 35 and 46% in 2011.
in the general population as well as among the population with disabilities, unemployment in 2008 was higher among women

Co
nC
LUsi
on
and youth, in particular among those with less education; it was also concentrated in poor households and in the regions with lower income levels (i.e. the Canary islands, extremadura and andalusia). However, among those with disabilities, the disability itself becomes an additional reason for their exclusion from the labour market. When asked about why they could not find a job, two reasons stand out: ‘Because of my disability’ (54%) and ‘Finding work is difficult for anyone’ (17%). A quarter of those who are no longer looking for work and who receive a pension recognise that the main reason for their discouragement is that ‘it would be difficult to find a job being disabled.’
in short, contextual and personal factors (the competitiveness of the labour market, precarious conditions of the jobs they have access to, the rise in unemployment in certain communities, prejudice on the part of the business community, prioritisation of pensions over the adaptation of the workplace, etc.) result in only a minority of persons with disabilities having jobs.
Of the 420,000 persons with paid employment, only one-fifth got their jobs through a sheltered employment programme (e.g. occupational centres and special employment centres) or through special assistance to enter the ordinary labour market (hiring quotas, incentives and bonuses for hiring, supported employment, etc.). the majority found work thanks to friends and family or by applying directly to the employer.
the distribution by sector, branches of activity and employment status is similar to that of the general population: the majority are employees (83%) and are employed in the service sector (70%),
in which the branches of trade, public administration, business services, health care and social services, and education stand out. By sex, there are more men employed in trade and transport, and more women in education, health care and social services, and domestic services (which employs 7% of working women, compared to less than 1% of men).
The most significant differences between the population with disabilities and the general population are found in the distribution of occupations, as persons with disabilities are employed in much greater proportion in unskilled jobs and much less in those requiring higher qualifications (e.g. business management and public administration, technicians and professionals). they are concentrated more in the following occupations: cleaning personnel, unskilled labour, janitors and unskilled workers in sales, restaurant work and personal services.
In 2008, 29% of work contracts were temporary, similar to the national average for that year (30%) and four points higher than the percentage from the 1999 Disability survey. the proportion of temporary employment was higher among women and young persons, who were also more likely to do shift work (morning, afternoon and night shifts); this corresponds with other indicators of socio-occupational discrimination in these groups. Finally, if one takes into account the possible benefit of part-time jobs for those who might have greater difficulty working long hours, it is surprising that the percentage of persons with disabilities holding part-time jobs is four times lower (3%) than that of the population in general (12%).

Co
nC
LUsi
on
8.6. SoCIal relatIonS anD frIenDShIP. exPerIenCInG DISCrIMInatIon
Approximately 90% of those under 65 years of age and 85% of those 65 and over have friends, almost always living in the same municipality. two-thirds see their friends daily or several times per week. in comparison with family relationships, contact with friends is less frequent than with a spouse, parents or children, but is more frequent than with siblings or other relatives.
Ten per cent of those under 65 lack friends and 15% of those 65 and over, but the percentages are twice as high among those with disabilities related to personal relationships and learning and communication (specifically those who more often suffer from mental or multiple impairments); these are also the groups that have more intensive contact with their close relatives. on the opposite end of the spectrum are persons with osteoarticular, hearing or vision impairments, who maintain more regular contact with friends. These groups also have less difficulty making new friends than those affected by disabilities related to language comprehension, learning and personal relationships.
nearly a quarter of persons with disabilities under 65 said that they had experienced discrimination in the year prior to the survey because of their disability, and of this group, a third experienced discrimination ‘often’ or ‘constantly’. However, only 9% reported it, with similar percentages for men and women. the experience of discrimination is higher among the economically active than the inactive, and particularly so among the unemployed, who suffer a greater degree of frustration in the labour market.
Membership in disability associations increased in the decade between 1999 and 2008; among working age persons with disabilities it rose from 7.5% to 10%. Participation in associations is much higher among children and youth and their families and decreases with age, reaching the lowest levels after 65. in general, membership is much higher in cases of mental impairment – often mediated by family members – than in cases of physical or sensory impairment.
8.7. MeaSureS to aDDreSS lIMItatIonS anD ConflICtS WIthIn a fraMeWork of funCtIonal DIVerSIty
We can distinguish between two types of measures aimed at addressing limitations. on the one hand are those measures oriented toward the individual, focused on resolving or mitigating the specific limitations faced by individuals with disabilities. On the other hand, there are measures of a preventive nature, which aim to eliminate the social conditions which exclude persons with disabilities. these measures take the form of broad social policies (such as policies to promote a more balanced distribution of income, promoting job sharing and quality health care and education for all persons without discrimination), the elimination of physical barriers and the promotion of direct participation in local communities and political institutions. information regarding measures aimed at the individual is included in the DiDss-2008, but not regarding preventive measures, which, however, are considered necessary by the World Health organization if we are to understand and address phenomena related to functioning and disability (iCF-2001).

Co
nC
LUsi
on
individual-oriented measures
individual-oriented measures are those aimed at resolving, compensating for or alleviating important difficulties in carrying out activities of daily living. assistance may be technical (products, instruments or equipment to overcome or alleviate a limitation) or personal. seventy-one percent of persons with disabilities receive assistance: 12% receive only technical assistance (the only assistance possible for those with visual, hearing and driving impairments); 31% receive only personal assistance, and 28% receive both types of assistance. Overall, this assistance is a major support in reducing the severity of disabilities at all ages, although for more than one third of those with disabilities such assistance is not enough:
• total disability, which means inability to perform the corresponding activity, is reduced by more than one third (from 41.7 to 28.6%);
• severe disability is reduced from 33.4% to 27.9%;
• moderate disability is increased by a quarter, from 25% to 31.5%, and
• just over a tenth (12%) of disabilities are largely overcome as the corresponding activities defining the disability can be carried out without difficulty.
according to the iCF-2001 (WHo), persons who overcome their limitations with technical and personal assistance no longer have a disability but are considered to be functioning. Following this
criterion, the total assistance available in spain implies a significant reduction in the total number of disabilities detected in the survey: 3.5 million of the 30.6 million detected (eight per person). in terms of the number of persons affected, taking into account maximum level of severity, this reduction would affect over 400,000 subjects, 16.7% of the group. And if we only consider those persons who have received assistance, the number of cases of total disability is reduced by just over half.
At the same time, two-thirds of the 29% who do not receive any aid say that they need it. in absolute numbers, more than half a million persons lack the technical assistance they need, and nearly a quarter of a million, personal assistance. it is striking that the majority of those who do not receive assistance and who need it are women. it is particularly paradoxical that while women are the primary caregivers (75% of caregivers), they are ones who receive the least help when they need it (69% of persons considered neglected).
Personal assistance, the most frequent type of aid, involves approximately three million caregivers, the vast majority relatives of the persons with disabilities (96% when they live in the same home, and 65% when they do not). Caregivers say that they often have professional, financial and health problems which they attribute to the burden of caring for the person with disabilities. this affects the caregiver as well as other family members and can sometimes lead to tensions and conflict with the person receiving care. one way to solve these problems would be if there was broader public support in promoting professional personal assistance. in recent years this has led to the development of the system for autonomy and Care for Dependency (saaD), which
Co
nC
LUsi
on
in mid-2011 was providing financial support to one of every ten informal caregivers (the majority women providing care to a family member), and expanding coverage of other professional resources and services. It would be unfortunate if the progress made after the enactment of the Dependency Law was halted as a result of the measures being taken to reduce the public deficit, as seems to have occurred in 2010, when aid was frozen after the significant increases of previous years.
a second type of aid for persons with limitations is offered by healthcare, rehabilitation and social assistance services. these are important services given the high morbidity rate of this group: 80% have a chronic illness (74% among those of working age), the most frequent being arthritis/osteoarthritis and depression. More than half of the respondents to the DIDSS-2008 had received some type of healthcare service in the 15 days prior to the survey, and nearly one-third had been hospitalised in the previous year. regarding specialised rehabilitation services, the two most frequently used were psychological assistance or mental health care, which108,000 working age persons had used in the previous 15 days, and medical-functional rehabilitation services, which 87,000 persons from the same age group had used. Telephone assistance, programmed home care and home help were used more frequently by persons over 65. Most of these services are covered by the health care system and public social services, although around one-third of rehabilitation services and social services used by working age persons with disabilities were provided privately, sometimes through mixed payment or co-payment. given that the spanish population, according to the WHo, is emerging as one of the oldest in the world, it is of great importance to maintain and strengthen these services, which primarily affect
older persons with disabilities, and not permit measures to reduce the public deficit to have a negative impact on them.
approximately a quarter of a million persons said they did not have access to a specific health care or social service when needed due to long waiting lists (31%) or not having money to pay for it (21%), among other reasons. these complaints arise mainly among women, just as occurred with personal and technical assistance. in this sense, it would be important to resolve problems with long waiting lists for those who have applied for assistance through the Dependency Law, many of whom, even after their eligibility is determined do not receive the services or benefits to which they are entitled.
a third type of aid is the different pensions available; three-quarters of working age persons with disabilities receive pensions, which serve as an alternative to work more than as a temporary provision when individuals cannot find a job. The ICF-2001 describes lack of employment as a disability for those of working age, just as is deafness or the inability to do housework. However, current policy regarding pensions, essential for those who are unable to work, seems to encourage persons to abandon the labour market even though they would be able to work if adequate conditions or adaptations were available to do so. in this sense, pension policy should aim to meet the needs of those unable to work, redirecting other public funding toward strengthening measures to support the employability of those in a position to work.
Lastly, there are measures to support integration of persons with disabilities into the regular school system, as well as different types of monetary and fiscal aid to help cover the extra expenses caused

Co
nC
LUsi
on
by disabilities or to pay caregivers. All these measures need to be maintained and their reach expanded, as they are necessary for the social inclusion of this group on equal terms with the rest of the population.
Preventive measures of a social character
in addition to individual measures, there are general or preventive measures which aim to create a social environment that avoids the appearance of disabilities. this approach addresses disability in terms of equal rights, the recognition of the individual and his/her right to a life with dignity, with the same opportunities as the rest of the population in the spheres of education, employment, civic participation, mobility, etc. obviously, we are far from realising these objectives in the current social context, characterised by significant inequality in the distribution of income and wealth, a competitive and polarised labour market and discrimination against broad segments of the population, including persons with disabilities.
some possible areas for policy development would include policies aimed at a more balanced distribution of wealth and income, since, as we have seen, disabilities occur much more frequently in poor households, with more precarious living and working conditions and with scarce resources to cope with disability. it is also necessary to maintain and strengthen universal access to public healthcare, education and social services, with measures to facilitate quality care and guarantee the support necessary for persons with functional limitations. the objective is to reduce the large deficit among persons with disabilities in these areas (chronic diseases, school failure, etc.), as well as the lack of access
of a quarter of a million persons to needed social services and rehabilitation services. Along the same lines, we must also fill the gap in terms of the three quarters of a million persons who do not receive the technical or personal assistance they need to cope with their limitations; in order to do this, the system for autonomy and Dependence Care (saaD) must be consolidated by strengthening professional services as well as by supporting – with resources, benefits and counselling – the daunting task of informal care. on this last point, it is also important to promote gender equality in the provision of care, currently primarily carried out by women (in this order: daughters, wives and mothers).
in addition, a more balanced division of employment among all persons who are able to work must be promoted, which includes the majority of persons with disabilities. this can be done by facilitating the adaptation of the workplace and more appropriate contract modalities, in particular, part-time work, which is currently underutilised. it is also important to provide support for the emancipation of persons with disabilities so that they are able to enjoy and exercise the same rights as the rest of society. in particular, their participation in the local community and broader society should be strengthened in order for them to become active actors, individually and as a group, in their own life projects and in society.

BiBL
iog
ra
PHy
BiBLiograPHy
AbbERLEy, P. (2008): «el concepto de opresión y el desarrollo de una teoría social de la discapacidad», in L. bARTON (ed.): Superar las barreras de la discapacidad, Madrid: Morata, 5-19.
AGENCIA DE ASUNTOS PRECARIOS TODAS AZIEN AND FORO DE VIDA INDEPENDIENTE (2011): Cojos y precarias: haciendo vidas que importan. Cuaderno sobre una alianza imprescindible, Madrid: Traficantes de Sueños.
AGUADO, a.L. (1995): Historia de las deficiencias, Madrid: escuela Libre.
ALMEIDA, M.e. et al. (2010): «nuevas retóricas para viejas prácticas. repensando la idea de diversidad y su uso en la comprensión y abordaje de la discapacidad», Política y Sociedad, 47(1), 27-44.
ALONSO, L.e. (2007): La crisis de la identidad laboral, Madrid: anthropos.
aPPLICA & CESEP & ALPhAMETRICS (2007): Men and Women with Disabilities in the EU: Statistical Analysis of the LFS Ad Hoc Module and the WU-SILCK, Dg Brussels: european Commission.
ARNAU, s. et al. (2007): Asistencia personal para la vida independiente y la promoción de la autonomía de las personas con diversidad funcional (discapacidad) en España, Madrid: Foro de Vida independiente.
ASSOCIATION OF PERCEIVED STIGMA AND MOOD AND ANxIETy DISORDERS (2008): «results from the World Mental Health surveys», in Acta Psychiatr. Scad., 118, 305-314.
AZAñA, a. (2009): Implementación de la Ley de Dependencia en España: comunidades autónomas, Valencia: Universidad de Valencia.
bAREA, J., and J.L. MONZóN (2008): Economía social e inserción laboral de las personas con discapacidad en el País Vasco, Bilbao: Fundación BBVa.
bARNES, C. (2010): «Discapacidad, política y pobreza en el contexto del mundo mayoritario», Política y Sociedad, 47(1), 11-25.
— (1990): The Social Construction of Dependence, Basingstoke: the Falmer Press.
— and g. MERCER (2003): Disability, Cambridge: Polity Press.
bENACh, J., and C. MUNTANER (eds.) (2010): Empleo, trabajo y desigualdades en salud. Una visión global, Barcelona: icaria.
bILbAO, a. (1997): El accidente de trabajo: entre lo negativo y lo irreformable, Madrid: siglo XXi.
BiBL
iog
ra
PHy
CASTILLO, J.J. (2008): La soledad del trabajador globalizado. Memoria, presente y futuro, Madrid: Los Libros de la Catarata.
CENTRO DE INVESTIGACIONES SOCIOLóGICAS (2011): Barómetro de marzo sobre voluntariado, estudio n.º 2.864.
— (2003): Estudio n.º 2.478 sobre tiempo libre y hábitos de lectura, Madrid: Cis.
ChATERRjI, s. (ed.) (2007): Estudio global sobre el envejecimiento y la salud adulta, oMs.
COLECTIVO IOé (2008): Barómetro social de España, análisis del periodo 1994-2006 a partir de un sistema de indicadores, Madrid: Traficantes de Sueños.
— (2003): La inserción laboral de las personas con discapacidades, Barcelona: Fundación ”la Caixa”.
— (1996): Tiempo social contra reloj. Las mujeres y la transformación de los usos de tiempo, Madrid: instituto de la Mujer.
— and CiMoP (1998): Discapacidad y trabajo en España, Madrid: Ministerio de trabajo y asuntos sociales.
COMISIóN EUROPEA (2008): Discrimination in the European Union: Perceptions, Experiences and Attitudes, special eurobarometer no. 296, Directorate general employment, social affairs and equal opportunities.
COMISIóN SObRE DETERMINANTES SOCIALES EN LA SALUD (CsDH) (2008): Closing the gap in a generation. Health equity through action on the social determinants of health, geneva: World Health organization.
CONSEjO ECONóMICO SOCIAL (2004): La situación de las personas con discapacidad en España, Madrid: Ces.
DöRNER, e.a. (1974): Ciudadanos y locos. Historia social de la psiquiatría, Madrid: taurus.
DRIEDGER, D. (1989): The Last Civil Rights Movement: Disabled People’s International, London: Hurst.
EUROSTAT (2001): Disability and Social Participation in Europe, Luxemburg: european Comission.
FERREIRA, M.a. (2010): «De la minusvalía a la diversidad funcional: un nuevo marco teórico metodológico», Política y Sociedad, 47(1), 45-65.
— (ed.) (2010): «Por una sociología de la discapacidad», Política y Sociedad, 47(1).
FOUCAULT, M. (1976): Historia de la locura en la época clásica, Mexico: Fondo de Cultura económica.
FUNDACIóN CireM (2005): Discapacidad y mundos rurales. Empleabilidad del colectivo con discapacidad en el medio rural, Madrid: Fundosa social Consulting.
— (2004): Imagen social y laboral de las personas con discapacidad en España, Madrid: imserso, Ministerio de trabajo y asuntos sociales.
FUNDACIóN FOESSA (2008): VI Informe sobre exclusión y desarrollo social en España 2008, Madrid: Cáritas española.
GUTIéRREZ, M.J. (1997): Compatibilidad entre trabajo y pensiones, toledo: CoCeMFe de Castilla-La Mancha.
INSTITUTO NACIONAL DE ESTADíSTICA (ine) (2010): Encuesta sobre Discapacidad, Autonomía Personal y Situaciones de Dependencia. Metodología, Madrid: subdirección general de estadísticas sociales sectoriales.

BiBL
iog
ra
PHy
— (2009), «Panorámica de la discapacidad en españa», in Cifras INE, Boletín Informativo del Instituto Nacional de Estadística, 10/2009, Madrid: INE.
— (2003): Encuesta de empleo del tiempo. 2002-2003, Madrid: ine.
jIMéNEZ, a., and a. hUETE (2003): «Las estimaciones de prevalencia de las encuestas del ine y los factores conceptuales de su disparidad», in La discapacidad en España: datos estadísticos. Aproximación desde la Encuesta sobre Discapacidades, Deficiencias y Estado de Salud 1999, Madrid: real Patronato sobre Discapacidad, 30-39.
— and D. CASADO (2001): «estadísticas epidemiológicas de la discapacidad», Boletín del Real Patronato sobre Discapacidades, 50, 86-89.
LObATO, M. (2005): «Filosofía del Movimiento de Vida independiente. el concepto de asistencia personal», I Jornadas de Vida Independiente, san sebastián: Diputación de guipúzcoa.
LóPEZ, g., and V. ORTúN (1998): Economía y salud. Fundamentos y políticas, Madrid: encuentro.
LóPEZ-TARRUELLA, F., and C. VIqUEIRA (1991): El trabajo del inválido permanente absoluto. Compatibilidad de la pensión en el nivel contributivo y no contributivo, Madrid: Civitas.
LORENZO, r. DE (2006): «Discapacidades y pensiones hacia el año 2000», in Jornadas sobre pensiones de invalidez, Madrid: Plataforma representativa de Discapacitados Físicos.
MIqUEO, C. et al. (eds.) (2001): Perspectivas de género en salud. Fundamentos científicos y socioprofesionales de diferencias sexuales no previstas, Zaragoza: Minerva.
OLIVER, M. (1998): «¿Una sociología de la discapacidad o una sociología discapacitada?», in L. bARTON (comp.): Discapacidad y sociedad, Madrid: Morata, 34-58.
— (1990): The Politics of Disablement, Basingstoke: Macmillan.
oMs (2001): Clasificación internacional del funcionamiento, de la discapacidad y de la salud (CIF), Madrid: Ministerio de trabajo y asuntos sociales.
— (1983): Clasificación internacional de deficiencias, discapacidades y minus-valías. Manual de clasificación de las consecuencias de la enfermedad, Madrid: inserso.
PALACIOS, a., and J. ROMAñACh (2008): «el modelo de diversidad: una nueva visión de la bioética desde la perspectiva de las personas con diversidad funcional (discapacidad)», Intersticios, 2(2), 37-47.
— (2006): El modelo de la diversidad, Madrid: Diversitas.
RAVAUD, J.F. et al. (1994): «Handicaps et inégalités liés aux deficiences et incapacités fonctionnelles», in F. bOUChAyER, Trajectoires sociales et inégalités, saint-agne: erès, ramonville, 141-160.
RECIO, a. (2009): «La evolución del mundo del trabajo en la crisis», Papeles de Relaciones Ecosociales y Cambio Social, 108, 89-97.
RODRíGUEZ, s., and M.a. FERREIRA (2010): «Diversidad funcional: sobre lo normal y lo patológico en torno a la condición social de la dis-capacidad», Cuadernos de Relaciones Laborales, 28(1), 64-85.
RODRíGUEZ CAbRERO, g. (coord.) (2011): «Dependencia y discapacidad como riesgo social: políticas de protección social, cuidados informales y autonomía», Cuadernos de Relaciones Laborales, 29(1).

BiBL
iog
ra
PHy
ROSATO, a., and M.a. ANGELINO (2009): Discapacidad e ideología de la normalidad. Desnaturalizar el déficit, Buenos aires: noveduc.
ROSEN, g. (1974): Locura y sociedad: sociología histórica de la enfermedad mental, Madrid: alianza Universidad.
saaD (2011): Estadísticas de los cuatro primeros años de aplicación de la Ley de Dependencia, Madrid: Ministerio de sanidad, Política social e igualdad, en www.mspsi.es.
SChALOCk, R.L., in C. Caballo (ed.) (1995): I Jornadas científicas de investigación sobre personas con discapacidad, salamanca: Universidad de salamanca, 13-22.
VALLS LLObET, C. et al. (2008): «Morbilidad diferencial entre mujeres y hombres», Anuario de Psicología (Universidad de Barcelona), 39(1), 9-22.
VEIGA, a. (2001): «incluir para excluir», in J. LARROSA and C. SCkLIAR (ed.): Habitantes de Babel. Políticas y poéticas de la diferencia, Barcelona: Laertes.
WhITEhEAD, M., and g. DAhLGREN (2006): Concepts and Principles for Tackling Social Inequities in Health, World Health organization.

inD
eX o
F ta
BLes
, gra
PHs
an
D M
aPs
inDeX oF taBLes, graPHs anD MaPs
tables
1.1. Percentage of persons with disabilities by region and in relation
to average age and average income level in each region 30
5.1. education level of the working age population with disabilities
and comparison with the general population in spain (1999
and 2008, in percentages) 63
6.1. Main branches of activity in the service sector, by sex
(in percentages) 77
6.2. Contributory and non-contributory pensions granted
by social security in 2008 because of disability 95
Graphs
1.1. number of persons affected by type of disability, by age 17
1.2. Proportion of persons with at least one disability, by age
(percentage of the spanish population) 23
1.3. Percentage of women and men with disabilities by age 23
1.4. Percentage of persons under 65 with disabilities, by level
of household income 24
1.5. types of household expenses due to disability (all ages,
in percentages) 25
1.6. Percentage of persons receiving services or dependency
benefits by region (per thousand inhabitants) 27
1.7. Percentage of persons with disabilities, by size of municipality 28
1.8. Percentages of persons with disabilities, by country of birth 32

inD
eX o
F ta
BLes
, gra
PHs
an
D M
aPs
2.1. Main types of impairment, by sex (all ages, in percentages) 34
2.2. age of onset of impairment among working-age persons with
disabilities (1999 and 2008, in percentages) 38
2.3. Causes of various types of impairments (all ages,
in percentages) 39
2.4. self-perceptions of health in the population with disabilities
and the general population in spain (in percentages) 40
2.5. Perceptions of state of health of women and men
with disabilities (ages 6-64, in percentages) 40
2.6. Men and women with disabilities and chronic illnesses
(all ages) and comparison with the general population
(in percentages) 41
2.7. the most common chronic illnesses among persons with
disabilities, by age (number of persons affected) 42
3.1. severity of disabilities before and after receiving assistance
(in percentages) 44
3.2. effect of assistance for people with disabilities, based on
highest degree of severity (in percentages) 45
3.3. Dependency Law coverage of persons with disabilities
related to basic activities of daily living (ADLs) identified
in the DiDss-2008 47
3.4. Men and women with disabilities who do not receive
technical or personal assistance, even though they say they
need it (totals) 48
3.5. Persons with disabilities in relation to technical and personal
assistance (in percentages) 49
3.6. Persons with disabilities who received rehabilitation
services in the two weeks prior to the survey (under 65 and
65 and over) 49
3.7. Men and women with disabilities aged 65 and older who
used social services in the two weeks prior to the survey
(in percentages) 50
3.8. Disability certification and persons with disabilities in Spain
(in percentages) 51
3.9. Men and women with disabilities who have disability
certification, by age (in percentages) 52
4.1. relationship of primary caregiver to person with disability
(totals) 54
4.2. sex and age of main caregiver (number and percentage
of women in each age bracket) 55
4.3. economic activity of primary caregivers (percentages by sex) 55
4.4. Most common types of assistance provided by main caregiver,
by age group of persons with disability (totals) 57
inD
eX o
F ta
BLes
, gra
PHs
an
D M
aPs
4.5. Caregivers who experience special difficulties in the caregiving
relationship (in percentages) 58
4.6. Problems related to free time and family life among caregivers,
by sex (in percentages) 59
4.7. Caregivers with health problems due to providing care
(in percentages) 60
5.1. education level of persons with disabilities, by age of onset
of disability (before or after 16 years of age, in percentages) 63
5.2. Percentages of people with disabilities without primary
education and with university degrees in comparison to
the general population (1999 and 2008) 65
5.3. education level of persons with disabilities aged 16 to 64,
by household income level (in percentages) 65
5.4. adults with disabilities in formal and non-formal education in
comparison to the general population (2008, in percentages) 66
5.5. type of schooling of boys and girls with disabilities aged
6 - 15 years (in percentages) 68
6.1. economic activity of working age persons with disabilities
in comparison to the general population (in percentages) 70
6.2. Changes in economic activity of working age persons at
the time disability appeared or worsened (in percentages) 72
6.3. Main reason why working age persons with disabilities
stopped working (totals) 73
6.4. How current employment was found, by age (in percentages) 74
6.5. economic sector of employed persons with disabilities
in comparison to the general population in spain
(in percentages) 76
6.6. employers with disabilities compared to the spanish general
public, by sex (in percentages) 78
6.7. Main categories of occupations of persons with disabilities
in comparison to the general population in spain
(in percentages) 78
6.8. Main unskilled occupations of men and women with
disabilities (in percentages) 82
6.9. Percentage of persons with disabilities with temporary
employment in comparison to the general population,
by age and sex 83
6.10. types of contracts held by employed persons with disabilities,
by size of company (totals) 84
6.11. Part-time workers among persons with disabilities and
in the general population, by sex (in percentages) 85

inD
eX o
F ta
BLes
, gra
PHs
an
D M
aPs
6.12. average income of employed women and men with disabilities
in relation to average income of persons of both sexes without
disabilities in spain and in the european Union, by age (2004) 86
6.13. Unemployment rate of persons with disabilities, by education
level (in percentages) 88
6.14. Unemployment rate of persons with disabilities, by household
income level (in pecentages) 88
6.15. Unemployment rate of men and women with disabilities,
by size of municipality (in percentages) 90
6.16. Methods used in the previous four weeks to look for work
(multiple responses, in percentages) 90
6.17. Long-term unemployment (more than one year) among
men and women with disabilities and in comparison to
the average for the general population (in percentages) 91
6.18. Main reasons for not being able to find a job (in percentages) 92
6.19. reasons given by working age persons with disabilities for not
looking for employment (in percentages) 93
6.20. Working age women with disabilities who are responsible
for housework and in comparison to the average in spain
(in percentages) 99
7.1. Proportion of married persons by age in the population over
20 years of age with and without disabilities (in percentages) 102
7.2. Proportion of married women and men by age in the
population with disabilities (in percentages) 102
7.3. Household type of men and women with disabilities and
in the general population of spain (in percentages) 104
7.4. Place of residence of relatives, by age of persons with
disabilities (in percentages) 105
7.5. Frequency of contact of persons with disabilities with family
members, by sex and age (in percentages) 106
7.6. Frequency of contact by telephone and letter between
persons with disabilities and their relatives (in percentages) 107
7.7. How often persons with disabilities see their friends
(in percentages) 108
7.8. Membership rates of persons with disabilities in associations
in the sector, by age (in percentages) 110
7.9. rates of membership in associations in the sector of persons
with disabilities (1999 and 2008, in percentages) 111
7.10. Leisure activities practiced and that they would like to
practice: for the population with disabilities and the general
population (in percentages) 112
7.11. Persons with disabilities between the ages of 6 and 64 who
have felt discriminated against in the previous 12 months
(in percentages) 114
inD
eX o
F ta
BLes
, gra
PHs
an
D M
aPs
7.12. Persons with disabilities who have felt discriminated against,
by economic activity (in percentages) 114
7.13. the main areas of discrimination or social exclusion persons
with disabilities experienced in the previous 12 months
(in percentages) 115
Maps
1.1. Prevalence of persons with disabilities, by region 29
6.1. Unemployment rate of persons with disabilities, by region 89

Social Studies Collection
available on the internet: www.laCaixa.es/obraSocial
1. Foreign iMMigration in sPain (Out of stock) eliseo aja, Francesc Carbonell, Colectivo ioé (C. Pereda, W. actis and M. a. de Prada), Jaume Funes and ignasi Vila
2. VaLUes in sPanisH soCiety anD tHeir reLation to DrUg Use (Out of stock) eusebio Megías (director), Domingo Comas, Javier elzo, ignacio Megías, José navarro, elena rodríguez and oriol romaní
3. FaMiLy PoLiCies FroM a CoMParatiVe PersPeCtiVe (Out of stock) Lluís Flaquer
4. yoUng WoMen in sPain (Out of stock) inés alberdi, Pilar escario and natalia Matas
5. tHe sPanisH FaMiLy anD attitUDes toWarD eDUCation (Out of stock) Víctor Pérez-Díaz, Juan Carlos rodríguez and Leonardo sánchez Ferrer
6. oLD age, DePenDenCe anD Long-terM Care (Out of stock) David Casado Marín and guillem López and Casasnovas
7. yoUng PeoPLe anD tHe eUroPean CHaLLenge Joaquim Prats Cuevas (director), Cristòfol-a. trepat and Carbonell (coordinator), José Vicente Peña Calvo, rafael Valls Montés and Ferran Urgell Plaza
8. sPain anD iMMigration Víctor Pérez-Díaz, Berta Álvarez-Miranda and Carmen gonzález-enríquez
9. HoUsing PoLiCy FroM a CoMParatiVe eUroPean PersPeCtiVe Carme trilla
10. DoMestiC VioLenCe (Out of stock) inés alberdi and natalia Matas
11. iMMigration, sCHooLing anD tHe LaBoUr MarKet Colectivo ioé (Walter actis, Carlos Pereda and Miguel a. de Prada)
12. aCoUstiC ContaMination in oUr Cities Benjamín garcía sanz and Francisco Javier garrido
13. Foster FaMiLies Pere amorós, Jesús Palacios, núria Fuentes, esperanza León and alicia Mesas
14. PeoPLe WitH DisaBiLities anD tHe LaBoUr MarKet Colectivo ioé (Carlos Pereda, Miguel a. de Prada and Walter actis)
15. MosLeM iMMigration in eUroPe Víctor Pérez-Díaz, Berta Álvarez-Miranda and elisa Chuliá
16. PoVerty anD soCiaL eXCLUsion Joan subirats (director), Clara riba, Laura giménez, anna obradors, Maria giménez, Dídac Queralt, Patricio Bottos and ana rapoport
17. tHe regULation oF iMMigration in eUroPe eliseo aja, Laura Díez (coordinators), Kay Hailbronner, Philippe de Bruycker, François Julien-Laferrière, Paolo Bonetti, satvinder s. Juss, giorgio Malinverni, Pablo santolaya and andreu olesti
available in english from no. 23

18. eUroPean eDUCationaL systeMs: Crisis or transForMation? Joaquim Prats and Francesc raventós (directors), edgar gasòliba (coordinator), robert Cowen, Bert P. M. Creemers, Pierre-Louis gauthier, Bart Maes, Barbara schulte and roger standaert
19. Parents anD CHiLDren in toDay’s sPain gerardo Meil Landwerlin
20. singLe Parenting anD CHiLDHooD Lluís Flaquer, elisabet almeda and Lara navarro
21. tHe iMMigrant BUsiness CoMMUnity in sPain Carlota solé, sònia Parella and Leonardo Cavalcanti
22. aDoLesCents anD aLCoHoL. tHe ParentaL VieW eusebio Megías Valenzuela (director), Juan Carlos Ballesteros guerra, Fernando Conde gutiérrez del Álamo, Javier elzo imaz, teresa Laespada Martínez, ignacio Megías Quirós and elena rodríguez san Julián
23. intergenerationaL PrograMMes. toWarDs a soCiety For aLL ages Mariano sánchez (director), Donna M. Butts, alan Hatton-yeo, nancy a. Henkin, shannon e. Jarrott, Matthew s. Kaplan, antonio Martínez, sally newman, sacramento Pinazo, Juan sáez and aaron P. C. Weintraub
24. FooD, ConsUMPtion anD HeaLtH Cecilia Díaz Méndez y Cristóbal gómez Benito (coordinators), Javier aranceta Bartrina, Jesús Contreras Hernández, María gonzález Álvarez, Mabel gracia arnaiz, Paloma Herrera racionero, alicia de León arce, emilio Luque and María Ángeles Menéndez Patterson
25. VoCationaL training in sPain. toWarD tHe KnoWLeDge soCiety oriol Homs
26. sPort, HeaLtH anD QUaLity oF LiFe David Moscoso sánchez and eduardo Moyano estrada (coordinators), Lourdes Biedma Velázquez, rocío Fernández-Ballesteros garcía, María Martín rodríguez, Carlos ramos gonzález, Luís rodríguez-Morcillo Baena and rafael serrano del rosal
27. tHe rUraL PoPULation in sPain. FroM DiseQUiLiBriUM to soCiaL sUstainaBiLity Luis Camarero (coordinator), Fátima Cruz, Manuel gonzález, Julio a. del Pino, Jesús oliva and rosario sampedro
28. Caring For otHers a CHaLLenge For tHe 21st CentUry Constanza tobío, M.ª silveria agulló tomás, M.ª Victoria gómez and M.ª teresa Martín Palomo
29. sCHooL FaiLUre anD DroPoUts in sPain Mariano Fernández enguita Luis Mena Martínez and Jaime riviere gómez
30. CHiLDHooD anD tHe FUtUre: neW reaLities, neW CHaLLenges Pau Marí-Klose, Marga Marí-Klose, elizabeth Vaquera and solveig argeseanu Cunningham
31. iMMigration anD tHe WeLFare state in sPain Francisco Javier Moreno Fuentes and María Bruquetas Callejo
32. inDiViDUaLiZation anD FaMiLy soLiDarity gerardo Meil
33. DisaBiLity anD soCiaL inCLUsion Colectivo ioé (Carlos Pereda, Miguel Ángel de Prada, Walter actis)

inD
eX o
F ta
BLes
, gra
PHs
an
D M
aPs
the present study offers a picture of the current population with disabilities in spain and developments over the past decade. it analyses the factors which trigger disability, forms of treatment and the integration of persons with disabilities in the spheres of education, the family, social relations and the labour market, as well as their participation in the public sphere.
among the factors examined, the study looks at transformations in the family and in the provision of informal care, the current economic crisis and the impact of social policy, in particular, the Dependency Law established in 2007. in line with the WHo, this study presents a new way of understanding and addressing disability, emphasising that persons with functional diversity have the right to be treated with the same consideration and dignity as the rest of the population. this means promoting the measures needed to ensure their autonomy and eliminating the barriers and prejudices they face. it is about replacing traditional labels, established on the basis of fixed parameters, with a diagnosis of the specific elements present in each case and the kind of support needed to achieve the best possible social integration.