socially-aware distributed systems or why this class collaboration? anda iamnitchi [email protected]
TRANSCRIPT


Distributed Systems
Collections of stand-alone communicating devices that have a common task or objective
Internet-connected computersMobile devices (cell phones, PDAs)
Common tasks:Communicate/share data (the Web, BitTorrent)Compute something together (SETI@home)...Collectively provide a service
2

A Distributed System
3

Or a Distributed System
4

5
Thesis
The wealth of social information exposed from multiple sources can be mined in the design of distributed computing infrastructures: to facilitate improved performance for traditional applications and services;to enable novel applications.
Funded by NSF CAREER Award

6
Social Information
Connects people through relationshipsObject centric: use of same objectsPerson centric: declared relationships or co-participation in events, groups, etc.
Social relationships can be translated into:
TrustIncentives for resource sharingShared interest in content…

7
Motivating Application: Socially-
aware Call Censor
8
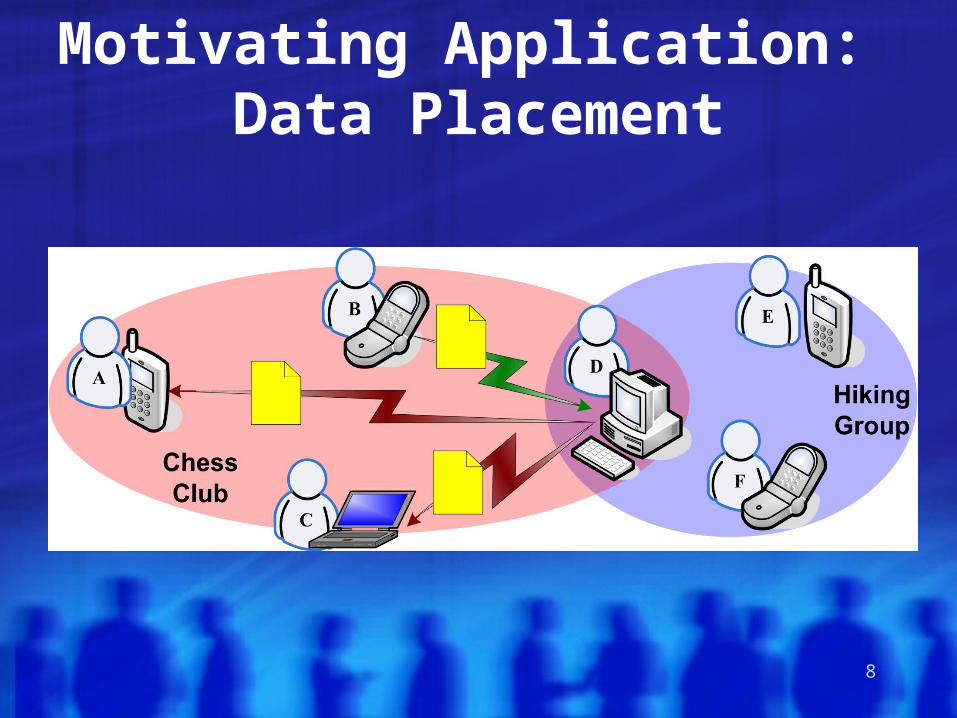
Motivating Application: Data Placement

9
“No 24 in B minor, BWV 869”“Les Bonbons”
“Yellow Submarine”“Les Bonbons”
“Yellow Submarine”“Wood Is a Pleasant Thing to Think About”
“Wood Is a Pleasant Thing to Think About”
The interest-sharing graph GmT(V, E):
V is set of users active during interval T An edge in E connects users who share at least m
file requests within T
An Example: Interest Sharing

10
Small Worlds
0.1
1.0
10.0
1 10 100 1000 10000Clustering coefficient ratio (log scale)
Avg
. pat
h le
ngth
rat
io (
log
scal
e) .
Word co-
occurrences
Film actors
LANL coauthors
Internet
Web
Food web
Power grid
D. J. Watts and S. H. Strogatz, Collective dynamics of small-world networks. Nature, 393:440-442, 1998R. Albert and A.-L. Barabási, Statistical mechanics of complex networks, R. Modern Physics 74, 47 (2002).

11
Web Interest-Sharing Graphs
0.1
1.0
10.0
1 10 100 1000 10000Clustering coefficient ratio (log scale)
Avg
. pat
h le
ngth
rat
io (
log
scal
e) . Web data-sharing graph
Other small-world graphs
7200s, 50files
3600s, 50files
1800s, 100files
1800s, 10file
300s, 1file

12
DØ Interest-Sharing Graphs
0.1
1.0
10.0
1 10 100 1000 10000Clustering coefficient ratio (log scale)
Avg
. pat
h le
ngth
rat
io (
log
scal
e) . Web data-sharing graph
D0 data-sharing graphOther small-world graphs
7days, 1file
28 days,1 file

13
KaZaA Interest-Sharing Graphs
7day, 1file
28 days1 file
0.1
1.0
10.0
1 10 100 1000 10000Clustering coefficient ratio (log scale)
Avg
. pat
h le
ngth
rat
io (
log
scal
e) . Web data-sharing graph
D0 data-sharing graphOther small-world graphsKazaa data-sharing graph
2 hours1 file
1 day2 files
4h2
files
12h4 files

14
Proactive Information Dissemination
3 days 7 days 10 days 14 days 21 days 28 days
0
10
20
30
40
50
60
70
80
90
100 Except largest cluster
Total hit rateD0
Web
2 min 5 min 15 min 30 min
0
10
20
30
40
50
60
70
80
90
100 Except largest clusterTotal hit rate
1 hour 4 hours 8 hours
010
20
30
40
50
60
70
8090
100 Except largest clusterTotal hit rate
Kazaa

15
Main Research Questions
What social information is relevant to distributed systems design?How to protect private information?How to use social information?What applications and services can benefit from social information?

Relevance to this Collaborative Class?Experience with interdisciplinary work
Communication (e.g., geodesic vs. shortest path)Field-specific problem-solving approach
High potential for more interesting research
By formulating more interesting questionsBy access to richer computational tools and expertise
Better learning (bigger project, real problems)Team work: can be highly productive – outcome bigger than the sum of the parts.
16

17