sociÉtÉ d’investissement À capital variable · avenue brigadeiro faria lima 3311, 5o andar,...
TRANSCRIPT

Franklin Templeton Investment FundsSOCIÉTÉ D’INVESTISSEMENT À CAPITAL VARIABLE
AuditedAnnual ReportJune 30, 2018
R.C.S. B35177


FRANKLIN TEMPLETON INVESTMENT FUNDSsociété d’investissement à capital variable
A U D I T E D A N N U A L R E P O RTF O R T H E Y E A R E N D E D J U N E 3 0 , 2 0 1 8
This report shall not constitute an offer or a solicitation of an offer to buy shares of Franklin Templeton Investment Funds (the “Company”).Subscriptions are to be made on the basis of the current prospectus and its addendum as the case may be, where available the relevant Key InvestorInformation Documents (“KIIDs”), a copy of the latest available audited annual report and, if published thereafter, the latest unaudited semi-annualreport.
The auditor’s report refers only to the full English version of the Annual Report and not to any translated versions.
This report is an abridged version of the report of the Company which is available free of charge upon request at the registered office of theCompany, at Franklin Templeton Investments’ local offices or distributors as stated in the current prospectus.


Contents
General Information 4The Board of Directors 7Report of the Investment Managers 10Audit Report 11Fund Performance 14Statement of Net Assets 16Statement of Operations and Changes in Net
Assets 32
Statistical Information 49Notes to the Financial Statements 67Additional Information - Unaudited 190Franklin Templeton Investments Office
Directory 200
FRANKLIN TEMPLETON INVESTMENT FUNDS
www.franklintempleton.lu Audited Annual Report 3

société d’investissement à capital variable8A, rue Albert Borschette, L-1246 Luxembourg, Grand Duchy of Luxembourg
(Registered with the registre de commerce et des sociétés, Luxembourg, under number B 35 177)
General Information (as at June 30, 2018)BOARD OF DIRECTORS:ChairmanGregory E. JohnsonChairman and Chief Executive OfficerFRANKLIN RESOURCES, INC.One Franklin ParkwaySan Mateo, CA 94403-1906, U.S.A.
DirectorsJed A. PlafkerPresident and Executive Managing DirectorFRANKLIN TEMPLETON INVESTMENTSOne Franklin ParkwaySan Mateo, CA 94403-1906, U.S.A.
Mark G. HoloweskoPresidentHOLOWESKO PARTNERS LTDShipston HouseP.O. Box N-7776, West Bay Street, Lyford Cay,Nassau, Bahamas
James J. K. HungPresident and Chief Executive OfficerASIA SECURITIES GLOBAL LTD2704, Block B, Parkway Court,No. 4 Parkway RoadHong Kong
Dr. J. B. Mark MobiusExecutive ChairmanTEMPLETON EMERGING MARKETS GROUP7 Temasek Boulevard, # 38-03 Suntec Tower OneSingapore 038987(date of resignation January 31, 2018)
The Honourable Trevor G. TrefgarneChairmanENTREPRISE GROUP LIMITED11 High StreetAccra, Ghana
William C. P. LockwoodIndependent DirectorPoste restante, Avenue du Général de GaulleF-57570 Cattenom, France
MANAGEMENT COMPANY:FRANKLIN TEMPLETON INTERNATIONAL SERVICES S.à r.l.8A, rue Albert Borschette, L-1246 LuxembourgGrand Duchy of Luxembourg
REGISTERED OFFICE:8A, rue Albert Borschette, L-1246 LuxembourgGrand Duchy of Luxembourg
PRINCIPAL DISTRIBUTOR:FRANKLIN TEMPLETON INTERNATIONAL SERVICES S.à r.l.8A, rue Albert Borschette, L-1246 LuxembourgGrand Duchy of Luxembourg
INVESTMENT MANAGERS:FRANKLIN ADVISERS, INC.One Franklin ParkwaySan Mateo, CA 94403-1906, U.S.A.
FASA, LLC (previously named FT ALPHAPARITY, LLC)One International Place, 25th FloorBoston, MA 02110, U.S.A.
FRANKLIN MUTUAL ADVISERS, LLC101 John F. Kennedy ParkwayShort Hills, NJ 07078-2789, U.S.A.
FRANKLIN TEMPLETON INSTITUTIONAL LLC280 Park Avenue,New York, NY 10017, U.S.A.
FRANKLIN TEMPLETON INVESTMENT MANAGEMENT LIMITEDCannon Place, 78 Cannon StreetLondon EC4N 6HL, United Kingdom
FRANKLIN TEMPLETON INVESTMENT TRUST MANAGEMENT CO. LIMITED12 Youido-dong, Youngdungpo-gu,Seoul, Korea
FRANKLIN TEMPLETON INVESTIMENTOS (Brasil) Ltda.Avenue Brigadeiro Faria Lima 3311, 5o andar,São Paulo 04538-133, Brazil
FRANKLIN TEMPLETON INVESTMENTS AUSTRALIA LIMITEDLevel 19, 101 Collins StreetMelbourne, VIC 3000, Australia
FRANKLIN TEMPLETON INVESTMENTS CORP.200 King Street West, Suite 1500,Toronto, Ontario M5H 3T4, Canada
K2/D&S MANAGEMENT CO., LLC300 Atlantic Street, 12th FloorStamford, CT 06901, U.S.A.
P/E GLOBAL LLC75 State Street, 31st Floor, BostonMA 02109, U.S.A.
CHILTON INVESTMENT COMPANY, LLC1290 East Main StreetStamford, CT 06902, U.S.A.
IMPALA ASSET MANAGEMENT LLC107 Cherry StreetNew Canaan, CT 06840, U.S.A.
JENNISON ASSOCIATES LLC466 Lexington AvenueNew York, NY 10017, U.S.A.
WELLINGTON MANAGEMENT COMPANY, LLP280 Congress StreetBoston, MA 02210, U.S.A.
P. SCHOENFELD ASSET MANAGEMENT L.P.1350 Avenue of the Americas, 21st FloorNew York, NY 10019, U.S.A.
EMSO ASSET MANAGEMENT LIMITEDIron Trades House, 21-14 Grosvenor PlaceLondon SW1X 7HF, United Kingdom
BASSO CAPITAL MANAGEMENT L.P.1266 East Main StreetStamford, CT 06902, U.S.A.
CHATHAM ASSET MANAGEMENT LLC26 Main Street, Suite 204Chatham, NJ 07928, U.S.A.
LAZARD ASSET MANAGEMENT LLC30 Rockfeller PlazaNew York, NY 10112, U.S.A.
LOOMIS SAYLES & COMPANY, L.P.One Financial Center, 27th FloorBoston, MA 02111, U.S.A.
GRAHAM CAPITAL MANAGEMENT L.P.40 Highland AvenueRowayton, CT 06853, U.S.A.
PORTLAND HILL ASSET MANAGEMENT LIMITED21 KnightsbridgeLondon SW1X 7LY, United Kingdom
ASPECT CAPITAL LIMITED10 Portman SquareLondon W1H 6AZ, United Kingdom
ELLINGTON GLOBAL ASSET MANAGEMENT, LLC53 Forest AvenueOld Greenwich, CT 06870, U.S.A.
APOLLO SA MANAGEMENT, LLC9 West 57th Street, Suite 4800New York, NY 10019, U.S.A.
LOGAN CIRCLE PARTNERS, L.P.1717 Arch Street, Suite 1500,Philadelphia, PA 19103, U.S.A
MEDALIST PARTNERS, L.P. (previously named CANDLEWOOD INVESTMENTGROUP, LP)555 Theodore Fremd, Suite C-303Rye, NY 10580, U.S.A.
HALCYON ARBITRAGE UCITS MANAGEMENT LP477 Madison Avenue, 8th FloorNew York, NY 10022, U.S.A.
FRANKLIN TEMPLETON INVESTMENTS (ME) LIMITEDThe Gate, East Wing, Level 2,Dubai International Financial Centre,P.O. Box 506613, Dubai, United Arab Emirates
SUMITOMO MITSUI ASSET MANAGEMENT COMPANY LIMITED2-5-1 Atago Minato-kuTokyo 105-6228, Japan
TEMPLETON ASSET MANAGEMENT LTD.7 Temasek Boulevard# 38-03 Suntec Tower OneSingapore 038987
TEMPLETON GLOBAL ADVISORS LIMITEDP.O. Box N-7759Lyford Cay, Nassau, Bahamas
TEMPLETON INVESTMENT COUNSEL, LLC300 S.E. 2nd StreetFort Lauderdale, FL 33301, U.S.A.
DEPOSITARY AND LISTING AGENTJ.P. Morgan Bank LUXEMBOURG S.A.European Bank and Business Centre6C Route de Trèves, L-2633 SenningerbergGrand Duchy of Luxembourg
AUDITOR:PRICEWATERHOUSECOOPERS, Société coopérative2, rue Gerhard Mercator, L-2182 LuxembourgGrand Duchy of Luxembourg
LEGAL ADVISERS:ELVINGER HOSS PRUSSEN, Société anonyme2, place Winston Churchill, L-1340 LuxembourgGrand Duchy of Luxembourg
FRANKLIN TEMPLETON INVESTMENT FUNDS
4 Audited Annual Report www.franklintempleton.lu
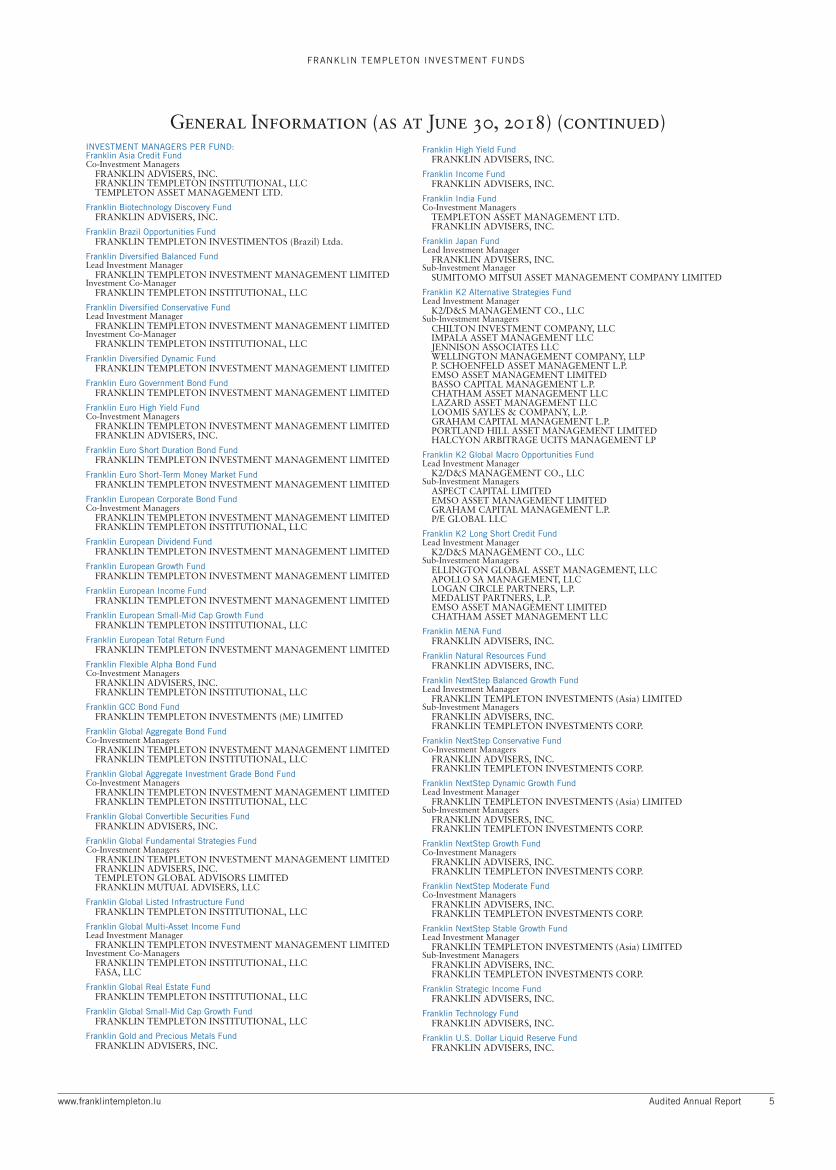
INVESTMENT MANAGERS PER FUND:Franklin Asia Credit FundCo-Investment Managers
FRANKLIN ADVISERS, INC.FRANKLIN TEMPLETON INSTITUTIONAL, LLCTEMPLETON ASSET MANAGEMENT LTD.
Franklin Biotechnology Discovery FundFRANKLIN ADVISERS, INC.
Franklin Brazil Opportunities FundFRANKLIN TEMPLETON INVESTIMENTOS (Brazil) Ltda.
Franklin Diversified Balanced FundLead Investment Manager
FRANKLIN TEMPLETON INVESTMENT MANAGEMENT LIMITEDInvestment Co-Manager
FRANKLIN TEMPLETON INSTITUTIONAL, LLC
Franklin Diversified Conservative FundLead Investment Manager
FRANKLIN TEMPLETON INVESTMENT MANAGEMENT LIMITEDInvestment Co-Manager
FRANKLIN TEMPLETON INSTITUTIONAL, LLC
Franklin Diversified Dynamic FundFRANKLIN TEMPLETON INVESTMENT MANAGEMENT LIMITED
Franklin Euro Government Bond FundFRANKLIN TEMPLETON INVESTMENT MANAGEMENT LIMITED
Franklin Euro High Yield FundCo-Investment Managers
FRANKLIN TEMPLETON INVESTMENT MANAGEMENT LIMITEDFRANKLIN ADVISERS, INC.
Franklin Euro Short Duration Bond FundFRANKLIN TEMPLETON INVESTMENT MANAGEMENT LIMITED
Franklin Euro Short-Term Money Market FundFRANKLIN TEMPLETON INVESTMENT MANAGEMENT LIMITED
Franklin European Corporate Bond FundCo-Investment Managers
FRANKLIN TEMPLETON INVESTMENT MANAGEMENT LIMITEDFRANKLIN TEMPLETON INSTITUTIONAL, LLC
Franklin European Dividend FundFRANKLIN TEMPLETON INVESTMENT MANAGEMENT LIMITED
Franklin European Growth FundFRANKLIN TEMPLETON INVESTMENT MANAGEMENT LIMITED
Franklin European Income FundFRANKLIN TEMPLETON INVESTMENT MANAGEMENT LIMITED
Franklin European Small-Mid Cap Growth FundFRANKLIN TEMPLETON INSTITUTIONAL, LLC
Franklin European Total Return FundFRANKLIN TEMPLETON INVESTMENT MANAGEMENT LIMITED
Franklin Flexible Alpha Bond FundCo-Investment Managers
FRANKLIN ADVISERS, INC.FRANKLIN TEMPLETON INSTITUTIONAL, LLC
Franklin GCC Bond FundFRANKLIN TEMPLETON INVESTMENTS (ME) LIMITED
Franklin Global Aggregate Bond FundCo-Investment Managers
FRANKLIN TEMPLETON INVESTMENT MANAGEMENT LIMITEDFRANKLIN TEMPLETON INSTITUTIONAL, LLC
Franklin Global Aggregate Investment Grade Bond FundCo-Investment Managers
FRANKLIN TEMPLETON INVESTMENT MANAGEMENT LIMITEDFRANKLIN TEMPLETON INSTITUTIONAL, LLC
Franklin Global Convertible Securities FundFRANKLIN ADVISERS, INC.
Franklin Global Fundamental Strategies FundCo-Investment Managers
FRANKLIN TEMPLETON INVESTMENT MANAGEMENT LIMITEDFRANKLIN ADVISERS, INC.TEMPLETON GLOBAL ADVISORS LIMITEDFRANKLIN MUTUAL ADVISERS, LLC
Franklin Global Listed Infrastructure FundFRANKLIN TEMPLETON INSTITUTIONAL, LLC
Franklin Global Multi-Asset Income FundLead Investment Manager
FRANKLIN TEMPLETON INVESTMENT MANAGEMENT LIMITEDInvestment Co-Managers
FRANKLIN TEMPLETON INSTITUTIONAL, LLCFASA, LLC
Franklin Global Real Estate FundFRANKLIN TEMPLETON INSTITUTIONAL, LLC
Franklin Global Small-Mid Cap Growth FundFRANKLIN TEMPLETON INSTITUTIONAL, LLC
Franklin Gold and Precious Metals FundFRANKLIN ADVISERS, INC.
Franklin High Yield FundFRANKLIN ADVISERS, INC.
Franklin Income FundFRANKLIN ADVISERS, INC.
Franklin India FundCo-Investment Managers
TEMPLETON ASSET MANAGEMENT LTD.FRANKLIN ADVISERS, INC.
Franklin Japan FundLead Investment Manager
FRANKLIN ADVISERS, INC.Sub-Investment Manager
SUMITOMO MITSUI ASSET MANAGEMENT COMPANY LIMITED
Franklin K2 Alternative Strategies FundLead Investment Manager
K2/D&S MANAGEMENT CO., LLCSub-Investment Managers
CHILTON INVESTMENT COMPANY, LLCIMPALA ASSET MANAGEMENT LLCJENNISON ASSOCIATES LLCWELLINGTON MANAGEMENT COMPANY, LLPP. SCHOENFELD ASSET MANAGEMENT L.P.EMSO ASSET MANAGEMENT LIMITEDBASSO CAPITAL MANAGEMENT L.P.CHATHAM ASSET MANAGEMENT LLCLAZARD ASSET MANAGEMENT LLCLOOMIS SAYLES & COMPANY, L.P.GRAHAM CAPITAL MANAGEMENT L.P.PORTLAND HILL ASSET MANAGEMENT LIMITEDHALCYON ARBITRAGE UCITS MANAGEMENT LP
Franklin K2 Global Macro Opportunities FundLead Investment Manager
K2/D&S MANAGEMENT CO., LLCSub-Investment Managers
ASPECT CAPITAL LIMITEDEMSO ASSET MANAGEMENT LIMITEDGRAHAM CAPITAL MANAGEMENT L.P.P/E GLOBAL LLC
Franklin K2 Long Short Credit FundLead Investment Manager
K2/D&S MANAGEMENT CO., LLCSub-Investment Managers
ELLINGTON GLOBAL ASSET MANAGEMENT, LLCAPOLLO SA MANAGEMENT, LLCLOGAN CIRCLE PARTNERS, L.P.MEDALIST PARTNERS, L.P.EMSO ASSET MANAGEMENT LIMITEDCHATHAM ASSET MANAGEMENT LLC
Franklin MENA FundFRANKLIN ADVISERS, INC.
Franklin Natural Resources FundFRANKLIN ADVISERS, INC.
Franklin NextStep Balanced Growth FundLead Investment Manager
FRANKLIN TEMPLETON INVESTMENTS (Asia) LIMITEDSub-Investment Managers
FRANKLIN ADVISERS, INC.FRANKLIN TEMPLETON INVESTMENTS CORP.
Franklin NextStep Conservative FundCo-Investment Managers
FRANKLIN ADVISERS, INC.FRANKLIN TEMPLETON INVESTMENTS CORP.
Franklin NextStep Dynamic Growth FundLead Investment Manager
FRANKLIN TEMPLETON INVESTMENTS (Asia) LIMITEDSub-Investment Managers
FRANKLIN ADVISERS, INC.FRANKLIN TEMPLETON INVESTMENTS CORP.
Franklin NextStep Growth FundCo-Investment Managers
FRANKLIN ADVISERS, INC.FRANKLIN TEMPLETON INVESTMENTS CORP.
Franklin NextStep Moderate FundCo-Investment Managers
FRANKLIN ADVISERS, INC.FRANKLIN TEMPLETON INVESTMENTS CORP.
Franklin NextStep Stable Growth FundLead Investment Manager
FRANKLIN TEMPLETON INVESTMENTS (Asia) LIMITEDSub-Investment Managers
FRANKLIN ADVISERS, INC.FRANKLIN TEMPLETON INVESTMENTS CORP.
Franklin Strategic Income FundFRANKLIN ADVISERS, INC.
Franklin Technology FundFRANKLIN ADVISERS, INC.
Franklin U.S. Dollar Liquid Reserve FundFRANKLIN ADVISERS, INC.
FRANKLIN TEMPLETON INVESTMENT FUNDS
General Information (as at June 30, 2018) (continued)
www.franklintempleton.lu Audited Annual Report 5
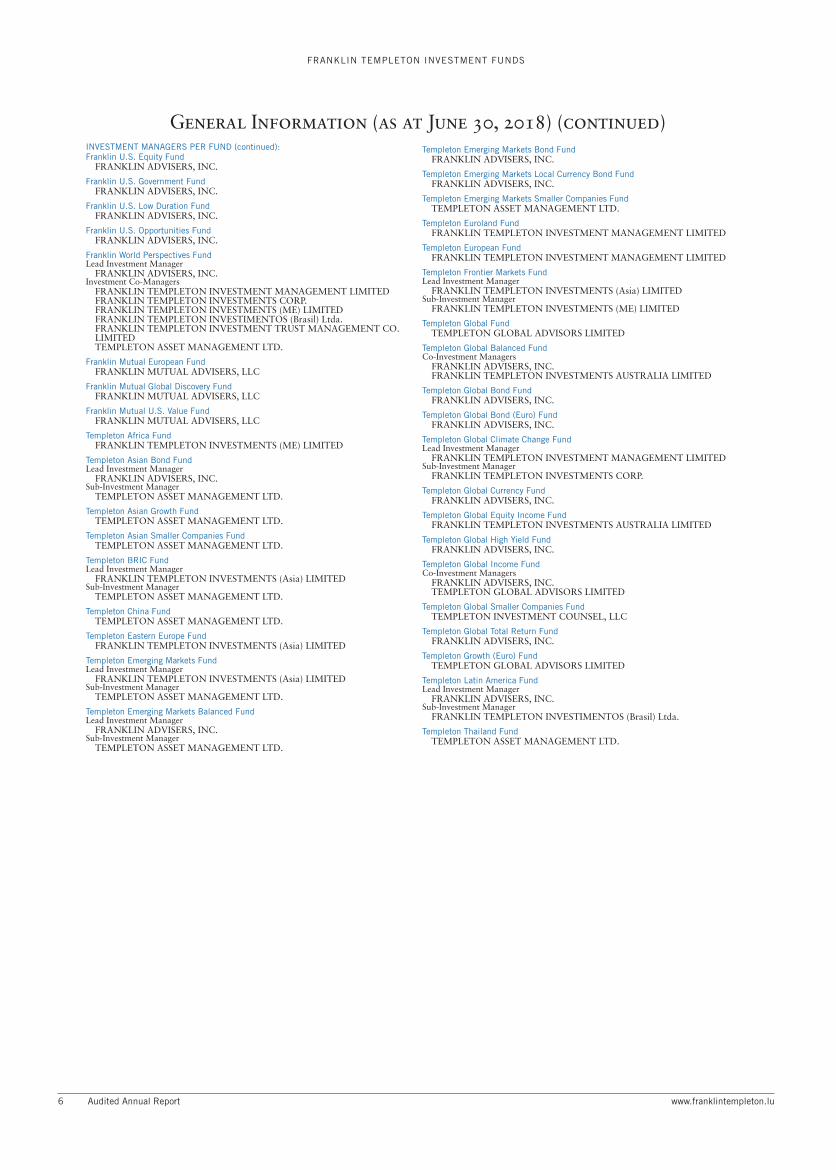
INVESTMENT MANAGERS PER FUND (continued):Franklin U.S. Equity Fund
FRANKLIN ADVISERS, INC.
Franklin U.S. Government FundFRANKLIN ADVISERS, INC.
Franklin U.S. Low Duration FundFRANKLIN ADVISERS, INC.
Franklin U.S. Opportunities FundFRANKLIN ADVISERS, INC.
Franklin World Perspectives FundLead Investment Manager
FRANKLIN ADVISERS, INC.Investment Co-Managers
FRANKLIN TEMPLETON INVESTMENT MANAGEMENT LIMITEDFRANKLIN TEMPLETON INVESTMENTS CORP.FRANKLIN TEMPLETON INVESTMENTS (ME) LIMITEDFRANKLIN TEMPLETON INVESTIMENTOS (Brasil) Ltda.FRANKLIN TEMPLETON INVESTMENT TRUST MANAGEMENT CO.LIMITEDTEMPLETON ASSET MANAGEMENT LTD.
Franklin Mutual European FundFRANKLIN MUTUAL ADVISERS, LLC
Franklin Mutual Global Discovery FundFRANKLIN MUTUAL ADVISERS, LLC
Franklin Mutual U.S. Value FundFRANKLIN MUTUAL ADVISERS, LLC
Templeton Africa FundFRANKLIN TEMPLETON INVESTMENTS (ME) LIMITED
Templeton Asian Bond FundLead Investment Manager
FRANKLIN ADVISERS, INC.Sub-Investment Manager
TEMPLETON ASSET MANAGEMENT LTD.
Templeton Asian Growth FundTEMPLETON ASSET MANAGEMENT LTD.
Templeton Asian Smaller Companies FundTEMPLETON ASSET MANAGEMENT LTD.
Templeton BRIC FundLead Investment Manager
FRANKLIN TEMPLETON INVESTMENTS (Asia) LIMITEDSub-Investment Manager
TEMPLETON ASSET MANAGEMENT LTD.
Templeton China FundTEMPLETON ASSET MANAGEMENT LTD.
Templeton Eastern Europe FundFRANKLIN TEMPLETON INVESTMENTS (Asia) LIMITED
Templeton Emerging Markets FundLead Investment Manager
FRANKLIN TEMPLETON INVESTMENTS (Asia) LIMITEDSub-Investment Manager
TEMPLETON ASSET MANAGEMENT LTD.
Templeton Emerging Markets Balanced FundLead Investment Manager
FRANKLIN ADVISERS, INC.Sub-Investment Manager
TEMPLETON ASSET MANAGEMENT LTD.
Templeton Emerging Markets Bond FundFRANKLIN ADVISERS, INC.
Templeton Emerging Markets Local Currency Bond FundFRANKLIN ADVISERS, INC.
Templeton Emerging Markets Smaller Companies FundTEMPLETON ASSET MANAGEMENT LTD.
Templeton Euroland FundFRANKLIN TEMPLETON INVESTMENT MANAGEMENT LIMITED
Templeton European FundFRANKLIN TEMPLETON INVESTMENT MANAGEMENT LIMITED
Templeton Frontier Markets FundLead Investment Manager
FRANKLIN TEMPLETON INVESTMENTS (Asia) LIMITEDSub-Investment Manager
FRANKLIN TEMPLETON INVESTMENTS (ME) LIMITED
Templeton Global FundTEMPLETON GLOBAL ADVISORS LIMITED
Templeton Global Balanced FundCo-Investment Managers
FRANKLIN ADVISERS, INC.FRANKLIN TEMPLETON INVESTMENTS AUSTRALIA LIMITED
Templeton Global Bond FundFRANKLIN ADVISERS, INC.
Templeton Global Bond (Euro) FundFRANKLIN ADVISERS, INC.
Templeton Global Climate Change FundLead Investment Manager
FRANKLIN TEMPLETON INVESTMENT MANAGEMENT LIMITEDSub-Investment Manager
FRANKLIN TEMPLETON INVESTMENTS CORP.
Templeton Global Currency FundFRANKLIN ADVISERS, INC.
Templeton Global Equity Income FundFRANKLIN TEMPLETON INVESTMENTS AUSTRALIA LIMITED
Templeton Global High Yield FundFRANKLIN ADVISERS, INC.
Templeton Global Income FundCo-Investment Managers
FRANKLIN ADVISERS, INC.TEMPLETON GLOBAL ADVISORS LIMITED
Templeton Global Smaller Companies FundTEMPLETON INVESTMENT COUNSEL, LLC
Templeton Global Total Return FundFRANKLIN ADVISERS, INC.
Templeton Growth (Euro) FundTEMPLETON GLOBAL ADVISORS LIMITED
Templeton Latin America FundLead Investment Manager
FRANKLIN ADVISERS, INC.Sub-Investment Manager
FRANKLIN TEMPLETON INVESTIMENTOS (Brasil) Ltda.
Templeton Thailand FundTEMPLETON ASSET MANAGEMENT LTD.
FRANKLIN TEMPLETON INVESTMENT FUNDS
General Information (as at June 30, 2018) (continued)
6 Audited Annual Report www.franklintempleton.lu

Report of the Board of DirectorsAt 30 June 2018 Franklin Templeton Investment Funds (“FTIF”, or the “Company”) had assets under management ofUSD101.98 billion, down from USD106.34 billion a year earlier.
The financial year was marked by the continued expansion of the range and depth of the Company’s offer, as detailed below. Formore information on these events, please refer to Note 1.
Fund LaunchesTempleton Emerging Markets Local Currency Bond Fund launched on February 20, 2018
Fund closuresTempleton Asian Dividend Fund closed on October 25, 2017
The following Funds closed on December 12, 2017:
Franklin European Fund
Franklin Real Return Fund
Templeton ASEAN Fund
Templeton Korea Fund closed on May 25, 2018
Fund Mergers
On October 20, 2017, Franklin Global High Income Bond Fund was merged into Franklin High Yield Fund
On November 3, 2017, Franklin U.S. Small-Mid Cap Growth Fund was merged into Franklin U.S. Opportunities Fund
On January 19, 2018, Franklin Global Growth Fund and Franklin Global Equity Strategies Fund were merged intoFranklin World Perspectives Fund.
The Company will continue to make changes to the range of sub-funds when this is in the best interest of investors. We remaincommitted to retaining investment techniques that have been shown, over time, to increase shareholder value.
For the full list of share classes offered as at June 30, 2018, please refer to the Statistical Information section.
Corporate GovernanceThe Company is committed to high standards of corporate governance. The Board of Directors of the Company (the “Board”)adheres to the principles of the ALFI Code of Conduct (as revised – June 2013) and considers that it has been in compliance withits principles throughout the financial year ended June 30, 2018.
Thank you for investing with Franklin Templeton Investments. Please be advised that the prospectus, the Key InvestorInformation Documents (KIIDs) and all Funds and share classes of FTIF may not be available in your jurisdiction.
If you have any queries, comments or suggestions about your investments with us please contact your financial adviser or yourlocal Franklin Templeton Investments office using the contact details on the last page of the report.
THE BOARD OF DIRECTORSLuxembourg, July 2018
FRANKLIN TEMPLETON INVESTMENT FUNDS
The Board of Directors
www.franklintempleton.lu Audited Annual Report 7

The Board
ChairmanGregory E. JohnsonGregory Johnson (57) was appointed to the Board on November 28, 2003. He is Chairman, President and Chief Executive Officerof Franklin Resources, Inc. and serves on the Board of Directors. He is also President of Templeton Worldwide, Inc., ChiefExecutive Officer and President of Templeton International, Inc. and serves as a Director for a number of subsidiaries of FranklinResources, Inc. He is a member of a number of Franklin Templeton’s International Fund Boards. Mr. Johnson joined Franklin in1986 after working as a senior accountant for Coopers & Lybrand. He has served as President and Chairman of the Board forFranklin Templeton Distributors, Inc., President of Franklin Investment Advisory, LLC, President of FT Trust Company, VicePresident of Franklin Advisers, Inc., co-portfolio manager of Franklin Income Fund and Franklin Utilities Fund and as aninvestment analyst.
DirectorsMark G. HoloweskoMark Holowesko (58) was appointed to the Board on November 30, 1994. Mark Holowesko is the founding Partner and ChiefExecutive Officer of Holowesko Partners Ltd (HPL). Mark launched the firm in the fall of 2000, under the name of TempletonCapital Advisors, to serve the needs of institutional and high-net-worth investors. Subsequently renamed Holowesko Partners,under Mark’s leadership HPL has enjoyed steady and consistent growth and now stands as one of the premier global equity hedgefirms in the industry.
Mark’s investment career began in 1985 when he joined Templeton Global Advisors as a research analyst. By 1987, he hadassumed the day-to-day management of all portfolios previously managed by Sir John Templeton, including the TempletonGrowth Fund and the Templeton Foreign Fund. In 1989, Mark became the Director of Research of the Templeton Global EquityFunds and later, in 1996, assumed the role of Chief Investment Officer.
Mark served as a member of the Executive Committee of Templeton, Galbraith & Hansberger from 1987 to 1992 and as amember of the Executive Committee of Franklin Resources from 1992 to 2000. Mark was Director, President & Head ofInvestments of Templeton Global Advisors Ltd. from 1992 to 2000.
Currently, Mark is Chairman of the Investment Committee of First Trust Bank, an offshore entity responsible for managing theassets of two of Sir John Templeton’s Foundations.
James J. K. HungJames Hung (71) was appointed to the Board on November 29, 2002. He is the Chairman and Chief Executive Officer (“CEO”)of Xinya Investment Group, China, a real estate development and investment group in Mainland China, Hong Kong and Taiwan.He is also a Director and major shareholder of Security Bank in the Philippines and the Director of Franklin Templeton FundManagement Company in Shanghai, a joint venture of Franklin Templeton and the Sealand Securities Company, China. Hisprevious experience includes working for Asia Securities Inc. (Taiwan) as the Chairman and CEO. He has also previously been theDirector of Yi-Min Fund Management Co., (China), H&Q Venture Capital Inc. (Taiwan), Taiwan Index Fund Inc. (Luxembourg)and Vietnam Fund Inc. (Guernsey).
Dr. J. B. Mark MobiusDr. Mark Mobius, Ph.D. (82) was appointed to the Board at inception. He is Executive Chairman of Templeton EmergingMarkets Group, currently directs analysts based in Templeton’s 18 emerging markets offices and manages the emerging marketsportfolios. Dr. Mobius has spent more than 40 years working in emerging markets all over the world. He joined FranklinTempleton Investments in 1987 as president of the Templeton Emerging Markets Fund, Inc. Dr.Mobius was named by Asiamoneymagazine in 2006 as one of their “Top 100 Most Powerful and Influential People.” Asiamoney said, he “...boasts one of thehighest profiles of any investor in the region and is regarded by many in the financial industry as one of the most successfulemerging markets investors over the last 20 years. Despite tough times during the financial crisis nine years ago, he still commandsa strong following in the investment world and is influencing the direction of billions of investment dollars.” Other awardsinclude: (1) “2010 Africa Investor Index Series Awards” by African Investor, (2) “Emerging Markets Equity Manager of the Year2001” by International MoneyMarketing, (3) “Ten Top MoneyManagers of the 20th Century” in a survey by the Carson Groupin 1999, (4) “Number One Global Emerging Market Fund” in the 1998 Reuters Survey, (5) “1994 First in Business MoneyManager of the Year” by CNBC, (6) “Closed-End Fund Manager of the Year” in 1993 by Morningstar and, (7) “Investment TrustManager of the Year 1992” by Sunday Telegraph.
Dr.Mobius is also the author of the following books: Trading with China, The Investor’s Guide to EmergingMarkets, Mobius onEmerging Markets, Passport to Profits, Equities – An Introduction to the Core Concepts, Mutual Funds – An Introduction to theCore Concepts, Foreign Exchange – An Introduction to the Core Concepts, Bonds – An Introduction to the Core Concepts, MarkMobius – An Illustrated Biography and The Little Book of Emerging Markets.
Dr. J.B Mark Mobius has announced his plans to retire from Franklin Templeton, effective January 31, 2018. In that perspective,Dr. J.B Mark Mobius resigned from the Board of Directors on January 31, 2018.
The Honourable Trevor G. TrefgarneThe Honourable Trevor Trefgarne (74) was appointed to the Board of Franklin Templeton Investment Funds on November 29,2002. He is Chairman of Enterprise Group Limited, Ghana, and has been Director of a number of U.K. listed investment fundsincluding Templeton Emerging Markets Investment Trust, Recovery Trust (Chairman) and Gartmore High Income Trust. He hasextensive experience of the management of listed companies in the U.K. and Africa.
Jed A. PlafkerMr. Plafker (47) was appointed to the Board of Franklin Templeton Investment Funds on April 13, 2017. He is currently servingas the president of Franklin Templeton International. In this capacity, he is responsible for the international sales and marketingfunction. He also serves as a director of various Franklin Templeton corporate and investment entities as well as the ICI GlobalSteering Committee. Mr. Plafker joined Franklin Templeton Investments in 1994, as an attorney in Franklin Templeton’s
FRANKLIN TEMPLETON INVESTMENT FUNDS
The Board of Directors (continued)
8 Audited Annual Report www.franklintempleton.lu

The Board (continued)
Jed A. Plafker (continued)corporate legal department. In January 1998, Mr. Plafker joined the international legal team as a vice president covering legalissues around the world. In May 2000, he moved to Franklin Templeton’s Hong Kong office to become chief legal counsel, Asia,where he had responsibility for all legal issues effecting Franklin Templeton’s Asia business, products and people.
In April 2001, Mr. Plafker took on the role of country head in Hong Kong where he ran the sales and marketing operations forHong Kong while continuing in his role as chief legal counsel for Asia. In July 2002, he became managing director of FranklinTempleton Alternative Strategies. In January 2003, Mr. Plafker relocated to London to become one of five managing directors ofFranklin Templeton’s International Retail Group where he was responsible for overseeing the sales and marketing of all FranklinTempleton products in Africa, Middle East and parts of Europe including the UK, Spain, Switzerland and various Nordiccountries. In June 2005, Mr. Plafker relocated to Franklin Templeton�s headquarters in the United States.
Mr. Plafker earned a B.A. in economics and business from Lafayette College in Easton, Pennsylvania and a Juris Doctorate fromthe University of Miami in Coral Gables, Florida.
William C. P. LockwoodWilliam Lockwood (62) was appointed to the Board of Franklin Templeton Investment Funds on December 1, 2014. He joinedFranklin Templeton in 1992 and served as General Manager of the Franklin Templeton Luxembourg subsidiary and FranklinTempleton Investment Funds until December 2005. From December 2005 until January 2014, he was Conducting Officer ofFranklin Templeton Investment Funds and of Franklin Templeton International Services S.à r.l. subsequently. The ConductingOfficer role was a management, oversight and governance role under the EU UCITS legislation reporting directly to the Board ofFranklin Templeton Investment Funds. Mr Lockwood has been working in the financial services industry in Luxembourg since1982. He is a Scottish Chartered Accountant and a Member of the Chartered Institute for Securities & Investment, London. Hehas served as a director and international vice chairman of the Luxembourg Fund Industry Association (ALFI) and as a councilmember of the Institute of Chartered Accountants of Scotland.
FRANKLIN TEMPLETON INVESTMENT FUNDS
The Board of Directors (continued)
www.franklintempleton.lu Audited Annual Report 9

During the twelve months ended 30 June 2018, the synchronised global growth story gained momentum over the first sevenmonths of the period, as financial markets appeared to focus attention on encouraging economic data from several developed andemerging markets as well as tax reform in the United States. However, later in the period, intensifying trade tensions and theirpotential to slow global economic growth restrained sentiment. Concerns also arose that global growth was becoming lesssynchronised: While the US economy looked resilient, parts of Asia, Latin America and Europe faced various challenges.
Upbeat economic data from Europe was a key theme for the region early in the reporting period and helped drive strong stockperformance in 2017’s third quarter. However, beginning in the fourth quarter, European equity markets struggled to maintaintheir upward momentum. Optimism early in the period gave way to worries about how US trade policy would affect the region.Political developments in Germany, Italy and Spain sparked apprehension at times, but these concerns appeared to be shrugged offfairly quickly. Investors also parsed changes in monetary policy, as the Bank of England in November hiked its benchmark interestrate for the first time in 10 years and the European Central Bank (ECB) extended its bond-buying programme, while reducing thevalue of monthly purchases. In June 2018, the ECB announced it intends to end its quantitative easing program by year-end andexpects to keep interest rates on hold at least through the summer of 2019. Europe’s gross domestic product (GDP) in third-quarter 2017 grew on the previous quarter and year-on-year in both the euro area and the European Union (EU), but deceleratedsomewhat by first-quarter 2018. Both EU and eurozone unemployment rates continued edging down to the lowest readings since2008. The United Kingdom’s GDP growth moderated during the period, with the first-quarter 2018 reading of 1.2% year-on-yearat the lowest pace since 2012. The country’s unemployment rate eased to a 42-year low in February and held steady through April.
In the United States, markets mostly shrugged off a dangerous and costly US hurricane season and tensions around North Korea’snuclear ambitions. Sentiment was bolstered by global economic growth momentum early in the period, ongoing strength incorporate earnings, upbeat business sentiment and Congressional passage of tax reform that featured a significant reduction in thecorporate tax rate. Third-quarter GDP came in ahead of consensus estimates and marked the first increase of at least 3% inconsecutive quarters since 2014. Data ranging from the labour market to consumer patterns and confidence suggested the USeconomy ended 2017 on a strong note despite a mixture of hurricane-induced effects that were evident in vehicle, retail and homesales, as well as in energy markets and non-core inflationary measures. First-quarter 2018 GDP slowed by comparison, but theeconomy appeared to bounce back in subsequent months as spending by consumers, businesses and the government gainedmomentum. The US Federal Reserve (Fed) lifted its 2018 GDP guidance as it raised its target range for the federal funds rate inJune by 25 basis points, the second rate increase in 2018. Faster growth helped drive the US unemployment rate to an 18-year lowin May.
The global commodities complex rallied in the first half of the reporting period, with most commodities showing strong upwardprice moves. Despite occasional bouts of selling throughout the spring of 2018, crude oil prices reached their highest level in morethan three years by the end of second-quarter 2018 amidst looming threats to global supply, even as major oil producers decidedto lift their production quotas at the June meeting of OPEC (Organization of the Petroleum Exporting Countries). The US dollarwas another key support: Dollar-denominated commodities became less expensive for overseas buyers as the trade-weighted valueof US currency declined over much of the period. After stumbling in early 2018, commodities continued rallying through lateMay. At that point, many non-energy securities began to sell off in response to widening threats by the United States ofcommodity-focused tariffs against China and several other key trading partners, which were immediately met with tit-for-tatcounter-tariff announcements. A sharp rise in the US dollar towards the end of the period also began to hinder the appeal ofdollar-denominated commodities for non-US buyers. While the energy sector was primarily influenced by the supply-sidedynamics described above, metals and mining stocks were impacted more so by trade tensions and their potential to slow globaleconomic growth.
By mid-2018, the wave of optimism last year as eurozone growth exceeded consensus expectations and France avoided a populistelection victory has been replaced by concerns about Italian political risk and the ECB’s ability to normalise monetary policyamidst weaker economic indicators. We believe that in all likelihood the recent Italian drama has done little more than push outECB interest-rate hikes a few months and take some air out of the euro—not necessarily adverse developments for an export-oriented trading bloc accustomed to expansive monetary policy. In the United States, we expect corporate earnings to continue tobe supported by US-led global economic growth, business spending and expanding manufacturing activity. We believe stillhistorically low interest rates, monetary accommodation, reduced regulation, and fiscal stimulus can provide tailwinds. However,as we began the latter half of 2018, previously synchronised global economic growth showed some signs of deceleration aspockets of Europe, Asia and Latin America produced what many perceived to be lukewarm economic data. Key potentialheadwinds include rising US interest rates (from Fed tightening and long-term market driven rates); rising inflation underpinnedby energy prices; geopolitical uncertainty in many regions; and the emergence of US-led trade protectionism.
THE INVESTMENT MANAGERSJune, 2018
FRANKLIN TEMPLETON INVESTMENT FUNDS
Report of the Investment Managers - Year to June 30, 2018
The information stated in this report represents historical data and is not an indication of future results.
10 Audited Annual Report www.franklintempleton.lu

Audit report
To the Shareholders of
Franklin Templeton Investment Funds
Our opinion
In our opinion, the accompanying financial statements give a true and fair view of the financial position of FranklinTempleton Investment Funds and of each of its sub-funds (the “Company”) as at June 30, 2018, and of the results oftheir operations and changes in their net assets for the year then ended in accordance with Luxembourg legal andregulatory requirements relating to the preparation and presentation of the financial statements.
What we have audited
The Company’s financial statements comprise:• the Statement of Net Assets as at June 30, 2018;• the Schedule of Investments as at June 30, 2018;• the Statement of Operations and Changes in Net Assets for the year then ended; and• the Notes to the Financial Statements, which include a summary of significant accounting policies.
Basis for opinion
We conducted our audit in accordance with the Law of July 23, 2016 on the audit profession (Law of July 23, 2016)and with International Standards on Auditing (ISAs) as adopted for Luxembourg by the “Commission de Surveillancedu Secteur Financier” (CSSF). Our responsibilities under those Law and standards are further described in the“Responsibilities of the “Réviseur d’entreprises agréé” for the audit of the financial statements” section of our report.
We believe that the audit evidence we have obtained is sufficient and appropriate to provide a basis for our opinion.
We are independent of the Company in accordance with the International Ethics Standards Board for Accountants’Code of Ethics for Professional Accountants (IESBA Code) as adopted for Luxembourg by the CSSF together with theethical requirements that are relevant to our audit of the financial statements. We have fulfilled our other ethicalresponsibilities under those ethical requirements.
Other information
The Board of Directors of the Company is responsible for the other information. The other information comprises theinformation stated in the annual report but does not include the financial statements and our audit report thereon.
Our opinion on the financial statements does not cover the other information and we do not express any form ofassurance conclusion thereon.
In connection with our audit of the financial statements, our responsibility is to read the other information identifiedabove and, in doing so, consider whether the other information is materially inconsistent with the financial statementsor our knowledge obtained in the audit, or otherwise appears to be materially misstated. If, based on the work we haveperformed, we conclude that there is a material misstatement of this other information, we are required to report thatfact. We have nothing to report in this regard.
Responsibilities of the Board of Directors of the Company
The Board of Directors of the Company is responsible for the preparation and fair presentation of the financialstatements in accordance with Luxembourg legal and regulatory requirements relating to the preparation andpresentation of the financial statements, and for such internal control as the Board of Directors of the Companydetermines is necessary to enable the preparation of financial statements that are free from material misstatement,whether due to fraud or error.
In preparing the financial statements, the Board of Directors of the Company is responsible for assessing theCompany’s ability to continue as a going concern, disclosing, as applicable, matters related to going concern and usingthe going concern basis of accounting unless the Board of Directors of the Company either intends to liquidate theCompany or to cease operations, or has no realistic alternative but to do so.
PricewaterhouseCoopers, Société coopérative, 2 rue Gerhard Mercator, B.P. 1443, L-1014 LuxembourgT: +352 494848 1, F:+352 494848 2900, www.pwc.lu
Cabinet de révision agréé. Expert-comptable (autorisation gouvernementale n°10028256)R.C.S. Luxembourg B 65 477 –TVA LU25482518
11
Responsibilities of the “Réviseur d’entreprises agréé” for the audit of the financial statements
The objectives of our audit are to obtain reasonable assurance about whether the financial statements as a whole arefree from material misstatement, whether due to fraud or error, and to issue an audit report that includes our opinion.Reasonable assurance is a high level of assurance, but is not a guarantee that an audit conducted in accordance with theLaw of July 23, 2016 and with ISAs as adopted for Luxembourg by the CSSF will always detect a materialmisstatement when it exists. Misstatements can arise from fraud or error and are considered material if, individually orin the aggregate, they could reasonably be expected to influence the economic decisions of users taken on the basis ofthese financial statements.
As part of an audit in accordance with the Law of July 23, 2016 and with ISAs as adopted for Luxembourg by theCSSF, we exercise professional judgment and maintain professional scepticism throughout the audit.
We also:• identify and assess the risks of material misstatement of the financial statements, whether due to fraud or error,
design and perform audit procedures responsive to those risks, and obtain audit evidence that is sufficient andappropriate to provide a basis for our opinion. The risk of not detecting a material misstatement resulting fromfraud is higher than for one resulting from error, as fraud may involve collusion, forgery, intentional omissions,misrepresentations, or the override of internal control;
• obtain an understanding of internal control relevant to the audit in order to design audit procedures that areappropriate in the circumstances, but not for the purpose of expressing an opinion on the effectiveness of theCompany’s internal control;
• evaluate the appropriateness of accounting policies used and the reasonableness of accounting estimates and relateddisclosures made by the Board of Directors of the Company;
• conclude on the appropriateness of the Board of Directors of the Company’s use of the going concern basis ofaccounting and, based on the audit evidence obtained, whether a material uncertainty exists related to events orconditions that may cast significant doubt on the Company’s ability to continue as a going concern. If we concludethat a material uncertainty exists, we are required to draw attention in our audit report to the related disclosures inthe financial statements or, if such disclosures are inadequate, to modify our opinion. Our conclusions are based onthe audit evidence obtained up to the date of our audit report. However, future events or conditions may cause theCompany to cease to continue as a going concern;
• evaluate the overall presentation, structure and content of the financial statements, including the disclosures, andwhether the financial statements represent the underlying transactions and events in a manner that achieves fairpresentation.
We communicate with those charged with governance regarding, among other matters, the planned scope and timingof the audit and significant audit findings, including any significant deficiencies in internal control that we identifyduring our audit.
PricewaterhouseCoopers, Société coopérative Luxembourg, October 12, 2018Represented by
Emmanuel Chataignier
12

FRANKLIN TEMPLETON INVESTMENT FUNDS
THIS PAGE LEFT BLANK INTENTIONALLY
www.franklintempleton.lu Audited Annual Report 13
ReferenceShareClass
LaunchDate
6Months
%
1Year%
3YearsΩ
%
5YearsΩ
%
10YearsΩ
%
SinceLaunchΩ
%
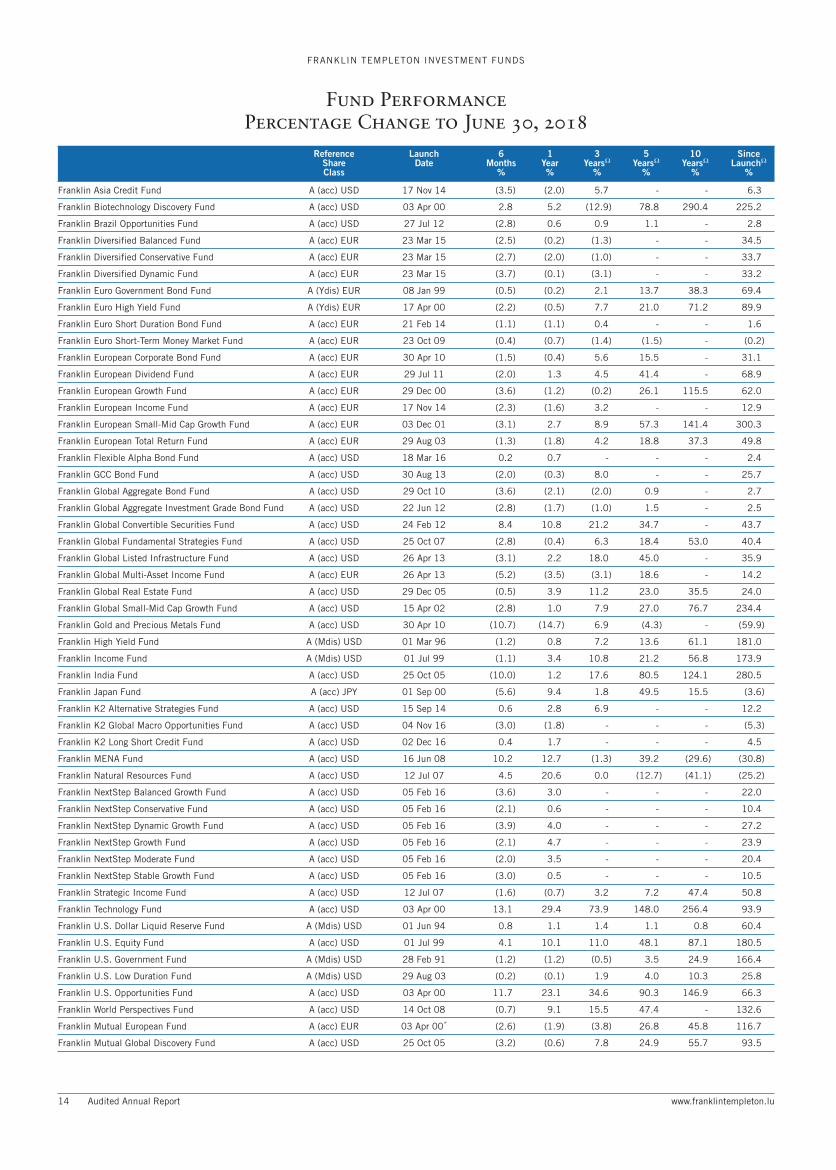
Franklin Asia Credit Fund A (acc) USD 17 Nov 14 (3.5) (2.0) 5.7 - - 6.3
Franklin Biotechnology Discovery Fund A (acc) USD 03 Apr 00 2.8 5.2 (12.9) 78.8 290.4 225.2
Franklin Brazil Opportunities Fund A (acc) USD 27 Jul 12 (2.8) 0.6 0.9 1.1 - 2.8
Franklin Diversified Balanced Fund A (acc) EUR 23 Mar 15 (2.5) (0.2) (1.3) - - 34.5
Franklin Diversified Conservative Fund A (acc) EUR 23 Mar 15 (2.7) (2.0) (1.0) - - 33.7
Franklin Diversified Dynamic Fund A (acc) EUR 23 Mar 15 (3.7) (0.1) (3.1) - - 33.2
Franklin Euro Government Bond Fund A (Ydis) EUR 08 Jan 99 (0.5) (0.2) 2.1 13.7 38.3 69.4
Franklin Euro High Yield Fund A (Ydis) EUR 17 Apr 00 (2.2) (0.5) 7.7 21.0 71.2 89.9
Franklin Euro Short Duration Bond Fund A (acc) EUR 21 Feb 14 (1.1) (1.1) 0.4 - - 1.6
Franklin Euro Short-Term Money Market Fund A (acc) EUR 23 Oct 09 (0.4) (0.7) (1.4) (1.5) - (0.2)
Franklin European Corporate Bond Fund A (acc) EUR 30 Apr 10 (1.5) (0.4) 5.6 15.5 - 31.1
Franklin European Dividend Fund A (acc) EUR 29 Jul 11 (2.0) 1.3 4.5 41.4 - 68.9
Franklin European Growth Fund A (acc) EUR 29 Dec 00 (3.6) (1.2) (0.2) 26.1 115.5 62.0
Franklin European Income Fund A (acc) EUR 17 Nov 14 (2.3) (1.6) 3.2 - - 12.9
Franklin European Small-Mid Cap Growth Fund A (acc) EUR 03 Dec 01 (3.1) 2.7 8.9 57.3 141.4 300.3
Franklin European Total Return Fund A (acc) EUR 29 Aug 03 (1.3) (1.8) 4.2 18.8 37.3 49.8
Franklin Flexible Alpha Bond Fund A (acc) USD 18 Mar 16 0.2 0.7 - - - 2.4
Franklin GCC Bond Fund A (acc) USD 30 Aug 13 (2.0) (0.3) 8.0 - - 25.7
Franklin Global Aggregate Bond Fund A (acc) USD 29 Oct 10 (3.6) (2.1) (2.0) 0.9 - 2.7
Franklin Global Aggregate Investment Grade Bond Fund A (acc) USD 22 Jun 12 (2.8) (1.7) (1.0) 1.5 - 2.5
Franklin Global Convertible Securities Fund A (acc) USD 24 Feb 12 8.4 10.8 21.2 34.7 - 43.7
Franklin Global Fundamental Strategies Fund A (acc) USD 25 Oct 07 (2.8) (0.4) 6.3 18.4 53.0 40.4
Franklin Global Listed Infrastructure Fund A (acc) USD 26 Apr 13 (3.1) 2.2 18.0 45.0 - 35.9
Franklin Global Multi-Asset Income Fund A (acc) EUR 26 Apr 13 (5.2) (3.5) (3.1) 18.6 - 14.2
Franklin Global Real Estate Fund A (acc) USD 29 Dec 05 (0.5) 3.9 11.2 23.0 35.5 24.0
Franklin Global Small-Mid Cap Growth Fund A (acc) USD 15 Apr 02 (2.8) 1.0 7.9 27.0 76.7 234.4
Franklin Gold and Precious Metals Fund A (acc) USD 30 Apr 10 (10.7) (14.7) 6.9 (4.3) - (59.9)
Franklin High Yield Fund A (Mdis) USD 01 Mar 96 (1.2) 0.8 7.2 13.6 61.1 181.0
Franklin Income Fund A (Mdis) USD 01 Jul 99 (1.1) 3.4 10.8 21.2 56.8 173.9
Franklin India Fund A (acc) USD 25 Oct 05 (10.0) 1.2 17.6 80.5 124.1 280.5
Franklin Japan Fund A (acc) JPY 01 Sep 00 (5.6) 9.4 1.8 49.5 15.5 (3.6)
Franklin K2 Alternative Strategies Fund A (acc) USD 15 Sep 14 0.6 2.8 6.9 - - 12.2
Franklin K2 Global Macro Opportunities Fund A (acc) USD 04 Nov 16 (3.0) (1.8) - - - (5.3)
Franklin K2 Long Short Credit Fund A (acc) USD 02 Dec 16 0.4 1.7 - - - 4.5
Franklin MENA Fund A (acc) USD 16 Jun 08 10.2 12.7 (1.3) 39.2 (29.6) (30.8)
Franklin Natural Resources Fund A (acc) USD 12 Jul 07 4.5 20.6 0.0 (12.7) (41.1) (25.2)
Franklin NextStep Balanced Growth Fund A (acc) USD 05 Feb 16 (3.6) 3.0 - - - 22.0
Franklin NextStep Conservative Fund A (acc) USD 05 Feb 16 (2.1) 0.6 - - - 10.4
Franklin NextStep Dynamic Growth Fund A (acc) USD 05 Feb 16 (3.9) 4.0 - - - 27.2
Franklin NextStep Growth Fund A (acc) USD 05 Feb 16 (2.1) 4.7 - - - 23.9
Franklin NextStep Moderate Fund A (acc) USD 05 Feb 16 (2.0) 3.5 - - - 20.4
Franklin NextStep Stable Growth Fund A (acc) USD 05 Feb 16 (3.0) 0.5 - - - 10.5
Franklin Strategic Income Fund A (acc) USD 12 Jul 07 (1.6) (0.7) 3.2 7.2 47.4 50.8
Franklin Technology Fund A (acc) USD 03 Apr 00 13.1 29.4 73.9 148.0 256.4 93.9
Franklin U.S. Dollar Liquid Reserve Fund A (Mdis) USD 01 Jun 94 0.8 1.1 1.4 1.1 0.8 60.4
Franklin U.S. Equity Fund A (acc) USD 01 Jul 99 4.1 10.1 11.0 48.1 87.1 180.5
Franklin U.S. Government Fund A (Mdis) USD 28 Feb 91 (1.2) (1.2) (0.5) 3.5 24.9 166.4
Franklin U.S. Low Duration Fund A (Mdis) USD 29 Aug 03 (0.2) (0.1) 1.9 4.0 10.3 25.8
Franklin U.S. Opportunities Fund A (acc) USD 03 Apr 00 11.7 23.1 34.6 90.3 146.9 66.3
Franklin World Perspectives Fund A (acc) USD 14 Oct 08 (0.7) 9.1 15.5 47.4 - 132.6
Franklin Mutual European Fund A (acc) EUR 03 Apr 00* (2.6) (1.9) (3.8) 26.8 45.8 116.7
Franklin Mutual Global Discovery Fund A (acc) USD 25 Oct 05 (3.2) (0.6) 7.8 24.9 55.7 93.5
FRANKLIN TEMPLETON INVESTMENT FUNDS
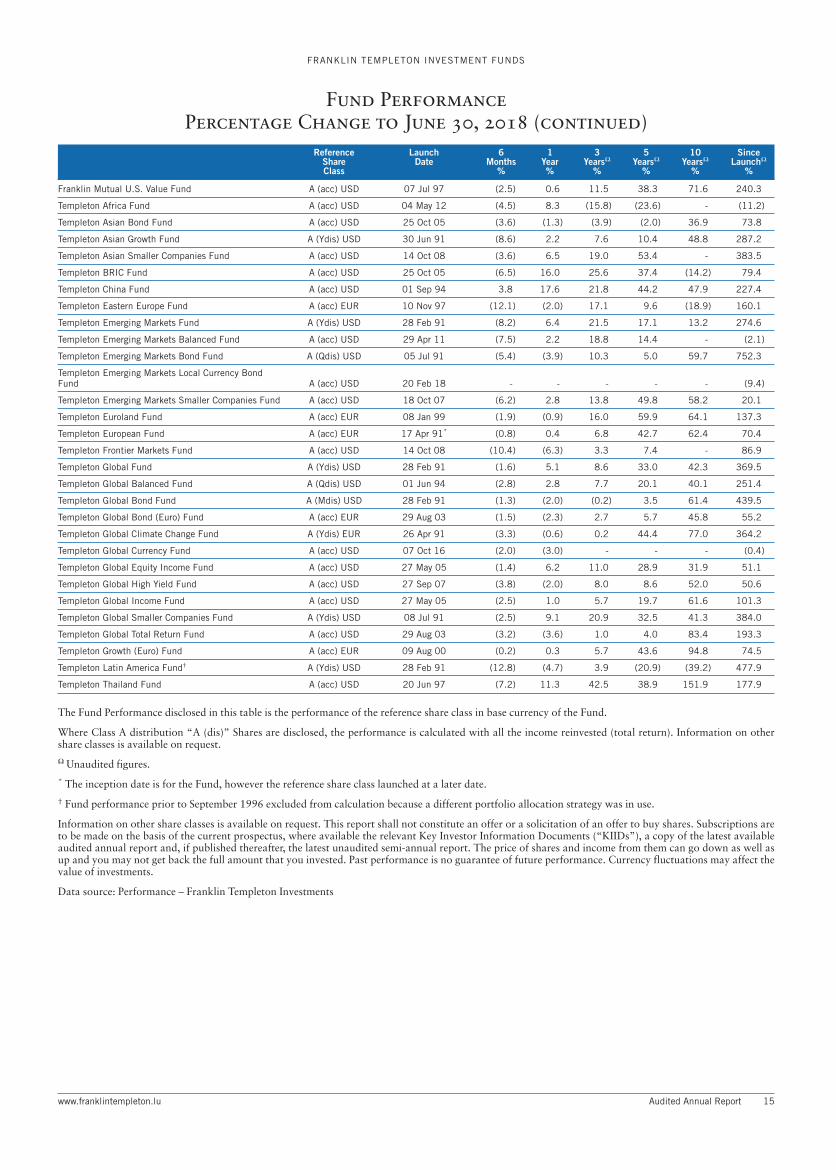
Fund PerformancePercentage Change to June 30, 2018
14 Audited Annual Report www.franklintempleton.lu
ReferenceShareClass
LaunchDate
6Months
%
1Year%
3YearsΩ
%
5YearsΩ
%
10YearsΩ
%
SinceLaunchΩ
%
Franklin Mutual U.S. Value Fund A (acc) USD 07 Jul 97 (2.5) 0.6 11.5 38.3 71.6 240.3
Templeton Africa Fund A (acc) USD 04 May 12 (4.5) 8.3 (15.8) (23.6) - (11.2)
Templeton Asian Bond Fund A (acc) USD 25 Oct 05 (3.6) (1.3) (3.9) (2.0) 36.9 73.8
Templeton Asian Growth Fund A (Ydis) USD 30 Jun 91 (8.6) 2.2 7.6 10.4 48.8 287.2
Templeton Asian Smaller Companies Fund A (acc) USD 14 Oct 08 (3.6) 6.5 19.0 53.4 - 383.5
Templeton BRIC Fund A (acc) USD 25 Oct 05 (6.5) 16.0 25.6 37.4 (14.2) 79.4
Templeton China Fund A (acc) USD 01 Sep 94 3.8 17.6 21.8 44.2 47.9 227.4
Templeton Eastern Europe Fund A (acc) EUR 10 Nov 97 (12.1) (2.0) 17.1 9.6 (18.9) 160.1
Templeton Emerging Markets Fund A (Ydis) USD 28 Feb 91 (8.2) 6.4 21.5 17.1 13.2 274.6
Templeton Emerging Markets Balanced Fund A (acc) USD 29 Apr 11 (7.5) 2.2 18.8 14.4 - (2.1)
Templeton Emerging Markets Bond Fund A (Qdis) USD 05 Jul 91 (5.4) (3.9) 10.3 5.0 59.7 752.3
Templeton Emerging Markets Local Currency BondFund A (acc) USD 20 Feb 18 - - - - - (9.4)
Templeton Emerging Markets Smaller Companies Fund A (acc) USD 18 Oct 07 (6.2) 2.8 13.8 49.8 58.2 20.1
Templeton Euroland Fund A (acc) EUR 08 Jan 99 (1.9) (0.9) 16.0 59.9 64.1 137.3
Templeton European Fund A (acc) EUR 17 Apr 91* (0.8) 0.4 6.8 42.7 62.4 70.4
Templeton Frontier Markets Fund A (acc) USD 14 Oct 08 (10.4) (6.3) 3.3 7.4 - 86.9
Templeton Global Fund A (Ydis) USD 28 Feb 91 (1.6) 5.1 8.6 33.0 42.3 369.5
Templeton Global Balanced Fund A (Qdis) USD 01 Jun 94 (2.8) 2.8 7.7 20.1 40.1 251.4
Templeton Global Bond Fund A (Mdis) USD 28 Feb 91 (1.3) (2.0) (0.2) 3.5 61.4 439.5
Templeton Global Bond (Euro) Fund A (acc) EUR 29 Aug 03 (1.5) (2.3) 2.7 5.7 45.8 55.2
Templeton Global Climate Change Fund A (Ydis) EUR 26 Apr 91 (3.3) (0.6) 0.2 44.4 77.0 364.2
Templeton Global Currency Fund A (acc) USD 07 Oct 16 (2.0) (3.0) - - - (0.4)
Templeton Global Equity Income Fund A (acc) USD 27 May 05 (1.4) 6.2 11.0 28.9 31.9 51.1
Templeton Global High Yield Fund A (acc) USD 27 Sep 07 (3.8) (2.0) 8.0 8.6 52.0 50.6
Templeton Global Income Fund A (acc) USD 27 May 05 (2.5) 1.0 5.7 19.7 61.6 101.3
Templeton Global Smaller Companies Fund A (Ydis) USD 08 Jul 91 (2.5) 9.1 20.9 32.5 41.3 384.0
Templeton Global Total Return Fund A (acc) USD 29 Aug 03 (3.2) (3.6) 1.0 4.0 83.4 193.3
Templeton Growth (Euro) Fund A (acc) EUR 09 Aug 00 (0.2) 0.3 5.7 43.6 94.8 74.5
Templeton Latin America Fund† A (Ydis) USD 28 Feb 91 (12.8) (4.7) 3.9 (20.9) (39.2) 477.9
Templeton Thailand Fund A (acc) USD 20 Jun 97 (7.2) 11.3 42.5 38.9 151.9 177.9
The Fund Performance disclosed in this table is the performance of the reference share class in base currency of the Fund.
Where Class A distribution “A (dis)” Shares are disclosed, the performance is calculated with all the income reinvested (total return). Information on othershare classes is available on request.
Ω Unaudited figures.
* The inception date is for the Fund, however the reference share class launched at a later date.
† Fund performance prior to September 1996 excluded from calculation because a different portfolio allocation strategy was in use.
Information on other share classes is available on request. This report shall not constitute an offer or a solicitation of an offer to buy shares. Subscriptions areto be made on the basis of the current prospectus, where available the relevant Key Investor Information Documents (“KIIDs”), a copy of the latest availableaudited annual report and, if published thereafter, the latest unaudited semi-annual report. The price of shares and income from them can go down as well asup and you may not get back the full amount that you invested. Past performance is no guarantee of future performance. Currency fluctuations may affect thevalue of investments.
Data source: Performance – Franklin Templeton Investments
FRANKLIN TEMPLETON INVESTMENT FUNDS
Fund PerformancePercentage Change to June 30, 2018 (continued)
www.franklintempleton.lu Audited Annual Report 15

Total FranklinAsia
CreditFund
FranklinBiotechnology
DiscoveryFund
FranklinBrazil
OpportunitiesFund
(USD) (USD) (USD) (USD)
ASSETSInvestment in securities at market value (notes 2(b), 3) 95,517,664,460 8,390,846 2,169,329,148 23,147,437Cash 2,987,027,353 47,252 21,148,440 1,402,250Time deposits (note 4) 1,113,832,247 - - -Amounts receivable on sale of investments 1,871,263,557 - 5,133,344 194,983Amounts receivable on subscriptions 349,846,309 - 12,161,582 56,820Interest and dividends receivable, net 878,282,292 97,762 357,301 513,871Unrealised profit on forward foreign exchange contracts (notes 2(c), 5) 630,070,503 - - 28,804Unrealised profit on financial future contracts (notes 2(d), 6) 2,074,375 - - 131,077Unrealised profit on interest rate swap contracts (notes 2(e), 7) 97,964,743 - - -Unrealised profit on inflation swap contracts (notes 2(f), 8) 659,968 - - 88,424Unrealised profit on cross currency swap contracts (notes 2(g), 9) 351,725 - - -Unrealised profit on total return swap contracts (notes 2(h), 10) 11,218,767 - - -Credit default swap contracts at market value (notes 2(j), 12) 728,947 - - -Option contracts at market value (notes 2(k), 13) 8,357,767 - - -Investment in mortgage dollar rolls at market value (notes 2(m), 14) 74,044,415 - - -Other receivables 50,717,330 - - -TOTAL ASSETS 103,594,104,758 8,535,860 2,208,129,815 25,563,666
LIABILITIESAmounts payable on purchases of investments 657,858,141 - - 74,098Amounts payable on purchases of mortgage dollar rolls (note 2(m)) 74,148,353 - - -Amounts payable on redemptions 413,158,222 - 19,187,899 13,454Investment management fees payable (note 16) 76,186,891 4,999 1,828,829 21,240Bank overdraft 2,235,412 - - -Unrealised loss on forward foreign exchange contracts (notes 2(c), 5) 40,397,458 76,109 213,594 -Unrealised loss on financial future contracts (notes 2(d), 6) 5,248,314 - - -Unrealised loss on interest rate swap contracts (notes 2(e), 7) 131,569,349 - - -Unrealised loss on inflation swap contracts (notes 2(f), 8) 248,217 - - -Unrealised loss on cross currency swap contracts (notes 2(g), 9) 7,188 - - -Unrealised loss on total return swap contracts (notes 2(h), 10) 733,514 - - -Credit default swap contracts at market value (notes 2(j), 12) 8,287,187 - - -Option contracts at market value (notes 2(k), 13) 279,638 - - -Taxes and expenses payable 201,137,794 8,856 1,685,476 141,910TOTAL LIABILITIES 1,611,495,678 89,964 22,915,798 250,702
TOTAL NET ASSETS 101,982,609,080 8,445,896 2,185,214,017 25,312,964
THREE YEAR ASSET SUMMARYJune 30, 2017 106,341,225,772 8,920,119 2,408,642,311 28,894,121June 30, 2016 104,023,441,025 8,597,799 2,038,926,588 21,737,459June 30, 2015 145,217,443,597 7,893,010 3,124,463,500 25,695,821
FRANKLIN TEMPLETON INVESTMENT FUNDS
Statement of Net Assetsat June 30, 2018
The accompanying notes form an integral part of these financial statements
16 Audited Annual Report www.franklintempleton.lu

FranklinDiversifiedBalanced
Fund
FranklinDiversified
ConservativeFund
FranklinDiversified
DynamicFund
FranklinEuro
GovernmentBond Fund
FranklinEuro
High YieldFund
FranklinEuro
Short DurationBond Fund
Franklin EuroShort-Term
Money MarketFund
(EUR) (EUR) (EUR) (EUR) (EUR) (EUR) (EUR)
240,757,574 292,401,601 119,526,304 48,507,148 553,130,055 132,022,755 87,084,27533,805,056 67,010,317 18,808,026 521,010 35,413,339 4,479,138 15,443,503
- - - - - - -1,271,257 1,718,215 671,992 - 5,352,289 - -
176,006 373,241 882,231 111 627,823 216,736 2971,246,521 1,875,257 381,293 313,512 7,440,500 1,197,407 9,145
- - - - 754,705 - -- - - - - - -- - - - - - -- - - - - - -- - - - - - -- - 17,924 - - - -- - - - - - -
937,016 659,045 615,088 - - - -- - - - - - -
97,303 191,753 41,913 1,216 - 10,849 19,240278,290,733 364,229,429 140,944,771 49,342,997 602,718,711 137,926,885 102,556,460
3,363,442 4,424,058 1,731,209 - 10,610,677 - -- - - - - - -
101,567 2,041,533 387,817 50,891 2,081,187 329,567 159,573157,781 207,084 91,528 13,530 381,884 23,885 19,814
- - - - - - -1,494,262 1,095,774 842,627 - - 20,270 -
15,605 3,895 137,958 233,067 - 386,050 -- - - - - - -- - - - - - -- - - - - - -
85,559 88,845 - - - - -103,990 200,797 79,478 - - - -
- - - - - - -197,881 242,743 164,699 48,604 521,470 54,645 87,504
5,520,087 8,304,729 3,435,316 346,092 13,595,218 814,417 266,891
272,770,646 355,924,700 137,509,455 48,996,905 589,123,493 137,112,468 102,289,569
212,716,472 305,343,335 86,613,579 90,465,722 727,071,302 79,066,843 118,230,964127,631,180 145,567,427 69,274,995 140,926,194 838,271,805 74,491,380 153,098,075107,850,940 37,946,832 65,867,006 184,877,343 997,997,060 65,830,876 65,615,272
FRANKLIN TEMPLETON INVESTMENT FUNDS
Statement of Net Assetsat June 30, 2018 (continued)
The accompanying notes form an integral part of these financial statements
www.franklintempleton.lu Audited Annual Report 17

FranklinEuropeanCorporate
Bond Fund
FranklinEuropeanDividend
Fund
FranklinEuropean
GrowthFund
FranklinEuropean
IncomeFund
(EUR) (EUR) (EUR) (EUR)
ASSETSInvestment in securities at market value (notes 2(b), 3) 73,551,767 106,119,565 382,919,325 20,056,558Cash 492,707 762,654 13,859,726 1,027,417Time deposits (note 4) - - - -Amounts receivable on sale of investments 619,828 - - -Amounts receivable on subscriptions 80,218 554,425 91,666 495Interest and dividends receivable, net 663,172 188,947 484,909 86,880Unrealised profit on forward foreign exchange contracts (notes 2(c), 5) - - 402,098 -Unrealised profit on financial future contracts (notes 2(d), 6) - - - -Unrealised profit on interest rate swap contracts (notes 2(e), 7) - - - -Unrealised profit on inflation swap contracts (notes 2(f), 8) - - - -Unrealised profit on cross currency swap contracts (notes 2(g), 9) - - - -Unrealised profit on total return swap contracts (notes 2(h), 10) - - - -Credit default swap contracts at market value (notes 2(j), 12) - - - -Option contracts at market value (notes 2(k), 13) - - - -Investment in mortgage dollar rolls at market value (notes 2(m), 14) - - - -Other receivables 565 476,064 2,097,929 28,681TOTAL ASSETS 75,408,257 108,101,655 399,855,653 21,200,031
LIABILITIESAmounts payable on purchases of investments 800,000 - 528 -Amounts payable on purchases of mortgage dollar rolls (note 2(m)) - - - -Amounts payable on redemptions 486,104 136,814 1,343,480 53,738Investment management fees payable (note 16) 26,073 82,244 321,886 14,015Bank overdraft - - - -Unrealised loss on forward foreign exchange contracts (notes 2(c), 5) 38,848 226,596 - 14,829Unrealised loss on financial future contracts (notes 2(d), 6) 92,590 - - -Unrealised loss on interest rate swap contracts (notes 2(e), 7) - - - -Unrealised loss on inflation swap contracts (notes 2(f), 8) - - - -Unrealised loss on cross currency swap contracts (notes 2(g), 9) - - - -Unrealised loss on total return swap contracts (notes 2(h), 10) - - - -Credit default swap contracts at market value (notes 2(j), 12) - - - -Option contracts at market value (notes 2(k), 13) - - - -Taxes and expenses payable 58,787 88,327 376,849 22,745TOTAL LIABILITIES 1,502,402 533,981 2,042,743 105,327
TOTAL NET ASSETS 73,905,855 107,567,674 397,812,910 21,094,704
THREE YEAR ASSET SUMMARYJune 30, 2017 104,153,323 152,193,195 736,996,088 17,654,854June 30, 2016 178,315,684 132,881,905 686,207,149 19,112,302June 30, 2015 178,736,104 143,512,949 1,100,842,764 10,018,756
FRANKLIN TEMPLETON INVESTMENT FUNDS
Statement of Net Assetsat June 30, 2018 (continued)
The accompanying notes form an integral part of these financial statements
18 Audited Annual Report www.franklintempleton.lu

FranklinEuropean
Small-Mid CapGrowth Fund
FranklinEuropean
Total ReturnFund
FranklinFlexible
Alpha BondFund
FranklinGCC
BondFund
FranklinGlobal
AggregateBond Fund
FranklinGlobal Aggregate
Investment GradeBond Fund
FranklinGlobal
ConvertibleSecurities Fund
(EUR) (EUR) (USD) (USD) (USD) (USD) (USD)
420,364,766 461,592,297 588,757,317 84,663,522 86,572,563 9,268,029 201,516,62316,316,876 19,841,060 21,692,821 165,564 3,470,269 640,526 1,125,207
- - - 1,100,000 - - -3,081 - 24,562,739 56 2,565,912 770,001 5,830,000
1,536,290 712,061 41,811 3,509 36,761 - 4,887,342738,562 3,982,525 4,860,117 1,073,173 973,829 93,283 641,516
1,436 137,068 - 159,160 - 7,299 491,215- - 411,615 - - - -- 31,617 334,711 - - - -- - 317,298 - - - -- - 351,725 - - - -- - 359,377 - - - -- - - - - - -- - 264,703 - - - -- - - - - - -
3,258,506 27,169 60,294 - 2,587 2,994 2,064442,219,517 486,323,797 642,014,528 87,164,984 93,621,921 10,782,132 214,493,967
3,128,726 8,904,930 4,986,937 - 1,730,651 133,241 6,121,853- - - - - - -
3,001,708 1,380,319 30,795 300,734 234,047 - 1,174,939319,067 147,090 84,993 42,165 16,003 3,753 113,012
- - - - - - -- - 3,738,816 - 422,537 - -- 2,948,839 - - - - -- - - - - - -- - - - - - -- - - - - - -- - - - - - -- - 3,672,530 - - - -- - - - - - -
296,582 335,735 74,405 26,723 31,607 15,241 121,5476,746,083 13,716,913 12,588,476 369,622 2,434,845 152,235 7,531,351
435,473,434 472,606,884 629,426,052 86,795,362 91,187,076 10,629,897 206,962,616
512,480,130 550,100,840 341,435,113 56,209,469 89,242,077 11,580,371 109,204,730630,857,606 342,927,026 310,655,006 47,711,986 81,204,083 103,518,562 75,977,729876,145,528 393,693,632 - 24,292,751 27,871,987 25,387,004 129,931,327
FRANKLIN TEMPLETON INVESTMENT FUNDS
Statement of Net Assetsat June 30, 2018 (continued)
The accompanying notes form an integral part of these financial statements
www.franklintempleton.lu Audited Annual Report 19

FranklinGlobal
FundamentalStrategies Fund
FranklinGlobal ListedInfrastructure
Fund
FranklinGlobal
Multi-AssetIncome Fund
FranklinGlobal
Real EstateFund
(USD) (USD) (EUR) (USD)
ASSETSInvestment in securities at market value (notes 2(b), 3) 1,709,941,418 80,329,910 291,193,578 201,252,032Cash 59,570,815 101,661 33,475,495 149,426Time deposits (note 4) - 480,000 - 1,400,000Amounts receivable on sale of investments 159,350,054 888,187 1,560,654 2,660,827Amounts receivable on subscriptions 1,104,754 155,302 879,430 120,246Interest and dividends receivable, net 10,595,209 268,841 1,812,013 999,868Unrealised profit on forward foreign exchange contracts (notes 2(c), 5) 14,574,331 - - 103,706Unrealised profit on financial future contracts (notes 2(d), 6) - - - -Unrealised profit on interest rate swap contracts (notes 2(e), 7) 6,771,217 - - -Unrealised profit on inflation swap contracts (notes 2(f), 8) - - - -Unrealised profit on cross currency swap contracts (notes 2(g), 9) - - - -Unrealised profit on total return swap contracts (notes 2(h), 10) - - - -Credit default swap contracts at market value (notes 2(j), 12) - - - -Option contracts at market value (notes 2(k), 13) - - 1,023,189 -Investment in mortgage dollar rolls at market value (notes 2(m), 14) - - - -Other receivables 1,044,579 70,410 149,612 33,785TOTAL ASSETS 1,962,952,377 82,294,311 330,093,971 206,719,890
LIABILITIESAmounts payable on purchases of investments 3,423,061 278,223 4,117,432 706,683Amounts payable on purchases of mortgage dollar rolls (note 2(m)) - - - -Amounts payable on redemptions 1,867,160 965,751 920,813 2,431,693Investment management fees payable (note 16) 1,615,921 45,291 217,090 152,588Bank overdraft - - - -Unrealised loss on forward foreign exchange contracts (notes 2(c), 5) - 12,994 1,710,873 -Unrealised loss on financial future contracts (notes 2(d), 6) - - 231,299 -Unrealised loss on interest rate swap contracts (notes 2(e), 7) - - - -Unrealised loss on inflation swap contracts (notes 2(f), 8) - - - -Unrealised loss on cross currency swap contracts (notes 2(g), 9) - - - -Unrealised loss on total return swap contracts (notes 2(h), 10) - - 307,931 -Credit default swap contracts at market value (notes 2(j), 12) - - 279,757 -Option contracts at market value (notes 2(k), 13) - - - -Taxes and expenses payable 2,281,709 38,182 254,410 207,604TOTAL LIABILITIES 9,187,851 1,340,441 8,039,605 3,498,568
TOTAL NET ASSETS 1,953,764,526 80,953,870 322,054,366 203,221,322
THREE YEAR ASSET SUMMARYJune 30, 2017 2,050,664,897 69,873,407 339,752,720 251,611,501June 30, 2016 1,785,550,418 60,542,687 135,211,370 342,101,642June 30, 2015 2,048,746,912 16,089,112 113,038,100 420,504,662
FRANKLIN TEMPLETON INVESTMENT FUNDS
Statement of Net Assetsat June 30, 2018 (continued)
The accompanying notes form an integral part of these financial statements
20 Audited Annual Report www.franklintempleton.lu

FranklinGlobal
Small-Mid CapGrowth Fund
FranklinGold andPrecious
Metals Fund
FranklinHighYieldFund
FranklinIncome
Fund
FranklinIndiaFund
FranklinJapanFund
Franklin K2AlternativeStrategies
Fund(USD) (USD) (USD) (USD) (USD) (JPY) (USD)
110,797,779 213,989,264 1,851,253,884 1,614,246,163 3,255,685,529 26,064,187,480 1,458,133,572101,464 438,753 7,835,223 11,998,439 4,016,082 - 356,838,202150,000 - - - 63,800,000 - 579,445,200555,634 2,393,188 55,427,090 65,433,873 6,913,191 2,408,836,242 32,695,158
81,569 544,266 2,363,452 5,944,996 3,111,398 50,598,855 23,756,15944,737 1,415 29,698,080 11,084,888 2,927,037 91,728,982 6,111,352
- 103,637 - 240,824 - 3,195,062 -- - - - - - 1,420,120- - - - - - 363,931- - - - - - -- - - - - - -- - - - - - 8,726,067- - - - - - 707,769- - - - - - 4,181,268- - - - - - -
1,032,503 - - 257,785 - 227 499,213112,763,686 217,470,523 1,946,577,729 1,709,206,968 3,336,453,237 28,618,546,848 2,472,878,011
609,021 15 1,825,988 29,650,504 - 1,124,243,654 31,728,687- - - - - - -
478,692 1,037,051 4,848,654 6,619,978 13,547,784 396,859,380 8,782,61193,981 179,021 1,275,698 1,168,052 2,423,122 19,031,553 3,501,503
- - - - - 117,101,350 -- - 626,566 - 1,415,772 - 16,483,017- - - - - - -- - - - - - -- - - - - - 215,305- - - - - - -- - - - - - -- - - - - - -- - - 270,832 - - -
118,082 212,361 2,122,665 1,747,108 12,963,311 23,899,591 1,234,2611,299,776 1,428,448 10,699,571 39,456,474 30,349,989 1,681,135,528 61,945,384
111,463,910 216,042,075 1,935,878,158 1,669,750,494 3,306,103,248 26,937,411,320 2,410,932,627
163,701,065 250,181,745 2,466,883,234 2,200,863,666 4,279,578,096 32,561,977,383 1,320,092,754200,170,691 245,152,174 2,648,362,272 2,413,536,952 3,238,697,682 26,519,107,459 1,084,826,827269,532,373 87,533,596 3,608,241,809 3,479,311,991 3,921,704,369 35,556,151,923 632,360,045
FRANKLIN TEMPLETON INVESTMENT FUNDS
Statement of Net Assetsat June 30, 2018 (continued)
The accompanying notes form an integral part of these financial statements
www.franklintempleton.lu Audited Annual Report 21

Franklin K2Global MacroOpportunites
Fund
FranklinK2 Long Short
CreditFund
FranklinMENAFund
FranklinNatural
ResourcesFund
(USD) (USD) (USD) (USD)
ASSETSInvestment in securities at market value (notes 2(b), 3) 3,088,852 71,523,560 137,681,466 337,724,611Cash 7,218,449 6,137,596 365,373 2,249,700Time deposits (note 4) 14,822,400 19,962,600 - -Amounts receivable on sale of investments - 425,692 337,282 11,528,252Amounts receivable on subscriptions - 437,349 753,914 6,509,903Interest and dividends receivable, net 31,305 704,958 204,214 324,596Unrealised profit on forward foreign exchange contracts (notes 2(c), 5) - - - -Unrealised profit on financial future contracts (notes 2(d), 6) 111,563 - - -Unrealised profit on interest rate swap contracts (notes 2(e), 7) 16,592 108,383 - -Unrealised profit on inflation swap contracts (notes 2(f), 8) - - - -Unrealised profit on cross currency swap contracts (notes 2(g), 9) - - - -Unrealised profit on total return swap contracts (notes 2(h), 10) - - - -Credit default swap contracts at market value (notes 2(j), 12) 21,178 - - -Option contracts at market value (notes 2(k), 13) - 132,956 - -Investment in mortgage dollar rolls at market value (notes 2(m), 14) - - - -Other receivables 12,603 70,174 11 26,646TOTAL ASSETS 25,322,942 99,503,268 139,342,260 358,363,708
LIABILITIESAmounts payable on purchases of investments 129,287 692,548 7,442 3,033,104Amounts payable on purchases of mortgage dollar rolls (note 2(m)) - - - -Amounts payable on redemptions - 57,690 521,069 2,441,342Investment management fees payable (note 16) 38,045 144,143 156,675 279,540Bank overdraft - - - -Unrealised loss on forward foreign exchange contracts (notes 2(c), 5) 55,038 257,733 118,576 291,370Unrealised loss on financial future contracts (notes 2(d), 6) - 5,731 - -Unrealised loss on interest rate swap contracts (notes 2(e), 7) - - - -Unrealised loss on inflation swap contracts (notes 2(f), 8) 11,018 21,894 - -Unrealised loss on cross currency swap contracts (notes 2(g), 9) - - - -Unrealised loss on total return swap contracts (notes 2(h), 10) - 169,978 - -Credit default swap contracts at market value (notes 2(j), 12) - 217,378 - -Option contracts at market value (notes 2(k), 13) - - - -Taxes and expenses payable 101,753 129,204 151,775 341,854TOTAL LIABILITIES 335,141 1,696,299 955,537 6,387,210
TOTAL NET ASSETS 24,987,801 97,806,969 138,386,723 351,976,498
THREE YEAR ASSET SUMMARYJune 30, 2017 25,215,832 73,961,073 86,705,941 357,146,962June 30, 2016 - - 95,875,802 301,524,049June 30, 2015 - - 209,097,880 274,683,455
FRANKLIN TEMPLETON INVESTMENT FUNDS
Statement of Net Assetsat June 30, 2018 (continued)
The accompanying notes form an integral part of these financial statements
22 Audited Annual Report www.franklintempleton.lu

FranklinNextStep
Balanced GrowthFund
FranklinNextStep
ConservativeFund
FranklinNextStep
Dynamic GrowthFund
FranklinNextStep
GrowthFund
FranklinNextStepModerate
Fund
FranklinNextStep
Stable GrowthFund
FranklinStrategic
IncomeFund
(USD) (USD) (USD) (USD) (USD) (USD) (USD)
252,129,245 37,011,804 59,966,928 25,094,927 75,338,911 21,491,167 805,558,128113,443 176,733 106,624 101,279 784,334 108,734 28,924,328
6,000,000 1,100,000 960,000 390,000 1,100,000 640,000 -715,512 89 415,587 20 254 123,686 204,494,382290,487 362,001 31,791 1,500,463 336,060 346,500 1,103,517
- - - - - - 8,395,222- - - - - - 3,186,357- - - - - - -- - - - - - -- - - - - - -- - - - - - -- - - - - - 1,413,270- - - - - - -- - - - - - -- - - - - - 74,044,416- 2,786 - 1,488 4,577 803 247,738
259,248,687 38,653,413 61,480,930 27,088,177 77,564,136 22,710,890 1,127,367,358
45,450 155,592 19 - 211,168 295,991 80,865,533- - - - - - 74,148,354
1,263,216 413,511 538,020 25,578 617,020 170,815 3,556,691186,767 23,719 46,126 20,128 55,975 14,940 542,370
- - - - - - -16,194 206,411 33,519 30,927 1,037,731 39,972 -
- - - - - - 219,097- - - - - - -- - - - - - -- - - - - - 3,921- - - - - - -- - - - - - 2,096,263- - - - - - -
153,994 28,761 57,178 27,191 58,099 20,162 909,3001,665,621 827,994 674,862 103,824 1,979,993 541,880 162,341,529
257,583,066 37,825,419 60,806,068 26,984,353 75,584,143 22,169,010 965,025,829
141,120,021 22,235,224 31,624,652 14,170,474 39,419,097 19,876,634 1,123,520,9549,828,108 7,141,045 4,497,653 3,376,470 8,501,020 6,077,952 1,179,933,357
- - - - - - 1,877,416,845
FRANKLIN TEMPLETON INVESTMENT FUNDS
Statement of Net Assetsat June 30, 2018 (continued)
The accompanying notes form an integral part of these financial statements
www.franklintempleton.lu Audited Annual Report 23

FranklinTechnology
Fund
FranklinU.S. Dollar
Liquid ReserveFund
FranklinU.S.
EquityFund
FranklinU.S.
GovernmentFund
(USD) (USD) (USD) (USD)
ASSETSInvestment in securities at market value (notes 2(b), 3) 2,545,958,447 275,000,714 410,032,720 610,393,873Cash 53,617,331 1,517 1,750,051 2,114,827Time deposits (note 4) - - - -Amounts receivable on sale of investments - 54,310,000 9,100,243 11,020,000Amounts receivable on subscriptions 49,669,368 5,534,828 877,214 4,464,082Interest and dividends receivable, net 1,790,583 208,616 136,994 2,068,719Unrealised profit on forward foreign exchange contracts (notes 2(c), 5) - - 76,244 -Unrealised profit on financial future contracts (notes 2(d), 6) - - - -Unrealised profit on interest rate swap contracts (notes 2(e), 7) - - - -Unrealised profit on inflation swap contracts (notes 2(f), 8) - - - -Unrealised profit on cross currency swap contracts (notes 2(g), 9) - - - -Unrealised profit on total return swap contracts (notes 2(h), 10) - - - -Credit default swap contracts at market value (notes 2(j), 12) - - - -Option contracts at market value (notes 2(k), 13) - - - -Investment in mortgage dollar rolls at market value (notes 2(m), 14) - - - -Other receivables 112,597 70,875 - -TOTAL ASSETS 2,651,148,326 335,126,550 421,973,466 630,061,501
LIABILITIESAmounts payable on purchases of investments 16,118 - - -Amounts payable on purchases of mortgage dollar rolls (note 2(m)) - - - -Amounts payable on redemptions 22,713,950 2,238,294 1,237,826 3,086,762Investment management fees payable (note 16) 2,012,159 79,164 317,159 305,564Bank overdraft - - - -Unrealised loss on forward foreign exchange contracts (notes 2(c), 5) 95,993 - - 254,126Unrealised loss on financial future contracts (notes 2(d), 6) - - - -Unrealised loss on interest rate swap contracts (notes 2(e), 7) - - - -Unrealised loss on inflation swap contracts (notes 2(f), 8) - - - -Unrealised loss on cross currency swap contracts (notes 2(g), 9) - - - -Unrealised loss on total return swap contracts (notes 2(h), 10) - - - -Credit default swap contracts at market value (notes 2(j), 12) - - - -Option contracts at market value (notes 2(k), 13) - - - -Taxes and expenses payable 1,709,584 202,686 422,432 623,019TOTAL LIABILITIES 26,547,804 2,520,144 1,977,417 4,269,471
TOTAL NET ASSETS 2,624,600,522 332,606,406 419,996,049 625,792,030
THREE YEAR ASSET SUMMARYJune 30, 2017 1,229,456,650 310,691,013 461,625,826 855,045,873June 30, 2016 912,322,077 403,995,936 506,167,855 1,211,181,698June 30, 2015 953,563,141 330,503,303 675,514,978 1,067,430,758
1 This Fund had its name changed effective on January 31, 2018 (refer to Note 1)
FRANKLIN TEMPLETON INVESTMENT FUNDS
Statement of Net Assetsat June 30, 2018 (continued)
The accompanying notes form an integral part of these financial statements
24 Audited Annual Report www.franklintempleton.lu

FranklinU.S. LowDuration
Fund
FranklinU.S.
OpportunitiesFund
FranklinWorld
PerspectivesFund
FranklinMutual
EuropeanFund
FranklinMutual Global
DiscoveryFund
FranklinMutual
U.S. ValueFund1
TempletonAfricaFund
(USD) (USD) (USD) (EUR) (USD) (USD) (USD)
732,867,712 3,795,950,434 409,748,177 1,165,331,542 746,781,432 487,399,671 62,105,07011,785,148 108,713,266 822,811 14,356,083 9,829,717 2,897,175 696,527
- - 12,200,000 - - - 12,000,00017,733,459 2,015,385 627 24,900,125 4,480,346 2,429,474 853,908
195,357 33,314,270 1,017,189 1,036,473 445,203 211,512 84,3724,507,032 659,047 550,297 4,087,216 2,245,548 700,483 309,827
- 804,584 - - 438,592 - -- - - - - - -- - - - - - -
254,246 - - - - - -- - - - - - -
699,111 - - - - - -- - - - - - -- - - - - - -- - - - - - -
39,310 - 359,000 2,341,870 1,132,806 63,967 10,578768,081,375 3,941,456,986 424,698,101 1,212,053,309 765,353,644 493,702,282 76,060,282
11,124,616 38,621,536 48,386 12,937,390 1,251,753 717,728 -- - - - - - -
1,974,079 15,058,738 1,179,428 2,306,765 1,531,335 884,717 536,949332,951 2,967,597 323,751 933,473 597,176 399,207 99,004
- - - - - - -2,390,662 - - 432,132 - 75,868 407,761
292,483 - - - - - -235,591 - - - - - -
- - - - - - -3,267 - - - - - -
- - - - - - -1,525,205 - - - - - -
- - - - - - -507,383 2,932,235 509,133 1,923,997 778,983 1,001,144 362,792
18,386,237 59,580,106 2,060,698 18,533,757 4,159,247 3,078,664 1,406,506
749,695,138 3,881,876,880 422,637,403 1,193,519,552 761,194,397 490,623,618 74,653,776
1,184,520,738 2,937,414,397 312,784,198 1,613,768,701 980,850,083 750,634,285 68,140,124904,479,104 3,723,344,289 363,338,333 1,808,035,248 942,338,326 641,560,164 77,149,040
1,605,831,136 4,723,501,172 392,152,862 3,038,004,877 1,372,939,054 956,365,990 127,043,263
FRANKLIN TEMPLETON INVESTMENT FUNDS
Statement of Net Assetsat June 30, 2018 (continued)
The accompanying notes form an integral part of these financial statements
www.franklintempleton.lu Audited Annual Report 25

TempletonAsianBondFund
TempletonAsian
GrowthFund
TempletonAsian Smaller
CompaniesFund
TempletonBRICFund
(USD) (USD) (USD) (USD)
ASSETSInvestment in securities at market value (notes 2(b), 3) 487,694,308 3,763,467,170 1,588,778,559 761,818,480Cash 12,579,607 3,490,207 1,487,228 272,087Time deposits (note 4) - 34,400,000 76,300,000 1,900,000Amounts receivable on sale of investments 33,489,944 10,802,463 5,086,131 1,483Amounts receivable on subscriptions 696,933 8,877,432 5,030,719 6,161,059Interest and dividends receivable, net 9,568,161 15,235,506 1,608,827 3,885,541Unrealised profit on forward foreign exchange contracts (notes 2(c), 5) 6,844,628 - - -Unrealised profit on financial future contracts (notes 2(d), 6) - - - -Unrealised profit on interest rate swap contracts (notes 2(e), 7) 2,590,575 - - -Unrealised profit on inflation swap contracts (notes 2(f), 8) - - - -Unrealised profit on cross currency swap contracts (notes 2(g), 9) - - - -Unrealised profit on total return swap contracts (notes 2(h), 10) - - - -Credit default swap contracts at market value (notes 2(j), 12) - - - -Option contracts at market value (notes 2(k), 13) - - - -Investment in mortgage dollar rolls at market value (notes 2(m), 14) - - - -Other receivables 310,233 594,112 2,085 -TOTAL ASSETS 553,774,389 3,836,866,890 1,678,293,549 774,038,650
LIABILITIESAmounts payable on purchases of investments 1,470,253 3,409,500 3,834,454 -Amounts payable on purchases of mortgage dollar rolls (note 2(m)) - - - -Amounts payable on redemptions 1,695,792 24,144,794 4,026,115 4,046,181Investment management fees payable (note 16) 303,795 4,291,683 1,534,952 1,052,416Bank overdraft - - - -Unrealised loss on forward foreign exchange contracts (notes 2(c), 5) - 2,190,880 876 344,248Unrealised loss on financial future contracts (notes 2(d), 6) - - - -Unrealised loss on interest rate swap contracts (notes 2(e), 7) - - - -Unrealised loss on inflation swap contracts (notes 2(f), 8) - - - -Unrealised loss on cross currency swap contracts (notes 2(g), 9) - - - -Unrealised loss on total return swap contracts (notes 2(h), 10) - - - -Credit default swap contracts at market value (notes 2(j), 12) - - - -Option contracts at market value (notes 2(k), 13) - - - -Taxes and expenses payable 2,430,116 7,437,286 2,919,841 1,961,376TOTAL LIABILITIES 5,899,956 41,474,143 12,316,238 7,404,221
TOTAL NET ASSETS 547,874,433 3,795,392,747 1,665,977,311 766,634,429
THREE YEAR ASSET SUMMARYJune 30, 2017 673,256,171 4,944,781,465 1,577,382,433 761,260,242June 30, 2016 841,044,530 4,508,040,016 1,126,815,386 683,471,085June 30, 2015 1,605,694,101 10,040,238,841 1,511,952,778 910,377,435
2 This Fund was launched on February 20, 2018
FRANKLIN TEMPLETON INVESTMENT FUNDS
Statement of Net Assetsat June 30, 2018 (continued)
The accompanying notes form an integral part of these financial statements
26 Audited Annual Report www.franklintempleton.lu

TempletonChinaFund
TempletonEasternEurope
Fund
TempletonEmerging
MarketsFund
TempletonEmerging Markets
BalancedFund
TempletonEmerging
MarketsBond Fund
TempletonEmerging Markets
Local Currency BondFund2
TempletonEmerging Markets
Smaller CompaniesFund
(USD) (EUR) (USD) (USD) (USD) (USD) (USD)
511,644,872 242,842,153 970,675,155 124,972,057 9,110,183,270 18,015,632 1,038,364,22670,229 7,874,063 - 1,959,638 292,013,745 258,833 7,247,250
9,900,000 - - - - - -828,371 489,509 6,736,884 4,232,337 400,831,650 775,000 30,902,218
2,010,689 527,875 1,409,804 467,118 51,301,698 - 1,725,5432,147,585 1,962,867 3,913,234 1,274,731 182,242,476 344,722 1,349,764
- - - 418,884 4,913,596 - -- - - - - - -- - - 150,640 49,660,059 - -- - - - - - -- - - - - - -- - - - - - -- - - - - - -- - - - - - -- - - - - - -- 736,778 173,202 15,000 1,903,117 4,019 277,239
526,601,746 254,433,245 982,908,279 133,490,405 10,093,049,611 19,398,206 1,079,866,240
- 651,640 12,764 347,103 102,257,069 784 -- - - - - - -
6,125,924 2,626,130 7,613,419 555,267 41,579,139 - 16,619,285708,029 322,314 922,684 141,120 7,953,899 12,110 1,047,217
- - 1,177,538 - - - -- - 311,148 - - 22,942 9,468- - - - - - -- - - - - - -- - - - - - -- - - - - - -- - - - - - -- - - - - - -- - - - - - -
725,335 636,850 2,007,794 285,635 32,909,329 33,469 1,604,0647,559,288 4,236,934 12,045,347 1,329,125 184,699,436 69,305 19,280,034
519,042,458 250,196,311 970,862,932 132,161,280 9,908,350,175 19,328,901 1,060,586,206
525,402,818 310,573,410 768,743,294 64,654,834 6,296,345,122 - 778,914,351529,554,974 270,212,102 525,175,142 44,032,095 3,822,276,997 - 483,632,814843,014,039 288,357,328 647,377,931 61,342,926 4,757,561,487 - 448,620,075
FRANKLIN TEMPLETON INVESTMENT FUNDS
Statement of Net Assetsat June 30, 2018 (continued)
The accompanying notes form an integral part of these financial statements
www.franklintempleton.lu Audited Annual Report 27

TempletonEuroland
Fund
TempletonEuropean
Fund
TempletonFrontierMarkets
Fund
TempletonGlobalFund
(EUR) (EUR) (USD) (USD)
ASSETSInvestment in securities at market value (notes 2(b), 3) 685,401,139 165,386,139 655,691,718 1,126,801,499Cash 13,012,429 864,808 5,850,075 127,162Time deposits (note 4) - - 10,800,000 22,900,000Amounts receivable on sale of investments 588,284 - 15,527,413 2,175,736Amounts receivable on subscriptions 1,928,637 176,164 486,882 1,429,588Interest and dividends receivable, net 148,808 199,242 1,290,466 2,338,247Unrealised profit on forward foreign exchange contracts (notes 2(c), 5) 5,171 - - -Unrealised profit on financial future contracts (notes 2(d), 6) - - - -Unrealised profit on interest rate swap contracts (notes 2(e), 7) - - - -Unrealised profit on inflation swap contracts (notes 2(f), 8) - - - -Unrealised profit on cross currency swap contracts (notes 2(g), 9) - - - -Unrealised profit on total return swap contracts (notes 2(h), 10) - - - -Credit default swap contracts at market value (notes 2(j), 12) - - - -Option contracts at market value (notes 2(k), 13) - - - -Investment in mortgage dollar rolls at market value (notes 2(m), 14) - - - -Other receivables 916,106 437,133 - 979,706TOTAL ASSETS 702,000,574 167,063,486 689,646,554 1,156,751,938
LIABILITIESAmounts payable on purchases of investments - 979 10,749,133 -Amounts payable on purchases of mortgage dollar rolls (note 2(m)) - - - -Amounts payable on redemptions 1,601,450 901,394 1,833,976 2,791,664Investment management fees payable (note 16) 437,757 138,572 805,985 902,709Bank overdraft - - - -Unrealised loss on forward foreign exchange contracts (notes 2(c), 5) - - 912,696 -Unrealised loss on financial future contracts (notes 2(d), 6) - - - -Unrealised loss on interest rate swap contracts (notes 2(e), 7) - - - -Unrealised loss on inflation swap contracts (notes 2(f), 8) - - - -Unrealised loss on cross currency swap contracts (notes 2(g), 9) - - - -Unrealised loss on total return swap contracts (notes 2(h), 10) - - - -Credit default swap contracts at market value (notes 2(j), 12) - - - -Option contracts at market value (notes 2(k), 13) - - - -Taxes and expenses payable 390,048 171,074 7,256,873 1,203,537TOTAL LIABILITIES 2,429,255 1,212,019 21,558,663 4,897,910
TOTAL NET ASSETS 699,571,319 165,851,467 668,087,891 1,151,854,028
THREE YEAR ASSET SUMMARYJune 30, 2017 465,137,539 209,415,616 882,514,750 1,259,094,531June 30, 2016 225,841,210 217,815,064 816,651,982 1,159,102,438June 30, 2015 270,562,552 301,775,110 1,256,869,622 1,500,917,332
3 This Fund had its name changed effective on March 5, 2018 (refer to Note 1)
FRANKLIN TEMPLETON INVESTMENT FUNDS
Statement of Net Assetsat June 30, 2018 (continued)
The accompanying notes form an integral part of these financial statements
28 Audited Annual Report www.franklintempleton.lu

TempletonGlobal
BalancedFund
TempletonGlobalBondFund
TempletonGlobal Bond
(Euro)Fund
TempletonGlobal
Climate ChangeFund 3
TempletonGlobal
CurrencyFund
TempletonGlobal Equity
IncomeFund
TempletonGlobal
High YieldFund
(USD) (USD) (EUR) (EUR) (USD) (USD) (USD)
800,342,779 14,262,595,791 257,384,459 630,674,065 8,282,320 140,211,372 134,625,204112,112,671 628,328,664 47,099,080 12,784,140 549,943 174,149 3,497,020
- - - - - 1,700,000 -351,027 289,417,401 - - 2,520,035 215 6,191,590
1,090,733 53,306,220 544,159 140,861 - 60,644 241,1384,350,530 215,837,402 4,674,380 1,471,999 58,552 277,516 2,807,046
643,612 320,261,932 - - 143,123 - 46,771- - - - - - -- - 4,466,552 - - - 249,480- - - - - - -- - - - - - -- - - - - - -- - - - - - -- - - - - - -- - - - - - -
429,854 15,022,592 187,689 625,771 3,198 156,897 25,220919,321,206 15,784,770,002 314,356,319 645,696,836 11,557,171 142,580,793 147,683,469
- 46,427,413 479,258 - - - 813,924- - - - - - -
1,866,396 50,652,411 661,487 361,593 - 1,258,058 891,758597,919 8,993,765 171,932 541,739 6,553 117,541 101,593
- - - - - - -- - 1,217,044 465 - 15,966 -- - - - - - -- 131,333,758 - - - - -- - - - - - -- - - - - - -- - - - - - -- - - - - - -- - - - - 8,806 -
1,183,029 42,554,170 656,495 661,431 18,341 179,628 229,2133,647,344 279,961,517 3,186,216 1,565,228 24,894 1,579,999 2,036,488
915,673,862 15,504,808,485 311,170,103 644,131,608 11,532,277 141,000,794 145,646,981
953,322,447 18,426,706,919 325,525,488 693,378,176 8,481,440 150,633,469 180,421,557938,407,418 22,001,556,826 365,968,734 620,499,565 - 164,081,704 163,016,307
1,235,789,670 32,732,039,223 388,655,489 784,348,115 - 248,399,545 203,340,828
FRANKLIN TEMPLETON INVESTMENT FUNDS
Statement of Net Assetsat June 30, 2018 (continued)
The accompanying notes form an integral part of these financial statements
www.franklintempleton.lu Audited Annual Report 29

TempletonGlobal
IncomeFund
TempletonGlobal Smaller
CompaniesFund
TempletonGlobal
Total ReturnFund
TempletonGrowth(Euro)Fund
(USD) (USD) (USD) (EUR)
ASSETSInvestment in securities at market value (notes 2(b), 3) 845,089,417 115,402,039 16,535,944,104 6,957,689,686Cash 11,324,476 106,574 487,575,999 232,099,298Time deposits (note 4) - 5,700,000 - 172,450,076Amounts receivable on sale of investments 41,241,501 873,428 151,669,734 100,187,561Amounts receivable on subscriptions 1,734,576 116,388 31,996,786 565,876Interest and dividends receivable, net 6,646,176 315,417 275,333,700 11,219,838Unrealised profit on forward foreign exchange contracts (notes 2(c), 5) 7,777,510 - 266,989,222 -Unrealised profit on financial future contracts (notes 2(d), 6) - - - -Unrealised profit on interest rate swap contracts (notes 2(e), 7) 5,222,975 - 27,240,744 -Unrealised profit on inflation swap contracts (notes 2(f), 8) - - - -Unrealised profit on cross currency swap contracts (notes 2(g), 9) - - - -Unrealised profit on total return swap contracts (notes 2(h), 10) - - - -Credit default swap contracts at market value (notes 2(j), 12) - - - -Option contracts at market value (notes 2(k), 13) - - - -Investment in mortgage dollar rolls at market value (notes 2(m), 14) - - - -Other receivables 995,150 89,905 6,252,006 4,035,474TOTAL ASSETS 920,031,781 122,603,751 17,783,002,295 7,478,247,809
LIABILITIESAmounts payable on purchases of investments 2,035,085 99,758 74,701,393 100,568,213Amounts payable on purchases of mortgage dollar rolls (note 2(m)) - - - -Amounts payable on redemptions 3,885,937 85,737 83,966,051 2,870,049Investment management fees payable (note 16) 634,323 102,224 10,390,912 6,135,884Bank overdraft - - - -Unrealised loss on forward foreign exchange contracts (notes 2(c), 5) - - - -Unrealised loss on financial future contracts (notes 2(d), 6) - - - -Unrealised loss on interest rate swap contracts (notes 2(e), 7) - - - -Unrealised loss on inflation swap contracts (notes 2(f), 8) - - - -Unrealised loss on cross currency swap contracts (notes 2(g), 9) - - - -Unrealised loss on total return swap contracts (notes 2(h), 10) - - - -Credit default swap contracts at market value (notes 2(j), 12) - - - -Option contracts at market value (notes 2(k), 13) - - - -Taxes and expenses payable 1,155,992 172,455 42,614,289 6,613,978TOTAL LIABILITIES 7,711,337 460,174 211,672,645 116,188,124
TOTAL NET ASSETS 912,320,444 122,143,577 17,571,329,650 7,362,059,685
THREE YEAR ASSET SUMMARYJune 30, 2017 1,137,684,998 120,018,892 20,185,056,502 7,584,398,180June 30, 2016 1,481,892,095 113,758,358 21,120,878,212 6,563,260,233June 30, 2015 2,206,717,655 142,872,980 30,788,646,224 7,445,372,975
FRANKLIN TEMPLETON INVESTMENT FUNDS
Statement of Net Assetsat June 30, 2018 (continued)
The accompanying notes form an integral part of these financial statements
30 Audited Annual Report www.franklintempleton.lu

TempletonLatin
AmericaFund
TempletonThailand
Fund
(USD) (USD)
971,725,139 161,051,899113,175 68,599
25,000,000 8,200,0001,280 437
3,733,900 2,744,4871,712,408 112,364
268,195 -- -- -- -- -- -- -- -- -- -
1,002,554,097 172,177,786
3,199,204 2,598,553- -
4,667,711 1,887,7951,142,284 232,151
- -- -- -- -- -- -- -- -- -
1,637,809 213,69410,647,008 4,932,193
991,907,089 167,245,593
1,199,770,938 139,450,1281,103,673,787 143,285,7381,177,268,298 155,284,109
FRANKLIN TEMPLETON INVESTMENT FUNDS
Statement of Net Assetsat June 30, 2018 (continued)
The accompanying notes form an integral part of these financial statements
www.franklintempleton.lu Audited Annual Report 31

Total FranklinAsia
CreditFund
FranklinBiotechnology
DiscoveryFund
FranklinBrazil
OpportunitiesFund
(USD) (USD) (USD) (USD)
NET ASSETS AT THE BEGINNING OF THE YEAR 106,341,225,772 8,920,119 2,408,642,311 28,894,121Currency translation adjustment 402,562,081 - - -
106,743,787,853 8,920,119 2,408,642,311 28,894,121INCOMEDividends (net of withholding taxes) (note 2(n)) 949,317,343 - 3,410,942 98,174Interest on bonds (net of withholding taxes) (note 2(n)) 3,944,104,749 364,535 146,352 1,887,676Bank interest 27,151,114 487 464,513 2,187Securities lending (notes 2(o), 15) 7,055,421 - 3,596,895 -Net interest income on swaps 24,878,452 - - -Sundry income 18,798,674 - 337,953 3,193TOTAL INCOME 4,971,305,753 365,022 7,956,655 1,991,230EXPENSESInvestment management fees (note 16) 968,392,097 62,829 23,616,388 295,273Administration and transfer agency fees 248,418,127 19,938 5,539,937 79,901Directors fees 221,973 18 4,921 60Subscription tax (note 19) 46,353,569 3,642 1,171,134 15,051Custodian fees 42,708,903 580 83,643 8,970Audit fees 1,049,396 11,387 15,452 9,417Printing and publishing expenses 8,151,551 670 180,122 2,217Bank charges 10,626,682 - 4,251 25Net interest expenses on swaps 97,912,164 - - 18,433Class A (dis) and Class A (acc) shares’ maintenance charges (note 20) 300,940,527 20,173 9,911,242 55,355Class AS (dis) and Class AS (acc) shares’ maintenance charges (note 20) 1,283,909 - - -Class AX (acc) shares’ maintenance charges (note 20) 1,649,252 - - -Class B (dis) and Class B (acc) shares’ maintenance and service charges (note 20) 15,592,368 - 384,021 -Class C (dis) and Class C (acc) shares’ maintenance charges (note 20) 17,710,789 - 212,958 -Class F (dis) and Class F (acc) shares’ maintenance and service charges (note 20) 20,081,129 - 597,783 -Class G (dis) and Class G (acc) shares’ maintenance and service charges (note 20) 229,922 - - -Class N (dis) and Class N (acc) shares’ maintenance charges (note 20) 105,166,675 - 2,001,374 184,517Other charges 29,401,807 2,183 607,148 7,373TOTAL EXPENSES 1,915,890,840 121,420 44,330,374 676,592
Expenses reimbursement (note 21) (11,249,674) - (1,638) -NET EXPENSES 1,904,641,166 121,420 44,328,736 676,592
NET PROFIT/(LOSS) FROM INVESTMENTS 3,066,664,587 243,602 (36,372,081) 1,314,638Net realised profit/(loss) on sale of investments 3,625,196,782 10,131 191,408,357 1,278,823Net realised profit/(loss) on forward foreign exchange contracts (428,188,507) 65,991 80,503 84,256Net realised profit/(loss) on financial future contracts (23,753,767) - - 1,102,738Net realised profit/(loss) on cross currency swap contracts (610,000) - - -Net realised profit/(loss) on interest rate swap contracts 38,286,203 - - -Net realised profit/(loss) on inflation swap contracts 564,655 - - -Net realised profit/(loss) on total return swap contracts 2,484,566 - - -Net realised profit/(loss) on volatility swap contracts (81,262) - - -Net realised profit/(loss) on credit default swap contracts (1,754,886) - - 326,716Net realised profit/(loss) on option contracts (5,425,395) - - (366,348)Net realised profit/(loss) on mortgage dollar rolls (1,881,900) - - -Net realised profit/(loss) on foreign exchange transactions (132,037,836) (578) (3,150) (243,192)NET REALISED PROFIT/(LOSS) FOR THE YEAR 6,139,463,240 319,146 155,113,629 3,497,631Change in net unrealised appreciation/(depreciation) on:
Investments (6,356,865,498) (419,494) 26,216,908 (3,245,371)Forward foreign exchange contracts 401,643,449 (116,040) (414,428) (90,886)Financial future contracts (4,649,471) - - 335,846Interest rate swap contracts 524,846,241 - - -Inflation swap contracts 163,750 - - (15,217)Cross currency swap contracts 679,700 - - -Total return swap contracts 6,188,422 - - -Volatility swap contracts 1,374,693 - - -Credit default swap contracts 1,782,889 - - (307,845)Option contracts (1,902,474) - - (3,615)Mortgage dollar rolls 399,155 - - -Foreign exchange transactions (34,469,226) (98) 1,156 (31,511)
Capital gains tax (24,176,775) - - -NET INCREASE/(DECREASE) IN NET ASSETS AS A RESULT OF OPERATIONS 654,478,095 (216,486) 180,917,265 139,032MOVEMENT OF CAPITALIssue of shares 43,198,156,537 618,947 2,109,026,760 11,160,825Redemption of shares (44,441,839,421) (514,734) (2,513,372,319) (12,477,591)Equalisation (note 24) 45,795,759 544 - (15,330)
(1,197,887,125) 104,757 (404,345,559) (1,332,096)
Dividends paid/accumulated (note 25) (4,217,769,743) (362,494) - (2,388,093)NET INCREASE/(DECREASE) IN NET ASSETSAS A RESULT OF MOVEMENT IN CAPITAL (5,415,656,868) (257,737) (404,345,559) (3,720,189)
NET ASSETS AT THE END OF THE YEAR 101,982,609,080 8,445,896 2,185,214,017 25,312,964
Portfolio Turnover Ratio (note 26) 51.11% 3.72% 85.59%
FRANKLIN TEMPLETON INVESTMENT FUNDS
Statement of Operations and Changes in Net AssetsFor the Year ended June 30, 2018
The accompanying notes form an integral part of these financial statements
32 Audited Annual Report www.franklintempleton.lu

FranklinDiversifiedBalanced
Fund
FranklinDiversified
ConservativeFund
FranklinDiversified
DynamicFund
FranklinEuro
GovernmentBond Fund
FranklinEuro
High YieldFund
FranklinEuro
Short DurationBond Fund
Franklin EuroShort-Term
Money MarketFund
(EUR) (EUR) (EUR) (EUR) (EUR) (EUR) (EUR)
212,716,472 305,343,335 86,613,579 90,465,722 727,071,302 79,066,843 118,230,964- - - - - - -
212,716,472 305,343,335 86,613,579 90,465,722 727,071,302 79,066,843 118,230,964
3,060,160 2,383,997 1,807,700 - 251,433 - -1,946,991 3,619,403 491,448 576,095 26,499,371 398,927 (399,931)
28,023 27,731 16,788 - 19,667 2,077 -- - - - - - -
4,346,268 5,687,848 1,722,850 - - - -1,861 4,498 - 613 9,144 - -
9,383,303 11,723,477 4,038,786 576,708 26,779,615 401,004 (399,931)
1,710,251 2,450,991 906,533 291,656 5,229,389 322,492 259,766541,093 773,976 239,098 168,341 1,530,974 207,434 150,679
483 682 206 155 1,389 199 22467,162 122,953 42,549 22,436 309,652 26,520 11,20120,585 27,288 11,165 6,979 55,844 11,887 9,04713,519 13,991 13,134 7,583 11,252 9,755 8,30517,708 25,045 7,593 5,638 50,889 7,339 8,205
114,222 282,053 44,152 9,639 176,403 25,342 82,449- - - - - 29,167 -
464,224 532,028 443,062 39,855 1,922,203 45,521 82,833- - - - - - -- - - - - - -- - - - 233,336 - -- - - - - - -- - - - - - -
11,893 18,275 - - - - -87,722 840,819 19,692 113,698 963,403 163,142 -56,676 80,735 23,629 19,607 169,270 22,270 26,570
3,105,538 5,168,836 1,750,813 685,587 10,654,004 871,068 639,279
- (138) - (13,450) (3,019) (52,803) (316,647)3,105,538 5,168,698 1,750,813 672,137 10,650,985 818,265 322,632
6,277,765 6,554,779 2,287,973 (95,429) 16,128,630 (417,261) (722,563)445,584 (3,483,081) 1,480,461 527,086 10,849,617 409,713 56
1,185,313 3,317,848 (256,724) - 495,941 1,011,506 -(2,525,355) (4,539,943) (2,051,375) (330,763) - 120,540 -
- - - - - - -- - - - - - -- - - - - - -
(211,150) (297,836) 14,199 - - - -(15,638) (24,508) (7,544) - - - -
- - - - - (36,611) -(1,722,138) (742,453) (986,197) - - 20,150 -
- - - - - - -(3,976) (110,113) 198,165 - (137,544) (1,987) -
3,430,405 674,693 678,958 100,894 27,336,644 1,106,050 (722,507)
(3,209,690) (6,296,396) (1,185,846) 296,590 (28,690,019) (851,917) -(2,268,863) (2,476,012) (1,029,763) - (910,106) (82,921) -
44,433 106,701 (116,892) (497,817) - (459,050) -- - - - - - -- - - - - - -- - - - - - -
(226,446) (249,494) (40,011) - - - -275,786 382,217 133,039 - - - -
18,425 35,620 13,858 - - - -(87,115) (20,978) (61,015) - - - -
- - - - - - -17,278 22,438 (10,719) - 39,742 (6,770) -
- - - - - - -(2,005,787) (7,821,211) (1,618,391) (100,333) (2,223,739) (294,608) (722,507)
93,870,240 159,414,630 63,669,564 10,247,455 138,235,290 118,097,047 51,299,637(21,982,082) (90,850,499) (6,545,462) (50,661,627) (243,466,137) (59,216,270) (66,518,525)
1,491,745 751,939 415,685 (167,644) (1,558,839) 59,911 -73,379,903 69,316,070 57,539,787 (40,581,816) (106,789,686) 58,940,688 (15,218,888)
(11,319,942) (10,913,494) (5,025,520) (786,668) (28,934,384) (600,455) -
62,059,961 58,402,576 52,514,267 (41,368,484) (135,724,070) 58,340,233 (15,218,888)
272,770,646 355,924,700 137,509,455 48,996,905 589,123,493 137,112,468 102,289,569
140.24% 73.84% 178.97% 132.03% 90.96% 100.84% N/A
FRANKLIN TEMPLETON INVESTMENT FUNDS
Statement of Operations and Changes in Net AssetsFor the Year ended June 30, 2018 (continued)
The accompanying notes form an integral part of these financial statements
www.franklintempleton.lu Audited Annual Report 33

FranklinEuropean
Fund1
FranklinEuropeanCorporate
Bond Fund
FranklinEuropeanDividend
Fund
FranklinEuropean
GrowthFund
(EUR) (EUR) (EUR) (EUR)
NET ASSETS AT THE BEGINNING OF THE YEAR 9,437,889 104,153,323 152,193,195 736,996,088Currency translation adjustment - - - -
9,437,889 104,153,323 152,193,195 736,996,088INCOMEDividends (net of withholding taxes) (note 2(n)) 30,622 - 4,395,606 11,512,703Interest on bonds (net of withholding taxes) (note 2(n)) - 1,590,079 - -Bank interest - - - 20,517Securities lending (notes 2(o), 15) - - - 755,064Net interest income on swaps - - - -Sundry income 49 1,716 48 704TOTAL INCOME 30,671 1,591,795 4,395,654 12,288,988EXPENSESInvestment management fees (note 16) 37,728 478,790 1,227,175 5,292,970Administration and transfer agency fees 10,061 213,039 317,324 1,298,903Directors fees - 200 285 1,216Subscription tax (note 19) 1,856 31,138 52,277 241,463Custodian fees 517 8,352 16,305 65,756Audit fees 2,602 8,313 8,138 9,170Printing and publishing expenses 1,296 7,335 10,427 44,427Bank charges - 17,285 24,680 83,602Net interest expenses on swaps - - - -Class A (dis) and Class A (acc) shares’ maintenance charges (note 20) 9,355 72,509 331,083 1,573,612Class AS (dis) and Class AS (acc) shares’ maintenance charges (note 20) - - - -Class AX (acc) shares’ maintenance charges (note 20) - - - -Class B (dis) and Class B (acc) shares’ maintenance and service charges (note 20) - - - -Class C (dis) and Class C (acc) shares’ maintenance charges (note 20) - - - -Class F (dis) and Class F (acc) shares’ maintenance and service charges (note 20) - - - -Class G (dis) and Class G (acc) shares’ maintenance and service charges (note 20) - - - -Class N (dis) and Class N (acc) shares’ maintenance charges (note 20) 14,512 267,610 318,825 1,429,274Other charges 409 25,089 35,485 150,882TOTAL EXPENSES 78,336 1,129,660 2,342,004 10,191,275
Expenses reimbursement (note 21) - (53,111) (16) (15,299)NET EXPENSES 78,336 1,076,549 2,341,988 10,175,976
NET PROFIT/(LOSS) FROM INVESTMENTS (47,665) 515,246 2,053,666 2,113,012Net realised profit/(loss) on sale of investments 1,256,822 1,282,127 1,675,145 40,265,376Net realised profit/(loss) on forward foreign exchange contracts - (156,290) (4,999) (1,694,829)Net realised profit/(loss) on financial future contracts - (303,000) - -Net realised profit/(loss) on cross currency swap contracts - - - -Net realised profit/(loss) on interest rate swap contracts - - - -Net realised profit/(loss) on inflation swap contracts - - - -Net realised profit/(loss) on total return swap contracts - - - -Net realised profit/(loss) on volatility swap contracts - - - -Net realised profit/(loss) on credit default swap contracts - - - -Net realised profit/(loss) on option contracts - - - -Net realised profit/(loss) on mortgage dollar rolls - - - -Net realised profit/(loss) on foreign exchange transactions 26,660 - (16,192) 139,916NET REALISED PROFIT/(LOSS) FOR THE YEAR 1,235,817 1,338,083 3,707,620 40,823,475Change in net unrealised appreciation/(depreciation) on:
Investments (1,091,632) (1,267,042) (576,343) (40,891,165)Forward foreign exchange contracts - (72,686) (100,532) 1,266,145Financial future contracts - (184,400) - -Interest rate swap contracts - - - -Inflation swap contracts - - - -Cross currency swap contracts - - - -Total return swap contracts - - - -Volatility swap contracts - - - -Credit default swap contracts - - - -Option contracts - - - -Mortgage dollar rolls - - - -Foreign exchange transactions 222 - 4,224 20,887
Capital gains tax - - - -NET INCREASE/(DECREASE) IN NET ASSETS AS A RESULT OF OPERATIONS 144,407 (186,045) 3,034,969 1,219,342MOVEMENT OF CAPITALIssue of shares 497,121 14,519,753 46,563,500 78,965,867Redemption of shares (10,044,029) (42,329,157) (85,311,327) (409,907,792)Equalisation (note 24) (31) (349,187) (671,220) (335,839)
(9,546,939) (28,158,591) (39,419,047) (331,277,764)
Dividends paid/accumulated (note 25) (35,357) (1,902,832) (8,241,443) (9,124,756)NET INCREASE/(DECREASE) IN NET ASSETSAS A RESULT OF MOVEMENT IN CAPITAL (9,582,296) (30,061,423) (47,660,490) (340,402,520)
NET ASSETS AT THE END OF THE YEAR - 73,905,855 107,567,674 397,812,910
Portfolio Turnover Ratio (note 26) N/A 39.80% 28.55% 52.40%
1 This Fund was closed on December 12, 2017
FRANKLIN TEMPLETON INVESTMENT FUNDS
Statement of Operations and Changes in Net AssetsFor the Year ended June 30, 2018 (continued)
The accompanying notes form an integral part of these financial statements
34 Audited Annual Report www.franklintempleton.lu

FranklinEuropean
IncomeFund
FranklinEuropean
Small-Mid CapGrowth Fund
FranklinEuropean
Total ReturnFund
FranklinFlexible
Alpha BondFund
FranklinGCC
BondFund
FranklinGlobal
AggregateBond Fund
FranklinGlobal Aggregate
Investment GradeBond Fund
(EUR) (EUR) (EUR) (USD) (USD) (USD) (USD)
17,654,854 512,480,130 550,100,840 341,435,113 56,209,469 89,242,077 11,580,371- - - - - - -
17,654,854 512,480,130 550,100,840 341,435,113 56,209,469 89,242,077 11,580,371
403,519 14,658,050 - - - - -135,543 - 6,738,869 18,024,658 3,345,885 2,755,884 203,913
- - 42,354 256,489 58,029 19,080 752- 24,968 - - - - -- - - - - - -
89,613 2,600,054 2,120 31,961 - 1,797 -628,675 17,283,072 6,783,343 18,313,108 3,403,914 2,776,761 204,665
159,061 4,347,580 3,265,226 1,522,315 429,044 268,544 46,37647,502 1,117,682 1,185,345 600,341 160,144 124,552 24,495
39 1,029 1,093 1,203 138 219 228,898 166,999 199,253 58,943 16,311 19,320 1,5792,549 63,393 94,536 27,960 4,127 6,305 1,606
10,100 8,235 7,792 13,217 10,472 8,183 8,5101,442 37,720 40,020 44,538 5,071 8,054 813
- 116,936 106,398 65,353 94 22,799 -- - - 1,457,488 - - -
34,984 1,270,815 642,548 4,125 59,445 45,031 3,279- - - - - - -- - - - - - -- - - - 3,390 - -- - - - - - -- - - - - - -- - - - - - -
106,425 284,032 1,281,404 20,509 - 49,790 -4,607 125,685 132,288 141,115 15,684 26,825 2,724
375,607 7,540,106 6,955,903 3,957,107 703,920 579,622 89,404
(2,213) - (852,037) (182,130) (36) (34,866) (15,873)373,394 7,540,106 6,103,866 3,774,977 703,884 544,756 73,531
255,281 9,742,966 679,477 14,538,131 2,700,030 2,232,005 131,13413,392 4,336,910 4,485,014 (1,621,841) 177,652 908,095 145,983
(80,027) (16,793) (4,115,517) (1,489,116) (2,130,915) (495,721) (163,882)(62,849) - (2,220,764) 6,638,987 - - -
- - - - - - -- - - - - - -- - - 247,954 - - -- - - 243,478 - - -- - - - - - -- - - (153,994) - - -- - 266,910 (13,462) - - -- - - (149,147) - - -
(15,938) (27,658) (438,721) (286,886) 23,126 (206,462) (25,065)109,859 14,035,425 (1,343,601) 17,954,104 769,893 2,437,917 88,170
(430,073) 1,327,124 (2,778,481) (11,920,597) (3,286,332) (4,059,076) (281,637)(17,038) 5,751 (997,524) (4,288,040) 159,160 (35,568) 86,553(45,830) - (4,537,339) 244,995 - - -
- - 31,617 334,711 - - -- - - 172,938 - - -- - - 669,734 - - -- - - 498,394 - - -- - - - - - -- - - 1,032,456 - - -- - - (135) - - -- - - 6,293 - - -
(765) 120,375 (65,257) 10,406 (283) (43,862) (3,281)- - - - - - -
(383,847) 15,488,675 (9,690,585) 4,715,259 (2,357,562) (1,700,589) (110,195)
9,786,576 91,182,268 230,105,749 477,364,965 73,299,790 49,028,301 1,829,701(5,463,068) (175,917,634) (290,945,936) (186,848,176) (37,145,676) (43,051,061) (2,542,320)
38,731 (1,073,009) (58,960) 114,726 126,571 (383,192) 5934,362,239 (85,808,375) (60,899,147) 290,631,515 36,280,685 5,594,048 (712,026)
(538,542) (6,686,996) (6,904,224) (7,355,835) (3,337,230) (1,948,460) (128,253)
3,823,697 (92,495,371) (67,803,371) 283,275,680 32,943,455 3,645,588 (840,279)
21,094,704 435,473,434 472,606,884 629,426,052 86,795,362 91,187,076 10,629,897
(2.47)% 28.16% 105.59% 29.76% 60.98% 79.54% 57.82%
FRANKLIN TEMPLETON INVESTMENT FUNDS
Statement of Operations and Changes in Net AssetsFor the Year ended June 30, 2018 (continued)
The accompanying notes form an integral part of these financial statements
www.franklintempleton.lu Audited Annual Report 35

FranklinGlobal
ConvertibleSecurities Fund
FranklinGlobal Equity
StrategiesFund2
FranklinGlobal
FundamentalStrategies Fund
FranklinGlobalGrowthFund2
(USD) (USD) (USD) (USD)
NET ASSETS AT THE BEGINNING OF THE YEAR 109,204,730 118,451,265 2,050,664,897 86,257,201Currency translation adjustment - - - -
109,204,730 118,451,265 2,050,664,897 86,257,201INCOMEDividends (net of withholding taxes) (note 2(n)) 648,628 1,163,971 32,288,879 278,371Interest on bonds (net of withholding taxes) (note 2(n)) 1,323,824 41,814 41,752,500 -Bank interest 19,099 64,815 543,309 17,092Securities lending (notes 2(o), 15) - - - -Net interest income on swaps - - - -Sundry income 15,518 6,886 170,888 -TOTAL INCOME 2,007,069 1,277,486 74,755,576 295,463EXPENSESInvestment management fees (note 16) 942,064 865,408 20,488,510 364,727Administration and transfer agency fees 314,161 228,567 4,833,484 99,370Directors fees 259 141 4,211 86Subscription tax (note 19) 44,617 46,953 1,018,463 19,373Custodian fees 4,441 13,225 216,047 3,582Audit fees 11,797 5,504 14,318 5,359Printing and publishing expenses 9,520 5,169 154,261 3,164Bank charges 1,394 - 112,399 -Net interest expenses on swaps - - 960,751 -Class A (dis) and Class A (acc) shares’ maintenance charges (note 20) 311,957 253,445 9,237,686 92,157Class AS (dis) and Class AS (acc) shares’ maintenance charges (note 20) - - - -Class AX (acc) shares’ maintenance charges (note 20) - - - -Class B (dis) and Class B (acc) shares’ maintenance and service charges (note 20) - - - -Class C (dis) and Class C (acc) shares’ maintenance charges (note 20) - - - -Class F (dis) and Class F (acc) shares’ maintenance and service charges (note 20) - - - -Class G (dis) and Class G (acc) shares’ maintenance and service charges (note 20) - - - -Class N (dis) and Class N (acc) shares’ maintenance charges (note 20) 311,683 231,795 1,932,190 66,070Other charges 27,625 46,846 530,171 12,302TOTAL EXPENSES 1,979,518 1,697,053 39,502,491 666,190
Expenses reimbursement (note 21) (2,713) (7,921) - -NET EXPENSES 1,976,805 1,689,132 39,502,491 666,190
NET PROFIT/(LOSS) FROM INVESTMENTS 30,264 (411,646) 35,253,085 (370,727)Net realised profit/(loss) on sale of investments 1,476,934 30,618,455 87,706,355 25,277,057Net realised profit/(loss) on forward foreign exchange contracts (2,645,558) 386,512 (19,482,285) -Net realised profit/(loss) on financial future contracts - - - -Net realised profit/(loss) on cross currency swap contracts - - - -Net realised profit/(loss) on interest rate swap contracts - - 807,724 -Net realised profit/(loss) on inflation swap contracts - - - -Net realised profit/(loss) on total return swap contracts - - - -Net realised profit/(loss) on volatility swap contracts - - - -Net realised profit/(loss) on credit default swap contracts - - - -Net realised profit/(loss) on option contracts - - - -Net realised profit/(loss) on mortgage dollar rolls - - - -Net realised profit/(loss) on foreign exchange transactions 6,995 403,488 (1,213,723) 124,672NET REALISED PROFIT/(LOSS) FOR THE YEAR (1,131,365) 30,996,809 103,071,156 25,031,002Change in net unrealised appreciation/(depreciation) on:
Investments 11,670,925 (16,588,424) (134,946,145) (12,711,912)Forward foreign exchange contracts 4,795 (116,854) 19,547,875 -Financial future contracts - - - -Interest rate swap contracts - - 6,871,345 -Inflation swap contracts - - - -Cross currency swap contracts - - - -Total return swap contracts - - - -Volatility swap contracts - - - -Credit default swap contracts - - - -Option contracts - - - -Mortgage dollar rolls - - - -Foreign exchange transactions (8,897) 8,273 (311,991) 529
Capital gains tax - - (13,232) -NET INCREASE/(DECREASE) IN NET ASSETS AS A RESULT OF OPERATIONS 10,535,458 14,299,804 (5,780,992) 12,319,619MOVEMENT OF CAPITALIssue of shares 168,632,563 12,247,957 270,761,954 17,513,080Redemption of shares (81,040,291) (144,971,187) (334,019,837) (116,009,220)Equalisation (note 24) 90,621 2,060 (849,201) (1,794)
87,682,893 (132,721,170) (64,107,084) (98,497,934)
Dividends paid/accumulated (note 25) (460,465) (29,899) (27,012,295) (78,886)NET INCREASE/(DECREASE) IN NET ASSETSAS A RESULT OF MOVEMENT IN CAPITAL 87,222,428 (132,751,069) (91,119,379) (98,576,820)
NET ASSETS AT THE END OF THE YEAR 206,962,616 - 1,953,764,526 -
Portfolio Turnover Ratio (note 26) 22.76% N/A 39.99% N/A
2 This Fund was merged into Franklin World Perspectives Fund on January 19, 20183 This Fund was merged into Franklin High Yield Fund on October 20, 2017
FRANKLIN TEMPLETON INVESTMENT FUNDS
Statement of Operations and Changes in Net AssetsFor the Year ended June 30, 2018 (continued)
The accompanying notes form an integral part of these financial statements
36 Audited Annual Report www.franklintempleton.lu

FranklinGlobal High
Income BondFund3
FranklinGlobal ListedInfrastructure
Fund
FranklinGlobal
Multi-AssetIncome Fund
FranklinGlobal
Real EstateFund
FranklinGlobal
Small-Mid CapGrowth Fund
FranklinGold andPrecious
Metals Fund
FranklinHighYieldFund
(USD) (USD) (EUR) (USD) (USD) (USD) (USD)
46,927,608 69,873,407 339,752,720 251,611,501 163,701,065 250,181,745 2,466,883,234- - - - - - -
46,927,608 69,873,407 339,752,720 251,611,501 163,701,065 250,181,745 2,466,883,234
9,327 2,176,812 4,673,511 6,083,667 3,293,482 1,469,614 82,682803,007 - 3,480,866 - - 35,338 127,470,830
- 10,535 38,335 23,067 13,709 7,619 126,818- - - - - - -- - 6,223,673 - - - -
8,098 - 4,719 - - - 2,555,155820,432 2,187,347 14,421,104 6,106,734 3,307,191 1,512,571 130,235,485
100,588 600,414 2,831,759 2,069,720 1,385,553 2,403,426 17,538,67629,877 163,521 798,609 556,576 348,303 604,337 5,273,569
30 149 713 462 299 493 4,58810,245 23,249 149,561 96,746 67,711 123,277 1,121,633
683 3,109 10,951 18,064 21,169 13,044 72,7473,936 11,538 10,465 12,309 9,786 9,993 15,8091,044 5,449 26,145 16,924 10,942 18,022 167,816
- - 157,843 415 13,760 800 847- - - - - - -
33,477 153,876 778,354 546,555 557,805 903,720 7,262,830- - - - - - -- - - - - - -- - - 128,688 22,129 - 3,515,918- - 24,575 214,671 - - 320,527- - - - - - 245,529- - 149,804 - - - -
36,594 103,764 1,280,894 400,955 178,186 738,210 794,8434,197 18,157 86,349 55,896 36,831 61,949 557,548
220,671 1,083,226 6,306,022 4,117,981 2,652,474 4,877,271 36,892,880
(4,673) (2,375) - - - - -215,998 1,080,851 6,306,022 4,117,981 2,652,474 4,877,271 36,892,880
604,434 1,106,496 8,115,082 1,988,753 654,717 (3,364,700) 93,342,605(109,777) 5,354,814 (1,301,260) 4,892,469 (6,552,271) (3,228,255) (20,085,740)
5,076 (13,995) 2,140,541 541,929 - (169,886) 1,926,935- - (4,568,828) - - - -- - - - - - -- - - - - - -- - - - - - -- - (535,514) - - - -- - (21,863) - - - -- - - - - - -- - (2,242,433) - - - -- - - - - - -
13,155 43,259 (123,589) (10,299) 275 (10,332) (5,466)512,888 6,490,574 1,462,136 7,412,852 (5,897,279) (6,773,173) 75,178,334
494,593 (4,600,529) (11,851,869) 1,429,638 8,957,002 (31,888,856) (55,467,913)(1,535) (14,749) (1,875,690) (373,863) - (326,656) (1,268,283)
- - (138,609) - - - -- - - - - - -- - - - - - -- - - - - - -- - (556,753) - - - -- - 385,569 - - - -- - 49,679 - - - -- - (95,569) - - - -- - - - - - -
(2,214) (6,861) 29,719 (4,246) 23,064 96 (3,118)- - - - - - -
1,003,732 1,868,435 (12,591,387) 8,464,381 3,082,787 (38,988,589) 18,439,020
4,378,197 37,599,403 120,891,860 57,432,994 43,733,762 106,323,945 369,547,315(51,367,980) (26,287,106) (105,238,137) (108,148,827) (98,251,311) (101,475,026) (786,013,884)
(15,061) (114,037) (827,283) (167,596) (99,618) - (1,755,089)(47,004,844) 11,198,260 14,826,440 (50,883,429) (54,617,167) 4,848,919 (418,221,658)
(926,496) (1,986,232) (19,933,407) (5,971,131) (702,775) - (131,222,438)
(47,931,340) 9,212,028 (5,106,967) (56,854,560) (55,319,942) 4,848,919 (549,444,096)
- 80,953,870 322,054,366 203,221,322 111,463,910 216,042,075 1,935,878,158
N/A 155.88% 130.65% 24.90% 21.62% (4.03)% 22.21%
FRANKLIN TEMPLETON INVESTMENT FUNDS
Statement of Operations and Changes in Net AssetsFor the Year ended June 30, 2018 (continued)
The accompanying notes form an integral part of these financial statements
www.franklintempleton.lu Audited Annual Report 37

FranklinIncome
Fund
FranklinIndiaFund
FranklinJapanFund
Franklin K2AlternativeStrategies
Fund(USD) (USD) (JPY) (USD)
NET ASSETS AT THE BEGINNING OF THE YEAR 2,200,863,666 4,279,578,096 32,561,977,383 1,320,092,754Currency translation adjustment - - - -
2,200,863,666 4,279,578,096 32,561,977,383 1,320,092,754INCOMEDividends (net of withholding taxes) (note 2(n)) 38,222,617 35,704,707 508,845,133 4,943,356Interest on bonds (net of withholding taxes) (note 2(n)) 52,412,288 - - 35,757,383Bank interest 60,205 747,745 - -Securities lending (notes 2(o), 15) - - - -Net interest income on swaps - - - -Sundry income 354,829 69,391 - 78,612TOTAL INCOME 91,049,939 36,521,843 508,845,133 40,779,351EXPENSESInvestment management fees (note 16) 16,180,698 35,113,014 252,556,884 34,384,447Administration and transfer agency fees 4,596,925 9,382,727 73,050,327 4,107,678Directors fees 3,993 8,670 64,056 3,554Subscription tax (note 19) 980,463 1,237,707 7,789,636 560,009Custodian fees 67,084 2,982,464 3,700,568 711,513Audit fees 13,426 16,142 1,109,280 13,115Printing and publishing expenses 145,968 317,694 2,348,821 130,823Bank charges 4,912 29,419 1,050,368 -Net interest expenses on swaps - - - 563,296Class A (dis) and Class A (acc) shares’ maintenance charges (note 20) 5,806,089 8,166,283 43,937,973 2,750,595Class AS (dis) and Class AS (acc) shares’ maintenance charges (note 20) - 10,369 - -Class AX (acc) shares’ maintenance charges (note 20) - - - -Class B (dis) and Class B (acc) shares’ maintenance and service charges (note 20) 1,915,364 338,794 - -Class C (dis) and Class C (acc) shares’ maintenance charges (note 20) 2,319,857 141,684 3,831,522 57,316Class F (dis) and Class F (acc) shares’ maintenance and service charges (note 20) 216,358 - - -Class G (dis) and Class G (acc) shares’ maintenance and service charges (note 20) - - - 19,652Class N (dis) and Class N (acc) shares’ maintenance charges (note 20) 3,052,106 2,780,167 29,155,694 2,961,131Other charges 538,252 1,078,968 7,674,225 820,741TOTAL EXPENSES 35,841,495 61,604,102 426,269,354 47,083,870
Expenses reimbursement (note 21) (1,985) (16,256) (29,110) (3,084,018)NET EXPENSES 35,839,510 61,587,846 426,240,244 43,999,852
NET PROFIT/(LOSS) FROM INVESTMENTS 55,210,429 (25,066,003) 82,604,889 (3,220,501)Net realised profit/(loss) on sale of investments 76,640,550 413,455,470 5,250,953,135 42,841,608Net realised profit/(loss) on forward foreign exchange contracts 1,150,275 2,055,785 (1,763,267) (13,698,454)Net realised profit/(loss) on financial future contracts - - - (9,540,170)Net realised profit/(loss) on cross currency swap contracts - - - (500,891)Net realised profit/(loss) on interest rate swap contracts - - - 502,951Net realised profit/(loss) on inflation swap contracts - - - (47,973)Net realised profit/(loss) on total return swap contracts - - - 3,136,349Net realised profit/(loss) on volatility swap contracts - - - -Net realised profit/(loss) on credit default swap contracts - - - (279,699)Net realised profit/(loss) on option contracts 5,449,541 - - (4,492,090)Net realised profit/(loss) on mortgage dollar rolls - - - -Net realised profit/(loss) on foreign exchange transactions (72,565) (4,884,269) (3,092,913) 1,492,881NET REALISED PROFIT/(LOSS) FOR THE YEAR 138,378,230 385,560,983 5,328,701,844 16,194,011Change in net unrealised appreciation/(depreciation) on:
Investments (72,095,704) (273,937,236) (2,383,821,164) 20,210,123Forward foreign exchange contracts (1,183,198) (2,223,253) (7,219,919) (28,690,705)Financial future contracts - - - 1,589,120Interest rate swap contracts - - - 292,463Inflation swap contracts - - - (215,305)Cross currency swap contracts - - - 23,320Total return swap contracts - - - 2,882,215Volatility swap contracts - - - -Credit default swap contracts - - - 414,830Option contracts (473,951) - - (1,114,401)Mortgage dollar rolls - - - -Foreign exchange transactions (14,502) (110,607) (2,335,740) 318,388
Capital gains tax - - - -NET INCREASE/(DECREASE) IN NET ASSETS AS A RESULT OF OPERATIONS 64,610,875 109,289,887 2,935,325,021 11,904,059MOVEMENT OF CAPITALIssue of shares 416,548,114 1,234,043,989 21,801,535,360 1,612,234,594Redemption of shares (923,707,176) (2,316,808,712) (30,223,849,098) (571,146,211)Equalisation (note 24) (19,898) 68 (19,161,075) 37,882,656
(507,178,960) (1,082,764,655) (8,441,474,813) 1,078,971,039
Dividends paid/accumulated (note 25) (88,545,087) (80) (118,416,271) (35,225)NET INCREASE/(DECREASE) IN NET ASSETSAS A RESULT OF MOVEMENT IN CAPITAL (595,724,047) (1,082,764,735) (8,559,891,084) 1,078,935,814
NET ASSETS AT THE END OF THE YEAR 1,669,750,494 3,306,103,248 26,937,411,320 2,410,932,627
Portfolio Turnover Ratio (note 26) 59.83% 38.92% 408.80% 183.58%
FRANKLIN TEMPLETON INVESTMENT FUNDS
Statement of Operations and Changes in Net AssetsFor the Year ended June 30, 2018 (continued)
The accompanying notes form an integral part of these financial statements
38 Audited Annual Report www.franklintempleton.lu
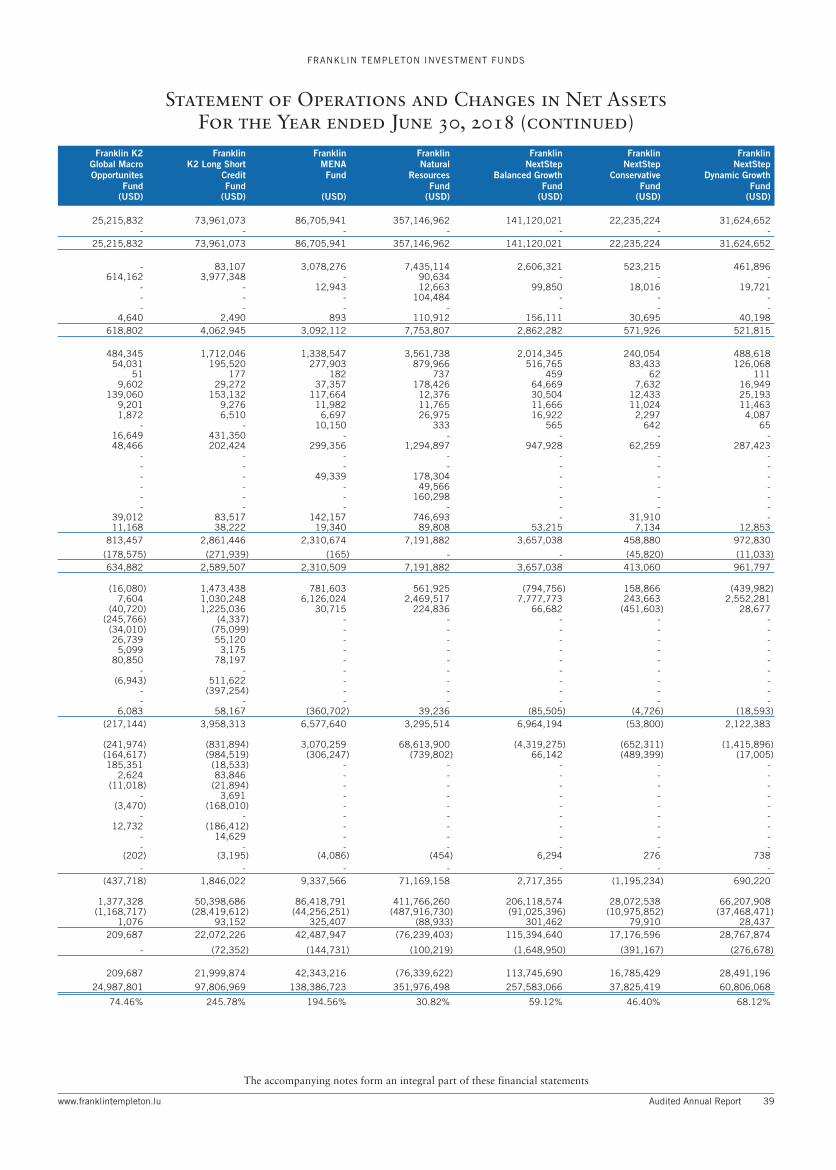
Franklin K2Global MacroOpportunites
Fund
FranklinK2 Long Short
CreditFund
FranklinMENAFund
FranklinNatural
ResourcesFund
FranklinNextStep
Balanced GrowthFund
FranklinNextStep
ConservativeFund
FranklinNextStep
Dynamic GrowthFund
(USD) (USD) (USD) (USD) (USD) (USD) (USD)
25,215,832 73,961,073 86,705,941 357,146,962 141,120,021 22,235,224 31,624,652- - - - - - -
25,215,832 73,961,073 86,705,941 357,146,962 141,120,021 22,235,224 31,624,652
- 83,107 3,078,276 7,435,114 2,606,321 523,215 461,896614,162 3,977,348 - 90,634 - - -
- - 12,943 12,663 99,850 18,016 19,721- - - 104,484 - - -- - - - - - -
4,640 2,490 893 110,912 156,111 30,695 40,198618,802 4,062,945 3,092,112 7,753,807 2,862,282 571,926 521,815
484,345 1,712,046 1,338,547 3,561,738 2,014,345 240,054 488,61854,031 195,520 277,903 879,966 516,765 83,433 126,068
51 177 182 737 459 62 1119,602 29,272 37,357 178,426 64,669 7,632 16,949
139,060 153,132 117,664 12,376 30,504 12,433 25,1939,201 9,276 11,982 11,765 11,666 11,024 11,4631,872 6,510 6,697 26,975 16,922 2,297 4,087
- - 10,150 333 565 642 6516,649 431,350 - - - - -48,466 202,424 299,356 1,294,897 947,928 62,259 287,423
- - - - - - -- - - - - - -- - 49,339 178,304 - - -- - - 49,566 - - -- - - 160,298 - - -- - - - - - -
39,012 83,517 142,157 746,693 - 31,910 -11,168 38,222 19,340 89,808 53,215 7,134 12,853
813,457 2,861,446 2,310,674 7,191,882 3,657,038 458,880 972,830
(178,575) (271,939) (165) - - (45,820) (11,033)634,882 2,589,507 2,310,509 7,191,882 3,657,038 413,060 961,797
(16,080) 1,473,438 781,603 561,925 (794,756) 158,866 (439,982)7,604 1,030,248 6,126,024 2,469,517 7,777,773 243,663 2,552,281
(40,720) 1,225,036 30,715 224,836 66,682 (451,603) 28,677(245,766) (4,337) - - - - -
(34,010) (75,099) - - - - -26,739 55,120 - - - - -
5,099 3,175 - - - - -80,850 78,197 - - - - -
- - - - - - -(6,943) 511,622 - - - - -
- (397,254) - - - - -- - - - - - -
6,083 58,167 (360,702) 39,236 (85,505) (4,726) (18,593)(217,144) 3,958,313 6,577,640 3,295,514 6,964,194 (53,800) 2,122,383
(241,974) (831,894) 3,070,259 68,613,900 (4,319,275) (652,311) (1,415,896)(164,617) (984,519) (306,247) (739,802) 66,142 (489,399) (17,005)185,351 (18,533) - - - - -
2,624 83,846 - - - - -(11,018) (21,894) - - - - -
- 3,691 - - - - -(3,470) (168,010) - - - - -
- - - - - - -12,732 (186,412) - - - - -
- 14,629 - - - - -- - - - - - -
(202) (3,195) (4,086) (454) 6,294 276 738- - - - - - -
(437,718) 1,846,022 9,337,566 71,169,158 2,717,355 (1,195,234) 690,220
1,377,328 50,398,686 86,418,791 411,766,260 206,118,574 28,072,538 66,207,908(1,168,717) (28,419,612) (44,256,251) (487,916,730) (91,025,396) (10,975,852) (37,468,471)
1,076 93,152 325,407 (88,933) 301,462 79,910 28,437209,687 22,072,226 42,487,947 (76,239,403) 115,394,640 17,176,596 28,767,874
- (72,352) (144,731) (100,219) (1,648,950) (391,167) (276,678)
209,687 21,999,874 42,343,216 (76,339,622) 113,745,690 16,785,429 28,491,196
24,987,801 97,806,969 138,386,723 351,976,498 257,583,066 37,825,419 60,806,068
74.46% 245.78% 194.56% 30.82% 59.12% 46.40% 68.12%
FRANKLIN TEMPLETON INVESTMENT FUNDS
Statement of Operations and Changes in Net AssetsFor the Year ended June 30, 2018 (continued)
The accompanying notes form an integral part of these financial statements
www.franklintempleton.lu Audited Annual Report 39

FranklinNextStep
GrowthFund
FranklinNextStepModerate
Fund
FranklinNextStep
Stable GrowthFund
FranklinReal
ReturnFund4
(USD) (USD) (USD) (USD)
NET ASSETS AT THE BEGINNING OF THE YEAR 14,170,474 39,419,097 19,876,634 9,881,702Currency translation adjustment - - - -
14,170,474 39,419,097 19,876,634 9,881,702INCOMEDividends (net of withholding taxes) (note 2(n)) 196,150 692,672 407,233 11,024Interest on bonds (net of withholding taxes) (note 2(n)) - - - 80,960Bank interest 7,469 26,114 11,576 121Securities lending (notes 2(o), 15) - - - -Net interest income on swaps - - - 3,788Sundry income 12,081 36,170 24,501 2,639TOTAL INCOME 215,700 754,956 443,310 98,532EXPENSESInvestment management fees (note 16) 215,120 544,097 180,019 30,753Administration and transfer agency fees 55,295 161,128 49,595 10,848Directors fees 44 121 45 -Subscription tax (note 19) 6,039 15,666 5,349 2,414Custodian fees 13,830 18,706 11,610 321Audit fees 11,014 11,058 11,425 2,803Printing and publishing expenses 1,632 4,439 1,661 2,917Bank charges 49 2,072 - -Net interest expenses on swaps - - - -Class A (dis) and Class A (acc) shares’ maintenance charges (note 20) 70,640 140,968 67,508 13,135Class AS (dis) and Class AS (acc) shares’ maintenance charges (note 20) - - - -Class AX (acc) shares’ maintenance charges (note 20) - - - -Class B (dis) and Class B (acc) shares’ maintenance and service charges (note 20) - - - -Class C (dis) and Class C (acc) shares’ maintenance charges (note 20) - - - -Class F (dis) and Class F (acc) shares’ maintenance and service charges (note 20) - - - -Class G (dis) and Class G (acc) shares’ maintenance and service charges (note 20) - - - -Class N (dis) and Class N (acc) shares’ maintenance charges (note 20) 53,186 127,009 - 14,734Other charges 5,118 13,642 5,410 155TOTAL EXPENSES 431,967 1,038,906 332,622 78,080
Expenses reimbursement (note 21) (40,049) (89,224) (24,318) (14,989)NET EXPENSES 391,918 949,682 308,304 63,091
NET PROFIT/(LOSS) FROM INVESTMENTS (176,218) (194,726) 135,006 35,441Net realised profit/(loss) on sale of investments 693,806 1,475,114 589,455 (2,602)Net realised profit/(loss) on forward foreign exchange contracts 21,103 (327,998) 24,160 87,236Net realised profit/(loss) on financial future contracts - - - -Net realised profit/(loss) on cross currency swap contracts - - - -Net realised profit/(loss) on interest rate swap contracts - - - -Net realised profit/(loss) on inflation swap contracts - - - -Net realised profit/(loss) on total return swap contracts - - - -Net realised profit/(loss) on volatility swap contracts - - - -Net realised profit/(loss) on credit default swap contracts - - - (11,900)Net realised profit/(loss) on option contracts - - - -Net realised profit/(loss) on mortgage dollar rolls - - - -Net realised profit/(loss) on foreign exchange transactions (16,809) (21,761) (2,650) (2,562)NET REALISED PROFIT/(LOSS) FOR THE YEAR 521,882 930,629 745,971 105,613Change in net unrealised appreciation/(depreciation) on:
Investments 274,719 (230,995) (675,194) 30,237Forward foreign exchange contracts (91,059) (1,274,836) (27,638) (44,504)Financial future contracts - - - -Interest rate swap contracts - - - -Inflation swap contracts - - - -Cross currency swap contracts - - - -Total return swap contracts - - - -Volatility swap contracts - - - -Credit default swap contracts - - - 4,386Option contracts - - - -Mortgage dollar rolls - - - -Foreign exchange transactions 876 846 134 (4,478)
Capital gains tax - - - 15NET INCREASE/(DECREASE) IN NET ASSETS AS A RESULT OF OPERATIONS 706,418 (574,356) 43,273 91,269MOVEMENT OF CAPITALIssue of shares 18,193,624 58,266,135 13,301,337 1,343,559Redemption of shares (5,968,208) (21,192,863) (10,697,213) (11,269,388)Equalisation (note 24) 36,317 153,284 (3,195) (8,392)
12,261,733 37,226,556 2,600,929 (9,934,221)
Dividends paid/accumulated (note 25) (154,272) (487,154) (351,826) (38,750)NET INCREASE/(DECREASE) IN NET ASSETSAS A RESULT OF MOVEMENT IN CAPITAL 12,107,461 36,739,402 2,249,103 (9,972,971)
NET ASSETS AT THE END OF THE YEAR 26,984,353 75,584,143 22,169,010 -
Portfolio Turnover Ratio (note 26) 43.99% 53.06% 23.20% N/A
4 This Fund was closed on December 12, 2017
FRANKLIN TEMPLETON INVESTMENT FUNDS
Statement of Operations and Changes in Net AssetsFor the Year ended June 30, 2018 (continued)
The accompanying notes form an integral part of these financial statements
40 Audited Annual Report www.franklintempleton.lu

FranklinStrategic
IncomeFund
FranklinTechnology
Fund
FranklinU.S. Dollar
Liquid ReserveFund
FranklinU.S.
EquityFund
FranklinU.S.
GovernmentFund
FranklinU.S. LowDuration
Fund
FranklinU.S.
OpportunitiesFund
(USD) (USD) (USD) (USD) (USD) (USD) (USD)
1,123,520,954 1,229,456,650 310,691,013 461,625,826 855,045,873 1,184,520,738 2,937,414,397- - - - - - -
1,123,520,954 1,229,456,650 310,691,013 461,625,826 855,045,873 1,184,520,738 2,937,414,397
1,357,765 10,160,166 - 3,710,085 - - 16,661,12738,761,961 95,065 4,329,255 71,627 23,652,904 28,275,487 160,010
330,954 300,394 1,181 17,285 35,804 138,599 467,952- 515,253 - 17,623 - - 117,593
3,866,984 - - - - - -349,848 8,840 - 23,241 201 33,543 861,693
44,667,512 11,079,718 4,330,436 3,839,861 23,688,909 28,447,629 18,268,375
7,657,466 17,644,485 920,149 4,049,873 4,298,955 5,827,722 30,964,6352,513,591 4,276,579 400,997 972,056 1,689,247 2,289,951 7,530,645
2,229 3,559 625 901 1,533 2,197 6,596477,096 770,577 31,449 207,225 312,650 401,146 1,380,951
41,944 61,032 10,431 14,373 23,107 41,706 105,50110,405 14,170 10,270 11,568 12,458 13,381 14,67381,618 131,151 22,915 32,978 56,067 80,266 242,06642,221 - 238 894 4,283 56,941 12,054
- - - - - 1,563,369 -3,006,285 6,797,226 250,206 1,520,178 1,250,022 1,689,049 10,493,142
- - - - - - 46,350- - - - 216,406 198,897 -
92,421 116,510 45,982 80,513 131,052 136,315 435,948947,643 572,675 49,579 355,731 191,470 208,956 1,419,410
- - 34,936 - - - 61,318- - - - - - -
1,706,644 2,385,401 389,353 588,744 494,718 412,366 4,210,391271,570 400,211 74,670 109,689 205,265 275,602 766,615
16,851,133 33,173,576 2,241,800 7,944,723 8,887,233 13,197,864 57,690,295
(1,543,448) (58,158) (1,003,343) (294) (128,285) (767,521) (832)15,307,685 33,115,418 1,238,457 7,944,429 8,758,948 12,430,343 57,689,463
29,359,827 (22,035,700) 3,091,979 (4,104,568) 14,929,961 16,017,286 (39,421,088)(20,759,601) 73,528,789 (17,709) 71,145,286 (2,364,308) (5,085,913) 133,362,932
(3,214,871) (271,229) - 146,976 6,148,678 11,986,176 (5,181,734)(221,231) - - - - (2,226,849) -
- - - - - - -- - - - - (639,500) -- - - - - 356,400 -
87,071 - - - - 62,373 -- - - - - - -
(686,772) - - - - (1,411,142) -- - - 31,284 - - -
(1,576,695) - - - 39,283 (195,341) -(204,780) 286,176 - 8,203 (58,277) (87,837) (253,046)
2,782,948 51,508,036 3,074,270 67,227,181 18,695,337 18,775,653 88,507,064
(11,656,799) 380,472,248 1,283 (24,188,500) (19,602,177) (9,154,526) 581,481,7041,124,978 (95,993) - (188,283) (1,739,996) (4,531,948) (2,211,364)
76,708 - - - - (252,876) -- - - - - (235,591) -- - - - - 254,246 -
(13,778) - - - - (3,267) -2,779,214 - - - - 1,453,373 -
- - - - - - -(1,307,617) - - - - 1,982,982 -
- - - - - - -376,251 - - - - 16,611 -(34,586) (19,499) - 855 (401) (14,519) 10,134
(4,865) - - - - (125) -(5,877,546) 431,864,792 3,075,553 42,851,253 (2,647,237) 8,290,013 667,787,538
384,316,539 2,263,019,467 390,464,745 77,365,887 195,163,680 339,332,229 1,633,308,410(489,477,867) (1,299,817,264) (370,820,441) (161,610,182) (406,436,901) (766,730,252) (1,356,580,234)
(389,317) 76,894 15,571 10,373 (814,095) (429,776) 20,813(105,550,645) 963,279,097 19,659,875 (84,233,922) (212,087,316) (427,827,799) 276,748,989
(47,066,934) (17) (820,035) (247,108) (14,519,290) (15,287,814) (74,044)
(152,617,579) 963,279,080 18,839,840 (84,481,030) (226,606,606) (443,115,613) 276,674,945
965,025,829 2,624,600,522 332,606,406 419,996,049 625,792,030 749,695,138 3,881,876,880
221.01% 26.86% N/A 175.80% 57.90% 64.84% 25.63%
FRANKLIN TEMPLETON INVESTMENT FUNDS
Statement of Operations and Changes in Net AssetsFor the Year ended June 30, 2018 (continued)
The accompanying notes form an integral part of these financial statements
www.franklintempleton.lu Audited Annual Report 41

FranklinU.S. Small-Mid
Cap GrowthFund5
FranklinWorld
PerspectivesFund
FranklinMutual
EuropeanFund
FranklinMutual Global
DiscoveryFund
(USD) (USD) (EUR) (USD)
NET ASSETS AT THE BEGINNING OF THE YEAR 165,121,050 312,784,198 1,613,768,701 980,850,083Currency translation adjustment - - - -
165,121,050 312,784,198 1,613,768,701 980,850,083INCOMEDividends (net of withholding taxes) (note 2(n)) 177,340 5,431,743 42,540,165 21,914,776Interest on bonds (net of withholding taxes) (note 2(n)) 9,241 - 636,058 1,969,836Bank interest - 225,632 5,989 16,679Securities lending (notes 2(o), 15) 3,824 - - 219,646Net interest income on swaps - - - -Sundry income 2,035 4,587 13,550 231,929TOTAL INCOME 192,440 5,661,962 43,195,762 24,352,866EXPENSESInvestment management fees (note 16) 521,731 3,165,472 13,116,286 8,127,242Administration and transfer agency fees 134,650 933,658 3,290,680 2,051,462Directors fees 112 718 3,026 1,800Subscription tax (note 19) 37,551 113,153 561,989 372,371Custodian fees 1,726 47,972 166,277 59,599Audit fees 3,198 7,491 11,292 12,369Printing and publishing expenses 3,947 26,250 110,828 65,813Bank charges - 1,892 151,200 30,123Net interest expenses on swaps - - - -Class A (dis) and Class A (acc) shares’ maintenance charges (note 20) 191,309 837,136 4,074,616 2,513,527Class AS (dis) and Class AS (acc) shares’ maintenance charges (note 20) - - - -Class AX (acc) shares’ maintenance charges (note 20) - - - -Class B (dis) and Class B (acc) shares’ maintenance and service charges (note 20) 11,023 - 100,758 45,134Class C (dis) and Class C (acc) shares’ maintenance charges (note 20) 64,780 - 167,798 382,347Class F (dis) and Class F (acc) shares’ maintenance and service charges (note 20) - - - -Class G (dis) and Class G (acc) shares’ maintenance and service charges (note 20) - - - -Class N (dis) and Class N (acc) shares’ maintenance charges (note 20) 53,453 768,790 1,540,233 1,638,437Other charges 15,839 69,209 378,304 227,309TOTAL EXPENSES 1,039,319 5,971,741 23,673,287 15,527,533
Expenses reimbursement (note 21) - - (15,626) (38)NET EXPENSES 1,039,319 5,971,741 23,657,661 15,527,495
NET PROFIT/(LOSS) FROM INVESTMENTS (846,879) (309,779) 19,538,101 8,825,371Net realised profit/(loss) on sale of investments 7,037,411 33,288,403 76,954,727 51,519,196Net realised profit/(loss) on forward foreign exchange contracts - (245,423) (455,007) 3,061,924Net realised profit/(loss) on financial future contracts - - - -Net realised profit/(loss) on cross currency swap contracts - - - -Net realised profit/(loss) on interest rate swap contracts - - - -Net realised profit/(loss) on inflation swap contracts - - - -Net realised profit/(loss) on total return swap contracts - - - -Net realised profit/(loss) on volatility swap contracts - - - -Net realised profit/(loss) on credit default swap contracts - - - -Net realised profit/(loss) on option contracts - - - -Net realised profit/(loss) on mortgage dollar rolls - - - -Net realised profit/(loss) on foreign exchange transactions - (461,783) (1,318,959) 800,349NET REALISED PROFIT/(LOSS) FOR THE YEAR 6,190,532 32,271,418 94,718,862 64,206,840Change in net unrealised appreciation/(depreciation) on:
Investments 3,975,569 (17,815,482) (112,127,701) (61,995,143)Forward foreign exchange contracts - - 792,857 (2,239,687)Financial future contracts - - - -Interest rate swap contracts - - - -Inflation swap contracts - - - -Cross currency swap contracts - - - -Total return swap contracts - - - -Volatility swap contracts - - - -Credit default swap contracts - - - -Option contracts - - - -Mortgage dollar rolls - - - -Foreign exchange transactions - (11,575) (9,135) 41,559
Capital gains tax - - - -NET INCREASE/(DECREASE) IN NET ASSETS AS A RESULT OF OPERATIONS 10,166,101 14,444,361 (16,625,117) 13,569MOVEMENT OF CAPITALIssue of shares 15,250,362 250,985,270 222,430,540 118,680,238Redemption of shares (190,537,513) (154,794,454) (608,615,891) (332,686,713)Equalisation (note 24) - (38,660) (1,564,448) (647,232)
(175,287,151) 96,152,156 (387,749,799) (214,653,707)
Dividends paid/accumulated (note 25) - (743,312) (15,874,233) (5,015,548)NET INCREASE/(DECREASE) IN NET ASSETSAS A RESULT OF MOVEMENT IN CAPITAL (175,287,151) 95,408,844 (403,624,032) (219,669,255)
NET ASSETS AT THE END OF THE YEAR - 422,637,403 1,193,519,552 761,194,397
Portfolio Turnover Ratio (note 26) N/A 80.46% 24.90% 20.04%
5 This Fund was merged into Franklin U.S. Opportunities Fund on November 3, 20176 This Fund had its name changed effective on January 31, 2018 (refer to Note 1)7 This Fund was closed on December 12, 20178 This Fund was closed on October 25, 2017
FRANKLIN TEMPLETON INVESTMENT FUNDS
Statement of Operations and Changes in Net AssetsFor the Year ended June 30, 2018 (continued)
The accompanying notes form an integral part of these financial statements
42 Audited Annual Report www.franklintempleton.lu

FranklinMutual
U.S. ValueFund6
TempletonAfricaFund
TempletonASEANFund7
TempletonAsianBondFund
TempletonAsian
DividendFund8
TempletonAsian
GrowthFund
TempletonAsian Smaller
CompaniesFund
(USD) (USD) (USD) (USD) (USD) (USD) (USD)
750,634,285 68,140,124 3,246,239 673,256,171 2,887,250 4,944,781,465 1,577,382,433- - - - - - -
750,634,285 68,140,124 3,246,239 673,256,171 2,887,250 4,944,781,465 1,577,382,433
12,382,382 2,350,333 23,132 - 33,970 117,696,461 26,749,6482,146,890 - - 31,316,232 - - -
1,748 228,818 328 320,555 - 345,042 743,095- - - - - 80,391 -- - - - - - -
227,708 - 216 111,954 - 83,192 -14,758,728 2,579,151 23,676 31,748,741 33,970 118,205,086 27,492,743
5,827,085 1,203,466 19,575 4,255,902 12,415 60,880,019 18,809,6201,469,389 269,789 3,815 1,349,896 2,605 10,734,119 3,967,373
1,305 157 - 1,304 - 9,754 3,460275,370 38,742 800 287,120 724 2,172,280 549,239
23,441 89,878 2,171 328,280 371 2,478,648 942,62612,797 11,018 5,564 9,246 6,065 15,047 14,11547,652 5,757 440 47,741 496 356,886 126,939
3,566 2,770 - 111,662 - 93,955 -- - - 1,316,675 - - -
1,690,003 263,330 7,250 1,301,715 2,652 18,656,725 4,034,558- - - - - - -- - - - - - -
25,063 - - 54,797 - 248,758 80,772463,204 - - 104,555 - 407,556 -
- - - - - - 266,899- - - - - - -
1,178,932 153,704 - 449,740 3,893 2,922,663 669,797155,946 21,892 - 154,739 1,561 2,191,912 428,101
11,173,753 2,060,503 39,615 9,773,372 30,782 101,168,322 29,893,499
(422) (196,310) (7,496) (13,586) (8,148) (5,841) (27,791)11,173,331 1,864,193 32,119 9,759,786 22,634 101,162,481 29,865,708
3,585,397 714,958 (8,443) 21,988,955 11,336 17,042,605 (2,372,965)69,317,813 (508,425) 436,058 (3,618,151) 642,901 443,874,347 64,682,181
328,264 383,671 - 4,727,685 - 3,334,176 (5,777)- - - - - - -- - - - - - -- - - - - - -- - - - - - -- - - - - - -- - - - - - -- - - - - - -- - - - - - -- - - - - - -
35,319 41,492 (3,304) (703,720) (3,220) (1,999,576) 206,16873,266,793 631,696 424,311 22,394,769 651,017 462,251,552 62,509,607
(64,823,483) 4,712,387 (235,104) (33,702,799) (372,313) (255,618,847) 48,779,355(259,178) (800,227) - (3,250,268) - (6,620,082) (876)
- - - - - - -- - - 8,088,574 - - -- - - - - - -- - - - - - -- - - - - - -- - - - - - -- - - - - - -- - - - - - -- - - - - - -
14,543 (1,695) - (304,606) (3,331) (144,940) (20,564)- - - (49,722) - - -
8,198,675 4,542,161 189,207 (6,824,052) 275,373 199,867,683 111,267,522
101,091,050 46,119,919 209,152 184,175,851 130,297 900,620,760 872,238,016(367,144,829) (43,360,088) (3,620,367) (268,744,215) (3,215,133) (2,229,528,678) (887,827,047)
(993,469) (33,084) - (330,088) (9,175) (2,546,564) (22,659)(267,047,248) 2,726,747 (3,411,215) (84,898,452) (3,094,011) (1,331,454,482) (15,611,690)
(1,162,094) (755,256) (24,231) (33,659,234) (68,612) (17,801,919) (7,060,954)
(268,209,342) 1,971,491 (3,435,446) (118,557,686) (3,162,623) (1,349,256,401) (22,672,644)
490,623,618 74,653,776 - 547,874,433 - 3,795,392,747 1,665,977,311
22.44% 12.14% N/A (11.90)% N/A 59.50% 9.34%
FRANKLIN TEMPLETON INVESTMENT FUNDS
Statement of Operations and Changes in Net AssetsFor the Year ended June 30, 2018 (continued)
The accompanying notes form an integral part of these financial statements
www.franklintempleton.lu Audited Annual Report 43

TempletonBRICFund
TempletonChinaFund
TempletonEasternEurope
Fund
TempletonEmerging
MarketsFund
(USD) (USD) (EUR) (USD)
NET ASSETS AT THE BEGINNING OF THE YEAR 761,260,242 525,402,818 310,573,410 768,743,294Currency translation adjustment - - - -
761,260,242 525,402,818 310,573,410 768,743,294INCOMEDividends (net of withholding taxes) (note 2(n)) 20,817,042 14,902,539 9,954,061 20,659,574Interest on bonds (net of withholding taxes) (note 2(n)) - - - -Bank interest 317,643 101,450 - 379,625Securities lending (notes 2(o), 15) - - - -Net interest income on swaps - - - -Sundry income 24,267 2,605 81 3,287TOTAL INCOME 21,158,952 15,006,594 9,954,142 21,042,486EXPENSESInvestment management fees (note 16) 13,562,994 8,514,606 4,792,573 13,405,468Administration and transfer agency fees 2,077,012 1,283,432 805,318 2,323,937Directors fees 1,720 1,101 651 1,937Subscription tax (note 19) 417,164 262,372 144,098 378,281Custodian fees 308,961 128,046 250,979 380,924Audit fees 11,124 12,741 9,512 13,993Printing and publishing expenses 63,057 40,346 23,849 71,272Bank charges 1,532 3,934 75,528 2,345Net interest expenses on swaps - - - -Class A (dis) and Class A (acc) shares’ maintenance charges (note 20) 3,912,995 2,383,635 1,213,366 3,048,141Class AS (dis) and Class AS (acc) shares’ maintenance charges (note 20) - - - -Class AX (acc) shares’ maintenance charges (note 20) - - - -Class B (dis) and Class B (acc) shares’ maintenance and service charges (note 20) 50,116 186,138 35,823 55,872Class C (dis) and Class C (acc) shares’ maintenance charges (note 20) 107,572 76,278 - 225,097Class F (dis) and Class F (acc) shares’ maintenance and service charges (note 20) - - - -Class G (dis) and Class G (acc) shares’ maintenance and service charges (note 20) - - - -Class N (dis) and Class N (acc) shares’ maintenance charges (note 20) 489,755 219,050 268,796 627,824Other charges 537,667 131,150 152,924 378,512TOTAL EXPENSES 21,541,669 13,242,829 7,773,417 20,913,603
Expenses reimbursement (note 21) - (1,448) (16,799) (193,546)NET EXPENSES 21,541,669 13,241,381 7,756,618 20,720,057
NET PROFIT/(LOSS) FROM INVESTMENTS (382,717) 1,765,213 2,197,524 322,429Net realised profit/(loss) on sale of investments 68,056,360 84,727,906 29,782,217 29,351,446Net realised profit/(loss) on forward foreign exchange contracts (115,815) - - 461,665Net realised profit/(loss) on financial future contracts - - - -Net realised profit/(loss) on cross currency swap contracts - - - -Net realised profit/(loss) on interest rate swap contracts - - - -Net realised profit/(loss) on inflation swap contracts - - - -Net realised profit/(loss) on total return swap contracts - - - -Net realised profit/(loss) on volatility swap contracts - - - -Net realised profit/(loss) on credit default swap contracts - - - -Net realised profit/(loss) on option contracts - - - -Net realised profit/(loss) on mortgage dollar rolls - - - -Net realised profit/(loss) on foreign exchange transactions (471,230) (56,459) (102,094) (217,236)NET REALISED PROFIT/(LOSS) FOR THE YEAR 67,086,598 86,436,660 31,877,647 29,918,304Change in net unrealised appreciation/(depreciation) on:
Investments 49,044,909 2,812,316 (33,525,367) 2,900,941Forward foreign exchange contracts (552,967) - - (687,321)Financial future contracts - - - -Interest rate swap contracts - - - -Inflation swap contracts - - - -Cross currency swap contracts - - - -Total return swap contracts - - - -Volatility swap contracts - - - -Credit default swap contracts - - - -Option contracts - - - -Mortgage dollar rolls - - - -Foreign exchange transactions 1,786 4,685 11,469 (2,328)
Capital gains tax - - - -NET INCREASE/(DECREASE) IN NET ASSETS AS A RESULT OF OPERATIONS 115,580,326 89,253,661 (1,636,251) 32,129,596MOVEMENT OF CAPITALIssue of shares 381,157,853 336,083,158 122,048,768 630,123,886Redemption of shares (491,291,996) (431,459,967) (180,251,287) (459,684,771)Equalisation (note 24) (23,488) (50,185) (102,249) 422,511
(110,157,631) (95,426,994) (58,304,768) 170,861,626
Dividends paid/accumulated (note 25) (48,508) (187,027) (436,080) (871,584)NET INCREASE/(DECREASE) IN NET ASSETSAS A RESULT OF MOVEMENT IN CAPITAL (110,206,139) (95,614,021) (58,740,848) 169,990,042
NET ASSETS AT THE END OF THE YEAR 766,634,429 519,042,458 250,196,311 970,862,932
Portfolio Turnover Ratio (note 26) 13.11% 5.02% 43.00% (8.77)%
9 This Fund was launched on February 20, 2018
FRANKLIN TEMPLETON INVESTMENT FUNDS
Statement of Operations and Changes in Net AssetsFor the Year ended June 30, 2018 (continued)
The accompanying notes form an integral part of these financial statements
44 Audited Annual Report www.franklintempleton.lu

TempletonEmerging Markets
BalancedFund
TempletonEmerging
MarketsBond Fund
TempletonEmerging Markets
Local Currency BondFund9
TempletonEmerging Markets
Smaller CompaniesFund
TempletonEuroland
Fund
TempletonEuropean
Fund
TempletonFrontierMarkets
Fund(USD) (USD) (USD) (USD) (EUR) (EUR) (USD)
64,654,834 6,296,345,122 - 778,914,351 465,137,539 209,415,616 882,514,750- - - - - - -
64,654,834 6,296,345,122 - 778,914,351 465,137,539 209,415,616 882,514,750
1,247,795 - - 18,053,386 15,661,499 5,057,060 27,110,5754,669,579 855,428,509 530,065 735,226 - - -
33,794 2,734,406 2,356 328,875 - - 441,473- - - - 289,290 - -- - - - - - -
2,114 600,223 - - - 177 -5,953,282 858,763,138 532,421 19,117,487 15,950,789 5,057,237 27,552,048
1,357,197 86,517,727 40,370 12,890,046 4,457,071 1,846,658 11,699,589278,075 21,810,478 11,173 2,236,522 1,242,254 445,326 1,989,771
207 17,800 - 2,183 1,073 386 1,74745,079 3,798,606 859 306,883 171,927 91,595 303,41455,443 6,953,772 2,541 688,606 63,294 22,146 1,166,16110,906 18,136 14,133 13,658 6,847 9,236 11,945
7,645 655,546 321 80,372 39,522 14,147 63,9313,695 1,076,647 16 - 85,613 6,249 13,253
20,900 7,059,796 - - - - -300,135 29,609,262 3,288 1,822,557 1,233,577 851,992 1,856,339
- - - - - - -- - - - - - -- 3,703,839 - - 28,936 - 1,589
93,269 857,395 3,365 161,249 - - 10,144- 18,321,882 - - - - -- - - - - - -
271,896 2,193,906 3,453 436,426 541,544 95,947 1,026,12534,551 2,056,699 905 286,394 119,076 46,956 394,005
2,478,998 184,651,491 80,424 18,924,896 7,990,734 3,430,638 18,538,013
(94,753) (259,543) (15,516) (17,264) (43,788) (39) -2,384,245 184,391,948 64,908 18,907,632 7,946,946 3,430,599 18,538,013
3,569,037 674,371,190 467,513 209,855 8,003,843 1,626,638 9,014,035634,748 (110,552,056) (35,074) 26,869,657 4,536,433 9,845,050 69,541,862
(782,001) 55,240,113 (67,081) 5,681 2,670 - 2,843,418- - - - - - -- - - - - - -- - - - - - -- - - - - - -- - - - - - -- - - - - - -- - - - - - -- - - - - - -- - - - - - -
(90,449) (10,486,896) 1,057 (789,673) 5,747 2,233 (142,509)3,331,335 608,572,351 366,415 26,295,520 12,548,693 11,473,921 81,256,806
(8,483,861) (1,187,837,464) (2,258,558) 2,992,396 (22,686,977) (10,022,982) (116,501,129)(169,504) (59,390,506) (22,942) (9,468) 5,171 - (2,533,698)
- - - - - - -171,319 52,286,632 - - - - -
- - - - - - -- - - - - - -- - - - - - -- - - - - - -- - - - - - -- - - - - - -- - - - - - -
(47,775) (7,890,202) (25,262) 11,397 1,745 9,014 (1,132,759)(169,017) (21,562,375) (2,755) - - - -
(5,367,503) (615,821,564) (1,943,102) 29,289,845 (10,131,368) 1,459,953 (38,910,780)
109,565,923 8,678,219,075 21,050,234 765,319,545 576,363,547 42,510,366 194,982,213(36,148,823) (3,649,750,435) - (510,725,223) (327,003,948) (85,454,265) (359,735,683)
1,050,090 39,351,543 249,760 505,396 766,378 (52,132) (707,779)74,467,190 5,067,820,183 21,299,994 255,099,718 250,125,977 (42,996,031) (165,461,249)
(1,593,241) (839,993,566) (27,991) (2,717,708) (5,560,829) (2,028,071) (10,054,830)
72,873,949 4,227,826,617 21,272,003 252,382,010 244,565,148 (45,024,102) (175,516,079)
132,161,280 9,908,350,175 19,328,901 1,060,586,206 699,571,319 165,851,467 668,087,891
6.73% 2.00% (46.08)% (17.83)% (18.40)% 0.24% 35.09%
FRANKLIN TEMPLETON INVESTMENT FUNDS
Statement of Operations and Changes in Net AssetsFor the Year ended June 30, 2018 (continued)
The accompanying notes form an integral part of these financial statements
www.franklintempleton.lu Audited Annual Report 45

TempletonGlobalFund
TempletonGlobal
BalancedFund
TempletonGlobalBondFund
TempletonGlobal Bond
(Euro)Fund
(USD) (USD) (USD) (EUR)
NET ASSETS AT THE BEGINNING OF THE YEAR 1,259,094,531 953,322,447 18,426,706,919 325,525,488Currency translation adjustment - - - -
1,259,094,531 953,322,447 18,426,706,919 325,525,488INCOMEDividends (net of withholding taxes) (note 2(n)) 26,038,466 14,825,250 - -Interest on bonds (net of withholding taxes) (note 2(n)) - 14,914,072 1,086,412,970 18,469,485Bank interest 281,116 590,730 6,056,498 189,412Securities lending (notes 2(o), 15) 62,654 27,732 - -Net interest income on swaps - - - -Sundry income 94,917 62,838 5,016,820 72,305TOTAL INCOME 26,477,153 30,420,622 1,097,486,288 18,731,202EXPENSESInvestment management fees (note 16) 11,631,016 7,629,586 121,551,232 2,178,657Administration and transfer agency fees 2,880,813 2,379,332 38,545,324 698,618Directors fees 2,539 1,972 35,700 631Subscription tax (note 19) 536,499 474,669 7,698,772 141,629Custodian fees 132,766 68,816 9,056,915 151,136Audit fees 10,646 13,618 26,828 8,562Printing and publishing expenses 92,984 72,223 1,307,486 23,112Bank charges 379 929 1,958,933 153,861Net interest expenses on swaps - - 43,838,988 469,210Class A (dis) and Class A (acc) shares’ maintenance charges (note 20) 4,724,302 2,699,551 33,039,309 613,159Class AS (dis) and Class AS (acc) shares’ maintenance charges (note 20) 92,451 1,077,761 - -Class AX (acc) shares’ maintenance charges (note 20) - - 1,233,949 -Class B (dis) and Class B (acc) shares’ maintenance and service charges (note 20) 114,766 231,422 1,024,305 -Class C (dis) and Class C (acc) shares’ maintenance charges (note 20) 138,041 221,611 3,612,576 -Class F (dis) and Class F (acc) shares’ maintenance and service charges (note 20) - - 176,126 -Class G (dis) and Class G (acc) shares’ maintenance and service charges (note 20) - - - -Class N (dis) and Class N (acc) shares’ maintenance charges (note 20) 314,962 741,177 19,745,789 644,512Other charges 314,584 235,212 4,061,148 74,461TOTAL EXPENSES 20,986,748 15,847,879 286,913,380 5,157,548
Expenses reimbursement (note 21) - (5,856) (414,461) (17,066)NET EXPENSES 20,986,748 15,842,023 286,498,919 5,140,482
NET PROFIT/(LOSS) FROM INVESTMENTS 5,490,405 14,578,599 810,987,369 13,590,720Net realised profit/(loss) on sale of investments 133,356,791 44,971,152 141,218,798 (2,019,042)Net realised profit/(loss) on forward foreign exchange contracts - (654,008) (263,422,238) 16,806,405Net realised profit/(loss) on financial future contracts - - - -Net realised profit/(loss) on cross currency swap contracts - - - -Net realised profit/(loss) on interest rate swap contracts - - 24,880,627 429,970Net realised profit/(loss) on inflation swap contracts - - - -Net realised profit/(loss) on total return swap contracts - - - -Net realised profit/(loss) on volatility swap contracts - - - -Net realised profit/(loss) on credit default swap contracts - - - -Net realised profit/(loss) on option contracts - - - -Net realised profit/(loss) on mortgage dollar rolls - - - -Net realised profit/(loss) on foreign exchange transactions (17,970) (726,560) (44,920,591) (769,300)NET REALISED PROFIT/(LOSS) FOR THE YEAR 138,829,226 58,169,183 668,743,965 28,038,753Change in net unrealised appreciation/(depreciation) on:
Investments (73,669,655) (30,333,692) (1,492,331,778) (28,293,236)Forward foreign exchange contracts - (321,438) 291,751,920 (10,776,689)Financial future contracts - - - -Interest rate swap contracts - - 205,846,402 3,523,025Inflation swap contracts - - - -Cross currency swap contracts - - - -Total return swap contracts - - - -Volatility swap contracts - - - -Credit default swap contracts - - - -Option contracts - - - -Mortgage dollar rolls - - - -Foreign exchange transactions 19,284 (157,218) (8,819,000) (5,078)
Capital gains tax - - (598,633) (647)NET INCREASE/(DECREASE) IN NET ASSETS AS A RESULT OF OPERATIONS 65,178,855 27,356,835 (335,407,124) (7,513,872)MOVEMENT OF CAPITALIssue of shares 144,922,033 192,734,841 3,958,374,693 121,312,499Redemption of shares (312,287,370) (227,524,570) (5,407,996,642) (116,685,757)Equalisation (note 24) (242,688) (439,620) (10,736,784) 552,224
(167,608,025) (35,229,349) (1,460,358,733) 5,178,966
Dividends paid/accumulated (note 25) (4,811,333) (29,776,071) (1,126,132,577) (12,020,479)NET INCREASE/(DECREASE) IN NET ASSETSAS A RESULT OF MOVEMENT IN CAPITAL (172,419,358) (65,005,420) (2,586,491,310) (6,841,513)
NET ASSETS AT THE END OF THE YEAR 1,151,854,028 915,673,862 15,504,808,485 311,170,103
Portfolio Turnover Ratio (note 26) 49.12% 27.72% 13.15% (16.04)%
10 This Fund had its name changed effective on March 5, 2018 (refer to Note 1)
FRANKLIN TEMPLETON INVESTMENT FUNDS
Statement of Operations and Changes in Net AssetsFor the Year ended June 30, 2018 (continued)
The accompanying notes form an integral part of these financial statements
46 Audited Annual Report www.franklintempleton.lu

TempletonGlobal
Climate ChangeFund 10
TempletonGlobal
CurrencyFund
TempletonGlobal Equity
IncomeFund
TempletonGlobal
High YieldFund
TempletonGlobal
IncomeFund
TempletonGlobal Smaller
CompaniesFund
TempletonGlobal
Total ReturnFund
(EUR) (USD) (USD) (USD) (USD) (USD) (USD)
693,378,176 8,481,440 150,633,469 180,421,557 1,137,684,998 120,018,892 20,185,056,502- - - - - - -
693,378,176 8,481,440 150,633,469 180,421,557 1,137,684,998 120,018,892 20,185,056,502
17,215,300 - 5,879,368 - 21,181,528 1,867,474 61,653- 483,443 - 12,980,409 22,000,468 - 1,445,557,893- 3,418 50,714 32,380 243,338 81,713 7,640,091- - 23,751 - 28,143 177,561 -- - - - - - -
39,645 - - 88,374 58,228 1,459 2,978,41117,254,945 486,861 5,953,833 13,101,163 43,511,705 2,128,207 1,456,238,048
6,813,656 67,680 1,577,002 1,386,675 8,704,456 1,257,373 141,456,8061,626,706 21,962 385,868 386,733 2,423,942 309,581 44,740,461
1,390 19 324 343 2,175 255 41,378339,783 3,865 79,691 81,681 501,766 62,925 8,538,947
71,896 4,049 17,922 63,657 248,118 17,103 11,494,6299,147 13,446 11,261 11,805 11,966 9,018 30,683
50,929 721 11,857 12,588 79,623 9,350 1,516,87631,966 - - 6,556 76,664 503 2,901,339
- - - 51,867 614,255 - 39,416,0683,353,683 7,879 675,313 628,503 3,148,611 603,093 36,315,794
- - 56,978 - - - -- - - - - - -
471 - 130,435 - 288,849 6,019 1,193,985- - - - 667,472 - 2,756,887- - - - - - -- - - - - - -
77,883 36,136 8,424 295,135 2,311,313 51,162 27,804,893166,102 2,260 45,102 41,762 276,754 34,492 5,018,423
12,543,612 158,017 3,000,177 2,967,305 19,355,964 2,360,874 323,227,169
- (17,455) (292,606) - (30,619) - (474,050)12,543,612 140,562 2,707,571 2,967,305 19,325,345 2,360,874 322,753,119
4,711,333 346,299 3,246,262 10,133,858 24,186,360 (232,667) 1,133,484,929133,158,475 67,437 7,650,201 (1,109,623) 60,508,392 6,914,517 60,248,574
5,678 (228,966) 44,453 (913,202) (9,104,006) - (222,645,021)- - - - - - -- - - - - - -- - - - - - 12,150,187- - - - - - -- - - - - - -- - - - - - -- - - - - - -- - 141,255 - 537,967 - -- - - - - - -
(95,713) (48,998) (74,383) (121,306) (925,866) (1,864) (60,393,002)137,779,773 135,772 11,007,788 7,989,727 75,202,847 6,679,986 922,845,667
(141,337,781) (808,081) (1,066,125) (11,079,567) (79,241,636) 4,000,606 (2,059,454,059)(667) 311,596 (19,443) 715,505 12,466,978 - 226,520,132
- - - - - - -- - - 218,546 5,382,360 - 241,349,944- - - - - - -- - - - - - -- - - - - - -- - - - - - -- - - - - - -- - 3,126 - (18,889) - -- - - - - - -
16,090 12,811 9,630 (77,485) (182,145) (842) (14,896,499)- (1,353) - (230,912) (26,718) - (1,516,327)
(3,542,585) (349,255) 9,934,976 (2,464,186) 13,582,797 10,679,750 (685,151,142)
16,777,184 3,618,007 73,222,544 41,715,762 256,763,152 22,238,724 7,775,925,090(59,792,727) (55,093) (86,672,021) (60,706,329) (450,004,120) (30,788,133) (8,199,483,056)
(32,182) 92,794 (61,890) (115,980) (1,594,784) (51) (6,777,026)(43,047,725) 3,655,708 (13,511,367) (19,106,547) (194,835,752) (8,549,460) (430,334,992)
(2,656,258) (255,616) (6,056,284) (13,203,843) (44,111,599) (5,605) (1,498,240,718)
(45,703,983) 3,400,092 (19,567,651) (32,310,390) (238,947,351) (8,555,065) (1,928,575,710)
644,131,608 11,532,277 141,000,794 145,646,981 912,320,444 122,143,577 17,571,329,650
139.00% 53.19% 3.58% 11.54% 60.68% 45.79% 11.76%
FRANKLIN TEMPLETON INVESTMENT FUNDS
Statement of Operations and Changes in Net AssetsFor the Year ended June 30, 2018 (continued)
The accompanying notes form an integral part of these financial statements
www.franklintempleton.lu Audited Annual Report 47

TempletonGrowth(Euro)Fund
TempletonKorea
Fund11
TempletonLatin
AmericaFund
TempletonThailand
Fund
(EUR) (USD) (USD) (USD)
NET ASSETS AT THE BEGINNING OF THE YEAR 7,584,398,180 38,338,370 1,199,770,938 139,450,128Currency translation adjustment - - - -
7,584,398,180 38,338,370 1,199,770,938 139,450,128INCOMEDividends (net of withholding taxes) (note 2(n)) 178,054,048 364,895 39,301,129 4,263,381Interest on bonds (net of withholding taxes) (note 2(n)) 3,018,077 - - -Bank interest 1,022,365 10,871 245,855 105,499Securities lending (notes 2(o), 15) 710,856 - - -Net interest income on swaps - - - -Sundry income 449,247 26,493 - -TOTAL INCOME 183,254,593 402,259 39,546,984 4,368,880EXPENSESInvestment management fees (note 16) 74,165,017 463,188 16,926,504 2,690,112Administration and transfer agency fees 17,563,175 95,182 3,028,413 419,563Directors fees 15,124 62 2,564 336Subscription tax (note 19) 3,658,361 16,750 586,210 82,289Custodian fees 731,933 13,339 548,712 80,575Audit fees 18,893 3,541 12,647 8,918Printing and publishing expenses 554,171 10,311 93,902 12,366Bank charges 1,621,855 - 4,754 614Net interest expenses on swaps - - - -Class A (dis) and Class A (acc) shares’ maintenance charges (note 20) 36,462,670 135,966 5,273,127 759,955Class AS (dis) and Class AS (acc) shares’ maintenance charges (note 20) - - - -Class AX (acc) shares’ maintenance charges (note 20) - - - -Class B (dis) and Class B (acc) shares’ maintenance and service charges (note 20) 3,758 - 78,163 15,694Class C (dis) and Class C (acc) shares’ maintenance charges (note 20) - 526 35,450 -Class F (dis) and Class F (acc) shares’ maintenance and service charges (note 20) - - - -Class G (dis) and Class G (acc) shares’ maintenance and service charges (note 20) - - - -Class N (dis) and Class N (acc) shares’ maintenance charges (note 20) 352,473 16,378 569,769 137,607Other charges 2,017,032 10,234 641,436 39,059TOTAL EXPENSES 137,164,462 765,477 27,801,651 4,247,088
Expenses reimbursement (note 21) - - (1,990) (109)NET EXPENSES 137,164,462 765,477 27,799,661 4,246,979
NET PROFIT/(LOSS) FROM INVESTMENTS 46,090,131 (363,218) 11,747,323 121,901Net realised profit/(loss) on sale of investments 630,503,379 (847,068) 39,001,700 23,050,209Net realised profit/(loss) on forward foreign exchange contracts - - 1,823,059 -Net realised profit/(loss) on financial future contracts - - - -Net realised profit/(loss) on cross currency swap contracts - - - -Net realised profit/(loss) on interest rate swap contracts - - - -Net realised profit/(loss) on inflation swap contracts - - - -Net realised profit/(loss) on total return swap contracts - - - -Net realised profit/(loss) on volatility swap contracts - - - -Net realised profit/(loss) on credit default swap contracts - - - -Net realised profit/(loss) on option contracts - - - -Net realised profit/(loss) on mortgage dollar rolls - - - -Net realised profit/(loss) on foreign exchange transactions (486,949) (14,754) (877,891) (143,993)NET REALISED PROFIT/(LOSS) FOR THE YEAR 676,106,561 (1,225,040) 51,694,191 23,028,117Change in net unrealised appreciation/(depreciation) on:
Investments (649,323,863) 3,260,660 (76,021,380) (9,537,495)Forward foreign exchange contracts - - (458,554) -Financial future contracts - - - -Interest rate swap contracts - - - -Inflation swap contracts - - - -Cross currency swap contracts - - - -Total return swap contracts - - - -Volatility swap contracts - - - -Credit default swap contracts - - - -Option contracts - - - -Mortgage dollar rolls - - - -Foreign exchange transactions (719,714) 9,978 (5,696) 3,440
Capital gains tax - - - -NET INCREASE/(DECREASE) IN NET ASSETS AS A RESULT OF OPERATIONS 26,062,984 2,045,598 (24,791,439) 13,494,062MOVEMENT OF CAPITALIssue of shares 319,038,382 26,160,575 365,038,406 143,135,978Redemption of shares (538,395,596) (66,544,543) (537,544,450) (128,518,801)Equalisation (note 24) (670,677) - (559,966) (20,773)
(220,027,891) (40,383,968) (173,066,010) 14,596,404
Dividends paid/accumulated (note 25) (28,373,588) - (10,006,400) (295,001)NET INCREASE/(DECREASE) IN NET ASSETSAS A RESULT OF MOVEMENT IN CAPITAL (248,401,479) (40,383,968) (183,072,410) 14,301,403
NET ASSETS AT THE END OF THE YEAR 7,362,059,685 - 991,907,089 167,245,593
Portfolio Turnover Ratio (note 26) 52.04% N/A 24.01% 48.75%
11 This Fund was closed on May 25, 2018
FRANKLIN TEMPLETON INVESTMENT FUNDS
Statement of Operations and Changes in Net AssetsFor the Year ended June 30, 2018 (continued)
The accompanying notes form an integral part of these financial statements
48 Audited Annual Report www.franklintempleton.lu

TotalExpense Ratio
June 30,2018
(See Note 27)
SharesOutstanding
June 30,2018
Net Asset Value per Share
June 30,2018
June 30,2017
June 30,2016
Franklin Asia Credit Fund – USDA (acc) USD 1.49% 109,817.038 10.63 10.85 10.50A (Mdis) AUD-H1 (hedged) 1.49% 229,568.420 9.63 10.22 10.25A (Mdis) SGD-H1 (hedged) 1.49% 259,620.000 9.25 9.90 10.01A (Mdis) USD 1.49% 184,126.010 9.28 9.86 9.94I (acc) USD 0.94% 200,000.000 10.84 11.00 10.59Y (Mdis) USD 0.18% 500.000 9.86 10.34 10.28
Franklin Biotechnology Discovery Fund – USDA (acc) CHF-H1 (hedged) 1.81% 146,834.982 15.41 15.08 12.61A (acc) EUR-H1 (hedged)* 1.78% 8,141.334 10.83 - -A (acc) HKD 1.82% 912,504.485 21.27 20.11 16.38A (acc) SGD 1.82% 882,190.904 32.28 31.00 24.85A (acc) USD 1.82% 53,072,659.754 32.52 30.91 25.33B (acc) USD 3.12% 680,276.278 25.76 24.81 20.60C (acc) USD 2.40% 510,026.200 38.43 36.74 30.27F (acc) USD 2.82% 4,800,341.767 10.89 10.45 -I (acc) EUR-H1 (hedged) 0.96% 537,505.368 21.27 20.60 16.96I (acc) USD 0.97% 2,761,030.623 49.16 46.33 37.64N (acc) USD 2.57% 5,179,726.843 28.14 26.95 22.24W (acc) USD 1.04% 2,516,209.374 15.41 14.53 11.82Z (acc) GBP 1.32% 106,819.139 32.31 30.98 24.67Z (acc) USD 1.32% 498,323.793 11.79 11.15 -
Franklin Brazil Opportunities Fund – USDA (acc) EUR-H1 (hedged) 1.91% 128,252.699 9.72 9.95 9.48A (acc) USD 1.91% 438,170.660 10.28 10.22 9.59A (Qdis) HKD 1.85% 5,560.398 7.53 8.07 8.15A (Qdis) USD 1.91% 590,965.518 7.42 8.00 8.13I (acc) USD 1.02% 1,463.392 10.79 10.63 9.90N (acc) EUR-H1 (hedged) 2.41% 282,317.288 9.46 9.73 9.32N (acc) USD 2.42% 720,897.075 9.99 9.98 9.41N (Qdis) USD 2.41% 633,782.877 7.30 7.91 8.08
Franklin Diversified Balanced Fund – EURA (acc) CZK-H1 (hedged) 1.57% 87,944.310 100.58 101.39 99.97A (acc) EUR 1.57% 4,845,716.869 13.45 13.48 13.18A (acc) SGD-H1 (hedged) 1.57% 13,959.561 10.37 10.22 -A (Qdis) EUR 1.57% 92,548.006 8.72 9.26 9.42A (Ydis) EUR 1.57% 4,312,508.300 12.55 13.28 13.19G (acc) EUR 2.27% 152,764.331 9.74 9.82 -I (acc) EUR 0.82% 9,998,509.239 14.31 14.24 13.82I (acc) USD-H1 (hedged) 0.81% 10,001.985 10.61 10.30 -I (Qdis) EUR 0.79% 447.828 8.92 9.39 9.49I (Ydis) EUR 0.80% 294.722 14.28 14.23 13.81N (acc) EUR 2.37% 533,334.125 12.42 12.54 12.37N (Ydis) EUR 2.37% 101,879.205 8.81 9.40 9.58W (Ydis) EUR 0.91% 1,726.686 9.48 9.97 9.99
Franklin Diversified Conservative Fund – EURA (acc) CZK-H1 (hedged) 1.42% 74,403.591 97.21 99.89 100.25A (acc) EUR 1.42% 5,517,166.405 13.37 13.64 13.57A (acc) SGD-H1 (hedged) 1.42% 13,902.714 10.09 10.11 -A (Qdis) EUR 1.42% 483,269.638 9.11 9.68 9.90A (Qdis) USD-H1 (hedged)* 1.40% 24,572.283 9.87 - -A (Ydis) EUR 1.42% 7,306,672.929 12.74 13.48 13.57G (acc) EUR 2.22% 191,872.745 9.63 9.90 -I (acc) EUR 0.77% 8,431,930.667 14.07 14.26 14.10I (acc) USD-H1 (hedged) 0.78% 430,052.469 10.30 10.18 -I (Qdis) EUR 0.74% 447.828 9.28 9.80 9.95I (Ydis) EUR 0.78% 37,108.094 13.45 14.14 14.10N (acc) EUR 2.32% 4,106,156.719 12.18 12.54 12.59N (acc) USD-H1 (hedged) 2.33% 11,750.108 10.06 10.08 -N (Ydis) EUR 2.32% 921,296.030 9.07 9.69 9.97W (Ydis) EUR 0.77% 85,285.927 9.76 10.26 10.22
Franklin Diversified Dynamic Fund – EURA (acc) CZK-H1 (hedged) 1.73% 151,467.777 100.96 101.71 99.74A (acc) EUR 1.73% 5,855,679.210 13.32 13.34 12.96A (acc) NOK-H1 (hedged) 1.73% 182,922.487 9.83 9.72 9.32A (acc) SEK-H1 (hedged) 1.73% 97,571.030 9.48 9.49 9.24A (acc) SGD-H1 (hedged) 1.73% 14,807.015 10.36 10.21 -A (Ydis) EUR 1.73% 754,401.084 12.77 13.34 12.96I (acc) EUR 0.89% 3,281,990.133 14.30 14.21 13.70I (acc) USD-H1 (hedged) 0.86% 10,026.678 10.61 10.30 -I (Ydis) EUR 0.87% 343.506 14.34 14.24 13.72N (acc) EUR 2.48% 153,896.219 12.14 12.25 11.99W (Ydis) EUR 0.95% 2,527.666 9.24 9.85 9.84
Franklin Euro Government Bond Fund – EURA (Ydis) EUR 0.99% 1,677,064.949 10.99 11.11 11.60I (acc) EUR 0.61% 1,142,806.013 15.49 15.46 15.91I (Qdis) EUR 0.59% 378.479 10.77 10.84 11.26N (acc) EUR 1.54% 958,164.499 13.42 13.53 14.06
FRANKLIN TEMPLETON INVESTMENT FUNDS
Statistical Information
www.franklintempleton.lu Audited Annual Report 49

TotalExpense Ratio
June 30,2018
(See Note 27)
SharesOutstanding
June 30,2018
Net Asset Value per Share
June 30,2018
June 30,2017
June 30,2016
Franklin Euro High Yield Fund – EURA (acc) EUR 1.52% 2,690,061.173 18.79 18.88 17.47A (Mdis) EUR 1.52% 48,331,968.523 6.00 6.27 6.07A (Mdis) USD 1.52% 2,818,257.144 8.87 9.07 8.53A (Mdis) USD-H1 (hedged) 1.51% 1,923,599.111 9.94 10.14 9.62A (Ydis) EUR 1.52% 7,524,110.485 6.23 6.54 6.38B (Mdis) EUR 2.93% 331,376.529 10.71 11.35 11.14B (Mdis) USD 2.93% 915,771.277 8.92 9.25 8.82I (acc) EUR 0.87% 3,388,983.579 20.71 20.67 19.01I (Ydis) EUR 0.86% 26,000.000 9.59 10.01 9.71N (acc) EUR 2.12% 4,890,671.362 16.87 17.06 15.88W (acc) EUR 0.94% 38,091.950 11.85 11.84 10.89
Franklin Euro Short Duration Bond Fund – EURA (acc) EUR 0.85% 2,594,599.448 10.16 10.27 10.21A (Ydis) EUR 0.86% 94,427.577 10.04 10.22 10.21I (acc) EUR 0.52% 4,638,069.148 10.32 10.39 10.29N (acc) EUR 1.41% 2,968,239.582 9.92 10.09 10.08W (acc) EUR 0.54% 53,723.881 10.29 10.37 10.28Y (Mdis) EUR 0.06% 1,142,688.386 10.03 10.10 10.02Y (Mdis) USD-H1 (hedged)* 0.05% 2,393,902.515 10.00 - -
Franklin Euro Short-Term Money Market Fund – EURA (acc) EUR 0.22% 72,892.494 997.77 1,004.40 1,008.69I (acc) EUR 0.22% 29,547.311 1,000.40 1,007.05 1,011.35
Franklin European Fund – EURΩ
A (acc) EUR - - - 15.91 13.66A (Ydis) EUR - - - 15.08 13.01I (acc) EUR - - - 16.76 14.27N (acc) EUR - - - 15.22 13.17
Franklin European Corporate Bond Fund – EURA (acc) EUR 1.11% 1,183,941.102 13.11 13.16 12.84A (Ydis) EUR 1.12% 507,068.629 11.23 11.49 11.45I (acc) EUR 0.64% 2,056,836.557 13.65 13.65 13.24I (Ydis) EUR 0.65% 387.931 11.36 11.58 11.50N (acc) EUR 1.92% 1,195,888.566 12.24 12.39 12.18N (Ydis) EUR 1.92% 690,209.771 10.94 11.29 11.34W (acc) EUR 0.72% 705.148 10.95 10.95 10.64Y (Mdis) EUR 0.05% 235,148.876 10.31 10.41 10.24
Franklin European Dividend Fund – EURA (acc) EUR 1.84% 1,425,698.274 16.89 16.68 14.58A (Mdis) SGD-H1 (hedged) 1.84% 13,058.961 10.65 10.85 9.88A (Mdis) USD 1.84% 114,857.209 9.00 9.09 8.14A (Mdis) USD-H1 (hedged)* 1.76% 9,986.040 10.10 - -A (Ydis) EUR 1.84% 2,536,922.574 12.91 13.46 12.46I (acc) EUR 0.98% 1,548,629.891 17.93 17.56 15.21N (acc) EUR 2.59% 734,410.035 16.04 15.96 14.05N (acc) PLN-H1 (hedged) 2.59% 3,685,689.710 12.01 11.72 10.14Y (Mdis) EUR 0.07% 441.840 9.34 9.50 8.60
Franklin European Growth Fund – EURA (acc) EUR 1.83% 11,609,636.598 16.20 16.39 14.21A (acc) NOK-H1 (hedged) 1.80% 1,196,160.811 11.30 11.30 9.67A (acc) SGD-H1 (hedged) 1.83% 348,232.078 13.94 13.89 11.89A (acc) USD 1.83% 2,271,380.484 12.06 11.93 10.05A (acc) USD-H1 (hedged) 1.83% 3,015,624.159 11.93 11.81 10.08A (Ydis) GBP 1.83% 55,195.043 18.41 18.67 15.58I (acc) EUR 0.96% 1,550,491.892 32.45 32.54 27.98N (acc) EUR 2.57% 6,269,191.172 14.17 14.44 12.62N (acc) USD 2.57% 1,015,736.403 11.59 11.55 9.80W (acc) EUR 1.07% 53,944.650 12.10 12.15 10.46
Franklin European Income Fund – EURA (acc) EUR 1.70% 160,914.610 11.29 11.47 10.72A (Mdis) EUR 1.70% 409,737.682 10.27 10.71 10.29A (Mdis) SGD-H1 (hedged) 1.70% 65,184.443 10.63 10.94 10.36A (Mdis) USD 1.70% 83,342.207 9.63 9.83 9.17I (acc) EUR 0.90% 43,934.091 11.62 11.71 10.86I (Mdis) EUR 0.89% 39,375.110 10.58 10.95 10.43N (acc) EUR 2.20% 399,420.019 11.09 11.32 10.63N (Mdis) EUR 2.20% 738,089.328 10.07 10.57 10.20N (Mdis) USD-H1 (hedged) 2.20% 36,026.560 9.27 9.50 9.01W (acc) EUR 1.04% 20,214.790 11.55 11.65 10.82W (Mdis) EUR 1.03% 19,696.345 10.51 10.89 10.39Z (acc) EUR 1.20% 19,706.750 11.50 11.62 10.80Z (Mdis) EUR 1.20% 19,696.662 10.46 10.86 10.38
Franklin European Small-Mid Cap Growth Fund – EURA (acc) EUR 1.82% 4,870,242.764 40.03 38.96 31.61A (acc) USD 1.82% 865,067.465 46.79 44.52 35.10I (acc) EUR 0.97% 3,734,296.582 48.65 46.94 37.77I (acc) USD 1.00% 5,330.498 56.56 53.51 41.86
FRANKLIN TEMPLETON INVESTMENT FUNDS
Statistical Information (continued)
50 Audited Annual Report www.franklintempleton.lu

TotalExpense Ratio
June 30,2018
(See Note 27)
SharesOutstanding
June 30,2018
Net Asset Value per Share
June 30,2018
June 30,2017
June 30,2016
Franklin European Small-Mid Cap Growth Fund – EUR (continued)I (acc) USD-H1 (hedged) 0.96% 10,235.799 12.29 11.58 9.14N (acc) EUR 2.57% 565,755.532 36.62 35.91 29.35W (acc) EUR 1.05% 180,064.749 17.20 16.61 13.37X (acc) EUR 0.15% 388.991 14.32 13.70 10.94Y (Mdis) EUR 0.06% 435.983 10.35 10.25 8.41
Franklin European Total Return Fund – EURA (acc) EUR 1.07% 3,456,830.888 14.98 15.25 15.03A (acc) NOK-H1 (hedged) 1.28% 147,691.683 11.83 11.92 11.61A (acc) SEK-H1 (hedged) 1.29% 99,164.802 11.18 11.38 11.24A (Mdis) EUR 1.06% 5,054,740.212 9.93 10.24 10.27A (Mdis) USD 1.07% 4,933,305.545 11.63 11.72 11.42I (acc) EUR 0.76% 13,233,907.866 14.73 14.95 14.70N (acc) EUR 1.76% 4,492,220.204 13.50 13.84 13.74N (acc) PLN-H1 (hedged) 1.76% 3,181,246.941 10.33 10.39 10.14N (Mdis) EUR 1.76% 4,077,284.979 11.01 11.43 11.54W (acc) EUR 0.68% 1,197,511.016 11.10 11.27 11.08
Franklin Flexible Alpha Bond Fund – USDA (acc) EUR 1.39% 20,458.036 9.89 10.05 10.21A (acc) EUR-H1 (hedged) 1.38% 9,124.125 9.78 9.98 10.01A (acc) USD 1.39% 7,033.664 10.24 10.17 10.04A (Qdis) EUR-H1 (hedged) 1.38% 24,411.912 9.64 9.94 10.01I (acc) EUR 0.75% 745,638.784 10.05 10.14 10.22I (acc) EUR-H1 (hedged) 0.75% 64,750.000 9.93 10.05 10.03I (acc) GBP-H1 (hedged) 0.75% 23,877.042 10.20 10.22 10.09I (acc) NOK-H1 (hedged) 0.74% 86,610.315 10.04 10.02 -I (acc) SEK-H1 (hedged) 0.75% 90,688.807 9.90 9.99 -I (acc) USD 0.75% 492.126 10.39 10.26 10.06I (Ydis) GBP-H1 (hedged) 0.75% 23,877.135 10.05 10.21 10.09I (Ydis) USD 0.75% 14,985,084.915 10.25 10.25 10.06N (acc) EUR 1.99% 5,115.418 9.75 9.96 10.19N (acc) EUR-H1 (hedged) 1.99% 1,082,052.673 9.64 9.87 10.00N (Qdis) EUR-H1 (hedged) 1.97% 10,891.873 9.64 9.89 10.00N (Qdis) USD 1.99% 23,398.163 10.12 10.10 10.03W (acc) USD 0.89% 500.000 10.11 9.99 -Y (acc) GBP-H1 (hedged) 0.05% 22,634,992.761 10.12 10.08 -Y (Mdis) USD 0.05% 15,030,060.120 9.96 10.00 -
Franklin GCC Bond Fund – USDA (acc) USD 1.39% 769,657.170 12.57 12.61 11.89A (Mdis) USD 1.39% 644,199.527 10.36 10.89 10.76B (acc) USD 2.87% 5,916.585 11.68 11.91 11.40B (Mdis) USD 2.86% 40.772 9.91 10.59 10.62I (acc) EUR-H1 (hedged)* 0.83% 2,636,222.506 9.68 - -I (acc) USD 0.82% 2,820,692.342 12.94 12.90 12.10W (Mdis) USD 0.93% 418,690.944 9.68 10.12 -
Franklin Global Aggregate Bond Fund – USDA (acc) EUR 1.25% 220,549.920 12.29 12.85 13.58A (acc) EUR-H1 (hedged) 1.24% 36,730.819 9.58 10.08 10.59A (acc) USD 1.25% 658,031.605 10.27 10.49 10.78A (Mdis) EUR 1.25% 208,639.408 11.25 11.91 12.66A (Mdis) USD 1.25% 40,594.007 9.45 9.77 10.10I (acc) EUR 0.60% 24,673.660 12.91 13.41 14.08I (acc) EUR-H1 (hedged) 0.60% 7,874.089 9.77 10.21 10.64I (acc) USD 0.60% 959,603.053 10.84 11.01 11.23N (acc) EUR 1.95% 268,837.784 11.67 12.28 13.07N (acc) EUR-H1 (hedged) 1.95% 55,634.771 9.12 9.65 10.19N (acc) USD 1.95% 6,070.145 9.77 10.05 10.40W (acc) EUR 0.65% 48,250.000 11.33 11.77 12.38Y (Mdis) USD 0.05% 6,248,469.768 9.91 10.25 -Z (Mdis) USD 0.95% 500.000 9.30 9.63 -
Franklin Global Aggregate Investment Grade Bond Fund – USDA (acc) USD 1.25% 88,356.948 10.25 10.43 10.68I (acc) USD 0.61% 880,687.356 10.66 10.78 10.97Z (acc) USD 0.95% 34,909.663 9.60 9.74 9.95
Franklin Global Convertible Securities Fund – USDA (acc) CHF-H1 (hedged) 1.59% 140,770.714 13.16 12.21 11.10A (acc) EUR 1.58% 1,155,408.173 16.54 15.26 13.97A (acc) EUR-H1 (hedged) 1.59% 2,133,894.113 13.47 12.46 11.30A (acc) HKD 1.57% 48,765.842 14.54 13.05 11.53A (acc) USD 1.58% 2,279,673.166 14.37 12.97 11.53A (Ydis) EUR 1.58% 443,571.994 16.08 14.87 13.65A (Ydis) EUR-H1 (hedged) 1.59% 554,514.340 13.12 12.16 11.06I (acc) EUR 0.86% 59,299.550 17.31 15.86 14.42I (acc) EUR-H1 (hedged) 0.86% 3,048,514.915 11.81 10.85 9.75I (acc) USD 0.87% 984,317.476 15.04 13.47 11.88N (acc) EUR 2.33% 1,111,812.510 15.78 14.67 13.53N (acc) USD 2.34% 1,020,342.637 13.70 12.45 11.16W (acc) CHF-H1 (hedged)* 0.89% 227,284.533 10.65 - -
FRANKLIN TEMPLETON INVESTMENT FUNDS
Statistical Information (continued)
www.franklintempleton.lu Audited Annual Report 51

TotalExpense Ratio
June 30,2018
(See Note 27)
SharesOutstanding
June 30,2018
Net Asset Value per Share
June 30,2018
June 30,2017
June 30,2016
Franklin Global Convertible Securities Fund – USD (continued)W (acc) EUR-H1 (hedged)* 0.93% 14,335.599 10.67 - -W (acc) USD 0.94% 395,195.846 11.03 9.89 -
Franklin Global Equity Strategies Fund – USDΩ
A (acc) EUR - - - 10.98 9.26A (acc) EUR-H1 (hedged) - - - 7.34 6.13A (acc) USD - - - 12.53 10.27A (Ydis) EUR - - - 10.88 9.19N (acc) EUR - - - 10.21 8.68
Franklin Global Fundamental Strategies Fund – USDA (acc) EUR 1.83% 42,631,231.272 12.03 12.35 10.90A (acc) EUR-H1 (hedged) 1.83% 13,123,902.092 9.05 9.33 8.14A (acc) USD 1.83% 8,226,779.282 14.04 14.09 12.09A (Ydis) EUR 1.83% 72,152,232.560 10.74 11.17 9.98I (acc) EUR 0.97% 3,742,817.179 13.17 13.40 11.73N (acc) EUR 2.58% 1,210,789.701 12.38 12.81 11.39N (acc) EUR-H1 (hedged) 2.57% 5,457,479.454 8.00 8.31 7.30N (acc) PLN-H1 (hedged) 2.58% 2,175,034.322 15.89 16.22 13.95N (acc) USD 2.58% 671,042.281 11.07 11.20 9.68N (Ydis) EUR 2.58% 3,442,722.897 12.79 13.32 11.89W (acc) EUR 1.01% 72,939.128 9.36 9.54 -W (acc) EUR-H1 (hedged) 1.06% 9,952.572 9.97 10.21 -W (acc) USD 1.05% 721.822 10.32 10.27 -W (Ydis) EUR 1.05% 471.676 9.29 9.54 -
Franklin Global Growth Fund – USDΩ
A (acc) EUR - - - 18.31 15.45A (acc) USD - - - 16.45 13.49I (acc) USD - - - 14.59 11.86N (acc) EUR - - - 17.38 14.77N (acc) USD - - - 14.52 11.99Z (acc) USD - - - 15.50 12.65
Franklin Global High Income Bond Fund – USDΩ
A (acc) EUR - - - 13.11 12.03A (acc) HKD - - - 12.32 10.92A (acc) USD - - - 12.23 10.90A (Mdis) HKD - - - 9.29 8.74A (Mdis) SGD-H1 (hedged) - - - 9.28 8.78A (Mdis) USD - - - 9.26 8.75I (acc) EUR - - - 13.55 12.35I (acc) USD - - - 12.64 11.19N (acc) EUR - - - 12.73 11.75N (Mdis) USD - - - 8.36 7.95Y (Mdis) USD - - - 11.22 10.43
Franklin Global Listed Infrastructure Fund – USDA (acc) EUR 1.85% 741,310.351 15.16 15.17 13.96A (acc) USD 1.85% 751,095.443 13.59 13.30 11.90A (Qdis) USD 1.85% 224,892.950 11.81 11.91 10.95A (Ydis) EUR 1.84% 129,646.833 13.52 13.89 13.13I (acc) EUR 1.00% 55,811.658 15.84 15.72 14.34I (acc) GBP-H1 (hedged) 0.98% 42,555.727 13.95 13.71 12.30I (acc) USD 0.98% 1,837,221.600 14.19 13.77 12.21N (acc) EUR 2.59% 406,898.177 14.58 14.70 13.63W (acc) GBP 1.07% 10,155.232 16.56 16.31 14.13W (acc) USD* 0.98% 500.000 10.17 - -W (Qdis) GBP 1.04% 2,345.893 14.40 14.60 13.02Y (Mdis) USD 0.06% 1,501,568.250 11.87 11.75 10.64
Franklin Global Multi-Asset Income Fund – EURA (acc) EUR 1.67% 2,415,800.894 11.42 11.83 11.53A (acc) USD-H1 (hedged) 1.67% 844,279.829 10.02 10.11 9.70A (Mdis) EUR 1.67% 325,603.995 8.69 9.50 9.75A (Mdis) SGD-H1 (hedged) 1.67% 33,288.129 8.56 9.20 9.32A (Mdis) USD-H1 (hedged) 1.67% 1,808,538.136 8.64 9.20 9.29A (Qdis) EUR 1.67% 8,746,994.915 9.25 10.12 10.38A (Ydis) EUR 1.67% 961,894.273 9.64 10.57 10.80C (acc) USD-H1 (hedged) 2.25% 210,714.736 9.74 9.89 -G (Qdis) EUR 2.27% 1,929,967.163 8.97 9.82 -I (acc) EUR 0.87% 2,497,817.311 11.89 12.22 11.82I (Mdis) USD-H1 (hedged) 0.85% 28,071.055 8.85 9.35 9.35I (Qdis) EUR 0.86% 909,125.333 9.60 10.42 10.60I (Ydis) EURΩ - - - 9.61 9.74N (acc) EUR 2.17% 5,629,720.000 11.13 11.59 11.36N (acc) USD-H1 (hedged) 2.17% 644,823.340 10.07 10.22 -N (Mdis) USD-H1 (hedged) 2.17% 1,637,601.331 8.50 9.10 9.24N (Qdis) EUR 2.17% 3,177,187.158 8.17 8.98 9.25N (Ydis) EUR 2.17% 482,976.217 8.50 9.36 9.61W (Mdis) USD-H1 (hedged) 0.97% 858,209.428 9.44 9.98 -W (Ydis) EUR 0.96% 51,329.435 9.45 10.29 10.37Y (Mdis) AUD-H1 (hedged)* 0.05% 782,116.817 9.68 - -Z (Mdis) USD-H1 (hedged) 1.17% 71,815.862 8.76 9.29 9.32
FRANKLIN TEMPLETON INVESTMENT FUNDS
Statistical Information (continued)
52 Audited Annual Report www.franklintempleton.lu

TotalExpense Ratio
June 30,2018
(See Note 27)
SharesOutstanding
June 30,2018
Net Asset Value per Share
June 30,2018
June 30,2017
June 30,2016
Franklin Global Real Estate Fund – USDA (acc) EUR-H1 (hedged) 1.85% 603,451.805 15.50 15.33 15.97A (acc) USD 1.85% 5,399,931.641 12.40 11.93 12.21A (Qdis) USD 1.86% 2,046,489.731 9.78 9.66 10.14A (Ydis) EUR-H1 (hedged) 1.85% 133,025.943 13.52 13.70 14.64B (Qdis) USD 3.16% 585,021.765 9.05 9.06 9.63C (Qdis) USD 2.43% 1,836,989.850 9.48 9.42 9.94I (acc) CAD* 0.97% 626.375 10.91 - -I (acc) USD 0.98% 2,669,786.686 13.85 13.21 13.40N (acc) EUR-H1 (hedged) 2.60% 314,790.707 14.61 14.54 15.28N (acc) USD 2.60% 1,926,684.884 11.29 10.95 11.29W (acc) USD 1.06% 47,135.284 10.34 9.87 -W (Qdis) USD 1.06% 345,202.044 10.79 10.57 11.01Y (Mdis) USD 0.05% 679,005.098 10.30 10.00 10.31Z (acc) USD 1.36% 465,393.332 11.16 10.69 10.88
Franklin Global Small-Mid Cap Growth Fund – USDA (acc) USD 1.85% 2,816,639.227 33.44 33.12 28.17B (acc) USD 3.15% 34,149.117 26.98 27.07 23.32I (acc) USD 0.99% 138,155.058 18.92 18.57 15.66N (acc) USD 2.60% 433,787.103 29.36 29.29 25.10W (acc) USD 1.07% 88,829.956 11.12 10.92 9.22X (acc) USD 0.15% 500.000 11.71 11.40 9.54
Franklin Gold and Precious Metals Fund – USDA (acc) CHF-H1 (hedged) 1.85% 2,040,361.927 2.96 3.57 4.55A (acc) EUR 1.84% 7,974,149.204 4.56 5.48 6.95A (acc) EUR-H1 (hedged) 1.84% 3,485,322.103 3.50 4.24 5.38A (acc) HKD 1.84% 10,011,511.182 4.05 4.72 5.79A (acc) SGD 1.84% 3,499,793.892 3.98 4.72 5.70A (acc) USD 1.84% 19,531,924.236 4.01 4.70 5.80A (Ydis) EUR 1.85% 1,386,874.079 4.57 5.48 6.96I (acc) USD 1.01% 130,565.336 4.31 5.01 6.12N (acc) EUR 2.59% 7,110,528.336 4.29 5.19 6.64N (acc) USD 2.59% 4,231,660.607 3.76 4.44 5.53
Franklin High Yield Fund – USDA (acc) EUR* 1.52% 200,794.535 9.94 - -A (acc) USD 1.53% 5,609,659.435 17.82 17.69 15.68A (Mdis) AUD-H1 (hedged) 1.52% 1,393,666.486 8.91 9.36 8.74A (Mdis) SGD-H1 (hedged) 1.52% 2,294,390.454 7.42 7.87 7.42A (Mdis) USD 1.53% 254,759,706.401 5.91 6.22 5.85B (Mdis) USD 2.93% 24,752,071.133 5.69 6.08 5.80C (acc) USD 2.21% 1,162,549.593 22.65 22.63 20.19F (Mdis) USD 2.53% 2,428,317.044 9.46 10.06 -I (acc) EUR-H1 (hedged) 0.86% 330,973.984 12.53 12.67 11.34I (acc) USD 0.87% 1,169,660.807 18.76 18.50 16.29I (Mdis) USD 0.87% 910,902.653 9.46 9.91 9.26N (acc) EUR* 2.12% 432,561.875 9.90 - -N (acc) USD 2.12% 2,084,702.316 18.34 18.31 16.33N (Mdis) USD 2.11% 2,768,676.232 8.10 8.58 8.12W (Mdis) USD 0.96% 296,958.525 9.62 10.06 -Y (Mdis) USD 0.05% 677,100.847 9.26 9.60 8.91Z (Mdis) USD 1.13% 689,459.854 8.83 9.26 8.67
Franklin Income Fund – USDA (acc) USD 1.68% 3,181,180.555 10.94 10.59 9.52A (Mdis) AUD-H1 (hedged) 1.67% 668,166.732 9.44 9.59 9.03A (Mdis) EUR-H1 (hedged) 1.68% 1,717,997.279 8.76 9.11 8.78A (Mdis) SGD-H1 (hedged) 1.68% 2,023,670.525 8.23 8.40 7.96A (Mdis) USD 1.68% 81,489,283.462 11.55 11.70 11.07A (Mdis) ZAR-H1 (hedged) 1.67% 101,623.141 104.01 99.96 -B (Mdis) USD 2.98% 7,707,367.830 10.60 10.89 10.43C (acc) USD 2.26% 4,009,126.848 24.27 23.63 21.36C (Mdis) USD 2.26% 6,057,599.459 14.59 14.87 14.14F (Mdis) USD 2.68% 2,354,554.350 9.88 10.12 -I (acc) EUR 0.86% 313,728.646 11.41 11.21 10.28I (acc) USD 0.87% 1,968,721.939 21.68 20.82 18.56I (Ydis) EUR-H1 (hedged) 0.85% 14,446.660 9.34 9.62 9.27N (acc) EUR-H1 (hedged) 2.18% 398,353.043 9.91 9.90 9.10N (acc) USD 2.18% 9,093,998.938 22.60 21.98 19.86N (Mdis) EUR 2.17% 465.095 9.51 9.91 9.69N (Mdis) EUR-H1 (hedged) 2.17% 4,103,331.199 8.63 9.02 8.72N (Mdis) USD 2.18% 1,302,389.988 8.88 9.05 8.60W (acc) USD 0.98% 382,120.731 10.52 10.11 -W (Mdis) USD 0.96% 665,118.232 10.19 10.26 -Z (acc) USD 1.18% 2,049,628.927 16.48 15.88 14.20Z (Mdis) USD 1.18% 1,280,222.427 10.60 10.69 10.06
Franklin India Fund – USDA (acc) EUR 1.88% 11,420,205.953 39.40 39.83 34.21A (acc) EUR-H1 (hedged) 1.87% 2,518,589.472 11.34 11.50 9.80A (acc) HKD 1.88% 1,194,770.662 17.68 17.39 14.42A (acc) SEK 1.88% 9,699,828.792 20.87 19.40 16.26
FRANKLIN TEMPLETON INVESTMENT FUNDS
Statistical Information (continued)
www.franklintempleton.lu Audited Annual Report 53
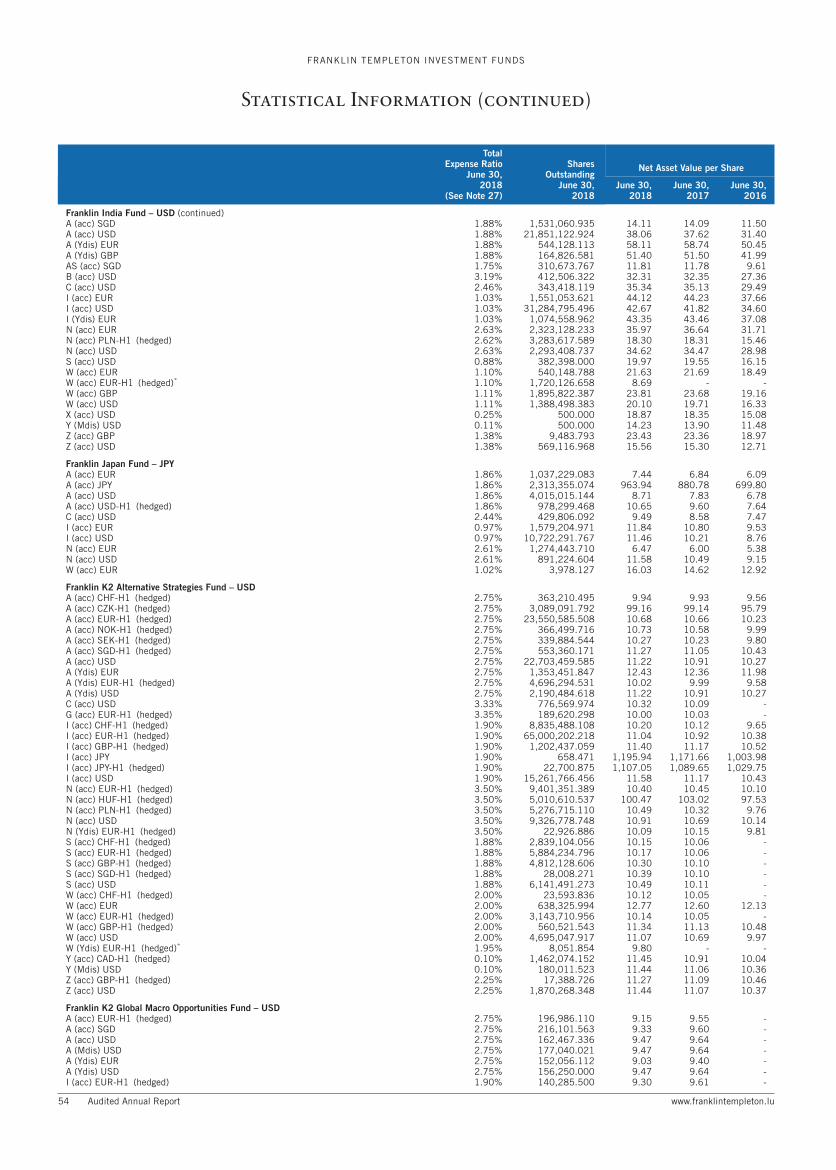
TotalExpense Ratio
June 30,2018
(See Note 27)
SharesOutstanding
June 30,2018
Net Asset Value per Share
June 30,2018
June 30,2017
June 30,2016
Franklin India Fund – USD (continued)A (acc) SGD 1.88% 1,531,060.935 14.11 14.09 11.50A (acc) USD 1.88% 21,851,122.924 38.06 37.62 31.40A (Ydis) EUR 1.88% 544,128.113 58.11 58.74 50.45A (Ydis) GBP 1.88% 164,826.581 51.40 51.50 41.99AS (acc) SGD 1.75% 310,673.767 11.81 11.78 9.61B (acc) USD 3.19% 412,506.322 32.31 32.35 27.36C (acc) USD 2.46% 343,418.119 35.34 35.13 29.49I (acc) EUR 1.03% 1,551,053.621 44.12 44.23 37.66I (acc) USD 1.03% 31,284,795.496 42.67 41.82 34.60I (Ydis) EUR 1.03% 1,074,558.962 43.35 43.46 37.08N (acc) EUR 2.63% 2,323,128.233 35.97 36.64 31.71N (acc) PLN-H1 (hedged) 2.62% 3,283,617.589 18.30 18.31 15.46N (acc) USD 2.63% 2,293,408.737 34.62 34.47 28.98S (acc) USD 0.88% 382,398.000 19.97 19.55 16.15W (acc) EUR 1.10% 540,148.788 21.63 21.69 18.49W (acc) EUR-H1 (hedged)* 1.10% 1,720,126.658 8.69 - -W (acc) GBP 1.11% 1,895,822.387 23.81 23.68 19.16W (acc) USD 1.11% 1,388,498.383 20.10 19.71 16.33X (acc) USD 0.25% 500.000 18.87 18.35 15.08Y (Mdis) USD 0.11% 500.000 14.23 13.90 11.48Z (acc) GBP 1.38% 9,483.793 23.43 23.36 18.97Z (acc) USD 1.38% 569,116.968 15.56 15.30 12.71
Franklin Japan Fund – JPYA (acc) EUR 1.86% 1,037,229.083 7.44 6.84 6.09A (acc) JPY 1.86% 2,313,355.074 963.94 880.78 699.80A (acc) USD 1.86% 4,015,015.144 8.71 7.83 6.78A (acc) USD-H1 (hedged) 1.86% 978,299.468 10.65 9.60 7.64C (acc) USD 2.44% 429,806.092 9.49 8.58 7.47I (acc) EUR 0.97% 1,579,204.971 11.84 10.80 9.53I (acc) USD 0.97% 10,722,291.767 11.46 10.21 8.76N (acc) EUR 2.61% 1,274,443.710 6.47 6.00 5.38N (acc) USD 2.61% 891,224.604 11.58 10.49 9.15W (acc) EUR 1.02% 3,978.127 16.03 14.62 12.92
Franklin K2 Alternative Strategies Fund – USDA (acc) CHF-H1 (hedged) 2.75% 363,210.495 9.94 9.93 9.56A (acc) CZK-H1 (hedged) 2.75% 3,089,091.792 99.16 99.14 95.79A (acc) EUR-H1 (hedged) 2.75% 23,550,585.508 10.68 10.66 10.23A (acc) NOK-H1 (hedged) 2.75% 366,499.716 10.73 10.58 9.99A (acc) SEK-H1 (hedged) 2.75% 339,884.544 10.27 10.23 9.80A (acc) SGD-H1 (hedged) 2.75% 553,360.171 11.27 11.05 10.43A (acc) USD 2.75% 22,703,459.585 11.22 10.91 10.27A (Ydis) EUR 2.75% 1,353,451.847 12.43 12.36 11.98A (Ydis) EUR-H1 (hedged) 2.75% 4,696,294.531 10.02 9.99 9.58A (Ydis) USD 2.75% 2,190,484.618 11.22 10.91 10.27C (acc) USD 3.33% 776,569.974 10.32 10.09 -G (acc) EUR-H1 (hedged) 3.35% 189,620.298 10.00 10.03 -I (acc) CHF-H1 (hedged) 1.90% 8,835,488.108 10.20 10.12 9.65I (acc) EUR-H1 (hedged) 1.90% 65,000,202.218 11.04 10.92 10.38I (acc) GBP-H1 (hedged) 1.90% 1,202,437.059 11.40 11.17 10.52I (acc) JPY 1.90% 658.471 1,195.94 1,171.66 1,003.98I (acc) JPY-H1 (hedged) 1.90% 22,700.875 1,107.05 1,089.65 1,029.75I (acc) USD 1.90% 15,261,766.456 11.58 11.17 10.43N (acc) EUR-H1 (hedged) 3.50% 9,401,351.389 10.40 10.45 10.10N (acc) HUF-H1 (hedged) 3.50% 5,010,610.537 100.47 103.02 97.53N (acc) PLN-H1 (hedged) 3.50% 5,276,715.110 10.49 10.32 9.76N (acc) USD 3.50% 9,326,778.748 10.91 10.69 10.14N (Ydis) EUR-H1 (hedged) 3.50% 22,926.886 10.09 10.15 9.81S (acc) CHF-H1 (hedged) 1.88% 2,839,104.056 10.15 10.06 -S (acc) EUR-H1 (hedged) 1.88% 5,884,234.796 10.17 10.06 -S (acc) GBP-H1 (hedged) 1.88% 4,812,128.606 10.30 10.10 -S (acc) SGD-H1 (hedged) 1.88% 28,008.271 10.39 10.10 -S (acc) USD 1.88% 6,141,491.273 10.49 10.11 -W (acc) CHF-H1 (hedged) 2.00% 23,593.836 10.12 10.05 -W (acc) EUR 2.00% 638,325.994 12.77 12.60 12.13W (acc) EUR-H1 (hedged) 2.00% 3,143,710.956 10.14 10.05 -W (acc) GBP-H1 (hedged) 2.00% 560,521.543 11.34 11.13 10.48W (acc) USD 2.00% 4,695,047.917 11.07 10.69 9.97W (Ydis) EUR-H1 (hedged)* 1.95% 8,051.854 9.80 - -Y (acc) CAD-H1 (hedged) 0.10% 1,462,074.152 11.45 10.91 10.04Y (Mdis) USD 0.10% 180,011.523 11.44 11.06 10.36Z (acc) GBP-H1 (hedged) 2.25% 17,388.726 11.27 11.09 10.46Z (acc) USD 2.25% 1,870,268.348 11.44 11.07 10.37
Franklin K2 Global Macro Opportunities Fund – USDA (acc) EUR-H1 (hedged) 2.75% 196,986.110 9.15 9.55 -A (acc) SGD 2.75% 216,101.563 9.33 9.60 -A (acc) USD 2.75% 162,467.336 9.47 9.64 -A (Mdis) USD 2.75% 177,040.021 9.47 9.64 -A (Ydis) EUR 2.75% 152,056.112 9.03 9.40 -A (Ydis) USD 2.75% 156,250.000 9.47 9.64 -I (acc) EUR-H1 (hedged) 1.90% 140,285.500 9.30 9.61 -
FRANKLIN TEMPLETON INVESTMENT FUNDS
Statistical Information (continued)
54 Audited Annual Report www.franklintempleton.lu

TotalExpense Ratio
June 30,2018
(See Note 27)
SharesOutstanding
June 30,2018
Net Asset Value per Share
June 30,2018
June 30,2017
June 30,2016
Franklin K2 Global Macro Opportunities Fund – USD (continued)I (acc) GBP-H1 (hedged) 1.90% 124,870.125 9.41 9.64 -I (acc) JPY 1.90% 1,609,453.130 103.20 105.87 -I (acc) JPY-H1 (hedged) 1.90% 1,609,453.130 93.63 96.41 -I (acc) USD 1.90% 156,250.000 9.60 9.70 -N (acc) EUR-H1 (hedged) 3.50% 146,455.791 9.05 9.50 -N (acc) USD 3.50% 158,653.273 9.35 9.60 -W (acc) EUR 2.00% 140,285.500 9.14 9.45 -W (acc) GBP-H1 (hedged) 2.00% 124,870.125 9.39 9.63 -W (acc) USD 2.00% 10,601.010 9.77 9.88 -Z (acc) USD 2.25% 156,250.000 9.55 9.67 -
Franklin K2 Long Short Credit Fund – USDA (acc) EUR-H1 (hedged) 2.75% 55,547.956 10.04 10.14 -A (acc) SGD 2.75% 511,614.000 10.01 9.96 -A (acc) USD 2.75% 2,690,376.074 10.45 10.28 -A (Mdis) USD 2.75% 395,666.912 10.28 10.25 -A (Ydis) EUR 2.75% 348,087.749 9.51 9.60 -A (Ydis) USD 2.75% 445,870.592 10.41 10.28 -I (acc) EUR-H1 (hedged) 1.90% 2,503,646.934 10.19 10.20 -I (acc) GBP-H1 (hedged) 1.90% 39,795.590 10.37 10.26 -I (acc) USD 1.90% 568,043.682 10.58 10.33 -N (acc) EUR-H1 (hedged) 3.50% 312,474.348 9.92 10.10 -N (acc) USD 3.50% 454,756.685 10.32 10.24 -W (acc) EUR-H1 (hedged) 2.00% 45,841.224 10.15 10.18 -W (acc) GBP-H1 (hedged) 2.00% 38,508.108 10.36 10.25 -W (acc) USD 2.00% 310,390.851 10.26 10.02 -Z (acc) USD 2.25% 360,948.194 10.53 10.31 -
Franklin MENA Fund – USDA (acc) EUR 2.53% 2,400,138.890 5.88 5.34 4.75A (acc) EUR-H1 (hedged) 2.53% 991,348.349 3.94 3.60 3.17A (acc) USD 2.53% 8,966,719.515 6.92 6.14 5.32A (Ydis) USD 2.53% 74,398.841 7.34 6.52 5.67B (acc) USD 3.84% 410,576.817 6.05 5.45 4.77I (acc) EUR 1.44% 1,123,551.213 6.61 5.94 5.23I (acc) USD 1.45% 3,700,978.621 7.71 6.77 5.80N (acc) EUR-H1 (hedged) 3.03% 1,874,221.687 3.75 3.45 3.04N (acc) USD 3.03% 975,974.245 6.57 5.87 5.10W (acc) EUR 1.48% 33,597.526 11.59 10.42 9.18W (Qdis) USD 1.48% 500.000 12.86 11.44 -X (acc) USD 0.30% 361.795 18.61 16.17 13.68
Franklin Natural Resources Fund – USDA (acc) EUR 1.83% 4,060,743.009 6.41 5.44 5.92A (acc) USD 1.83% 27,654,666.347 7.48 6.20 6.56A (Ydis) EUR-H1 (hedged) 1.83% 473,674.395 5.97 5.08 5.48A (Ydis) USD 1.83% 394,984.467 7.48 6.21 6.57B (acc) USD 3.14% 1,100,553.079 7.79 6.55 7.02C (acc) USD 2.41% 733,744.296 6.73 5.62 5.98F (acc) USD 2.83% 2,096,826.440 11.00 9.22 -I (acc) EUR 0.97% 132,810.286 7.07 5.95 6.42I (acc) USD 0.98% 1,198,938.548 8.24 6.78 7.11N (acc) EUR 2.58% 4,854,368.197 5.89 5.04 5.53N (acc) PLN-H1 (hedged) 2.59% 12,860,602.399 8.03 6.76 7.20
Franklin NextStep Balanced Growth Fund – USDA (acc) HKD 1.54% 400,698.725 12.29 11.87 10.75A (acc) RMB-H1 (hedged)* 1.53% 64,363.000 9.76 - -A (acc) SGD-H1 (hedged) 1.54% 174,444.410 12.04 11.78 10.78A (acc) USD 1.54% 18,584,662.138 12.20 11.84 10.80A (Mdis) HKD 1.54% 1,044,468.810 11.96 11.69 10.71A (Mdis) SGD-H1 (hedged) 1.54% 280,794.564 11.73 11.61 10.74A (Mdis) USD 1.54% 2,077,201.888 11.87 11.66 10.75
Franklin NextStep Conservative Fund – USDA (acc) PLN-H1 (hedged) 1.37% 6,691,589.281 10.99 11.01 10.58A (acc) USD 1.37% 258,504.063 11.04 10.97 10.58A (Mdis) USD 1.37% 32,892.393 10.64 10.76 10.54N (acc) USD 2.25% 339,113.114 10.81 10.84 10.55W (Mdis) EUR-H1 (hedged) 0.78% 420,308.602 9.82 10.14 10.06W (Mdis) GBP-H1 (hedged) 0.78% 202,108.714 10.56 10.80 10.60W (Mdis) USD 0.78% 356,727.601 10.29 10.35 10.07
Franklin NextStep Dynamic Growth Fund – USDA (acc) HKD 1.68% 46,435.395 12.80 12.25 10.86A (acc) RMB-H1 (hedged)* 1.67% 64,363.000 9.69 - -A (acc) SGD-H1 (hedged) 1.68% 164,434.448 12.52 12.16 10.89A (acc) USD 1.68% 4,067,691.374 12.72 12.23 10.91A (Mdis) HKD 1.68% 561,667.427 12.61 12.13 10.83A (Mdis) SGD-H1 (hedged) 1.68% 94,824.972 12.26 12.01 10.85A (Mdis) USD 1.68% 453,380.414 12.44 12.08 10.87
FRANKLIN TEMPLETON INVESTMENT FUNDS
Statistical Information (continued)
www.franklintempleton.lu Audited Annual Report 55
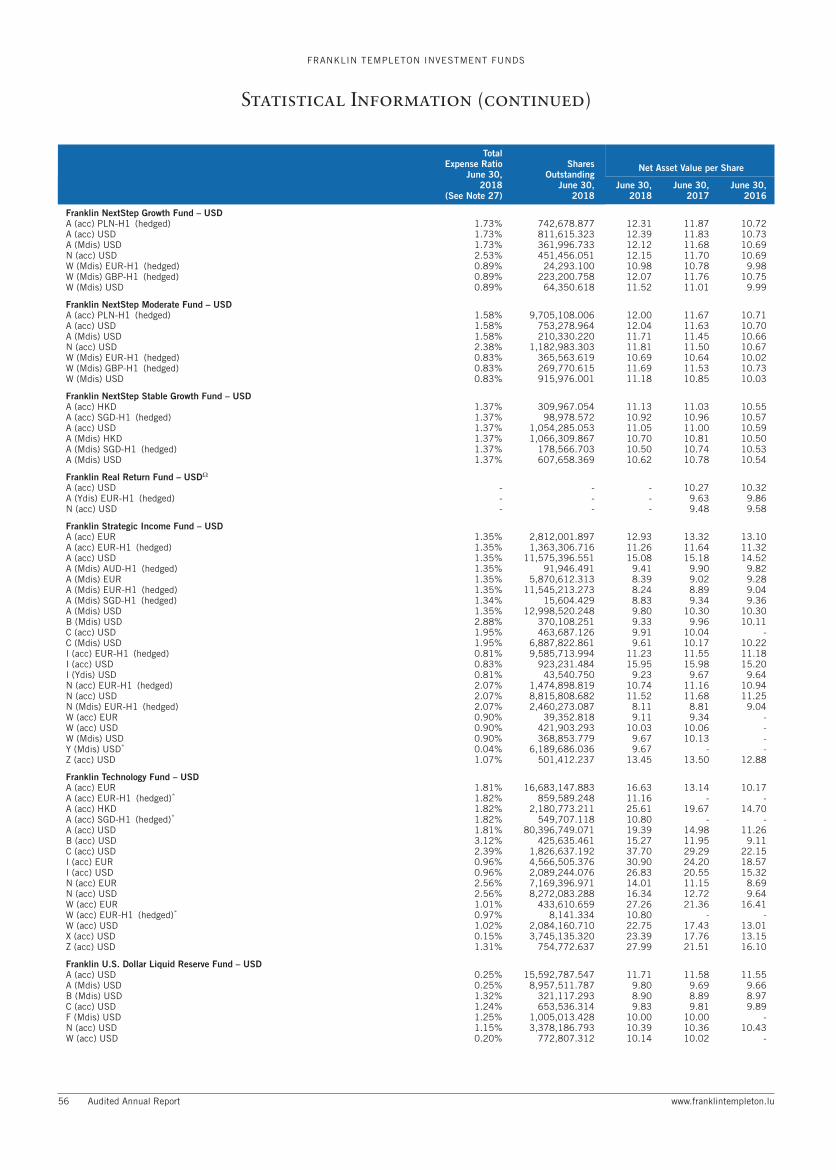
TotalExpense Ratio
June 30,2018
(See Note 27)
SharesOutstanding
June 30,2018
Net Asset Value per Share
June 30,2018
June 30,2017
June 30,2016
Franklin NextStep Growth Fund – USDA (acc) PLN-H1 (hedged) 1.73% 742,678.877 12.31 11.87 10.72A (acc) USD 1.73% 811,615.323 12.39 11.83 10.73A (Mdis) USD 1.73% 361,996.733 12.12 11.68 10.69N (acc) USD 2.53% 451,456.051 12.15 11.70 10.69W (Mdis) EUR-H1 (hedged) 0.89% 24,293.100 10.98 10.78 9.98W (Mdis) GBP-H1 (hedged) 0.89% 223,200.758 12.07 11.76 10.75W (Mdis) USD 0.89% 64,350.618 11.52 11.01 9.99
Franklin NextStep Moderate Fund – USDA (acc) PLN-H1 (hedged) 1.58% 9,705,108.006 12.00 11.67 10.71A (acc) USD 1.58% 753,278.964 12.04 11.63 10.70A (Mdis) USD 1.58% 210,330.220 11.71 11.45 10.66N (acc) USD 2.38% 1,182,983.303 11.81 11.50 10.67W (Mdis) EUR-H1 (hedged) 0.83% 365,563.619 10.69 10.64 10.02W (Mdis) GBP-H1 (hedged) 0.83% 269,770.615 11.69 11.53 10.73W (Mdis) USD 0.83% 915,976.001 11.18 10.85 10.03
Franklin NextStep Stable Growth Fund – USDA (acc) HKD 1.37% 309,967.054 11.13 11.03 10.55A (acc) SGD-H1 (hedged) 1.37% 98,978.572 10.92 10.96 10.57A (acc) USD 1.37% 1,054,285.053 11.05 11.00 10.59A (Mdis) HKD 1.37% 1,066,309.867 10.70 10.81 10.50A (Mdis) SGD-H1 (hedged) 1.37% 178,566.703 10.50 10.74 10.53A (Mdis) USD 1.37% 607,658.369 10.62 10.78 10.54
Franklin Real Return Fund – USDΩ
A (acc) USD - - - 10.27 10.32A (Ydis) EUR-H1 (hedged) - - - 9.63 9.86N (acc) USD - - - 9.48 9.58
Franklin Strategic Income Fund – USDA (acc) EUR 1.35% 2,812,001.897 12.93 13.32 13.10A (acc) EUR-H1 (hedged) 1.35% 1,363,306.716 11.26 11.64 11.32A (acc) USD 1.35% 11,575,396.551 15.08 15.18 14.52A (Mdis) AUD-H1 (hedged) 1.35% 91,946.491 9.41 9.90 9.82A (Mdis) EUR 1.35% 5,870,612.313 8.39 9.02 9.28A (Mdis) EUR-H1 (hedged) 1.35% 11,545,213.273 8.24 8.89 9.04A (Mdis) SGD-H1 (hedged) 1.34% 15,604.429 8.83 9.34 9.36A (Mdis) USD 1.35% 12,998,520.248 9.80 10.30 10.30B (Mdis) USD 2.88% 370,108.251 9.33 9.96 10.11C (acc) USD 1.95% 463,687.126 9.91 10.04 -C (Mdis) USD 1.95% 6,887,822.861 9.61 10.17 10.22I (acc) EUR-H1 (hedged) 0.81% 9,585,713.994 11.23 11.55 11.18I (acc) USD 0.83% 923,231.484 15.95 15.98 15.20I (Ydis) USD 0.81% 43,540.750 9.23 9.67 9.64N (acc) EUR-H1 (hedged) 2.07% 1,474,898.819 10.74 11.16 10.94N (acc) USD 2.07% 8,815,808.682 11.52 11.68 11.25N (Mdis) EUR-H1 (hedged) 2.07% 2,460,273.087 8.11 8.81 9.04W (acc) EUR 0.90% 39,352.818 9.11 9.34 -W (acc) USD 0.90% 421,903.293 10.03 10.06 -W (Mdis) USD 0.90% 368,853.779 9.67 10.13 -Y (Mdis) USD* 0.04% 6,189,686.036 9.67 - -Z (acc) USD 1.07% 501,412.237 13.45 13.50 12.88
Franklin Technology Fund – USDA (acc) EUR 1.81% 16,683,147.883 16.63 13.14 10.17A (acc) EUR-H1 (hedged)* 1.82% 859,589.248 11.16 - -A (acc) HKD 1.82% 2,180,773.211 25.61 19.67 14.70A (acc) SGD-H1 (hedged)* 1.82% 549,707.118 10.80 - -A (acc) USD 1.81% 80,396,749.071 19.39 14.98 11.26B (acc) USD 3.12% 425,635.461 15.27 11.95 9.11C (acc) USD 2.39% 1,826,637.192 37.70 29.29 22.15I (acc) EUR 0.96% 4,566,505.376 30.90 24.20 18.57I (acc) USD 0.96% 2,089,244.076 26.83 20.55 15.32N (acc) EUR 2.56% 7,169,396.971 14.01 11.15 8.69N (acc) USD 2.56% 8,272,083.288 16.34 12.72 9.64W (acc) EUR 1.01% 433,610.659 27.26 21.36 16.41W (acc) EUR-H1 (hedged)* 0.97% 8,141.334 10.80 - -W (acc) USD 1.02% 2,084,160.710 22.75 17.43 13.01X (acc) USD 0.15% 3,745,135.320 23.39 17.76 13.15Z (acc) USD 1.31% 754,772.637 27.99 21.51 16.10
Franklin U.S. Dollar Liquid Reserve Fund – USDA (acc) USD 0.25% 15,592,787.547 11.71 11.58 11.55A (Mdis) USD 0.25% 8,957,511.787 9.80 9.69 9.66B (Mdis) USD 1.32% 321,117.293 8.90 8.89 8.97C (acc) USD 1.24% 653,536.314 9.83 9.81 9.89F (Mdis) USD 1.25% 1,005,013.428 10.00 10.00 -N (acc) USD 1.15% 3,378,186.793 10.39 10.36 10.43W (acc) USD 0.20% 772,807.312 10.14 10.02 -
FRANKLIN TEMPLETON INVESTMENT FUNDS
Statistical Information (continued)
56 Audited Annual Report www.franklintempleton.lu

TotalExpense Ratio
June 30,2018
(See Note 27)
SharesOutstanding
June 30,2018
Net Asset Value per Share
June 30,2018
June 30,2017
June 30,2016
Franklin U.S. Equity Fund – USDA (acc) EUR 1.82% 327,135.314 24.00 22.30 19.54A (acc) EUR-H1 (hedged) 1.82% 314,598.604 18.89 17.60 15.23A (acc) HKD 1.83% 1,567,493.456 18.58 16.79 14.21A (acc) USD 1.83% 9,385,837.945 28.05 25.48 21.70B (acc) USD 3.13% 140,317.903 21.85 20.10 17.35C (acc) USD 2.41% 1,341,438.942 23.83 21.77 18.65I (acc) EUR 0.99% 14,897.892 18.84 17.36 15.08I (acc) EUR-H1 (hedged) 0.97% 182,019.801 13.79 12.73 10.91I (acc) USD 1.01% 365,839.570 23.73 21.38 18.06N (acc) EUR 2.57% 450,336.131 20.79 19.46 17.18N (acc) EUR-H1 (hedged) 2.56% 143,746.651 12.56 11.80 10.29N (acc) USD 2.57% 1,185,963.008 24.32 22.26 19.10W (acc) EUR 1.02% 17,391.180 17.01 15.67 13.63Y (Mdis) USD 0.05% 2,832,485.449 13.84 12.44 10.50Z (acc) USD 1.32% 763,027.400 11.10 10.03 8.50
Franklin U.S. Government Fund – USDA (acc) EUR-H1 (hedged) 1.26% 14,175.335 9.35 9.70 -A (acc) HKD 1.27% 460,577.344 11.30 11.37 11.45A (acc) USD 1.27% 8,139,952.329 10.88 11.00 11.15A (Mdis) HKD 1.27% 756,901.812 9.53 9.77 10.00A (Mdis) USD 1.27% 33,520,430.030 8.87 9.15 9.42AX (acc) USD 1.47% 2,126,611.695 15.23 15.43 15.67B (acc) USD 2.53% 58,830.308 12.00 12.29 12.61B (Mdis) USD 2.53% 570,981.556 8.89 9.17 9.44C (acc) USD 2.05% 1,081,195.948 13.13 13.38 13.67I (acc) EUR-H1 (hedged) 0.59% 1,012,752.910 10.11 10.41 10.66I (acc) USD 0.60% 3,227,415.821 13.83 13.89 13.98I (Mdis) JPY-H1 (hedged) 0.60% 32,241.865 867.26 911.62 951.51I (Mdis) USD 0.60% 6,716,045.885 9.34 9.61 9.88N (acc) USD 1.97% 2,208,341.268 13.82 14.07 14.36N (Mdis) USD 1.97% 986,948.911 8.90 9.18 9.45W (acc) USD 0.75% 215,800.085 10.41 10.47 10.56W (Mdis) USD 0.75% 2,277,634.319 9.21 9.49 9.77X (acc) USD 0.15% 500.000 10.81 10.81 10.85Z (acc) USD 0.97% 284,529.131 11.56 11.66 11.79Z (Mdis) USD 0.98% 24,516.308 9.35 9.63 9.92
Franklin U.S. Low Duration Fund – USDA (acc) EUR 1.15% 528,352.925 10.35 10.60 10.71A (acc) EUR-H1 (hedged) 1.14% 1,539,721.713 9.72 9.98 -A (acc) USD 1.15% 9,116,831.541 10.77 10.79 10.59A (Mdis) USD 1.15% 23,518,236.170 9.75 9.90 9.81AX (acc) USD 1.35% 2,772,345.074 12.22 12.26 12.06B (Mdis) USD 2.41% 878,920.643 9.38 9.51 9.45C (acc) USD 2.05% 102,753.020 9.90 10.00 -C (Mdis) USD 2.04% 1,737,177.224 9.63 9.73 9.64I (acc) EUR-H1 (hedged) 0.66% 10,462,966.521 10.33 10.55 10.49I (acc) USD 0.67% 7,392,541.784 13.17 13.13 12.82N (Mdis) USD 1.84% 2,702,629.965 9.74 9.83 9.72W (acc) USD 0.69% 86,797.727 10.03 10.00 -W (Qdis) USD 0.70% 120,396.054 9.93 10.05 9.96Y (Mdis) USD* 0.04% 8,090,757.615 9.91 - -Z (acc) USD 0.85% 595,525.004 10.25 10.24 10.02
Franklin U.S. Opportunities Fund – USDA (acc) CHF-H1 (hedged) 1.82% 155,221.986 23.61 19.68 16.67A (acc) EUR 1.81% 11,116,611.729 14.43 11.99 10.23A (acc) EUR-H1 (hedged) 1.82% 13,569,803.909 11.25 9.38 7.92A (acc) HKD 1.81% 5,334,829.026 22.98 18.58 15.31A (acc) NOK-H1 (hedged) 1.81% 2,634,593.457 16.48 13.58 11.28A (acc) RMB-H1 (hedged) 1.78% 8,059.697 163.07 130.11 104.27A (acc) SEK-H1 (hedged) 1.82% 2,188,009.709 22.48 18.68 15.77A (acc) SGD 1.81% 2,467,581.206 20.41 16.76 13.59A (acc) SGD-H1 (hedged) 1.81% 1,227,154.299 25.69 21.05 17.50A (acc) USD 1.81% 112,435,494.467 16.84 13.68 11.34A (Ydis) EUR 1.81% 2,126,804.608 14.69 12.21 10.42A (Ydis) GBP 1.81% 765,332.722 12.74 10.49 8.50AS (acc) SGD 1.71% 1,472,766.590 13.62 11.17 9.05B (acc) USD 3.12% 1,415,798.388 13.26 10.91 9.17C (acc) USD 2.39% 6,109,290.242 27.01 22.07 18.40F (acc) USD 2.82% 1,245,940.417 12.67 10.40 -I (acc) EUR 0.96% 3,866,184.057 37.02 30.51 25.81I (acc) EUR-H1 (hedged) 0.97% 2,446,804.170 28.54 23.56 19.72I (acc) USD 0.96% 9,787,966.658 43.26 34.85 28.64N (acc) EUR 2.56% 2,167,370.413 28.75 24.07 20.69N (acc) EUR-H1 (hedged) 2.57% 496,089.365 20.14 16.91 14.38N (acc) PLN-H1 (hedged) 2.57% 5,700,659.146 30.01 24.73 20.63N (acc) USD 2.56% 7,362,960.976 33.65 27.54 23.00S (acc) USD* 0.88% 500.000 11.39 - -W (acc) EUR 1.02% 395,478.571 20.52 16.92 14.32W (acc) EUR-H1 (hedged) 1.02% 429,652.442 12.60 10.40 -W (acc) USD 1.04% 5,693,149.758 23.64 19.06 15.69
FRANKLIN TEMPLETON INVESTMENT FUNDS
Statistical Information (continued)
www.franklintempleton.lu Audited Annual Report 57

TotalExpense Ratio
June 30,2018
(See Note 27)
SharesOutstanding
June 30,2018
Net Asset Value per Share
June 30,2018
June 30,2017
June 30,2016
Franklin U.S. Opportunities Fund – USD (continued)X (acc) USD 0.15% 500.000 17.41 13.91 11.35X (Ydis) USD 0.24% 1,584,331.482 23.99 19.24 15.72Y (Mdis) USD 0.05% 94,845.173 13.75 11.04 9.04Z (acc) USD 1.31% 975,360.097 29.18 23.59 19.46
Franklin U.S. Small-Mid Cap Growth Fund – USDΩ
A (acc) USD - - - 21.10 18.25B (acc) USD - - - 28.12 24.64C (acc) USD - - - 19.41 16.89I (acc) USD - - - 21.17 18.16N (acc) USD - - - 18.56 16.18
Franklin World Perspectives Fund – USDA (acc) EUR 1.97% 4,714,994.248 27.16 25.47 22.28A (acc) USD 1.91% 3,091,083.557 23.26 21.32 18.12I (acc) EUR 0.98% 2,324,159.998 29.58 27.48 23.82I (acc) USD 0.97% 1,461,280.226 25.32 23.00 19.37N (acc) EUR* 2.77% 2,947,830.473 10.10 - -N (acc) USD 2.64% 2,189,405.709 21.62 19.97 17.10W (acc) GBP 1.02% 5,038.950 21.42 19.73 16.25Z (acc) USD 1.32% 120,896.583 12.61 11.49 9.71
Franklin Mutual European Fund – EURA (acc) CZK-H1 (hedged) 1.82% 2,701,924.191 146.61 150.39 129.88A (acc) EUR 1.83% 18,138,523.577 24.31 24.79 21.22A (acc) RMB-H1 (hedged) 1.81% 6,435.005 126.17 123.60 100.67A (acc) SEK 1.83% 5,429,990.051 16.41 15.39 12.86A (acc) USD 1.83% 7,935,302.647 28.39 28.31 23.55A (acc) USD-H1 (hedged) 1.82% 3,013,057.099 11.06 11.00 9.27A (Ydis) EUR 1.83% 1,312,305.147 20.67 21.24 18.62A (Ydis) GBP 1.83% 102,892.802 18.43 18.77 15.59B (acc) USD 3.14% 207,387.768 22.46 22.69 19.13B (Ydis) EUR 3.14% 7,580.814 18.99 19.62 17.02C (acc) EUR 2.41% 6,178.348 21.66 22.21 19.13C (acc) USD 2.41% 646,403.004 25.31 25.38 21.24I (acc) EUR 0.96% 12,173,739.585 22.89 23.14 19.65I (Ydis) EUR 1.01% 5,360.000 18.15 18.64 16.36N (acc) EUR 2.57% 4,244,415.165 19.88 20.42 17.62N (acc) USD 2.58% 553,579.119 23.12 23.22 19.47N (acc) USD-H1 (hedged) 2.55% 697,230.238 11.12 11.15 9.46W (acc) EUR 1.01% 287,634.448 13.56 13.72 11.67W (acc) USD 1.05% 54,614.260 10.13 10.01 -W (acc) USD-H1 (hedged) 1.03% 44,710.659 9.95 9.82 -W (Ydis) EUR 1.02% 24,283.527 11.10 11.41 10.01X (acc) EUR 0.15% 362.897 11.94 11.97 10.09Y (Mdis) EUR 0.05% 2,089,369.655 10.83 11.18 9.74Z (acc) EUR 1.33% 30,326.123 15.12 15.34 13.07Z (acc) USD 1.34% 2,918,844.477 14.55 14.44 11.95Z (acc) USD-H1 (hedged) 1.32% 1,470,551.147 11.63 11.51 9.65
Franklin Mutual Global Discovery Fund – USDA (acc) EUR 1.83% 7,689,486.360 20.03 20.62 17.61A (acc) EUR-H2 (hedged) 1.83% 1,596,275.115 13.61 14.03 11.83A (acc) USD 1.83% 9,997,042.649 19.35 19.47 16.16A (Ydis) EUR 1.83% 1,414,628.743 27.25 28.16 24.28A (Ydis) GBP 1.83% 85,694.770 24.30 24.90 20.38B (acc) USD 3.14% 115,047.634 16.41 16.74 14.07C (acc) USD 2.41% 1,745,942.365 17.96 18.18 15.18I (acc) EUR 0.96% 357,827.338 22.39 22.86 19.35I (acc) EUR-H2 (hedged) 0.97% 3,657,046.961 19.56 20.00 16.73I (acc) USD 0.97% 2,817,801.764 21.62 21.58 17.75N (acc) EUR 2.58% 2,673,053.991 18.18 18.85 16.22N (acc) EUR-H2 (hedged) 2.58% 1,521,673.952 12.76 13.28 11.30N (acc) USD 2.58% 1,645,452.773 17.58 17.83 14.91W (acc) EUR 1.05% 68,924.934 13.46 13.75 11.65W (acc) EUR-H1 (hedged)* 1.00% 655,469.161 9.03 - -W (acc) USD 1.06% 158,931.684 10.05 10.04 -Z (acc) USD 1.33% 565,948.887 16.88 16.90 13.96
Franklin Mutual U.S. Value Fund – USDA (acc) EUR 1.83% 291,705.161 68.92 70.07 62.10A (acc) EUR-H1 (hedged) 1.83% 53,059.978 52.47 53.49 46.84A (acc) SGD 1.83% 332,876.607 13.09 13.15 11.08A (acc) USD 1.83% 3,004,354.778 80.43 79.95 68.85A (Ydis) USD 1.83% 139,177.861 76.27 75.81 65.69B (acc) USD 3.13% 30,119.194 35.15 35.40 30.89C (acc) USD 2.41% 1,551,640.684 22.44 22.43 19.43I (acc) EUR 0.96% 135,189.547 19.48 19.64 17.26I (acc) EUR-H1 (hedged) 1.01% 13,595.064 14.85 15.00 13.04I (acc) USD 0.97% 2,900,326.552 22.77 22.44 19.16N (acc) EUR 2.56% 775,561.020 33.44 34.25 30.58N (acc) EUR-H1 (hedged) 2.57% 142,404.509 25.71 26.43 23.30N (acc) USD 2.58% 1,174,081.004 39.10 39.16 33.98
FRANKLIN TEMPLETON INVESTMENT FUNDS
Statistical Information (continued)
58 Audited Annual Report www.franklintempleton.lu

TotalExpense Ratio
June 30,2018
(See Note 27)
SharesOutstanding
June 30,2018
Net Asset Value per Share
June 30,2018
June 30,2017
June 30,2016
Franklin Mutual U.S. Value Fund – USD (continued)W (acc) USD 1.05% 1,093,964.294 10.43 10.29 -Z (acc) USD 1.33% 571,197.911 19.78 19.56 16.76
Templeton Africa Fund – USDA (acc) EUR 2.40% 1,473,532.354 9.95 9.40 9.18A (acc) EUR-H1 (hedged) 2.39% 1,079,922.715 8.25 7.85 7.60A (acc) GBP 2.39% 36,222.562 10.88 10.18 9.44A (acc) SGD 2.40% 27,353.457 9.72 9.07 8.43A (acc) USD 2.40% 1,930,068.672 8.88 8.20 7.79A (Ydis) EUR 2.40% 312,527.428 9.25 8.84 8.78A (Ydis) EUR-H1 (hedged) 2.40% 141,077.080 7.68 7.39 7.27I (acc) EUR 1.39% 18,427.039 10.58 9.89 9.57I (acc) USD 1.40% 139,809.337 9.44 8.64 8.12N (acc) EUR-H1 (hedged) 2.89% 1,566,373.045 8.01 7.65 7.44W (acc) EUR 1.52% 285,692.222 8.60 8.05 7.80W (acc) GBP 1.52% 371,111.305 11.27 10.46 9.62
Templeton ASEAN Fund – USDΩ
A (acc) SGD - - - 10.49 8.97A (acc) USD - - - 9.89 8.64A (Ydis) USD - - - 9.79 8.60
Templeton Asian Bond Fund – USDA (acc) CHF-H1 (hedged) 1.42% 1,326,794.395 9.74 10.16 9.74A (acc) EUR 1.42% 2,546,520.986 17.99 18.64 18.04A (acc) EUR-H1 (hedged) 1.41% 1,994,344.085 11.74 12.21 11.68A (acc) USD 1.42% 8,296,083.987 17.38 17.61 16.56A (Mdis) AUD-H1 (hedged) 1.42% 104,012.646 8.17 8.72 8.59A (Mdis) EUR 1.42% 2,056,998.981 9.39 10.27 10.46A (Mdis) SGD 1.41% 135,747.783 8.37 9.04 8.76A (Mdis) SGD-H1 (hedged) 1.42% 6,375,600.664 7.83 8.43 8.35A (Mdis) USD 1.42% 6,026,255.893 10.95 11.70 11.59B (Mdis) USD 2.92% 239,485.897 10.43 11.31 11.38C (Mdis) USD 2.19% 860,936.427 10.67 11.49 11.47I (acc) CHF-H1 (hedged) 0.87% 1,235,908.160 10.22 10.59 10.10I (acc) EUR 0.86% 698,010.994 15.93 16.42 15.80I (acc) EUR-H1 (hedged) 0.87% 111,700.882 11.14 11.44 10.88I (acc) USD 0.87% 903,736.244 18.63 18.78 17.56I (Mdis) EUR 0.87% 299,354.391 9.94 10.80 10.94I (Ydis) EUR-H1 (hedged) 0.84% 11,095.444 8.12 8.89 8.91N (acc) EUR 2.11% 587,575.871 16.46 17.18 16.74N (acc) USD 2.11% 1,019,959.124 15.90 16.23 15.36N (Mdis) USD 2.11% 1,047,187.305 10.71 11.52 11.49S (acc) CHF-H1 (hedged)Ω - - - 9.80 9.34S (acc) USDΩ - - - 10.22 9.55W (acc) EUR 0.92% 5,471.676 9.13 9.42 -W (acc) EUR-H1 (hedged) 0.95% 245,531.888 9.94 10.29 9.80W (Mdis) USD 0.95% 4,090,576.469 8.28 8.81 8.69X (Ydis) USDΩ - - - 8.97 8.76Y (Mdis) USD 0.08% 4,631,194.543 9.51 10.03 9.80Z (acc) USD 1.11% 362,554.680 11.62 11.74 11.01
Templeton Asian Dividend Fund – USDΩ
A (acc) USD - - - 10.19 8.79A (Mdis) USD - - - 8.40 7.62N (acc) EUR - - - 11.38 10.16Y (Mdis) USD - - - 11.75 10.34
Templeton Asian Growth Fund – USDA (acc) CHF-H1 (hedged) 2.21% 932,959.909 12.00 12.07 9.41A (acc) CZK-H1 (hedged) 2.21% 1,887,414.604 105.00 106.02 82.95A (acc) EUR 2.21% 11,297,179.189 30.88 30.90 24.25A (acc) EUR-H1 (hedged) 2.21% 4,361,076.981 23.36 23.49 18.22A (acc) HKD 2.21% 21,063,874.669 10.93 10.64 8.07A (acc) RMB-H1 (hedged) 2.21% 114,090.601 135.26 130.44 96.26A (acc) SGD 2.21% 6,348,132.972 9.35 9.24 6.90A (acc) SGD-H1 (hedged) 2.20% 84,012.190 12.24 12.11 9.27A (acc) USD 2.21% 34,109,902.268 36.14 35.36 26.97A (Ydis) EUR 2.21% 3,734,314.479 28.19 28.29 22.33A (Ydis) GBP 2.21% 337,549.584 24.95 24.82 18.59A (Ydis) USD 2.21% 34,549,493.027 32.92 32.30 24.77B (acc) USD 3.51% 528,772.262 14.69 14.57 11.26C (acc) USD 2.79% 1,091,012.317 30.16 29.68 22.77I (acc) CHF-H1 (hedged) 1.23% 75,576.526 10.53 10.49 8.10I (acc) EUR 1.20% 1,775,593.753 32.55 32.25 25.06I (acc) EUR-H1 (hedged) 1.22% 280,927.774 21.31 21.26 16.34I (acc) USD 1.21% 6,343,012.493 38.03 36.84 27.82I (Ydis) EUR-H2 (hedged) 1.21% 5,112,041.584 6.31 6.81 6.02N (acc) EUR 2.71% 1,128,722.718 41.63 41.87 33.03N (acc) EUR-H1 (hedged) 2.71% 1,022,908.308 31.36 31.73 24.73N (acc) HUF 2.71% 2,143,559.920 153.46 144.83 116.77N (acc) PLN-H1 (hedged) 2.69% 4,163,628.423 14.29 14.18 10.86N (acc) USD 2.71% 2,516,760.728 48.63 47.83 36.65
FRANKLIN TEMPLETON INVESTMENT FUNDS
Statistical Information (continued)
www.franklintempleton.lu Audited Annual Report 59

TotalExpense Ratio
June 30,2018
(See Note 27)
SharesOutstanding
June 30,2018
Net Asset Value per Share
June 30,2018
June 30,2017
June 30,2016
Templeton Asian Growth Fund – USD (continued)W (acc) EUR 1.27% 394,159.677 11.92 11.83 9.21W (acc) EUR-H1 (hedged) 1.25% 19,747.270 10.22 10.22 -W (acc) GBP 1.30% 182,668.307 14.68 14.43 10.66W (acc) USD 1.30% 2,168,641.058 12.45 12.08 9.13W (Ydis) EUR 1.29% 12,160.789 12.43 12.45 9.83X (Ydis) USDΩ - - - 10.37 7.95Y (Mdis) USD 0.10% 450.450 10.64 10.43 7.96Z (acc) USD 1.71% 267,254.108 14.20 13.83 10.49Z (Ydis) EUR-H1 (hedged) 1.71% 28,768.792 11.29 11.38 8.89Z (Ydis) USD 1.71% 103,846.764 10.35 10.15 7.78
Templeton Asian Smaller Companies Fund – USDA (acc) EUR 2.23% 4,705,855.537 56.48 54.25 45.81A (acc) SGD 2.23% 156,453.503 45.04 42.74 34.31A (acc) USD 2.23% 6,254,492.890 48.35 45.41 37.26A (Ydis) USD 2.23% 1,788,177.297 47.38 44.50 36.74B (acc) USD 3.53% 73,634.425 44.20 42.05 34.96F (acc) USD 3.25% 2,437,758.457 10.89 10.33 -I (acc) EUR 1.21% 2,691,753.783 62.44 59.36 49.62I (acc) USD 1.21% 7,072,226.356 53.47 49.71 40.38I (Ydis) USD 1.22% 10,079,133.580 11.24 10.47 -N (acc) EUR 2.73% 1,468,331.581 21.37 20.63 17.51N (acc) USD 2.73% 1,706,744.312 17.58 16.59 13.69W (acc) EUR 1.26% 922,384.985 17.37 16.52 13.83W (acc) USD 1.26% 1,617,575.880 14.79 13.76 11.19W (Ydis) EUR-H1 (hedged)* 1.21% 8,050.882 9.07 - -W (Ydis) USD* 1.22% 5,978,518.023 9.89 - -X (Ydis) USD 0.31% 3,437,869.290 13.83 12.97 10.72Y (Mdis) USD 0.10% 2,005,394.812 14.66 13.69 11.23
Templeton BRIC Fund – USDA (acc) EUR 2.46% 4,027,000.553 18.58 16.37 13.19A (acc) EUR-H1 (hedged) 2.46% 1,511,678.050 11.15 9.88 7.89A (acc) HKD 2.48% 596,433.108 9.89 8.47 6.58A (acc) USD 2.46% 33,494,450.601 17.94 15.46 12.10B (acc) USD 3.76% 83,423.650 15.24 13.31 10.55C (acc) USD 3.04% 526,994.588 16.66 14.44 11.36I (acc) USD 1.40% 118,426.509 20.55 17.53 13.57N (acc) EUR 2.95% 1,404,848.177 17.44 15.45 12.50N (acc) USD 2.96% 997,884.991 16.84 14.58 11.47
Templeton China Fund – USDA (acc) HKD 2.45% 486,083.092 13.76 11.64 9.17A (acc) SGD 2.44% 785,960.348 10.08 8.66 6.72A (acc) USD 2.44% 14,532,235.207 30.04 25.55 20.25A (Ydis) EUR 2.44% 543,109.655 24.84 21.61 17.65A (Ydis) GBP 2.44% 43,103.676 21.82 18.82 14.57B (acc) USD 3.74% 543,401.297 12.61 10.87 8.73C (acc) USD 3.02% 323,034.050 20.88 17.86 14.24I (acc) USD 1.39% 240,332.700 37.38 31.46 24.67I (Ydis) GBP 1.48% 4,151.194 13.76 11.75 9.00N (acc) USD 2.94% 743,465.550 29.08 24.86 19.80W (acc) EUR 1.44% 17,496.273 15.01 12.93 10.45W (acc) GBP 1.48% 53,264.379 17.47 14.92 11.45W (acc) USD 1.48% 133,536.518 13.42 11.30 8.88W (Ydis) EUR 1.47% 11,851.442 14.13 12.24 10.00X (acc) HKD 0.27% 2,999,380.406 14.16 11.73 9.04Z (acc) USD 1.95% 445,419.811 12.43 10.54 8.31
Templeton Eastern Europe Fund – EURA (acc) EUR 2.52% 7,035,053.919 22.35 22.80 18.92A (acc) USD 2.52% 2,106,663.821 26.11 26.03 20.99A (Ydis) EUR 2.52% 58,882.301 22.10 22.54 18.71B (acc) USD 3.82% 240,820.181 5.62 5.68 4.64B (Ydis) EUR 3.81% 16,505.027 4.81 4.97 4.18I (acc) EUR 1.40% 1,134,119.121 16.82 16.97 13.92N (acc) EUR 3.02% 885,927.229 20.30 20.81 17.36W (acc) EUR 1.52% 243,165.357 10.51 10.62 8.74X (acc) EUR 0.30% 407,180.804 9.08 9.06 7.35
Templeton Emerging Markets Fund – USDA (acc) EUR-H1 (hedged) 2.33% 1,446,506.476 9.43 9.12 7.41A (acc) HKD 2.31% 212,869.130 11.76 11.00 8.68A (acc) SGD 2.36% 2,155,335.608 8.52 8.09 6.29A (acc) USD 2.35% 6,966,271.426 40.19 37.79 30.03A (Ydis) USD 2.35% 5,757,223.762 38.37 36.07 28.67B (acc) USD 3.68% 98,127.774 18.29 17.42 14.02C (acc) USD 2.92% 615,136.409 33.38 31.56 25.23I (acc) EUR-H1 (hedged) 1.34% 49,674.998 10.10 9.72 7.81I (acc) USD 1.31% 12,146,999.378 27.43 25.53 20.07N (acc) EUR 2.84% 934,794.619 18.16 17.55 14.43N (acc) USD 2.83% 2,287,728.827 21.20 20.03 16.00W (acc) USD 1.46% 792,243.168 11.97 11.15 8.79
FRANKLIN TEMPLETON INVESTMENT FUNDS
Statistical Information (continued)
60 Audited Annual Report www.franklintempleton.lu
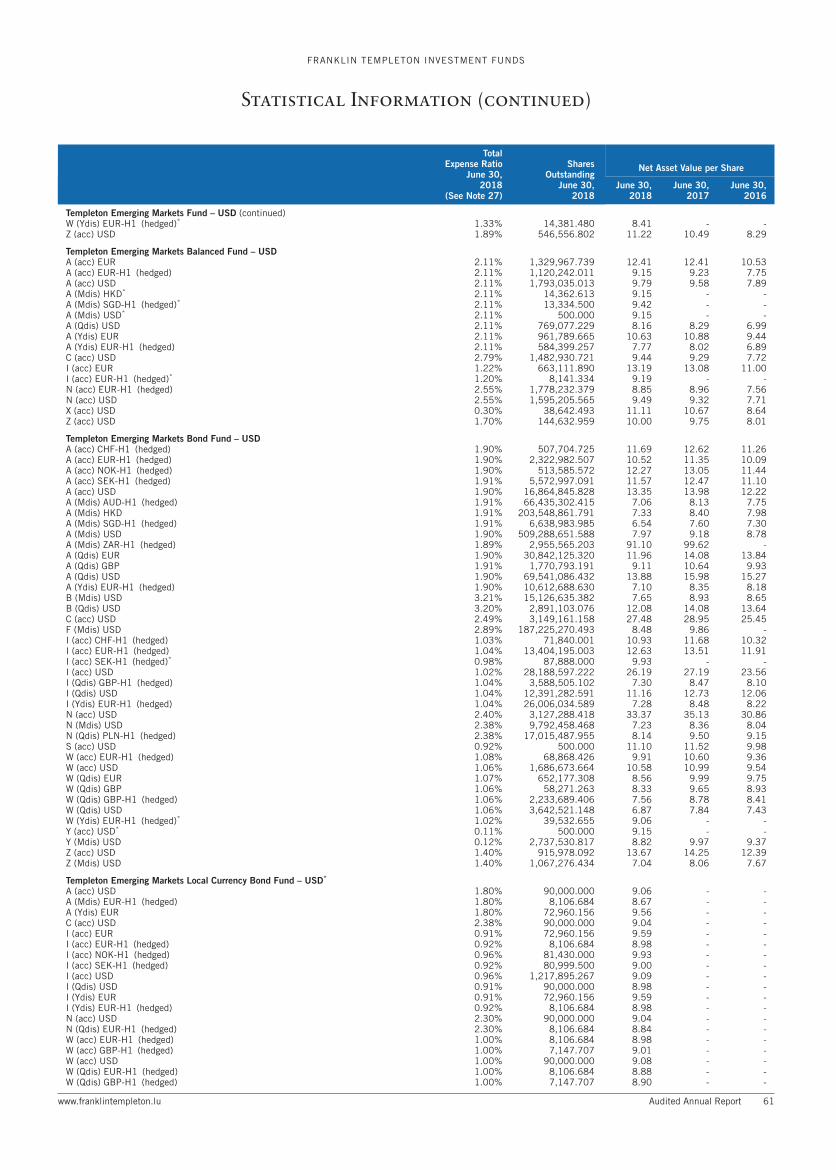
TotalExpense Ratio
June 30,2018
(See Note 27)
SharesOutstanding
June 30,2018
Net Asset Value per Share
June 30,2018
June 30,2017
June 30,2016
Templeton Emerging Markets Fund – USD (continued)W (Ydis) EUR-H1 (hedged)* 1.33% 14,381.480 8.41 - -Z (acc) USD 1.89% 546,556.802 11.22 10.49 8.29
Templeton Emerging Markets Balanced Fund – USDA (acc) EUR 2.11% 1,329,967.739 12.41 12.41 10.53A (acc) EUR-H1 (hedged) 2.11% 1,120,242.011 9.15 9.23 7.75A (acc) USD 2.11% 1,793,035.013 9.79 9.58 7.89A (Mdis) HKD* 2.11% 14,362.613 9.15 - -A (Mdis) SGD-H1 (hedged)* 2.11% 13,334.500 9.42 - -A (Mdis) USD* 2.11% 500.000 9.15 - -A (Qdis) USD 2.11% 769,077.229 8.16 8.29 6.99A (Ydis) EUR 2.11% 961,789.665 10.63 10.88 9.44A (Ydis) EUR-H1 (hedged) 2.11% 584,399.257 7.77 8.02 6.89C (acc) USD 2.79% 1,482,930.721 9.44 9.29 7.72I (acc) EUR 1.22% 663,111.890 13.19 13.08 11.00I (acc) EUR-H1 (hedged)* 1.20% 8,141.334 9.19 - -N (acc) EUR-H1 (hedged) 2.55% 1,778,232.379 8.85 8.96 7.56N (acc) USD 2.55% 1,595,205.565 9.49 9.32 7.71X (acc) USD 0.30% 38,642.493 11.11 10.67 8.64Z (acc) USD 1.70% 144,632.959 10.00 9.75 8.01
Templeton Emerging Markets Bond Fund – USDA (acc) CHF-H1 (hedged) 1.90% 507,704.725 11.69 12.62 11.26A (acc) EUR-H1 (hedged) 1.90% 2,322,982.507 10.52 11.35 10.09A (acc) NOK-H1 (hedged) 1.90% 513,585.572 12.27 13.05 11.44A (acc) SEK-H1 (hedged) 1.91% 5,572,997.091 11.57 12.47 11.10A (acc) USD 1.90% 16,864,845.828 13.35 13.98 12.22A (Mdis) AUD-H1 (hedged) 1.91% 66,435,302.415 7.06 8.13 7.75A (Mdis) HKD 1.91% 203,548,861.791 7.33 8.40 7.98A (Mdis) SGD-H1 (hedged) 1.91% 6,638,983.985 6.54 7.60 7.30A (Mdis) USD 1.90% 509,288,651.588 7.97 9.18 8.78A (Mdis) ZAR-H1 (hedged) 1.89% 2,955,565.203 91.10 99.62 -A (Qdis) EUR 1.90% 30,842,125.320 11.96 14.08 13.84A (Qdis) GBP 1.91% 1,770,793.191 9.11 10.64 9.93A (Qdis) USD 1.90% 69,541,086.432 13.88 15.98 15.27A (Ydis) EUR-H1 (hedged) 1.90% 10,612,688.630 7.10 8.35 8.18B (Mdis) USD 3.21% 15,126,635.382 7.65 8.93 8.65B (Qdis) USD 3.20% 2,891,103.076 12.08 14.08 13.64C (acc) USD 2.49% 3,149,161.158 27.48 28.95 25.45F (Mdis) USD 2.89% 187,225,270.493 8.48 9.86 -I (acc) CHF-H1 (hedged) 1.03% 71,840.001 10.93 11.68 10.32I (acc) EUR-H1 (hedged) 1.04% 13,404,195.003 12.63 13.51 11.91I (acc) SEK-H1 (hedged)* 0.98% 87,888.000 9.93 - -I (acc) USD 1.02% 28,188,597.222 26.19 27.19 23.56I (Qdis) GBP-H1 (hedged) 1.04% 3,588,505.102 7.30 8.47 8.10I (Qdis) USD 1.04% 12,391,282.591 11.16 12.73 12.06I (Ydis) EUR-H1 (hedged) 1.04% 26,006,034.589 7.28 8.48 8.22N (acc) USD 2.40% 3,127,288.418 33.37 35.13 30.86N (Mdis) USD 2.38% 9,792,458.468 7.23 8.36 8.04N (Qdis) PLN-H1 (hedged) 2.38% 17,015,487.955 8.14 9.50 9.15S (acc) USD 0.92% 500.000 11.10 11.52 9.98W (acc) EUR-H1 (hedged) 1.08% 68,868.426 9.91 10.60 9.36W (acc) USD 1.06% 1,686,673.664 10.58 10.99 9.54W (Qdis) EUR 1.07% 652,177.308 8.56 9.99 9.75W (Qdis) GBP 1.06% 58,271.263 8.33 9.65 8.93W (Qdis) GBP-H1 (hedged) 1.06% 2,233,689.406 7.56 8.78 8.41W (Qdis) USD 1.06% 3,642,521.148 6.87 7.84 7.43W (Ydis) EUR-H1 (hedged)* 1.02% 39,532.655 9.06 - -Y (acc) USD* 0.11% 500.000 9.15 - -Y (Mdis) USD 0.12% 2,737,530.817 8.82 9.97 9.37Z (acc) USD 1.40% 915,978.092 13.67 14.25 12.39Z (Mdis) USD 1.40% 1,067,276.434 7.04 8.06 7.67
Templeton Emerging Markets Local Currency Bond Fund – USD*
A (acc) USD 1.80% 90,000.000 9.06 - -A (Mdis) EUR-H1 (hedged) 1.80% 8,106.684 8.67 - -A (Ydis) EUR 1.80% 72,960.156 9.56 - -C (acc) USD 2.38% 90,000.000 9.04 - -I (acc) EUR 0.91% 72,960.156 9.59 - -I (acc) EUR-H1 (hedged) 0.92% 8,106.684 8.98 - -I (acc) NOK-H1 (hedged) 0.96% 81,430.000 9.93 - -I (acc) SEK-H1 (hedged) 0.92% 80,999.500 9.00 - -I (acc) USD 0.96% 1,217,895.267 9.09 - -I (Qdis) USD 0.91% 90,000.000 8.98 - -I (Ydis) EUR 0.91% 72,960.156 9.59 - -I (Ydis) EUR-H1 (hedged) 0.92% 8,106.684 8.98 - -N (acc) USD 2.30% 90,000.000 9.04 - -N (Qdis) EUR-H1 (hedged) 2.30% 8,106.684 8.84 - -W (acc) EUR-H1 (hedged) 1.00% 8,106.684 8.98 - -W (acc) GBP-H1 (hedged) 1.00% 7,147.707 9.01 - -W (acc) USD 1.00% 90,000.000 9.08 - -W (Qdis) EUR-H1 (hedged) 1.00% 8,106.684 8.88 - -W (Qdis) GBP-H1 (hedged) 1.00% 7,147.707 8.90 - -
FRANKLIN TEMPLETON INVESTMENT FUNDS
Statistical Information (continued)
www.franklintempleton.lu Audited Annual Report 61

TotalExpense Ratio
June 30,2018
(See Note 27)
SharesOutstanding
June 30,2018
Net Asset Value per Share
June 30,2018
June 30,2017
June 30,2016
Templeton Emerging Markets Local Currency Bond Fund – USD* (continued)W (Qdis) USD 1.00% 90,000.000 8.98 - -Y (acc) SEK-H1 (hedged) 0.11% 80,999.500 9.03 - -
Templeton Emerging Markets Smaller Companies Fund – USDA (acc) EUR 2.48% 6,744,398.909 14.69 14.62 12.30A (acc) EUR-H1 (hedged)* 2.48% 48,005.336 9.71 - -A (acc) USD 2.48% 13,390,368.739 12.01 11.68 9.55A (Ydis) GBP 2.48% 272,074.766 17.80 17.55 14.03A (Ydis) USD 2.48% 1,878,358.541 11.50 11.18 9.17C (acc) USD 3.06% 1,257,889.766 12.55 12.28 10.09I (acc) EUR 1.42% 9,905,301.438 16.49 16.22 13.50I (acc) USD 1.42% 20,825,871.372 13.47 12.97 10.49N (acc) USD 2.98% 3,662,059.414 11.39 11.14 9.15W (acc) EUR* 1.48% 1,697,609.559 9.73 - -W (acc) GBP 1.55% 1,606,590.279 20.85 20.37 16.13W (acc) USD 1.55% 2,232,063.977 14.41 13.88 11.25W (Ydis) EUR-H1 (hedged)* 1.45% 8,050.882 8.84 - -Y (Mdis) USD 0.10% 2,312,243.412 11.41 11.01 8.96Y (Ydis) JPY* 0.08% 11,314,975.787 1,020.92 - -
Templeton Euroland Fund – EURA (acc) EUR 1.82% 7,298,276.369 23.58 23.79 18.53A (acc) USD-H1 (hedged)* 1.82% 50,268.207 9.90 - -A (Ydis) EUR 1.82% 2,453,392.306 19.58 19.94 15.72B (acc) USD 3.13% 62,840.063 10.63 10.62 8.14B (Ydis) EUR 3.13% 50,719.095 8.67 8.86 7.00I (acc) EUR 0.97% 14,019,416.475 22.36 22.36 17.27N (acc) EUR 2.58% 3,229,850.224 13.64 13.86 10.88W (acc) EUR 1.01% 4,166,067.916 10.18 10.19 -X (acc) EUR 0.15% 5,259,540.000 14.84 14.72 11.28
Templeton European Fund – EURA (acc) EUR 1.84% 1,780,487.334 23.69 23.59 18.98A (acc) SGD 1.84% 1,288,923.740 9.08 8.93 6.83A (acc) USD 1.84% 1,146,450.453 27.64 26.91 21.04A (Ydis) USD 1.84% 4,079,884.311 22.55 22.16 17.59I (acc) EUR 0.98% 160,642.658 21.05 20.78 16.58N (acc) EUR 2.59% 330,651.830 21.05 21.12 17.13W (acc) EUR 0.99% 10,298.689 11.91 11.76 9.38Z (acc) EUR 1.32% 623.887 11.77 11.66 9.33
Templeton Frontier Markets Fund – USDA (acc) EUR 2.57% 5,504,763.534 21.83 23.82 19.71A (acc) EUR-H1 (hedged) 2.56% 2,162,340.685 10.65 11.71 9.60A (acc) SGD 2.57% 175,823.655 17.42 18.78 14.77A (acc) USD 2.57% 6,124,899.776 18.69 19.94 16.03A (Ydis) GBP 2.57% 168,122.384 22.50 24.52 19.62A (Ydis) USD 2.57% 802,345.368 17.00 18.27 14.98B (acc) USD 3.86% 1,709.484 15.57 16.83 13.72C (acc) USD 3.15% 42,437.847 16.71 17.92 14.50I (acc) EUR 1.50% 6,215,145.150 24.23 26.16 21.41I (acc) USD 1.50% 2,947,561.552 20.75 21.89 17.42I (Ydis) GBP 1.50% 303,308.184 22.92 24.96 20.00N (acc) EUR 3.07% 1,247,813.156 20.80 22.80 18.96N (acc) EUR-H1 (hedged) 3.06% 2,419,485.976 15.96 17.62 14.51N (acc) PLN-H1 (hedged) 3.05% 1,749,430.189 12.15 13.19 10.65W (acc) EUR 1.65% 605,629.456 12.25 13.24 10.86W (acc) GBP 1.64% 629,300.584 15.83 16.96 13.21W (acc) USD 1.65% 1,035,376.235 13.93 14.72 11.74X (acc) USD 0.30% 500.000 13.93 14.53 11.42Z (acc) GBP 2.07% 22,131.301 15.48 16.66 13.02Z (Ydis) EUR-H1 (hedged) 2.06% 51,833.384 9.84 10.89 9.10
Templeton Global Fund – USDA (acc) HKD 1.83% 707,429.585 17.56 16.63 13.56A (acc) SGD 1.83% 2,153,767.723 10.94 10.52 8.44A (acc) USD 1.83% 4,781,064.146 42.72 40.66 33.35A (Ydis) USD 1.83% 17,500,181.442 38.03 36.29 29.97AS (acc) SGD 1.73% 2,634,966.101 11.27 10.83 8.68B (acc) USD 3.13% 198,938.647 24.47 23.60 19.61C (acc) USD 2.41% 520,748.784 24.00 22.97 18.95I (acc) USD 0.97% 7,227,308.239 25.16 23.75 19.31N (acc) USD 2.58% 835,066.620 27.02 25.92 21.42W (Ydis) USD 1.06% 39,961.707 12.15 11.59 9.58X (Ydis) USD 0.25% 1,692,360.210 10.64 10.14 8.38Z (acc) USD 1.33% 100,839.900 11.44 10.83 8.84
Templeton Global Balanced Fund – USDA (acc) EUR 1.64% 2,073,933.735 25.86 25.75 22.72A (acc) EUR-H1 (hedged) 1.63% 597,249.143 19.48 19.48 17.01A (acc) SGD 1.64% 1,752,600.329 11.70 11.51 9.66A (acc) USD 1.64% 6,044,724.037 30.20 29.40 25.22A (Qdis) USD 1.64% 9,637,069.060 23.00 23.09 20.42AS (acc) SGD 1.54% 33,790,013.079 11.09 10.90 9.13
FRANKLIN TEMPLETON INVESTMENT FUNDS
Statistical Information (continued)
62 Audited Annual Report www.franklintempleton.lu

TotalExpense Ratio
June 30,2018
(See Note 27)
SharesOutstanding
June 30,2018
Net Asset Value per Share
June 30,2018
June 30,2017
June 30,2016
Templeton Global Balanced Fund – USD (continued)B (acc) USD 2.94% 438,645.783 18.42 18.17 15.79C (Qdis) USD 2.22% 1,432,208.739 13.28 13.41 11.93I (Ydis) USD 0.87% 2,145,536.135 13.17 13.09 11.46N (acc) EUR 2.14% 2,485,270.408 18.01 18.02 15.99N (acc) EUR-H1 (hedged) 2.13% 1,083,255.500 10.03 10.08 8.83W (acc) EUR 0.91% 7,047.115 9.74 9.63 -W (acc) GBP-H1 (hedged) 0.92% 51,487.319 10.34 10.17 8.73W (acc) USD 0.93% 951,541.668 11.28 10.90 9.29X (Ydis) USD 0.25% 813,818.064 10.22 10.09 8.77Z (acc) USD 1.14% 469,622.901 10.52 10.18 8.69
Templeton Global Bond Fund – USDA (acc) CHF-H1 (hedged) 1.41% 5,346,626.809 12.07 12.69 11.74A (acc) CZK-H1 (hedged) 1.41% 25,097,731.920 104.92 110.50 103.03A (acc) EUR 1.41% 42,735,310.757 24.70 25.83 24.15A (acc) EUR-H1 (hedged) 1.41% 41,475,891.699 20.03 21.01 19.36A (acc) HKD 1.41% 860,096.714 12.93 13.15 11.87A (acc) NOK-H1 (hedged) 1.40% 1,906,263.002 13.43 13.90 12.65A (acc) SEK-H1 (hedged) 1.41% 26,769,150.840 12.53 13.13 12.11A (acc) USD 1.41% 54,596,382.405 28.86 29.50 26.81A (Mdis) AUD-H1 (hedged) 1.41% 2,607,497.446 10.16 11.08 10.59A (Mdis) CAD-H1 (hedged) 1.41% 496,251.639 9.10 10.01 9.69A (Mdis) EUR 1.41% 27,352,622.219 14.81 16.55 16.40A (Mdis) EUR-H1 (hedged) 1.40% 33,476,182.882 10.69 11.97 11.71A (Mdis) GBP 1.41% 2,202,656.603 13.12 14.53 13.67A (Mdis) GBP-H1 (hedged) 1.41% 3,903,822.775 8.75 9.72 9.41A (Mdis) HKD 1.40% 36,770,064.701 9.48 10.31 9.87A (Mdis) RMB-H1 (hedged) 1.40% 103,925.883 100.68 108.03 100.45A (Mdis) SGD 1.41% 8,166,241.496 10.20 11.25 10.61A (Mdis) SGD-H1 (hedged) 1.41% 13,836,350.078 10.65 11.70 11.28A (Mdis) USD 1.41% 159,763,062.158 17.29 18.88 18.19A (Ydis) CHF-H1 (hedged) 1.41% 1,984,046.945 9.02 10.06 9.78A (Ydis) EUR 1.41% 50,822,207.575 15.79 17.52 17.21A (Ydis) EUR-H1 (hedged) 1.41% 72,566,558.303 8.96 9.96 9.63AX (acc) USD 1.61% 9,824,317.037 21.67 22.19 20.20B (Mdis) USD 2.91% 2,424,418.593 17.19 19.06 18.64C (acc) USD 2.19% 1,232,856.334 9.51 9.80 -C (Mdis) USD 2.19% 21,687,126.425 12.95 14.25 13.83F (Mdis) USD 2.40% 2,367,518.454 8.95 9.88 -I (acc) CHF-H1 (hedged) 0.86% 11,820,112.324 11.90 12.41 11.42I (acc) EUR 0.85% 8,919,741.296 20.70 21.52 20.01I (acc) EUR-H1 (hedged) 0.86% 22,426,100.779 17.06 17.76 16.28I (acc) NOK-H1 (hedged) 0.86% 195,119,486.329 10.37 10.69 9.67I (acc) USD 0.86% 45,426,301.225 24.34 24.74 22.36I (Mdis) EUR 0.86% 903,050.686 12.60 14.00 13.80I (Mdis) GBP 0.86% 3,606,295.409 12.46 13.72 12.84I (Mdis) GBP-H1 (hedged) 0.86% 8,882,916.280 9.77 10.81 10.40I (Mdis) JPY 0.85% 4,853,295.192 1,174.01 1,295.39 1,139.40I (Mdis) JPY-H1 (hedged) 0.84% 5,812,860.930 865.77 958.02 922.12I (Ydis) EUR 0.86% 6,372,949.390 14.06 15.51 15.14I (Ydis) EUR-H1 (hedged) 0.86% 18,856,412.853 9.20 10.16 9.78N (acc) EUR 2.11% 8,342,571.322 23.59 24.84 23.39N (acc) EUR-H1 (hedged) 2.10% 17,915,554.649 19.19 20.25 18.81N (acc) HUF 2.10% 3,805,502.311 147.79 146.00 140.51N (acc) PLN-H1 (hedged) 2.10% 6,321,949.686 13.95 14.42 13.12N (acc) USD 2.11% 13,379,519.822 27.56 28.38 25.96N (Mdis) EUR-H1 (hedged) 2.10% 31,446,618.577 12.21 13.77 13.56N (Mdis) USD 2.11% 6,858,408.378 9.06 9.96 9.67N (Ydis) EUR-H1 (hedged) 2.10% 9,535,872.358 8.84 9.87 9.64S (acc) USD 0.74% 44,742.000 10.56 10.72 9.68S (Mdis) EUR 0.74% 422.244 8.58 9.53 9.41W (acc) CHF-H1 (hedged) 0.95% 1,121,413.933 9.64 10.06 9.26W (acc) EUR 0.96% 4,437,841.759 11.56 12.03 11.21W (acc) EUR-H1 (hedged) 0.95% 4,300,436.493 11.11 11.60 10.64W (acc) USD 0.95% 9,602,437.100 11.63 11.83 10.71W (Mdis) EUR 0.96% 733,491.300 9.77 10.86 10.73W (Mdis) GBP 0.96% 2,321,284.321 10.90 12.01 11.26W (Mdis) GBP-H1 (hedged) 0.96% 5,086,844.154 9.23 10.20 9.82W (Mdis) USD 0.96% 7,532,912.056 8.22 8.94 8.58W (Ydis) CHF-H1 (hedged)* 0.88% 14,510.815 9.77 - -W (Ydis) EUR 0.96% 1,278,210.760 10.37 11.45 11.20W (Ydis) EUR-H1 (hedged) 0.96% 967,011.471 8.31 9.19 8.86X (acc) EUR 0.15% 379.158 12.52 12.92 11.94X (acc) EUR-H1 (hedged) 0.15% 18,875,524.491 10.64 11.03 10.05X (acc) USD 0.29% 2,532,100.574 10.33 10.45 9.38Y (acc) CAD 0.08% 1,596,466.816 10.97 10.91 9.76Y (Mdis) USD 0.08% 500.000 10.06 10.85 10.29Z (acc) EUR 1.11% 172,907.851 14.20 14.80 13.80Z (acc) USD 1.11% 8,163,408.259 12.87 13.12 11.88Z (Mdis) GBP-H1 (hedged) 1.10% 24,420.685 9.21 10.19 9.83Z (Mdis) USD 1.11% 4,666,660.408 8.84 9.62 9.24Z (Ydis) EUR-H1 (hedged) 1.11% 122,273.752 9.08 10.05 9.70
FRANKLIN TEMPLETON INVESTMENT FUNDS
Statistical Information (continued)
www.franklintempleton.lu Audited Annual Report 63

TotalExpense Ratio
June 30,2018
(See Note 27)
SharesOutstanding
June 30,2018
Net Asset Value per Share
June 30,2018
June 30,2017
June 30,2016
Templeton Global Bond (Euro) Fund – EURA (acc) EUR 1.41% 8,070,318.902 15.52 15.88 15.65A (acc) USD 1.41% 128,803.018 10.27 10.28 9.85A (Ydis) EUR 1.41% 6,180,020.822 9.63 10.25 10.32I (acc) EUR 0.86% 1,767,647.919 16.09 16.38 16.05N (acc) EUR 2.11% 4,281,900.646 13.99 14.42 14.31N (Ydis) EUR 2.08% 466.201 9.29 9.88 9.94W (acc) EUR 0.98% 1,903,354.377 10.69 10.89 10.69X (acc) EUR 0.15% 1,693,000.000 9.84 9.95 -
Templeton Global Climate Change Fund – EURA (acc) EUR 1.83% 1,612,843.137 21.76 21.90 18.25A (acc) USD-H1 (hedged)* 1.76% 9,986.040 10.18 - -A (Ydis) EUR 1.83% 30,532,187.797 19.59 19.79 16.62B (acc) USD 3.11% 1,673.932 11.08 11.04 9.06I (acc) EUR 0.97% 196,998.049 21.68 21.63 17.86I (acc) EUR-H2 (hedged)Ω - - - 20.35 16.57N (acc) EUR 2.58% 351,549.859 17.58 17.82 14.96W (acc) EUR 1.06% 21,028.003 13.56 13.54 11.20Z (acc) EUR 1.33% 9,121.023 12.36 12.38 10.26
Templeton Global Currency Fund – USDA (acc) EUR 1.35% 63,135.096 9.55 10.07 -A (acc) EUR-H1 (hedged) 1.35% 62,508.369 9.57 10.15 -A (acc) USD 1.35% 113,396.629 9.96 10.27 -I (acc) EUR 0.81% 62,508.369 9.64 10.11 -I (acc) EUR-H1 (hedged) 0.81% 62,508.369 9.67 10.18 -I (acc) USD 0.81% 70,000.000 10.05 10.31 -N (acc) EUR 2.05% 65,417.866 9.43 10.01 -N (acc) EUR-H1 (hedged) 2.05% 63,964.680 9.47 10.09 -N (acc) USD 2.05% 410,641.114 9.84 10.21 -W (acc) EUR 0.90% 62,508.369 9.62 10.09 -W (acc) EUR-H1 (hedged) 0.90% 62,923.739 9.66 10.18 -W (acc) USD 0.95% 500.000 9.68 9.94 -
Templeton Global Equity Income Fund – USDA (acc) EUR 1.60% 477,565.871 16.27 15.67 12.96A (acc) USD 1.60% 1,501,169.391 15.11 14.23 11.44A (Mdis) RMB-H1 (hedged) 1.79% 37,958.359 108.20 104.49 85.04A (Mdis) SGD 1.84% 4,024,945.539 6.56 6.50 5.36A (Mdis) USD 1.60% 6,862,001.000 10.00 9.79 8.23AS (Mdis) SGD 1.74% 1,658,474.136 10.32 10.22 8.42B (Qdis) USD 2.90% 512,921.491 9.34 9.27 7.91N (Mdis) USD 2.57% 65,083.278 9.17 9.06 7.69Y (Mdis) USD 0.06% 177,853.002 12.25 11.81 9.77Z (Qdis) USD 1.10% 45,453.276 11.13 10.84 9.08
Templeton Global High Yield Fund – USDA (acc) EUR 1.71% 913,850.357 12.90 13.46 12.61A (acc) USD 1.71% 668,179.991 15.06 15.37 13.99A (Mdis) EUR 1.71% 8,669,401.435 6.81 7.70 7.70A (Mdis) USD 1.71% 2,667,726.855 7.95 8.78 8.53I (acc) EUR 0.91% 675,252.534 13.99 14.49 13.46N (acc) EUR 2.21% 1,443,132.651 12.19 12.79 12.04
Templeton Global Income Fund – USDA (acc) EUR 1.69% 8,674,908.431 21.67 21.96 19.25A (acc) EUR-H1 (hedged) 1.65% 809,837.600 10.48 10.65 9.23A (acc) HKDΩ - - - 14.35 12.15A (acc) USD 1.69% 8,712,524.626 20.13 19.94 16.99A (Mdis) SGD-H1 (hedged) 1.65% 25,801.035 9.32 9.72 8.63A (Qdis) EUR-H1 (hedged) 1.66% 856,735.988 9.18 9.70 8.76A (Qdis) HKD 1.69% 5,054,134.711 11.80 12.13 10.69A (Qdis) USD 1.69% 8,824,026.460 13.51 13.95 12.38B (Qdis) USD 2.99% 718,854.581 12.90 13.49 12.13C (acc) USD 2.27% 198,969.685 10.26 10.23 -C (Qdis) USD 2.27% 4,170,323.441 13.22 13.73 12.25I (acc) EUR-H1 (hedged) 0.88% 1,866,166.779 10.86 10.95 9.42I (acc) USD 0.89% 2,915,752.287 22.04 21.66 18.30N (acc) EUR-H1 (hedged) 2.19% 630,330.096 10.04 10.27 8.94N (acc) USD 2.19% 9,081,113.131 18.86 18.78 16.08N (Qdis) EUR-H1 (hedged) 2.18% 2,335,063.841 9.02 9.59 8.69S (acc) USD 0.77% 500.000 11.32 11.11 9.39W (acc) EUR 0.93% 5,312.955 9.47 9.52 -W (acc) USD 0.94% 40,920.632 10.43 10.26 -Z (acc) USD 1.05% 802,770.862 16.16 15.90 13.46
Templeton Global Smaller Companies Fund – USDA (acc) USD 1.85% 1,000,791.056 44.77 41.05 33.59A (Ydis) USD 1.85% 1,714,363.687 42.26 38.74 31.71B (acc) USD 3.14% 9,807.198 11.34 10.54 8.74I (acc) USD 1.03% 47,219.950 20.83 18.94 15.38N (acc) USD 2.60% 130,136.828 29.09 26.87 22.16
FRANKLIN TEMPLETON INVESTMENT FUNDS
Statistical Information (continued)
64 Audited Annual Report www.franklintempleton.lu

TotalExpense Ratio
June 30,2018
(See Note 27)
SharesOutstanding
June 30,2018
Net Asset Value per Share
June 30,2018
June 30,2017
June 30,2016
Templeton Global Total Return Fund – USDA (acc) CHF-H1 (hedged) 1.41% 6,876,695.774 13.64 14.57 13.17A (acc) EUR 1.41% 25,009,279.736 25.09 26.61 24.33A (acc) EUR-H1 (hedged) 1.41% 39,427,840.228 20.21 21.49 19.38A (acc) HKD 1.41% 11,047,673.411 14.24 14.70 12.98A (acc) NOK-H1 (hedged) 1.41% 2,365,313.809 10.43 10.97 9.75A (acc) PLN-H1 (hedged) 1.41% 3,250,902.947 86.86 90.65 79.98A (acc) SEK-H1 (hedged) 1.41% 23,707,975.163 12.22 12.99 11.71A (acc) USD 1.41% 74,548,203.080 29.33 30.42 27.03A (Mdis) AUD-H1 (hedged) 1.42% 25,794,186.108 9.80 10.95 10.38A (Mdis) EUR 1.41% 35,865,140.147 12.16 13.90 13.65A (Mdis) EUR-H1 (hedged) 1.41% 68,178,096.400 8.73 10.03 9.70A (Mdis) GBP 1.41% 3,025,918.595 10.77 12.20 11.37A (Mdis) GBP-H1 (hedged) 1.41% 16,937,019.661 6.89 7.85 7.52A (Mdis) HKD 1.41% 726,425,972.520 9.38 10.43 9.89A (Mdis) RMB-H1 (hedged) 1.40% 1,056,032.470 96.67 106.16 97.77A (Mdis) SGD 1.41% 16,898,700.363 9.80 11.07 10.33A (Mdis) SGD-H1 (hedged) 1.41% 53,614,390.553 9.24 10.41 9.95A (Mdis) USD 1.41% 194,743,444.346 14.16 15.82 15.10A (Ydis) CHF-H1 (hedged) 1.42% 1,655,566.912 8.73 9.98 9.65A (Ydis) EUR 1.41% 35,075,693.272 13.04 14.84 14.49A (Ydis) EUR-H1 (hedged) 1.41% 38,956,010.843 8.89 10.14 9.77B (acc) USD 2.92% 389,394.622 23.55 24.80 22.37B (Mdis) USD 2.92% 2,876,104.924 13.46 15.28 14.80C (acc) USD 2.19% 844,411.971 9.43 9.85 -C (Mdis) USD 2.19% 19,163,913.871 12.30 13.85 13.32I (acc) CHF-H1 (hedged) 0.87% 2,350,043.302 12.34 13.09 11.79I (acc) EUR 0.86% 6,344,981.360 24.19 25.52 23.20I (acc) EUR-H1 (hedged) 0.87% 22,021,831.314 18.83 19.90 17.86I (acc) NOK-H1 (hedged) 0.85% 2,893,314.076 10.41 10.87 9.61I (acc) USD 0.87% 22,957,653.186 28.23 29.12 25.73I (acc) USD-H4 (BRL) (hedged) 0.86% 4,519,905.962 8.56 9.85 8.18I (Mdis) EUR 0.87% 950,052.660 12.11 13.77 13.44I (Mdis) GBP 0.87% 234,336.493 12.74 14.36 13.31I (Mdis) GBP-H1 (hedged) 0.86% 1,410,192.075 9.94 11.22 10.74I (Mdis) JPY 0.85% 155,997,159.654 1,138.77 1,285.82 1,119.78I (Mdis) JPY-H1 (hedged) 0.85% 16,548,426.132 800.47 907.84 865.47I (Qdis) USD* 0.85% 8,136,004.673 9.28 - -I (Ydis) EUR 0.87% 1,905,850.286 13.24 15.00 14.56I (Ydis) EUR-H1 (hedged) 0.87% 20,362,020.733 9.08 10.30 9.88N (acc) EUR 2.11% 13,621,145.353 22.61 24.15 22.24N (acc) EUR-H1 (hedged) 2.11% 28,791,377.905 18.10 19.42 17.62N (acc) HUF 2.11% 7,296,960.678 159.63 159.99 150.59N (acc) USD 2.11% 18,533,366.194 26.44 27.61 24.71N (Mdis) EUR-H1 (hedged) 2.11% 62,382,223.093 10.13 11.70 11.41N (Mdis) USD 2.11% 2,653,406.738 7.29 8.20 7.88N (Ydis) EUR-H1 (hedged) 2.11% 10,448,026.549 8.74 10.03 9.73S (acc) EUR-H1 (hedged) 0.74% 74,601.000 10.17 10.76 9.63S (acc) USD 0.74% 61,858.000 10.64 10.96 9.67S (Ydis) USD 0.74% 2,659,000.000 8.41 9.30 8.76W (acc) CHF-H1 (hedged) 0.97% 2,272,615.609 9.59 10.18 9.17W (acc) EUR 0.97% 1,687,959.810 12.04 12.71 11.57W (acc) EUR-H1 (hedged) 0.96% 8,464,203.324 11.53 12.22 10.97W (acc) GBP-H1 (hedged) 0.96% 168,920.821 10.10 10.61 9.43W (acc) PLN-H1 (hedged) 0.97% 3,999.888 94.70 98.43 -W (acc) USD 0.96% 9,578,518.134 12.08 12.47 11.04W (Mdis) EUR 0.96% 7,968,725.162 9.27 10.55 10.32W (Mdis) GBP 0.98% 805,333.673 10.46 11.80 10.96W (Mdis) GBP-H1 (hedged) 0.96% 1,338,632.579 7.64 8.67 8.28W (Mdis) USD 0.96% 11,552,812.536 7.76 8.64 8.21W (Ydis) CHF-H1 (hedged)* 0.88% 9,513.000 9.58 - -W (Ydis) EUR 0.95% 907,842.915 9.80 11.11 10.80W (Ydis) EUR-H1 (hedged)* 0.89% 366,561.165 9.51 - -X (acc) USD* 0.30% 8,945,999.662 9.60 - -X (Ydis) USD 0.30% 123,586.539 9.44 10.39 9.75Y (Mdis) USD 0.10% 1,737,303.395 9.71 10.71 10.09Z (acc) USD 1.11% 5,123,783.566 14.14 14.62 12.95Z (Mdis) GBP-H1 (hedged) 1.11% 467,361.583 8.80 10.00 9.54Z (Mdis) USD 1.11% 3,763,951.132 8.57 9.55 9.08Z (Ydis) EUR-H1 (hedged) 1.11% 1,150,406.919 8.93 10.15 9.74
Templeton Growth (Euro) Fund – EURA (acc) EUR 1.83% 385,197,417.446 17.45 17.39 14.69A (acc) USD 1.83% 14,208,100.440 20.41 19.88 16.32A (Ydis) EUR 1.83% 15,012,072.580 17.66 17.66 15.00A (Ydis) USD 1.83% 1,449,018.606 20.59 20.13 16.61B (Ydis) EUR 3.13% 8,298.522 11.68 11.80 10.10I (acc) EUR 0.97% 3,177,761.298 20.14 19.89 16.66I (Ydis) EUR 0.97% 229,681.722 16.69 16.69 14.18I (Ydis) USD 0.97% 326,927.265 19.61 19.17 15.83N (acc) EUR 2.58% 1,804,904.567 15.18 15.24 12.97W (acc) EUR 1.02% 3,205.374 9.89 9.78 -
FRANKLIN TEMPLETON INVESTMENT FUNDS
Statistical Information (continued)
www.franklintempleton.lu Audited Annual Report 65

TotalExpense Ratio
June 30,2018
(See Note 27)
SharesOutstanding
June 30,2018
Net Asset Value per Share
June 30,2018
June 30,2017
June 30,2016
Templeton Growth (Euro) Fund – EUR (continued)W (acc) USD 1.05% 30,454.133 10.90 10.54 -W (Ydis) EUR 1.05% 468.779 9.82 9.78 -
Templeton Korea Fund – USDΩ
A (acc) SGD - - - 6.20 5.33A (acc) USD - - - 5.23 4.60C (acc) USD - - - 8.76 7.74I (acc) USD - - - 10.56 9.19N (acc) USD - - - 13.87 12.26
Templeton Latin America Fund – USDA (acc) EUR 2.27% 2,811,843.675 7.29 7.82 7.19A (acc) SGD 2.27% 2,697,810.967 6.08 6.45 5.63A (acc) USD 2.27% 2,060,513.389 54.71 57.43 51.27A (Ydis) EUR 2.27% 256,090.327 41.63 45.05 41.67A (Ydis) GBP 2.27% 18,327.015 37.00 39.67 34.81A (Ydis) USD 2.27% 14,427,302.336 48.58 51.40 46.19B (acc) USD 3.57% 241,133.914 9.60 10.21 9.24C (acc) USD 2.85% 266,339.779 10.45 11.03 9.91I (acc) USD 1.30% 2,514,063.706 17.88 18.60 16.44I (Ydis) EUR-H2 (hedged) 1.30% 3,741,772.532 7.34 7.59 7.14N (acc) PLN-H1 (hedged) 2.77% 3,958,848.594 6.69 7.21 6.52N (acc) USD 2.77% 1,287,053.979 27.87 29.40 26.38W (acc) GBP 1.36% 89,107.178 9.04 9.53 8.24W (Ydis) USD 1.35% 375,573.282 7.15 7.56 6.79X (acc) USD 0.25% 500.000 8.71 8.96 7.84Z (acc) GBP 1.76% 12,479.845 8.88 9.40 8.15
Templeton Thailand Fund – USDA (acc) SGD 2.48% 620,280.551 21.29 19.34 15.63A (acc) USD 2.48% 5,019,447.325 27.78 24.97 20.64B (acc) USD 3.78% 20,243.498 25.73 23.43 19.62N (acc) USD 2.98% 446,944.354 34.20 30.89 25.66W (acc) USD 1.54% 157,274.612 14.60 13.00 10.65
* This Fund / share class was launched during the yearΩ This Fund / share class was closed during the year
FRANKLIN TEMPLETON INVESTMENT FUNDS
Statistical Information (continued)
66 Audited Annual Report www.franklintempleton.lu

Franklin Templeton Investment Funds (“FTIF” or the “Company”) is a collective investment undertaking pursuant to Part I of the amendedLuxembourg law of December 17, 2010 on undertakings for collective investment and qualifies as a société d’investissement à capital variable. TheCompany was incorporated in Luxembourg on November 6, 1990, for an undetermined period. At the date of this report, it offers shares in 82sub-funds of the Company (the “Funds”). The Board of Directors of the Company may authorise the creation of additional Funds in future withdifferent investment objectives.
The Company aims to provide investors with a choice of Funds investing in a wide range of transferable securities and other eligible assets on aworldwide basis and featuring a diverse array of investment objectives, including capital growth and income. The overall objective of the Companyis to seek to minimise investment exposure through diversification and to provide Shareholders with the benefit of a portfolio managed by FranklinTempleton Investments, according to its successful time-tested investment selection methods.
Changes to the Investment Manager structure of the CompanyWith effect from October 1, 2017, Franklin Advisers, Inc. and Franklin Templeton Investments Corp. have been appointed as co-investmentmanagers of Franklin NextStep Conservative Fund, Franklin NextStep Growth Fund and Franklin NextStep Moderate Fund.
With effect from February 28, 2018, Franklin Advisers Inc. and Franklin Templeton Investment Corp. have been appointed as sub-investmentmanagers with Franklin Templeton Investments (Asia) Limited as lead investment manager of Franklin NextStep Dynamic Growth Fund, FranklinNextStep Stable Growth Fund and Franklin NextStep Balanced Growth Fund.
With effect from March 5, 2018, the management structure of Templeton Global (Euro) Fund (to be renamed Templeton Global Climate ChangeFund) has changed from a sole investment management structure with Franklin Templeton Investment Management Limited to a lead managementstructure where Franklin Templeton Investment Management Limited has appointed Franklin Templeton Investments Corp. as sub-investmentmanager.
With effect from March 31, 2018:➤ Franklin Templeton Investment (ME) Limited has been appointed as sole investment manager of Templeton Africa Fund.➤ Franklin Templeton Investments (Asia) Limited has been appointed as sole investment manager of Templeton Eastern Europe Fund.➤ Franklin Templeton Investments (Asia) Limited has been appointed as lead investment manager and has in turn appointed Franklin Templeton
Investments (ME) Limited as sub-investment manager of Templeton Frontier Markets Fund.➤ Franklin Advisers, Inc. has been appointed as lead investment manager and has in turn appointed Templeton Asset Management Ltd. as sub-
investment manager of Templeton Emerging Markets Balanced Fund.➤ Franklin Templeton Investments (Asia) Limited has been appointed as lead investment manager and has in turn appointed Templeton Asset
Management Ltd. as sub-investment manager of Templeton BRIC Fund and Templeton Emerging Markets Fund.With effect from June 4, 2018:➤ Franklin Templeton Investments Australia Limited has been appointed as sole investment manager of Templeton Global Equity Income Fund.➤ Franklin Advisers, Inc. and Franklin Templeton Investments Australia Limited have been appointed as co-investment managers of Templeton
Global Balanced Fund.
Fund closuresThe Templeton Asian Dividend Fund closed on October 25, 2017.
The following Funds closed on December 12, 2017:➤ Franklin European Fund➤ Franklin Real Return Fund➤ Templeton ASEAN FundThe Templeton Korea Fund closed on May 25, 2018.
As at June 30, 2018, the liquidations of the following Funds were not completed. There were remaining amounts of cash at bank that will be usedto cover outstanding liabilities.
Fund Currency Cash at bank
Franklin European Fund EUR (50)Franklin Real Return Fund USD 2,546Templeton ASEAN Fund USD 1,075Templeton Korea Fund USD 14,299
As of October 12, 2018, the above cash balances are still open. The cash accounts will be closed as soon as all invoices are paid.
Fund launchesThe Templeton Emerging Markets Local Currency Bond Fund launched on February 20, 2018.
Fund name changesThe Franklin Mutual Beacon Fund is renamed Franklin Mutual U.S. Value Fund from January 31, 2018.
The Templeton Global (Euro) Fund is renamed Templeton Global Climate Change Fund from March 5, 2018.
Fund mergersOn October 20, 2017, Franklin Global High Income Bond Fund was merged into Franklin High Yield Fund. The conversions of Shares were basedon the following ratios:➤ For 1 Franklin Global High Income Bond Fund Class A (acc) EUR, the Shareholder received 1.29934990 Shares of Franklin High Yield Fund
Class A (acc) EUR;➤ For 1 Franklin Global High Income Bond Fund Class A (acc) USD, the Shareholder received 0.69153200 Shares of Franklin High Yield Fund
Class A (acc) USD;➤ For 1 Franklin Global High Income Bond Fund Class A (Mdis) HKD, the Shareholder received 0.19122592 Shares of Franklin High Yield
Fund Class A (Mdis) USD;➤ For 1 Franklin Global High Income Bond Fund Class A (Mdis) SGD-H1, the Shareholder received 1.17783834 Shares of Franklin High Yield
Fund Class A (Mdis) SGD-H1;➤ For 1 Franklin Global High Income Bond Fund Class A (Mdis) USD, the Shareholder received 1.48730666 Shares of Franklin High Yield
Fund Class A (Mdis) USD;➤ For 1 Franklin Global High Income Bond Fund Class I (acc) EUR, the Shareholder received 1.04593765 Shares of Franklin High Yield Fund
Class I (acc) EUR-H1;
FRANKLIN TEMPLETON INVESTMENT FUNDS
Notes to the Financial StatementsAt June 30, 2018
Note 1 — The Company
www.franklintempleton.lu Audited Annual Report 67

Fund mergers (continued)➤ For 1 Franklin Global High Income Bond Fund Class I (acc) USD, the Shareholder received 0.68349077 Shares of Franklin High Yield Fund
Class I (acc) USD;➤ For 1 Franklin Global High Income Bond Fund Class N (acc) EUR, the Shareholder received 1.25959530 Shares of Franklin High Yield Fund
Class N (acc) EUR;➤ For 1 Franklin Global High Income Bond Fund Class N (Mdis) USD, the Shareholder received 0.97359681 Shares of Franklin High Yield
Fund Class N (Mdis) USD;➤ For 1 Franklin Global High Income Bond Fund Class Y (Mdis) USD, the Shareholder received 1.16763906 Shares of Franklin High Yield
Fund Class Y (Mdis) USD.On November 3, 2017, Franklin U.S. Small-Mid Cap Growth Fund was merged into Franklin U.S. Opportunities Fund. The conversions of Shareswere based on the following ratios:➤ For 1 Franklin U.S. Small-Mid Cap Growth Fund Class A (acc) USD, the Shareholder received 1.50611738 Shares of Franklin U.S. Opportu-
nities Fund Class A (acc) USD;➤ For 1 Franklin U.S. Small-Mid Cap Growth Fund Class B (acc) USD, the Shareholder received 2.51668270 Shares of Franklin U.S. Opportu-
nities Fund Class B (acc) USD;➤ For 1 Franklin U.S. Small-Mid Cap Growth Fund Class C (acc) USD, the Shareholder received 0.85917709 Shares of Franklin U.S. Opportu-
nities Fund Class C (acc) USD;➤ For 1 Franklin U.S. Small-Mid Cap Growth Fund Class I (acc) USD, the Shareholder received 0.59321388 Shares of Franklin U.S. Opportu-
nities Fund Class I (acc) USD;➤ For 1 Franklin U.S. Small-Mid Cap Growth Fund Class N (acc) USD, the Shareholder received 0.65827499 Shares of Franklin U.S. Oppor-
tunities Fund Class N (acc) USD.On January 19, 2018, Franklin Global Equity Strategies Fund was merged into Franklin World Perspectives Fund. The conversions of Shares werebased on the following ratios:➤ For 1 Franklin Global Equity Strategies Fund Class A (acc) EUR, the Shareholder received 0.41636410 Shares of Franklin World Perspectives
Fund Class A (acc) EUR;➤ For 1 Franklin Global Equity Strategies Fund Class A (acc) EUR-H1, the Shareholder received 0.29342338 Shares of Franklin World Perspec-
tives Fund Class A (acc) EUR;➤ For 1 Franklin Global Equity Strategies Fund Class A (acc) USD, the Shareholder received 0.56803551 Shares of Franklin World Perspectives
Fund Class A (acc) USD;➤ For 1 Franklin Global Equity Strategies Fund Class A (Ydis) EUR, the Shareholder received 0.41230170 Shares of Franklin World Perspec-
tives Fund Class A (acc) EUR;➤ For 1 Franklin Global Equity Strategies Fund Class N (acc) EUR, the Shareholder received 1.03427572 Shares of Franklin World Perspectives
Fund Class N (acc) EUR.On January 19, 2018, Franklin Global Growth Fund was merged into Franklin World Perspectives Fund. The conversions of Shares were basedon the following ratios:➤ For 1 Franklin Global Growth Fund Class A (acc) EUR, the Shareholder received 0.73285266 Shares of Franklin World Perspectives Fund
Class A (acc) EUR;➤ For 1 Franklin Global Growth Fund Class A (acc) USD, the Shareholder received 0.78666557 Shares of Franklin World Perspectives Fund
Class A (acc) USD;➤ For 1 Franklin Global Growth Fund Class I (acc) USD, the Shareholder received 0.64664600 Shares of Franklin World Perspectives Fund
Class I (acc) USD;➤ For 1 Franklin Global Growth Fund Class N (acc) EUR, the Shareholder received 1.85663035 Shares of Franklin World Perspectives Fund
Class N (acc) EUR;➤ For 1 Franklin Global Growth Fund Class N (acc) USD, the Shareholder received 0.74113166 Shares of Franklin World Perspectives Fund
Class N (acc) USD;➤ For 1 Franklin Global Growth Fund Class Z (acc) USD, the Shareholder received 1.37451458 Shares of Franklin World Perspectives Fund
Class Z (acc) USD.
Note 2 — Significant accounting policies
(a) GeneralThe financial statements are prepared in accordance with the regulations of the Grand Duchy of Luxembourg relating to investment funds.
(b) Investment in securitiesSecurities which are listed on a stock exchange or traded on any other organised market are valued at the last available price on such exchange ormarket which is normally the principal market for each security, and those securities dealt in on an over-the-counter market are valued in a manneras near as possible to that for quoted securities.
Securities not listed on any stock exchange nor traded on any organised market are valued at the last available price, or if such price is notrepresentative of their fair value, they are valued prudently and in good faith on the basis of their reasonably foreseeable sales prices.
The Company has procedures to determine the fair value of individual securities and other assets for which market prices are not readily availableor which may not be reliably priced. In such circumstances, the price of such investment shall be adjusted in accordance with the proceduresadopted, as determined by or under the direction of the Board of Directors.
During the accounting year under review, gains and losses on investment securities sold were computed on the average cost basis for all Funds withthe exception of the Franklin High Yield Fund, the Franklin Income Fund, the Franklin U.S. Government Fund, the Templeton Asian Bond Fundand the Templeton BRIC Fund which were computed on the first-in, first-out basis.
During the accounting year under review, discounts and premiums were amortised to income over the period to maturity.
For mortgage-backed and other similar holdings with scheduled debt paydowns, the Funds record accruals, based on their historical experience,for anticipated paydowns. Such accruals are recorded as a reduction or increase to the related holdings as disclosed on the Schedule of Investmentsand are included in the related unrealised appreciation/depreciation on investments shown on the “Statement of Operations and Changes in NetAssets”.
Money market instruments are valued at market value with the exception of Franklin Euro Short-Term Money Market Fund, where all securitiesare valued at amortised cost. Under this method, the cost of investments is adjusted to income for the amortisation of premiums and accretion of
FRANKLIN TEMPLETON INVESTMENT FUNDS
Notes to the Financial StatementsAt June 30, 2018 (continued)
Note 1 — The Company (continued)
68 Audited Annual Report www.franklintempleton.lu

(b) Investment in securities (continued)discounts over the life of the investments. Where the amortised cost basis does not reflect a prudent approach to the valuation of the security, thelatest available price prevailing on the valuation day is used.
(c) Forward foreign exchange contractsForward foreign exchange contracts are valued at the forward rate applicable at the “Statement of Net Assets” date for the remaining period, untilmaturity. Gains or losses resulting from forward foreign exchange contracts are recognised in the “Statement of Operations and Changes in NetAssets”.
(d) Financial future contractsThe Company may enter into financial future contracts to gain exposure to market changes. A financial future contract is an agreement betweentwo parties to buy or sell a security for a set price on a future date. Required initial margin deposits of cash or securities are maintained by a brokerin a segregated account. Subsequent payments, known as variation margin, are made or received by the Company depending on the fluctuationsin the value of the underlying securities. Such variation margin is accounted for as unrealised gains or losses until the contract is closed, at whichtime the gains or losses are reclassified to realised gains or losses. Realised and unrealised gains and losses are included in the “Statement ofOperations and Changes in Net Assets”.
(e) Interest rate swap contractsInterest rate swap contracts are used to hedge the risk of changes in interest rates and are agreements between two parties to exchange cash flowsbased on a notional principal amount. The net interest received or paid on interest rate swap contract agreements is accrued daily as interestincome/expense.
Interest rate swap contracts are marked to market daily based upon quotations from the market makers and the change, if any, is recorded as anunrealised gain or loss in the “Statement of Operations and Changes in Net Assets”. When the swap contract is terminated early, the Fund recordsa realised gain or loss equal to the difference between the current net present value and the executed net present value. Any outstanding interestaccrual is recorded as either a net receivable or net payable.
The risks of interest rate swap contracts include changes in market conditions and the possible inability of the counterparty to fulfill its obligationsunder the agreement.
(f) Inflation swap contractsAn inflation swap contract is a bilateral agreement used to transfer inflation risk from one party to another through an exchange of cash flows.
Inflation swap contracts are marked to market daily based upon quotations from the market makers and the change, if any, is recorded as anunrealised gain or loss in the “Statement of Operations and Changes in Net Assets”. When the swap contract is terminated early, the Fund recordsa realised gain or loss equal to the difference between the current net present value and the executed net present value. Any outstanding interestaccrual is recorded as either a net receivable or net payable.
The risks of inflation swap contracts include changes in market conditions and the possible inability of the counterparty to fulfill its obligationsunder the agreement.
(g) Cross currency swap contractsA cross currency swap is an agreement between two parties to exchange interest payments and principals denominated in two different currencies.Cross currency swap contracts are marked to market daily based upon quotations from the market makers and the change in value, if any, isrecorded as an unrealised gain or loss in the “Statement of Operations and Changes in Net Assets”.
When the swap contract is terminated early, the Fund records a realised gain or loss equal to the difference between the current net present valueand the executed net present value. Any outstanding interest accrual is recorded as either a net receivable or net payable.
The risks of cross currency swap contracts include changes in market conditions and the possible inability of the counterparty to fulfill itsobligations under the agreement.
(h) Total return swap contractsA total return swap is an agreement in which one party makes payments based on a set rate, either fixed or variable, while the other party makespayments based on the return of an underlying asset, which includes both the income it generates and any capital gains.
Total return swap contracts are marked to market daily based upon quotations from the market makers and the change in value, if any, is recordedas an unrealised gain or loss in the “Statement of Operations and Changes in Net Assets”.
When the swap contract is terminated early, the Fund records a realised gain or loss equal to the difference between the current net present valueand the executed net present value. Any outstanding interest accrual is recorded as either a net receivable or net payable.
The risks of total return swap contracts include changes in market conditions and the possible inability of the counterparty to fulfill its obligationsunder the agreement.
(i) Volatility swap contractsA volatility swap is a bilateral agreement in which each party agrees to exchange cash flows based on the measured volatility of a specifiedunderlying asset.
Volatility swap contracts are marked to market daily based upon quotations from the market makers and the change in value, if any, is recordedas an unrealised gain or loss in the “Statement of Operations and Changes in Net Assets”.
When the swap contract is terminated early, the Fund records a realised gain or loss equal to the difference between the current net present valueand the executed net present value. Any outstanding interest accrual is recorded as either a net receivable or net payable.
The risks of volatility swap contracts include changes in market conditions and the possible inability of the counterparty to fulfill its obligationsunder the agreement.
FRANKLIN TEMPLETON INVESTMENT FUNDS
Notes to the Financial StatementsAt June 30, 2018 (continued)
Note 2 — Significant accounting policies (continued)
www.franklintempleton.lu Audited Annual Report 69

(j) Credit default swap contractsA credit default swap contract is a credit derivative transaction in which two parties enter into an agreement, whereby one party pays the other afixed periodic payment for the specified life of the agreement. The other party makes no payments unless a credit event, relating to a predeterminedreference asset, occurs. If such an event occurs, the party will then make a payment to the first party, and the swap will terminate. The value of theunderlying securities shall be taken into account for the calculation of the investment and borrowing powers applicable to individual users.
Credit default swap contracts are marked to market daily based upon quotations from the market makers and the change in value, if any, isrecorded as an unrealised gain or loss in the “Statement of Operations and Changes in Net Assets”. Any payment received or paid to initiate acontract is recorded as a liability or asset in the “Statement of Net Assets”. When the swap contract is terminated early, the Fund records a realisedgain or loss for any payments received or paid.
The risks of credit default swap contracts include unfavourable changes in interest rates, an illiquid secondary market and the possible inability ofthe counterparty to fulfill its obligations under the agreement, which may be in excess of the amount reflected in the “Statement of Net Assets”.
(k) Option contractsOptions are contracts entitling the holder to purchase or sell a specified number of shares or units of a particular security at a specified price at anytime until the contract-stated expiration date. Options purchased are recorded as investments; options written (sold) are recorded as liabilities.When the exercise of an option results in a cash settlement, the difference between the premium (original option value) and the settlement proceedsis accounted for as a realised gain or loss. When securities are acquired or delivered upon exercise of an option, the acquisition cost or sale proceedsare adjusted by the amount of the premium. When an option is closed, the difference between the premium and the cost to close the position isaccounted for as a realised gain or loss. When an option expires, the premium is accounted for as a realised gain for options written or as a realisedloss for options purchased.
The risks include price movements in the underlying securities, the possibility there may be an illiquid options market, or the inability of thecounterparties to fulfill their obligations under the contract.
The Company writes options on securities, futures and interest rate swaps (“swaptions”). These options are settled in cash and subject the Companyto unlimited risk of loss. The Company, however, is not subject to credit risk on written options as the counterparty has already performed itsobligation by paying the premium at the inception of the contract.
The market values are recorded under “Option Contracts at Market Value” in the “Statement of Net Assets”.
(l) Foreign exchange transactionsTransactions expressed in currencies other than each Fund’s currency are translated into each Fund’s currency at the exchange rates applicable onthe transaction dates.
Assets and liabilities designated in currencies other than each Fund’s currency are translated into each Fund’s currency at the appropriate exchangerates ruling at the period-end. Gains and losses on foreign exchange transactions are recognised in the “Statement of Operations and Changes inNet Assets” in determining the results for the accounting year.
The reference currency of the Company as reflected in the financial statements is U.S. dollar. The principal exchange rates applied as atJune 30, 2018, are as follows:
AUD 1.3510775CAD 1.3142000CHF 0.9904000
CNH 6.6350000CZK 22.2315000EUR 0.8559079
GBP 0.7572316HKD 7.8460500HUF 281.7000000
JPY 110.6950000NOK 8.1450000PLN 3.7433500
SEK 8.9521000SGD 1.3624500ZAR 13.7113000
The list of the currency abbreviations is available in note 30.
(m) Mortgage dollar rollsIn a mortgage dollar roll, a Fund sells mortgage-backed securities for delivery in the current month and simultaneously contracts to repurchasesubstantially similar (name, type, coupon, and maturity) securities on a specified future date. During the period between the sale and repurchase,the Fund foregoes principal and interest paid on the mortgage-backed securities. The Fund is compensated by the difference between the currentsales price and the lower forward price for the future purchase, as well as by the interest earned on the cash proceeds of the initial sale.
Mortgage dollar rolls are marked to market daily based upon quotations from the market makers and the change in value, if any, is recorded as anunrealised gain or loss in the “Statement of Operations and Changes in Net Assets”.
The difference between the current sales price and the lower forward price is treated as realised gain.
The market values are recorded under “Investment in mortgage dollar rolls at market value” or under “Open Short Positions on mortgage dollarrolls” in the “Statement of Net Assets”.
(n) IncomeDividends are credited to income on their ex-dividend date. Interest income is accrued on a daily basis and includes the amortisation of premiumsand accretion of discounts, where applicable.
(o) Securities lendingUnless otherwise provided in the relevant Fund’s investment policy, a Fund may utilise up to 50% of its assets for securities lending transactions.The volume of the securities lending transactions of each Fund shall be kept at an appropriate level or each Fund shall be entitled to request thereturn of the securities lent in a manner that enables it, at all times, to meet its redemption obligations and that these transactions do not jeopardisethe management of each Fund’s assets in accordance with its investment policy. The counterparties to securities lending transactions must have aminimum credit rating of A- or better, as rated by Standard & Poor’s, Moody’s or Fitch, at the time of the transactions. Loans will be securedcontinuously by collateral which must at least equal the value of the securities lent. Securities lending income is disclosed under the caption“Securities lending” in the “Statement of Operations and Changes in Net Assets”. Any transaction expenses in connection with the loans arecharged to the concerned Fund.
(p) Formation expensesFormation expenses associated with the launch of the new Funds are expensed as incurred.
FRANKLIN TEMPLETON INVESTMENT FUNDS
Notes to the Financial StatementsAt June 30, 2018 (continued)
Note 2 — Significant accounting policies (continued)
70 Audited Annual Report www.franklintempleton.lu

(q) Swing pricingA Fund may suffer dilution of the net asset value per share due to investors buying or selling shares in a Fund at a price that does not reflect dealingand other costs that arise when security trades are undertaken by the Investment Manager to accommodate cash inflows or outflows.
In order to counter this impact, a swing pricing mechanism may be adopted to protect the interests of Shareholders of the Fund. If on any valuationdate, the aggregate net capital activity of a Fund exceeds a pre-determined threshold, as determined and reviewed for each Fund on a periodic basis,the net asset value per share will be adjusted upwards or downwards to reflect net capital inflows or net capital outflows respectively.
The net capital inflows and net capital outflows will be determined based on the latest available information at the time of calculation of the netasset value per share. The swing pricing mechanism may be applied across all Funds. The extent of the price adjustment is set to reflect dealing andother costs. Such adjustment may vary from Fund to Fund and will not exceed 2% of the original net asset value per share.
In the case of a swing pricing event on the last day of the annual/semi-annual period, the net assets as disclosed in the “Statement of Net Assets”,exclude the swing pricing adjustment, however, the net asset value per share as at year/semi-annual period end, as disclosed in the StatisticalInformation, would include the swing pricing adjustment.
There was no swing pricing adjustment affecting the Funds’ net asset value per share on the last day of the year.
Note 3 — Cross Funds investmentsSome Funds may invest into units of UCITS and other open and closed end UCIs which may include other Funds of Franklin Templeton InvestmentFunds. As at June 30, 2018, the following Funds held shares issued by another Fund of the Company.
Currency
Investment in securitiesat market value as
per Statement of Net AssetsMarket value of
Cross Funds investments
Investment in securitiesat market value after deduction
of Cross Funds investments
Franklin Diversified Balanced Fund EUR 240,757,574 13,601,568 227,156,006Franklin Diversified Conservative Fund EUR 292,401,601 10,139,546 282,262,055Franklin Diversified Dynamic Fund EUR 119,526,304 4,728,652 114,797,652Franklin European Income Fund EUR 20,056,558 548,880 19,507,678Franklin Global Multi-Asset Income Fund EUR 291,193,578 6,316,628 284,876,950Franklin NextStep Balanced Growth Fund USD 252,129,245 71,700,599 180,428,646Franklin NextStep Conservative Fund USD 37,011,804 11,639,712 25,372,092Franklin NextStep Dynamic Growth Fund USD 59,966,928 14,060,445 45,906,483Franklin NextStep Growth Fund USD 25,094,927 7,008,970 18,085,957Franklin NextStep Moderate Fund USD 75,338,911 22,424,716 52,914,195Franklin NextStep Stable Growth Fund USD 21,491,167 8,248,378 13,242,789
The total combined net assets at year-end without Cross Funds investments would amount to USD 101,806,242,292.
Note 4 — Time deposits (“TDs”)As at June 30, 2018, the Company had the following cash on time deposits:
FundCounterparty
Value of TDsin Fund currency
Franklin GCC Bond FundRoyal Bank of Canada USD 1,100,000Franklin Global Listed Infrastructure FundRoyal Bank of Canada USD 480,000Franklin Global Real Estate FundRoyal Bank of Canada USD 1,400,000Franklin Global Small-Mid Cap Growth FundRoyal Bank of Canada USD 150,000Franklin India FundNational Australia Bank USD 10,000,000National Bank of Canada USD 30,000,000Royal Bank of Canada USD 23,800,000
63,800,000Franklin K2 Alternative Strategies FundBank of Montreal USD 193,148,400National Australia Bank USD 193,148,400Royal Bank of Canada USD 193,148,400
579,445,200Franklin K2 Global Macro Opportunities FundBank of Montreal USD 3,705,600BNP Paribas USD 3,705,600National Australia Bank USD 3,705,600Royal Bank of Canada USD 3,705,600
14,822,400
FundCounterparty
Value of TDsin Fund currency
Franklin K2 Long Short Credit FundBank of Montreal USD 6,654,200National Australia Bank USD 6,654,200Royal Bank of Canada USD 6,654,200
19,962,600Franklin NextStep Balanced Growth FundRoyal Bank of Canada USD 6,000,000Franklin NextStep Conservative FundRoyal Bank of Canada USD 1,100,000Franklin NextStep Dynamic Growth FundRoyal Bank of Canada USD 960,000Franklin NextStep Growth FundRoyal Bank of Canada USD 390,000Franklin NextStep Moderate FundRoyal Bank of Canada USD 1,100,000Franklin NextStep Stable Growth FundRoyal Bank of Canada USD 640,000Franklin World Perspectives FundRoyal Bank of Canada USD 12,200,000Templeton Africa FundRoyal Bank of Canada USD 12,000,000Templeton Asian Growth FundBank of Montreal USD 12,000,000Royal Bank of Canada USD 22,400,000
34,400,000
FRANKLIN TEMPLETON INVESTMENT FUNDS
Notes to the Financial StatementsAt June 30, 2018 (continued)
Note 2 — Significant accounting policies (continued)
www.franklintempleton.lu Audited Annual Report 71

FundCounterparty
Value of TDsin Fund currency
Templeton Asian Smaller Companies FundNational Australia Bank USD 11,000,000National Bank of Canada USD 45,000,000Royal Bank of Canada USD 20,300,000
76,300,000Templeton BRIC FundRoyal Bank of Canada USD 1,900,000Templeton China FundRoyal Bank of Canada USD 9,900,000Templeton Frontier Markets FundNational Australia Bank USD 3,000,000Royal Bank of Canada USD 7,800,000
10,800,000Templeton Global FundRoyal Bank of Canada USD 22,900,000
FundCounterparty
Value of TDsin Fund currency
Templeton Global Equity Income FundRoyal Bank of Canada USD 1,700,000Templeton Global Smaller Companies FundRoyal Bank of Canada USD 5,700,000Templeton Growth (Euro) FundCredit Agricole CIB London EUR 93,504,984Royal Bank of Canada EUR 78,945,092
172,450,076Templeton Latin America FundNational Australia Bank USD 9,000,000Royal Bank of Canada USD 16,000,000
25,000,000Templeton Thailand FundRoyal Bank of Canada USD 8,200,000
Note 5 — Forward foreign exchange contractsAs at June 30, 2018, the Company had entered into the following outstanding contracts:
Franklin Asia Credit Fund
Purchases Sales MaturityDate
Unrealisedprofit/(loss)
USD
Forward foreign exchange contracts used for share class hedging:AUD 2,173,777 USD 1,649,850 16-Jul-18 (40,829)SGD 2,387,897 USD 1,788,616 16-Jul-18 (35,387)USD 37,088 SGD 50,368 16-Jul-18 107
(76,109)
The above contracts were opened with the following counterparties:
BNP Paribas (1,579)Citigroup (948)HSBC Bank (67,405)JPMorgan (769)Morgan Stanley (3,662)Toronto–Dominion Bank (1,746)
(76,109)
Franklin Biotechnology Discovery Fund
Purchases Sales MaturityDate
Unrealisedprofit/(loss)
USD
Forward foreign exchange contracts used for share class hedging:CHF 2,320,752 USD 2,371,723 10-Jul-18 (26,249)EUR 11,669,276 USD 13,828,135 10-Jul-18 (183,137)USD 168,217 CHF 166,436 10-Jul-18 8USD 809,166 EUR 695,607 10-Jul-18 (4,216)
(213,594)
The above contracts were opened with the following counterparties:
Bank of America (27,776)Barclays Bank (20,160)BNP Paribas (6,066)Citigroup (24,246)Credit Suisse International (2,945)Deutsche Bank (25,417)Goldman Sachs (20,384)HSBC Bank (18,335)JPMorgan (24,736)Morgan Stanley (25,664)The Bank of New York Mellon (6,668)Toronto–Dominion Bank (41)UBS (11,156)
(213,594)
FRANKLIN TEMPLETON INVESTMENT FUNDS
Notes to the Financial StatementsAt June 30, 2018 (continued)
Note 4 — Time deposits (“TDs”) (continued)
72 Audited Annual Report www.franklintempleton.lu

As at June 30, 2018, the Company had entered into the following outstanding contracts:
Franklin Brazil Opportunities Fund
Purchases Sales MaturityDate
Unrealisedprofit/(loss)
USD
Forward foreign exchange contracts used for share class hedging:EUR 4,200,334 USD 4,885,603 20-Jul-18 29,557USD 526,121 EUR 450,249 20-Jul-18 (753)
28,804
The above contracts were opened with the following counterparties:
Bank of America 2,837Barclays Bank 327BNP Paribas 2,790Citigroup 3,929Credit Suisse International 3,304Goldman Sachs 1,985HSBC Bank 3,621JPMorgan 3,513Morgan Stanley 3,195The Bank of New York Mellon 278UBS 3,025
28,804
Franklin Diversified Balanced Fund
Purchases Sales MaturityDate
Unrealisedprofit/(loss)
EUR
Forward foreign exchange contracts used for share class hedging:CZK 9,722,667 EUR 376,663 20-Jul-18 (2,556)EUR 41,008 CZK 1,065,263 20-Jul-18 20SGD 142,380 EUR 90,677 20-Jul-18 (1,335)USD 104,102 EUR 89,511 20-Jul-18 (548)
(4,419)
Forward foreign exchange contracts used for efficient portfolio management:AUD 510,000 EUR 317,443 17-Jul-18 5,230CAD 1,000,000 EUR 633,378 17-Jul-18 17,230CHF 230,000 EUR 195,538 17-Jul-18 3,271EUR 650,000 USD 803,627 17-Jul-18 (36,907)MXN 7,000,000 EUR 304,929 17-Jul-18 (4,456)SEK 6,600,000 EUR 641,240 17-Jul-18 (10,199)EUR 3,906,038 AUD 6,110,000 24-Aug-18 51,309EUR 7,721,037 NZD 13,200,000 24-Aug-18 95,943EUR 91,581,434 USD 108,907,000 24-Aug-18 (1,231,775)USD 74,004,000 EUR 62,827,164 24-Aug-18 240,854EUR 11,239,490 USD 13,255,000 27-Aug-18 (54,048)USD 9,933,000 EUR 8,515,623 27-Aug-18 (52,499)EUR 6,672,486 GBP 5,871,000 31-Aug-18 49,452EUR 9,782,746 JPY 1,283,409,000 31-Aug-18 (136,734)EUR 3,835,583 KRW 4,890,724,000 31-Aug-18 93,294EUR 49,630,320 USD 58,575,000 31-Aug-18 (261,352)GBP 410,000 EUR 466,775 31-Aug-18 (4,257)JPY 715,419,000 CAD 8,264,138 31-Aug-18 167,371JPY 1,283,409,000 EUR 10,042,418 31-Aug-18 (122,939)KRW 259,105,000 EUR 202,488 31-Aug-18 (4,225)USD 58,575,000 EUR 50,186,078 31-Aug-18 (294,406)
(1,489,843)
(1,494,262)
The above contracts were opened with the following counterparties:
Bank of America (504)Barclays Bank 6,956BNP Paribas (136)Citigroup (442,480)Goldman Sachs (1,533)JPMorgan (1,055,366)Morgan Stanley (903)The Bank of New York Mellon (159)UBS (137)
(1,494,262)
FRANKLIN TEMPLETON INVESTMENT FUNDS
Notes to the Financial StatementsAt June 30, 2018 (continued)
Note 5 — Forward foreign exchange contracts (continued)
www.franklintempleton.lu Audited Annual Report 73

As at June 30, 2018, the Company had entered into the following outstanding contracts:
Franklin Diversified Conservative Fund
Purchases Sales MaturityDate
Unrealisedprofit/(loss)
EUR
Forward foreign exchange contracts used for share class hedging:CZK 7,043,646 EUR 272,587 20-Jul-18 (1,566)EUR 1,992 SGD 3,175 20-Jul-18 (1)SGD 139,760 EUR 89,012 20-Jul-18 (1,314)USD 4,724,538 EUR 4,062,057 20-Jul-18 (24,626)
(27,507)
Forward foreign exchange contracts used for efficient portfolio management:AUD 970,000 EUR 603,764 17-Jul-18 9,946CAD 2,150,000 EUR 1,364,710 17-Jul-18 34,099CHF 470,000 EUR 399,579 17-Jul-18 6,683EUR 230,000 GBP 200,838 17-Jul-18 3,104EUR 1,500,000 USD 1,854,525 17-Jul-18 (85,169)MXN 12,400,000 EUR 540,160 17-Jul-18 (7,893)SEK 13,300,000 EUR 1,291,102 17-Jul-18 (19,456)EUR 8,419,397 AUD 13,170,000 24-Aug-18 110,595EUR 16,752,310 NZD 28,640,000 24-Aug-18 208,166EUR 92,329,479 USD 109,802,000 24-Aug-18 (1,246,470)USD 48,135,000 EUR 40,937,800 24-Aug-18 84,024EUR 17,840,729 USD 21,040,000 27-Aug-18 (85,791)USD 15,768,000 EUR 13,517,999 27-Aug-18 (83,333)EUR 2,229,844 GBP 1,962,000 31-Aug-18 16,526EUR 3,253,072 JPY 426,774,000 31-Aug-18 (45,468)EUR 1,292,098 KRW 1,647,562,000 31-Aug-18 31,415EUR 16,468,886 USD 19,437,000 31-Aug-18 (86,716)GBP 136,000 EUR 154,838 31-Aug-18 (1,417)JPY 978,233,000 CAD 11,300,025 31-Aug-18 228,855JPY 426,774,000 EUR 3,339,421 31-Aug-18 (40,881)KRW 86,127,000 EUR 67,303 31-Aug-18 (1,400)USD 19,437,000 EUR 16,653,289 31-Aug-18 (97,686)
(1,068,267)
(1,095,774)
The above contracts were opened with the following counterparties:
Bank of America (5,916)Barclays Bank 17,747Citigroup (599,214)Goldman Sachs (6,345)HSBC Bank (1,408)JPMorgan (498,775)Morgan Stanley (577)UBS (1,286)
(1,095,774)
Franklin Diversified Dynamic Fund
Purchases Sales MaturityDate
Unrealisedprofit/(loss)
EUR
Forward foreign exchange contracts used for share class hedging:CZK 16,420,094 EUR 639,616 10-Jul-18 (7,633)EUR 54,798 CZK 1,412,313 10-Jul-18 441EUR 1,999 SEK 20,675 10-Jul-18 22NOK 1,766,485 EUR 185,615 10-Jul-18 (55)SEK 924,341 EUR 90,149 10-Jul-18 (1,774)SGD 151,191 EUR 95,787 10-Jul-18 (865)USD 104,855 EUR 88,407 10-Jul-18 1,266
(8,598)
Forward foreign exchange contracts used for efficient portfolio management:EUR 476,268 AUD 745,000 24-Aug-18 6,256EUR 2,094,039 NZD 3,580,000 24-Aug-18 26,021EUR 6,320,984 USD 7,519,000 24-Aug-18 (86,892)USD 3,183,000 EUR 2,739,714 24-Aug-18 (27,084)EUR 36,567,669 USD 43,493,000 27-Aug-18 (489,277)USD 42,201,000 EUR 35,820,246 27-Aug-18 135,889EUR 4,556,293 GBP 4,009,000 31-Aug-18 33,768EUR 6,668,777 JPY 874,884,000 31-Aug-18 (93,210)EUR 2,615,880 KRW 3,335,489,000 31-Aug-18 63,627EUR 33,879,952 USD 39,986,000 31-Aug-18 (178,407)GBP 280,000 EUR 318,882 31-Aug-18 (3,015)JPY 281,906,000 CAD 3,256,427 31-Aug-18 65,951JPY 874,884,000 EUR 6,845,792 31-Aug-18 (83,806)
FRANKLIN TEMPLETON INVESTMENT FUNDS
Notes to the Financial StatementsAt June 30, 2018 (continued)
Note 5 — Forward foreign exchange contracts (continued)
74 Audited Annual Report www.franklintempleton.lu

As at June 30, 2018, the Company had entered into the following outstanding contracts:
Franklin Diversified Dynamic Fund (continued)Purchases Sales Maturity
DateUnrealisedprofit/(loss)
EUR
KRW 176,699,000 EUR 138,088 31-Aug-18 (2,881)USD 39,986,000 EUR 34,259,329 31-Aug-18 (200,969)
(834,029)
(842,627)
The above contracts were opened with the following counterparties:
Bank of America (2,195)Barclays Bank (148)BNP Paribas (660)Citigroup (116,861)Deutsche Bank (729)Goldman Sachs (313)HSBC Bank (93)JPMorgan (605,015)Morgan Stanley (2,183)Toronto–Dominion Bank (107)UBS (114,323)
(842,627)
Franklin Euro High Yield Fund
Purchases Sales MaturityDate
Unrealisedprofit/(loss)
EUR
Forward foreign exchange contracts used for share class hedging:EUR 417,894 USD 483,532 20-Jul-18 4,683USD 19,154,345 EUR 16,467,801 20-Jul-18 (99,145)
(94,462)
Forward foreign exchange contracts used for efficient portfolio management:EUR 57,353,412 GBP 50,100,000 17-Jul-18 753,159GBP 3,000,000 EUR 3,428,858 17-Jul-18 (39,621)EUR 26,086,458 USD 30,500,000 14-Sep-18 135,727USD 2,000,000 EUR 1,701,786 14-Sep-18 (98)
849,167
754,705
The above contracts were opened with the following counterparties:
Bank of America (12,880)BNP Paribas (9,564)Citigroup (13,010)Deutsche Bank 135,629Goldman Sachs (13,062)HSBC Bank (12,609)JPMorgan (12,216)Morgan Stanley 703,021UBS (10,604)
754,705
Franklin Euro Short Duration Bond Fund
Purchases Sales MaturityDate
Unrealisedprofit/(loss)
EUR
Forward foreign exchange contracts used for share class hedging:USD 23,412,900 EUR 20,123,540 20-Jul-18 (115,666)
Forward foreign exchange contracts used for efficient portfolio management:EUR 3,107,431 GBP 2,725,000 14-Sep-18 34,815EUR 3,464,392 NOK 33,000,000 14-Sep-18 6,325EUR 4,605,885 PLN 20,000,000 14-Sep-18 54,256
95,396
(20,270)
The above contracts were opened with the following counterparties:
Bank of America (115,147)Citigroup 34,815JPMorgan 60,062
(20,270)
FRANKLIN TEMPLETON INVESTMENT FUNDS
Notes to the Financial StatementsAt June 30, 2018 (continued)
Note 5 — Forward foreign exchange contracts (continued)
www.franklintempleton.lu Audited Annual Report 75

As at June 30, 2018, the Company had entered into the following outstanding contracts:
Franklin European Corporate Bond Fund
Purchases Sales MaturityDate
Unrealisedprofit/(loss)
EUR
Forward foreign exchange contracts used for efficient portfolio management:SEK 26,500,000 EUR 2,572,717 14-Sep-18 (38,848)
The above contracts were opened with the following counterparty:
Barclays Bank (38,848)
Franklin European Dividend Fund
Purchases Sales MaturityDate
Unrealisedprofit/(loss)
EUR
Forward foreign exchange contracts used for share class hedging:EUR 592,128 PLN 2,562,601 16-Jul-18 6,803EUR 1,995 SGD 3,138 16-Jul-18 25EUR 1,996 USD 2,328 16-Jul-18 6PLN 45,085,368 EUR 10,530,444 16-Jul-18 (232,471)SGD 138,577 EUR 88,681 16-Jul-18 (1,706)USD 99,398 EUR 84,220 16-Jul-18 747
(226,596)
The above contracts were opened with the following counterparties:
Bank of America (25,354)Barclays Bank (22,570)BNP Paribas (8,812)Citigroup (20,371)Deutsche Bank (24,388)Goldman Sachs (24,929)HSBC Bank (17,800)JPMorgan (22,683)Morgan Stanley (22,196)Toronto–Dominion Bank (14,082)UBS (23,411)
(226,596)
Franklin European Growth Fund
Purchases Sales MaturityDate
Unrealisedprofit/(loss)
EUR
Forward foreign exchange contracts used for share class hedging:EUR 60,947 NOK 578,632 10-Jul-18 164EUR 72,880 SGD 114,791 10-Jul-18 811EUR 719,934 USD 841,191 10-Jul-18 544NOK 13,884,399 EUR 1,459,213 10-Jul-18 (728)SGD 4,890,318 EUR 3,098,374 10-Jul-18 (28,081)USD 35,737,829 EUR 30,133,767 10-Jul-18 429,388
402,098
The above contracts were opened with the following counterparties:
Bank of America 17,702Barclays Bank 45,236BNP Paribas 26,639Citigroup 38,481Credit Suisse International 28,458Deutsche Bank 38,387Goldman Sachs 40,267HSBC Bank 44,963JPMorgan 42,026Morgan Stanley 33,248The Bank of New York Mellon (922)UBS 47,613
402,098
FRANKLIN TEMPLETON INVESTMENT FUNDS
Notes to the Financial StatementsAt June 30, 2018 (continued)
Note 5 — Forward foreign exchange contracts (continued)
76 Audited Annual Report www.franklintempleton.lu

As at June 30, 2018, the Company had entered into the following outstanding contracts:
Franklin European Income Fund
Purchases Sales MaturityDate
Unrealisedprofit/(loss)
EUR
Forward foreign exchange contracts used for share class hedging:SGD 670,603 EUR 429,100 16-Jul-18 (8,214)USD 324,346 EUR 274,721 16-Jul-18 2,537
(5,677)
Forward foreign exchange contracts used for efficient portfolio management:EUR 456,137 GBP 400,000 14-Sep-18 5,111EUR 598,206 PLN 2,600,000 14-Sep-18 6,494SEK 14,000,000 EUR 1,359,404 14-Sep-18 (20,757)
(9,152)
(14,829)
The above contracts were opened with the following counterparties:
Bank of America (956)Barclays Bank (9,063)BNP Paribas (760)Citigroup (473)Deutsche Bank (835)Goldman Sachs (938)HSBC Bank 94JPMorgan 158Morgan Stanley (641)Toronto–Dominion Bank (768)UBS (647)
(14,829)
Franklin European Small-Mid Cap Growth Fund
Purchases Sales MaturityDate
Unrealisedprofit/(loss)
EUR
Forward foreign exchange contracts used for share class hedging:USD 124,801 EUR 105,295 10-Jul-18 1,436
The above contracts were opened with the following counterparties:
Citigroup 280Deutsche Bank 71Goldman Sachs (21)JPMorgan 287Morgan Stanley 626UBS 193
1,436
Franklin European Total Return Fund
Purchases Sales MaturityDate
Unrealisedprofit/(loss)
EUR
Forward foreign exchange contracts used for share class hedging:NOK 1,710,393 EUR 180,926 16-Jul-18 (1,293)PLN 32,252,356 EUR 7,532,883 16-Jul-18 (166,106)SEK 1,076,894 EUR 106,127 16-Jul-18 (3,165)
(170,564)
Forward foreign exchange contracts used for efficient portfolio management:EUR 15,736,718 GBP 13,800,000 14-Sep-18 176,313EUR 5,354,060 NOK 51,000,000 14-Sep-18 9,775EUR 38,919,727 PLN 169,000,000 14-Sep-18 458,462PLN 20,000,000 EUR 4,610,017 14-Sep-18 (58,388)SEK 190,000,000 EUR 18,445,893 14-Sep-18 (278,530)
307,632
137,068
FRANKLIN TEMPLETON INVESTMENT FUNDS
Notes to the Financial StatementsAt June 30, 2018 (continued)
Note 5 — Forward foreign exchange contracts (continued)
www.franklintempleton.lu Audited Annual Report 77

As at June 30, 2018, the Company had entered into the following outstanding contracts:
Franklin European Total Return Fund (continued)Unrealisedprofit/(loss)
EUR
The above contracts were opened with the following counterparties:
Bank of America (38,246)Barclays Bank (278,798)BNP Paribas (3,687)Citigroup 158,788Deutsche Bank (234)Goldman Sachs (25,016)HSBC Bank (12,934)JPMorgan 372,023Morgan Stanley (34,508)Toronto–Dominion Bank (55)UBS (265)
137,068
Franklin Flexible Alpha Bond Fund
Purchases Sales MaturityDate
Unrealisedprofit/(loss)
USD
Forward foreign exchange contracts used for share class hedging:EUR 11,178,377 USD 13,197,337 16-Jul-18 (120,500)GBP 222,009,227 USD 296,874,168 16-Jul-18 (3,455,324)NOK 841,825 USD 105,123 16-Jul-18 (1,696)SEK 874,839 USD 101,795 16-Jul-18 (3,944)
(3,581,464)
Forward foreign exchange contracts used for efficient portfolio management:NOK 18,700,000 USD 2,424,117 13-Jul-18 (126,909)USD 1,983,213 NOK 16,100,000 13-Jul-18 5,403GBP 200,000 USD 285,960 18-Jul-18 (21,605)USD 327,435 CHF 302,550 19-Jul-18 21,424INR 210,700,000 USD 3,209,933 24-Jul-18 (143,347)USD 1,144,870 INR 78,000,000 24-Jul-18 9,637USD 1,520,495 CAD 1,940,000 25-Jul-18 43,634AUD 872,180 CAD 850,000 27-Jul-18 (1,491)MXN 91,020,000 USD 4,554,924 14-Aug-18 (5,037)IDR 21,437,000,000 USD 1,498,462 20-Aug-18 (11,949)USD 770,541 PHP 40,700,000 23-Aug-18 11,355PLN 5,427,000 USD 1,479,089 29-Aug-18 (27,914)USD 832,438 PLN 3,100,000 29-Aug-18 3,501SEK 30,700,000 USD 3,500,434 05-Sep-18 (52,783)USD 961,134 CAD 1,245,000 06-Sep-18 12,643AUD 3,300,000 USD 2,440,763 18-Sep-18 2,359USD 7,865,675 AUD 10,441,000 18-Sep-18 135,788EUR 880,000 USD 1,032,482 28-Sep-18 2,904USD 4,487,414 EUR 3,810,000 28-Sep-18 4,665JPY 1,071,577,807 USD 9,727,777 17-Dec-18 81,954USD 9,725,613 JPY 1,071,577,807 17-Dec-18 (84,117)USD 1,687,811 GBP 1,265,700 15-Aug-19 (17,467)
(157,352)
(3,738,816)
The above contracts were opened with the following counterparties:
Bank of America (264,479)BNP Paribas 10Citigroup (4)Deutsche Bank (255)Goldman Sachs (2,932)HSBC Bank (25,839)JPMorgan (2,735,120)Morgan Stanley (551,665)Royal Bank of Scotland (119,526)UBS (39,006)
(3,738,816)
FRANKLIN TEMPLETON INVESTMENT FUNDS
Notes to the Financial StatementsAt June 30, 2018 (continued)
Note 5 — Forward foreign exchange contracts (continued)
78 Audited Annual Report www.franklintempleton.lu

As at June 30, 2018, the Company had entered into the following outstanding contracts:
Franklin GCC Bond Fund
Purchases Sales MaturityDate
Unrealisedprofit/(loss)
USD
Forward foreign exchange contracts used for share class hedging:EUR 25,154,358 USD 29,269,029 20-Jul-18 166,176USD 623,025 EUR 538,412 20-Jul-18 (7,016)
159,160
The above contracts were opened with the following counterparties:
Bank of America 19,696JPMorgan 66,027Morgan Stanley 73,437
159,160
Franklin Global Aggregate Bond Fund
Purchases Sales MaturityDate
Unrealisedprofit/(loss)
USD
Forward foreign exchange contracts used for share class hedging:EUR 917,142 USD 1,066,733 20-Jul-18 6,490USD 12,032 EUR 10,373 20-Jul-18 (106)
6,384
Forward foreign exchange contracts used for efficient portfolio management:EUR 2,900,000 USD 3,585,415 17-Jul-18 (192,644)GBP 2,000,000 USD 2,833,084 17-Jul-18 (189,657)SEK 19,000,000 USD 2,282,002 17-Jul-18 (156,682)USD 2,300,250 AUD 3,000,000 17-Jul-18 79,652USD 1,800,391 EUR 1,500,000 01-Nov-18 30,410
(428,921)
(422,537)
The above contracts were opened with the following counterparties:
Bank of America 624Barclays Bank 79,853BNP Paribas 97Citigroup (507,841)Credit Suisse International 1,092Deutsche Bank 549Goldman Sachs 1,037HSBC Bank 277JPMorgan 673Morgan Stanley 481The Bank of New York Mellon 166UBS 455
(422,537)
Franklin Global Aggregate Investment Grade Bond Fund
Purchases Sales MaturityDate
Unrealisedprofit/(loss)
USD
Forward foreign exchange contracts used for efficient portfolio management:EUR 50,000 USD 61,818 17-Jul-18 (3,321)USD 306,700 AUD 400,000 17-Jul-18 10,620
7,299
The above contracts were opened with the following counterparties:
Barclays Bank 10,620Citigroup (3,321)
7,299
FRANKLIN TEMPLETON INVESTMENT FUNDS
Notes to the Financial StatementsAt June 30, 2018 (continued)
Note 5 — Forward foreign exchange contracts (continued)
www.franklintempleton.lu Audited Annual Report 79

As at June 30, 2018, the Company had entered into the following outstanding contracts:
Franklin Global Convertible Securities Fund
Purchases Sales MaturityDate
Unrealisedprofit/(loss)
USD
Forward foreign exchange contracts used for share class hedging:CHF 4,251,329 USD 4,285,832 20-Jul-18 14,501EUR 70,148,557 USD 81,609,261 20-Jul-18 477,395USD 121,172 CHF 119,820 20-Jul-18 (30)USD 849,922 EUR 726,873 20-Jul-18 (651)
491,215
The above contracts were opened with the following counterparties:
Bank of America 90,975Barclays Bank 17,395BNP Paribas 13,161Citigroup 25,595Credit Suisse International 812Deutsche Bank 10,806Goldman Sachs 29,234HSBC Bank 27,446JPMorgan 93,108Morgan Stanley 161,084The Bank of New York Mellon 2,036UBS 19,563
491,215
Franklin Global Fundamental Strategies Fund
Purchases Sales MaturityDate
Unrealisedprofit/(loss)
USD
Forward foreign exchange contracts used for share class hedging:EUR 161,370,749 USD 187,696,259 20-Jul-18 1,137,063PLN 34,242,327 USD 9,261,271 20-Jul-18 (111,135)USD 3,961,916 EUR 3,389,903 20-Jul-18 (4,891)USD 208,765 PLN 785,689 20-Jul-18 (1,184)
1,019,853
Forward foreign exchange contracts used for efficient portfolio management:JPY 221,491,000 USD 2,008,442 05-Jul-18 (6,704)USD 4,121,242 EUR 3,521,225 05-Jul-18 5,376USD 2,045,464 JPY 221,491,000 05-Jul-18 43,726USD 7,875,485 EUR 6,354,400 06-Jul-18 447,443USD 1,481,194 EUR 1,221,203 09-Jul-18 53,336USD 18,054,091 EUR 14,636,648 10-Jul-18 939,320USD 6,752,297 KRW 7,130,425,558 10-Jul-18 357,698USD 1,681,540 JPY 182,154,300 11-Jul-18 34,630USD 4,181,894 AUD 5,468,459 12-Jul-18 134,220USD 6,289,784 EUR 5,056,482 12-Jul-18 376,308USD 83,400 JPY 9,200,000 12-Jul-18 214INR 11,752,040 USD 178,901 13-Jul-18 (7,587)USD 2,286,504 EUR 1,835,245 13-Jul-18 140,053USD 4,125,879 JPY 438,300,000 13-Jul-18 162,537INR 11,750,960 USD 178,058 16-Jul-18 (6,834)USD 3,429,386 AUD 4,505,000 16-Jul-18 94,801USD 16,378,507 EUR 13,800,273 16-Jul-18 234,487USD 7,486,185 JPY 825,390,000 17-Jul-18 20,517USD 234,504 AUD 310,000 18-Jul-18 5,041USD 4,068,366 EUR 3,262,000 18-Jul-18 251,799INR 106,896,500 USD 1,639,014 19-Jul-18 (82,088)USD 884,112 EUR 757,250 19-Jul-18 (1,943)USD 169,030 JPY 18,015,000 20-Jul-18 6,051USD 8,843,735 EUR 7,613,250 23-Jul-18 (67,158)USD 1,717,677 JPY 188,677,000 23-Jul-18 10,385INR 12,372,000 USD 185,314 24-Jul-18 (5,248)USD 10,825,653 KRW 11,453,000,000 24-Jul-18 550,679INR 8,089,000 USD 121,048 25-Jul-18 (3,335)USD 1,430,993 EUR 1,231,995 25-Jul-18 (11,205)USD 260,111 JPY 28,190,000 26-Jul-18 4,973INR 71,836,000 USD 1,068,909 27-Jul-18 (23,841)USD 14,396,224 EUR 12,308,042 30-Jul-18 (17,277)USD 1,928,124 JPY 207,339,759 30-Jul-18 51,046USD 2,820,706 EUR 2,304,574 31-Jul-18 121,688USD 1,985,410 JPY 215,130,000 31-Jul-18 37,665INR 76,304,000 USD 1,127,840 02-Aug-18 (18,731)USD 976,255 EUR 802,000 02-Aug-18 36,837USD 1,011,169 JPY 111,309,225 02-Aug-18 3,252
FRANKLIN TEMPLETON INVESTMENT FUNDS
Notes to the Financial StatementsAt June 30, 2018 (continued)
Note 5 — Forward foreign exchange contracts (continued)
80 Audited Annual Report www.franklintempleton.lu

As at June 30, 2018, the Company had entered into the following outstanding contracts:
Franklin Global Fundamental Strategies Fund (continued)Purchases Sales Maturity
DateUnrealisedprofit/(loss)
USD
INR 38,658,000 USD 595,976 06-Aug-18 (34,390)USD 2,893,979 EUR 2,402,300 06-Aug-18 79,164INR 38,629,500 USD 594,712 08-Aug-18 (33,701)USD 17,598,608 JPY 1,900,730,000 08-Aug-18 379,802USD 227,757 AUD 303,550 09-Aug-18 3,052USD 25,284,165 EUR 21,076,763 09-Aug-18 582,269USD 4,361,905 JPY 471,936,980 09-Aug-18 86,295USD 9,650,912 EUR 8,079,182 10-Aug-18 181,383USD 4,179,921 AUD 5,464,771 13-Aug-18 134,558USD 1,175,972 JPY 127,406,666 13-Aug-18 21,370USD 15,761,584 EUR 13,118,074 14-Aug-18 381,117USD 233,541 JPY 26,080,667 14-Aug-18 (2,828)USD 3,408,843 AUD 4,505,000 15-Aug-18 73,944USD 4,884,509 EUR 4,062,215 15-Aug-18 121,329USD 1,300,547 JPY 139,152,000 15-Aug-18 39,323INR 41,044,000 USD 602,613 16-Aug-18 (7,222)USD 567,393 EUR 470,742 16-Aug-18 15,377USD 24,163,002 JPY 2,596,560,700 16-Aug-18 626,997USD 875,199 EUR 733,987 17-Aug-18 14,420USD 11,281,189 KRW 12,072,000,000 17-Aug-18 442,034USD 237,563 AUD 314,000 20-Aug-18 5,116USD 6,994,669 EUR 5,897,782 20-Aug-18 76,425USD 2,406,192 JPY 263,478,025 20-Aug-18 17,256USD 9,397,196 EUR 7,903,507 21-Aug-18 125,448USD 4,332,448 JPY 476,818,900 21-Aug-18 8,853USD 1,791,783 AUD 2,390,000 22-Aug-18 22,513USD 2,176,208 EUR 1,836,959 22-Aug-18 21,066USD 4,295,505 JPY 473,396,000 22-Aug-18 2,636USD 987,727 EUR 834,500 23-Aug-18 8,603USD 1,322,404 JPY 146,123,000 23-Aug-18 (2,771)USD 8,532,586 KRW 9,132,000,000 23-Aug-18 331,418USD 4,255,666 EUR 3,588,345 24-Aug-18 45,106USD 1,804,154 JPY 198,848,000 24-Aug-18 690USD 1,290,224 JPY 139,643,000 27-Aug-18 23,449USD 3,056,744 EUR 2,588,943 29-Aug-18 17,680USD 2,911,560 JPY 316,870,000 29-Aug-18 36,644USD 6,254,816 KRW 6,738,000,000 30-Aug-18 201,977USD 1,441,791 EUR 1,222,519 31-Aug-18 6,500USD 290,668 EUR 248,074 04-Sep-18 (670)USD 1,142,270 JPY 123,765,000 04-Sep-18 18,873USD 843,159 JPY 91,761,397 05-Sep-18 10,192USD 7,568,801 KRW 8,127,000,000 05-Sep-18 266,171USD 1,984,155 EUR 1,684,869 06-Sep-18 5,138USD 5,977,297 EUR 5,086,156 07-Sep-18 2,730USD 798,354 JPY 87,300,000 10-Sep-18 5,594USD 8,745,417 EUR 7,344,369 11-Sep-18 115,546USD 6,527,677 JPY 713,344,100 11-Sep-18 49,416USD 4,180,795 AUD 5,464,771 12-Sep-18 135,082USD 5,989,454 EUR 5,056,482 12-Sep-18 47,468USD 2,790,914 JPY 303,500,000 12-Sep-18 34,464USD 8,328,037 AUD 10,936,000 13-Sep-18 231,805USD 270,844 JPY 29,452,000 13-Sep-18 3,335INR 26,339,000 USD 385,637 14-Sep-18 (5,075)USD 3,430,621 AUD 4,505,000 14-Sep-18 95,431USD 416,121 JPY 45,586,000 14-Sep-18 2,038USD 54,021 EUR 45,526 17-Sep-18 502USD 299,641 AUD 396,000 18-Sep-18 6,467USD 21,257,927 EUR 17,972,549 18-Sep-18 128,269USD 26,646,621 JPY 2,924,030,515 18-Sep-18 78,234USD 10,112,480 JPY 1,110,108,234 19-Sep-18 25,049USD 16,761,825 AUD 22,532,000 20-Sep-18 80,389USD 10,695,153 EUR 9,152,949 20-Sep-18 (67,279)USD 2,274,235 JPY 249,597,256 20-Sep-18 6,005USD 7,956,693 JPY 870,039,850 21-Sep-18 49,572MXN 582,730,804 USD 28,127,467 24-Sep-18 817,932USD 5,184,869 EUR 4,448,147 24-Sep-18 (47,058)USD 2,495,645 EUR 2,139,430 25-Sep-18 (20,954)USD 6,178,249 JPY 676,270,756 25-Sep-18 30,334USD 16,196,845 EUR 13,792,974 28-Sep-18 (31,618)USD 1,088,521 JPY 118,665,000 28-Sep-18 9,499USD 1,005,327 JPY 110,181,775 02-Oct-18 3,106USD 10,856,504 JPY 1,140,367,140 04-Oct-18 481,908USD 263,842 JPY 27,600,000 05-Oct-18 12,728INR 6,186,000 USD 93,307 09-Oct-18 (4,219)USD 233,727 AUD 303,550 09-Oct-18 8,968USD 7,979,131 JPY 837,350,000 09-Oct-18 358,063
FRANKLIN TEMPLETON INVESTMENT FUNDS
Notes to the Financial StatementsAt June 30, 2018 (continued)
Note 5 — Forward foreign exchange contracts (continued)
www.franklintempleton.lu Audited Annual Report 81

As at June 30, 2018, the Company had entered into the following outstanding contracts:
Franklin Global Fundamental Strategies Fund (continued)Purchases Sales Maturity
DateUnrealisedprofit/(loss)
USD
USD 8,303,180 KRW 8,720,000,000 10-Oct-18 455,255USD 7,882,272 JPY 832,900,000 11-Oct-18 300,431USD 3,410,195 AUD 4,505,000 15-Oct-18 74,355USD 1,566,197 KRW 1,668,000,000 16-Oct-18 64,620USD 9,137,185 KRW 9,711,000,000 18-Oct-18 394,325USD 6,288,871 AUD 8,160,000 24-Oct-18 246,126USD 723,824 JPY 78,972,120 26-Oct-18 4,038USD 4,011,708 KRW 4,426,518,442 29-Oct-18 24,584USD 2,815,161 KRW 3,008,000,000 30-Oct-18 105,630USD 2,084,639 KRW 2,229,000,000 15-Nov-18 75,411USD 3,475,084 KRW 3,710,000,000 19-Nov-18 130,296USD 3,197,582 KRW 3,411,500,000 21-Nov-18 121,641USD 7,850,328 KRW 8,434,000,000 07-Dec-18 240,601USD 3,493,244 KRW 3,710,000,000 11-Dec-18 145,246USD 8,762,169 JPY 955,047,900 18-Dec-18 18,471INR 7,069,000 USD 102,050 19-Dec-18 (1,169)USD 1,034,002 KRW 1,111,500,000 20-Dec-18 30,562USD 9,683,631 JPY 1,065,686,000 11-Jan-19 (92,001)USD 2,164,890 JPY 235,540,000 16-Jan-19 3,401USD 529,020 JPY 57,240,000 22-Jan-19 3,493USD 946,614 JPY 102,360,000 24-Jan-19 6,685USD 5,465,162 JPY 588,943,000 25-Jan-19 56,717USD 1,008,644 JPY 107,390,272 31-Jan-19 21,975USD 4,001,181 JPY 426,910,000 12-Feb-19 75,113USD 462,899 JPY 49,040,667 14-Feb-19 11,826USD 460,076 JPY 48,220,000 15-Feb-19 16,516USD 5,272,244 KRW 5,650,000,000 20-Mar-19 151,862
13,554,478
14,574,331
The above contracts were opened with the following counterparties:
Bank of America 432,698Barclays Bank 542,961BNP Paribas 103,226Citigroup 2,925,350Credit Suisse International 108,692Deutsche Bank 1,789,873Goldman Sachs 615,970HSBC Bank 3,521,163JPMorgan 4,022,514Morgan Stanley 105,788Standard Chartered 176,071The Bank of New York Mellon 47,386UBS 182,639
14,574,331
Franklin Global Listed Infrastructure Fund
Purchases Sales MaturityDate
Unrealisedprofit/(loss)
USD
Forward foreign exchange contracts used for share class hedging:GBP 575,208 USD 773,218 10-Jul-18 (13,208)USD 16,028 GBP 11,969 10-Jul-18 214
(12,994)
The above contracts were opened with the following counterparties:
Bank of America (2,417)Barclays Bank (455)BNP Paribas (257)Credit Suisse International (485)Deutsche Bank (4,408)HSBC Bank (437)JPMorgan (94)Morgan Stanley (4,245)UBS (196)
(12,994)
FRANKLIN TEMPLETON INVESTMENT FUNDS
Notes to the Financial StatementsAt June 30, 2018 (continued)
Note 5 — Forward foreign exchange contracts (continued)
82 Audited Annual Report www.franklintempleton.lu

As at June 30, 2018, the Company had entered into the following outstanding contracts:
Franklin Global Multi-Asset Income Fund
Purchases Sales MaturityDate
Unrealisedprofit/(loss)
EUR
Forward foreign exchange contracts used for share class hedging:AUD 7,603,596 EUR 4,864,201 20-Jul-18 (54,499)EUR 100,857 AUD 158,167 20-Jul-18 808EUR 3,997 SGD 6,286 20-Jul-18 53EUR 1,072,498 USD 1,252,307 20-Jul-18 2,318SGD 286,322 EUR 182,342 20-Jul-18 (2,680)USD 55,501,743 EUR 47,707,626 20-Jul-18 (277,712)
(331,712)
Forward foreign exchange contracts used for efficient portfolio management:AUD 980,000 EUR 609,988 17-Jul-18 10,049CAD 2,200,000 USD 1,711,716 17-Jul-18 (31,763)CHF 450,000 EUR 382,575 17-Jul-18 6,399MXN 13,500,000 EUR 579,929 17-Jul-18 (444)MXN 7,000,000 USD 376,999 17-Jul-18 (21,769)SEK 12,300,000 EUR 1,194,614 17-Jul-18 (18,581)USD 346,873 MXN 7,000,000 17-Jul-18 (3,982)EUR 6,603,825 AUD 10,330,000 24-Aug-18 86,746EUR 11,874,018 NZD 20,300,000 24-Aug-18 147,548EUR 113,588,555 USD 135,058,000 24-Aug-18 (1,511,175)USD 69,862,000 EUR 59,341,567 24-Aug-18 196,539EUR 17,707,602 USD 20,883,000 27-Aug-18 (85,151)USD 15,650,000 EUR 13,416,835 27-Aug-18 (82,708)CAD 10,866,000 EUR 7,021,638 31-Aug-18 28,665CHF 7,527,000 EUR 6,541,306 31-Aug-18 (31,836)EUR 7,171,653 CAD 10,866,000 31-Aug-18 121,350EUR 6,404,551 CHF 7,527,000 31-Aug-18 (104,918)EUR 11,781,574 GBP 10,366,000 31-Aug-18 87,762EUR 9,954,176 JPY 1,305,119,000 31-Aug-18 (133,100)EUR 3,377,374 KRW 4,410,850,000 31-Aug-18 2,275EUR 36,785,284 USD 43,410,000 31-Aug-18 (189,492)EUR 4,452,933 ZAR 67,100,000 31-Aug-18 319,730GBP 4,685,000 EUR 5,323,374 31-Aug-18 (38,258)JPY 898,665,000 CAD 10,380,898 31-Aug-18 210,241JPY 1,305,119,000 EUR 10,213,538 31-Aug-18 (126,262)USD 43,410,000 EUR 37,142,758 31-Aug-18 (167,982)ZAR 67,100,000 EUR 4,182,247 31-Aug-18 (49,044)
(1,379,161)
(1,710,873)
The above contracts were opened with the following counterparties:
Bank of America (64,752)Barclays Bank (51,702)BNP Paribas (9,192)Citigroup (478,331)Credit Suisse International (2,855)Deutsche Bank (7,146)Goldman Sachs (11,902)HSBC Bank (7,875)JPMorgan (1,011,161)Morgan Stanley (62,451)UBS (3,506)
(1,710,873)
Franklin Global Real Estate Fund
Purchases Sales MaturityDate
Unrealisedprofit/(loss)
USD
Forward foreign exchange contracts used for share class hedging:EUR 15,874,505 USD 18,464,362 20-Jul-18 111,716USD 900,758 EUR 776,603 20-Jul-18 (8,010)
103,706
FRANKLIN TEMPLETON INVESTMENT FUNDS
Notes to the Financial StatementsAt June 30, 2018 (continued)
Note 5 — Forward foreign exchange contracts (continued)
www.franklintempleton.lu Audited Annual Report 83

As at June 30, 2018, the Company had entered into the following outstanding contracts:
Franklin Global Real Estate Fund (continued)Unrealisedprofit/(loss)
USD
The above contracts were opened with the following counterparties:
Bank of America 11,701Barclays Bank 1,799BNP Paribas 7,268Citigroup 12,112Credit Suisse International 5,727Deutsche Bank 1,734Goldman Sachs 13,872HSBC Bank 13,154JPMorgan 13,137Morgan Stanley 7,963The Bank of New York Mellon 2,297Toronto–Dominion Bank 295UBS 12,647
103,706
Franklin Gold and Precious Metals Fund
Purchases Sales MaturityDate
Unrealisedprofit/(loss)
USD
Forward foreign exchange contracts used for share class hedging:CHF 5,973,419 USD 6,021,439 20-Jul-18 20,833EUR 12,298,669 USD 14,304,672 20-Jul-18 87,024USD 164,308 CHF 163,114 20-Jul-18 (686)USD 728,230 EUR 625,342 20-Jul-18 (3,534)
103,637
The above contracts were opened with the following counterparties:
Bank of America 8,532Barclays Bank 7,601BNP Paribas 9,362Citigroup 8,892Credit Suisse International 8,384Deutsche Bank 9,990Goldman Sachs 9,280HSBC Bank 9,442JPMorgan 9,077Morgan Stanley 8,356The Bank of New York Mellon 3,535Toronto–Dominion Bank 2,028UBS 9,158
103,637
Franklin High Yield Fund
Purchases Sales MaturityDate
Unrealisedprofit/(loss)
USD
Forward foreign exchange contracts used for share class hedging:AUD 12,007,345 USD 9,096,328 10-Jul-18 (208,731)EUR 6,869,348 USD 8,147,060 10-Jul-18 (114,667)SGD 16,958,853 USD 12,741,725 10-Jul-18 (291,743)USD 3,312,202 EUR 2,842,224 10-Jul-18 (11,238)USD 273,021 SGD 372,154 10-Jul-18 (187)
(626,566)
The above contracts were opened with the following counterparties:
Bank of America (44,370)Barclays Bank (9,007)BNP Paribas (20,284)Citigroup (52,458)Credit Suisse International (18,666)Deutsche Bank (69,789)Goldman Sachs (29,630)HSBC Bank (33,654)JPMorgan (73,697)Morgan Stanley (143,154)UBS (131,857)
(626,566)
FRANKLIN TEMPLETON INVESTMENT FUNDS
Notes to the Financial StatementsAt June 30, 2018 (continued)
Note 5 — Forward foreign exchange contracts (continued)
84 Audited Annual Report www.franklintempleton.lu

As at June 30, 2018, the Company had entered into the following outstanding contracts:
Franklin Income Fund
Purchases Sales MaturityDate
Unrealisedprofit/(loss)
USD
Forward foreign exchange contracts used for share class hedging:AUD 6,194,868 USD 4,605,808 20-Jul-18 (20,319)EUR 53,358,572 USD 62,066,502 20-Jul-18 372,794SGD 16,474,488 USD 12,200,713 20-Jul-18 (103,966)USD 152,026 EUR 131,283 20-Jul-18 (1,599)USD 252,191 SGD 344,572 20-Jul-18 (818)USD 50,977 ZAR 687,480 20-Jul-18 975ZAR 11,026,748 USD 808,239 20-Jul-18 (6,243)
240,824
The above contracts were opened with the following counterparties:
Bank of America 22,317Barclays Bank 15,774BNP Paribas 1,617Citigroup 50,548Credit Suisse International (12,390)Goldman Sachs 32,427HSBC Bank 28,481JPMorgan 51,052Morgan Stanley 52,286UBS (1,288)
240,824
Franklin India Fund
Purchases Sales MaturityDate
Unrealisedprofit/(loss)
USD
Forward foreign exchange contracts used for share class hedging:EUR 43,772,764 USD 51,920,098 10-Jul-18 (736,190)PLN 62,004,503 USD 17,225,698 10-Jul-18 (659,299)USD 2,008,918 EUR 1,733,723 10-Jul-18 (18,341)USD 1,009,236 PLN 3,784,627 10-Jul-18 (1,942)
(1,415,772)
The above contracts were opened with the following counterparties:
Bank of America (461,626)Barclays Bank (34,287)BNP Paribas (81,166)Citigroup (93,300)Credit Suisse International (54,662)Deutsche Bank (49,764)Goldman Sachs (88,809)HSBC Bank (67,072)JPMorgan (160,105)Morgan Stanley (227,115)The Bank of New York Mellon (2,766)UBS (95,100)
(1,415,772)
Franklin Japan Fund
Purchases Sales MaturityDate
Unrealisedprofit/(loss)
JPY
Forward foreign exchange contracts used for share class hedging:JPY 24,334,368 USD 221,377 20-Jul-18 (135,563)USD 10,327,965 JPY 1,138,272,667 20-Jul-18 3,330,625
3,195,062
FRANKLIN TEMPLETON INVESTMENT FUNDS
Notes to the Financial StatementsAt June 30, 2018 (continued)
Note 5 — Forward foreign exchange contracts (continued)
www.franklintempleton.lu Audited Annual Report 85

As at June 30, 2018, the Company had entered into the following outstanding contracts:
Franklin Japan Fund (continued)Unrealisedprofit/(loss)
JPY
The above contracts were opened with the following counterparties:
Bank of America 514,302Barclays Bank 431,232BNP Paribas 177,228Citigroup 453,611Credit Suisse International 49,697Deutsche Bank 160,591Goldman Sachs 102,409HSBC Bank 285,894JPMorgan 284,811Morgan Stanley 312,134UBS 423,153
3,195,062
Franklin K2 Alternative Strategies Fund
Purchases Sales MaturityDate
Unrealisedprofit/(loss)
USD
Forward foreign exchange contracts used for share class hedging:CAD 16,188,571 USD 12,452,341 16-Jul-18 (135,324)CHF 118,764,381 USD 120,817,814 16-Jul-18 (759,182)CZK 293,775,110 USD 13,474,148 16-Jul-18 (251,783)EUR 1,174,094,537 USD 1,385,961,749 16-Jul-18 (13,557,041)GBP 67,126,713 USD 89,768,110 16-Jul-18 (1,125,550)HUF 497,685,000 USD 1,834,553 16-Jul-18 (68,248)NOK 3,791,730 USD 473,505 16-Jul-18 (7,693)PLN 54,717,724 USD 15,070,756 16-Jul-18 (459,912)SEK 3,388,822 USD 393,949 16-Jul-18 (15,226)SGD 6,379,530 USD 4,777,995 16-Jul-18 (94,603)USD 2,370,833 EUR 2,027,942 16-Jul-18 361USD 40,154 HUF 11,361,800 16-Jul-18 (169)USD 326,944 PLN 1,233,297 16-Jul-18 (2,374)JPY 24,164,911 USD 219,256 17-Jul-18 (786)
(16,477,530)
Forward foreign exchange contracts used for efficient portfolio management:NOK 395,000 USD 49,260 02-Jul-18 (761)PEN 520,000 USD 158,827 02-Jul-18 (484)RUB 3,380,000 USD 54,416 02-Jul-18 (595)USD 48,151 NOK 395,000 02-Jul-18 (349)USD 158,973 PEN 520,000 02-Jul-18 629USD 54,123 RUB 3,380,000 02-Jul-18 303BRL 5,847,564 USD 1,597,420 03-Jul-18 (88,663)EUR 205,000 USD 254,513 03-Jul-18 (15,114)HKD 500,000 USD 63,715 03-Jul-18 15USD 1,552,508 BRL 5,847,564 03-Jul-18 43,751USD 254,035 EUR 205,000 03-Jul-18 14,636CNY 1,850,000 USD 287,624 05-Jul-18 (8,402)ILS 255,000 USD 71,570 05-Jul-18 (1,854)PEN 9,349,976 USD 2,852,369 05-Jul-18 (5,474)PHP 6,500,000 USD 123,223 05-Jul-18 (1,435)TWD 1,425,000 USD 48,067 05-Jul-18 (1,323)USD 71,641 ILS 255,000 05-Jul-18 1,926USD 2,855,391 PEN 9,349,976 05-Jul-18 8,495USD 47,595 TWD 1,425,000 05-Jul-18 851CNY 1,610,000 USD 250,974 06-Jul-18 (7,980)IDR 47,140,649,960 USD 3,387,330 06-Jul-18 (98,798)MYR 835,000 USD 209,541 06-Jul-18 (2,847)USD 243,349 CNY 1,610,000 06-Jul-18 355USD 52,852 EUR 45,000 06-Jul-18 290USD 47,776 HUF 12,975,000 06-Jul-18 1,757USD 3,237,393 IDR 45,498,324,960 06-Jul-18 63,430USD 207,222 MYR 835,000 06-Jul-18 528BRL 305,000 USD 82,510 09-Jul-18 (3,873)JPY 5,240,000 USD 47,806 09-Jul-18 (459)MXN 975,000 USD 47,776 09-Jul-18 1,270RUB 4,970,000 USD 79,812 09-Jul-18 (723)SGD 105,000 USD 78,896 09-Jul-18 (1,823)THB 2,550,000 USD 80,075 09-Jul-18 (3,098)USD 79,614 BRL 305,000 09-Jul-18 976USD 47,764 JPY 5,240,000 09-Jul-18 416USD 47,742 MXN 975,000 09-Jul-18 (1,304)USD 78,590 RUB 4,970,000 09-Jul-18 (499)USD 77,290 SGD 105,000 09-Jul-18 217
FRANKLIN TEMPLETON INVESTMENT FUNDS
Notes to the Financial StatementsAt June 30, 2018 (continued)
Note 5 — Forward foreign exchange contracts (continued)
86 Audited Annual Report www.franklintempleton.lu

As at June 30, 2018, the Company had entered into the following outstanding contracts:
Franklin K2 Alternative Strategies Fund (continued)Purchases Sales Maturity
DateUnrealisedprofit/(loss)
USD
USD 79,466 THB 2,550,000 09-Jul-18 2,490USD 47,696 ZAR 610,000 09-Jul-18 3,261ZAR 610,000 USD 44,630 09-Jul-18 (195)ARS 36,014,362 USD 1,290,960 10-Jul-18 (55,385)USD 1,329,807 ARS 34,854,362 10-Jul-18 134,030INR 219,282,586 USD 3,230,935 11-Jul-18 (33,389)PHP 7,725,000 USD 146,523 11-Jul-18 (1,817)USD 3,249,233 INR 219,282,586 11-Jul-18 51,687USD 144,177 PHP 7,725,000 11-Jul-18 (529)USD 4,429,486 PLN 15,990,000 11-Jul-18 160,103INR 166,383,271 USD 2,453,126 12-Jul-18 (27,247)USD 2,447,165 INR 166,383,271 12-Jul-18 21,287BRL 295,000 USD 79,762 16-Jul-18 (3,768)COP 6,552,520,000 USD 2,290,650 16-Jul-18 (56,601)MXN 1,660,000 USD 82,165 16-Jul-18 1,245USD 78,001 BRL 295,000 16-Jul-18 2,007USD 2,472,062 INR 167,445,103 16-Jul-18 31,898USD 48,120 KRW 51,820,000 16-Jul-18 1,611USD 79,885 MXN 1,660,000 16-Jul-18 (3,525)USD 48,762 MYR 195,000 16-Jul-18 503USD 32,583 SEK 280,000 16-Jul-18 1,291USD 80,942 THB 2,595,000 16-Jul-18 2,592RUB 3,880,000 USD 61,377 18-Jul-18 306TRY 235,000 USD 48,986 18-Jul-18 1,841USD 61,683 RUB 3,880,000 18-Jul-18 0USD 49,314 TRY 235,000 18-Jul-18 (1,513)USD 48,915 TWD 1,460,000 18-Jul-18 984INR 112,491,577 USD 1,640,776 19-Jul-18 (2,048)USD 1,646,781 INR 112,491,577 19-Jul-18 8,053CHF 1,118,000 USD 1,124,976 20-Jul-18 5,607EUR 45,000 USD 52,701 20-Jul-18 (85)TRY 235,000 USD 49,650 20-Jul-18 1,132USD 48,659 CZK 1,080,000 20-Jul-18 40USD 31,685,944 EUR 27,394,600 20-Jul-18 (345,502)USD 6,004,386 GBP 4,537,951 20-Jul-18 10,752USD 5,328,911 HKD 41,820,000 20-Jul-18 (2,649)USD 842,926 INR 57,668,780 20-Jul-18 2,936USD 48,609 PLN 180,000 20-Jul-18 543USD 48,987 TRY 235,000 20-Jul-18 (1,796)INR 56,643,610 USD 832,382 23-Jul-18 (7,628)THB 4,790,000 USD 144,985 23-Jul-18 (334)USD 263,681 GBP 200,000 23-Jul-18 (513)USD 825,829 INR 56,643,610 23-Jul-18 1,075USD 145,723 THB 4,790,000 23-Jul-18 1,072JPY 5,280,000 USD 47,922 25-Jul-18 (161)USD 650,073 GBP 490,000 25-Jul-18 2,736USD 48,103 JPY 5,280,000 25-Jul-18 341INR 112,839,072 USD 1,638,912 27-Jul-18 3,265USD 48,710 CLP 31,160,000 27-Jul-18 1,017USD 48,698 COP 142,540,000 27-Jul-18 121USD 1,649,332 INR 112,839,072 27-Jul-18 7,155USD 1,690,618 KRW 1,886,222,123 27-Jul-18 (2,814)USD 183,625 EUR 157,000 30-Jul-18 (89)USD 81,463 RUB 5,145,000 30-Jul-18 (224)GBP 35,000 USD 46,051 31-Jul-18 200USD 45,858 GBP 35,000 31-Jul-18 (394)USD 3,448,956 ZAR 48,075,000 31-Jul-18 (42,866)USD 1,685,713 INR 116,971,621 02-Aug-18 (15,352)USD 842,223 PEN 2,758,282 02-Aug-18 3,330USD 47,849 ZAR 665,000 02-Aug-18 (439)USD 1,752,266 EGP 32,341,255 16-Aug-18 (29,923)USD 398,546 EGP 7,341,218 23-Aug-18 (5,140)CNH 8,686,168 USD 1,363,156 24-Aug-18 (56,331)TWD 52,628,283 USD 1,729,771 24-Aug-18 2,632USD 1,349,539 CNH 8,686,168 24-Aug-18 42,714USD 5,243,697 TWD 156,016,057 24-Aug-18 108,003USD 357,331 EGP 6,646,364 27-Aug-18 (7,701)CAD 2,157,792 USD 1,624,232 31-Aug-18 18,832EUR 642,076 USD 748,090 31-Aug-18 5,143GBP 166,026 USD 221,090 31-Aug-18 (1,380)JPY 132,429,020 USD 1,215,418 31-Aug-18 (14,297)KRW 514,061,800 USD 458,728 31-Aug-18 3,334TRY 3,548,384 USD 729,559 31-Aug-18 22,812USD 11,406,642 CAD 15,149,720 31-Aug-18 (129,207)USD 852,659 CHF 840,645 31-Aug-18 (655)USD 3,594,152 EUR 3,078,088 31-Aug-18 (16,821)
FRANKLIN TEMPLETON INVESTMENT FUNDS
Notes to the Financial StatementsAt June 30, 2018 (continued)
Note 5 — Forward foreign exchange contracts (continued)
www.franklintempleton.lu Audited Annual Report 87

As at June 30, 2018, the Company had entered into the following outstanding contracts:
Franklin K2 Alternative Strategies Fund (continued)Purchases Sales Maturity
DateUnrealisedprofit/(loss)
USD
USD 427,863 GBP 322,056 31-Aug-18 1,671USD 1,261,474 JPY 138,205,364 31-Aug-18 7,962USD 464,614 KRW 514,061,800 31-Aug-18 2,552USD 3,429,303 MXN 68,896,000 31-Aug-18 (6,374)USD 98,759 SEK 872,832 31-Aug-18 858USD 260,064 TRY 1,268,396 31-Aug-18 (8,876)USD 1,898,944 CAD 2,467,000 14-Sep-18 20,008USD 1,720,562 EUR 1,454,000 14-Sep-18 13,006USD 4,831,690 JPY 529,789,000 14-Sep-18 21,599USD 1,675,128 PEN 5,494,251 14-Sep-18 6,607AUD 638,000 USD 474,234 19-Sep-18 (1,968)CAD 681,000 USD 513,873 19-Sep-18 4,837CHF 2,276,000 USD 2,320,956 19-Sep-18 (6,780)CNH 10,424,727 EUR 1,384,904 19-Sep-18 (60,364)CNH 21,761,102 USD 3,330,828 19-Sep-18 (60,482)CZK 75,035,801 EUR 2,908,358 19-Sep-18 (29,226)EUR 1,344,103 CNH 10,424,727 19-Sep-18 12,429EUR 2,888,937 CZK 75,035,802 19-Sep-18 6,410EUR 9,274,476 USD 10,907,816 19-Sep-18 (11,838)GBP 14,220,000 USD 19,023,739 19-Sep-18 (190,245)HKD 19,513,000 USD 2,490,550 19-Sep-18 (99)JPY 2,409,397,000 USD 21,950,659 19-Sep-18 (67,086)MXN 22,020,000 USD 1,055,348 19-Sep-18 39,625NZD 3,596,000 USD 2,526,912 19-Sep-18 (91,158)RUB 102,837,705 USD 1,621,151 19-Sep-18 3,037TRY 15,615,264 USD 3,214,968 19-Sep-18 70,983USD 23,222,287 AUD 30,913,000 19-Sep-18 339,620USD 23,745,594 CAD 30,990,000 19-Sep-18 140,854USD 18,164,043 CHF 17,925,481 19-Sep-18 (62,109)USD 4,158,915 CNH 26,843,421 19-Sep-18 124,778USD 58,141,747 EUR 49,688,590 19-Sep-18 (234,146)USD 23,956,153 GBP 18,070,000 19-Sep-18 23,577USD 1,504,956 INR 103,336,971 19-Sep-18 10,844USD 23,756,950 JPY 2,601,625,000 19-Sep-18 127,449USD 6,036,735 MXN 126,022,000 19-Sep-18 (229,872)USD 11,245,028 NZD 16,190,000 19-Sep-18 278,716USD 1,638,913 RUB 102,837,705 19-Sep-18 14,726USD 3,183,642 TRY 15,615,264 19-Sep-18 (102,309)USD 17,068,368 ZAR 231,978,769 19-Sep-18 331,259ZAR 35,599,846 USD 2,599,093 19-Sep-18 (30,588)EUR 51,000 USD 59,582 20-Sep-18 339GBP 3,758,000 USD 4,992,692 20-Sep-18 (15,243)JPY 98,500,000 USD 896,293 20-Sep-18 (1,592)USD 11,186,520 EUR 9,574,000 20-Sep-18 (62,211)USD 1,496,668 GBP 1,128,000 20-Sep-18 2,638USD 5,043,612 JPY 553,250,000 20-Sep-18 18,299ARS 17,448,347 USD 581,612 25-Sep-18 (27,988)USD 586,374 ARS 17,448,347 25-Sep-18 32,751USD 4,137,580 EUR 3,549,000 28-Sep-18 (34,784)USD 2,651,847 GBP 2,019,000 28-Sep-18 (23,233)
(5,487)
(16,483,017)
The above contracts were opened with the following counterparties:
Bank of America (3,411,096)Barclays Bank (90,606)Deutsche Bank (889,745)Goldman Sachs (4,120)HSBC Bank (1,092)JPMorgan (6,612,434)Morgan Stanley (5,471,669)UBS (2,255)
(16,483,017)
FRANKLIN TEMPLETON INVESTMENT FUNDS
Notes to the Financial StatementsAt June 30, 2018 (continued)
Note 5 — Forward foreign exchange contracts (continued)
88 Audited Annual Report www.franklintempleton.lu

As at June 30, 2018, the Company had entered into the following outstanding contracts:
Franklin K2 Global Macro Opportunities Fund
Purchases Sales MaturityDate
Unrealisedprofit/(loss)
USD
Forward foreign exchange contracts used for share class hedging:EUR 4,319,697 USD 5,099,878 16-Jul-18 (50,565)GBP 2,295,288 USD 3,068,803 16-Jul-18 (37,816)JPY 147,960,487 USD 1,342,651 17-Jul-18 (4,980)
(93,361)
Forward foreign exchange contracts used for efficient portfolio management:BRL 272,792 USD 74,589 03-Jul-18 (4,205)USD 72,397 BRL 272,792 03-Jul-18 2,013PEN 706,140 USD 215,441 05-Jul-18 (435)USD 215,648 PEN 706,140 05-Jul-18 642IDR 2,162,947,435 USD 155,418 06-Jul-18 (4,530)USD 153,903 IDR 2,162,947,435 06-Jul-18 3,015ARS 1,652,198 USD 59,060 10-Jul-18 (2,377)USD 62,640 ARS 1,652,198 10-Jul-18 5,957INR 10,337,793 USD 152,316 11-Jul-18 (1,572)USD 153,181 INR 10,337,793 11-Jul-18 2,437INR 7,807,911 USD 115,118 12-Jul-18 (1,279)USD 114,839 INR 7,807,911 12-Jul-18 999USD 115,323 INR 7,811,406 16-Jul-18 1,488INR 5,203,919 USD 75,903 19-Jul-18 (95)USD 76,181 INR 5,203,919 19-Jul-18 373USD 38,053 INR 2,603,393 20-Jul-18 133INR 2,620,991 USD 38,516 23-Jul-18 (353)USD 38,212 INR 2,620,991 23-Jul-18 50INR 5,219,785 USD 75,814 27-Jul-18 151USD 76,296 INR 5,219,785 27-Jul-18 331USD 78,206 KRW 87,254,121 27-Jul-18 (130)USD 77,956 INR 5,409,369 02-Aug-18 (710)USD 75,701 PEN 247,920 02-Aug-18 299USD 92,294 EGP 1,702,549 16-Aug-18 (1,526)USD 22,990 EGP 423,472 23-Aug-18 (296)CNH 423,486 USD 66,459 24-Aug-18 (2,746)TWD 2,436,614 USD 80,086 24-Aug-18 122USD 65,795 CNH 423,486 24-Aug-18 2,082USD 242,647 TWD 7,219,101 24-Aug-18 5,011USD 149,414 EGP 2,779,093 27-Aug-18 (3,220)USD 45,334 PEN 148,691 14-Sep-18 179BRL 189,172 USD 50,000 19-Sep-18 (1,590)CAD 21,000 USD 15,975 19-Sep-18 21CNH 482,253 EUR 64,066 19-Sep-18 (2,792)CNH 1,647,864 USD 254,086 19-Sep-18 (6,438)COP 147,192,806 USD 50,000 19-Sep-18 34CZK 3,469,565 EUR 134,479 19-Sep-18 (1,351)EUR 62,179 CNH 482,253 19-Sep-18 575EUR 233,581 CZK 6,062,832 19-Sep-18 703EUR 400,000 HUF 127,635,256 19-Sep-18 15,190EUR 50,000 NOK 476,358 19-Sep-18 66EUR 100,000 PLN 436,248 19-Sep-18 867EUR 800,000 SEK 8,225,938 19-Sep-18 15,846EUR 194,212 USD 225,357 19-Sep-18 2,810GBP 459,000 USD 614,214 19-Sep-18 (6,298)INR 6,821,518 USD 100,000 19-Sep-18 (1,370)JPY 66,784,000 USD 608,647 19-Sep-18 (2,075)KRW 319,695,000 USD 300,000 19-Sep-18 (12,377)MXN 3,430,000 USD 163,143 19-Sep-18 7,418NOK 7,133,152 EUR 750,000 19-Sep-18 (2,502)NZD 14,000 USD 9,775 19-Sep-18 (292)PHP 5,290,075 USD 100,000 19-Sep-18 (1,245)PLN 646,358 EUR 150,000 19-Sep-18 (3,443)RUB 11,075,843 USD 175,709 19-Sep-18 (781)SEK 1,011,622 EUR 100,000 19-Sep-18 (3,848)SGD 265,720 USD 200,000 19-Sep-18 (4,643)THB 4,771,785 USD 150,000 19-Sep-18 (5,628)TRY 728,795 USD 150,036 19-Sep-18 3,326TWD 2,983,985 USD 100,000 19-Sep-18 (1,568)USD 832,611 AUD 1,110,000 19-Sep-18 10,958USD 200,000 BRL 748,010 19-Sep-18 8,583USD 866,699 CAD 1,131,000 19-Sep-18 5,229USD 585,635 CHF 578,000 19-Sep-18 (2,060)USD 242,394 CNH 1,569,944 19-Sep-18 6,456USD 50,000 COP 146,352,194 19-Sep-18 251USD 1,929,038 EUR 1,647,802 19-Sep-18 (6,858)USD 888,991 GBP 671,000 19-Sep-18 293USD 217,217 INR 14,928,386 19-Sep-18 1,373
FRANKLIN TEMPLETON INVESTMENT FUNDS
Notes to the Financial StatementsAt June 30, 2018 (continued)
Note 5 — Forward foreign exchange contracts (continued)
www.franklintempleton.lu Audited Annual Report 89

As at June 30, 2018, the Company had entered into the following outstanding contracts:
Franklin K2 Global Macro Opportunities Fund (continued)Purchases Sales Maturity
DateUnrealisedprofit/(loss)
USD
USD 437,213 JPY 47,908,000 19-Sep-18 2,084USD 100,000 KRW 111,011,574 19-Sep-18 125USD 304,724 MXN 6,276,000 19-Sep-18 (7,358)USD 332,726 NZD 476,000 19-Sep-18 10,307USD 100,000 PHP 5,399,525 19-Sep-18 (798)USD 126,539 RUB 8,013,622 19-Sep-18 (26)USD 200,000 SGD 271,619 19-Sep-18 306USD 100,000 THB 3,285,522 19-Sep-18 595USD 248,578 TRY 1,197,767 19-Sep-18 (3,470)USD 200,000 TWD 5,898,530 19-Sep-18 5,427USD 855,641 ZAR 11,616,667 19-Sep-18 17,506ZAR 2,554,331 USD 189,298 19-Sep-18 (5,004)CLP 63,655,590 USD 100,000 20-Sep-18 (2,581)USD 150,000 CLP 96,191,365 20-Sep-18 2,789USD 200,000 ILS 714,572 20-Sep-18 3,553ARS 807,396 USD 26,913 25-Sep-18 (1,295)USD 27,134 ARS 807,396 25-Sep-18 1,515
38,323
(55,038)
The above contracts were opened with the following counterparties:
Bank of America (702)Barclays Bank (2,744)Deutsche Bank (84,158)JPMorgan 18,879Morgan Stanley 13,687
(55,038)
Franklin K2 Long Short Credit Fund
Purchases Sales MaturityDate
Unrealisedprofit/(loss)
USD
Forward foreign exchange contracts used for share class hedging:EUR 28,278,274 USD 33,338,391 16-Jul-18 (283,782)GBP 780,928 USD 1,044,275 16-Jul-18 (13,039)
(296,821)
Forward foreign exchange contracts used for efficient portfolio management:BRL 587,395 USD 160,611 03-Jul-18 (9,055)USD 155,890 BRL 587,394 03-Jul-18 4,334PEN 1,041,445 USD 317,680 05-Jul-18 (579)USD 318,047 PEN 1,041,445 05-Jul-18 946IDR 4,659,156,919 USD 334,782 06-Jul-18 (9,759)USD 331,518 IDR 4,659,156,919 06-Jul-18 6,495ARS 3,544,247 USD 126,693 10-Jul-18 (5,098)USD 134,971 ARS 3,544,246 10-Jul-18 13,375INR 22,262,861 USD 328,019 11-Jul-18 (3,386)USD 329,881 INR 22,262,861 11-Jul-18 5,248INR 16,851,091 USD 248,450 12-Jul-18 (2,760)USD 247,847 INR 16,851,091 12-Jul-18 2,157USD 248,206 INR 16,812,246 16-Jul-18 3,203INR 11,202,998 USD 163,404 19-Jul-18 (204)USD 164,002 INR 11,202,998 19-Jul-18 802USD 81,890 INR 5,602,513 20-Jul-18 285INR 5,639,424 USD 82,872 23-Jul-18 (759)USD 82,219 INR 5,639,424 23-Jul-18 107INR 11,639,081 USD 169,050 27-Jul-18 337USD 170,125 INR 11,639,081 27-Jul-18 738USD 174,383 KRW 194,559,313 27-Jul-18 (290)USD 173,867 INR 12,064,607 02-Aug-18 (1,583)USD 93,747 PEN 307,022 02-Aug-18 371USD 184,048 EGP 3,396,919 16-Aug-18 (3,142)USD 41,921 EGP 772,190 23-Aug-18 (541)CNH 911,394 USD 143,029 24-Aug-18 (5,911)TWD 4,874,228 USD 160,205 24-Aug-18 244USD 141,600 CNH 911,394 24-Aug-18 4,482USD 522,282 TWD 15,538,636 24-Aug-18 10,786USD 41,647 EGP 774,630 27-Aug-18 (898)USD 166,549 PEN 546,265 14-Sep-18 657CNH 1,038,195 EUR 137,922 19-Sep-18 (6,012)CNH 2,167,181 USD 331,716 19-Sep-18 (6,023)CZK 7,472,081 EUR 289,615 19-Sep-18 (2,910)EUR 133,859 CNH 1,038,195 19-Sep-18 1,238
FRANKLIN TEMPLETON INVESTMENT FUNDS
Notes to the Financial StatementsAt June 30, 2018 (continued)
Note 5 — Forward foreign exchange contracts (continued)
90 Audited Annual Report www.franklintempleton.lu
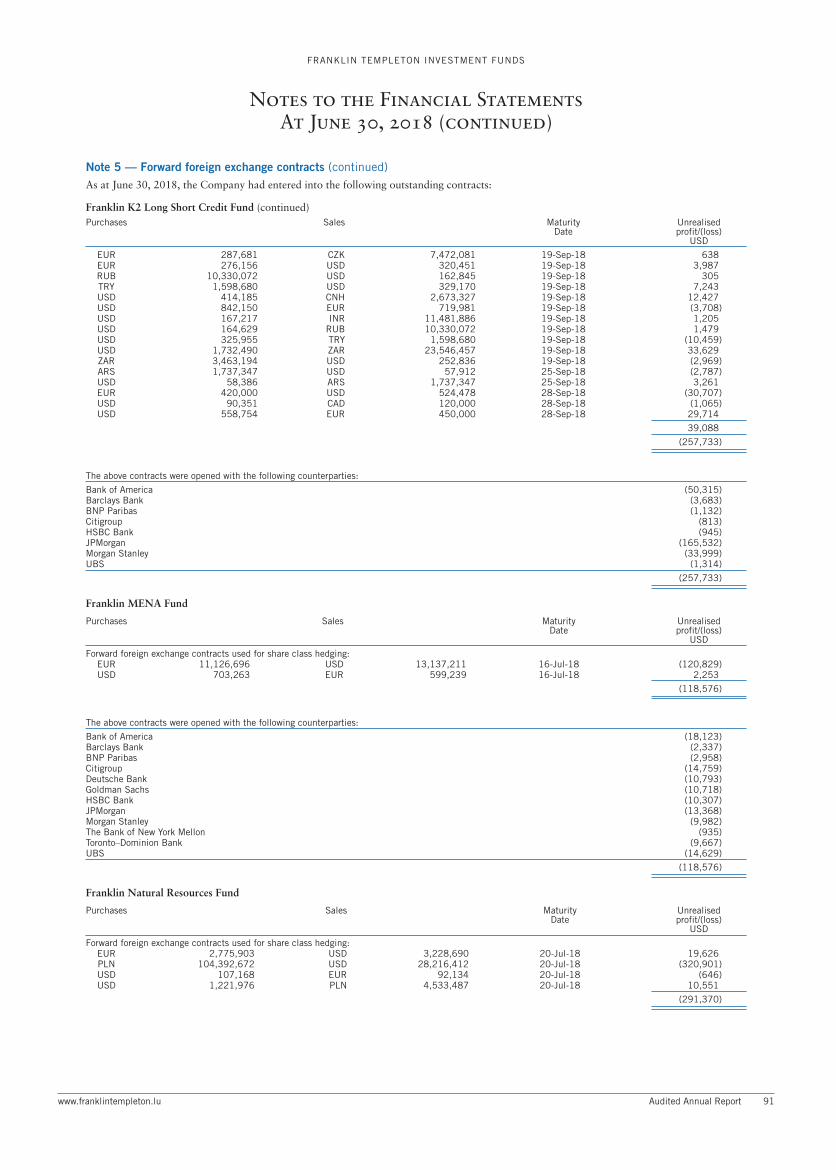
As at June 30, 2018, the Company had entered into the following outstanding contracts:
Franklin K2 Long Short Credit Fund (continued)Purchases Sales Maturity
DateUnrealisedprofit/(loss)
USD
EUR 287,681 CZK 7,472,081 19-Sep-18 638EUR 276,156 USD 320,451 19-Sep-18 3,987RUB 10,330,072 USD 162,845 19-Sep-18 305TRY 1,598,680 USD 329,170 19-Sep-18 7,243USD 414,185 CNH 2,673,327 19-Sep-18 12,427USD 842,150 EUR 719,981 19-Sep-18 (3,708)USD 167,217 INR 11,481,886 19-Sep-18 1,205USD 164,629 RUB 10,330,072 19-Sep-18 1,479USD 325,955 TRY 1,598,680 19-Sep-18 (10,459)USD 1,732,490 ZAR 23,546,457 19-Sep-18 33,629ZAR 3,463,194 USD 252,836 19-Sep-18 (2,969)ARS 1,737,347 USD 57,912 25-Sep-18 (2,787)USD 58,386 ARS 1,737,347 25-Sep-18 3,261EUR 420,000 USD 524,478 28-Sep-18 (30,707)USD 90,351 CAD 120,000 28-Sep-18 (1,065)USD 558,754 EUR 450,000 28-Sep-18 29,714
39,088
(257,733)
The above contracts were opened with the following counterparties:
Bank of America (50,315)Barclays Bank (3,683)BNP Paribas (1,132)Citigroup (813)HSBC Bank (945)JPMorgan (165,532)Morgan Stanley (33,999)UBS (1,314)
(257,733)
Franklin MENA Fund
Purchases Sales MaturityDate
Unrealisedprofit/(loss)
USD
Forward foreign exchange contracts used for share class hedging:EUR 11,126,696 USD 13,137,211 16-Jul-18 (120,829)USD 703,263 EUR 599,239 16-Jul-18 2,253
(118,576)
The above contracts were opened with the following counterparties:
Bank of America (18,123)Barclays Bank (2,337)BNP Paribas (2,958)Citigroup (14,759)Deutsche Bank (10,793)Goldman Sachs (10,718)HSBC Bank (10,307)JPMorgan (13,368)Morgan Stanley (9,982)The Bank of New York Mellon (935)Toronto–Dominion Bank (9,667)UBS (14,629)
(118,576)
Franklin Natural Resources Fund
Purchases Sales MaturityDate
Unrealisedprofit/(loss)
USD
Forward foreign exchange contracts used for share class hedging:EUR 2,775,903 USD 3,228,690 20-Jul-18 19,626PLN 104,392,672 USD 28,216,412 20-Jul-18 (320,901)USD 107,168 EUR 92,134 20-Jul-18 (646)USD 1,221,976 PLN 4,533,487 20-Jul-18 10,551
(291,370)
FRANKLIN TEMPLETON INVESTMENT FUNDS
Notes to the Financial StatementsAt June 30, 2018 (continued)
Note 5 — Forward foreign exchange contracts (continued)
www.franklintempleton.lu Audited Annual Report 91

As at June 30, 2018, the Company had entered into the following outstanding contracts:
Franklin Natural Resources Fund (continued)Unrealisedprofit/(loss)
USD
The above contracts were opened with the following counterparties:
Bank of America (30,979)Barclays Bank (20,881)BNP Paribas (24,639)Citigroup (21,597)Credit Suisse International (25,211)Deutsche Bank (35,416)Goldman Sachs (32,529)HSBC Bank (28,413)JPMorgan (27,664)Morgan Stanley (33,686)The Bank of New York Mellon (179)Toronto–Dominion Bank 629UBS (10,805)
(291,370)
Franklin NextStep Balanced Growth Fund
Purchases Sales MaturityDate
Unrealisedprofit/(loss)
USD
Forward foreign exchange contracts used for share class hedging:CNH 624,681 USD 97,000 10-Jul-18 (2,885)SGD 5,826,197 USD 4,377,437 10-Jul-18 (100,256)USD 2,000 CNH 13,214 10-Jul-18 9USD 439,179 SGD 591,091 10-Jul-18 5,241
(97,891)
Forward foreign exchange contracts used for efficient portfolio management:USD 12,597,521 EUR 10,668,000 22-Aug-18 81,697
(16,194)
The above contracts were opened with the following counterparties:
Bank of America 73,907Barclays Bank (3,565)BNP Paribas (886)Citigroup (11,500)Goldman Sachs (9,489)HSBC Bank (5,729)JPMorgan (26,585)Morgan Stanley (25,857)UBS (6,490)
(16,194)
Franklin NextStep Conservative Fund
Purchases Sales MaturityDate
Unrealisedprofit/(loss)
USD
Forward foreign exchange contracts used for share class hedging:EUR 3,946,008 USD 4,590,976 20-Jul-18 26,574GBP 2,068,829 USD 2,742,420 20-Jul-18 (7,636)PLN 75,083,694 USD 20,304,001 20-Jul-18 (240,351)USD 1,025,708 PLN 3,848,571 20-Jul-18 (2,696)
(224,109)
Forward foreign exchange contracts used for efficient portfolio management:USD 2,728,990 EUR 2,311,000 22-Aug-18 17,698
(206,411)
FRANKLIN TEMPLETON INVESTMENT FUNDS
Notes to the Financial StatementsAt June 30, 2018 (continued)
Note 5 — Forward foreign exchange contracts (continued)
92 Audited Annual Report www.franklintempleton.lu

As at June 30, 2018, the Company had entered into the following outstanding contracts:
Franklin NextStep Conservative Fund (continued)Unrealisedprofit/(loss)
USD
The above contracts were opened with the following counterparties:
Bank of America (5,877)BNP Paribas (9,102)Citigroup (23,574)Deutsche Bank (3,853)Goldman Sachs (9,127)HSBC Bank (14,533)JPMorgan (86,225)Morgan Stanley (54,358)Toronto–Dominion Bank 590UBS (352)
(206,411)
Franklin NextStep Dynamic Growth Fund
Purchases Sales MaturityDate
Unrealisedprofit/(loss)
USD
Forward foreign exchange contracts used for share class hedging:CNH 624,849 USD 97,000 16-Jul-18 (2,879)SGD 3,182,138 USD 2,383,342 16-Jul-18 (46,970)USD 1,996 CNH 13,150 16-Jul-18 15USD 52,019 SGD 70,867 16-Jul-18 (12)
(49,846)
Forward foreign exchange contracts used for efficient portfolio management:USD 2,517,615 EUR 2,132,000 22-Aug-18 16,327
(33,519)
The above contracts were opened with the following counterparties:
Bank of America 10,267BNP Paribas (2,680)Citigroup (2,851)Deutsche Bank (140)Goldman Sachs (4,355)HSBC Bank (6,374)JPMorgan (10,588)Morgan Stanley (12,377)Toronto–Dominion Bank (767)UBS (3,654)
(33,519)
Franklin NextStep Growth Fund
Purchases Sales MaturityDate
Unrealisedprofit/(loss)
USD
Forward foreign exchange contracts used for share class hedging:EUR 265,446 USD 308,754 20-Jul-18 1,867GBP 2,669,527 USD 3,540,083 20-Jul-18 (11,240)PLN 9,099,270 USD 2,460,170 20-Jul-18 (28,689)USD 7,016 EUR 6,000 20-Jul-18 (4)USD 74,864 GBP 56,799 20-Jul-18 (218)USD 60,531 PLN 228,222 20-Jul-18 (454)
(38,738)
Forward foreign exchange contracts used for efficient portfolio management:USD 1,204,487 EUR 1,020,000 22-Aug-18 7,811
(30,927)
FRANKLIN TEMPLETON INVESTMENT FUNDS
Notes to the Financial StatementsAt June 30, 2018 (continued)
Note 5 — Forward foreign exchange contracts (continued)
www.franklintempleton.lu Audited Annual Report 93

As at June 30, 2018, the Company had entered into the following outstanding contracts:
Franklin NextStep Growth Fund (continued)Unrealisedprofit/(loss)
USD
The above contracts were opened with the following counterparties:
Bank of America 1,779Barclays Bank (198)BNP Paribas (3,373)Citigroup (2,993)Credit Suisse International (264)Deutsche Bank (776)Goldman Sachs (2,761)HSBC Bank (878)JPMorgan (10,823)Morgan Stanley (10,357)UBS (283)
(30,927)
Franklin NextStep Moderate Fund
Purchases Sales MaturityDate
Unrealisedprofit/(loss)
USD
Forward foreign exchange contracts used for share class hedging:EUR 3,799,664 USD 4,486,153 16-Jul-18 (41,180)GBP 3,112,263 USD 4,160,946 16-Jul-18 (47,620)PLN 114,257,539 USD 31,505,455 16-Jul-18 (975,551)
(1,064,351)
Forward foreign exchange contracts used for efficient portfolio management:USD 4,104,704 EUR 3,476,000 22-Aug-18 26,620
(1,037,731)
The above contracts were opened with the following counterparties:
Bank of America (159,357)Barclays Bank (30,183)BNP Paribas (48,358)Citigroup (52,354)Deutsche Bank (13,664)Goldman Sachs (34,446)HSBC Bank (34,879)JPMorgan (380,400)Morgan Stanley (267,369)Toronto–Dominion Bank (15,714)UBS (1,007)
(1,037,731)
Franklin NextStep Stable Growth Fund
Purchases Sales MaturityDate
Unrealisedprofit/(loss)
USD
Forward foreign exchange contracts used for share class hedging:SGD 2,965,581 USD 2,228,203 10-Jul-18 (51,083)USD 60,048 SGD 81,055 10-Jul-18 543
(50,540)
Forward foreign exchange contracts used for efficient portfolio management:USD 1,629,601 EUR 1,380,000 22-Aug-18 10,568
(39,972)
The above contracts were opened with the following counterparties:
Bank of America (553)BNP Paribas (859)Citigroup (5,167)Credit Suisse International (329)Goldman Sachs (5,514)HSBC Bank (2,226)JPMorgan (9,037)Morgan Stanley (16,003)UBS (284)
(39,972)
FRANKLIN TEMPLETON INVESTMENT FUNDS
Notes to the Financial StatementsAt June 30, 2018 (continued)
Note 5 — Forward foreign exchange contracts (continued)
94 Audited Annual Report www.franklintempleton.lu
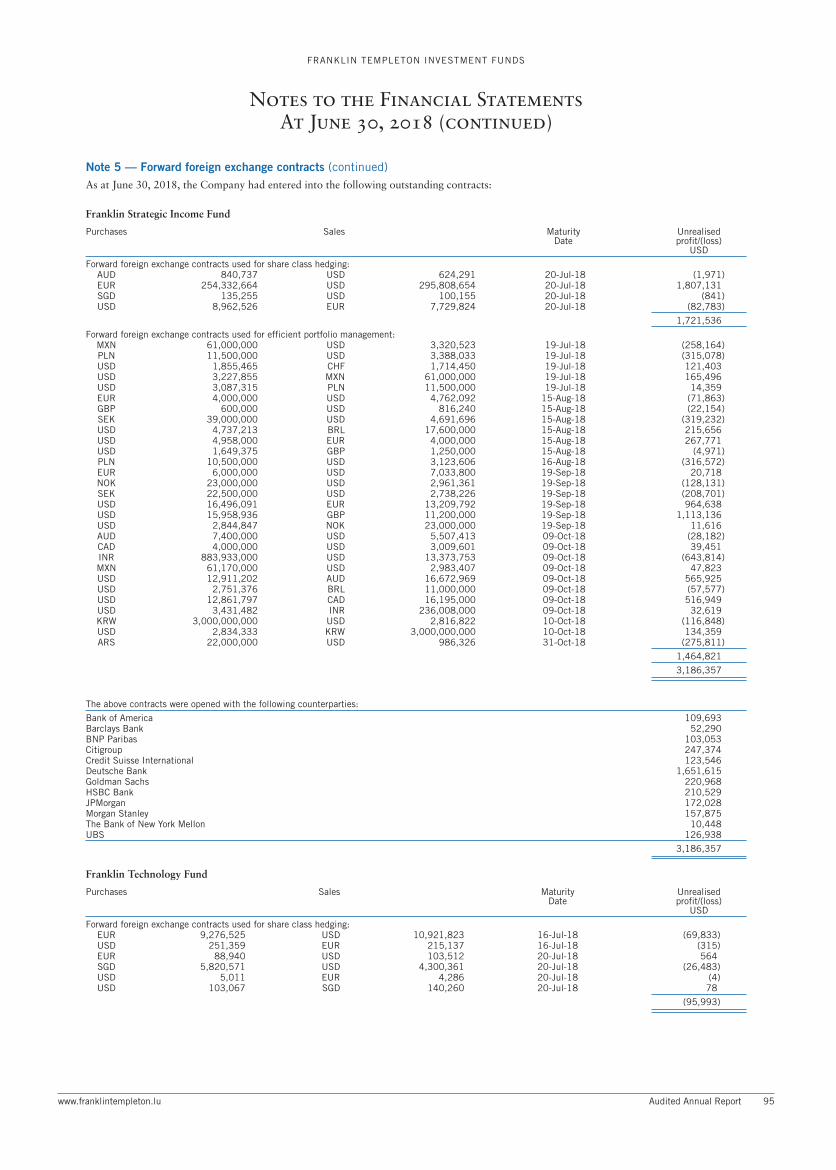
As at June 30, 2018, the Company had entered into the following outstanding contracts:
Franklin Strategic Income Fund
Purchases Sales MaturityDate
Unrealisedprofit/(loss)
USD
Forward foreign exchange contracts used for share class hedging:AUD 840,737 USD 624,291 20-Jul-18 (1,971)EUR 254,332,664 USD 295,808,654 20-Jul-18 1,807,131SGD 135,255 USD 100,155 20-Jul-18 (841)USD 8,962,526 EUR 7,729,824 20-Jul-18 (82,783)
1,721,536
Forward foreign exchange contracts used for efficient portfolio management:MXN 61,000,000 USD 3,320,523 19-Jul-18 (258,164)PLN 11,500,000 USD 3,388,033 19-Jul-18 (315,078)USD 1,855,465 CHF 1,714,450 19-Jul-18 121,403USD 3,227,855 MXN 61,000,000 19-Jul-18 165,496USD 3,087,315 PLN 11,500,000 19-Jul-18 14,359EUR 4,000,000 USD 4,762,092 15-Aug-18 (71,863)GBP 600,000 USD 816,240 15-Aug-18 (22,154)SEK 39,000,000 USD 4,691,696 15-Aug-18 (319,232)USD 4,737,213 BRL 17,600,000 15-Aug-18 215,656USD 4,958,000 EUR 4,000,000 15-Aug-18 267,771USD 1,649,375 GBP 1,250,000 15-Aug-18 (4,971)PLN 10,500,000 USD 3,123,606 16-Aug-18 (316,572)EUR 6,000,000 USD 7,033,800 19-Sep-18 20,718NOK 23,000,000 USD 2,961,361 19-Sep-18 (128,131)SEK 22,500,000 USD 2,738,226 19-Sep-18 (208,701)USD 16,496,091 EUR 13,209,792 19-Sep-18 964,638USD 15,958,936 GBP 11,200,000 19-Sep-18 1,113,136USD 2,844,847 NOK 23,000,000 19-Sep-18 11,616AUD 7,400,000 USD 5,507,413 09-Oct-18 (28,182)CAD 4,000,000 USD 3,009,601 09-Oct-18 39,451INR 883,933,000 USD 13,373,753 09-Oct-18 (643,814)MXN 61,170,000 USD 2,983,407 09-Oct-18 47,823USD 12,911,202 AUD 16,672,969 09-Oct-18 565,925USD 2,751,376 BRL 11,000,000 09-Oct-18 (57,577)USD 12,861,797 CAD 16,195,000 09-Oct-18 516,949USD 3,431,482 INR 236,008,000 09-Oct-18 32,619KRW 3,000,000,000 USD 2,816,822 10-Oct-18 (116,848)USD 2,834,333 KRW 3,000,000,000 10-Oct-18 134,359ARS 22,000,000 USD 986,326 31-Oct-18 (275,811)
1,464,821
3,186,357
The above contracts were opened with the following counterparties:
Bank of America 109,693Barclays Bank 52,290BNP Paribas 103,053Citigroup 247,374Credit Suisse International 123,546Deutsche Bank 1,651,615Goldman Sachs 220,968HSBC Bank 210,529JPMorgan 172,028Morgan Stanley 157,875The Bank of New York Mellon 10,448UBS 126,938
3,186,357
Franklin Technology Fund
Purchases Sales MaturityDate
Unrealisedprofit/(loss)
USD
Forward foreign exchange contracts used for share class hedging:EUR 9,276,525 USD 10,921,823 16-Jul-18 (69,833)USD 251,359 EUR 215,137 16-Jul-18 (315)EUR 88,940 USD 103,512 20-Jul-18 564SGD 5,820,571 USD 4,300,361 20-Jul-18 (26,483)USD 5,011 EUR 4,286 20-Jul-18 (4)USD 103,067 SGD 140,260 20-Jul-18 78
(95,993)
FRANKLIN TEMPLETON INVESTMENT FUNDS
Notes to the Financial StatementsAt June 30, 2018 (continued)
Note 5 — Forward foreign exchange contracts (continued)
www.franklintempleton.lu Audited Annual Report 95

As at June 30, 2018, the Company had entered into the following outstanding contracts:
Franklin Technology Fund (continued)Unrealisedprofit/(loss)
USD
The above contracts were opened with the following counterparties:
Bank of America (18,546)Barclays Bank (631)Citigroup (8,862)Deutsche Bank (2,476)Goldman Sachs (3,961)HSBC Bank (343)JPMorgan (33,790)Morgan Stanley (24,343)UBS (3,041)
(95,993)
Franklin U.S. Equity Fund
Purchases Sales MaturityDate
Unrealisedprofit/(loss)
USD
Forward foreign exchange contracts used for share class hedging:EUR 18,809,632 USD 21,877,254 20-Jul-18 133,462USD 10,405,866 EUR 8,941,406 20-Jul-18 (57,218)
76,244
The above contracts were opened with the following counterparties:
Bank of America 12,463Barclays Bank 6,695BNP Paribas 13,480Citigroup 19,587Credit Suisse International 15,570Deutsche Bank 993Goldman Sachs 19,011HSBC Bank 17,117JPMorgan 7,334Morgan Stanley (42,128)The Bank of New York Mellon 173UBS 5,949
76,244
Franklin U.S. Government Fund
Purchases Sales MaturityDate
Unrealisedprofit/(loss)
USD
Forward foreign exchange contracts used for share class hedging:EUR 13,840,072 USD 16,414,201 10-Jul-18 (230,874)JPY 27,327,044 USD 248,916 10-Jul-18 (1,861)USD 4,410,621 EUR 3,790,281 10-Jul-18 (21,391)
(254,126)
The above contracts were opened with the following counterparties:
Bank of America (25,618)BNP Paribas (46,949)Credit Suisse International (23,161)Deutsche Bank (21,887)JPMorgan (53,156)Morgan Stanley (637)UBS (82,718)
(254,126)
FRANKLIN TEMPLETON INVESTMENT FUNDS
Notes to the Financial StatementsAt June 30, 2018 (continued)
Note 5 — Forward foreign exchange contracts (continued)
96 Audited Annual Report www.franklintempleton.lu

As at June 30, 2018, the Company had entered into the following outstanding contracts:
Franklin U.S. Low Duration Fund
Purchases Sales MaturityDate
Unrealisedprofit/(loss)
USD
Forward foreign exchange contracts used for share class hedging:EUR 119,934,383 USD 142,239,658 10-Jul-18 (1,999,246)
Forward foreign exchange contracts used for efficient portfolio management:EUR 2,546,000 USD 3,066,963 19-Sep-18 (73,495)PLN 3,210,000 USD 948,904 19-Sep-18 (90,223)SEK 11,920,000 USD 1,450,651 19-Sep-18 (110,565)USD 18,707,581 EUR 14,979,718 19-Sep-18 1,095,131AUD 1,878,833 USD 1,398,197 09-Oct-18 (7,040)IDR 12,400,000,000 USD 887,172 09-Oct-18 (34,196)INR 197,335,000 USD 2,986,179 09-Oct-18 (144,264)MXN 70,400,000 USD 3,746,016 09-Oct-18 (257,401)USD 1,459,368 AUD 1,878,833 09-Oct-18 68,211USD 795,767 CAD 1,000,000 09-Oct-18 33,504USD 863,209 IDR 12,400,000,000 09-Oct-18 10,233USD 1,628,330 INR 112,000,000 09-Oct-18 15,364USD 1,336,819 MXN 24,900,000 09-Oct-18 102,920EUR 3,600,000 USD 4,391,244 28-Feb-19 (100,117)USD 11,404,630 EUR 10,300,000 28-Feb-19 (872,761)USD 1,961,850 EUR 1,650,000 03-Jul-19 (26,717)
(391,416)
(2,390,662)
The above contracts were opened with the following counterparties:
Bank of America (352,419)BNP Paribas (123,188)Citigroup (242,331)Deutsche Bank 280,864Goldman Sachs (319,345)HSBC Bank (115,423)JPMorgan (889,776)Morgan Stanley (539,067)UBS (89,977)
(2,390,662)
Franklin U.S. Opportunities Fund
Purchases Sales MaturityDate
Unrealisedprofit/(loss)
USD
Forward foreign exchange contracts used for share class hedging:CHF 3,616,564 USD 3,646,793 20-Jul-18 11,457CNH 1,297,227 USD 200,486 20-Jul-18 (5,111)EUR 236,694,455 USD 275,339,588 20-Jul-18 1,636,269NOK 43,664,297 USD 5,368,188 20-Jul-18 (2,687)PLN 166,110,053 USD 44,918,081 20-Jul-18 (530,624)SEK 49,517,064 USD 5,624,541 20-Jul-18 (84,349)SGD 31,224,786 USD 23,124,279 20-Jul-18 (196,813)USD 86,228 CHF 85,110 20-Jul-18 137USD 5,000 CNH 33,163 20-Jul-18 5USD 6,032,255 EUR 5,177,463 20-Jul-18 (26,326)USD 165,222 NOK 1,340,064 20-Jul-18 554USD 145,230 SEK 1,284,751 20-Jul-18 1,486USD 715,511 SGD 973,651 20-Jul-18 586
804,584
FRANKLIN TEMPLETON INVESTMENT FUNDS
Notes to the Financial StatementsAt June 30, 2018 (continued)
Note 5 — Forward foreign exchange contracts (continued)
www.franklintempleton.lu Audited Annual Report 97

As at June 30, 2018, the Company had entered into the following outstanding contracts:
Franklin U.S. Opportunities Fund (continued)Unrealisedprofit/(loss)
USD
The above contracts were opened with the following counterparties:
Bank of America 214,386Barclays Bank 122,201BNP Paribas 29,015Citigroup 36,145Credit Suisse International (8,587)Deutsche Bank (27,986)Goldman Sachs 58,382HSBC Bank (1,036)JPMorgan 123,586Morgan Stanley 146,123The Bank of New York Mellon 18,702Toronto–Dominion Bank 1,604UBS 92,049
804,584
Franklin Mutual European Fund
Purchases Sales MaturityDate
Unrealisedprofit/(loss)
EUR
Forward foreign exchange contracts used for share class hedging:CNH 808,076 EUR 107,406 20-Jul-18 (3,400)CZK 404,714,361 EUR 15,694,609 20-Jul-18 (122,130)EUR 1,992 CNH 15,342 20-Jul-18 18EUR 739,507 CZK 19,142,403 20-Jul-18 2,952EUR 16,713,555 USD 19,457,907 20-Jul-18 85,484USD 76,617,483 EUR 65,869,767 20-Jul-18 (395,056)
(432,132)
The above contracts were opened with the following counterparties:
Bank of America (50,712)Barclays Bank (37,908)BNP Paribas (37,084)Citigroup (46,123)Credit Suisse International (20,129)Deutsche Bank (4,913)Goldman Sachs (38,807)HSBC Bank (40,930)JPMorgan (82,571)Morgan Stanley (45,502)The Bank of New York Mellon (5,180)UBS (22,273)
(432,132)
Franklin Mutual Global Discovery Fund
Purchases Sales MaturityDate
Unrealisedprofit/(loss)
USD
Forward foreign exchange contracts used for share class hedging:EUR 12,292,351 GBP 10,787,300 25-Jul-18 126,612EUR 75,508,310 USD 88,078,578 25-Jul-18 312,990USD 517,121 EUR 442,612 25-Jul-18 (1,010)
438,592
The above contracts were opened with the following counterparties:
Bank of America 358,038Barclays Bank 17Citigroup 21JPMorgan 51,837Morgan Stanley 28,679
438,592
FRANKLIN TEMPLETON INVESTMENT FUNDS
Notes to the Financial StatementsAt June 30, 2018 (continued)
Note 5 — Forward foreign exchange contracts (continued)
98 Audited Annual Report www.franklintempleton.lu

As at June 30, 2018, the Company had entered into the following outstanding contracts:
Franklin Mutual U.S. Value Fund
Purchases Sales MaturityDate
Unrealisedprofit/(loss)
USD
Forward foreign exchange contracts used for share class hedging:EUR 6,753,819 USD 7,974,088 16-Jul-18 (73,244)USD 324,097 EUR 279,288 16-Jul-18 (2,624)
(75,868)
The above contracts were opened with the following counterparties:
Bank of America (11,746)Barclays Bank (4,183)BNP Paribas (3,447)Citigroup (6,046)Deutsche Bank (3,926)Goldman Sachs (4,790)HSBC Bank (10,164)JPMorgan (8,229)Morgan Stanley (8,529)The Bank of New York Mellon (4,037)Toronto–Dominion Bank (5,473)UBS (5,298)
(75,868)
Templeton Africa Fund
Purchases Sales MaturityDate
Unrealisedprofit/(loss)
USD
Forward foreign exchange contracts used for share class hedging:EUR 23,387,548 USD 27,736,952 10-Jul-18 (389,668)USD 1,972,555 EUR 1,702,412 10-Jul-18 (18,093)
(407,761)
The above contracts were opened with the following counterparties:
Bank of America (54,312)Barclays Bank (10,179)BNP Paribas (9,009)Citigroup (55,107)Credit Suisse International (15,041)Deutsche Bank (28,219)Goldman Sachs (42,518)HSBC Bank (36,950)JPMorgan (45,477)Morgan Stanley (57,912)The Bank of New York Mellon (4,060)Toronto–Dominion Bank (3,811)UBS (45,166)
(407,761)
Templeton Asian Bond Fund
Purchases Sales MaturityDate
Unrealisedprofit/(loss)
USD
Forward foreign exchange contracts used for share class hedging:AUD 835,914 USD 621,599 20-Jul-18 (2,849)CHF 25,664,029 USD 25,871,707 20-Jul-18 88,145EUR 49,660,681 USD 57,756,356 20-Jul-18 355,732SGD 48,465,621 USD 35,888,432 20-Jul-18 (301,510)USD 556,294 CHF 550,695 20-Jul-18 (748)USD 26,808,763 EUR 23,050,313 20-Jul-18 (164,324)
(25,554)
Forward foreign exchange contracts used for efficient portfolio management:JPY 3,256,500,000 USD 29,535,272 03-Jul-18 (108,510)USD 29,407,382 JPY 3,256,500,000 03-Jul-18 (19,379)USD 2,299,632 JPY 256,041,000 11-Jul-18 (15,308)USD 7,424,023 AUD 9,708,032 12-Jul-18 238,279USD 2,483,683 JPY 273,980,000 12-Jul-18 6,380USD 8,409,909 JPY 893,700,000 13-Jul-18 328,599USD 7,899,818 JPY 870,560,000 17-Jul-18 25,586JPY 575,854,000 USD 5,226,674 23-Jul-18 (15,912)USD 5,242,567 JPY 575,854,000 23-Jul-18 31,805KRW 13,796,210,000 USD 12,300,473 24-Jul-18 76,695
FRANKLIN TEMPLETON INVESTMENT FUNDS
Notes to the Financial StatementsAt June 30, 2018 (continued)
Note 5 — Forward foreign exchange contracts (continued)
www.franklintempleton.lu Audited Annual Report 99

As at June 30, 2018, the Company had entered into the following outstanding contracts:
Templeton Asian Bond Fund (continued)Purchases Sales Maturity
DateUnrealisedprofit/(loss)
USD
USD 25,160,052 JPY 2,693,383,600 24-Jul-18 786,606USD 13,040,512 KRW 13,796,210,000 24-Jul-18 663,345USD 1,172,623 JPY 126,020,000 30-Jul-18 31,745USD 8,766,790 JPY 947,650,000 31-Jul-18 186,953USD 29,602,393 JPY 3,256,500,000 06-Aug-18 105,872USD 2,234,586 JPY 242,566,519 09-Aug-18 37,005USD 7,420,520 AUD 9,701,484 13-Aug-18 238,877USD 4,041,051 JPY 438,859,333 13-Aug-18 63,963USD 1,926,773 JPY 215,172,332 14-Aug-18 (23,331)USD 2,219,401 JPY 241,579,600 16-Aug-18 29,651USD 6,586,924 JPY 724,909,000 21-Aug-18 13,751USD 1,015,105 JPY 111,957,000 22-Aug-18 (148)USD 5,463,281 JPY 602,144,000 24-Aug-18 2,102JPY 835,512,500 USD 7,601,490 27-Aug-18 (22,114)USD 8,697,966 JPY 946,152,500 27-Aug-18 114,916USD 4,545,191 JPY 495,491,000 29-Aug-18 49,674KRW 8,359,000,000 USD 7,460,728 30-Aug-18 48,277USD 7,759,573 KRW 8,359,000,000 30-Aug-18 250,567USD 3,426,553 JPY 371,267,000 04-Sep-18 56,614KRW 2,700,000,000 USD 2,410,391 05-Sep-18 15,732USD 9,395,111 KRW 10,088,000,000 05-Sep-18 330,396USD 7,422,072 AUD 9,701,484 12-Sep-18 239,809USD 14,784,246 AUD 19,414,000 13-Sep-18 411,509USD 949,637 JPY 103,265,000 13-Sep-18 11,694JPY 238,281,000 USD 2,170,536 14-Sep-18 (6,100)USD 2,174,613 JPY 238,281,000 14-Sep-18 10,177USD 41,372,240 AUD 56,000,000 24-Sep-18 (87,541)USD 4,409,987 JPY 482,629,000 25-Sep-18 22,451JPY 790,000,000 USD 7,203,199 28-Sep-18 (19,720)USD 14,492,887 JPY 1,580,244,500 28-Sep-18 123,706USD 12,062,462 JPY 1,261,830,000 05-Oct-18 581,883USD 376,414 KRW 415,335,782 29-Oct-18 2,307USD 1,209,172 KRW 1,292,000,000 30-Oct-18 45,370USD 11,961,409 KRW 12,770,000,000 19-Nov-18 448,486USD 10,149,393 KRW 10,904,000,000 07-Dec-18 311,064USD 20,540,464 KRW 21,815,000,000 11-Dec-18 854,057USD 3,188,145 JPY 347,994,000 18-Dec-18 2,174USD 9,806,100 JPY 1,061,020,000 22-Jan-19 64,753USD 10,808,147 JPY 1,169,030,000 24-Jan-19 73,440USD 4,082,436 JPY 434,657,000 31-Jan-19 88,941USD 9,908,989 JPY 1,065,900,000 06-Feb-19 111,147USD 2,031,029 JPY 215,172,335 14-Feb-19 51,887
6,870,182
6,844,628
The above contracts were opened with the following counterparties:
Bank of America 11,096Barclays Bank 248,450BNP Paribas 55,821Citigroup 1,514,702Credit Suisse International 53,562Deutsche Bank 1,410,994Goldman Sachs 394,316HSBC Bank 1,710,224JPMorgan 687,759Morgan Stanley 16,441Standard Chartered 677,699The Bank of New York Mellon 13,154Toronto–Dominion Bank (76)UBS 50,486
6,844,628
Templeton Asian Growth Fund
Purchases Sales MaturityDate
Unrealisedprofit/(loss)
USD
Forward foreign exchange contracts used for share class hedging:EUR 1,531,422 PKR 225,103,700 03-Jul-18 (59,186)PKR 7,001,100 EUR 49,041 03-Jul-18 191CHF 12,775,778 USD 12,998,751 16-Jul-18 (80,177)CNH 16,544,605 USD 2,584,151 16-Jul-18 (92,029)CZK 208,766,502 USD 9,576,114 16-Jul-18 (177,979)
FRANKLIN TEMPLETON INVESTMENT FUNDS
Notes to the Financial StatementsAt June 30, 2018 (continued)
Note 5 — Forward foreign exchange contracts (continued)
100 Audited Annual Report www.franklintempleton.lu

As at June 30, 2018, the Company had entered into the following outstanding contracts:
Templeton Asian Growth Fund (continued)Purchases Sales Maturity
DateUnrealisedprofit/(loss)
USD
EUR 148,032,586 USD 174,729,326 16-Jul-18 (1,555,855)PLN 65,221,019 USD 17,985,746 16-Jul-18 (558,525)SGD 1,290,062 USD 966,217 16-Jul-18 (19,033)USD 1,098,637 CHF 1,090,613 16-Jul-18 (4,164)USD 270,569 CNH 1,777,031 16-Jul-18 2,894USD 775,583 CZK 17,257,777 16-Jul-18 (1,318)USD 15,262,695 EUR 13,143,499 16-Jul-18 (113,011)USD 2,013,167 PLN 7,488,055 16-Jul-18 12,340USD 226,237 SGD 307,100 16-Jul-18 760EUR 8,184,588 HKD 74,323,200 25-Jul-18 104,666EUR 4,208,404 IDR 69,974,704,900 25-Jul-18 50,723EUR 2,542,613 INR 201,896,200 25-Jul-18 38,407EUR 4,548,878 KRW 5,828,022,000 25-Jul-18 96,301EUR 3,775,540 THB 144,140,300 25-Jul-18 53,040EUR 2,618,351 TWD 91,500,900 25-Jul-18 56,659EUR 4,652,958 USD 5,385,400 25-Jul-18 61,447HKD 4,139,700 EUR 452,861 25-Jul-18 (2,308)IDR 2,771,018,900 EUR 167,383 25-Jul-18 (2,862)THB 3,055,700 EUR 79,193 25-Jul-18 (133)TWD 3,120,800 EUR 87,781 25-Jul-18 (151)USD 347,700 EUR 298,369 25-Jul-18 (1,577)
(2,190,880)
The above contracts were opened with the following counterparties:
Bank of America (53,038)Barclays Bank (152,428)BNP Paribas (178,980)Citigroup (61,584)Deutsche Bank (191,818)Goldman Sachs (219,322)HSBC Bank (263,437)JPMorgan (253,403)Morgan Stanley (218,292)The Bank of New York Mellon (203,700)Toronto–Dominion Bank (219,584)UBS (175,294)
(2,190,880)
Templeton Asian Smaller Companies Fund
Purchases Sales MaturityDate
Unrealisedprofit/(loss)
USD
Forward foreign exchange contracts used for share class hedging:EUR 75,622 USD 89,283 16-Jul-18 (819)USD 6,009 EUR 5,186 16-Jul-18 (57)
(876)
The above contracts were opened with the following counterparties:
Bank of America (19)Citigroup (26)Deutsche Bank (17)JPMorgan (18)Morgan Stanley (796)
(876)
Templeton BRIC Fund
Purchases Sales MaturityDate
Unrealisedprofit/(loss)
USD
Forward foreign exchange contracts used for share class hedging:EUR 19,483,905 USD 23,108,301 10-Jul-18 (325,584)USD 4,190,087 EUR 3,599,345 10-Jul-18 (18,664)
(344,248)
FRANKLIN TEMPLETON INVESTMENT FUNDS
Notes to the Financial StatementsAt June 30, 2018 (continued)
Note 5 — Forward foreign exchange contracts (continued)
www.franklintempleton.lu Audited Annual Report 101

As at June 30, 2018, the Company had entered into the following outstanding contracts:
Templeton BRIC Fund (continued)Unrealisedprofit/(loss)
USD
The above contracts were opened with the following counterparties:
Bank of America (71,731)Barclays Bank (17,325)Citigroup (21,840)Credit Suisse International (704)Deutsche Bank (25,935)Goldman Sachs (10,939)HSBC Bank (38,028)JPMorgan (65,647)Morgan Stanley (63,663)The Bank of New York Mellon (1,115)UBS (27,321)
(344,248)
Templeton Emerging Markets Fund
Purchases Sales MaturityDate
Unrealisedprofit/(loss)
USD
Forward foreign exchange contracts used for share class hedging:EUR 22,862,337 USD 26,992,149 16-Jul-18 (247,023)USD 10,692,732 EUR 9,195,205 16-Jul-18 (64,125)
(311,148)
The above contracts were opened with the following counterparties:
Bank of America (40,770)Barclays Bank (959)BNP Paribas (13,518)Citigroup (23,762)Deutsche Bank (12,051)Goldman Sachs (3,431)HSBC Bank (24,641)JPMorgan (85,475)Morgan Stanley (87,268)The Bank of New York Mellon (1,459)Toronto–Dominion Bank (3,023)UBS (14,791)
(311,148)
Templeton Emerging Markets Balanced Fund
Purchases Sales MaturityDate
Unrealisedprofit/(loss)
USD
Forward foreign exchange contracts used for share class hedging:EUR 30,743,482 USD 35,763,751 20-Jul-18 211,752SGD 126,667 USD 93,815 20-Jul-18 (807)USD 1,389,947 EUR 1,195,402 20-Jul-18 (8,892)USD 3,999 SGD 5,436 20-Jul-18 8
202,061
Forward foreign exchange contracts used for efficient portfolio management:USD 50,205 EUR 42,895 05-Jul-18 65USD 26,151 EUR 21,100 06-Jul-18 1,486USD 24,715 EUR 20,500 09-Jul-18 746USD 120,627 AUD 157,738 12-Jul-18 3,872USD 980,327 EUR 787,775 12-Jul-18 59,036USD 16,592 EUR 13,323 13-Jul-18 1,010USD 80,852 EUR 68,442 16-Jul-18 787USD 7,274 EUR 6,230 19-Jul-18 (16)USD 169,696 EUR 146,230 23-Jul-18 (1,459)USD 138,802 EUR 119,500 25-Jul-18 (1,087)USD 47,906 EUR 40,957 30-Jul-18 (58)USD 1,785,702 JPY 191,963,000 30-Jul-18 47,833USD 80,992 EUR 66,000 31-Jul-18 3,696USD 1,769,244 JPY 191,963,000 31-Jul-18 31,249USD 120,570 AUD 157,631 13-Aug-18 3,881USD 15,143 EUR 12,700 17-Aug-18 250USD 125,566 EUR 105,875 20-Aug-18 1,372USD 208,956 EUR 175,757 21-Aug-18 2,773USD 14,748 EUR 12,460 23-Aug-18 128USD 442,392 EUR 373,000 24-Aug-18 4,715USD 220,988 AUD 292,000 29-Aug-18 4,822
FRANKLIN TEMPLETON INVESTMENT FUNDS
Notes to the Financial StatementsAt June 30, 2018 (continued)
Note 5 — Forward foreign exchange contracts (continued)
102 Audited Annual Report www.franklintempleton.lu
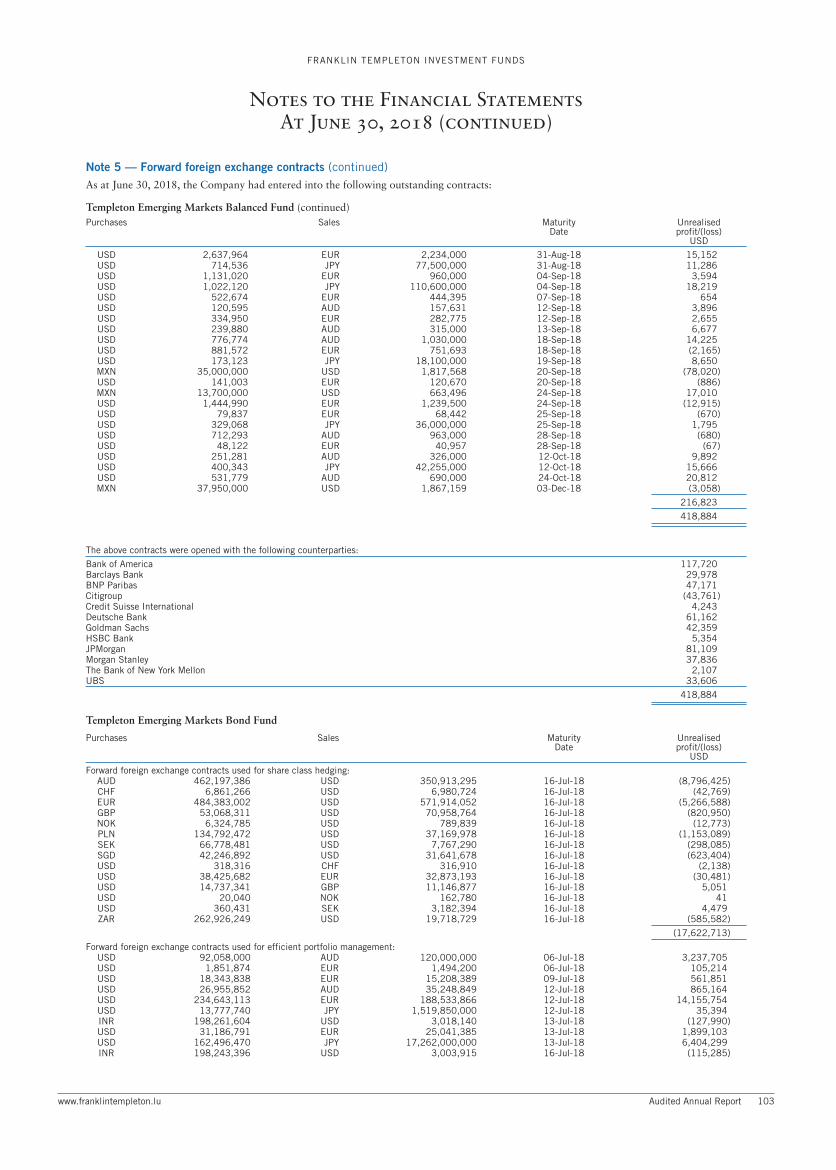
As at June 30, 2018, the Company had entered into the following outstanding contracts:
Templeton Emerging Markets Balanced Fund (continued)Purchases Sales Maturity
DateUnrealisedprofit/(loss)
USD
USD 2,637,964 EUR 2,234,000 31-Aug-18 15,152USD 714,536 JPY 77,500,000 31-Aug-18 11,286USD 1,131,020 EUR 960,000 04-Sep-18 3,594USD 1,022,120 JPY 110,600,000 04-Sep-18 18,219USD 522,674 EUR 444,395 07-Sep-18 654USD 120,595 AUD 157,631 12-Sep-18 3,896USD 334,950 EUR 282,775 12-Sep-18 2,655USD 239,880 AUD 315,000 13-Sep-18 6,677USD 776,774 AUD 1,030,000 18-Sep-18 14,225USD 881,572 EUR 751,693 18-Sep-18 (2,165)USD 173,123 JPY 18,100,000 19-Sep-18 8,650MXN 35,000,000 USD 1,817,568 20-Sep-18 (78,020)USD 141,003 EUR 120,670 20-Sep-18 (886)MXN 13,700,000 USD 663,496 24-Sep-18 17,010USD 1,444,990 EUR 1,239,500 24-Sep-18 (12,915)USD 79,837 EUR 68,442 25-Sep-18 (670)USD 329,068 JPY 36,000,000 25-Sep-18 1,795USD 712,293 AUD 963,000 28-Sep-18 (680)USD 48,122 EUR 40,957 28-Sep-18 (67)USD 251,281 AUD 326,000 12-Oct-18 9,892USD 400,343 JPY 42,255,000 12-Oct-18 15,666USD 531,779 AUD 690,000 24-Oct-18 20,812MXN 37,950,000 USD 1,867,159 03-Dec-18 (3,058)
216,823
418,884
The above contracts were opened with the following counterparties:
Bank of America 117,720Barclays Bank 29,978BNP Paribas 47,171Citigroup (43,761)Credit Suisse International 4,243Deutsche Bank 61,162Goldman Sachs 42,359HSBC Bank 5,354JPMorgan 81,109Morgan Stanley 37,836The Bank of New York Mellon 2,107UBS 33,606
418,884
Templeton Emerging Markets Bond Fund
Purchases Sales MaturityDate
Unrealisedprofit/(loss)
USD
Forward foreign exchange contracts used for share class hedging:AUD 462,197,386 USD 350,913,295 16-Jul-18 (8,796,425)CHF 6,861,266 USD 6,980,724 16-Jul-18 (42,769)EUR 484,383,002 USD 571,914,052 16-Jul-18 (5,266,588)GBP 53,068,311 USD 70,958,764 16-Jul-18 (820,950)NOK 6,324,785 USD 789,839 16-Jul-18 (12,773)PLN 134,792,472 USD 37,169,978 16-Jul-18 (1,153,089)SEK 66,778,481 USD 7,767,290 16-Jul-18 (298,085)SGD 42,246,892 USD 31,641,678 16-Jul-18 (623,404)USD 318,316 CHF 316,910 16-Jul-18 (2,138)USD 38,425,682 EUR 32,873,193 16-Jul-18 (30,481)USD 14,737,341 GBP 11,146,877 16-Jul-18 5,051USD 20,040 NOK 162,780 16-Jul-18 41USD 360,431 SEK 3,182,394 16-Jul-18 4,479ZAR 262,926,249 USD 19,718,729 16-Jul-18 (585,582)
(17,622,713)
Forward foreign exchange contracts used for efficient portfolio management:USD 92,058,000 AUD 120,000,000 06-Jul-18 3,237,705USD 1,851,874 EUR 1,494,200 06-Jul-18 105,214USD 18,343,838 EUR 15,208,389 09-Jul-18 561,851USD 26,955,852 AUD 35,248,849 12-Jul-18 865,164USD 234,643,113 EUR 188,533,866 12-Jul-18 14,155,754USD 13,777,740 JPY 1,519,850,000 12-Jul-18 35,394INR 198,261,604 USD 3,018,140 13-Jul-18 (127,990)USD 31,186,791 EUR 25,041,385 13-Jul-18 1,899,103USD 162,496,470 JPY 17,262,000,000 13-Jul-18 6,404,299INR 198,243,396 USD 3,003,915 16-Jul-18 (115,285)
FRANKLIN TEMPLETON INVESTMENT FUNDS
Notes to the Financial StatementsAt June 30, 2018 (continued)
Note 5 — Forward foreign exchange contracts (continued)
www.franklintempleton.lu Audited Annual Report 103

As at June 30, 2018, the Company had entered into the following outstanding contracts:
Templeton Emerging Markets Bond Fund (continued)Purchases Sales Maturity
DateUnrealisedprofit/(loss)
USD
USD 28,173,132 EUR 23,519,433 16-Jul-18 659,311USD 52,651,073 JPY 5,802,910,000 17-Jul-18 163,637USD 25,921,805 EUR 20,784,000 18-Jul-18 1,604,353INR 834,881,083 USD 12,800,998 19-Jul-18 (641,119)USD 7,726,094 EUR 6,617,469 19-Jul-18 (16,978)USD 29,402,346 EUR 25,256,470 23-Jul-18 (158,972)INR 791,552,000 USD 11,856,237 24-Jul-18 (335,771)INR 18,021,000 USD 269,675 25-Jul-18 (7,430)USD 34,011,176 EUR 29,281,485 25-Jul-18 (266,327)INR 1,604,076,666 USD 23,868,413 27-Jul-18 (532,360)USD 2,974,660 EUR 2,543,183 30-Jul-18 (3,570)USD 22,562,562 EUR 18,389,179 31-Jul-18 1,025,948INR 2,151,110,000 USD 31,795,285 02-Aug-18 (528,060)USD 3,657,427 EUR 3,008,000 03-Aug-18 133,746INR 487,121,000 USD 7,509,766 06-Aug-18 (433,346)USD 6,405,696 EUR 5,317,387 06-Aug-18 175,226INR 399,632,500 USD 6,152,452 08-Aug-18 (348,648)USD 110,428,620 JPY 11,940,160,000 08-Aug-18 2,262,130MXN 1,899,503,821 USD 98,457,127 09-Aug-18 (3,425,757)USD 14,631,826 EUR 12,200,000 09-Aug-18 333,466USD 55,201,701 JPY 5,971,720,000 09-Aug-18 1,099,681USD 26,943,132 AUD 35,225,076 13-Aug-18 867,338USD 220,164,772 EUR 183,043,900 15-Aug-18 5,535,325INR 91,436,000 USD 1,342,475 16-Aug-18 (16,090)USD 11,261,289 EUR 9,444,300 17-Aug-18 185,541BRL 164,000,000 USD 44,282,436 20-Aug-18 (2,157,597)USD 25,012,500 EUR 21,090,100 20-Aug-18 273,291USD 66,298,940 EUR 55,761,978 21-Aug-18 883,544MXN 2,651,921,750 USD 138,120,925 22-Aug-18 (5,734,273)USD 2,160,147 EUR 1,823,324 22-Aug-18 21,001USD 4,810,661 EUR 4,064,380 23-Aug-18 41,902USD 21,716,898 EUR 18,305,000 24-Aug-18 237,828USD 49,976,562 EUR 42,318,544 29-Aug-18 300,374USD 21,042,094 EUR 17,841,960 31-Aug-18 94,865USD 228,121,542 EUR 194,567,888 04-Sep-18 (379,500)USD 13,371,200 EUR 11,353,769 06-Sep-18 35,261USD 52,493,566 EUR 44,718,000 07-Sep-18 (35,437)USD 26,948,768 AUD 35,225,076 12-Sep-18 870,720USD 40,905,710 EUR 34,533,866 12-Sep-18 324,189MXN 1,148,193,277 USD 56,280,593 13-Sep-18 845,364USD 53,681,420 AUD 70,492,000 13-Sep-18 1,494,184INR 146,040,000 USD 2,138,214 14-Sep-18 (28,139)USD 22,747,797 AUD 29,870,000 17-Sep-18 633,917USD 52,870,156 EUR 44,937,295 18-Sep-18 39,046USD 297,493,249 JPY 32,695,323,056 19-Sep-18 394,447USD 98,921,693 EUR 84,657,776 20-Sep-18 (622,572)USD 17,240,060 JPY 1,892,096,627 20-Sep-18 45,520MXN 2,430,000,000 USD 117,685,803 24-Sep-18 3,017,135USD 215,702,788 EUR 184,994,715 24-Sep-18 (1,888,702)USD 19,819,340 EUR 16,990,433 25-Sep-18 (166,405)USD 17,248,754 JPY 1,888,117,650 25-Sep-18 84,051MXN 4,441,313,649 USD 227,573,394 28-Sep-18 (7,097,824)USD 148,542,959 AUD 200,826,000 28-Sep-18 (141,857)USD 51,789,799 EUR 44,287,250 28-Sep-18 (317,452)USD 43,581,275 JPY 4,558,950,000 05-Oct-18 2,102,324INR 626,076,000 USD 9,443,433 09-Oct-18 (427,015)USD 27,399,767 JPY 2,875,400,000 09-Oct-18 1,229,563USD 27,066,979 JPY 2,860,100,000 11-Oct-18 1,031,653USD 112,228,480 AUD 145,600,000 12-Oct-18 4,418,110USD 108,008,754 JPY 11,400,000,000 12-Oct-18 4,226,490INR 1,533,400,000 USD 22,847,352 24-Oct-18 (806,717)USD 16,878,221 AUD 21,900,000 24-Oct-18 660,558MXN 2,952,525,000 USD 151,953,115 31-Oct-18 (6,158,715)MXN 945,957,180 USD 47,613,297 14-Nov-18 (1,006,860)MXN 1,314,359,940 USD 64,730,851 29-Nov-18 (128,425)INR 140,242,000 USD 2,024,571 19-Dec-18 (23,183)MXN 1,456,169,725 USD 76,048,137 02-Jan-19 (4,857,981)USD 26,125,394 JPY 2,875,400,000 11-Jan-19 (250,907)USD 46,582,902 JPY 5,040,270,000 22-Jan-19 307,600USD 14,057,668 JPY 1,524,540,000 24-Jan-19 58,463MXN 1,623,995,760 USD 83,298,921 05-Feb-19 (4,310,992)USD 56,091,231 JPY 5,984,710,000 12-Feb-19 1,052,979
22,536,309
4,913,596
FRANKLIN TEMPLETON INVESTMENT FUNDS
Notes to the Financial StatementsAt June 30, 2018 (continued)
Note 5 — Forward foreign exchange contracts (continued)
104 Audited Annual Report www.franklintempleton.lu

As at June 30, 2018, the Company had entered into the following outstanding contracts:
Templeton Emerging Markets Bond Fund (continued)Unrealisedprofit/(loss)
USD
The above contracts were opened with the following counterparties:
Bank of America 1,536,436Barclays Bank 1,446,572BNP Paribas 10,413,336Citigroup (8,592,158)Credit Suisse International 2,025Deutsche Bank (427,069)Goldman Sachs 10,237,680HSBC Bank (7,874,465)JPMorgan 847,285Morgan Stanley (3,653,464)Standard Chartered 3,655,373The Bank of New York Mellon (52,275)Toronto–Dominion Bank (311,479)UBS (2,314,201)
4,913,596
Templeton Emerging Markets Local Currency Bond Fund
Purchases Sales MaturityDate
Unrealisedprofit/(loss)
USD
Forward foreign exchange contracts used for share class hedging:EUR 421,976 USD 490,787 20-Jul-18 3,005GBP 124,402 USD 164,949 20-Jul-18 (503)NOK 789,295 USD 97,129 20-Jul-18 (140)SEK 1,428,399 USD 162,232 20-Jul-18 (2,416)
(54)
Forward foreign exchange contracts used for efficient portfolio management:INR 69,500,000 USD 1,019,809 09-Nov-18 (22,888)
(22,942)
The above contracts were opened with the following counterparties:
HSBC Bank (22,888)JPMorgan 86Morgan Stanley (140)
(22,942)
Templeton Emerging Markets Smaller Companies Fund
Purchases Sales MaturityDate
Unrealisedprofit/(loss)
USD
Forward foreign exchange contracts used for share class hedging:EUR 551,537 USD 654,115 10-Jul-18 (9,198)USD 30,987 EUR 26,732 10-Jul-18 (270)
(9,468)
The above contracts were opened with the following counterparties:
Bank of America (202)Barclays Bank (27)BNP Paribas (27)Citigroup (27)Deutsche Bank (152)JPMorgan (3,318)Morgan Stanley (5,715)
(9,468)
Templeton Euroland Fund
Purchases Sales MaturityDate
Unrealisedprofit/(loss)
EUR
Forward foreign exchange contracts used for share class hedging:USD 485,706 EUR 410,207 10-Jul-18 5,171
FRANKLIN TEMPLETON INVESTMENT FUNDS
Notes to the Financial StatementsAt June 30, 2018 (continued)
Note 5 — Forward foreign exchange contracts (continued)
www.franklintempleton.lu Audited Annual Report 105
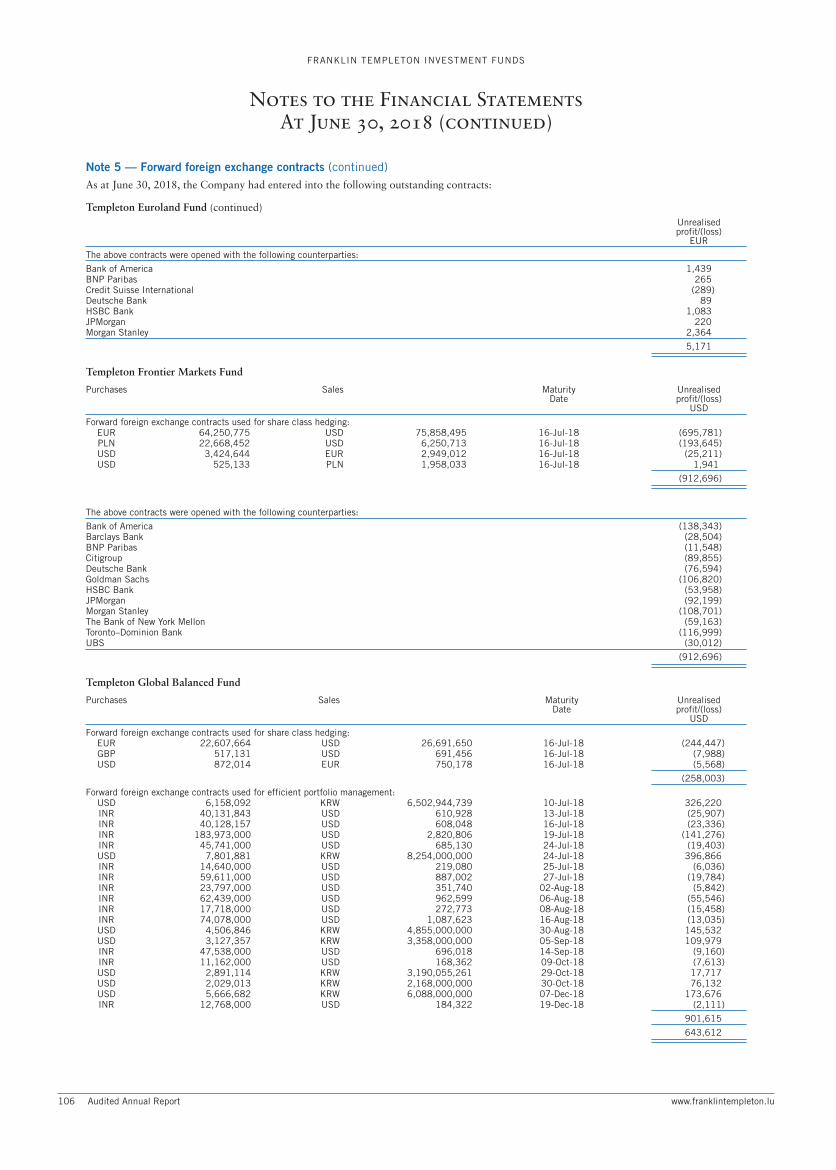
As at June 30, 2018, the Company had entered into the following outstanding contracts:
Templeton Euroland Fund (continued)Unrealisedprofit/(loss)
EUR
The above contracts were opened with the following counterparties:
Bank of America 1,439BNP Paribas 265Credit Suisse International (289)Deutsche Bank 89HSBC Bank 1,083JPMorgan 220Morgan Stanley 2,364
5,171
Templeton Frontier Markets Fund
Purchases Sales MaturityDate
Unrealisedprofit/(loss)
USD
Forward foreign exchange contracts used for share class hedging:EUR 64,250,775 USD 75,858,495 16-Jul-18 (695,781)PLN 22,668,452 USD 6,250,713 16-Jul-18 (193,645)USD 3,424,644 EUR 2,949,012 16-Jul-18 (25,211)USD 525,133 PLN 1,958,033 16-Jul-18 1,941
(912,696)
The above contracts were opened with the following counterparties:
Bank of America (138,343)Barclays Bank (28,504)BNP Paribas (11,548)Citigroup (89,855)Deutsche Bank (76,594)Goldman Sachs (106,820)HSBC Bank (53,958)JPMorgan (92,199)Morgan Stanley (108,701)The Bank of New York Mellon (59,163)Toronto–Dominion Bank (116,999)UBS (30,012)
(912,696)
Templeton Global Balanced Fund
Purchases Sales MaturityDate
Unrealisedprofit/(loss)
USD
Forward foreign exchange contracts used for share class hedging:EUR 22,607,664 USD 26,691,650 16-Jul-18 (244,447)GBP 517,131 USD 691,456 16-Jul-18 (7,988)USD 872,014 EUR 750,178 16-Jul-18 (5,568)
(258,003)
Forward foreign exchange contracts used for efficient portfolio management:USD 6,158,092 KRW 6,502,944,739 10-Jul-18 326,220INR 40,131,843 USD 610,928 13-Jul-18 (25,907)INR 40,128,157 USD 608,048 16-Jul-18 (23,336)INR 183,973,000 USD 2,820,806 19-Jul-18 (141,276)INR 45,741,000 USD 685,130 24-Jul-18 (19,403)USD 7,801,881 KRW 8,254,000,000 24-Jul-18 396,866INR 14,640,000 USD 219,080 25-Jul-18 (6,036)INR 59,611,000 USD 887,002 27-Jul-18 (19,784)INR 23,797,000 USD 351,740 02-Aug-18 (5,842)INR 62,439,000 USD 962,599 06-Aug-18 (55,546)INR 17,718,000 USD 272,773 08-Aug-18 (15,458)INR 74,078,000 USD 1,087,623 16-Aug-18 (13,035)USD 4,506,846 KRW 4,855,000,000 30-Aug-18 145,532USD 3,127,357 KRW 3,358,000,000 05-Sep-18 109,979INR 47,538,000 USD 696,018 14-Sep-18 (9,160)INR 11,162,000 USD 168,362 09-Oct-18 (7,613)USD 2,891,114 KRW 3,190,055,261 29-Oct-18 17,717USD 2,029,013 KRW 2,168,000,000 30-Oct-18 76,132USD 5,666,682 KRW 6,088,000,000 07-Dec-18 173,676INR 12,768,000 USD 184,322 19-Dec-18 (2,111)
901,615
643,612
FRANKLIN TEMPLETON INVESTMENT FUNDS
Notes to the Financial StatementsAt June 30, 2018 (continued)
Note 5 — Forward foreign exchange contracts (continued)
106 Audited Annual Report www.franklintempleton.lu
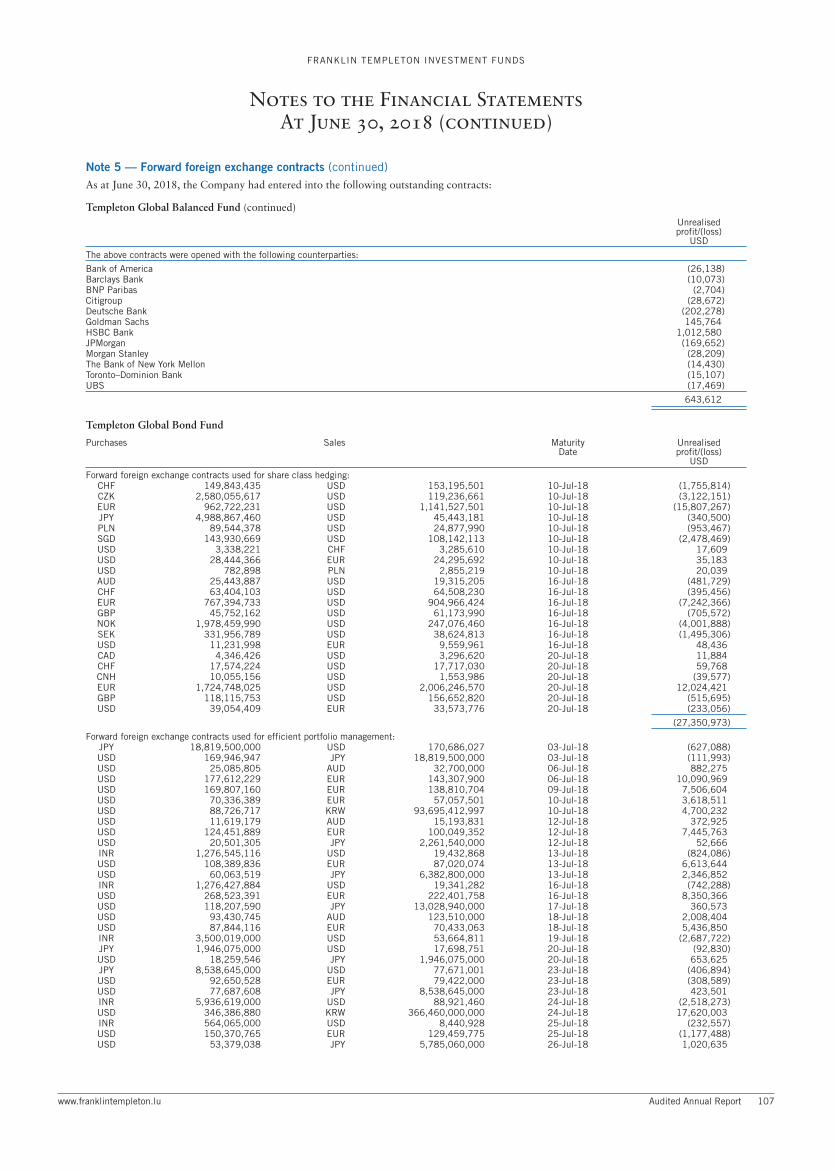
As at June 30, 2018, the Company had entered into the following outstanding contracts:
Templeton Global Balanced Fund (continued)Unrealisedprofit/(loss)
USD
The above contracts were opened with the following counterparties:
Bank of America (26,138)Barclays Bank (10,073)BNP Paribas (2,704)Citigroup (28,672)Deutsche Bank (202,278)Goldman Sachs 145,764HSBC Bank 1,012,580JPMorgan (169,652)Morgan Stanley (28,209)The Bank of New York Mellon (14,430)Toronto–Dominion Bank (15,107)UBS (17,469)
643,612
Templeton Global Bond Fund
Purchases Sales MaturityDate
Unrealisedprofit/(loss)
USD
Forward foreign exchange contracts used for share class hedging:CHF 149,843,435 USD 153,195,501 10-Jul-18 (1,755,814)CZK 2,580,055,617 USD 119,236,661 10-Jul-18 (3,122,151)EUR 962,722,231 USD 1,141,527,501 10-Jul-18 (15,807,267)JPY 4,988,867,460 USD 45,443,181 10-Jul-18 (340,500)PLN 89,544,378 USD 24,877,990 10-Jul-18 (953,467)SGD 143,930,669 USD 108,142,113 10-Jul-18 (2,478,469)USD 3,338,221 CHF 3,285,610 10-Jul-18 17,609USD 28,444,366 EUR 24,295,692 10-Jul-18 35,183USD 782,898 PLN 2,855,219 10-Jul-18 20,039AUD 25,443,887 USD 19,315,205 16-Jul-18 (481,729)CHF 63,404,103 USD 64,508,230 16-Jul-18 (395,456)EUR 767,394,733 USD 904,966,424 16-Jul-18 (7,242,366)GBP 45,752,162 USD 61,173,990 16-Jul-18 (705,572)NOK 1,978,459,990 USD 247,076,460 16-Jul-18 (4,001,888)SEK 331,956,789 USD 38,624,813 16-Jul-18 (1,495,306)USD 11,231,998 EUR 9,559,961 16-Jul-18 48,436CAD 4,346,426 USD 3,296,620 20-Jul-18 11,884CHF 17,574,224 USD 17,717,030 20-Jul-18 59,768CNH 10,055,156 USD 1,553,986 20-Jul-18 (39,577)EUR 1,724,748,025 USD 2,006,246,570 20-Jul-18 12,024,421GBP 118,115,753 USD 156,652,820 20-Jul-18 (515,695)USD 39,054,409 EUR 33,573,776 20-Jul-18 (233,056)
(27,350,973)
Forward foreign exchange contracts used for efficient portfolio management:JPY 18,819,500,000 USD 170,686,027 03-Jul-18 (627,088)USD 169,946,947 JPY 18,819,500,000 03-Jul-18 (111,993)USD 25,085,805 AUD 32,700,000 06-Jul-18 882,275USD 177,612,229 EUR 143,307,900 06-Jul-18 10,090,969USD 169,807,160 EUR 138,810,704 09-Jul-18 7,506,604USD 70,336,389 EUR 57,057,501 10-Jul-18 3,618,511USD 88,726,717 KRW 93,695,412,997 10-Jul-18 4,700,232USD 11,619,179 AUD 15,193,831 12-Jul-18 372,925USD 124,451,889 EUR 100,049,352 12-Jul-18 7,445,763USD 20,501,305 JPY 2,261,540,000 12-Jul-18 52,666INR 1,276,545,116 USD 19,432,868 13-Jul-18 (824,086)USD 108,389,836 EUR 87,020,074 13-Jul-18 6,613,644USD 60,063,519 JPY 6,382,800,000 13-Jul-18 2,346,852INR 1,276,427,884 USD 19,341,282 16-Jul-18 (742,288)USD 268,523,391 EUR 222,401,758 16-Jul-18 8,350,366USD 118,207,590 JPY 13,028,940,000 17-Jul-18 360,573USD 93,430,745 AUD 123,510,000 18-Jul-18 2,008,404USD 87,844,116 EUR 70,433,063 18-Jul-18 5,436,850INR 3,500,019,000 USD 53,664,811 19-Jul-18 (2,687,722)JPY 1,946,075,000 USD 17,698,751 20-Jul-18 (92,830)USD 18,259,546 JPY 1,946,075,000 20-Jul-18 653,625JPY 8,538,645,000 USD 77,671,001 23-Jul-18 (406,894)USD 92,650,528 EUR 79,422,000 23-Jul-18 (308,589)USD 77,687,608 JPY 8,538,645,000 23-Jul-18 423,501INR 5,936,619,000 USD 88,921,460 24-Jul-18 (2,518,273)USD 346,386,880 KRW 366,460,000,000 24-Jul-18 17,620,003INR 564,065,000 USD 8,440,928 25-Jul-18 (232,557)USD 150,370,765 EUR 129,459,775 25-Jul-18 (1,177,488)USD 53,379,038 JPY 5,785,060,000 26-Jul-18 1,020,635
FRANKLIN TEMPLETON INVESTMENT FUNDS
Notes to the Financial StatementsAt June 30, 2018 (continued)
Note 5 — Forward foreign exchange contracts (continued)
www.franklintempleton.lu Audited Annual Report 107

As at June 30, 2018, the Company had entered into the following outstanding contracts:
Templeton Global Bond Fund (continued)Purchases Sales Maturity
DateUnrealisedprofit/(loss)
USD
JPY 2,250,000,000 USD 20,476,604 30-Jul-18 (107,020)USD 104,761,510 EUR 89,223,052 30-Jul-18 275,633USD 946,381,916 JPY 102,152,050,000 30-Jul-18 21,584,220USD 234,895,330 AUD 290,385,000 31-Jul-18 19,941,887USD 336,079,358 EUR 275,858,390 31-Jul-18 13,005,895USD 958,324,849 JPY 103,485,740,000 31-Jul-18 21,385,257USD 19,784,371 EUR 16,253,000 02-Aug-18 746,526USD 154,827,079 EUR 127,335,372 03-Aug-18 5,661,749USD 171,073,922 JPY 18,819,500,000 06-Aug-18 611,842INR 6,511,439,500 USD 100,245,393 08-Aug-18 (5,680,723)USD 158,053,758 JPY 17,070,280,000 08-Aug-18 3,413,260USD 131,073,492 AUD 174,692,450 09-Aug-18 1,756,674USD 168,640,013 EUR 140,606,500 09-Aug-18 3,849,658USD 276,901,300 JPY 29,954,520,000 09-Aug-18 5,522,193USD 201,590,903 EUR 168,741,017 10-Aug-18 3,811,230USD 11,613,696 AUD 15,183,584 13-Aug-18 373,861USD 97,622,869 EUR 81,574,000 13-Aug-18 1,987,932USD 104,859,879 JPY 11,367,777,656 13-Aug-18 1,841,329USD 146,238,120 EUR 121,608,000 14-Aug-18 3,657,145USD 28,446,713 JPY 3,176,786,656 14-Aug-18 (344,461)USD 395,717,341 EUR 329,099,396 15-Aug-18 9,829,466USD 283,734,096 JPY 30,271,713,000 15-Aug-18 9,362,099INR 9,624,010,000 USD 141,300,984 16-Aug-18 (1,693,492)USD 120,135,127 EUR 99,663,000 16-Aug-18 3,265,241USD 48,454,415 JPY 5,274,214,600 16-Aug-18 647,354USD 210,831,325 EUR 176,814,067 17-Aug-18 3,473,656USD 93,446,987 AUD 123,514,000 20-Aug-18 2,012,491USD 117,604,855 EUR 99,162,345 20-Aug-18 1,284,972USD 67,933,470 JPY 7,438,715,000 20-Aug-18 487,182USD 166,479,347 EUR 140,051,608 21-Aug-18 2,182,245USD 173,090,571 EUR 146,101,281 22-Aug-18 1,682,817USD 24,873,399 JPY 2,743,312,000 22-Aug-18 (3,618)USD 439,341,096 EUR 370,915,819 23-Aug-18 4,143,554USD 74,213,361 JPY 8,200,428,000 23-Aug-18 (155,493)USD 107,763,842 EUR 90,850,448 24-Aug-18 1,160,015USD 139,378,157 JPY 15,361,725,000 24-Aug-18 54,122USD 130,916,510 JPY 14,296,606,500 27-Aug-18 1,224,421USD 405,842,938 AUD 536,254,725 29-Aug-18 8,856,378USD 124,916,766 EUR 105,803,233 29-Aug-18 718,227USD 161,307,046 JPY 17,608,034,000 29-Aug-18 1,551,913USD 476,393,873 KRW 513,195,300,000 30-Aug-18 15,383,420USD 226,779,530 EUR 192,203,013 31-Aug-18 1,124,915USD 300,090,618 EUR 254,718,128 04-Sep-18 948,976USD 86,195,542 JPY 9,339,287,000 04-Sep-18 1,424,139USD 150,397,177 JPY 16,367,800,000 05-Sep-18 1,818,010USD 242,239,814 KRW 260,105,000,000 05-Sep-18 8,518,800USD 154,676,796 EUR 131,345,612 06-Sep-18 400,537USD 70,935,522 JPY 7,734,100,000 06-Sep-18 723,844USD 239,592,040 EUR 203,790,409 07-Sep-18 205,058USD 76,645,318 JPY 8,388,830,000 10-Sep-18 467,447USD 22,413,168 EUR 18,822,494 11-Sep-18 296,126USD 37,668,376 JPY 4,116,972,690 11-Sep-18 279,932USD 11,616,125 AUD 15,183,584 12-Sep-18 375,319USD 118,509,457 EUR 100,049,352 12-Sep-18 939,219USD 23,138,176 AUD 30,384,000 13-Sep-18 644,035USD 23,707,563 JPY 2,577,996,000 13-Sep-18 291,947INR 7,011,302,780 USD 102,654,506 14-Sep-18 (1,350,961)USD 110,270,624 EUR 92,820,000 14-Sep-18 1,179,043USD 118,916,956 JPY 13,025,212,000 14-Sep-18 601,866USD 225,342,216 EUR 189,904,994 17-Sep-18 2,095,075USD 117,999,660 AUD 155,946,000 18-Sep-18 2,546,640USD 175,035,631 EUR 148,544,683 18-Sep-18 397,161USD 535,849,260 JPY 57,382,345,300 18-Sep-18 14,460,612USD 46,361,092 JPY 5,096,150,292 19-Sep-18 52,935USD 80,037,492 AUD 107,590,000 20-Sep-18 383,856USD 357,771,121 EUR 306,192,697 20-Sep-18 (2,263,460)USD 46,605,944 JPY 5,115,002,306 20-Sep-18 123,056USD 150,904,034 EUR 129,460,795 24-Sep-18 (1,368,247)USD 156,898,151 JPY 17,172,052,733 25-Sep-18 788,599USD 171,503,384 EUR 146,607,834 28-Sep-18 (991,662)USD 224,125,926 JPY 24,436,908,500 28-Sep-18 1,920,844USD 13,211,227 JPY 1,382,000,000 05-Oct-18 637,298INR 7,133,944,000 USD 107,605,023 09-Oct-18 (4,865,709)USD 134,509,693 AUD 174,692,450 09-Oct-18 5,160,998USD 68,621,083 KRW 75,716,503,003 29-Oct-18 420,510USD 90,112,307 KRW 96,285,000,000 30-Oct-18 3,381,175
FRANKLIN TEMPLETON INVESTMENT FUNDS
Notes to the Financial StatementsAt June 30, 2018 (continued)
Note 5 — Forward foreign exchange contracts (continued)
108 Audited Annual Report www.franklintempleton.lu

As at June 30, 2018, the Company had entered into the following outstanding contracts:
Templeton Global Bond Fund (continued)Purchases Sales Maturity
DateUnrealisedprofit/(loss)
USD
USD 406,127,153 AUD 536,254,725 31-Oct-18 8,989,077USD 306,144,623 KRW 326,840,000,000 19-Nov-18 11,478,704USD 292,089,793 KRW 321,065,100,000 23-Nov-18 2,579,831USD 246,626,332 KRW 264,963,000,000 07-Dec-18 7,558,736USD 590,275,882 KRW 626,902,500,000 11-Dec-18 24,543,225USD 79,591,393 JPY 8,687,599,500 18-Dec-18 54,276INR 3,744,585,000 USD 54,057,817 19-Dec-18 (619,008)USD 84,488,218 JPY 9,298,900,000 11-Jan-19 (811,422)USD 116,111,553 JPY 12,563,270,000 22-Jan-19 766,718USD 58,010,410 JPY 6,261,237,600 23-Jan-19 520,691USD 103,055,522 JPY 10,972,321,434 31-Jan-19 2,245,200USD 242,305,907 JPY 26,063,200,000 06-Feb-19 2,730,801USD 120,730,648 JPY 12,790,506,688 14-Feb-19 3,084,291USD 116,776,418 JPY 12,239,610,000 15-Feb-19 4,188,205
347,612,905
320,261,932
The above contracts were opened with the following counterparties:
Bank of America 18,101,272Barclays Bank 18,384,730BNP Paribas 884,783Citigroup 19,602,786Credit Suisse International (727,690)Deutsche Bank 47,972,942Goldman Sachs 49,267,728HSBC Bank 86,721,399JPMorgan 44,459,819Morgan Stanley 337,840Standard Chartered 31,860,274The Bank of New York Mellon (716,353)Toronto–Dominion Bank (1,485,176)UBS 5,597,578
320,261,932
Templeton Global Bond (Euro) Fund
Purchases Sales MaturityDate
Unrealisedprofit/(loss)
EUR
Forward foreign exchange contracts used for efficient portfolio management:EUR 8,770,186 INR 706,000,000 05-Jul-18 (44,796)EUR 4,734,788 USD 5,889,626 12-Jul-18 (301,295)EUR 18,742,615 USD 23,000,000 31-Jul-18 (896,078)EUR 685,060 MXN 15,949,655 07-Aug-18 3,875EUR 2,569,032 BRL 10,999,025 08-Aug-18 157,183EUR 7,714,480 COP 26,443,693,750 08-Aug-18 24,460EUR 4,375,425 BRL 19,300,000 20-Aug-18 149,286EUR 8,375,674 BRL 37,020,480 21-Aug-18 270,211EUR 6,212,121 USD 7,380,000 21-Aug-18 (78,798)EUR 1,143,717 MXN 27,429,763 22-Aug-18 (23,436)EUR 9,234,128 MXN 219,490,600 24-Aug-18 (100,733)EUR 16,857,808 MXN 393,041,480 31-Aug-18 169,620EUR 15,711,906 USD 18,390,000 04-Sep-18 52,896EUR 2,734,696 BRL 11,869,400 05-Sep-18 142,808EUR 7,148,386 USD 8,404,000 05-Sep-18 (7,037)EUR 734,018 BRL 3,300,000 10-Sep-18 14,228EUR 3,871,399 COP 13,029,000,000 10-Sep-18 98,263EUR 1,724,213 MXN 42,611,339 13-Sep-18 (79,742)EUR 11,573,417 MXN 286,966,348 14-Sep-18 (572,598)EUR 16,147,490 BRL 71,780,436 20-Sep-18 526,454EUR 11,447,085 IDR 200,816,202,006 20-Sep-18 (335,347)EUR 13,179,644 IDR 231,500,450,600 27-Sep-18 (381,675)EUR 15,474,029 KRW 20,764,600,000 27-Sep-18 (401,709)EUR 21,386,537 MXN 506,283,482 28-Sep-18 25,490EUR 15,262,983 KRW 20,009,008,000 10-Oct-18 (26,731)EUR 2,883,922 INR 240,000,000 15-Oct-18 (47,136)EUR 4,096,045 BRL 17,901,765 18-Oct-18 220,374EUR 1,150,076 COP 3,960,000,000 23-Oct-18 10,354EUR 2,893,909 IDR 50,600,000,000 19-Nov-18 (32,415)EUR 11,723,703 INR 974,239,750 26-Nov-18 (68,010)EUR 1,446,128 IDR 25,300,000,000 30-Nov-18 (13,169)EUR 1,571,648 KRW 2,000,000,000 30-Nov-18 46,622
FRANKLIN TEMPLETON INVESTMENT FUNDS
Notes to the Financial StatementsAt June 30, 2018 (continued)
Note 5 — Forward foreign exchange contracts (continued)
www.franklintempleton.lu Audited Annual Report 109

As at June 30, 2018, the Company had entered into the following outstanding contracts:
Templeton Global Bond (Euro) Fund (continued)Purchases Sales Maturity
DateUnrealisedprofit/(loss)
EUR
EUR 6,337,655 KRW 7,967,700,000 05-Dec-18 263,452EUR 765,688 IDR 13,300,000,000 21-Mar-19 18,085
(1,217,044)
The above contracts were opened with the following counterparties:
Barclays Bank (896,078)BNP Paribas 52,896Citigroup 653,232Deutsche Bank (560,286)HSBC Bank 148,065JPMorgan (614,873)
(1,217,044)
Templeton Global Climate Change Fund
Purchases Sales MaturityDate
Unrealisedprofit/(loss)
EUR
Forward foreign exchange contracts used for share class hedging:EUR 1,996 USD 2,334 20-Jul-18 1USD 101,829 EUR 87,486 20-Jul-18 (466)
(465)
The above contracts were opened with the following counterparties:
JPMorgan (13)Morgan Stanley (452)
(465)
Templeton Global Currency Fund
Purchases Sales MaturityDate
Unrealisedprofit/(loss)
USD
Forward foreign exchange contracts used for share class hedging:EUR 2,349,797 USD 2,732,629 20-Jul-18 17,062
Forward foreign exchange contracts used for efficient portfolio management:USD 263,340 EUR 225,000 05-Jul-18 344USD 327,033 AUD 425,000 06-Jul-18 12,461USD 348,736 EUR 282,222 10-Jul-18 18,731USD 1,089,520 JPY 122,078,000 12-Jul-18 (14,298)USD 483,685 JPY 51,400,000 13-Jul-18 18,899USD 333,886 EUR 282,222 16-Jul-18 3,733USD 298,825 AUD 370,000 02-Aug-18 24,936USD 730,365 EUR 600,000 02-Aug-18 27,559USD 1,018,057 JPY 110,000,000 02-Aug-18 21,994INR 66,100,000 USD 1,018,822 06-Aug-18 (58,586)USD 505,685 EUR 423,334 10-Aug-18 9,500USD 540,675 EUR 450,000 14-Aug-18 13,066USD 143,337 EUR 122,000 04-Sep-18 59USD 264,555 EUR 225,000 07-Sep-18 254USD 336,060 EUR 282,222 11-Sep-18 4,440USD 474,788 JPY 51,600,000 12-Sep-18 6,147USD 534,971 EUR 450,000 13-Sep-18 6,126USD 221,107 JPY 24,300,000 19-Sep-18 296USD 327,241 AUD 425,000 09-Oct-18 12,556USD 100,190 AUD 130,000 24-Oct-18 3,921INR 28,000,000 USD 403,749 03-Dec-18 (3,345)USD 481,801 JPY 50,500,000 15-Feb-19 17,268
126,061
143,123
FRANKLIN TEMPLETON INVESTMENT FUNDS
Notes to the Financial StatementsAt June 30, 2018 (continued)
Note 5 — Forward foreign exchange contracts (continued)
110 Audited Annual Report www.franklintempleton.lu

As at June 30, 2018, the Company had entered into the following outstanding contracts:
Templeton Global Currency Fund (continued)Unrealisedprofit/(loss)
USD
The above contracts were opened with the following counterparties:
Bank of America (3,073)Barclays Bank 91Citigroup 83,986Deutsche Bank 6,745JPMorgan 54,895Morgan Stanley 82UBS 397
143,123
Templeton Global Equity Income Fund
Purchases Sales MaturityDate
Unrealisedprofit/(loss)
USD
Forward foreign exchange contracts used for share class hedging:CNH 4,062,589 USD 627,899 20-Jul-18 (16,031)USD 13,996 CNH 92,499 20-Jul-18 65
(15,966)
The above contracts were opened with the following counterparties:
Bank of America (1,917)Barclays Bank (957)BNP Paribas (1,710)Citigroup (1,970)Credit Suisse International (1,064)Goldman Sachs (1,698)HSBC Bank (1,325)JPMorgan (1,808)Morgan Stanley (1,602)UBS (1,915)
(15,966)
Templeton Global High Yield Fund
Purchases Sales MaturityDate
Unrealisedprofit/(loss)
USD
Forward foreign exchange contracts used for efficient portfolio management:USD 484,305 EUR 413,795 05-Jul-18 632USD 196,338 EUR 158,417 06-Jul-18 11,155MXN 132,066,099 USD 6,655,216 10-Jul-18 (15,518)USD 71,717 JPY 7,985,000 11-Jul-18 (477)MXN 3,768,700 USD 189,658 12-Jul-18 (246)USD 141,539 AUD 185,083 12-Jul-18 4,543USD 1,863,817 EUR 1,498,359 12-Jul-18 111,509USD 51,853 JPY 5,720,000 12-Jul-18 133USD 85,275 EUR 72,186 16-Jul-18 830USD 146,461 JPY 16,140,000 17-Jul-18 474USD 59,706 EUR 47,872 18-Jul-18 3,695USD 487,166 EUR 420,000 23-Jul-18 (4,421)USD 384,710 EUR 331,211 25-Jul-18 (3,013)USD 111,693 JPY 12,105,000 26-Jul-18 2,136USD 105,500 JPY 11,337,896 30-Jul-18 2,856USD 1,541,512 EUR 1,263,144 31-Jul-18 62,172USD 346,206 JPY 37,645,000 31-Jul-18 5,375INR 81,830,000 USD 1,259,795 08-Aug-18 (71,390)USD 69,875 JPY 7,585,026 09-Aug-18 1,157USD 141,472 AUD 184,958 13-Aug-18 4,554USD 123,184 JPY 13,345,334 13-Aug-18 2,245USD 23,768 JPY 2,654,333 14-Aug-18 (288)USD 564,057 EUR 469,100 15-Aug-18 14,011USD 53,246 JPY 5,783,000 15-Aug-18 830USD 69,399 JPY 7,554,000 16-Aug-18 927USD 227,565 EUR 191,879 20-Aug-18 2,486USD 85,785 EUR 72,186 21-Aug-18 1,103USD 242,148 JPY 26,648,500 21-Aug-18 509USD 30,818 JPY 3,399,000 22-Aug-18 (4)USD 155,261 JPY 17,156,000 23-Aug-18 (325)USD 3,072,455 EUR 2,590,870 24-Aug-18 32,331USD 210,209 JPY 23,168,000 24-Aug-18 85USD 31,788 JPY 3,359,000 27-Aug-18 1,316USD 1,515,596 EUR 1,284,066 29-Aug-18 8,278
FRANKLIN TEMPLETON INVESTMENT FUNDS
Notes to the Financial StatementsAt June 30, 2018 (continued)
Note 5 — Forward foreign exchange contracts (continued)
www.franklintempleton.lu Audited Annual Report 111

As at June 30, 2018, the Company had entered into the following outstanding contracts:
Templeton Global High Yield Fund (continued)Purchases Sales Maturity
DateUnrealisedprofit/(loss)
USD
USD 369,510 JPY 40,280,000 29-Aug-18 4,056USD 4,776 EUR 4,050 31-Aug-18 22USD 122,003 JPY 13,219,000 04-Sep-18 2,016USD 186,187 JPY 20,300,000 06-Sep-18 1,900USD 486,540 EUR 413,795 07-Sep-18 467USD 141,502 AUD 184,958 12-Sep-18 4,572USD 1,774,822 EUR 1,498,359 12-Sep-18 14,066USD 281,764 AUD 370,000 13-Sep-18 7,843USD 29,612 JPY 3,220,000 13-Sep-18 365USD 261,248 JPY 27,508,070 18-Sep-18 11,304USD 5,053,610 JPY 555,200,000 19-Sep-18 8,569USD 55,938 EUR 47,872 20-Sep-18 (353)USD 468,833 EUR 402,214 24-Sep-18 (4,253)USD 84,205 EUR 72,186 25-Sep-18 (707)USD 151,663 JPY 16,598,000 25-Sep-18 772USD 880,935 AUD 1,191,000 28-Sep-18 (841)USD 200,615 JPY 21,880,000 28-Sep-18 1,660USD 163,945 JPY 17,150,000 05-Oct-18 7,909USD 2,689,726 AUD 3,490,000 24-Oct-18 105,267USD 149,541 JPY 16,315,550 26-Oct-18 834USD 99,425 JPY 10,852,500 18-Dec-18 68USD 171,257 JPY 18,530,000 22-Jan-19 1,131USD 52,836 JPY 5,730,000 24-Jan-19 220MXN 121,319,360 USD 6,215,290 25-Jan-19 (304,755)USD 137,763 JPY 14,667,628 31-Jan-19 3,001USD 25,054 JPY 2,654,333 14-Feb-19 640USD 37,213 JPY 3,900,000 15-Feb-19 1,338
46,771
The above contracts were opened with the following counterparties:
Bank of America (817)Barclays Bank 8,494Citigroup (292,974)Deutsche Bank 171,522Goldman Sachs 16,363HSBC Bank (77,135)JPMorgan 138,484Morgan Stanley 2,583Standard Chartered 80,251
46,771
Templeton Global Income Fund
Purchases Sales MaturityDate
Unrealisedprofit/(loss)
USD
Forward foreign exchange contracts used for share class hedging:EUR 64,205,090 USD 75,785,984 16-Jul-18 (676,721)SGD 238,252 USD 178,444 16-Jul-18 (3,516)USD 2,068,939 EUR 1,778,081 16-Jul-18 (11,120)USD 4,002 SGD 5,447 16-Jul-18 2
(691,355)
Forward foreign exchange contracts used for efficient portfolio management:USD 1,486,602 EUR 1,270,165 05-Jul-18 1,939USD 458,243 EUR 371,333 09-Jul-18 24,073USD 3,787,013 EUR 3,070,000 10-Jul-18 197,234USD 168,044 JPY 18,710,000 11-Jul-18 (1,119)USD 1,816,796 AUD 2,375,735 12-Jul-18 58,311USD 2,229,587 EUR 1,792,409 12-Jul-18 133,393USD 85,122 JPY 9,390,000 12-Jul-18 219USD 7,319,780 EUR 5,875,000 13-Jul-18 448,548USD 5,752,877 EUR 4,867,490 16-Jul-18 58,725USD 5,253,902 JPY 579,270,000 17-Jul-18 14,393USD 3,816,896 EUR 3,060,372 18-Jul-18 236,235JPY 17,382,000 USD 158,114 23-Jul-18 (828)USD 2,837,164 EUR 2,446,000 23-Jul-18 (25,745)USD 158,246 JPY 17,382,000 23-Jul-18 960KRW 1,350,000,000 USD 1,256,632 24-Jul-18 (45,490)USD 5,804,263 KRW 6,140,620,000 24-Jul-18 295,251USD 307,192 JPY 33,013,435 30-Jul-18 8,316USD 66,478,011 EUR 54,459,044 31-Jul-18 2,697,924USD 688,373 JPY 74,410,000 31-Jul-18 14,680USD 1,804,002 EUR 1,482,000 02-Aug-18 68,071
FRANKLIN TEMPLETON INVESTMENT FUNDS
Notes to the Financial StatementsAt June 30, 2018 (continued)
Note 5 — Forward foreign exchange contracts (continued)
112 Audited Annual Report www.franklintempleton.lu

As at June 30, 2018, the Company had entered into the following outstanding contracts:
Templeton Global Income Fund (continued)Purchases Sales Maturity
DateUnrealisedprofit/(loss)
USD
MXN 85,916,000 USD 4,493,045 06-Aug-18 (192,546)USD 1,785,321 EUR 1,482,000 06-Aug-18 48,837JPY 209,900,000 USD 1,911,405 08-Aug-18 (9,911)USD 71,647,593 GBP 52,591,758 08-Aug-18 2,065,705USD 16,783,504 JPY 1,811,900,000 08-Aug-18 369,414USD 522,291 AUD 696,100 09-Aug-18 7,000USD 2,450,946 EUR 2,043,000 09-Aug-18 56,557USD 1,941,486 JPY 210,030,000 09-Aug-18 38,677USD 2,511,025 EUR 2,102,001 10-Aug-18 47,291USD 1,815,938 AUD 2,374,133 13-Aug-18 58,458USD 296,264 JPY 32,043,000 13-Aug-18 5,880USD 10,568,087 EUR 8,910,825 20-Aug-18 115,469USD 2,023,646 JPY 221,589,225 20-Aug-18 14,513USD 15,081,855 EUR 12,684,480 21-Aug-18 201,460USD 2,742,019 JPY 301,791,200 21-Aug-18 5,502USD 4,165,810 JPY 459,085,500 22-Aug-18 2,712USD 2,207,895 KRW 2,363,000,000 23-Aug-18 85,758USD 995,335 EUR 839,410 24-Aug-18 10,372USD 889,486 JPY 98,035,000 24-Aug-18 352USD 149,986 JPY 15,849,000 27-Aug-18 6,211USD 9,390,914 EUR 7,952,235 29-Aug-18 56,076USD 1,015,655 JPY 110,469,000 29-Aug-18 13,385USD 534,176 JPY 57,878,000 04-Sep-18 8,826USD 438,076 EUR 371,333 06-Sep-18 1,915USD 1,493,460 EUR 1,270,165 07-Sep-18 1,432USD 1,892,125 EUR 1,589,000 11-Sep-18 24,999USD 1,242,531 JPY 135,790,000 11-Sep-18 9,349JPY 36,000,000 USD 328,613 12-Sep-18 (1,653)USD 1,816,318 AUD 2,374,133 12-Sep-18 58,686USD 2,123,127 EUR 1,792,409 12-Sep-18 16,826USD 3,547,173 JPY 385,780,000 12-Sep-18 43,439USD 2,560,247 AUD 3,362,000 13-Sep-18 71,263USD 69,394 JPY 7,546,000 13-Sep-18 855USD 2,039,309 EUR 1,724,020 18-Sep-18 12,442USD 2,843,844 JPY 312,389,225 18-Sep-18 5,407USD 1,564,277 JPY 171,950,000 19-Sep-18 1,786USD 16,486,578 AUD 22,162,000 20-Sep-18 79,069USD 16,389,587 EUR 14,026,362 20-Sep-18 (103,214)USD 2,444,191 JPY 268,250,000 20-Sep-18 6,454USD 8,095,797 JPY 885,250,325 21-Sep-18 50,439USD 3,824,359 EUR 3,278,490 25-Sep-18 (32,110)USD 4,013,818 JPY 439,366,000 25-Sep-18 19,581USD 8,417,808 EUR 7,201,681 28-Sep-18 (55,506)USD 79,435 JPY 8,661,000 28-Sep-18 680USD 6,621,312 JPY 695,502,600 04-Oct-18 293,913USD 269,387 JPY 28,180,000 05-Oct-18 12,995USD 535,983 AUD 696,100 09-Oct-18 20,565USD 10,430,474 JPY 1,094,600,000 09-Oct-18 468,067USD 10,304,020 JPY 1,088,800,000 11-Oct-18 392,736MXN 74,782,000 USD 3,817,940 07-Nov-18 (129,374)USD 8,966,037 JPY 977,071,100 18-Dec-18 20,710USD 7,653,279 JPY 842,182,000 11-Jan-19 (72,131)USD 305,268 JPY 33,030,000 22-Jan-19 2,016USD 86,861 JPY 9,420,000 24-Jan-19 361USD 401,408 JPY 42,737,915 31-Jan-19 8,745USD 1,972,801 JPY 210,490,000 12-Feb-19 37,035
8,468,865
7,777,510
FRANKLIN TEMPLETON INVESTMENT FUNDS
Notes to the Financial StatementsAt June 30, 2018 (continued)
Note 5 — Forward foreign exchange contracts (continued)
www.franklintempleton.lu Audited Annual Report 113

As at June 30, 2018, the Company had entered into the following outstanding contracts:
Templeton Global Income Fund (continued)Unrealisedprofit/(loss)
USD
The above contracts were opened with the following counterparties:
Bank of America 419,865Barclays Bank 330,796BNP Paribas (26,957)Citigroup (149,518)Deutsche Bank 443,660Goldman Sachs 301,685HSBC Bank 750,314JPMorgan 5,662,688Morgan Stanley (120,903)Standard Chartered 98,169The Bank of New York Mellon (18,760)Toronto–Dominion Bank (3,510)UBS 89,981
7,777,510
Templeton Global Total Return Fund
Purchases Sales MaturityDate
Unrealisedprofit/(loss)
USD
Forward foreign exchange contracts used for share class hedging:BRL 153,238,300 USD 41,000,000 03-Jul-18 (1,475,474)USD 40,022,305 BRL 153,238,300 03-Jul-18 497,779EUR 1,326,007,188 USD 1,572,639,196 10-Jul-18 (22,126,420)GBP 13,911,090 USD 18,702,152 10-Jul-18 (321,701)JPY 13,430,214,444 USD 122,332,374 10-Jul-18 (914,297)PLN 286,254,476 USD 79,528,455 10-Jul-18 (3,046,813)USD 64,131,600 EUR 54,786,700 10-Jul-18 68,991USD 3,873,069 JPY 427,717,935 10-Jul-18 6,214USD 1,703,917 PLN 6,211,289 10-Jul-18 44,381CHF 141,145,135 USD 143,607,026 16-Jul-18 (884,303)EUR 1,175,045,965 USD 1,387,341,264 16-Jul-18 (12,733,137)GBP 1,695,912 USD 2,267,559 16-Jul-18 (26,155)NOK 29,393,804 USD 3,668,046 16-Jul-18 (56,710)PLN 368,329 USD 101,554 16-Jul-18 (3,135)SGD 478,791,749 USD 358,596,404 16-Jul-18 (7,060,629)USD 6,975,962 CHF 6,940,822 16-Jul-18 (42,438)USD 18,799,170 EUR 16,184,487 16-Jul-18 (133,984)USD 46,980 GBP 35,886 16-Jul-18 (449)AUD 248,816,738 USD 185,002,039 20-Jul-18 (826,048)CHF 21,586,113 USD 21,763,308 20-Jul-18 71,624CNH 108,645,823 USD 16,792,073 20-Jul-18 (428,900)EUR 1,206,756,030 USD 1,403,632,737 20-Jul-18 8,492,773GBP 129,266,678 USD 171,425,723 20-Jul-18 (548,194)NOK 26,686,815 USD 3,281,400 20-Jul-18 (2,105)SEK 288,501,491 USD 32,762,397 20-Jul-18 (483,540)USD 4,021,994 AUD 5,479,788 20-Jul-18 (34,185)USD 1,339,332 CNH 8,732,311 20-Jul-18 24,157USD 12,579,603 EUR 10,786,507 20-Jul-18 (42,586)USD 563,556 GBP 427,450 20-Jul-18 (1,490)USD 317,232 NOK 2,589,383 20-Jul-18 (953)USD 742,808 SEK 6,669,445 20-Jul-18 (3,400)BRL 147,940,100 USD 38,500,000 02-Aug-18 (474,796)
(42,465,923)
Forward foreign exchange contracts used for efficient portfolio management:JPY 7,590,800,000 USD 68,845,798 03-Jul-18 (252,934)USD 68,547,692 JPY 7,590,800,000 03-Jul-18 (45,172)JPY 65,947,874,500 USD 598,003,940 05-Jul-18 (1,996,205)MXN 1,753,525,150 USD 87,588,669 05-Jul-18 642,030USD 85,516,857 EUR 73,066,351 05-Jul-18 111,561USD 609,026,952 JPY 65,947,874,500 05-Jul-18 13,019,217USD 249,400,465 AUD 325,100,000 06-Jul-18 8,771,482USD 458,870,859 EUR 373,819,382 09-Jul-18 21,792,944USD 285,428,988 EUR 231,031,943 10-Jul-18 15,281,147USD 211,023,819 KRW 222,841,152,510 10-Jul-18 11,178,829USD 169,699,245 JPY 18,133,931,000 11-Jul-18 5,745,166USD 45,475,743 AUD 59,466,404 12-Jul-18 1,459,571USD 226,314,107 EUR 181,938,417 12-Jul-18 13,540,021USD 4,495,975 JPY 495,960,000 12-Jul-18 11,550INR 1,945,074,293 USD 29,609,899 13-Jul-18 (1,255,661)USD 246,634,864 EUR 197,987,490 13-Jul-18 15,074,354USD 29,458,677 JPY 3,130,500,000 13-Jul-18 1,151,034INR 1,944,895,667 USD 29,470,349 16-Jul-18 (1,131,025)
FRANKLIN TEMPLETON INVESTMENT FUNDS
Notes to the Financial StatementsAt June 30, 2018 (continued)
Note 5 — Forward foreign exchange contracts (continued)
114 Audited Annual Report www.franklintempleton.lu

As at June 30, 2018, the Company had entered into the following outstanding contracts:
Templeton Global Total Return Fund (continued)Purchases Sales Maturity
DateUnrealisedprofit/(loss)
USD
USD 369,407,441 EUR 311,627,785 16-Jul-18 4,854,821USD 53,750,667 JPY 5,925,310,000 17-Jul-18 156,122USD 117,229,071 AUD 154,970,000 18-Jul-18 2,519,977USD 132,100,795 EUR 105,917,892 18-Jul-18 8,175,985INR 6,945,075,232 USD 106,486,894 19-Jul-18 (5,333,237)MXN 454,357,500 USD 23,629,378 19-Jul-18 (819,446)USD 102,169,967 EUR 87,509,500 19-Jul-18 (224,521)JPY 19,700,000,000 USD 179,163,389 20-Jul-18 (939,716)USD 296,942,113 JPY 31,647,645,000 20-Jul-18 10,629,447USD 253,123,537 EUR 217,055,750 23-Jul-18 (928,375)USD 99,676,599 JPY 10,955,455,000 23-Jul-18 543,370INR 1,996,786,000 USD 29,908,796 24-Jul-18 (847,023)USD 335,793,752 KRW 355,253,000,000 24-Jul-18 17,081,152INR 136,616,000 USD 2,044,385 25-Jul-18 (56,325)USD 154,772,512 EUR 133,249,402 25-Jul-18 (1,211,956)USD 26,609,151 JPY 2,883,820,000 26-Jul-18 508,781USD 34,517,208 EUR 29,347,000 30-Jul-18 150,002USD 62,745,631 JPY 6,747,653,046 30-Jul-18 1,658,125USD 118,301,506 EUR 98,328,154 31-Jul-18 3,143,809USD 75,652,746 JPY 8,230,530,000 31-Jul-18 1,135,142USD 17,057,675 EUR 14,013,000 02-Aug-18 643,639USD 301,070,803 JPY 33,141,783,628 02-Aug-18 968,157USD 21,398,928 EUR 17,599,250 03-Aug-18 782,520MXN 557,930,584 USD 29,177,418 06-Aug-18 (1,250,374)USD 69,002,254 JPY 7,590,800,000 06-Aug-18 246,785INR 1,218,424,500 USD 18,757,979 08-Aug-18 (1,062,980)USD 260,171,606 JPY 28,116,370,000 08-Aug-18 5,464,041MXN 457,839,000 USD 23,731,204 09-Aug-18 (825,713)USD 184,745,718 AUD 246,225,850 09-Aug-18 2,476,000USD 318,867,421 EUR 265,815,219 09-Aug-18 7,332,860USD 205,660,333 JPY 22,253,306,004 09-Aug-18 4,051,951USD 277,813,469 EUR 232,571,362 10-Aug-18 5,218,881USD 45,454,284 AUD 59,426,298 13-Aug-18 1,463,238USD 10,313,505 EUR 8,618,000 13-Aug-18 210,018USD 169,869,775 JPY 18,508,041,779 13-Aug-18 2,143,797MXN 967,646,000 USD 50,311,756 14-Aug-18 (1,941,290)USD 4,633,696 EUR 3,854,000 14-Aug-18 115,021USD 145,673,076 JPY 16,268,040,778 14-Aug-18 (1,763,955)USD 18,860,427 EUR 15,685,325 15-Aug-18 468,486USD 393,129,478 JPY 41,853,109,000 15-Aug-18 13,787,843USD 128,737,812 EUR 106,809,858 16-Aug-18 3,487,157USD 198,967,771 JPY 21,656,972,800 16-Aug-18 2,662,481USD 1,307,359 EUR 1,096,419 17-Aug-18 21,540USD 117,244,896 AUD 154,969,000 20-Aug-18 2,525,007USD 128,398,347 EUR 108,263,227 20-Aug-18 1,402,903USD 78,468,128 JPY 8,592,260,000 20-Aug-18 562,731USD 258,692,343 EUR 217,575,116 21-Aug-18 3,450,995USD 36,588,954 JPY 4,026,825,000 21-Aug-18 75,379USD 6,640,959 JPY 732,438,000 22-Aug-18 (966)USD 208,921,990 JPY 23,085,462,000 23-Aug-18 (437,737)USD 463,487,970 KRW 496,048,000,000 23-Aug-18 18,002,564USD 211,387,471 EUR 178,066,528 24-Aug-18 2,444,382USD 37,740,264 JPY 4,159,582,000 24-Aug-18 14,699MXN 139,958,300 USD 7,329,003 27-Aug-18 (347,967)USD 53,562,812 JPY 5,825,066,000 27-Aug-18 720,553USD 121,216,937 EUR 102,646,774 29-Aug-18 723,649USD 102,196,169 JPY 11,117,946,000 29-Aug-18 1,324,662MXN 109,621,300 USD 5,471,763 04-Sep-18 (10,505)USD 230,935,220 EUR 196,108,789 04-Sep-18 624,541USD 23,227,300 JPY 2,516,678,000 04-Sep-18 383,766MXN 1,179,814,300 USD 60,686,914 05-Sep-18 (1,918,091)USD 275,690,460 JPY 30,003,530,560 05-Sep-18 3,332,563USD 112,325,960 KRW 120,610,000,000 05-Sep-18 3,950,145USD 248,977,835 AUD 325,100,000 06-Sep-18 8,302,161USD 273,432,591 EUR 231,837,786 06-Sep-18 1,119,983USD 26,546,822 JPY 2,894,400,000 06-Sep-18 270,891USD 721,975,933 EUR 614,438,800 07-Sep-18 211,593USD 161,101,244 JPY 17,620,550,000 10-Sep-18 1,091,329USD 260,895,730 EUR 219,099,260 11-Sep-18 3,446,996USD 337,453,460 JPY 36,997,289,860 11-Sep-18 1,461,164MXN 1,278,939,000 USD 66,453,924 12-Sep-18 (2,813,562)USD 45,463,792 AUD 59,426,298 12-Sep-18 1,468,944USD 215,507,874 EUR 181,938,417 12-Sep-18 1,707,957USD 363,177,866 JPY 39,498,150,000 12-Sep-18 4,447,504MXN 1,470,519,940 USD 75,028,917 13-Sep-18 (1,866,270)USD 136,478,226 AUD 179,217,000 13-Sep-18 3,798,775
FRANKLIN TEMPLETON INVESTMENT FUNDS
Notes to the Financial StatementsAt June 30, 2018 (continued)
Note 5 — Forward foreign exchange contracts (continued)
www.franklintempleton.lu Audited Annual Report 115
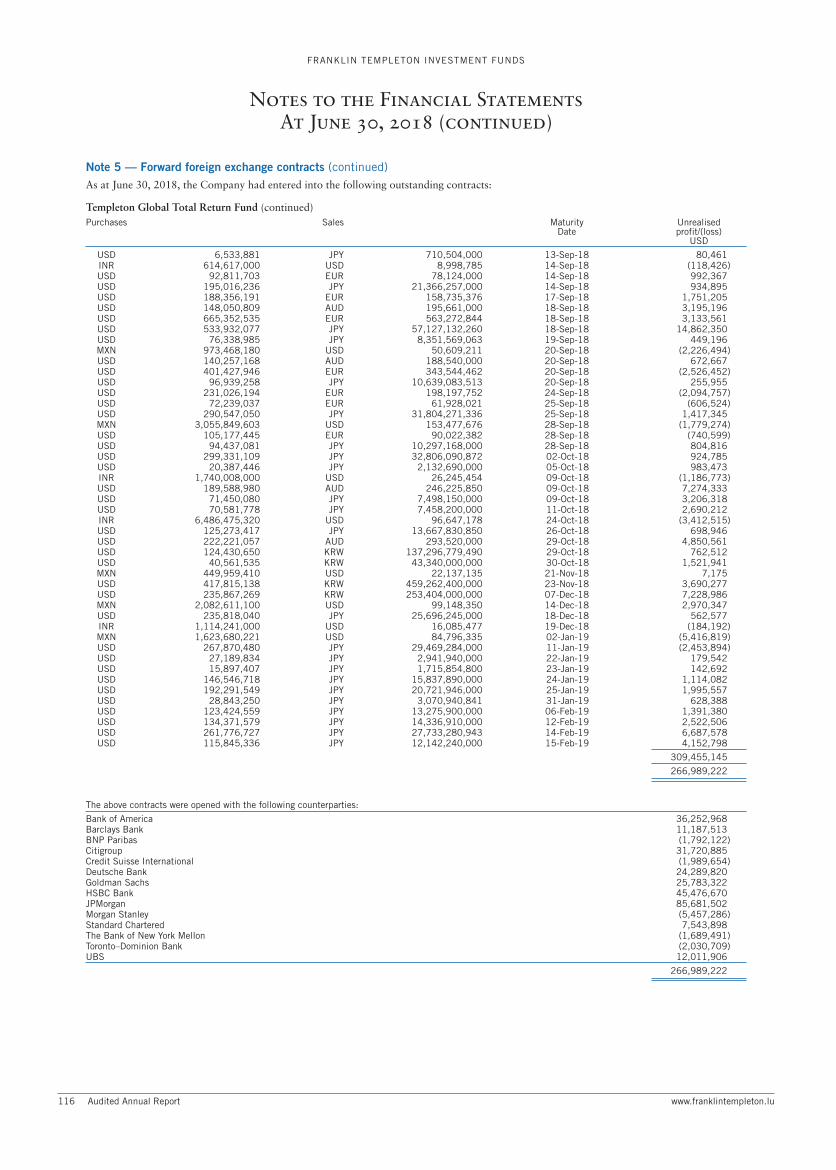
As at June 30, 2018, the Company had entered into the following outstanding contracts:
Templeton Global Total Return Fund (continued)Purchases Sales Maturity
DateUnrealisedprofit/(loss)
USD
USD 6,533,881 JPY 710,504,000 13-Sep-18 80,461INR 614,617,000 USD 8,998,785 14-Sep-18 (118,426)USD 92,811,703 EUR 78,124,000 14-Sep-18 992,367USD 195,016,236 JPY 21,366,257,000 14-Sep-18 934,895USD 188,356,191 EUR 158,735,376 17-Sep-18 1,751,205USD 148,050,809 AUD 195,661,000 18-Sep-18 3,195,196USD 665,352,535 EUR 563,272,844 18-Sep-18 3,133,561USD 533,932,077 JPY 57,127,132,260 18-Sep-18 14,862,350USD 76,338,985 JPY 8,351,569,063 19-Sep-18 449,196MXN 973,468,180 USD 50,609,211 20-Sep-18 (2,226,494)USD 140,257,168 AUD 188,540,000 20-Sep-18 672,667USD 401,427,946 EUR 343,544,462 20-Sep-18 (2,526,452)USD 96,939,258 JPY 10,639,083,513 20-Sep-18 255,955USD 231,026,194 EUR 198,197,752 24-Sep-18 (2,094,757)USD 72,239,037 EUR 61,928,021 25-Sep-18 (606,524)USD 290,547,050 JPY 31,804,271,336 25-Sep-18 1,417,345MXN 3,055,849,603 USD 153,477,676 28-Sep-18 (1,779,274)USD 105,177,445 EUR 90,022,382 28-Sep-18 (740,599)USD 94,437,081 JPY 10,297,168,000 28-Sep-18 804,816USD 299,331,109 JPY 32,806,090,872 02-Oct-18 924,785USD 20,387,446 JPY 2,132,690,000 05-Oct-18 983,473INR 1,740,008,000 USD 26,245,454 09-Oct-18 (1,186,773)USD 189,588,980 AUD 246,225,850 09-Oct-18 7,274,333USD 71,450,080 JPY 7,498,150,000 09-Oct-18 3,206,318USD 70,581,778 JPY 7,458,200,000 11-Oct-18 2,690,212INR 6,486,475,320 USD 96,647,178 24-Oct-18 (3,412,515)USD 125,273,417 JPY 13,667,830,850 26-Oct-18 698,946USD 222,221,057 AUD 293,520,000 29-Oct-18 4,850,561USD 124,430,650 KRW 137,296,779,490 29-Oct-18 762,512USD 40,561,535 KRW 43,340,000,000 30-Oct-18 1,521,941MXN 449,959,410 USD 22,137,135 21-Nov-18 7,175USD 417,815,138 KRW 459,262,400,000 23-Nov-18 3,690,277USD 235,867,269 KRW 253,404,000,000 07-Dec-18 7,228,986MXN 2,082,611,100 USD 99,148,350 14-Dec-18 2,970,347USD 235,818,040 JPY 25,696,245,000 18-Dec-18 562,577INR 1,114,241,000 USD 16,085,477 19-Dec-18 (184,192)MXN 1,623,680,221 USD 84,796,335 02-Jan-19 (5,416,819)USD 267,870,480 JPY 29,469,284,000 11-Jan-19 (2,453,894)USD 27,189,834 JPY 2,941,940,000 22-Jan-19 179,542USD 15,897,407 JPY 1,715,854,800 23-Jan-19 142,692USD 146,546,718 JPY 15,837,890,000 24-Jan-19 1,114,082USD 192,291,549 JPY 20,721,946,000 25-Jan-19 1,995,557USD 28,843,250 JPY 3,070,940,841 31-Jan-19 628,388USD 123,424,559 JPY 13,275,900,000 06-Feb-19 1,391,380USD 134,371,579 JPY 14,336,910,000 12-Feb-19 2,522,506USD 261,776,727 JPY 27,733,280,943 14-Feb-19 6,687,578USD 115,845,336 JPY 12,142,240,000 15-Feb-19 4,152,798
309,455,145
266,989,222
The above contracts were opened with the following counterparties:
Bank of America 36,252,968Barclays Bank 11,187,513BNP Paribas (1,792,122)Citigroup 31,720,885Credit Suisse International (1,989,654)Deutsche Bank 24,289,820Goldman Sachs 25,783,322HSBC Bank 45,476,670JPMorgan 85,681,502Morgan Stanley (5,457,286)Standard Chartered 7,543,898The Bank of New York Mellon (1,689,491)Toronto–Dominion Bank (2,030,709)UBS 12,011,906
266,989,222
FRANKLIN TEMPLETON INVESTMENT FUNDS
Notes to the Financial StatementsAt June 30, 2018 (continued)
Note 5 — Forward foreign exchange contracts (continued)
116 Audited Annual Report www.franklintempleton.lu

As at June 30, 2018, the Company had entered into the following outstanding contracts:
Templeton Latin America Fund
Purchases Sales MaturityDate
Unrealisedprofit/(loss)
USD
Forward foreign exchange contracts used for share class hedging:PLN 27,094,437 USD 7,471,531 16-Jul-18 (231,829)USD 493,832 PLN 1,816,760 16-Jul-18 8,389BRL 971,000 EUR 221,442 25-Jul-18 (9,482)EUR 10,315,082 BRL 44,951,000 25-Jul-18 513,594EUR 6,744,282 MXN 159,965,900 25-Jul-18 (127,950)EUR 8,986,238 USD 10,400,800 25-Jul-18 118,673USD 467,900 EUR 402,437 25-Jul-18 (3,200)
268,195
The above contracts were opened with the following counterparties:
Bank of America 475,792Barclays Bank (20,224)BNP Paribas (18,111)Citigroup (25,767)Deutsche Bank (21,844)Goldman Sachs (21,393)HSBC Bank (19,989)JPMorgan (15,961)Morgan Stanley (18,697)The Bank of New York Mellon (8,048)Toronto–Dominion Bank (21,852)UBS (15,711)
268,195
Note 6 — Open positions on financial future contractsAs at June 30, 2018, the Company had entered into the following outstanding contracts:
Franklin Brazil Opportunities Fund
Number ofcontracts
purchased/(sold)
Description Counterparty Tradingcurrency
CommitmentUSD
Unrealisedprofit/(loss)
USD
Bond Future(20) U.S. Treasury 10 Yr. Note Future, Sep. 2018 JPMorgan USD (2,403,750) (11,627)
Currency Future1 USD/BRL Future, July 2, 2018 CM Capital Markets CCTVM BRL 49,752 1,836
338 USD/BRL Future, July 31, 2018 CM Capital Markets CCTVM BRL 16,942,893 152,882
154,718
Deposit Future(68) BM&F, One-Day Interbank Deposits Future, Jan. 2023 CM Capital Markets CCTVM BRL (1,106,572) 23,995
(230) BM&F, One-Day Interbank Deposits Future, Jan. 2025 CM Capital Markets CCTVM BRL (2,924,377) 260,551450 BM&F, One-Day Interbank Deposits Future, Jan. 2027 Investimentos SA BRL 4,468,187 (305,660)
(21,114)
Index Future(84) Bovespa Index Future, Aug. 2018 CM Capital Markets CCTVM BRL (1,585,943) 9,100
131,077
Franklin Diversified Balanced Fund
Number ofcontracts
purchased/(sold)
Description Counterparty Tradingcurrency
CommitmentEUR
Unrealisedprofit/(loss)
EUR
Bond Future63 U.S. Treasury 10 Yr. Note Future, Sep. 2018 JPMorgan USD 6,480,774 (14,496)
Index Future(497) MSCI Emerging Markets Index Future, Sep. 2018 JPMorgan USD (22,615,659) 132,653240 MSCI World Index Future, Sep. 2018 JPMorgan USD 12,351,778 (228,705)139 U.S. Dollar Index Future, Sep. 2018 JPMorgan USD 11,224,814 94,943
(1,109)
(15,605)
FRANKLIN TEMPLETON INVESTMENT FUNDS
Notes to the Financial StatementsAt June 30, 2018 (continued)
Note 5 — Forward foreign exchange contracts (continued)
www.franklintempleton.lu Audited Annual Report 117

As at June 30, 2018, the Company had entered into the following outstanding contracts:
Franklin Diversified Conservative Fund
Number ofcontracts
purchased/(sold)
Description Counterparty Tradingcurrency
CommitmentEUR
Unrealisedprofit/(loss)
EUR
Bond Future(83) Euro-BOBL Future, Sep. 2018 JPMorgan EUR (10,970,110) (37,557)(34) Euro-OAT Future, Sep. 2018 JPMorgan EUR (5,254,360) (56,185)122 U.S. Treasury 10 Yr. Note Future, Sep. 2018 JPMorgan USD 12,550,071 (28,072)
(121,814)
Index Future(283) MSCI Emerging Markets Index Future, Sep. 2018 JPMorgan USD (12,877,729) 75,535
88 MSCI World Index Future, Sep. 2018 JPMorgan USD 4,528,985 (83,859)185 U.S. Dollar Index Future, Sep. 2018 JPMorgan USD 14,939,500 126,243
117,919
(3,895)
Franklin Diversified Dynamic Fund
Number ofcontracts
purchased/(sold)
Description Counterparty Tradingcurrency
CommitmentEUR
Unrealisedprofit/(loss)
EUR
Bond Future22 U.S. Treasury 10 Yr. Note Future, Sep. 2018 JPMorgan USD 2,263,127 (5,062)
Index Future(318) MSCI Emerging Markets Index Future, Sep. 2018 JPMorgan USD (14,470,381) 84,877277 MSCI World Index Future, Sep. 2018 JPMorgan USD 14,256,011 (263,964)
69 U.S. Dollar Index Future, Sep. 2018 JPMorgan USD 5,572,030 46,191
(132,896)
(137,958)
Franklin Euro Government Bond Fund
Number ofcontracts
purchased/(sold)
Description Counterparty Tradingcurrency
CommitmentEUR
Unrealisedprofit/(loss)
EUR
Bond Future(50) Euro-Bund Future, Sep. 2018 JPMorgan EUR (8,127,500) (119,025)(61) Euro-OAT Future, Sep. 2018 JPMorgan EUR (9,426,940) (114,042)
(233,067)
Franklin Euro Short Duration Bond Fund
Number ofcontracts
purchased/(sold)
Description Counterparty Tradingcurrency
CommitmentEUR
Unrealisedprofit/(loss)
EUR
Bond Future(484) Euro-BOBL Future, Sep. 2018 JPMorgan EUR (63,970,280) (386,050)
Franklin European Corporate Bond Fund
Number ofcontracts
purchased/(sold)
Description Counterparty Tradingcurrency
CommitmentEUR
Unrealisedprofit/(loss)
EUR
Bond Future(26) Euro-Bund Future, Sep. 2018 JPMorgan EUR (4,226,300) (76,765)(10) Euro-OAT Future, Sep. 2018 JPMorgan EUR (1,545,400) (15,825)
(92,590)
Franklin European Total Return Fund
Number ofcontracts
purchased/(sold)
Description Counterparty Tradingcurrency
CommitmentEUR
Unrealisedprofit/(loss)
EUR
Bond Future(746) Euro-Bund Future, Sep. 2018 JPMorgan EUR (121,262,300) (1,641,482)(746) Euro-OAT Future, Sep. 2018 JPMorgan EUR (115,286,840) (1,307,357)
(2,948,839)
FRANKLIN TEMPLETON INVESTMENT FUNDS
Notes to the Financial StatementsAt June 30, 2018 (continued)
Note 6 — Open positions on financial future contracts (continued)
118 Audited Annual Report www.franklintempleton.lu

As at June 30, 2018, the Company had entered into the following outstanding contracts:
Franklin Flexible Alpha Bond Fund
Number ofcontracts
purchased/(sold)
Description Counterparty Tradingcurrency
CommitmentUSD
Unrealisedprofit/(loss)
USD
Bond Future87 Australia 10 Yr. Bond Future, Sep. 2018 JPMorgan AUD 8,329,992 86,28982 Canada 10 Yr. Bond Future, Sep. 2018 JPMorgan CAD 8,530,072 89,654
(109) Euro-Bund Future, Sep. 2018 JPMorgan EUR (20,700,767) (292,041)(624) U.S. Treasury 2 Yr. Note Future, Sep. 2018 JPMorgan USD (132,180,750) 281,190(227) U.S. Treasury 5 Yr. Note Future, Sep. 2018 JPMorgan USD (25,791,102) 55,160
(39) U.S. Treasury 10 Yr. Note Future, Sep. 2018 JPMorgan USD (4,687,312) 4,162133 U.S. Treasury Ultra 10 Yr. Note Future, Sep. 2018 JPMorgan USD 17,055,172 187,201
411,615
Franklin Global Multi-Asset Income Fund
Number ofcontracts
purchased/(sold)
Description Counterparty Tradingcurrency
CommitmentEUR
Unrealisedprofit/(loss)
EUR
Bond Future103 U.S. Treasury 10 Yr. Note Future, Sep. 2018 JPMorgan USD 10,595,551 (23,700)
Index Future(481) MSCI Emerging Markets Index Future, Sep. 2018 JPMorgan USD (21,887,589) 128,383475 MSCI World Index Future, Sep. 2018 JPMorgan USD 24,446,228 (452,646)170 U.S. Dollar Index Future, Sep. 2018 JPMorgan USD 13,728,189 116,664
(207,599)
(231,299)
Franklin K2 Alternative Strategies Fund
Number ofcontracts
purchased/(sold)
Description Counterparty Tradingcurrency
CommitmentUSD
Unrealisedprofit/(loss)
USD
Bond Future(3) Euro-BOBL Future, Sep. 2018 Deutsche Bank EUR (463,044) (1,829)
(73) U.S. Treasury 5 Yr. Note Future, Sep. 2018 Deutsche Bank USD (8,294,055) 2,657(5) Euro BTP Future, Sep. 2018 JPMorgan EUR (742,954) (13,558)
(14) Euro-BUXL 30 Yr. Bond Future, Sep. 2018 JPMorgan EUR (2,905,253) (66,737)165 U.S. Treasury 5 Yr. Note Future, Sep. 2018 JPMorgan USD 18,746,836 (20,907)336 3-month EURIBOR Future, Dec. 2019 Morgan Stanley EUR 98,222,727 65,813
(673) 90 day Eurodollar Future, Dec. 2019 Morgan Stanley USD (163,261,401) (36,280)503 90 day Sterling Future, Dec. 2019 Morgan Stanley GBP 82,041,616 22,310
54 Australia 10 Yr. Bond Future, Sep. 2018 Morgan Stanley AUD 5,169,640 66,252(130) Canada 10 Yr. Bond Future, Sep. 2018 Morgan Stanley CAD (13,518,660) (355,490)
(10) CME Ultra Long Term U.S. Treasury Bond Future, Sep.2018 Morgan Stanley USD (1,595,625) 1,396
181 Euro-BOBL Future, Sep. 2018 Morgan Stanley EUR 27,937,005 105,47698 Euro-Bund Future, Sep. 2018 Morgan Stanley EUR 18,602,938 142,268
(253) Euro-Schatz Future, Sep. 2018 Morgan Stanley EUR (33,115,899) (24,814)15 Japan 10 Yr. Bond Future, Sep. 2018 Morgan Stanley JPY 20,436,255 22,835
211 Long Gilt Future, Sep. 2018 Morgan Stanley GBP 34,268,145 296,10814 mini-10 Yr. JGB Future, Sep. 2018 Morgan Stanley JPY 1,907,385 40
(81) U.S. Long Bond Treasury Future, Sep. 2018 Morgan Stanley USD (11,745,000) (181,005)(150) U.S. Treasury 2 Yr. Note Future, Sep. 2018 Morgan Stanley USD (31,774,214) 1,487(282) U.S. Treasury 5 Yr. Note Future, Sep. 2018 Morgan Stanley USD (32,040,040) (127,403)(237) U.S. Treasury 10 Yr. Note Future, Sep. 2018 Morgan Stanley USD (28,484,454) (261,972)
(363,353)
Index Future(773) S&P 500 E-mini Index Future, Sep. 2018 JPMorgan USD (105,189,840) 2,127,658
84 CAC 40 Index Future, Jul. 2018 Morgan Stanley EUR 5,219,160 (121,327)(74) DJIA mini E-cbot Index Future, Sep. 2018 Morgan Stanley USD (8,978,050) 101,897
(284) Euro STOXX 50 Index Future, Sep. 2018 Morgan Stanley EUR (11,246,429) 304,1226 FTSE 100 Index Future, Sep. 2018 Morgan Stanley GBP 601,928 26,9119 Hang Seng Index Future, Jul. 2018 Morgan Stanley HKD 1,647,639 (6,752)
94 Nasdaq 100 E-mini Index Future, Sep. 2018 Morgan Stanley USD 13,285,490 (237,410)76 Nikkei 225 Index Future, Sep. 2018 Morgan Stanley JPY 15,300,914 (109,602)
183 Russell 2000 mini Index Future, Sep. 2018 Morgan Stanley USD 15,074,625 (281,630)(12) S&P 500 E-mini Index Future, Sep. 2018 Morgan Stanley USD (1,632,960) 49,412
(246) STOXX Europe 600 Index Future, Sep. 2018 Morgan Stanley EUR (2,303,976) 69,17544 Topix Index Future, Sep. 2018 Morgan Stanley JPY 6,877,296 (138,981)
1,783,473
1,420,120
FRANKLIN TEMPLETON INVESTMENT FUNDS
Notes to the Financial StatementsAt June 30, 2018 (continued)
Note 6 — Open positions on financial future contracts (continued)
www.franklintempleton.lu Audited Annual Report 119

As at June 30, 2018, the Company had entered into the following outstanding contracts:
Franklin K2 Global Macro Opportunities Fund
Number ofcontracts
purchased/(sold)
Description Counterparty Tradingcurrency
CommitmentUSD
Unrealisedprofit/(loss)
USD
Bond Future2 90 day Bank Bill Future, Jun. 2019 JPMorgan AUD 1,472,620 703 90 day Bank Bill Future, Sep. 2019 JPMorgan AUD 2,208,660 2313 90 day Bank Bill Future, Dec. 2019 JPMorgan AUD 2,208,387 1591 90 day Bank Bill Future, Mar. 2020 JPMorgan AUD 736,057 71
(4) 90 day Eurodollar Future, Mar. 2019 JPMorgan USD (972,400) (220)(8) 90 day Eurodollar Future, Jun. 2019 JPMorgan USD (1,942,904) 435(7) 90 day Eurodollar Future, Sep. 2019 JPMorgan USD (1,698,900) 12(6) 90 day Eurodollar Future, Dec. 2019 JPMorgan USD (1,455,528) (324)(6) 90 day Eurodollar Future, Mar. 2020 JPMorgan USD (1,455,300) 327(1) 90 day Eurodollar Future, Jun. 2020 JPMorgan GBP (162,956) (116)(5) 90 day Eurodollar Future, Jun. 2020 JPMorgan USD (1,212,750) (22)(3) 90 day Eurodollar Future, Sep. 2020 JPMorgan GBP (488,622) (943)(5) 90 day Eurodollar Future, Sep. 2020 JPMorgan USD (1,212,815) (246)(4) 90 day Eurodollar Future, Dec. 2020 JPMorgan USD (970,200) (482)(1) 90 day Sterling Future, Mar. 2019 JPMorgan GBP (163,418) 49(4) 90 day Sterling Future, Jun. 2019 JPMorgan GBP (653,276) (333)(1) 90 day Sterling Future, Dec. 2019 JPMorgan GBP (163,105) (397)(5) 90 day Sterling Future, Mar. 2020 JPMorgan GBP (815,110) (747)(3) 90 day Sterling Future, Dec. 2020 JPMorgan GBP (488,423) (52)14 Australia 3 Yr. Bond Future, Sep. 2018 JPMorgan AUD 1,153,600 1,089
1 Canada 10 Yr. Bond Future, Sep. 2018 JPMorgan CAD 103,990 (465)1 Euro-Bund Future, Sep. 2018 JPMorgan EUR 189,826 675
(1) Euro-BUXL 30 Yr. Bond Future, Sep. 2018 JPMorgan EUR (207,518) (4,767)4 Euro-OAT Future, Sep. 2018 JPMorgan EUR 721,888 6,8011 Euro-Schatz Future, Sep. 2018 JPMorgan EUR 130,893 1099 mini-10 Yr. JGB Future, Sep. 2018 JPMorgan JPY 1,226,176 903
(3) U.S. Treasury 2 Yr. Note Future, Sep. 2018 JPMorgan USD (635,484) 73(5) U.S. Treasury 5 Yr. Note Future, Sep. 2018 JPMorgan USD (568,085) (455)(4) U.S. Treasury 10 Yr. Note Future, Sep. 2018 JPMorgan USD (480,752) (2,469)1 3-month EURIBOR Future, Dec. 2019 Morgan Stanley EUR 292,330 (16)
(7) 90 day Eurodollar Future, Dec. 2019 Morgan Stanley USD (1,698,113) 211(9) Canada 10 Yr. Bond Future, Sep. 2018 Morgan Stanley CAD (935,907) (27,527)3 Euro-BOBL Future, Sep. 2018 Morgan Stanley EUR 463,044 1,9943 Euro-Bund Future, Sep. 2018 Morgan Stanley EUR 569,478 4,5867 Long Gilt Future, Sep. 2018 Morgan Stanley GBP 1,136,856 562
(3) U.S. Long Bond Treasury Future, Sep. 2018 Morgan Stanley USD (435,000) (5,950)(5) U.S. Treasury 2 Yr. Note Future, Sep. 2018 Morgan Stanley USD (1,059,140) (366)
(11) U.S. Treasury 5 Yr. Note Future, Sep. 2018 Morgan Stanley USD (1,249,788) (4,429)(11) U.S. Treasury 10 Yr. Note Future, Sep. 2018 Morgan Stanley USD (1,322,065) (9,313)
(41,282)
Currency Future(13) AUD/USD Future, Sep. 2018 JPMorgan USD (961,740) 11,702(17) CAD/USD Future, Sep. 2018 JPMorgan USD (1,294,720) 10,131(12) CHF/USD Future, Sep. 2018 JPMorgan USD (1,523,253) 8,365
(9) EUR/USD Future, Sep. 2018 JPMorgan USD (1,320,354) 14,2176 GBP/USD Future, Sep. 2018 JPMorgan USD 496,350 (5,083)
(4) JPY/USD Future, Sep. 2018 JPMorgan USD (453,376) 2,284(1) MXN/USD Future, Sep. 2018 JPMorgan USD (24,855) (1,097)
(12) NZD/USD Future, Sep. 2018 JPMorgan USD (812,400) 18,754(29) AUD/USD Future, Sep. 2018 Morgan Stanley USD (2,145,420) 50,926
(1) CHF/USD Future, Sep. 2018 Morgan Stanley USD (126,938) 772(52) EUR/USD Future, Sep. 2018 Morgan Stanley USD (7,628,725) 64,520
(1) GBP/USD Future, Sep. 2018 Morgan Stanley USD (82,725) 1,241(24) MXN/USD Future, Sep. 2018 Morgan Stanley USD (596,520) (26,220)
(1) NZD/USD Future, Sep. 2018 Morgan Stanley USD (67,700) 2,3541 USD/NOK Future, Sep. 2018 Morgan Stanley NOK 99,866 1,7083 USD/SEK Future, Sep. 2018 Morgan Stanley SEK 298,523 5,155
(3) ZAR/USD Future, Sep. 2018 Morgan Stanley USD (108,150) 3,067
162,796
Index Future2 AEX Index Future, Jul. 2018 JPMorgan EUR 257,664 (3,845)6 CAC 40 Index Future, Jul. 2018 JPMorgan EUR 372,798 (7,486)1 DJIA mini E-cbot Index Future, Sep. 2018 JPMorgan USD 121,325 (5,277)3 Euro STOXX 50 Index Future, Sep. 2018 JPMorgan EUR 118,800 (2,140)3 FTSE 100 Index Future, Sep. 2018 JPMorgan GBP 300,963 (2,104)1 FTSE/JSE Africa Top 40 Index Future, Sep. 2018 JPMorgan ZAR 37,679 4362 Hang Seng China Enterprises Index Future, Jul. 2018 JPMorgan HKD 138,536 (1,235)1 Hang Seng Index Future, Jul. 2018 JPMorgan HKD 183,071 (1,303)1 MSCI EAFE Index Future, Sep. 2018 JPMorgan USD 97,770 (3,437)1 Nasdaq 100 E-mini Index Future, Sep. 2018 JPMorgan USD 141,335 (3,205)1 Nikkei 225 Index Future, Sep. 2018 JPMorgan JPY 100,438 (913)1 Nikkei 225 Index Future, Sep. 2018 JPMorgan USD 111,325 (1,453)
FRANKLIN TEMPLETON INVESTMENT FUNDS
Notes to the Financial StatementsAt June 30, 2018 (continued)
Note 6 — Open positions on financial future contracts (continued)
120 Audited Annual Report www.franklintempleton.lu

As at June 30, 2018, the Company had entered into the following outstanding contracts:
Franklin K2 Global Macro Opportunities Fund (continued)Number ofcontracts
purchased/(sold)
Description Counterparty Tradingcurrency
CommitmentUSD
Unrealisedprofit/(loss)
USD
1 OMXS 30 Index Future, Jul. 2018 JPMorgan SEK 17,428 (109)4 Russell 2000 mini Index Future, Sep. 2018 JPMorgan USD 329,500 (8,307)1 S&P 500 E-mini Index Future, Sep. 2018 JPMorgan USD 136,080 (3,259)1 S&P MidCap 400 E-mini Index Future, Sep. 2018 JPMorgan USD 195,610 (5,342)4 S&P/TSX 60 IX Index Future, Sep. 2018 JPMorgan CAD 586,196 6,0816 SPI 200 Index Future, Sep. 2018 JPMorgan AUD 682,475 12,6651 Topix Index Future, Sep. 2018 JPMorgan JPY 156,302 (5,468)1 CAC 40 Index Future, Jul. 2018 Morgan Stanley EUR 62,133 (1,881)
(6) DJIA mini E-cbot Index Future, Sep. 2018 Morgan Stanley USD (727,950) 30,5184 FTSE 100 Index Future, Sep. 2018 Morgan Stanley GBP 401,284 (849)2 Nasdaq 100 E-mini Index Future, Sep. 2018 Morgan Stanley USD 282,670 (3,479)
(1) Nikkei 225 Index Future, Sep. 2018 Morgan Stanley JPY (201,328) 5,7787 Russell 2000 mini Index Future, Sep. 2018 Morgan Stanley USD 576,625 (9,599)
(2) S&P 500 E-mini Index Future, Sep. 2018 Morgan Stanley USD (272,160) 5,262
(9,951)
111,563
Franklin K2 Long Short Credit Fund
Number ofcontracts
purchased/(sold)
Description Counterparty Tradingcurrency
CommitmentUSD
Unrealisedprofit/(loss)
USD
Bond Future(1) Euro BTP Future, Sep. 2018 JPMorgan EUR (148,591) (2,712)(2) Euro-BUXL 30 Yr. Bond Future, Sep. 2018 JPMorgan EUR (415,036) (9,533)
(12,245)
Index Future(2) S&P 500 E-mini Index Future, Sep. 2018 JPMorgan USD (272,160) 6,514
(5,731)
Franklin Strategic Income Fund
Number ofcontracts
purchased/(sold)
Description Counterparty Tradingcurrency
CommitmentUSD
Unrealisedprofit/(loss)
USD
Bond Future(75) Euro-Bund Future, Sep. 2018 JPMorgan EUR (14,243,647) (219,097)
Franklin U.S. Low Duration Fund
Number ofcontracts
purchased/(sold)
Description Counterparty Tradingcurrency
CommitmentUSD
Unrealisedprofit/(loss)
USD
Bond Future32 Canada 10 Yr. Bond Future, Sep. 2018 JPMorgan CAD 3,328,808 34,987
(50) Euro-BOBL Future, Sep. 2018 JPMorgan EUR (7,721,041) (28,157)(34) Euro-Bund Future, Sep. 2018 JPMorgan EUR (6,457,120) (52,118)536 U.S. Treasury 2 Yr. Note Future, Sep. 2018 JPMorgan USD 113,539,875 (286,090)
(106) U.S. Treasury 5 Yr. Note Future, Sep. 2018 JPMorgan USD (12,043,422) 26,695(63) U.S. Treasury 10 Yr. Note Future, Sep. 2018 JPMorgan USD (7,571,812) 12,200
(292,483)
Note 7 — Open positions on interest rate swap contractsAs at June 30, 2018, the Company had entered into the following outstanding contracts:
Franklin European Total Return Fund
Notionalamount
Description Counterparty Maturitydate
Tradingcurrency
Unrealisedprofit/(loss)
EUR
350,000,000 Receiving floating rate 6-month CZK PRIBORPaying fixed rate 1.846% HSBC Bank 11-Jan-22 CZK 31,617
FRANKLIN TEMPLETON INVESTMENT FUNDS
Notes to the Financial StatementsAt June 30, 2018 (continued)
Note 6 — Open positions on financial future contracts (continued)
www.franklintempleton.lu Audited Annual Report 121

As at June 30, 2018, the Company had entered into the following outstanding contracts:
Franklin Flexible Alpha Bond Fund
Notionalamount
Description Counterparty Maturitydate
Tradingcurrency
Unrealisedprofit/(loss)
USD
22,800,000 Receiving floating rate 3-month USD BBA LIBORPaying fixed rate 2.788% Citigroup 26-Mar-23 USD 96,714
22,800,000 Receiving floating rate 3-month USD BBA LIBORPaying fixed rate 2.79% Citigroup 28-Mar-23 USD 94,348
13,600,000 Receiving floating rate 3-month USD BBA LIBORPaying fixed rate 2.7125% Citigroup 29-Mar-23 USD 103,227
18,500,000 Receiving floating rate 3-month USD BBA LIBORPaying fixed rate 2.806% Citigroup 17-Apr-23 USD 65,521
40,000,000 Receiving floating rate 3-month USD BBA LIBORPaying fixed rate 2% Citigroup 20-Jun-25 USD (76,417)
14,000,000 Receiving floating rate 3-month USD BBA LIBORPaying fixed rate 2.883% Citigroup 26-Mar-28 USD 51,318
334,711
Franklin Global Fundamental Strategies Fund
Notionalamount
Description Counterparty Maturitydate
Tradingcurrency
Unrealisedprofit/(loss)
USD
1,010,000 Receiving floating rate 3-month USD BBA LIBORPaying fixed rate 4.34675% Citigroup 25-Feb-41 USD (240,057)
9,042,000 Receiving floating rate 3-month USD BBA LIBORPaying fixed rate 2.97981% Citigroup 20-Feb-48 USD (102,234)
9,042,000 Receiving floating rate 3-month USD BBA LIBORPaying fixed rate 3.002% Citigroup 22-Feb-48 USD (131,010)
9,042,000 Receiving floating rate 3-month USD BBA LIBORPaying fixed rate 3.019% Citigroup 23-Feb-48 USD (162,901)
600,000 Receiving floating rate 3-month USD BBA LIBORPaying fixed rate 3.523% Deutsche Bank 28-Mar-21 USD (10,815)
430,000 Receiving floating rate 3-month USD BBA LIBORPaying fixed rate 2.775% Deutsche Bank 04-Oct-23 USD 2,373
430,000 Receiving floating rate 3-month USD BBA LIBORPaying fixed rate 2.795% Deutsche Bank 04-Oct-23 USD 1,951
210,000 Receiving floating rate 3-month USD BBA LIBORPaying fixed rate 3.668% Deutsche Bank 04-Oct-43 USD (27,959)
210,000 Receiving floating rate 3-month USD BBA LIBORPaying fixed rate 3.68655% Deutsche Bank 04-Oct-43 USD (28,682)
430,000 Receiving floating rate 3-month USD BBA LIBORPaying fixed rate 2.765% HSBC Bank 07-Oct-23 USD 2,590
210,000 Receiving floating rate 3-month USD BBA LIBORPaying fixed rate 3.675% HSBC Bank 07-Oct-43 USD (28,238)
330,000 Receiving floating rate 3-month USD BBA LIBORPaying fixed rate 3.5575% JPMorgan 04-Mar-21 USD (6,127)
5,610,000 Receiving floating rate 3-month USD BBA LIBORPaying fixed rate 2.7305% JPMorgan 07-Jul-24 USD 48,974
9,452,000 Receiving floating rate 3-month USD BBA LIBORPaying fixed rate 1.91422% JPMorgan 22-Jan-25 USD 556,702
29,540,000 Receiving floating rate 3-month USD BBA LIBORPaying fixed rate 1.96953% JPMorgan 23-Jan-25 USD 1,641,962
17,440,000 Receiving floating rate 3-month USD BBA LIBORPaying fixed rate 1.973% JPMorgan 27-Jan-25 USD 967,449
4,360,000 Receiving floating rate 3-month USD BBA LIBORPaying fixed rate 1.9367% JPMorgan 29-Jan-25 USD 251,374
3,690,000 Receiving floating rate 3-month USD BBA LIBORPaying fixed rate 1.94152% JPMorgan 30-Jan-25 USD 211,929
5,820,000 Receiving floating rate 3-month USD BBA LIBORPaying fixed rate 1.81667% JPMorgan 03-Feb-25 USD 378,959
830,000 Receiving floating rate 3-month USD BBA LIBORPaying fixed rate 4.215% JPMorgan 11-Jan-41 USD (177,846)
1,010,000 Receiving floating rate 3-month USD BBA LIBORPaying fixed rate 4.3494% JPMorgan 25-Feb-41 USD (242,935)
760,000 Receiving floating rate 3-month USD BBA LIBORPaying fixed rate 4.3201% JPMorgan 28-Feb-41 USD (177,254)
250,000 Receiving floating rate 3-month USD BBA LIBORPaying fixed rate 4.299% JPMorgan 01-Mar-41 USD (57,456)
30,700,000 Receiving floating rate 3-month USD BBA LIBORPaying fixed rate 2.3782% JPMorgan 18-Nov-46 USD 3,465,864
10,100,000 Receiving floating rate 3-month USD BBA LIBORPaying fixed rate 2.7935% JPMorgan 13-Mar-47 USD 295,056
FRANKLIN TEMPLETON INVESTMENT FUNDS
Notes to the Financial StatementsAt June 30, 2018 (continued)
Note 7 — Open positions on interest rate swap contracts (continued)
122 Audited Annual Report www.franklintempleton.lu
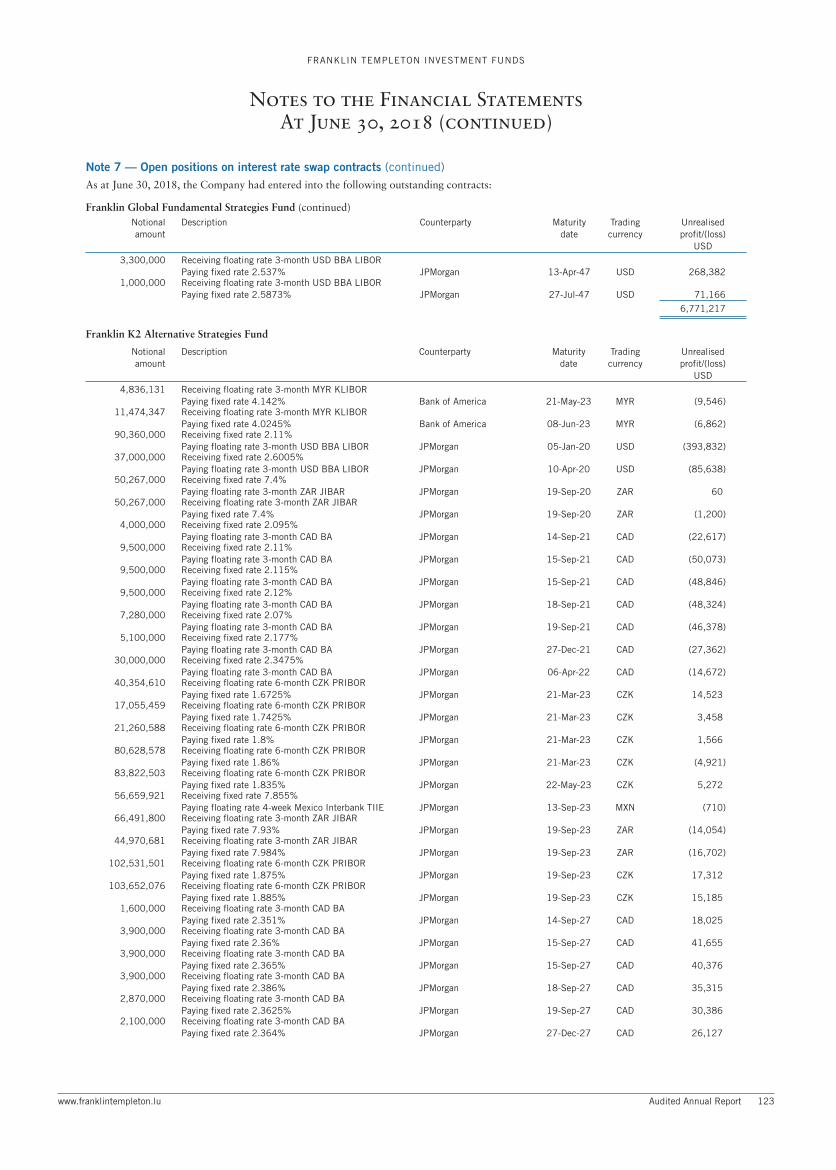
As at June 30, 2018, the Company had entered into the following outstanding contracts:
Franklin Global Fundamental Strategies Fund (continued)Notionalamount
Description Counterparty Maturitydate
Tradingcurrency
Unrealisedprofit/(loss)
USD
3,300,000 Receiving floating rate 3-month USD BBA LIBORPaying fixed rate 2.537% JPMorgan 13-Apr-47 USD 268,382
1,000,000 Receiving floating rate 3-month USD BBA LIBORPaying fixed rate 2.5873% JPMorgan 27-Jul-47 USD 71,166
6,771,217
Franklin K2 Alternative Strategies Fund
Notionalamount
Description Counterparty Maturitydate
Tradingcurrency
Unrealisedprofit/(loss)
USD
4,836,131 Receiving floating rate 3-month MYR KLIBORPaying fixed rate 4.142% Bank of America 21-May-23 MYR (9,546)
11,474,347 Receiving floating rate 3-month MYR KLIBORPaying fixed rate 4.0245% Bank of America 08-Jun-23 MYR (6,862)
90,360,000 Receiving fixed rate 2.11%Paying floating rate 3-month USD BBA LIBOR JPMorgan 05-Jan-20 USD (393,832)
37,000,000 Receiving fixed rate 2.6005%Paying floating rate 3-month USD BBA LIBOR JPMorgan 10-Apr-20 USD (85,638)
50,267,000 Receiving fixed rate 7.4%Paying floating rate 3-month ZAR JIBAR JPMorgan 19-Sep-20 ZAR 60
50,267,000 Receiving floating rate 3-month ZAR JIBARPaying fixed rate 7.4% JPMorgan 19-Sep-20 ZAR (1,200)
4,000,000 Receiving fixed rate 2.095%Paying floating rate 3-month CAD BA JPMorgan 14-Sep-21 CAD (22,617)
9,500,000 Receiving fixed rate 2.11%Paying floating rate 3-month CAD BA JPMorgan 15-Sep-21 CAD (50,073)
9,500,000 Receiving fixed rate 2.115%Paying floating rate 3-month CAD BA JPMorgan 15-Sep-21 CAD (48,846)
9,500,000 Receiving fixed rate 2.12%Paying floating rate 3-month CAD BA JPMorgan 18-Sep-21 CAD (48,324)
7,280,000 Receiving fixed rate 2.07%Paying floating rate 3-month CAD BA JPMorgan 19-Sep-21 CAD (46,378)
5,100,000 Receiving fixed rate 2.177%Paying floating rate 3-month CAD BA JPMorgan 27-Dec-21 CAD (27,362)
30,000,000 Receiving fixed rate 2.3475%Paying floating rate 3-month CAD BA JPMorgan 06-Apr-22 CAD (14,672)
40,354,610 Receiving floating rate 6-month CZK PRIBORPaying fixed rate 1.6725% JPMorgan 21-Mar-23 CZK 14,523
17,055,459 Receiving floating rate 6-month CZK PRIBORPaying fixed rate 1.7425% JPMorgan 21-Mar-23 CZK 3,458
21,260,588 Receiving floating rate 6-month CZK PRIBORPaying fixed rate 1.8% JPMorgan 21-Mar-23 CZK 1,566
80,628,578 Receiving floating rate 6-month CZK PRIBORPaying fixed rate 1.86% JPMorgan 21-Mar-23 CZK (4,921)
83,822,503 Receiving floating rate 6-month CZK PRIBORPaying fixed rate 1.835% JPMorgan 22-May-23 CZK 5,272
56,659,921 Receiving fixed rate 7.855%Paying floating rate 4-week Mexico Interbank TIIE JPMorgan 13-Sep-23 MXN (710)
66,491,800 Receiving floating rate 3-month ZAR JIBARPaying fixed rate 7.93% JPMorgan 19-Sep-23 ZAR (14,054)
44,970,681 Receiving floating rate 3-month ZAR JIBARPaying fixed rate 7.984% JPMorgan 19-Sep-23 ZAR (16,702)
102,531,501 Receiving floating rate 6-month CZK PRIBORPaying fixed rate 1.875% JPMorgan 19-Sep-23 CZK 17,312
103,652,076 Receiving floating rate 6-month CZK PRIBORPaying fixed rate 1.885% JPMorgan 19-Sep-23 CZK 15,185
1,600,000 Receiving floating rate 3-month CAD BAPaying fixed rate 2.351% JPMorgan 14-Sep-27 CAD 18,025
3,900,000 Receiving floating rate 3-month CAD BAPaying fixed rate 2.36% JPMorgan 15-Sep-27 CAD 41,655
3,900,000 Receiving floating rate 3-month CAD BAPaying fixed rate 2.365% JPMorgan 15-Sep-27 CAD 40,376
3,900,000 Receiving floating rate 3-month CAD BAPaying fixed rate 2.386% JPMorgan 18-Sep-27 CAD 35,315
2,870,000 Receiving floating rate 3-month CAD BAPaying fixed rate 2.3625% JPMorgan 19-Sep-27 CAD 30,386
2,100,000 Receiving floating rate 3-month CAD BAPaying fixed rate 2.364% JPMorgan 27-Dec-27 CAD 26,127
FRANKLIN TEMPLETON INVESTMENT FUNDS
Notes to the Financial StatementsAt June 30, 2018 (continued)
Note 7 — Open positions on interest rate swap contracts (continued)
www.franklintempleton.lu Audited Annual Report 123

As at June 30, 2018, the Company had entered into the following outstanding contracts:
Franklin K2 Alternative Strategies Fund (continued)Notionalamount
Description Counterparty Maturitydate
Tradingcurrency
Unrealisedprofit/(loss)
USD
17,900,000 Receiving floating rate 3-month USD BBA LIBORPaying fixed rate 2.432% JPMorgan 05-Jan-28 USD 609,967
11,000,000 Receiving floating rate 3-month CAD BAPaying fixed rate 2.5315% JPMorgan 06-Apr-28 CAD 6,426
5,500,000 Receiving floating rate 3-month USD BBA LIBORPaying fixed rate 2.803% JPMorgan 10-Apr-28 USD 50,997
31,296,165 Receiving fixed rate 8.364%Paying floating rate 3-month ZAR JIBAR JPMorgan 19-Sep-28 ZAR 7,703
31,296,165 Receiving floating rate 3-month ZAR JIBARPaying fixed rate 8.364% JPMorgan 19-Sep-28 ZAR (1,343)
16,335,281 Receiving floating rate 3-month ZAR JIBARPaying fixed rate 8.428% JPMorgan 19-Sep-28 ZAR (5,820)
16,532,191 Receiving floating rate 3-month ZAR JIBARPaying fixed rate 8.429% JPMorgan 19-Sep-28 ZAR (5,971)
16,518,025 Receiving floating rate 3-month ZAR JIBARPaying fixed rate 8.464% JPMorgan 19-Sep-28 ZAR (8,746)
16,612,107 Receiving floating rate 3-month ZAR JIBARPaying fixed rate 8.48% JPMorgan 19-Sep-28 ZAR (10,147)
688,077 Receiving floating rate 6-month GBP LIBORPaying fixed rate 1.556% JPMorgan 29-Nov-46 GBP 14,318
306,623 Receiving floating rate 6-month GBP LIBORPaying fixed rate 1.596% JPMorgan 01-Dec-46 GBP 2,544
692,041 Receiving floating rate 6-month GBP LIBORPaying fixed rate 1.44% JPMorgan 05-Jan-47 GBP 36,774
700,000 Receiving floating rate 6-month GBP LIBORPaying fixed rate 1.37% JPMorgan 05-Jan-67 GBP 49,054
1,258,000 Receiving floating rate 6-month GBP LIBORPaying fixed rate 1.41% JPMorgan 04-Aug-67 GBP 64,140
1,194,000 Receiving floating rate 6-month GBP LIBORPaying fixed rate 1.339% JPMorgan 14-Dec-67 GBP 106,011
4,768,646 Receiving floating rate 3-month MYR KLIBORPaying fixed rate 4.1425% Morgan Stanley 18-May-23 MYR (9,499)
363,931
Franklin K2 Global Macro Opportunities Fund
Notionalamount
Description Counterparty Maturitydate
Tradingcurrency
Unrealisedprofit/(loss)
USD
235,796 Receiving floating rate 3-month MYR KLIBORPaying fixed rate 4.142% Bank of America 21-May-23 MYR (465)
514,374 Receiving floating rate 3-month MYR KLIBORPaying fixed rate 4.0245% Bank of America 08-Jun-23 MYR (308)
2,162,532 Receiving fixed rate 7.4%Paying floating rate 3-month ZAR JIBAR JPMorgan 19-Sep-20 ZAR (33)
4,099,347 Receiving fixed rate 7.405%Paying floating rate 3-month ZAR JIBAR JPMorgan 19-Sep-20 ZAR 1,099
2,162,532 Receiving floating rate 3-month ZAR JIBARPaying fixed rate 7.4% JPMorgan 19-Sep-20 ZAR (52)
4,099,347 Receiving floating rate 3-month ZAR JIBARPaying fixed rate 7.405% JPMorgan 19-Sep-20 ZAR (125)
1,318,884 Receiving floating rate 6-month CZK PRIBORPaying fixed rate 1.6725% JPMorgan 21-Mar-23 CZK 475
1,025,015 Receiving floating rate 6-month CZK PRIBORPaying fixed rate 1.7425% JPMorgan 21-Mar-23 CZK 208
1,534,258 Receiving floating rate 6-month CZK PRIBORPaying fixed rate 1.8% JPMorgan 21-Mar-23 CZK 113
3,767,658 Receiving floating rate 6-month CZK PRIBORPaying fixed rate 1.86% JPMorgan 21-Mar-23 CZK (230)
3,199,498 Receiving floating rate 6-month CZK PRIBORPaying fixed rate 1.835% JPMorgan 22-May-23 CZK 201
2,620,246 Receiving fixed rate 7.855%Paying floating rate 4-week Mexico Interbank TIIE JPMorgan 13-Sep-23 MXN (33)
3,100,148 Receiving floating rate 3-month ZAR JIBARPaying fixed rate 7.93% JPMorgan 19-Sep-23 ZAR (655)
2,054,597 Receiving floating rate 3-month ZAR JIBARPaying fixed rate 7.984% JPMorgan 19-Sep-23 ZAR (763)
4,742,194 Receiving floating rate 6-month CZK PRIBORPaying fixed rate 1.875% JPMorgan 19-Sep-23 CZK 801
FRANKLIN TEMPLETON INVESTMENT FUNDS
Notes to the Financial StatementsAt June 30, 2018 (continued)
Note 7 — Open positions on interest rate swap contracts (continued)
124 Audited Annual Report www.franklintempleton.lu

As at June 30, 2018, the Company had entered into the following outstanding contracts:
Franklin K2 Global Macro Opportunities Fund (continued)Notionalamount
Description Counterparty Maturitydate
Tradingcurrency
Unrealisedprofit/(loss)
USD
5,194,473 Receiving floating rate 6-month CZK PRIBORPaying fixed rate 1.885% JPMorgan 19-Sep-23 CZK 761
1,448,024 Receiving fixed rate 8.364%Paying floating rate 3-month ZAR JIBAR JPMorgan 19-Sep-28 ZAR 356
1,448,024 Receiving floating rate 3-month ZAR JIBARPaying fixed rate 8.364% JPMorgan 19-Sep-28 ZAR (62)
756,132 Receiving floating rate 3-month ZAR JIBARPaying fixed rate 8.428% JPMorgan 19-Sep-28 ZAR (269)
764,984 Receiving floating rate 3-month ZAR JIBARPaying fixed rate 8.429% JPMorgan 19-Sep-28 ZAR (276)
764,449 Receiving floating rate 3-month ZAR JIBARPaying fixed rate 8.464% JPMorgan 19-Sep-28 ZAR (405)
768,430 Receiving floating rate 3-month ZAR JIBARPaying fixed rate 8.48% JPMorgan 19-Sep-28 ZAR (469)
76,973 Receiving floating rate 6-month GBP LIBORPaying fixed rate 1.556% JPMorgan 29-Nov-46 GBP 1,602
37,720 Receiving floating rate 6-month GBP LIBORPaying fixed rate 1.596% JPMorgan 01-Dec-46 GBP 313
83,425 Receiving floating rate 6-month GBP LIBORPaying fixed rate 1.44% JPMorgan 05-Jan-47 GBP 4,433
70,000 Receiving floating rate 6-month GBP LIBORPaying fixed rate 1.287% JPMorgan 27-Feb-67 GBP 7,830
59,000 Receiving floating rate 6-month GBP LIBORPaying fixed rate 1.41% JPMorgan 04-Aug-67 GBP 3,008
232,634 Receiving floating rate 3-month MYR KLIBORPaying fixed rate 4.1425% Morgan Stanley 18-May-23 MYR (463)
16,592
Franklin K2 Long Short Credit Fund
Notionalamount
Description Counterparty Maturitydate
Tradingcurrency
Unrealisedprofit/(loss)
USD
507,406 Receiving floating rate 3-month MYR KLIBORPaying fixed rate 4.142% Bank of America 21-May-23 MYR (1,002)
1,108,927 Receiving floating rate 3-month MYR KLIBORPaying fixed rate 4.0245% Bank of America 08-Jun-23 MYR (663)
2,024,000 Receiving floating rate 3-month USD BBA LIBORPaying fixed rate 1.75% JPMorgan 21-Mar-20 USD 11,907
4,648,276 Receiving fixed rate 7.4%Paying floating rate 3-month ZAR JIBAR JPMorgan 19-Sep-20 ZAR (71)
13,946,572 Receiving fixed rate 7.405%Paying floating rate 3-month ZAR JIBAR JPMorgan 19-Sep-20 ZAR 105
4,648,276 Receiving floating rate 3-month ZAR JIBARPaying fixed rate 7.4% JPMorgan 19-Sep-20 ZAR (111)
1,012,000 Receiving floating rate 3-month USD BBA LIBORPaying fixed rate 2% JPMorgan 21-Mar-23 USD 23,281
3,123,604 Receiving floating rate 6-month CZK PRIBORPaying fixed rate 1.6725% JPMorgan 21-Mar-23 CZK 1,124
1,875,257 Receiving floating rate 6-month CZK PRIBORPaying fixed rate 1.7425% JPMorgan 21-Mar-23 CZK 380
2,164,829 Receiving floating rate 6-month CZK PRIBORPaying fixed rate 1.8% JPMorgan 21-Mar-23 CZK 159
7,060,080 Receiving floating rate 6-month CZK PRIBORPaying fixed rate 1.86% JPMorgan 21-Mar-23 CZK (431)
9,986,950 Receiving floating rate 6-month CZK PRIBORPaying fixed rate 1.835% JPMorgan 22-May-23 CZK 628
5,843,979 Receiving fixed rate 7.855%Paying floating rate 4-week Mexico Interbank TIIE JPMorgan 13-Sep-23 MXN (73)
6,676,748 Receiving floating rate 3-month ZAR JIBARPaying fixed rate 7.93% JPMorgan 19-Sep-23 ZAR (1,411)
4,819,667 Receiving floating rate 3-month ZAR JIBARPaying fixed rate 7.984% JPMorgan 19-Sep-23 ZAR (1,790)
10,587,120 Receiving floating rate 6-month CZK PRIBORPaying fixed rate 1.875% JPMorgan 19-Sep-23 CZK 1,788
11,551,555 Receiving floating rate 6-month CZK PRIBORPaying fixed rate 1.885% JPMorgan 19-Sep-23 CZK 1,692
1,023,000 Receiving floating rate 3-month USD BBA LIBORPaying fixed rate 2.25% JPMorgan 21-Mar-28 USD 41,284
FRANKLIN TEMPLETON INVESTMENT FUNDS
Notes to the Financial StatementsAt June 30, 2018 (continued)
Note 7 — Open positions on interest rate swap contracts (continued)
www.franklintempleton.lu Audited Annual Report 125

As at June 30, 2018, the Company had entered into the following outstanding contracts:
Franklin K2 Long Short Credit Fund (continued)Notionalamount
Description Counterparty Maturitydate
Tradingcurrency
Unrealisedprofit/(loss)
USD
3,116,777 Receiving fixed rate 8.364%Paying floating rate 3-month ZAR JIBAR JPMorgan 19-Sep-28 ZAR 755
3,116,777 Receiving floating rate 3-month ZAR JIBARPaying fixed rate 8.364% JPMorgan 19-Sep-28 ZAR (134)
1,628,428 Receiving floating rate 3-month ZAR JIBARPaying fixed rate 8.428% JPMorgan 19-Sep-28 ZAR (580)
1,645,186 Receiving floating rate 3-month ZAR JIBARPaying fixed rate 8.429% JPMorgan 19-Sep-28 ZAR (594)
1,642,917 Receiving floating rate 3-month ZAR JIBARPaying fixed rate 8.464% JPMorgan 19-Sep-28 ZAR (870)
1,653,484 Receiving floating rate 3-month ZAR JIBARPaying fixed rate 8.48% JPMorgan 19-Sep-28 ZAR (1,010)
310,624 Receiving floating rate 6-month GBP LIBORPaying fixed rate 1.44% JPMorgan 05-Jan-47 GBP 16,506
62,000 Receiving floating rate 6-month GBP LIBORPaying fixed rate 1.287% JPMorgan 27-Feb-67 GBP 6,937
227,000 Receiving floating rate 6-month GBP LIBORPaying fixed rate 1.41% JPMorgan 04-Aug-67 GBP 11,574
500,319 Receiving floating rate 3-month MYR KLIBORPaying fixed rate 4.1425% Morgan Stanley 18-May-23 MYR (997)
108,383
Franklin U.S. Low Duration Fund
Notionalamount
Description Counterparty Maturitydate
Tradingcurrency
Unrealisedprofit/(loss)
USD
20,200,000 Receiving fixed rate 2.8055%Paying floating rate 3-month USD BBA LIBOR Citigroup 24-May-20 USD 10,814
77,800,000 Receiving fixed rate 2.25%Paying floating rate 3-month USD BBA LIBOR JPMorgan 19-Sep-20 USD (246,405)
(235,591)
Templeton Asian Bond Fund
Notionalamount
Description Counterparty Maturitydate
Tradingcurrency
Unrealisedprofit/(loss)
USD
7,640,000 Receiving floating rate 3-month USD BBA LIBORPaying fixed rate 2.97981% Citigroup 20-Feb-48 USD (86,405)
7,640,000 Receiving floating rate 3-month USD BBA LIBORPaying fixed rate 3.002% Citigroup 22-Feb-48 USD (110,720)
7,640,000 Receiving floating rate 3-month USD BBA LIBORPaying fixed rate 3.019% Citigroup 23-Feb-48 USD (137,666)
23,500,000 Receiving floating rate 3-month USD BBA LIBORPaying fixed rate 2.765% HSBC Bank 07-Oct-23 USD 141,561
11,430,000 Receiving floating rate 3-month USD BBA LIBORPaying fixed rate 3.675% HSBC Bank 07-Oct-43 USD (1,536,938)
25,800,000 Receiving floating rate 3-month USD BBA LIBORPaying fixed rate 2.61313% JPMorgan 26-Jan-47 USD 1,697,648
44,400,000 Receiving floating rate 3-month USD BBA LIBORPaying fixed rate 2.6782% JPMorgan 27-Jan-47 USD 2,337,532
4,000,000 Receiving floating rate 3-month USD BBA LIBORPaying fixed rate 2.5873% JPMorgan 27-Jul-47 USD 285,563
2,590,575
FRANKLIN TEMPLETON INVESTMENT FUNDS
Notes to the Financial StatementsAt June 30, 2018 (continued)
Note 7 — Open positions on interest rate swap contracts (continued)
126 Audited Annual Report www.franklintempleton.lu

As at June 30, 2018, the Company had entered into the following outstanding contracts:
Templeton Emerging Markets Balanced Fund
Notionalamount
Description Counterparty Maturitydate
Tradingcurrency
Unrealisedprofit/(loss)
USD
230,000 Receiving floating rate 3-month USD BBA LIBORPaying fixed rate 2.97981% Citigroup 20-Feb-48 USD (2,747)
230,000 Receiving floating rate 3-month USD BBA LIBORPaying fixed rate 3.002% Citigroup 22-Feb-48 USD (3,479)
230,000 Receiving floating rate 3-month USD BBA LIBORPaying fixed rate 3.019% Citigroup 23-Feb-48 USD (4,290)
340,000 Receiving floating rate 3-month USD BBA LIBORPaying fixed rate 3.018% JPMorgan 22-Aug-23 USD (2,143)
960,000 Receiving floating rate 3-month USD BBA LIBORPaying fixed rate 1.91422% JPMorgan 22-Jan-25 USD 56,542
1,200,000 Receiving floating rate 3-month USD BBA LIBORPaying fixed rate 1.96953% JPMorgan 23-Jan-25 USD 66,701
700,000 Receiving floating rate 3-month USD BBA LIBORPaying fixed rate 1.973% JPMorgan 27-Jan-25 USD 38,831
180,000 Receiving floating rate 3-month USD BBA LIBORPaying fixed rate 1.9367% JPMorgan 29-Jan-25 USD 10,378
150,000 Receiving floating rate 3-month USD BBA LIBORPaying fixed rate 1.94152% JPMorgan 30-Jan-25 USD 8,615
230,000 Receiving floating rate 3-month USD BBA LIBORPaying fixed rate 1.81667% JPMorgan 03-Feb-25 USD 14,976
200,000 Receiving floating rate 3-month USD BBA LIBORPaying fixed rate 3.848% JPMorgan 22-Aug-43 USD (32,744)
150,640
Templeton Emerging Markets Bond Fund
Notionalamount
Description Counterparty Maturitydate
Tradingcurrency
Unrealisedprofit/(loss)
USD
62,460,000 Receiving floating rate 3-month USD BBA LIBORPaying fixed rate 3.44% Citigroup 21-Apr-21 USD (1,000,587)
73,706,000 Receiving floating rate 3-month USD BBA LIBORPaying fixed rate 2.97981% Citigroup 20-Feb-48 USD (832,640)
73,706,000 Receiving floating rate 3-month USD BBA LIBORPaying fixed rate 3.002% Citigroup 22-Feb-48 USD (1,067,207)
73,706,000 Receiving floating rate 3-month USD BBA LIBORPaying fixed rate 3.019% Citigroup 23-Feb-48 USD (1,327,166)
10,460,000 Receiving floating rate 3-month USD BBA LIBORPaying fixed rate 2.775% Deutsche Bank 04-Oct-23 USD 57,715
10,460,000 Receiving floating rate 3-month USD BBA LIBORPaying fixed rate 2.795% Deutsche Bank 04-Oct-23 USD 47,455
5,090,000 Receiving floating rate 3-month USD BBA LIBORPaying fixed rate 3.668% Deutsche Bank 04-Oct-43 USD (677,683)
5,090,000 Receiving floating rate 3-month USD BBA LIBORPaying fixed rate 3.68655% Deutsche Bank 04-Oct-43 USD (695,186)
10,460,000 Receiving floating rate 3-month USD BBA LIBORPaying fixed rate 2.765% HSBC Bank 07-Oct-23 USD 63,010
5,090,000 Receiving floating rate 3-month USD BBA LIBORPaying fixed rate 3.675% HSBC Bank 07-Oct-43 USD (684,428)
217,280,000 Receiving floating rate 3-month USD BBA LIBORPaying fixed rate 1.91422% JPMorgan 22-Jan-25 USD 12,797,303
271,610,000 Receiving floating rate 3-month USD BBA LIBORPaying fixed rate 1.96953% JPMorgan 23-Jan-25 USD 15,097,268
160,300,000 Receiving floating rate 3-month USD BBA LIBORPaying fixed rate 1.973% JPMorgan 27-Jan-25 USD 8,892,320
40,070,000 Receiving floating rate 3-month USD BBA LIBORPaying fixed rate 1.9367% JPMorgan 29-Jan-25 USD 2,310,220
33,930,000 Receiving floating rate 3-month USD BBA LIBORPaying fixed rate 1.94152% JPMorgan 30-Jan-25 USD 1,948,716
111,000,000 Receiving floating rate 3-month USD BBA LIBORPaying fixed rate 2.43% JPMorgan 25-Nov-46 USD 11,379,976
114,600,000 Receiving floating rate 3-month USD BBA LIBORPaying fixed rate 2.7935% JPMorgan 13-Mar-47 USD 3,350,973
49,660,059
FRANKLIN TEMPLETON INVESTMENT FUNDS
Notes to the Financial StatementsAt June 30, 2018 (continued)
Note 7 — Open positions on interest rate swap contracts (continued)
www.franklintempleton.lu Audited Annual Report 127

As at June 30, 2018, the Company had entered into the following outstanding contracts:
Templeton Global Bond Fund
Notionalamount
Description Counterparty Maturitydate
Tradingcurrency
Unrealisedprofit/(loss)
USD
34,400,000 Receiving floating rate 3-month USD BBA LIBORPaying fixed rate 4.3675% Citigroup 20-Dec-40 USD (8,250,765)
186,490,000 Receiving floating rate 3-month USD BBA LIBORPaying fixed rate 4.34675% Citigroup 25-Feb-41 USD (44,324,960)
187,632,000 Receiving floating rate 3-month USD BBA LIBORPaying fixed rate 2.97981% Citigroup 20-Feb-48 USD (2,118,863)
187,632,000 Receiving floating rate 3-month USD BBA LIBORPaying fixed rate 3.002% Citigroup 22-Feb-48 USD (2,715,997)
187,632,000 Receiving floating rate 3-month USD BBA LIBORPaying fixed rate 3.019% Citigroup 23-Feb-48 USD (3,377,769)
94,430,000 Receiving floating rate 3-month USD BBA LIBORPaying fixed rate 3.5575% JPMorgan 04-Mar-21 USD (1,753,302)
290,840,000 Receiving floating rate 3-month USD BBA LIBORPaying fixed rate 1.91422% JPMorgan 22-Jan-25 USD 17,129,822
536,430,000 Receiving floating rate 3-month USD BBA LIBORPaying fixed rate 1.973% JPMorgan 27-Jan-25 USD 29,757,376
134,110,000 Receiving floating rate 3-month USD BBA LIBORPaying fixed rate 1.9367% JPMorgan 29-Jan-25 USD 7,732,058
113,540,000 Receiving floating rate 3-month USD BBA LIBORPaying fixed rate 1.94152% JPMorgan 30-Jan-25 USD 6,520,993
178,930,000 Receiving floating rate 3-month USD BBA LIBORPaying fixed rate 1.81667% JPMorgan 03-Feb-25 USD 11,650,699
263,000,000 Receiving floating rate 3-month USD BBA LIBORPaying fixed rate 3.9625% JPMorgan 23-Nov-40 USD (44,823,824)
31,200,000 Receiving floating rate 3-month USD BBA LIBORPaying fixed rate 4.153% JPMorgan 10-Dec-40 USD (6,337,645)
194,540,000 Receiving floating rate 3-month USD BBA LIBORPaying fixed rate 4.215% JPMorgan 11-Jan-41 USD (41,684,564)
186,490,000 Receiving floating rate 3-month USD BBA LIBORPaying fixed rate 4.3494% JPMorgan 25-Feb-41 USD (44,856,406)
139,860,000 Receiving floating rate 3-month USD BBA LIBORPaying fixed rate 4.3201% JPMorgan 28-Feb-41 USD (32,619,311)
46,620,000 Receiving floating rate 3-month USD BBA LIBORPaying fixed rate 4.299% JPMorgan 01-Mar-41 USD (10,714,439)
227,900,000 Receiving floating rate 3-month USD BBA LIBORPaying fixed rate 2.61313% JPMorgan 26-Jan-47 USD 14,998,243
392,400,000 Receiving floating rate 3-month USD BBA LIBORPaying fixed rate 2.6782% JPMorgan 27-Jan-47 USD 20,661,079
46,600,000 Receiving floating rate 3-month USD BBA LIBORPaying fixed rate 2.537% JPMorgan 13-Apr-47 USD 3,793,817
(131,333,758)
Templeton Global Bond (Euro) Fund
Notionalamount
Description Counterparty Maturitydate
Tradingcurrency
Unrealisedprofit/(loss)
EUR
3,504,000 Receiving floating rate 3-month USD BBA LIBORPaying fixed rate 2.97981% Citigroup 20-Feb-48 USD (33,980)
3,504,000 Receiving floating rate 3-month USD BBA LIBORPaying fixed rate 3.002% Citigroup 22-Feb-48 USD (43,524)
3,504,000 Receiving floating rate 3-month USD BBA LIBORPaying fixed rate 3.019% Citigroup 23-Feb-48 USD (54,103)
25,539,000 Receiving floating rate 3-month USD BBA LIBORPaying fixed rate 1.9965% HSBC Bank 28-Apr-25 USD 1,223,853
13,890,000 Receiving floating rate 3-month USD BBA LIBORPaying fixed rate 2.3865% HSBC Bank 28-Apr-45 USD 1,283,708
10,700,000 Receiving floating rate 3-month USD BBA LIBORPaying fixed rate 2.3782% JPMorgan 18-Nov-46 USD 1,033,722
7,300,000 Receiving floating rate 3-month USD BBA LIBORPaying fixed rate 2.7935% JPMorgan 13-Mar-47 USD 182,431
14,300,000 Receiving floating rate 3-month USD BBA LIBORPaying fixed rate 2.5873% JPMorgan 27-Jul-47 USD 874,445
4,466,552
FRANKLIN TEMPLETON INVESTMENT FUNDS
Notes to the Financial StatementsAt June 30, 2018 (continued)
Note 7 — Open positions on interest rate swap contracts (continued)
128 Audited Annual Report www.franklintempleton.lu

As at June 30, 2018, the Company had entered into the following outstanding contracts:
Templeton Global High Yield Fund
Notionalamount
Description Counterparty Maturitydate
Tradingcurrency
Unrealisedprofit/(loss)
USD
1,330,000 Receiving floating rate 3-month USD BBA LIBORPaying fixed rate 3.44% Citigroup 21-Apr-21 USD (21,306)
1,860,000 Receiving floating rate 3-month USD BBA LIBORPaying fixed rate 1.9367% JPMorgan 29-Jan-25 USD 107,238
1,580,000 Receiving floating rate 3-month USD BBA LIBORPaying fixed rate 1.94152% JPMorgan 30-Jan-25 USD 90,745
2,490,000 Receiving floating rate 3-month USD BBA LIBORPaying fixed rate 1.81667% JPMorgan 03-Feb-25 USD 162,132
4,670,000 Receiving floating rate 3-month USD BBA LIBORPaying fixed rate 2.9975% JPMorgan 25-Apr-28 USD (28,632)
476,000 Receiving floating rate 3-month USD BBA LIBORPaying fixed rate 2.97981% JPMorgan 20-Feb-48 USD (5,674)
476,000 Receiving floating rate 3-month USD BBA LIBORPaying fixed rate 3.002% JPMorgan 22-Feb-48 USD (7,189)
476,000 Receiving floating rate 3-month USD BBA LIBORPaying fixed rate 3.019% JPMorgan 23-Feb-48 USD (8,868)
2,060,000 Receiving floating rate 3-month USD BBA LIBORPaying fixed rate 3.024% JPMorgan 25-Apr-48 USD (38,966)
249,480
Templeton Global Income Fund
Notionalamount
Description Counterparty Maturitydate
Tradingcurrency
Unrealisedprofit/(loss)
USD
1,924,000 Receiving floating rate 3-month USD BBA LIBORPaying fixed rate 2.97981% Citigroup 20-Feb-48 USD (21,872)
1,924,000 Receiving floating rate 3-month USD BBA LIBORPaying fixed rate 3.002% Citigroup 22-Feb-48 USD (27,995)
1,924,000 Receiving floating rate 3-month USD BBA LIBORPaying fixed rate 3.019% Citigroup 23-Feb-48 USD (34,781)
1,430,000 Receiving floating rate 3-month USD BBA LIBORPaying fixed rate 3.018% JPMorgan 22-Aug-23 USD (9,012)
22,820,000 Receiving floating rate 3-month USD BBA LIBORPaying fixed rate 2.7305% JPMorgan 07-Jul-24 USD 199,214
20,030,000 Receiving floating rate 3-month USD BBA LIBORPaying fixed rate 1.91422% JPMorgan 22-Jan-25 USD 1,179,722
25,040,000 Receiving floating rate 3-month USD BBA LIBORPaying fixed rate 1.96953% JPMorgan 23-Jan-25 USD 1,391,832
14,780,000 Receiving floating rate 3-month USD BBA LIBORPaying fixed rate 1.973% JPMorgan 27-Jan-25 USD 819,891
3,700,000 Receiving floating rate 3-month USD BBA LIBORPaying fixed rate 1.9367% JPMorgan 29-Jan-25 USD 213,322
3,130,000 Receiving floating rate 3-month USD BBA LIBORPaying fixed rate 1.94152% JPMorgan 30-Jan-25 USD 179,767
4,930,000 Receiving floating rate 3-month USD BBA LIBORPaying fixed rate 1.81667% JPMorgan 03-Feb-25 USD 321,008
820,000 Receiving floating rate 3-month USD BBA LIBORPaying fixed rate 3.848% JPMorgan 22-Aug-43 USD (134,253)
11,100,000 Receiving floating rate 3-month USD BBA LIBORPaying fixed rate 2.537% JPMorgan 13-Apr-47 USD 903,449
3,400,000 Receiving floating rate 3-month USD BBA LIBORPaying fixed rate 2.5873% JPMorgan 27-Jul-47 USD 242,683
5,222,975
FRANKLIN TEMPLETON INVESTMENT FUNDS
Notes to the Financial StatementsAt June 30, 2018 (continued)
Note 7 — Open positions on interest rate swap contracts (continued)
www.franklintempleton.lu Audited Annual Report 129

As at June 30, 2018, the Company had entered into the following outstanding contracts:
Templeton Global Total Return Fund
Notionalamount
Description Counterparty Maturitydate
Tradingcurrency
Unrealisedprofit/(loss)
USD
45,640,000 Receiving floating rate 3-month USD BBA LIBORPaying fixed rate 4.34675% Citigroup 25-Feb-41 USD (10,847,719)
217,542,000 Receiving floating rate 3-month USD BBA LIBORPaying fixed rate 2.97981% Citigroup 20-Feb-48 USD (2,456,547)
217,542,000 Receiving floating rate 3-month USD BBA LIBORPaying fixed rate 3.002% Citigroup 22-Feb-48 USD (3,148,868)
217,542,000 Receiving floating rate 3-month USD BBA LIBORPaying fixed rate 3.019% Citigroup 23-Feb-48 USD (3,916,132)
88,240,000 Receiving floating rate 3-month USD BBA LIBORPaying fixed rate 3.523% Deutsche Bank 28-Mar-21 USD (1,590,596)
234,540,000 Receiving floating rate 3-month USD BBA LIBORPaying fixed rate 3.668% Deutsche Bank 04-Oct-43 USD (31,226,681)
234,540,000 Receiving floating rate 3-month USD BBA LIBORPaying fixed rate 3.68655% Deutsche Bank 04-Oct-43 USD (32,033,185)
234,540,000 Receiving floating rate 3-month USD BBA LIBORPaying fixed rate 3.675% HSBC Bank 07-Oct-43 USD (31,537,491)
83,070,000 Receiving floating rate 3-month USD BBA LIBORPaying fixed rate 3.0755% JPMorgan 14-Jun-21 USD (525,517)
202,130,000 Receiving floating rate 3-month USD BBA LIBORPaying fixed rate 1.91422% JPMorgan 22-Jan-25 USD 11,905,002
252,660,000 Receiving floating rate 3-month USD BBA LIBORPaying fixed rate 1.96953% JPMorgan 23-Jan-25 USD 14,043,944
149,110,000 Receiving floating rate 3-month USD BBA LIBORPaying fixed rate 1.973% JPMorgan 27-Jan-25 USD 8,271,578
37,280,000 Receiving floating rate 3-month USD BBA LIBORPaying fixed rate 1.9367% JPMorgan 29-Jan-25 USD 2,149,363
31,560,000 Receiving floating rate 3-month USD BBA LIBORPaying fixed rate 1.94152% JPMorgan 30-Jan-25 USD 1,812,599
49,740,000 Receiving floating rate 3-month USD BBA LIBORPaying fixed rate 1.81667% JPMorgan 03-Feb-25 USD 3,238,729
161,368,000 Receiving floating rate 3-month USD BBA LIBORPaying fixed rate 2.0362% JPMorgan 23-Mar-25 USD 8,509,564
541,800,000 Receiving floating rate 3-month USD BBA LIBORPaying fixed rate 1.9777% JPMorgan 27-Mar-25 USD 30,559,508
541,800,000 Receiving floating rate 3-month USD BBA LIBORPaying fixed rate 1.985% JPMorgan 27-Mar-25 USD 30,315,520
45,640,000 Receiving floating rate 3-month USD BBA LIBORPaying fixed rate 4.3494% JPMorgan 25-Feb-41 USD (10,977,781)
34,230,000 Receiving floating rate 3-month USD BBA LIBORPaying fixed rate 4.3201% JPMorgan 28-Feb-41 USD (7,983,405)
11,410,000 Receiving floating rate 3-month USD BBA LIBORPaying fixed rate 4.299% JPMorgan 01-Mar-41 USD (2,622,303)
330,000,000 Receiving floating rate 3-month USD BBA LIBORPaying fixed rate 2.61313% JPMorgan 26-Jan-47 USD 21,717,644
568,200,000 Receiving floating rate 3-month USD BBA LIBORPaying fixed rate 2.6782% JPMorgan 27-Jan-47 USD 29,917,629
51,300,000 Receiving floating rate 3-month USD BBA LIBORPaying fixed rate 2.5873% JPMorgan 27-Jul-47 USD 3,665,889
27,240,744
Note 8 — Open positions on inflation swap contractsAs at June 30, 2018, the Company had entered into the following outstanding contracts:
Franklin Brazil Opportunities Fund
Notionalamount
Description Counterparty Maturitydate
Tradingcurrency
Unrealisedprofit/(loss)
USD
7,000,000 Receiving floating rate IPCAPaying floating rate CDI
CM Capital MarketsCCTVM 17-Aug-20 BRL (288,708)
7,000,000 Receiving floating rate CDIPaying floating rate IPCA
CM Capital MarketsCCTVM 17-Aug-20 BRL 202,385
5,000,000 Receiving floating rate IPCAPaying floating rate CDI
CM Capital MarketsCCTVM 15-Dec-27 BRL (401,788)
5,000,000 Receiving floating rate CDIPaying floating rate IPCA
CM Capital MarketsCCTVM 15-Dec-27 BRL 583,737
6,040,000 Receiving floating rate IPCAPaying floating rate CDI Itau Corretora de Valores 15-Aug-22 BRL (282,751)
FRANKLIN TEMPLETON INVESTMENT FUNDS
Notes to the Financial StatementsAt June 30, 2018 (continued)
Note 7 — Open positions on interest rate swap contracts (continued)
130 Audited Annual Report www.franklintempleton.lu

As at June 30, 2018, the Company had entered into the following outstanding contracts:
Franklin Brazil Opportunities Fund (continued)Notionalamount
Description Counterparty Maturitydate
Tradingcurrency
Unrealisedprofit/(loss)
USD
6,040,000 Receiving floating rate CDIPaying floating rate IPCA Itau Corretora de Valores 15-Aug-22 BRL 275,549
88,424
Franklin Flexible Alpha Bond Fund
Notionalamount
Description Counterparty Maturitydate
Tradingcurrency
Unrealisedprofit/(loss)
USD
7,000,000 Receiving floating rate US CPI Urban Consumers NSAPaying fixed rate 2.103% Citigroup 11-Dec-25 USD 136,764
4,000,000 Receiving floating rate US CPI Urban Consumers NSAPaying fixed rate 1.782% JPMorgan 27-May-24 USD 180,534
317,298
Franklin K2 Alternative Strategies Fund
Notionalamount
Description Counterparty Maturitydate
Tradingcurrency
Unrealisedprofit/(loss)
USD
130,624,452 Receiving floating rate INR MIBORPaying fixed rate 6.6715% Bank of America 20-Jun-23 INR 51,311
22,737,597 Receiving floating rate CDIPaying fixed rate 8.09% Barclays Bank 04-Jan-21 BRL (46,282)
22,737,596 Receiving fixed rate 8.09%Paying floating rate CDI Barclays Bank 04-Jan-21 BRL (140,344)
3,778,807 Receiving floating rate CDIPaying fixed rate 10.355% Barclays Bank 02-Jan-25 BRL (23,784)
3,778,807 Receiving fixed rate 10.355%Paying floating rate CDI JPMorgan 02-Jan-25 BRL (56,206)
(215,305)
Franklin K2 Global Macro Opportunities Fund
Notionalamount
Description Counterparty Maturitydate
Tradingcurrency
Unrealisedprofit/(loss)
USD
7,051,916 Receiving floating rate INR MIBORPaying fixed rate 6.6715% Bank of America 20-Jun-23 INR 2,770
1,235,357 Receiving floating rate CDIPaying fixed rate 8.09% Barclays Bank 04-Jan-21 BRL (2,433)
1,235,358 Receiving fixed rate 8.09%Paying floating rate CDI Barclays Bank 04-Jan-21 BRL (7,625)
176,186 Receiving floating rate CDIPaying fixed rate 10.355% Barclays Bank 02-Jan-25 BRL (1,109)
176,185 Receiving fixed rate 10.355%Paying floating rate CDI JPMorgan 02-Jan-25 BRL (2,621)
(11,018)
Franklin K2 Long Short Credit Fund
Notionalamount
Description Counterparty Maturitydate
Tradingcurrency
Unrealisedprofit/(loss)
USD
13,316,339 Receiving floating rate INR MIBORPaying fixed rate 6.6715% Bank of America 20-Jun-23 INR 5,231
2,333,484 Receiving floating rate CDIPaying fixed rate 8.09% Barclays Bank 04-Jan-21 BRL (4,691)
2,333,485 Receiving fixed rate 8.09%Paying floating rate CDI Barclays Bank 04-Jan-21 BRL (14,402)
379,447 Receiving floating rate CDIPaying fixed rate 10.355% Barclays Bank 02-Jan-25 BRL (2,388)
379,447 Receiving fixed rate 10.355%Paying floating rate CDI JPMorgan 02-Jan-25 BRL (5,644)
(21,894)
FRANKLIN TEMPLETON INVESTMENT FUNDS
Notes to the Financial StatementsAt June 30, 2018 (continued)
Note 8 — Open positions on inflation swap contracts (continued)
www.franklintempleton.lu Audited Annual Report 131

As at June 30, 2018, the Company had entered into the following outstanding contracts:
Franklin U.S. Low Duration Fund
Notionalamount
Description Counterparty Maturitydate
Tradingcurrency
Unrealisedprofit/(loss)
USD
8,700,000 Receiving floating rate US CPI Urban Consumers NSAPaying fixed rate 1.96% JPMorgan 31-Aug-24 USD 254,246
Note 9 — Open positions on cross currency swap contractsAs at June 30, 2018, the Company had entered into the following outstanding contracts:
Franklin Flexible Alpha Bond Fund
Description Notionalamount
Counterparty Maturitydate
Tradingcurrency
Unrealisedprofit/(loss)
USD
Receiving floating rate 3-month USD BBA LIBOR +1.0825% 3,486,000 USDPaying fixed rate 0.75% 3,000,000 BNP Paribas 31-May-22 EUR 854Receiving floating rate 3-month USD BBA LIBOR +0.821% 3,029,000 USDPaying fixed rate 0.625% 2,600,000 BNP Paribas 08-Jun-23 EUR 15,972Receiving floating rate 3-month USD BBA LIBOR +0.36% 2,530,000 USDPaying floating rate 3-month EURIBOR 2,300,000 Citigroup 18-Oct-19 EUR (149,836)Receiving floating rate 3-month USD BBA LIBOR +1.6% 2,625,000 USDPaying fixed rate 1.25% 2,100,000 Citigroup 28-Jan-21 EUR 178,225Receiving floating rate 3-month USD BBA LIBOR +1.85% 864,500 USDPaying fixed rate 1.5% 700,000 Citigroup 04-May-21 EUR 53,195Receiving floating rate 3-month USD BBA LIBOR +1.894% 2,214,000 USDPaying fixed rate 1.5% 1,800,000 Citigroup 04-May-21 EUR 129,029Receiving floating rate 3-month USD BBA LIBOR +2.87% 813,400 USDPaying fixed rate 2.5% 700,000 Citigroup 04-May-21 EUR (4,574)Receiving fixed rate 3.045% 1,008,000 USDPaying fixed rate 1.125% 900,000 Citigroup 15-Dec-21 EUR (84,852)Receiving floating rate 3-month USD BBA LIBOR +1.53% 532,500 USDPaying fixed rate 1.00% 500,000 Citigroup 03-Mar-22 EUR (47,561)Receiving floating rate 3-month USD BBA LIBOR +0.7275% 4,740,000 USDPaying fixed rate 0.1% 4,000,000 HSBC Bank 15-Jan-19 EUR 71,326Receiving floating rate 3-month USD BBA LIBOR +1.1225% 3,902,500 USDPaying fixed rate 0.75% 3,500,000 HSBC Bank 01-Apr-22 EUR (159,852)Receiving floating rate 3-month USD BBA LIBOR +1.045% 1,552,200 USDPaying fixed rate 0.75% 1,300,000 HSBC Bank 31-May-22 EUR 42,664Receiving floating rate 3-month USD BBA LIBOR +1.12% 2,230,000 USDPaying fixed rate 0.75% 2,000,000 HSBC Bank 01-Jun-22 EUR (92,257)Receiving floating rate 3-month USD BBA LIBOR +0.731% 2,897,278 USDPaying fixed rate 0.18% 330,000,000 HSBC Bank 15-Jul-22 JPY (70,056)Receiving floating rate 3-month USD BBA LIBOR +0.7825% 5,985,000 USDPaying fixed rate 0.625% 5,000,000 HSBC Bank 08-Jun-23 EUR 190,084Receiving floating rate 3-month USD BBA LIBOR +1.395% 1,195,000 USDPaying fixed rate 1.5% 1,000,000 HSBC Bank 26-Nov-25 EUR 40,168Receiving floating rate 3-month USD BBA LIBOR +1.415% 2,633,400 USDPaying fixed rate 1.5% 2,200,000 HSBC Bank 26-Nov-25 EUR 93,185Receiving floating rate 3-month USD BBA LIBOR +0.7863% 1,176,000 USDPaying fixed rate 0.1% 1,000,000 JPMorgan 15-Jan-19 EUR 9,175Receiving floating rate 3-month USD BBA LIBOR +0.5975% 4,130,000 USDPaying fixed rate 0.1% 3,500,000 JPMorgan 27-Jan-21 EUR 62,450Receiving floating rate 3-month USD BBA LIBOR +0.8375% 2,390,000 USDPaying fixed rate 1.00% 2,000,000 JPMorgan 26-Nov-25 EUR 74,386
351,725
Franklin Strategic Income Fund
Description Notionalamount
Counterparty Maturitydate
Tradingcurrency
Unrealisedprofit/(loss)
USD
Receiving floating rate 3-month USD BBA LIBOR +2.87% 697,200 USDPaying fixed rate 2.5% 600,000 Citigroup 04-May-21 EUR (3,921)
Franklin U.S. Low Duration Fund
Description Notionalamount
Counterparty Maturitydate
Tradingcurrency
Unrealisedprofit/(loss)
USD
Receiving floating rate 3-month USD BBA LIBOR +2.87% 581,000 USDPaying fixed rate 2.5% 500,000 Citigroup 04-May-21 EUR (3,267)
FRANKLIN TEMPLETON INVESTMENT FUNDS
Notes to the Financial StatementsAt June 30, 2018 (continued)
Note 8 — Open positions on inflation swap contracts (continued)
132 Audited Annual Report www.franklintempleton.lu
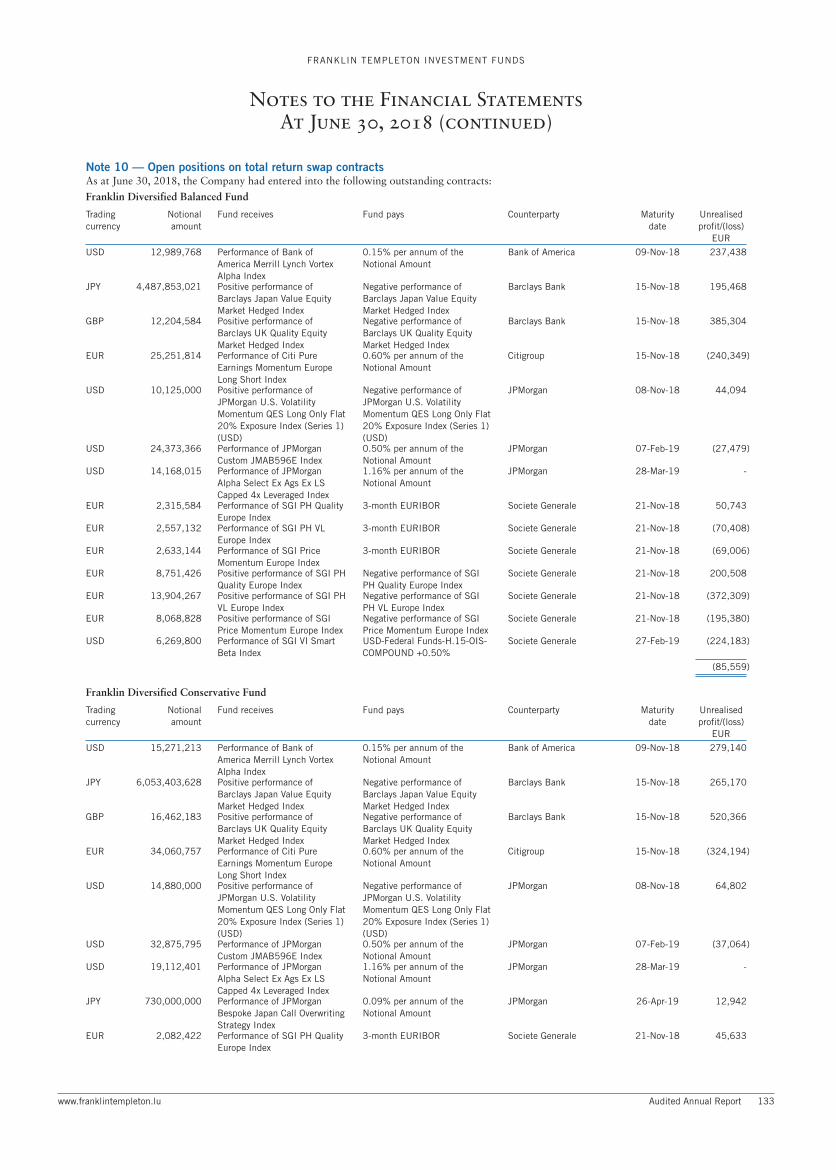
As at June 30, 2018, the Company had entered into the following outstanding contracts:
Franklin Diversified Balanced Fund
Tradingcurrency
Notionalamount
Fund receives Fund pays Counterparty Maturitydate
Unrealisedprofit/(loss)
EUR
USD 12,989,768 Performance of Bank ofAmerica Merrill Lynch VortexAlpha Index
0.15% per annum of theNotional Amount
Bank of America 09-Nov-18 237,438
JPY 4,487,853,021 Positive performance ofBarclays Japan Value EquityMarket Hedged Index
Negative performance ofBarclays Japan Value EquityMarket Hedged Index
Barclays Bank 15-Nov-18 195,468
GBP 12,204,584 Positive performance ofBarclays UK Quality EquityMarket Hedged Index
Negative performance ofBarclays UK Quality EquityMarket Hedged Index
Barclays Bank 15-Nov-18 385,304
EUR 25,251,814 Performance of Citi PureEarnings Momentum EuropeLong Short Index
0.60% per annum of theNotional Amount
Citigroup 15-Nov-18 (240,349)
USD 10,125,000 Positive performance ofJPMorgan U.S. VolatilityMomentum QES Long Only Flat20% Exposure Index (Series 1)(USD)
Negative performance ofJPMorgan U.S. VolatilityMomentum QES Long Only Flat20% Exposure Index (Series 1)(USD)
JPMorgan 08-Nov-18 44,094
USD 24,373,366 Performance of JPMorganCustom JMAB596E Index
0.50% per annum of theNotional Amount
JPMorgan 07-Feb-19 (27,479)
USD 14,168,015 Performance of JPMorganAlpha Select Ex Ags Ex LSCapped 4x Leveraged Index
1.16% per annum of theNotional Amount
JPMorgan 28-Mar-19 -
EUR 2,315,584 Performance of SGI PH QualityEurope Index
3-month EURIBOR Societe Generale 21-Nov-18 50,743
EUR 2,557,132 Performance of SGI PH VLEurope Index
3-month EURIBOR Societe Generale 21-Nov-18 (70,408)
EUR 2,633,144 Performance of SGI PriceMomentum Europe Index
3-month EURIBOR Societe Generale 21-Nov-18 (69,006)
EUR 8,751,426 Positive performance of SGI PHQuality Europe Index
Negative performance of SGIPH Quality Europe Index
Societe Generale 21-Nov-18 200,508
EUR 13,904,267 Positive performance of SGI PHVL Europe Index
Negative performance of SGIPH VL Europe Index
Societe Generale 21-Nov-18 (372,309)
EUR 8,068,828 Positive performance of SGIPrice Momentum Europe Index
Negative performance of SGIPrice Momentum Europe Index
Societe Generale 21-Nov-18 (195,380)
USD 6,269,800 Performance of SGI VI SmartBeta Index
USD-Federal Funds-H.15-OIS-COMPOUND +0.50%
Societe Generale 27-Feb-19 (224,183)
(85,559)
Franklin Diversified Conservative Fund
Tradingcurrency
Notionalamount
Fund receives Fund pays Counterparty Maturitydate
Unrealisedprofit/(loss)
EUR
USD 15,271,213 Performance of Bank ofAmerica Merrill Lynch VortexAlpha Index
0.15% per annum of theNotional Amount
Bank of America 09-Nov-18 279,140
JPY 6,053,403,628 Positive performance ofBarclays Japan Value EquityMarket Hedged Index
Negative performance ofBarclays Japan Value EquityMarket Hedged Index
Barclays Bank 15-Nov-18 265,170
GBP 16,462,183 Positive performance ofBarclays UK Quality EquityMarket Hedged Index
Negative performance ofBarclays UK Quality EquityMarket Hedged Index
Barclays Bank 15-Nov-18 520,366
EUR 34,060,757 Performance of Citi PureEarnings Momentum EuropeLong Short Index
0.60% per annum of theNotional Amount
Citigroup 15-Nov-18 (324,194)
USD 14,880,000 Positive performance ofJPMorgan U.S. VolatilityMomentum QES Long Only Flat20% Exposure Index (Series 1)(USD)
Negative performance ofJPMorgan U.S. VolatilityMomentum QES Long Only Flat20% Exposure Index (Series 1)(USD)
JPMorgan 08-Nov-18 64,802
USD 32,875,795 Performance of JPMorganCustom JMAB596E Index
0.50% per annum of theNotional Amount
JPMorgan 07-Feb-19 (37,064)
USD 19,112,401 Performance of JPMorganAlpha Select Ex Ags Ex LSCapped 4x Leveraged Index
1.16% per annum of theNotional Amount
JPMorgan 28-Mar-19 -
JPY 730,000,000 Performance of JPMorganBespoke Japan Call OverwritingStrategy Index
0.09% per annum of theNotional Amount
JPMorgan 26-Apr-19 12,942
EUR 2,082,422 Performance of SGI PH QualityEurope Index
3-month EURIBOR Societe Generale 21-Nov-18 45,633
FRANKLIN TEMPLETON INVESTMENT FUNDS
Notes to the Financial StatementsAt June 30, 2018 (continued)
Note 10 — Open positions on total return swap contracts
www.franklintempleton.lu Audited Annual Report 133

As at June 30, 2018, the Company had entered into the following outstanding contracts:
Franklin Diversified Conservative Fund (continued)Tradingcurrency
Notionalamount
Fund receives Fund pays Counterparty Maturitydate
Unrealisedprofit/(loss)
EUR
EUR 2,056,055 Performance of SGI PH VLEurope Index
3-month EURIBOR Societe Generale 21-Nov-18 (56,612)
EUR 2,648,303 Performance of SGI PriceMomentum Europe Index
3-month EURIBOR Societe Generale 21-Nov-18 (69,403)
EUR 12,845,183 Positive performance of SGI PHQuality Europe Index
Negative performance of SGIPH Quality Europe Index
Societe Generale 21-Nov-18 294,303
EUR 20,147,834 Positive performance of SGI PHVL Europe Index
Negative performance of SGIPH VL Europe Index
Societe Generale 21-Nov-18 (539,491)
EUR 11,786,925 Positive performance of SGIPrice Momentum Europe Index
Negative performance of SGIPrice Momentum Europe Index
Societe Generale 21-Nov-18 (285,410)
USD 8,043,396 Performance of SGI VI SmartBeta Index
USD-Federal Funds-H.15-OIS-COMPOUND +0.50%
Societe Generale 27-Feb-19 (259,027)
(88,845)
Franklin Diversified Dynamic Fund
Tradingcurrency
Notionalamount
Fund receives Fund pays Counterparty Maturitydate
Unrealisedprofit/(loss)
EUR
USD 11,798,296 Performance of Bank ofAmerica Merrill Lynch VortexAlpha Index
0.15% per annum of theNotional Amount
Bank of America 09-Nov-18 185,087
JPY 1,710,311,356 Positive performance ofBarclays Japan Value EquityMarket Hedged Index
Negative performance ofBarclays Japan Value EquityMarket Hedged Index
Barclays Bank 15-Nov-18 74,907
GBP 4,651,186 Positive performance ofBarclays UK Quality EquityMarket Hedged Index
Negative performance ofBarclays UK Quality EquityMarket Hedged Index
Barclays Bank 15-Nov-18 147,017
EUR 9,623,467 Performance of Citi PureEarnings Momentum EuropeLong Short Index
0.60% per annum of theNotional Amount
Citigroup 15-Nov-18 (91,597)
USD 4,189,000 Positive performance ofJPMorgan U.S. VolatilityMomentum QES Long Only Flat20% Exposure Index (Series 1)(USD)
Negative performance ofJPMorgan U.S. VolatilityMomentum QES Long Only Flat20% Exposure Index (Series 1)(USD)
JPMorgan 08-Nov-18 18,243
USD 13,452,661 Performance of JPMorganCustom JMAB596E Index
0.50% per annum of theNotional Amount
JPMorgan 07-Feb-19 (15,167)
USD 8,343,784 Performance of JPMorganAlpha Select Ex Ags Ex LSCapped 4x Leveraged Index
1.16% per annum of theNotional Amount
JPMorgan 28-Mar-19 -
EUR 597,577 Performance of SGI PH QualityEurope Index
3-month EURIBOR Societe Generale 21-Nov-18 13,095
EUR 453,141 Performance of SGI PH VLEurope Index
3-month EURIBOR Societe Generale 21-Nov-18 (12,477)
EUR 702,278 Performance of SGI PriceMomentum Europe Index
3-month EURIBOR Societe Generale 21-Nov-18 (18,404)
EUR 3,620,040 Positive performance of SGI PHQuality Europe Index
Negative performance of SGIPH Quality Europe Index
Societe Generale 21-Nov-18 82,941
EUR 5,820,259 Positive performance of SGI PHVL Europe Index
Negative performance of SGIPH VL Europe Index
Societe Generale 21-Nov-18 (155,847)
EUR 3,376,234 Positive performance of SGIPrice Momentum Europe Index
Negative performance of SGIPrice Momentum Europe Index
Societe Generale 21-Nov-18 (81,753)
USD 3,247,893 Performance of SGI VI SmartBeta Index
USD-Federal Funds-H.15-OIS-COMPOUND +0.50%
Societe Generale 27-Feb-19 (128,121)
17,924
Franklin Flexible Alpha Bond Fund
Tradingcurrency
Notionalamount
Fund receives Fund pays Counterparty Maturitydate
Unrealisedprofit/(loss)
USD
USD 5,600,000 Performance of Markit iBoxxUSD Liquid Leveraged LoansIndex Series 1 Version 1
3-month USD BBA LIBOR Citigroup 20-Sep-18 69,210
USD 3,250,000 Performance of Markit iBoxxUSD Liquid Leveraged LoansIndex Series 1 Version 1
3-month USD BBA LIBOR Credit Suisse International 20-Mar-19 5,252
FRANKLIN TEMPLETON INVESTMENT FUNDS
Notes to the Financial StatementsAt June 30, 2018 (continued)
Note 10 — Open positions on total return swap contracts (continued)
134 Audited Annual Report www.franklintempleton.lu

As at June 30, 2018, the Company had entered into the following outstanding contracts:
Franklin Flexible Alpha Bond Fund (continued)Tradingcurrency
Notionalamount
Fund receives Fund pays Counterparty Maturitydate
Unrealisedprofit/(loss)
USD
USD 9,300,000 Performance of Markit iBoxxUSD Liquid Leveraged LoansIndex Series 1 Version 1
3-month USD BBA LIBOR Goldman Sachs 20-Sep-18 100,871
USD 14,100,000 Performance of Markit iBoxxUSD Liquid Leveraged LoansIndex Series 1 Version 1
3-month USD BBA LIBOR Goldman Sachs 20-Dec-18 92,902
USD 3,700,000 Performance of Markit iBoxxUSD Liquid Leveraged LoansIndex Series 1 Version 1
3-month USD BBA LIBOR JPMorgan 20-Mar-19 5,980
USD 9,000,000 Performance of Markit iBoxxUSD Liquid Leveraged LoansIndex Series 1 Version 1
3-month USD BBA LIBOR Morgan Stanley 20-Sep-18 85,162
359,377
Franklin Global Multi-Asset Income Fund
Tradingcurrency
Notionalamount
Fund receives Fund pays Counterparty Maturitydate
Unrealisedprofit/(loss)
EUR
JPY 5,897,259,636 Positive performance ofBarclays Japan Value EquityMarket Hedged Index
Negative performance ofBarclays Japan Value EquityMarket Hedged Index
Barclays Bank 15-Nov-18 266,913
GBP 16,021,742 Positive performance ofBarclays UK Quality EquityMarket Hedged Index
Negative performance ofBarclays UK Quality EquityMarket Hedged Index
Barclays Bank 15-Nov-18 507,745
EUR 33,758,671 Performance of Citi PureEarnings Momentum EuropeLong Short Index
0.60% per annum of theNotional Amount
Citigroup 15-Nov-18 (321,318)
USD 16,875,000 Positive performance ofJPMorgan U.S. VolatilityMomentum QES Long Only Flat20% Exposure Index (Series 1)(USD)
Negative performance ofJPMorgan U.S. VolatilityMomentum QES Long Only Flat20% Exposure Index (Series 1)(USD)
JPMorgan 08-Nov-18 73,489
USD 31,072,320 Performance of JPMorganCustom JMAB596E Index
0.50% per annum of theNotional Amount
JPMorgan 07-Feb-19 (35,031)
USD 18,064,166 Performance of JPMorganAlpha Select Ex Ags Ex LSCapped 4x Leveraged Index
1.16% per annum of theNotional Amount
JPMorgan 28-Mar-19 -
JPY 360,400,000 Performance of JPMorganBespoke Japan Call OverwritingStrategy Index
0.09% per annum of theNotional Amount
JPMorgan 26-Apr-19 6,389
EUR 14,590,487 Positive performance of SGI PHQuality Europe Index
Negative performance of SGIPH Quality Europe Index
Societe Generale 21-Nov-18 334,290
EUR 21,656,925 Positive performance of SGI PHVL Europe Index
Negative performance of SGIPH VL Europe Index
Societe Generale 21-Nov-18 (579,899)
EUR 13,388,224 Positive performance of SGIPrice Momentum Europe Index
Negative performance of SGIPrice Momentum Europe Index
Societe Generale 21-Nov-18 (324,184)
USD 7,337,859 Performance of SGI VI SmartBeta Index
USD-Federal Funds-H.15-OIS-COMPOUND +0.50%
Societe Generale 27-Feb-19 (236,325)
(307,931)
Franklin K2 Alternative Strategies Fund
Tradingcurrency
Notionalamount
Fund receives Fund pays Counterparty Maturitydate
Unrealisedprofit/(loss)
USD
HKD 487,076 1-month HKD HIBOR -0.40% Performance of HaitianInternational Holdings Ltd.
BNP Paribas 29-Oct-18 536
USD 321,105 Performance of Liberty MediaGroup, cvt., senior note,1.00%, 01/30/23
1-month USD LIBOR +0.75% BNP Paribas 29-Oct-18 8,347
USD 185,279 US Overnight Bank FundingRate -0.50%
Performance of Liberty MediaGroup
BNP Paribas 29-Oct-18 (5,820)
EUR 28,738 1-month EURIBOR -4.50% Performance of Nyrstar NV BNP Paribas 28-Nov-18 657GBP 435,380 1-month USD LIBOR -6.00% Performance of Hurricane
Energy PLCBNP Paribas 28-Nov-18 (15,046)
USD 966,875 Performance of HurricaneEnergy PLC, cvt., senior note,Reg S, 7.50%, 07/24/22
1-month USD LIBOR +0.80% BNP Paribas 28-Nov-18 19,232
FRANKLIN TEMPLETON INVESTMENT FUNDS
Notes to the Financial StatementsAt June 30, 2018 (continued)
Note 10 — Open positions on total return swap contracts (continued)
www.franklintempleton.lu Audited Annual Report 135

As at June 30, 2018, the Company had entered into the following outstanding contracts:
Franklin K2 Alternative Strategies Fund (continued)Tradingcurrency
Notionalamount
Fund receives Fund pays Counterparty Maturitydate
Unrealisedprofit/(loss)
USD
EUR 301,644 Performance of Nyrstar NV,cvt., senior note, Reg S,5.00%, 07/11/22
1-month EURIBOR +0.80% BNP Paribas 28-Nov-18 (13,518)
USD 9,839 US Overnight Bank FundingRate -0.50%
Performance of Liberty MediaGroup
BNP Paribas 28-Dec-18 (309)
EUR 21,440 1-month EURIBOR -4.50% Performance of Nyrstar NV BNP Paribas 31-Dec-18 490HKD 6,090,880 1-month HKD HIBOR -0.75% Performance of ASM Pacific
Technology Ltd.BNP Paribas 31-Dec-18 (13,304)
EUR 100,548 Performance of Nyrstar NV,cvt., senior note, Reg S,5.00%, 07/11/22
1-month EURIBOR +0.80% BNP Paribas 31-Dec-18 (4,506)
GBP 37,237 1-month USD LIBOR -6.00% Performance of HurricaneEnergy PLC
BNP Paribas 29-Jan-19 (1,287)
USD 401,070 Performance of AYC FinanceLtd., cvt., senior note, Reg S,0.50%, 05/02/19
1-month USD LIBOR +0.75% BNP Paribas 27-Feb-19 4,264
USD 112,300 Performance of AYC FinanceLtd., cvt., senior note, Reg S,0.50%, 05/02/19
1-month USD LIBOR +1.00% BNP Paribas 27-Feb-19 1,194
SGD 749,520 Performance of Suntec REIT,cvt., senior note, Reg S,1.75%, 09/05/21
1-month SGD LIBOR +0.75% BNP Paribas 27-Feb-19 7,995
HKD 783,396 1-month HKD HIBOR -0.40% Performance of HaitianInternational Holdings Ltd.
BNP Paribas 27-Mar-19 863
SGD 753,242 1-month SGD LIBOR -0.50% Performance of Suntec REIT BNP Paribas 27-Mar-19 (19,174)THB 174,134 1-month USD LIBOR -0.75% Performance of CP ALL PCL,
fgn.BNP Paribas 27-Mar-19 32,816
USD 2,329,494 Performance of CP FoodsHoldings Ltd., cvt., senior note,Reg S, 0.50%, 09/22/21
1-month USD LIBOR +0.75% BNP Paribas 27-Mar-19 (92,308)
SGD 3,247,919 Performance of Suntec REIT,cvt., senior note, Reg S,1.75%, 09/05/21
1-month SGD LIBOR +0.75% BNP Paribas 27-Mar-19 34,644
USD 24,729 US Overnight Bank FundingRate -0.50%
Performance of Liberty MediaGroup
BNP Paribas 27-Mar-19 (777)
HKD 2,390,720 1-month HKD HIBOR -0.40% Performance of ASM PacificTechnology Ltd.
BNP Paribas 29-Apr-19 (5,222)
HKD 15,542,384 1-month HKD HIBOR -1.50% Performance of YuexiuTransport Infrastructure Ltd.
BNP Paribas 29-Apr-19 51,950
THB 865,841 1-month USD LIBOR -0.75% Performance of CP ALL PCL,fgn.
BNP Paribas 29-Apr-19 163,171
USD 2,204,833 Performance of Asia View Ltd.,cvt., senior note, Reg S,1.50%, 08/08/19
1-month USD LIBOR +0.90% BNP Paribas 29-Apr-19 (60,991)
USD 1,270,633 Performance of CP FoodsHoldings Ltd., cvt., senior note,Reg S, 0.50%, 09/22/21
1-month USD LIBOR +0.75% BNP Paribas 29-Apr-19 (50,350)
USD 131,735 Performance of Liberty MediaGroup, cvt., senior note,1.00%, 01/30/23
1-month USD LIBOR +0.75% BNP Paribas 29-Apr-19 3,425
USD 50,942 US Overnight Bank FundingRate -0.50%
Performance of Liberty MediaGroup
BNP Paribas 29-Apr-19 (1,600)
GBP 72,773 1-month GBP LIBOR -7.00% Performance of Premier OilPLC
BNP Paribas 30-May-19 (10,521)
USD 1,023,928 Performance of GuidewireSoftware Inc., cvt., senior note,1.25%, 03/15/25
1-month USD LIBOR +0.75% BNP Paribas 30-May-19 6,137
USD 138,793 Performance of Liberty MediaGroup, cvt., senior note,1.00%, 01/30/23
1-month USD LIBOR +0.75% BNP Paribas 30-May-19 3,608
USD 179,740 Performance of Tesla Inc., cvt.,senior note, 2.375%, 03/15/22
1-month USD LIBOR +0.75% BNP Paribas 30-May-19 3,850
USD 470,534 US Overnight Bank FundingRate -0.30%
Performance of GuidewireSoftware Inc.
BNP Paribas 30-May-19 1,643
USD 75,634 US Overnight Bank FundingRate -0.50%
Performance of Liberty MediaGroup
BNP Paribas 30-May-19 (2,376)
USD 73,734 US Overnight Bank FundingRate -3.50%
Performance of Tesla Inc. BNP Paribas 30-May-19 (2,137)
EUR 28,287 1-month EURIBOR -4.50% Performance of Nyrstar NV BNP Paribas 27-Jun-19 647GBP 141,280 1-month GBP LIBOR -0.40% Performance of EI Group PLC BNP Paribas 27-Jun-19 9,706
FRANKLIN TEMPLETON INVESTMENT FUNDS
Notes to the Financial StatementsAt June 30, 2018 (continued)
Note 10 — Open positions on total return swap contracts (continued)
136 Audited Annual Report www.franklintempleton.lu

As at June 30, 2018, the Company had entered into the following outstanding contracts:
Franklin K2 Alternative Strategies Fund (continued)Tradingcurrency
Notionalamount
Fund receives Fund pays Counterparty Maturitydate
Unrealisedprofit/(loss)
USD
GBP 83,692 1-month GBP LIBOR -7.00% Performance of Premier OilPLC
BNP Paribas 27-Jun-19 (12,099)
GBP 151,385 1-month USD LIBOR -6.00% Performance of HurricaneEnergy PLC
BNP Paribas 27-Jun-19 (5,232)
HKD 11,263,611 Performance of ASM PacificTechnology Ltd., cvt., seniornote, Reg S, 2.00%, 03/28/19
1-month HKD HIBOR +0.90% BNP Paribas 27-Jun-19 18,165
GBP 802,322 Performance of EnterpriseFunding Ltd., cvt., senior note,Reg S, 3.50%, 09/10/20
1-month GBP LIBOR +0.80% BNP Paribas 27-Jun-19 (11,787)
EUR 301,644 Performance of Nyrstar NV,cvt., senior note, Reg S,5.00%, 07/11/22
1-month EURIBOR +0.80% BNP Paribas 27-Jun-19 (13,518)
USD 1,009,968 Performance of Tesla Inc., cvt.,senior note, 2.375%, 03/15/22
1-month USD LIBOR +0.75% BNP Paribas 27-Jun-19 21,635
USD 691,387 US Overnight Bank FundingRate -3.50%
Performance of Tesla Inc. BNP Paribas 27-Jun-19 (20,038)
NOK 1,276,587 1-month EURIBOR -0.65% Performance of Subsea 7 SA BNP Paribas 29-Jul-19 (71,234)GBP 317,721 1-month GBP LIBOR -0.40% Performance of EI Group PLC BNP Paribas 29-Jul-19 21,826HKD 2,192,320 1-month HKD HIBOR -0.40% Performance of ASM Pacific
Technology Ltd.BNP Paribas 29-Jul-19 (4,789)
HKD 2,931,716 1-month HKD HIBOR -0.40% Performance of HaitianInternational Holdings Ltd.
BNP Paribas 29-Jul-19 3,228
HKD 1,729,156 1-month HKD HIBOR -1.50% Performance of YuexiuTransport Infrastructure Ltd.
BNP Paribas 29-Jul-19 5,780
USD 843,820 Performance of AcordaTherapeutics Inc., cvt., seniornote, 1.75%, 06/15/21
1-month USD LIBOR +0.75% BNP Paribas 29-Jul-19 414
USD 1,734,163 Performance of Carbonite Inc.,cvt., senior note, 2.50%,04/01/22
1-month USD LIBOR +0.75% BNP Paribas 29-Jul-19 (29,410)
GBP 802,322 Performance of EnterpriseFunding Ltd., cvt., senior note,Reg S, 3.50%, 09/10/20
1-month GBP LIBOR +0.80% BNP Paribas 29-Jul-19 (11,787)
USD 675,793 Performance of GuidewireSoftware Inc., cvt., senior note,1.25%, 03/15/25
1-month USD LIBOR +0.75% BNP Paribas 29-Jul-19 4,051
USD 1,265,651 Performance of HaitianInternational Holdings Ltd.,cvt., senior note, 2.00%,02/13/19
1-month USD LIBOR +0.90% BNP Paribas 29-Jul-19 (2,517)
USD 769,894 Performance of LigandPharmaceuticals Inc., cvt.,senior note, 144A, 0.75%,05/15/23
1-month USD LIBOR +0.75% BNP Paribas 29-Jul-19 18,588
EUR 1,729,993 Performance of SiemIndustries Inc., cvt., first lien,Reg S, 2.25%, 06/02/21
1-month EURIBOR +0.80% BNP Paribas 29-Jul-19 46,224
USD 383,935 Performance of Tesla Inc., cvt.,senior note, 2.375%, 03/15/22
1-month USD LIBOR +0.75% BNP Paribas 29-Jul-19 8,224
USD 831,078 Performance of VishayIntertechnology Inc., cvt.,senior bond, 144A, 2.25%,06/15/25
1-month USD LIBOR +0.75% BNP Paribas 29-Jul-19 (7,049)
USD 1,374,992 Performance of ZillowGroup Inc., cvt., senior note,2.00%, 12/01/21
1-month USD LIBOR +0.75% BNP Paribas 29-Jul-19 (15,425)
USD 294,519 US Overnight Bank FundingRate -0.30%
Performance of AcordaTherapeutics Inc.
BNP Paribas 29-Jul-19 1,539
USD 1,331,505 US Overnight Bank FundingRate -0.30%
Performance of Carbonite Inc. BNP Paribas 29-Jul-19 26,706
USD 337,364 US Overnight Bank FundingRate -0.30%
Performance of GuidewireSoftware Inc.
BNP Paribas 29-Jul-19 1,178
USD 368,763 US Overnight Bank FundingRate -0.30%
Performance of LigandPharmaceuticals Inc., B
BNP Paribas 29-Jul-19 (16,683)
USD 403,402 US Overnight Bank FundingRate -0.30%
Performance of VishayIntertechnology Inc.
BNP Paribas 29-Jul-19 12,171
USD 868,832 US Overnight Bank FundingRate -0.30%
Performance of ZillowGroup Inc., C
BNP Paribas 29-Jul-19 19,685
FRANKLIN TEMPLETON INVESTMENT FUNDS
Notes to the Financial StatementsAt June 30, 2018 (continued)
Note 10 — Open positions on total return swap contracts (continued)
www.franklintempleton.lu Audited Annual Report 137

As at June 30, 2018, the Company had entered into the following outstanding contracts:
Franklin K2 Alternative Strategies Fund (continued)Tradingcurrency
Notionalamount
Fund receives Fund pays Counterparty Maturitydate
Unrealisedprofit/(loss)
USD
USD 247,610 US Overnight Bank FundingRate -3.50%
Performance of Tesla Inc. BNP Paribas 29-Jul-19 (7,176)
USD 345,517 Performance of Arbor RealtyTrust Inc., cvt., senior note,5.375%, 11/15/20
1-month USD LIBOR +0.75% BNP Paribas 28-Aug-19 (2,717)
USD 466,917 Performance of LigandPharmaceuticals Inc., cvt.,senior note, 144A, 0.75%,05/15/23
1-month USD LIBOR +0.75% BNP Paribas 28-Aug-19 11,273
USD 809,911 Performance of Twilio Inc., cvt.,senior note, 144A, 0.25%,06/01/23
1-month USD LIBOR +0.75% BNP Paribas 28-Aug-19 15,272
USD 282,637 Performance of ZillowGroup Inc., cvt., senior note,2.00%, 12/01/21
1-month USD LIBOR +0.75% BNP Paribas 28-Aug-19 (3,171)
USD 229,752 US Overnight Bank FundingRate -0.30%
Performance of LigandPharmaceuticals Inc., B
BNP Paribas 28-Aug-19 (10,394)
USD 400,375 US Overnight Bank FundingRate -0.30%
Performance of Twilio Inc., A BNP Paribas 28-Aug-19 (9,506)
USD 13,441 US Overnight Bank FundingRate -0.50%
Performance of Liberty MediaGroup
BNP Paribas 28-Aug-19 (422)
USD 245,553 US Overnight Bank FundingRate -1.00%
Performance of Arbor RealtyTrust Inc.
BNP Paribas 28-Aug-19 942
USD 191,295 US Overnight Bank FundingRate -1.00%
Performance of ZillowGroup Inc., C
BNP Paribas 28-Aug-19 4,334
MYR 215,311 1-month SGD LIBOR -3.10% Performance of IHH HealthcareBhd.
Deutsche Bank 20-Aug-18 (2,380)
USD 826,813 Performance of Asia View Ltd.,cvt., senior note, Reg S,1.50%, 08/08/19
1-month USD LIBOR +0.90% Deutsche Bank 20-Aug-18 (32,925)
USD 671,599 Performance of PB Issuer No. 4Ltd., cvt., senior note, Reg S,3.25%, 07/03/21
1-month USD LIBOR +0.90% Deutsche Bank 20-Aug-18 2,108
USD 3,237,523 US Overnight Bank FundingRate -0.35%
Performance of AT&T Inc. Deutsche Bank 17-Sep-18 104,859
USD 1,809,628 US Overnight Bank FundingRate -0.35%
Performance of Cigna Corp. Deutsche Bank 17-Sep-18 40,798
USD 5,006,772 US Overnight Bank FundingRate -0.35%
Performance of CME Group Inc. Deutsche Bank 17-Sep-18 180,516
USD 855,483 US Overnight Bank FundingRate -0.35%
Performance of ConagraBrands Inc.
Deutsche Bank 17-Sep-18 10,439
USD 9,325,482 US Overnight Bank FundingRate -0.35%
Performance of ConchoResources Inc.
Deutsche Bank 17-Sep-18 (847,818)
USD 4,279,082 US Overnight Bank FundingRate -0.35%
Performance of CVS HealthCorp.
Deutsche Bank 17-Sep-18 381,693
USD 4,917,220 US Overnight Bank FundingRate -0.35%
Performance of Discovery Inc.,A
Deutsche Bank 17-Sep-18 21,738
USD 10,216,840 US Overnight Bank FundingRate -0.35%
Performance of MarathonPetroleum Corp.
Deutsche Bank 17-Sep-18 415,638
USD 975,027 US Overnight Bank FundingRate -0.35%
Performance of MarvellTechnology Group Ltd.
Deutsche Bank 17-Sep-18 21,374
USD 2,334,596 US Overnight Bank FundingRate -0.35%
Performance of PebblebrookHotel Trust
Deutsche Bank 17-Sep-18 12,311
USD 746,137 US Overnight Bank FundingRate -0.35%
Performance of SinclairBroadcast Group Inc., A
Deutsche Bank 17-Sep-18 10,444
USD 10,930,959 US Overnight Bank FundingRate -0.35%
Performance of SpectrumBrands Holdings Inc.
Deutsche Bank 17-Sep-18 (417,846)
USD 3,375,014 US Overnight Bank FundingRate -0.35%
Performance of Sprint Corp. Deutsche Bank 17-Sep-18 31,020
USD 3,569,724 US Overnight Bank FundingRate -0.35%
Performance of The WaltDisney Co.
Deutsche Bank 17-Sep-18 119,908
USD 1,811,060 US Overnight Bank FundingRate -0.35%
Performance of UnitedTechnologies Corp.
Deutsche Bank 17-Sep-18 27,231
USD 1,841,472 US Overnight Bank FundingRate -6.50%
Performance of Rent-A-Center Inc.
Deutsche Bank 17-Sep-18 17,514
SGD 268,750 Performance of Indah CapitalLtd., senior note, Reg S, cvt.,zero cpn., 10/24/18
1-month SGD LIBOR +1.00% Deutsche Bank 19-Sep-18 1,376
USD 155,585 1-month USD LIBOR -0.35% Performance of LigandPharmaceuticals Inc., B
Deutsche Bank 01-Oct-18 (16,614)
FRANKLIN TEMPLETON INVESTMENT FUNDS
Notes to the Financial StatementsAt June 30, 2018 (continued)
Note 10 — Open positions on total return swap contracts (continued)
138 Audited Annual Report www.franklintempleton.lu

As at June 30, 2018, the Company had entered into the following outstanding contracts:
Franklin K2 Alternative Strategies Fund (continued)Tradingcurrency
Notionalamount
Fund receives Fund pays Counterparty Maturitydate
Unrealisedprofit/(loss)
USD
USD 595,196 Performance of AK Steel Corp.,cvt., senior note, 5.00%,11/15/19
1-month USD LIBOR +1.00% Deutsche Bank 01-Oct-18 (10,240)
USD 486,224 Performance of AllscriptsHealthcare Solutions Inc., cvt.,senior note, 1.25%, 07/01/20
1-month USD LIBOR +1.00% Deutsche Bank 01-Oct-18 (14,486)
USD 544,565 Performance of Alteryx Inc.,cvt., senior note, 144A,0.50%, 06/01/23
1-month USD LIBOR +1.00% Deutsche Bank 01-Oct-18 (3,804)
USD 1,587,884 Performance of AmericanResidential Properties OP LP,cvt., senior note, 144A,3.25%, 11/15/18
1-month USD LIBOR +1.00% Deutsche Bank 01-Oct-18 162,926
USD 2,542,946 Performance of AmicusTherapeutics Inc., cvt., seniornote, 144A, 3.00%, 12/15/23
1-month USD LIBOR +1.00% Deutsche Bank 01-Oct-18 743,521
USD 1,373,617 Performance of Atlas AirWorldwide Holdings Inc., cvt.,senior note, 1.875%, 06/01/24
1-month USD LIBOR +1.00% Deutsche Bank 01-Oct-18 83,128
USD 994,564 Performance of Atlassian Inc.,cvt., senior note, 144A,0.625%, 05/01/23
1-month USD LIBOR +1.00% Deutsche Bank 01-Oct-18 (13,562)
USD 1,042,208 Performance of CalAmp Corp.,cvt., senior note, 1.625%,05/15/20
1-month USD LIBOR +1.00% Deutsche Bank 01-Oct-18 21,647
USD 1,115,779 Performance of Carbonite Inc.,cvt., senior note, 2.50%,04/01/22
1-month USD LIBOR +1.00% Deutsche Bank 01-Oct-18 147,536
USD 1,269,277 Performance of Cemex SAB deCV, cvt., 3.72%, 03/15/20
1-month USD LIBOR +1.00% Deutsche Bank 01-Oct-18 (29,672)
USD 589,947 Performance of Chegg Inc.,cvt., senior note, 144A,0.25%, 05/15/23
1-month USD LIBOR +1.00% Deutsche Bank 01-Oct-18 (8,154)
USD 1,033,742 Performance of ChesapeakeEnergy Corp., cvt., senior note,5.50%, 09/15/26
1-month USD LIBOR +1.00% Deutsche Bank 01-Oct-18 12,619
USD 434,769 Performance of Cleveland-Cliffs Inc., cvt., senior note,1.50%, 01/15/25
1-month USD LIBOR +1.00% Deutsche Bank 01-Oct-18 107
USD 505,835 Performance of ColonyNorthStar Inc., cvt., seniornote, 3.875%, 01/15/21
1-month USD LIBOR +1.00% Deutsche Bank 01-Oct-18 (35,103)
USD 206,703 Performance of CoriumInternational Inc., cvt., seniornote, 144A, 5.00%, 03/15/25
1-month USD LIBOR +1.00% Deutsche Bank 01-Oct-18 (23,935)
USD 739,613 Performance of CoupaSoftware Inc., cvt., senior note,144A, 0.375%, 01/15/23
1-month USD LIBOR +1.00% Deutsche Bank 01-Oct-18 45,493
USD 498,148 Performance of CSG SystemsInternational Inc., cvt., seniornote, 4.25%, 03/15/36
1-month USD LIBOR +1.00% Deutsche Bank 01-Oct-18 (22,256)
USD 717,668 Performance of Encore CapitalGroup Inc., cvt., senior note,2.875%, 03/15/21
1-month USD LIBOR +1.00% Deutsche Bank 01-Oct-18 (68,364)
USD 890,333 Performance of Encore CapitalGroup Inc., cvt., senior note,3.25%, 03/15/22
1-month USD LIBOR +1.00% Deutsche Bank 01-Oct-18 (23,957)
USD 711,049 Performance of Envestnet Inc.,cvt., senior note, 144A,1.75%, 06/01/23
1-month USD LIBOR +1.00% Deutsche Bank 01-Oct-18 (13,375)
USD 150,433 Performance of Everbridge Inc.,cvt., senior note, 1.50%,11/01/22
1-month USD LIBOR +1.00% Deutsche Bank 01-Oct-18 (7,098)
USD 856,749 Performance of EvolentHealth Inc., cvt., senior note,2.00%, 12/01/21
1-month USD LIBOR +1.00% Deutsche Bank 01-Oct-18 (25,361)
USD 1,249,761 Performance of EZCORP Inc.,cvt., senior note, 2.12%,06/15/19
1-month USD LIBOR +1.00% Deutsche Bank 01-Oct-18 (30,062)
FRANKLIN TEMPLETON INVESTMENT FUNDS
Notes to the Financial StatementsAt June 30, 2018 (continued)
Note 10 — Open positions on total return swap contracts (continued)
www.franklintempleton.lu Audited Annual Report 139

As at June 30, 2018, the Company had entered into the following outstanding contracts:
Franklin K2 Alternative Strategies Fund (continued)Tradingcurrency
Notionalamount
Fund receives Fund pays Counterparty Maturitydate
Unrealisedprofit/(loss)
USD
USD 214,132 Performance of First MajesticSilver Corp., cvt., senior note,144A, 1.875%, 03/01/23
1-month USD LIBOR +1.00% Deutsche Bank 01-Oct-18 5,126
USD 502,754 Performance of Five9 Inc., cvt.,senior note, 144A, 0.125%,05/01/23
1-month USD LIBOR +1.00% Deutsche Bank 01-Oct-18 (2,726)
USD 886,310 Performance of Forest CityEnterprises Inc., cvt., seniornote, 4.25%, 08/15/18
1-month USD LIBOR +1.00% Deutsche Bank 01-Oct-18 (32,973)
USD 1,090,777 Performance of Golar LNG Ltd.,cvt., senior note, 2.75%,02/15/22
1-month USD LIBOR +1.00% Deutsche Bank 01-Oct-18 13,537
USD 831,687 Performance of GreenPlains Inc., cvt., senior note,4.125%, 09/01/22
1-month USD LIBOR +1.00% Deutsche Bank 01-Oct-18 (41,102)
USD 423,376 Performance of HerbalifeNutrition Ltd., cvt., senior note,144A, 2.625%, 03/15/24
1-month USD LIBOR +1.00% Deutsche Bank 01-Oct-18 (6,548)
USD 1,303 Performance of HerbalifeNutrition Ltd., cvt., senior note,2.00%, 08/15/19
1-month USD LIBOR +1.00% Deutsche Bank 01-Oct-18 (30)
USD 848,973 Performance of Huazhu GroupLtd., cvt., senior note, 144A,0.375%, 11/01/22
1-month USD LIBOR +1.00% Deutsche Bank 01-Oct-18 28,728
USD 966,103 Performance of HubSpot Inc.,cvt., senior note, 0.25%,06/01/22
1-month USD LIBOR +1.00% Deutsche Bank 01-Oct-18 31,506
USD 783,973 Performance of Innoviva Inc.,cvt., sub. note, 2.125%,01/15/23
1-month USD LIBOR +1.00% Deutsche Bank 01-Oct-18 (4,114)
USD 560,361 Performance of Insulet Corp.,cvt., senior note, 144A,1.375%, 11/15/24
1-month USD LIBOR +1.00% Deutsche Bank 01-Oct-18 (40,541)
USD 571,593 Performance of IntegratedDevice Technology Inc., cvt.,senior note, 0.875%, 11/15/22
1-month USD LIBOR +1.00% Deutsche Bank 01-Oct-18 (28,257)
USD 2,406,748 Performance of Invacare Corp.,cvt., senior note, 5.00%,02/15/21
1-month USD LIBOR +1.00% Deutsche Bank 01-Oct-18 222,814
USD 650,336 Performance of j2 Global Inc.,cvt., senior bond, 3.25%,06/15/29
1-month USD LIBOR +1.00% Deutsche Bank 01-Oct-18 3,461
USD 574,106 Performance of Kaman Corp.,cvt., senior note, 3.25%,05/01/24
1-month USD LIBOR +1.00% Deutsche Bank 01-Oct-18 45,639
USD 283,831 Performance of Knowles Corp.,cvt., senior note, 3.25%,11/01/21
1-month USD LIBOR +1.00% Deutsche Bank 01-Oct-18 (5,154)
USD 475,425 Performance of Liberty ExpediaHoldings, cvt., 144A, 1.00%,06/30/47
1-month USD LIBOR +1.00% Deutsche Bank 01-Oct-18 1,345
USD 471,029 Performance of LibertyInteractive LLC, cvt., seniorbond, 4.00%, 11/15/29
1-month USD LIBOR +1.00% Deutsche Bank 01-Oct-18 55,406
USD 258,361 Performance of LigandPharmaceuticals Inc., cvt.,senior note, 144A, 0.75%,05/15/23
1-month USD LIBOR +1.00% Deutsche Bank 01-Oct-18 4,952
USD 402,416 Performance of MicrochipTechnology Inc., cvt., 1.625%,02/15/27
1-month USD LIBOR +1.00% Deutsche Bank 01-Oct-18 4,212
USD 442,481 Performance ofMINDBODY Inc., cvt., seniorbond, 144A, 0.375%,06/01/23
1-month USD LIBOR +1.00% Deutsche Bank 01-Oct-18 (3,801)
USD 263,873 Performance of NavistarInternational Corp., cvt., seniorsub. note, 4.75%, 04/15/19
1-month USD LIBOR +1.00% Deutsche Bank 01-Oct-18 (6,527)
FRANKLIN TEMPLETON INVESTMENT FUNDS
Notes to the Financial StatementsAt June 30, 2018 (continued)
Note 10 — Open positions on total return swap contracts (continued)
140 Audited Annual Report www.franklintempleton.lu

As at June 30, 2018, the Company had entered into the following outstanding contracts:
Franklin K2 Alternative Strategies Fund (continued)Tradingcurrency
Notionalamount
Fund receives Fund pays Counterparty Maturitydate
Unrealisedprofit/(loss)
USD
USD 708,339 Performance of NeurocrineBiosciences Inc., cvt., seniornote, 2.25%, 05/15/24
1-month USD LIBOR +1.00% Deutsche Bank 01-Oct-18 (13,348)
USD 974,193 Performance of OasisPetroleum Inc., cvt., seniornote, 2.625%, 09/15/23
1-month USD LIBOR +1.00% Deutsche Bank 01-Oct-18 4,766
USD 620,099 Performance of Okta Inc., cvt.,senior note, 144A, 0.25%,02/15/23
1-month USD LIBOR +1.00% Deutsche Bank 01-Oct-18 (25,560)
USD 166,039 Performance of OSISystems Inc., senior note, cvt.,1.25%, 09/01/22
1-month USD LIBOR +1.00% Deutsche Bank 01-Oct-18 1,005
USD 40,323 Performance of PaciraPharmaceuticals Inc., cvt.,senior note, 2.375%, 04/01/22
1-month USD LIBOR +1.00% Deutsche Bank 01-Oct-18 (919)
USD 464,598 Performance of PatrickIndustries Inc., cvt., seniornote, 144A, 1.00%, 02/01/23
1-month USD LIBOR +1.00% Deutsche Bank 01-Oct-18 (22,744)
USD 251,688 Performance of PDLBioPharma Inc., cvt., seniornote, 4.00%, 12/01/21
1-month USD LIBOR +1.00% Deutsche Bank 01-Oct-18 (52,368)
USD 305,566 Performance of PRAGroup Inc., cvt., senior note,3.00%, 08/01/20
1-month USD LIBOR +1.00% Deutsche Bank 01-Oct-18 989
USD 474,547 Performance of PRAGroup Inc., cvt., senior note,3.50%, 06/01/23
1-month USD LIBOR +1.00% Deutsche Bank 01-Oct-18 (3,110)
USD 247,759 Performance of PROSHoldings Inc., cvt., senior note,144A, 2.00%, 06/01/47
1-month USD LIBOR +1.00% Deutsche Bank 01-Oct-18 (4,481)
USD 133,845 Performance of RadiusHealth Inc., cvt., senior note,3.00%, 09/01/24
1-month USD LIBOR +1.00% Deutsche Bank 01-Oct-18 (10,266)
USD 1,069,309 Performance of Realpage Inc.,cvt., senior note, 1.50%,11/15/22
1-month USD LIBOR +1.00% Deutsche Bank 01-Oct-18 (70,440)
USD 639,666 Performance of Red Hat Inc.,cvt., senior note, 0.25%,10/01/19
1-month USD LIBOR +1.00% Deutsche Bank 01-Oct-18 (158,541)
USD 136,608 Performance of RedwoodTrust Inc., cvt., senior note,4.75%, 08/15/23
1-month USD LIBOR +1.00% Deutsche Bank 01-Oct-18 (2,276)
USD 925,036 Performance of Repligen Corp.,cvt., 2.125%, 01/06/21
1-month USD LIBOR +1.00% Deutsche Bank 01-Oct-18 51,747
USD 388,238 Performance of RestorationHardware Holdings Inc., cvt.,senior note, 144A, zero cpn.,06/15/19
1-month USD LIBOR +1.00% Deutsche Bank 01-Oct-18 79,564
USD 520,324 Performance ofRingcentral Inc., cvt., seniornote, 144A, zero cpn.,03/15/23
1-month USD LIBOR +1.00% Deutsche Bank 01-Oct-18 (26,901)
USD 226,977 Performance of RWTHoldings Inc., cvt., senior note,5.625%, 11/15/19
1-month USD LIBOR +1.00% Deutsche Bank 01-Oct-18 9,550
USD 308,897 Performance of Sea Ltd., cvt.,senior note, 144A, 2.25%,07/01/23
1-month USD LIBOR +1.00% Deutsche Bank 01-Oct-18 (1,791)
USD 1,057,326 Performance of SEACORHoldings Inc., cvt., seniorbond, 3.00%, 11/15/28
1-month USD LIBOR +1.00% Deutsche Bank 01-Oct-18 20,695
USD 336,569 Performance ofServiceNow Inc., cvt., seniorbond, zero cpn., 06/01/22
1-month USD LIBOR +1.00% Deutsche Bank 01-Oct-18 (4,557)
USD 364,927 Performance of SM Energy Co.,cvt., senior note, 1.50%,07/01/21
1-month USD LIBOR +1.00% Deutsche Bank 01-Oct-18 3,479
FRANKLIN TEMPLETON INVESTMENT FUNDS
Notes to the Financial StatementsAt June 30, 2018 (continued)
Note 10 — Open positions on total return swap contracts (continued)
www.franklintempleton.lu Audited Annual Report 141
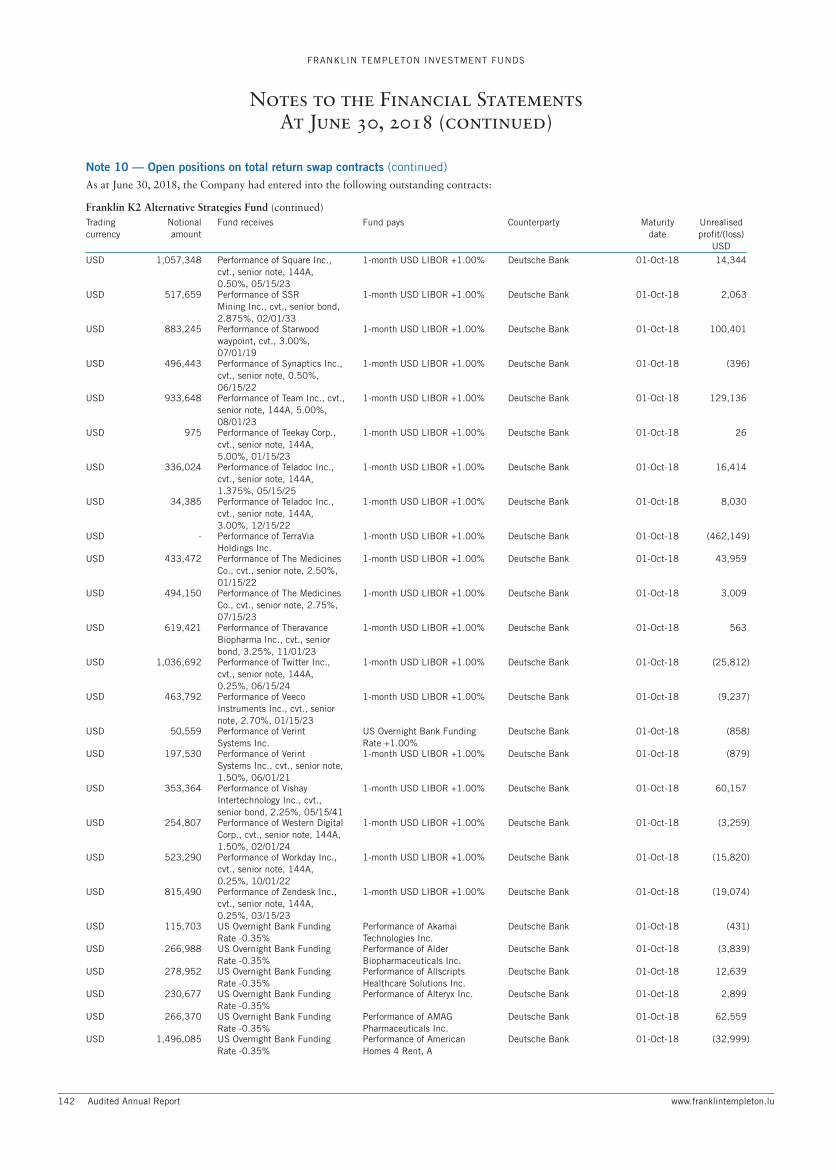
As at June 30, 2018, the Company had entered into the following outstanding contracts:
Franklin K2 Alternative Strategies Fund (continued)Tradingcurrency
Notionalamount
Fund receives Fund pays Counterparty Maturitydate
Unrealisedprofit/(loss)
USD
USD 1,057,348 Performance of Square Inc.,cvt., senior note, 144A,0.50%, 05/15/23
1-month USD LIBOR +1.00% Deutsche Bank 01-Oct-18 14,344
USD 517,659 Performance of SSRMining Inc., cvt., senior bond,2.875%, 02/01/33
1-month USD LIBOR +1.00% Deutsche Bank 01-Oct-18 2,063
USD 883,245 Performance of Starwoodwaypoint, cvt., 3.00%,07/01/19
1-month USD LIBOR +1.00% Deutsche Bank 01-Oct-18 100,401
USD 496,443 Performance of Synaptics Inc.,cvt., senior note, 0.50%,06/15/22
1-month USD LIBOR +1.00% Deutsche Bank 01-Oct-18 (396)
USD 933,648 Performance of Team Inc., cvt.,senior note, 144A, 5.00%,08/01/23
1-month USD LIBOR +1.00% Deutsche Bank 01-Oct-18 129,136
USD 975 Performance of Teekay Corp.,cvt., senior note, 144A,5.00%, 01/15/23
1-month USD LIBOR +1.00% Deutsche Bank 01-Oct-18 26
USD 336,024 Performance of Teladoc Inc.,cvt., senior note, 144A,1.375%, 05/15/25
1-month USD LIBOR +1.00% Deutsche Bank 01-Oct-18 16,414
USD 34,385 Performance of Teladoc Inc.,cvt., senior note, 144A,3.00%, 12/15/22
1-month USD LIBOR +1.00% Deutsche Bank 01-Oct-18 8,030
USD - Performance of TerraViaHoldings Inc.
1-month USD LIBOR +1.00% Deutsche Bank 01-Oct-18 (462,149)
USD 433,472 Performance of The MedicinesCo., cvt., senior note, 2.50%,01/15/22
1-month USD LIBOR +1.00% Deutsche Bank 01-Oct-18 43,959
USD 494,150 Performance of The MedicinesCo., cvt., senior note, 2.75%,07/15/23
1-month USD LIBOR +1.00% Deutsche Bank 01-Oct-18 3,009
USD 619,421 Performance of TheravanceBiopharma Inc., cvt., seniorbond, 3.25%, 11/01/23
1-month USD LIBOR +1.00% Deutsche Bank 01-Oct-18 563
USD 1,036,692 Performance of Twitter Inc.,cvt., senior note, 144A,0.25%, 06/15/24
1-month USD LIBOR +1.00% Deutsche Bank 01-Oct-18 (25,812)
USD 463,792 Performance of VeecoInstruments Inc., cvt., seniornote, 2.70%, 01/15/23
1-month USD LIBOR +1.00% Deutsche Bank 01-Oct-18 (9,237)
USD 50,559 Performance of VerintSystems Inc.
US Overnight Bank FundingRate +1.00%
Deutsche Bank 01-Oct-18 (858)
USD 197,530 Performance of VerintSystems Inc., cvt., senior note,1.50%, 06/01/21
1-month USD LIBOR +1.00% Deutsche Bank 01-Oct-18 (879)
USD 353,364 Performance of VishayIntertechnology Inc., cvt.,senior bond, 2.25%, 05/15/41
1-month USD LIBOR +1.00% Deutsche Bank 01-Oct-18 60,157
USD 254,807 Performance of Western DigitalCorp., cvt., senior note, 144A,1.50%, 02/01/24
1-month USD LIBOR +1.00% Deutsche Bank 01-Oct-18 (3,259)
USD 523,290 Performance of Workday Inc.,cvt., senior note, 144A,0.25%, 10/01/22
1-month USD LIBOR +1.00% Deutsche Bank 01-Oct-18 (15,820)
USD 815,490 Performance of Zendesk Inc.,cvt., senior note, 144A,0.25%, 03/15/23
1-month USD LIBOR +1.00% Deutsche Bank 01-Oct-18 (19,074)
USD 115,703 US Overnight Bank FundingRate -0.35%
Performance of AkamaiTechnologies Inc.
Deutsche Bank 01-Oct-18 (431)
USD 266,988 US Overnight Bank FundingRate -0.35%
Performance of AlderBiopharmaceuticals Inc.
Deutsche Bank 01-Oct-18 (3,839)
USD 278,952 US Overnight Bank FundingRate -0.35%
Performance of AllscriptsHealthcare Solutions Inc.
Deutsche Bank 01-Oct-18 12,639
USD 230,677 US Overnight Bank FundingRate -0.35%
Performance of Alteryx Inc. Deutsche Bank 01-Oct-18 2,899
USD 266,370 US Overnight Bank FundingRate -0.35%
Performance of AMAGPharmaceuticals Inc.
Deutsche Bank 01-Oct-18 62,559
USD 1,496,085 US Overnight Bank FundingRate -0.35%
Performance of AmericanHomes 4 Rent, A
Deutsche Bank 01-Oct-18 (32,999)
FRANKLIN TEMPLETON INVESTMENT FUNDS
Notes to the Financial StatementsAt June 30, 2018 (continued)
Note 10 — Open positions on total return swap contracts (continued)
142 Audited Annual Report www.franklintempleton.lu

As at June 30, 2018, the Company had entered into the following outstanding contracts:
Franklin K2 Alternative Strategies Fund (continued)Tradingcurrency
Notionalamount
Fund receives Fund pays Counterparty Maturitydate
Unrealisedprofit/(loss)
USD
USD 3,310,393 US Overnight Bank FundingRate -0.35%
Performance of AmicusTherapeutics Inc.
Deutsche Bank 01-Oct-18 (1,113,573)
USD 848,785 US Overnight Bank FundingRate -0.35%
Performance of Atlas AirWorldwide Holdings Inc.
Deutsche Bank 01-Oct-18 (7,796)
USD 440,829 US Overnight Bank FundingRate -0.35%
Performance of Atlassian Corp.PLC
Deutsche Bank 01-Oct-18 3,893
USD 431,700 US Overnight Bank FundingRate -0.35%
Performance of Avaya HoldingsCorp.
Deutsche Bank 01-Oct-18 33,104
USD 338,259 US Overnight Bank FundingRate -0.35%
Performance of CalAmp Corp. Deutsche Bank 01-Oct-18 2,994
USD 761,937 US Overnight Bank FundingRate -0.35%
Performance of Carbonite Inc. Deutsche Bank 01-Oct-18 (77,931)
USD 527,487 US Overnight Bank FundingRate -0.35%
Performance of ChartIndustries Inc.
Deutsche Bank 01-Oct-18 96,966
USD 384,363 US Overnight Bank FundingRate -0.35%
Performance of Chegg Inc. Deutsche Bank 01-Oct-18 (765)
USD 1,061,076 US Overnight Bank FundingRate -0.35%
Performance of Cleveland-Cliffs Inc.
Deutsche Bank 01-Oct-18 (57,426)
USD 644,869 US Overnight Bank FundingRate -0.35%
Performance of CoupaSoftware Inc.
Deutsche Bank 01-Oct-18 (17,307)
USD 211,216 US Overnight Bank FundingRate -0.35%
Performance of CSG SystemsInternational Inc.
Deutsche Bank 01-Oct-18 19,622
USD 7,033 US Overnight Bank FundingRate -0.35%
Performance of Electronics forImaging Inc.
Deutsche Bank 01-Oct-18 10
USD 1,511,800 US Overnight Bank FundingRate -0.35%
Performance of Encore CapitalGroup Inc.
Deutsche Bank 01-Oct-18 247,069
USD 514,991 US Overnight Bank FundingRate -0.35%
Performance of Envestnet Inc. Deutsche Bank 01-Oct-18 11,786
USD 119,498 US Overnight Bank FundingRate -0.35%
Performance of Everbridge Inc. Deutsche Bank 01-Oct-18 6,853
USD 363,407 US Overnight Bank FundingRate -0.35%
Performance of EvolentHealth Inc., A
Deutsche Bank 01-Oct-18 19,934
USD 195,669 US Overnight Bank FundingRate -0.35%
Performance of ExpediaGroup Inc.
Deutsche Bank 01-Oct-18 3,645
USD 995,848 US Overnight Bank FundingRate -0.35%
Performance of EZCORP Inc., A Deutsche Bank 01-Oct-18 85,096
USD 195,079 US Overnight Bank FundingRate -0.35%
Performance of Five9 Inc. Deutsche Bank 01-Oct-18 1,803
USD 1,426,902 US Overnight Bank FundingRate -0.35%
Performance of Forest CityRealty Trust Inc., A
Deutsche Bank 01-Oct-18 (31,018)
USD 840,191 US Overnight Bank FundingRate -0.35%
Performance of Fortive Corp. Deutsche Bank 01-Oct-18 (18,568)
USD 583,470 US Overnight Bank FundingRate -0.35%
Performance of GDS HoldingsLtd., ADR
Deutsche Bank 01-Oct-18 (22,090)
USD 285,556 US Overnight Bank FundingRate -0.35%
Performance of Golar LNG Ltd. Deutsche Bank 01-Oct-18 (21,753)
USD 880,907 US Overnight Bank FundingRate -0.35%
Performance of GreenPlains Inc.
Deutsche Bank 01-Oct-18 92,999
USD 29,546 US Overnight Bank FundingRate -0.35%
Performance of GSV CapitalCorp.
Deutsche Bank 01-Oct-18 656
USD 234,113 US Overnight Bank FundingRate -0.35%
Performance of GuidewireSoftware Inc.
Deutsche Bank 01-Oct-18 1,949
USD 1,037,279 US Overnight Bank FundingRate -0.35%
Performance of HerbalifeNutrition Ltd.
Deutsche Bank 01-Oct-18 (12,178)
USD 440,954 US Overnight Bank FundingRate -0.35%
Performance of HopeBancorp Inc.
Deutsche Bank 01-Oct-18 9,672
USD 844,694 US Overnight Bank FundingRate -0.35%
Performance of Hubspot Inc. Deutsche Bank 01-Oct-18 (10,400)
USD 602,660 US Overnight Bank FundingRate -0.35%
Performance of Innoviva Inc. Deutsche Bank 01-Oct-18 36,686
USD 311,262 US Overnight Bank FundingRate -0.35%
Performance of Insulet Corp. Deutsche Bank 01-Oct-18 22,075
USD 333,529 US Overnight Bank FundingRate -0.35%
Performance of IntegratedDevice Technology Inc.
Deutsche Bank 01-Oct-18 25,747
USD 1,654,154 US Overnight Bank FundingRate -0.35%
Performance of Invacare Corp. Deutsche Bank 01-Oct-18 (209,495)
USD 2,684,322 US Overnight Bank FundingRate -0.35%
Performance of InvitationHomes Inc.
Deutsche Bank 01-Oct-18 (50,276)
USD 290,403 US Overnight Bank FundingRate -0.35%
Performance of J2 Global Inc. Deutsche Bank 01-Oct-18 (7,280)
FRANKLIN TEMPLETON INVESTMENT FUNDS
Notes to the Financial StatementsAt June 30, 2018 (continued)
Note 10 — Open positions on total return swap contracts (continued)
www.franklintempleton.lu Audited Annual Report 143

As at June 30, 2018, the Company had entered into the following outstanding contracts:
Franklin K2 Alternative Strategies Fund (continued)Tradingcurrency
Notionalamount
Fund receives Fund pays Counterparty Maturitydate
Unrealisedprofit/(loss)
USD
USD 615,572 US Overnight Bank FundingRate -0.35%
Performance of Kaman Corp., A Deutsche Bank 01-Oct-18 (52,537)
USD 449,223 US Overnight Bank FundingRate -0.35%
Performance of Knowles Corp. Deutsche Bank 01-Oct-18 (53,481)
USD 1,338,420 US Overnight Bank FundingRate -0.35%
Performance of MicrochipTechnology Inc.
Deutsche Bank 01-Oct-18 (6,417)
USD 238,432 US Overnight Bank FundingRate -0.35%
Performance ofMINDBODY Inc., A
Deutsche Bank 01-Oct-18 5,086
USD 214,847 US Overnight Bank FundingRate -0.35%
Performance of Momo Inc.,ADR
Deutsche Bank 01-Oct-18 6,382
USD 382,350 US Overnight Bank FundingRate -0.35%
Performance of MongoDB Inc. Deutsche Bank 01-Oct-18 18,220
USD 145,370 US Overnight Bank FundingRate -0.35%
Performance of NavistarInternational Corp.
Deutsche Bank 01-Oct-18 (13,191)
USD 516,841 US Overnight Bank FundingRate -0.35%
Performance of NeurocrineBiosciences Inc.
Deutsche Bank 01-Oct-18 6,493
USD 553,417 US Overnight Bank FundingRate -0.35%
Performance of OasisPetroleum Inc.
Deutsche Bank 01-Oct-18 (5,055)
USD 390,619 US Overnight Bank FundingRate -0.35%
Performance of Okta Inc., A Deutsche Bank 01-Oct-18 3,411
USD 84,067 US Overnight Bank FundingRate -0.35%
Performance of PaciraPharmaceuticals Inc.
Deutsche Bank 01-Oct-18 9,045
USD 323,988 US Overnight Bank FundingRate -0.35%
Performance of PatrickIndustries Inc.
Deutsche Bank 01-Oct-18 28,298
USD 927,436 US Overnight Bank FundingRate -0.35%
Performance of PRA Group Inc. Deutsche Bank 01-Oct-18 (5,819)
USD 54,124 US Overnight Bank FundingRate -0.35%
Performance of PROSHoldings Inc.
Deutsche Bank 01-Oct-18 2,071
USD 542,680 US Overnight Bank FundingRate -0.35%
Performance of RealPage Inc. Deutsche Bank 01-Oct-18 30,128
USD 640,676 US Overnight Bank FundingRate -0.35%
Performance of Red Hat Inc. Deutsche Bank 01-Oct-18 96,372
USD 240,709 US Overnight Bank FundingRate -0.35%
Performance of RedwoodTrust Inc.
Deutsche Bank 01-Oct-18 1,153
USD 718,019 US Overnight Bank FundingRate -0.35%
Performance of Repligen Corp. Deutsche Bank 01-Oct-18 (51,307)
USD 206,196 US Overnight Bank FundingRate -0.35%
Performance ofRingCentral Inc., A
Deutsche Bank 01-Oct-18 15,010
USD 288,675 US Overnight Bank FundingRate -0.35%
Performance of Sea Ltd., ADR Deutsche Bank 01-Oct-18 3,067
USD 77,372 US Overnight Bank FundingRate -0.35%
Performance of SEACORHoldings Inc.
Deutsche Bank 01-Oct-18 (8,214)
USD 512,926 US Overnight Bank FundingRate -0.35%
Performance ofServiceNow Inc.
Deutsche Bank 01-Oct-18 12,556
USD 99,908 US Overnight Bank FundingRate -0.35%
Performance of SM Energy Co. Deutsche Bank 01-Oct-18 (4,438)
USD 390,366 US Overnight Bank FundingRate -0.35%
Performance of Square Inc., A Deutsche Bank 01-Oct-18 (1,398)
USD 89,507 US Overnight Bank FundingRate -0.35%
Performance of Synaptics Inc. Deutsche Bank 01-Oct-18 6,384
USD 125,261 US Overnight Bank FundingRate -0.35%
Performance of Twilio Inc., A Deutsche Bank 01-Oct-18 2,098
USD 395,214 US Overnight Bank FundingRate -0.35%
Performance of Twitter Inc. Deutsche Bank 01-Oct-18 22,409
USD 3,518,525 US Overnight Bank FundingRate -0.35%
Performance of U.S. TreasuryNote, 2.875%, 05/15/28
Deutsche Bank 01-Oct-18 (33,408)
USD 84,374 US Overnight Bank FundingRate -0.35%
Performance of VeecoInstruments Inc.
Deutsche Bank 01-Oct-18 7,417
USD 1,242,569 US Overnight Bank FundingRate -0.35%
Performance of VishayIntertechnology Inc.
Deutsche Bank 01-Oct-18 40,059
USD 276,931 US Overnight Bank FundingRate -0.35%
Performance of Weibo Corp.,ADR
Deutsche Bank 01-Oct-18 40,477
USD 72,765 US Overnight Bank FundingRate -0.35%
Performance of Western DigitalCorp.
Deutsche Bank 01-Oct-18 2,593
USD 205,715 US Overnight Bank FundingRate -0.35%
Performance of Wix.com Ltd. Deutsche Bank 01-Oct-18 (3,693)
USD 677 US Overnight Bank FundingRate -0.35%
Performance of Workday Inc., A Deutsche Bank 01-Oct-18 3,331
USD 260,638 US Overnight Bank FundingRate -0.35%
Performance of Wright MedicalGroup NV
Deutsche Bank 01-Oct-18 8,517
FRANKLIN TEMPLETON INVESTMENT FUNDS
Notes to the Financial StatementsAt June 30, 2018 (continued)
Note 10 — Open positions on total return swap contracts (continued)
144 Audited Annual Report www.franklintempleton.lu

As at June 30, 2018, the Company had entered into the following outstanding contracts:
Franklin K2 Alternative Strategies Fund (continued)Tradingcurrency
Notionalamount
Fund receives Fund pays Counterparty Maturitydate
Unrealisedprofit/(loss)
USD
USD 320,074 US Overnight Bank FundingRate -0.35%
Performance of Zendesk Inc. Deutsche Bank 01-Oct-18 21,223
USD 124,026 US Overnight Bank FundingRate -0.35%
Performance of ZillowGroup Inc., C
Deutsche Bank 01-Oct-18 (1,000)
USD 223,831 US Overnight Bank FundingRate -1.00%
Performance of CoriumInternational Inc.
Deutsche Bank 01-Oct-18 83,880
USD 614,580 US Overnight Bank FundingRate -1.00%
Performance of Cowen Inc. Deutsche Bank 01-Oct-18 7,631
USD 336,192 US Overnight Bank FundingRate -1.00%
Performance of PDLBioPharma Inc.
Deutsche Bank 01-Oct-18 42,130
USD 850,523 US Overnight Bank FundingRate -1.00%
Performance of The MedicinesCo.
Deutsche Bank 01-Oct-18 (93,765)
USD 279,991 US Overnight Bank FundingRate -1.13%
Performance of LGI Homes Inc. Deutsche Bank 01-Oct-18 8,916
USD 352,369 US Overnight Bank FundingRate -1.50%
Performance of AK SteelHolding Corp.
Deutsche Bank 01-Oct-18 19,866
USD 533,945 US Overnight Bank FundingRate -1.50%
Performance of Huazhu GroupLtd., ADR
Deutsche Bank 01-Oct-18 59,720
USD 565,087 US Overnight Bank FundingRate -1.50%
Performance of RH Deutsche Bank 01-Oct-18 10,672
USD 539,362 US Overnight Bank FundingRate -2.00%
Performance of Team Inc. Deutsche Bank 01-Oct-18 (107,339)
USD 1,007,806 US Overnight Bank FundingRate -2.75%
Performance of Teladoc Inc. Deutsche Bank 01-Oct-18 (163,161)
USD 276,401 US Overnight Bank FundingRate -2.75%
Performance of TheravanceBiopharma Inc.
Deutsche Bank 01-Oct-18 (6,100)
USD 481,476 US Overnight Bank FundingRate -3.50%
Performance of First MajesticSilver Corp.
Deutsche Bank 01-Oct-18 (42,441)
USD 569,950 US Overnight Bank FundingRate -3.50%
Performance of RadiusHealth Inc.
Deutsche Bank 01-Oct-18 148,138
USD 366,486 US Overnight Bank FundingRate -5.00%
Performance of ChesapeakeEnergy Corp.
Deutsche Bank 01-Oct-18 (9,793)
USD 256,494 US Overnight Bank FundingRate -5.50%
Performance of Teekay Corp. Deutsche Bank 01-Oct-18 16,218
GBP 99,616 1-month GBP LIBOR -6.50% Performance of Premier OilPLC
Deutsche Bank 12-Oct-18 (17,775)
GBP 171,785 Performance of Premier OilPLC, wts., 05/31/22
1-month GBP LIBOR +0.40% Deutsche Bank 12-Oct-18 17,079
GBP 7,071,818 Performance of NEX Group PLC 1-month GBP LIBOR +0.45% Deutsche Bank 16-Oct-18 (45,395)GBP 6,205,807 Performance of Sky PLC 1-month GBP LIBOR +0.45% Deutsche Bank 16-Oct-18 697,687JPY 30,072,000 1-month JPY LIBOR -0.40% Performance of Chugoku
Electric Power Co. Inc.Deutsche Bank 06-Nov-18 (19,337)
JPY 46,102,800 1-month JPY LIBOR -0.40% Performance of Kyushu ElectricPower Co. Inc.
Deutsche Bank 06-Nov-18 10,184
JPY 31,192,000 1-month JPY LIBOR -0.40% Performance of MedipalHoldings Corp.
Deutsche Bank 06-Nov-18 (4,022)
JPY 24,112,400 1-month JPY LIBOR -0.40% Performance of MitsubishiChemical Holdings Corp.
Deutsche Bank 06-Nov-18 49,476
JPY 15,744,000 1-month JPY LIBOR -0.40% Performance of Nipro Corp. Deutsche Bank 06-Nov-18 36,343JPY 18,380,400 1-month JPY LIBOR -0.40% Performance of Toho Holdings
Co. Ltd.Deutsche Bank 06-Nov-18 1,000
JPY 14,241,500 1-month JPY LIBOR -1.00% Performance of ANAHoldings Inc.
Deutsche Bank 06-Nov-18 6,530
JPY 30,373,200 1-month JPY LIBOR -1.75% Performance of MIRAITHoldings Corp.
Deutsche Bank 06-Nov-18 (16,717)
HKD 264,225 1-month HKD LIBOR -0.40% Performance of HaitianInternational Holdings Ltd.
Deutsche Bank 16-Nov-18 3,419
HKD 3,700,160 1-month HKD LIBOR -1.00% Performance of ASM PacificTechnology Ltd.
Deutsche Bank 16-Nov-18 27,575
HKD 809,045 1-month HKD LIBOR -1.26% Performance of Pacific BasinShipping Ltd.
Deutsche Bank 16-Nov-18 6,715
HKD 3,523,520 1-month HKD LIBOR -1.50% Performance of YuexiuTransport Infrastructure Ltd.
Deutsche Bank 16-Nov-18 21,984
JPY 90,083 1-month USD LIBOR -0.35% Performance of The Oita BankLtd.
Deutsche Bank 16-Nov-18 3,597
JPY 3,627,671 1-month USD LIBOR -0.35% Performance of YamaguchiFinancial Group Inc.
Deutsche Bank 16-Nov-18 247,427
JPY 272,853 1-month USD LIBOR -1.50% Performance of The YamagataBank Ltd.
Deutsche Bank 16-Nov-18 13,819
EUR 567,596 1-month EURIBOR -0.50% Performance of Fugro NV, IDR Deutsche Bank 04-Dec-18 8,656
FRANKLIN TEMPLETON INVESTMENT FUNDS
Notes to the Financial StatementsAt June 30, 2018 (continued)
Note 10 — Open positions on total return swap contracts (continued)
www.franklintempleton.lu Audited Annual Report 145

As at June 30, 2018, the Company had entered into the following outstanding contracts:
Franklin K2 Alternative Strategies Fund (continued)Tradingcurrency
Notionalamount
Fund receives Fund pays Counterparty Maturitydate
Unrealisedprofit/(loss)
USD
EUR 631,550 Performance of Airbus SE, cvt.,senior note, Reg S, zero cpn.,06/14/21
1-month EURIBOR +1.00% Deutsche Bank 04-Dec-18 (20,320)
USD 496,875 Performance of Yamagata BankLtd., cvt., senior note, zerocpn., 04/22/19
1-month USD LIBOR +0.90% Deutsche Bank 19-Dec-18 (9,375)
EUR 170,981 1-month EURIBOR -3.50% Performance of Nyrstar NV Deutsche Bank 17-Jan-19 (3,647)EUR 603,288 Performance of Nyrstar NV,
cvt., senior note, Reg S,5.00%, 07/11/22
1-month EURIBOR +0.90% Deutsche Bank 17-Jan-19 11,224
CAD 226,291 US Overnight Bank FundingRate -0.25%
Performance of EndeavourMining Corp.
Deutsche Bank 01-Feb-19 2,211
THB 263,507 1-month USD LIBOR -1.00% Performance of CP ALL PCL,fgn.
Deutsche Bank 06-Feb-19 29,921
EUR 592,416 1-month EURIBOR -0.50% Performance of DassaultAviation SA
Deutsche Bank 13-Feb-19 20,029
GBP 38,000 Performance of CarillionFinance Jersey Ltd., cvt., seniornote, Reg S, 2.50%, 12/19/19
1-month GBP LIBOR +0.90% Deutsche Bank 19-Feb-19 37,613
USD 629,417 Performance of Larsen &Toubro Ltd., cvt., senior note,Reg S, 0.675%, 10/22/19
1-month USD LIBOR +1.50% Deutsche Bank 20-Feb-19 (5,660)
USD 121,136 1-month USD LIBOR -2.50% Performance of Larsen &Toubro Ltd., GDR, Reg S
Deutsche Bank 19-Mar-19 7,662
HKD 11,263,611 Performance of ASM PacificTechnology Ltd., cvt., seniornote, Reg S, 2.00%, 03/28/19
1-month HKD LIBOR +0.90% Deutsche Bank 20-May-19 (55,694)
USD 1,265,651 Performance of HaitianInternational Holdings Ltd.,cvt., senior note, 2.00%,02/13/19
1-month USD LIBOR +0.90% Deutsche Bank 20-May-19 (65,286)
USD 230,367 1-month USD LIBOR -4.75% Performance of The PricelineGroup Inc., cvt., senior note,0.90%, 09/15/21
Deutsche Bank 15-Jun-19 7,420
USD 1,272,175 Performance of Altaba Inc.,cvt., zero cpn., 12/01/18
1-month USD LIBOR +0.90% Deutsche Bank 15-Jun-19 (147,240)
USD 2,574,021 Performance of ApolloCommercial Real EstateFinance Inc., cvt., senior note,4.75%, 08/23/22
1-month USD LIBOR +0.90% Deutsche Bank 15-Jun-19 (18,207)
USD 1,506,905 Performance of ApolloCommercial Real EstateFinance Inc., cvt., senior note,5.50%, 03/15/19
1-month USD LIBOR +0.90% Deutsche Bank 15-Jun-19 (11,565)
USD 345,517 Performance of Arbor RealtyTrust Inc., cvt., senior note,5.375%, 11/15/20
1-month USD LIBOR +0.90% Deutsche Bank 15-Jun-19 (2,551)
USD 1,263,318 Performance of AXA SA, cvt.,senior note, 144A, 7.25%,05/15/21
1-month USD LIBOR +0.90% Deutsche Bank 15-Jun-19 (12,992)
USD 1,701,623 Performance of BlackstoneMortgage Trust Inc., cvt., seniornote, 4.75%, 03/15/23
1-month USD LIBOR +0.90% Deutsche Bank 15-Jun-19 (4,651)
USD 95,273 Performance of BookingHoldings Inc.
US Overnight Bank FundingRate +0.90%
Deutsche Bank 15-Jun-19 (5,375)
USD 1,222,651 Performance of CitrixSystems Inc., cvt., senior note,0.50%, 04/15/19
1-month USD LIBOR +0.90% Deutsche Bank 15-Jun-19 (27,275)
USD 408,918 Performance of Ctrip.comInternational Ltd., cvt., seniornote, 1.00%, 07/01/20
1-month USD LIBOR +0.90% Deutsche Bank 15-Jun-19 (16,914)
USD 1,104,645 Performance of Dermira Inc.,cvt., senior note, 3.00%,05/15/22
1-month USD LIBOR +0.90% Deutsche Bank 15-Jun-19 37,320
USD 2,595,422 Performance of DISH NetworkCorp., cvt., senior note,2.375%, 03/15/24
1-month USD LIBOR +0.90% Deutsche Bank 15-Jun-19 25,000
USD 1,035,121 Performance of Envestnet Inc.,cvt., senior note, 1.75%,12/15/19
1-month USD LIBOR +0.90% Deutsche Bank 15-Jun-19 (31,800)
FRANKLIN TEMPLETON INVESTMENT FUNDS
Notes to the Financial StatementsAt June 30, 2018 (continued)
Note 10 — Open positions on total return swap contracts (continued)
146 Audited Annual Report www.franklintempleton.lu

As at June 30, 2018, the Company had entered into the following outstanding contracts:
Franklin K2 Alternative Strategies Fund (continued)Tradingcurrency
Notionalamount
Fund receives Fund pays Counterparty Maturitydate
Unrealisedprofit/(loss)
USD
USD 864,840 Performance of Finisar Corp.,cvt., senior bond, 0.50%,12/15/36
1-month USD LIBOR +0.90% Deutsche Bank 15-Jun-19 5,679
USD 494,409 Performance of Gannett Co.Inc., cvt., senior bond, 144A,4.75%, 04/15/24
1-month USD LIBOR +0.90% Deutsche Bank 15-Jun-19 11,543
USD 2,925,478 Performance of HannonArmstrong SustainableInfrastructure Capital Inc., cvt.,senior note, 4.125%, 09/01/22
1-month USD LIBOR +0.90% Deutsche Bank 15-Jun-19 55,683
USD 1,357,798 Performance of HerbalifeNutrition Ltd., cvt., senior note,144A, 2.625%, 03/15/24
1-month USD LIBOR +0.90% Deutsche Bank 15-Jun-19 (1,224)
USD 1,452,859 Performance of Innoviva Inc.,cvt., sub. note, 2.125%,01/15/23
1-month USD LIBOR +0.90% Deutsche Bank 15-Jun-19 (25,631)
USD 1,747,933 Performance of IntegratedDevice Technology Inc., cvt.,senior note, 0.875%, 11/15/22
1-month USD LIBOR +0.90% Deutsche Bank 15-Jun-19 (81,057)
USD 1,721,027 Performance ofInterDigital Inc., cvt., seniornote, 1.50%, 03/01/20
1-month USD LIBOR +0.90% Deutsche Bank 15-Jun-19 (39,479)
USD 3,212,078 Performance of Invacare Corp.,cvt., senior note, 5.00%,02/15/21
1-month USD LIBOR +0.90% Deutsche Bank 15-Jun-19 (83,002)
USD 1,094,935 Performance of InvitationHomes Inc., cvt., senior note,3.50%, 01/15/22
1-month USD LIBOR +0.90% Deutsche Bank 15-Jun-19 16,518
USD 3,031,731 Performance of j2 Global Inc.,cvt., senior bond, 3.25%,06/15/29
1-month USD LIBOR +0.90% Deutsche Bank 15-Jun-19 (56,561)
USD 602,219 Performance of Liberty MediaGroup, cvt., senior note,1.00%, 01/30/23
1-month USD LIBOR +0.90% Deutsche Bank 15-Jun-19 28,284
USD 731,523 Performance of National HealthInvestors Inc., cvt., senior note,3.25%, 04/01/21
1-month USD LIBOR +0.90% Deutsche Bank 15-Jun-19 2,410
USD 2,882,557 Performance of NiceSystems Inc., cvt., senior note,1.25%, 01/15/24
1-month USD LIBOR +0.90% Deutsche Bank 15-Jun-19 (112,507)
USD 1,368,627 Performance of NuanceCommunications Inc., cvt.,senior bond, 1.00%, 12/15/35
1-month USD LIBOR +0.90% Deutsche Bank 15-Jun-19 (3,180)
USD 2,018,654 Performance of Nutanix Inc.,cvt., senior note, 144A, zerocpn., 01/15/23
1-month USD LIBOR +0.90% Deutsche Bank 15-Jun-19 (268,226)
USD 4,325,948 Performance of ONSemiconductor Corp., cvt.,senior note, 1.00%, 12/01/20
1-month USD LIBOR +0.90% Deutsche Bank 15-Jun-19 (430,052)
USD 1,978,835 Performance of RedwoodTrust Inc., cvt., senior note,4.75%, 08/15/23
1-month USD LIBOR +0.90% Deutsche Bank 15-Jun-19 (17,662)
USD 1,141,351 Performance ofServiceNow Inc., cvt., seniorbond, zero cpn., 06/01/22
1-month USD LIBOR +0.90% Deutsche Bank 15-Jun-19 (67,103)
USD 3,020,940 Performance of Ship FinanceInternational Ltd., cvt., seniornote, 4.875%, 05/01/23
1-month USD LIBOR +0.90% Deutsche Bank 15-Jun-19 44,343
USD 1,205,523 Performance of SiliconLaboratories Inc., cvt., seniornote, 1.375%, 03/01/22
1-month USD LIBOR +0.90% Deutsche Bank 15-Jun-19 (63,090)
USD 294,337 Performance of Teladoc Inc.,cvt., senior note, 144A,1.375%, 05/15/25
1-month USD LIBOR +0.90% Deutsche Bank 15-Jun-19 (5,330)
USD 3,149,710 Performance of Teradyne Inc.,cvt., senior note, 1.25%,12/15/23
1-month USD LIBOR +0.90% Deutsche Bank 15-Jun-19 (44,026)
FRANKLIN TEMPLETON INVESTMENT FUNDS
Notes to the Financial StatementsAt June 30, 2018 (continued)
Note 10 — Open positions on total return swap contracts (continued)
www.franklintempleton.lu Audited Annual Report 147

As at June 30, 2018, the Company had entered into the following outstanding contracts:
Franklin K2 Alternative Strategies Fund (continued)Tradingcurrency
Notionalamount
Fund receives Fund pays Counterparty Maturitydate
Unrealisedprofit/(loss)
USD
USD 2,565,119 Performance of The MedicinesCo., cvt., senior note, 2.50%,01/15/22
1-month USD LIBOR +0.90% Deutsche Bank 15-Jun-19 3,027
USD 2,604,930 Performance of Two HarborsInvestment Corp., cvt., seniornote, 6.25%, 01/15/22
1-month USD LIBOR +0.90% Deutsche Bank 15-Jun-19 33,742
USD 571,442 Performance of VeecoInstruments Inc., cvt., seniornote, 2.70%, 01/15/23
1-month USD LIBOR +0.90% Deutsche Bank 15-Jun-19 (6,926)
USD 4,234,866 Performance of VishayIntertechnology Inc., cvt.,senior bond, 2.25%, 05/15/41
1-month USD LIBOR +0.90% Deutsche Bank 15-Jun-19 (154,211)
USD 361,930 Performance of VoceraCommunications Inc., cvt.,senior note, 144A, 1.50%,05/15/23
1-month USD LIBOR +0.90% Deutsche Bank 15-Jun-19 7,582
USD 619,998 Performance of Workday Inc.,cvt., senior note, 1.50%,07/15/20
1-month USD LIBOR +0.90% Deutsche Bank 15-Jun-19 (27,940)
USD 1,528,364 Performance of Wright MedicalGroup NV, cvt., senior note,2.25%, 11/15/21
1-month USD LIBOR +0.90% Deutsche Bank 15-Jun-19 (1,105)
USD 689,529 Performance of Zendesk Inc.,cvt., senior note, 144A,0.25%, 03/15/23
1-month USD LIBOR +0.90% Deutsche Bank 15-Jun-19 (20,666)
USD 1,276,709 US Overnight Bank FundingRate -0.35%
Performance of Altaba Inc. Deutsche Bank 15-Jun-19 143,872
USD 2,157,241 US Overnight Bank FundingRate -0.35%
Performance of ApolloCommercial Finance Inc.
Deutsche Bank 15-Jun-19 4,175
USD 263,973 US Overnight Bank FundingRate -0.35%
Performance of Arbor RealtyTrust Inc.
Deutsche Bank 15-Jun-19 506
USD 905,603 US Overnight Bank FundingRate -0.35%
Performance of AXA EquitableHoldings Inc.
Deutsche Bank 15-Jun-19 22,409
USD 713,461 US Overnight Bank FundingRate -0.35%
Performance of BlackstoneMortgage Trust Inc., Class A
Deutsche Bank 15-Jun-19 6,583
USD 1,167,603 US Overnight Bank FundingRate -0.35%
Performance of CitrixSystems Inc.
Deutsche Bank 15-Jun-19 23,388
USD 156,322 US Overnight Bank FundingRate -0.35%
Performance of Ctrip.comInternational Ltd., ADR
Deutsche Bank 15-Jun-19 12,676
USD 138,000 US Overnight Bank FundingRate -0.35%
Performance of Dermira Inc. Deutsche Bank 15-Jun-19 12,300
USD 474,741 US Overnight Bank FundingRate -0.35%
Performance of DISH NetworkCorp., A
Deutsche Bank 15-Jun-19 14,125
USD 423,060 US Overnight Bank FundingRate -0.35%
Performance of Envestnet Inc. Deutsche Bank 15-Jun-19 24,252
USD 84,600 US Overnight Bank FundingRate -0.35%
Performance of Finisar Corp. Deutsche Bank 15-Jun-19 -
USD 212,644 US Overnight Bank FundingRate -0.35%
Performance of FireEye Inc. Deutsche Bank 15-Jun-19 22,660
USD 893,705 US Overnight Bank FundingRate -0.35%
Performance of Fortive Corp. Deutsche Bank 15-Jun-19 (17,630)
USD 238,610 US Overnight Bank FundingRate -0.35%
Performance of Gannett Co.Inc.
Deutsche Bank 15-Jun-19 (8,920)
USD 26,634 US Overnight Bank FundingRate -0.35%
Performance of GuidewireSoftware Inc.
Deutsche Bank 15-Jun-19 1,269
USD 654,239 US Overnight Bank FundingRate -0.35%
Performance of HannonArmstrong SustainableInfrastructure Capital Inc.
Deutsche Bank 15-Jun-19 (40,729)
USD 709,104 US Overnight Bank FundingRate -0.35%
Performance of HerbalifeNutrition Ltd.
Deutsche Bank 15-Jun-19 4,488
USD 624,008 US Overnight Bank FundingRate -0.35%
Performance of Innoviva Inc. Deutsche Bank 15-Jun-19 31,200
USD 1,017,960 US Overnight Bank FundingRate -0.35%
Performance of IntegratedDevice Technology Inc.
Deutsche Bank 15-Jun-19 92,919
USD 996,769 US Overnight Bank FundingRate -0.35%
Performance of InterDigital Inc. Deutsche Bank 15-Jun-19 55,444
USD 2,049,218 US Overnight Bank FundingRate -0.35%
Performance of Invacare Corp. Deutsche Bank 15-Jun-19 88,138
USD 571,888 US Overnight Bank FundingRate -0.35%
Performance of InvitationHomes Inc.
Deutsche Bank 15-Jun-19 (16,120)
FRANKLIN TEMPLETON INVESTMENT FUNDS
Notes to the Financial StatementsAt June 30, 2018 (continued)
Note 10 — Open positions on total return swap contracts (continued)
148 Audited Annual Report www.franklintempleton.lu

As at June 30, 2018, the Company had entered into the following outstanding contracts:
Franklin K2 Alternative Strategies Fund (continued)Tradingcurrency
Notionalamount
Fund receives Fund pays Counterparty Maturitydate
Unrealisedprofit/(loss)
USD
USD 2,376,059 US Overnight Bank FundingRate -0.35%
Performance of J2 Global Inc. Deutsche Bank 15-Jun-19 69,384
USD 227,727 US Overnight Bank FundingRate -0.35%
Performance of KKR RealEstate Finance Trust Inc.
Deutsche Bank 15-Jun-19 (1,152)
USD 326,410 US Overnight Bank FundingRate -0.35%
Performance of Liberty MediaGroup
Deutsche Bank 15-Jun-19 (21,063)
USD 355,727 US Overnight Bank FundingRate -0.35%
Performance of National HealthInvestors Inc.
Deutsche Bank 15-Jun-19 (1,255)
USD 2,179,378 US Overnight Bank FundingRate -0.35%
Performance of Nice Ltd., ADR Deutsche Bank 15-Jun-19 116,561
USD 237,919 US Overnight Bank FundingRate -0.35%
Performance of NuanceCommunications Inc.
Deutsche Bank 15-Jun-19 8,140
USD 1,397,547 US Overnight Bank FundingRate -0.35%
Performance of Nutanix Inc., A Deutsche Bank 15-Jun-19 279,672
USD 3,091,310 US Overnight Bank FundingRate -0.35%
Performance of ONSemiconductor Corp.
Deutsche Bank 15-Jun-19 469,223
USD 1,057,852 US Overnight Bank FundingRate -0.35%
Performance of RedwoodTrust Inc.
Deutsche Bank 15-Jun-19 2,730
USD 876,493 US Overnight Bank FundingRate -0.35%
Performance ofServiceNow Inc.
Deutsche Bank 15-Jun-19 70,538
USD 817,118 US Overnight Bank FundingRate -0.35%
Performance of SiliconLaboratories Inc.
Deutsche Bank 15-Jun-19 75,477
USD 190,346 US Overnight Bank FundingRate -0.35%
Performance of Teladoc Inc. Deutsche Bank 15-Jun-19 6,904
USD 2,206,804 US Overnight Bank FundingRate -0.35%
Performance of Teradyne Inc. Deutsche Bank 15-Jun-19 58,671
USD 1,571,090 US Overnight Bank FundingRate -0.35%
Performance of The MedicinesCo.
Deutsche Bank 15-Jun-19 4,358
USD 1,022,055 US Overnight Bank FundingRate -0.35%
Performance of Two HarborsInvestment Corp.
Deutsche Bank 15-Jun-19 (26,521)
USD 79,558 US Overnight Bank FundingRate -0.35%
Performance of VeecoInstruments Inc.
Deutsche Bank 15-Jun-19 14,516
USD 3,718,960 US Overnight Bank FundingRate -0.35%
Performance of VishayIntertechnology Inc.
Deutsche Bank 15-Jun-19 200,375
USD 276,841 US Overnight Bank FundingRate -0.35%
Performance of VoceraCommunications Inc.
Deutsche Bank 15-Jun-19 (1,503)
USD 5,248 US Overnight Bank FundingRate -0.35%
Performance of Workday Inc., A Deutsche Bank 15-Jun-19 30,201
USD 1,065,398 US Overnight Bank FundingRate -0.35%
Performance of Wright MedicalGroup NV
Deutsche Bank 15-Jun-19 (6,090)
USD 382,792 US Overnight Bank FundingRate -0.35%
Performance of Zendesk Inc. Deutsche Bank 15-Jun-19 31,051
USD 3,310,020 US Overnight Bank FundingRate -0.57%
Performance of Ship FinanceInternational Ltd.
Deutsche Bank 15-Jun-19 (33,211)
JPY 263,754,996 1-month JPY LIBOR -0.50% Performance of TakedaPharmaceutical Co. Ltd.
Deutsche Bank 17-Jun-19 (144,235)
PHP 112,988 1-month USD LIBOR -2.63% Performance of Ayala Land Inc. Deutsche Bank 19-Jul-19 3,937USD 624,147 Performance of Accenture PLC,
A1-month USD LIBOR +0.30% Deutsche Bank 10-May-20 2,597
USD 385,034 Performance of AdobeSystems Inc.
1-month USD LIBOR +0.30% Deutsche Bank 10-May-20 (11,454)
USD 99,005 Performance of Advanced MicroDevices Inc.
1-month USD LIBOR +0.30% Deutsche Bank 10-May-20 (4,768)
USD 282,720 Performance of AkamaiTechnologies Inc.
1-month USD LIBOR +0.30% Deutsche Bank 10-May-20 (21,810)
USD 514,456 Performance of Alibaba GroupHolding Ltd., ADR
1-month USD LIBOR +0.30% Deutsche Bank 10-May-20 (51,025)
USD 1,299,589 Performance of Alliance DataSystems Corp.
1-month USD LIBOR +0.30% Deutsche Bank 10-May-20 62,943
USD 567,028 Performance of Alphabet Inc.,A
1-month USD LIBOR +0.30% Deutsche Bank 10-May-20 (6,460)
USD 684,774 Performance of Alphabet Inc.,C
1-month USD LIBOR +0.30% Deutsche Bank 10-May-20 (9,431)
USD 1,697,566 Performance of Amazon.comInc.
1-month USD LIBOR +0.30% Deutsche Bank 10-May-20 8,935
USD 310,749 Performance of Apple Inc. 1-month USD LIBOR +0.30% Deutsche Bank 10-May-20 (10,291)USD 20,742 Performance of Atento SA 1-month USD LIBOR +0.40% Deutsche Bank 10-May-20 (3,334)USD 500,063 Performance of Atlassian Corp.
PLC1-month USD LIBOR +0.30% Deutsche Bank 10-May-20 (14,798)
USD 655,384 Performance of Automatic DataProcessing Inc.
1-month USD LIBOR +0.30% Deutsche Bank 10-May-20 (426)
FRANKLIN TEMPLETON INVESTMENT FUNDS
Notes to the Financial StatementsAt June 30, 2018 (continued)
Note 10 — Open positions on total return swap contracts (continued)
www.franklintempleton.lu Audited Annual Report 149

As at June 30, 2018, the Company had entered into the following outstanding contracts:
Franklin K2 Alternative Strategies Fund (continued)Tradingcurrency
Notionalamount
Fund receives Fund pays Counterparty Maturitydate
Unrealisedprofit/(loss)
USD
USD 1,660,443 Performance of AvagoTechnologies Ltd.
1-month USD LIBOR +0.30% Deutsche Bank 10-May-20 (106,513)
USD 351,293 Performance of Blackbaud Inc. 1-month USD LIBOR +0.30% Deutsche Bank 10-May-20 (4,979)USD 369,627 Performance of Booking
Holdings Inc.1-month USD LIBOR +0.30% Deutsche Bank 10-May-20 (17,323)
USD 514,230 Performance of Cafe24 Corp 1-month USD LIBOR +0.55% Deutsche Bank 10-May-20 15,308USD 69,351 Performance of China Unicom
(Hong Kong) Ltd., ADR1-month USD LIBOR +0.30% Deutsche Bank 10-May-20 (3,154)
USD 1,282,847 Performance of ChromaAte Inc.
1-month USD LIBOR +0.65% Deutsche Bank 10-May-20 (40,783)
USD 212,591 Performance of CognizantTechnology Solutions Corp., A
1-month USD LIBOR +0.30% Deutsche Bank 10-May-20 5,355
USD 1,100,770 Performance of CommScopeHolding Co. Inc.
1-month USD LIBOR +0.30% Deutsche Bank 10-May-20 (22,908)
USD 783,349 Performance of CoStarGroup Inc.
1-month USD LIBOR +0.30% Deutsche Bank 10-May-20 13,414
USD 334,204 Performance of eBay Inc. 1-month USD LIBOR +0.30% Deutsche Bank 10-May-20 (35,287)USD 432,604 Performance of EPAM
Systems Inc.1-month USD LIBOR +0.30% Deutsche Bank 10-May-20 (6,016)
USD 1,518,917 Performance of Equifax Inc. 1-month USD LIBOR +0.30% Deutsche Bank 10-May-20 6,513USD 1,995,413 Performance of ExlService
Holdings Inc.1-month USD LIBOR +0.30% Deutsche Bank 10-May-20 (82,286)
USD 528,599 Performance of ExpediaGroup Inc.
1-month USD LIBOR +0.30% Deutsche Bank 10-May-20 (15,262)
USD 355,489 Performance of Fabrinet 1-month USD LIBOR +0.30% Deutsche Bank 10-May-20 (7,037)USD 890,661 Performance of Facebook Inc.,
A1-month USD LIBOR +0.30% Deutsche Bank 10-May-20 11,936
USD 1,636,879 Performance of FleetCorTechnologies Inc.
1-month USD LIBOR +0.30% Deutsche Bank 10-May-20 61,456
USD 741,317 Performance of Flex Ltd. 1-month USD LIBOR +0.30% Deutsche Bank 10-May-20 (4,000)USD 587,233 Performance of FormFactor Inc. 1-month USD LIBOR +0.30% Deutsche Bank 10-May-20 (32,020)USD 2,492,490 Performance of Genpact Ltd. 1-month USD LIBOR +0.30% Deutsche Bank 10-May-20 (134,067)USD 1,973,960 Performance of Global
Payments Inc.1-month USD LIBOR +0.30% Deutsche Bank 10-May-20 (92,350)
USD 1,052,955 Performance of GoDaddy Inc.,A
1-month USD LIBOR +0.30% Deutsche Bank 10-May-20 (23,649)
USD 978,871 Performance of GuidewireSoftware Inc.
1-month USD LIBOR +0.30% Deutsche Bank 10-May-20 (9,495)
USD 951,113 Performance of Hubspot Inc. 1-month USD LIBOR +0.30% Deutsche Bank 10-May-20 (32,215)USD 519,263 Performance of Huron
Consulting Group Inc.1-month USD LIBOR +0.30% Deutsche Bank 10-May-20 770
USD 204,268 Performance of IntegratedDevice Technology Inc.
1-month USD LIBOR +0.30% Deutsche Bank 10-May-20 (13,701)
USD 532,409 Performance of Intuit Inc. 1-month USD LIBOR +0.30% Deutsche Bank 10-May-20 (5,842)EUR 39,243 Performance of Irish
Continental Group PLC1-month EURIBOR +0.50% Deutsche Bank 10-May-20 (4,797)
USD 555,000 Performance of Itron Inc. 1-month USD LIBOR +0.30% Deutsche Bank 10-May-20 13,129USD 987,711 Performance of KLA-Tencor
Corp.1-month USD LIBOR +0.30% Deutsche Bank 10-May-20 (88,400)
USD 1,190,224 Performance of MarvellTechnology Group Ltd.
1-month USD LIBOR +0.30% Deutsche Bank 10-May-20 2,503
USD 935,881 Performance ofMastercard Inc., A
1-month USD LIBOR +0.30% Deutsche Bank 10-May-20 (10,346)
USD 2,718,925 Performance of MicrochipTechnology Inc.
1-month USD LIBOR +0.30% Deutsche Bank 10-May-20 (307,175)
USD 458,969 Performance of Microsoft Corp. 1-month USD LIBOR +0.30% Deutsche Bank 10-May-20 (11,535)USD 102,424 Performance of NVIDIA Corp. 1-month USD LIBOR +0.30% Deutsche Bank 10-May-20 (9,439)USD 1,138,723 Performance of PayPal
Holdings Inc.1-month USD LIBOR +0.30% Deutsche Bank 10-May-20 (9,719)
USD 63,672 Performance of QuantennaCommunications Inc.
1-month USD LIBOR +0.30% Deutsche Bank 10-May-20 (4,848)
USD 615,059 Performance of Roku Inc. 1-month USD LIBOR +0.30% Deutsche Bank 10-May-20 16,487USD 499,745 Performance of Salesforce.com
Inc.1-month USD LIBOR +0.30% Deutsche Bank 10-May-20 8,457
USD 965,096 Performance of SamsungElectronics Co. Ltd.
1-month USD LIBOR +0.55% Deutsche Bank 10-May-20 (87,538)
USD 886,894 Performance ofServiceNow Inc.
1-month USD LIBOR +0.30% Deutsche Bank 10-May-20 (38,427)
USD 76,713 Performance of Teradyne Inc. 1-month USD LIBOR +0.30% Deutsche Bank 10-May-20 (1,958)USD 340,735 Performance of Tesla Inc. 1-month USD LIBOR +0.30% Deutsche Bank 10-May-20 10,742USD 849,182 Performance of Total System
Services Inc.1-month USD LIBOR +0.30% Deutsche Bank 10-May-20 (19,228)
FRANKLIN TEMPLETON INVESTMENT FUNDS
Notes to the Financial StatementsAt June 30, 2018 (continued)
Note 10 — Open positions on total return swap contracts (continued)
150 Audited Annual Report www.franklintempleton.lu

As at June 30, 2018, the Company had entered into the following outstanding contracts:
Franklin K2 Alternative Strategies Fund (continued)Tradingcurrency
Notionalamount
Fund receives Fund pays Counterparty Maturitydate
Unrealisedprofit/(loss)
USD
USD 1,101,628 Performance of TransUnion 1-month USD LIBOR +0.30% Deutsche Bank 10-May-20 9,668USD 2,145,644 Performance of TriNet
Group Inc.1-month USD LIBOR +0.30% Deutsche Bank 10-May-20 39,084
USD 709,002 Performance of Trupanion Inc. 1-month USD LIBOR +0.30% Deutsche Bank 10-May-20 64,835USD 1,269,507 Performance of VeriSign Inc. 1-month USD LIBOR +0.30% Deutsche Bank 10-May-20 (5,787)USD 2,147,381 Performance of Visa Inc., A 1-month USD LIBOR +0.30% Deutsche Bank 10-May-20 (25,655)USD 1,369,637 Performance of WEX Inc. 1-month USD LIBOR +0.30% Deutsche Bank 10-May-20 22,738USD 381,426 Performance of Yandex NV, A 1-month USD LIBOR +0.30% Deutsche Bank 10-May-20 9,480USD 275,642 Performance of Zebra
Technologies Corp., A1-month USD LIBOR +0.30% Deutsche Bank 10-May-20 (27,279)
USD 734,929 1-month USD LIBOR +0.10% Performance of DB HybridBasket 01 Index
Deutsche Bank 12-May-20 43,562
USD 572,103 1-month USD LIBOR +0.10% Performance of S&P SmallCap600 Total Return Index
Deutsche Bank 12-May-20 13,031
USD 1,544,765 1-month USD LIBOR +0.15% Performance of NASDAQ 100Total Return Index
Deutsche Bank 12-May-20 28,769
USD 260,955 1-month USD LIBOR -0.10% Performance of Dow JonesTransportation Average TotalReturn Index
Deutsche Bank 12-May-20 16,912
USD 6,016,101 1-month USD LIBOR -0.10% Performance of Dow Jones USTechnology Total Return Index
Deutsche Bank 12-May-20 207,191
USD 123,271 1-month USD LIBOR -0.25% Performance of Russell MidcapGrowth Index Total ReturnIndex
Deutsche Bank 12-May-20 3,926
USD 1,175,747 1-month USD LIBOR -0.30% Performance of S&P SmallCap600 Growth Index
Deutsche Bank 12-May-20 24,142
USD 305,092 1-month USD LIBOR -0.35% Performance of ConsumerDiscretionary Select SectorTotal Return Index
Deutsche Bank 12-May-20 2,349
USD 262,278 1-month USD LIBOR -0.35% Performance of S&P MidCap400 Total Return Index
Deutsche Bank 12-May-20 6,402
USD 324,556 1-month USD LIBOR -0.35% Performance of S&P NorthAmerican Technology SoftwareIndex
Deutsche Bank 12-May-20 10,475
USD 211,664 1-month USD LIBOR -0.35% Performance of S&PTransportation Select IndustryIndex (TR)
Deutsche Bank 12-May-20 11,826
USD 418,085 1-month USD LIBOR -0.40% Performance of S&P North USATechnology Total Return Index
Deutsche Bank 12-May-20 2,960
USD 825,272 1-month USD LIBOR -1.00% Performance of Russell 2000Total Return Growth Index
Deutsche Bank 12-May-20 16,604
USD 2,230,918 1-month USD LIBOR Performance of MSCI DailyTotal Return Net EmergingMarkets Taiwan USD Index
Deutsche Bank 13-May-20 99,639
USD 827,441 1-month USD LIBOR +0.10% Performance of DB HybridBasket 01 Index
Deutsche Bank 13-May-20 48,980
USD 1,132,064 1-month USD LIBOR +0.10% Performance of S&P SmallCap600 Total Return Index
Deutsche Bank 13-May-20 25,780
USD 136,782 1-month USD LIBOR +0.10% Performance of Standard &Poors United States Index
Deutsche Bank 13-May-20 3,156
USD 2,787,116 1-month USD LIBOR +0.15% Performance of NASDAQ 100Total Return Index
Deutsche Bank 13-May-20 51,856
USD 487,115 1-month USD LIBOR -0.10% Performance of Dow JonesTransportation Average TotalReturn Index
Deutsche Bank 13-May-20 31,556
USD 1,009,381 1-month USD LIBOR -0.10% Performance of Dow Jones USTechnology Total Return Index
Deutsche Bank 13-May-20 34,713
USD 375,976 1-month USD LIBOR -0.25% Performance of Russell MidcapGrowth Index Total ReturnIndex
Deutsche Bank 13-May-20 11,979
USD 1,109,642 1-month USD LIBOR -0.30% Performance of S&P SmallCap600 Growth Index
Deutsche Bank 13-May-20 22,759
USD 610,183 1-month USD LIBOR -0.35% Performance of ConsumerDiscretionary Select SectorTotal Return Index
Deutsche Bank 13-May-20 4,715
USD 2,395,285 1-month USD LIBOR -0.35% Performance of PhiladelphiaStock Exchange SemiconductorIndex
Deutsche Bank 13-May-20 163,915
USD 542,439 1-month USD LIBOR -0.35% Performance of S&P MidCap400 Total Return Index
Deutsche Bank 13-May-20 13,238
FRANKLIN TEMPLETON INVESTMENT FUNDS
Notes to the Financial StatementsAt June 30, 2018 (continued)
Note 10 — Open positions on total return swap contracts (continued)
www.franklintempleton.lu Audited Annual Report 151

As at June 30, 2018, the Company had entered into the following outstanding contracts:
Franklin K2 Alternative Strategies Fund (continued)Tradingcurrency
Notionalamount
Fund receives Fund pays Counterparty Maturitydate
Unrealisedprofit/(loss)
USD
USD 1,366,593 1-month USD LIBOR -0.35% Performance of S&P NorthAmerican Technology SoftwareIndex
Deutsche Bank 13-May-20 44,091
USD 438,813 1-month USD LIBOR -0.35% Performance of S&PTransportation Select IndustryIndex (TR)
Deutsche Bank 13-May-20 24,511
USD 781,792 1-month USD LIBOR -0.40% Performance of S&P North USATechnology Total Return Index
Deutsche Bank 13-May-20 5,527
USD 1,263,925 1-month USD LIBOR -1.00% Performance of Russell 2000Total Return Growth Index
Deutsche Bank 13-May-20 25,426
USD 1,630,076 1-month USD LIBOR +0.10% Performance of DB HybridBasket 01 Index
Deutsche Bank 14-May-20 96,530
USD 318,435 1-month USD LIBOR +0.10% Performance of S&P SmallCap600 Total Return Index
Deutsche Bank 14-May-20 7,253
USD 196,161 1-month USD LIBOR +0.15% Performance of NASDAQ 100Total Return Index
Deutsche Bank 14-May-20 3,659
USD 1,322,171 1-month USD LIBOR -0.10% Performance of Dow JonesTransportation Average TotalReturn Index
Deutsche Bank 14-May-20 85,685
USD 67,799 1-month USD LIBOR -0.25% Performance of Russell MidcapGrowth Index Total ReturnIndex
Deutsche Bank 14-May-20 2,153
USD 1,252,872 1-month USD LIBOR -0.30% Performance of S&P SmallCap600 Growth Index
Deutsche Bank 14-May-20 25,741
USD 409,024 1-month USD LIBOR -0.35% Performance of ConsumerDiscretionary Select SectorTotal Return Index
Deutsche Bank 14-May-20 3,161
USD 220,552 1-month USD LIBOR -0.35% Performance of S&P MidCap400 Total Return Index
Deutsche Bank 14-May-20 5,390
USD 29,418 1-month USD LIBOR -0.40% Performance of S&P North USATechnology Total Return Index
Deutsche Bank 14-May-20 205
USD 329,184 Performance of PayPalHoldings Inc.
1-month USD LIBOR +0.30% Deutsche Bank 14-May-20 (2,763)
USD 4,932,389 1-month USD LIBOR -0.05% Performance of Health CareSelect Sector SPDR ETF
Goldman Sachs 17-Nov-27 84,200
USD 4,640,152 1-month USD LIBOR -0.65% Performance of NASDAQBiotechnology Total ReturnIndex
Goldman Sachs 17-Nov-27 521
USD 237,667 1-month USD LIBOR Performance of Avaya HoldingsCorp.
JPMorgan 24-Jul-18 15,032
USD 381,831 1-month USD LIBOR Performance ofMINDBODY Inc., A
JPMorgan 24-Jul-18 (4,946)
USD 289,867 1-month USD LIBOR Performance of Wix.com Ltd. JPMorgan 25-Jul-18 15,462USD 13,960,000 3-month USD LIBOR Performance of iBoxx USD
Liquid High Yield IndexJPMorgan 20-Sep-18 43,738
USD 5,393,643 Performance of Martin MariettaMaterials Inc.
1-month USD LIBOR +0.35% JPMorgan 10-Jul-19 (143,216)
GBP 1,299,669 Performance of BBA AviationPLC
1-month GBP LIBOR +0.40% JPMorgan 17-Jul-19 9,044
USD 14,260,485 Performance of Microsoft Corp. 1-month USD LIBOR +0.35% JPMorgan 17-Jul-19 (219,815)USD 6,115,172 Performance of Bank of
America Corp.1-month USD LIBOR +0.35% JPMorgan 22-Jul-19 (262,488)
USD 9,286,221 Performance of Citigroup Inc. 1-month USD LIBOR +0.35% JPMorgan 24-Jul-19 76,293USD 152,998,582 1-month USD LIBOR Performance of S&P 500 Index JPMorgan 29-Jul-19 513,232USD 5,611,515 Performance of Dominos
Pizza Inc.1-month USD LIBOR +0.35% JPMorgan 29-Jul-19 92,049
USD 7,824,629 Performance of CostcoWholesale Corp.
1-month USD LIBOR +0.35% JPMorgan 30-Jul-19 60,315
USD 6,849,996 Performance of Cintas Corp. 1-month USD LIBOR +0.35% JPMorgan 31-Jul-19 (197,720)USD 8,272,250 Performance of FedEx Corp. 1-month USD LIBOR +0.35% JPMorgan 31-Jul-19 (1,218,912)USD 70,260 1-month USD LIBOR -0.17% Performance of Standard &
Poors United States IndexJPMorgan 05-May-20 776
USD 136,554 1-month USD LIBOR -0.25% Performance of S&P SmallCap600 Total Return Index
JPMorgan 05-May-20 2,060
USD 185,112 1-month USD LIBOR -0.35% Performance of S&P North USATechnology Total Return Index
JPMorgan 05-May-20 1,036
USD 288,656 Performance of Accenture PLC,A
1-month USD LIBOR +0.20% JPMorgan 05-May-20 6,230
USD 119,140 Performance of Accenture PLC,A
1-month USD LIBOR +0.40% JPMorgan 05-May-20 2,563
FRANKLIN TEMPLETON INVESTMENT FUNDS
Notes to the Financial StatementsAt June 30, 2018 (continued)
Note 10 — Open positions on total return swap contracts (continued)
152 Audited Annual Report www.franklintempleton.lu

As at June 30, 2018, the Company had entered into the following outstanding contracts:
Franklin K2 Alternative Strategies Fund (continued)Tradingcurrency
Notionalamount
Fund receives Fund pays Counterparty Maturitydate
Unrealisedprofit/(loss)
USD
USD 413,164 Performance of AdobeSystems Inc.
1-month USD LIBOR +0.20% JPMorgan 05-May-20 (15,085)
USD 607,370 Performance of Advanced MicroDevices Inc.
1-month USD LIBOR +0.20% JPMorgan 05-May-20 (23,276)
USD 94,731 Performance of Ak SteelHolding Corp., 7.25%, cvt. pfd.
1-month USD LIBOR +0.20% JPMorgan 05-May-20 (5,710)
USD 143,683 Performance of AkamaiTechnologies Inc.
1-month USD LIBOR +0.20% JPMorgan 05-May-20 (10,671)
USD 920,996 Performance of Alibaba GroupHolding Ltd., ADR
1-month USD LIBOR +1.25% JPMorgan 05-May-20 (102,754)
USD 128,994 Performance of Alliance DataSystems Corp.
1-month USD LIBOR +0.20% JPMorgan 05-May-20 10,048
USD 526,016 Performance of Alphabet Inc.,A
1-month USD LIBOR +0.20% JPMorgan 05-May-20 (10,681)
USD 641,628 Performance of Alphabet Inc.,C
1-month USD LIBOR +0.20% JPMorgan 05-May-20 (14,377)
USD 1,155,214 Performance of Amazon.comInc.
1-month USD LIBOR +0.20% JPMorgan 05-May-20 785
USD 71,247 Performance of Amazon.comInc.
1-month USD LIBOR +0.40% JPMorgan 05-May-20 45
USD 233,325 Performance of Apple Inc. 1-month USD LIBOR +0.20% JPMorgan 05-May-20 (10,240)USD 85,713 Performance of Atento SA 1-month USD LIBOR +0.20% JPMorgan 05-May-20 (8,575)USD 554,428 Performance of Atlassian Corp.
PLC1-month USD LIBOR +0.20% JPMorgan 05-May-20 (35,233)
USD 938,781 Performance of AvagoTechnologies Ltd.
1-month USD LIBOR +0.20% JPMorgan 05-May-20 (55,174)
USD 96,782 Performance of AxcelisTechnologies Inc.
1-month USD LIBOR +0.20% JPMorgan 05-May-20 (8,599)
USD 85,446 Performance of Blackbaud Inc. 1-month USD LIBOR +0.20% JPMorgan 05-May-20 (323)USD 428,198 Performance of Booking
Holdings Inc.1-month USD LIBOR +0.20% JPMorgan 05-May-20 (23,360)
USD 536,536 Performance of China Unicom(Hong Kong) Ltd., ADR
1-month USD LIBOR +1.25% JPMorgan 05-May-20 (52,705)
USD 104,139 Performance of Cloudera Inc. 1-month USD LIBOR +0.20% JPMorgan 05-May-20 (21,204)USD 255,354 Performance of Cognizant
Technology Solutions Corp., A1-month USD LIBOR +0.20% JPMorgan 05-May-20 6,152
USD 949,618 Performance of Comcast Corp.,A
1-month USD LIBOR +0.20% JPMorgan 05-May-20 51,463
USD 689,636 Performance of CommScopeHolding Co. Inc.
1-month USD LIBOR +0.20% JPMorgan 05-May-20 (20,630)
USD 285,445 Performance of eBay Inc. 1-month USD LIBOR +0.20% JPMorgan 05-May-20 (27,340)USD 666,250 Performance of EPAM
Systems Inc.1-month USD LIBOR +0.20% JPMorgan 05-May-20 (15,148)
USD 817,821 Performance of Equifax Inc. 1-month USD LIBOR +0.20% JPMorgan 05-May-20 51,622USD 105,650 Performance of Equifax Inc. 1-month USD LIBOR +0.40% JPMorgan 05-May-20 6,661USD 64,254 Performance of ExlService
Holdings Inc.1-month USD LIBOR +0.40% JPMorgan 05-May-20 (3,049)
USD 519,779 Performance of ExpediaGroup Inc.
1-month USD LIBOR +0.20% JPMorgan 05-May-20 (664)
USD 126,670 Performance of ExpediaGroup Inc.
1-month USD LIBOR +0.40% JPMorgan 05-May-20 (170)
USD 1,096,864 Performance of Facebook Inc.,A
1-month USD LIBOR +0.20% JPMorgan 05-May-20 6,355
USD 123,517 Performance of FleetCorTechnologies Inc.
1-month USD LIBOR +0.20% JPMorgan 05-May-20 3,762
USD 2,315,552 Performance of Flex Ltd. 1-month USD LIBOR +0.20% JPMorgan 05-May-20 (17,969)USD 569,634 Performance of FormFactor Inc. 1-month USD LIBOR +0.20% JPMorgan 05-May-20 (46,172)USD 121,059 Performance of Genpact Ltd. 1-month USD LIBOR +0.20% JPMorgan 05-May-20 (6,885)USD 112,736 Performance of Genpact Ltd. 1-month USD LIBOR +0.40% JPMorgan 05-May-20 (6,419)USD 183,076 Performance of Global
Payments Inc.1-month USD LIBOR +0.20% JPMorgan 05-May-20 (5,933)
USD 94,296 Performance of GuidewireSoftware Inc.
1-month USD LIBOR +0.20% JPMorgan 05-May-20 (5,280)
USD 197,611 Performance of Harris Corp. 1-month USD LIBOR +0.20% JPMorgan 05-May-20 (11,156)USD 69,968 Performance of Huron
Consulting Group Inc.1-month USD LIBOR +0.40% JPMorgan 05-May-20 158
USD 181,759 Performance of II-VI Inc. 1-month USD LIBOR +0.20% JPMorgan 05-May-20 (14,353)USD 73,921 Performance of Inphi Corp. 1-month USD LIBOR +0.20% JPMorgan 05-May-20 (4,009)USD 221,078 Performance of Integrated
Device Technology Inc.1-month USD LIBOR +0.20% JPMorgan 05-May-20 (17,881)
USD 897,387 Performance of IPG PhotonicsCorp.
1-month USD LIBOR +0.20% JPMorgan 05-May-20 (126,019)
FRANKLIN TEMPLETON INVESTMENT FUNDS
Notes to the Financial StatementsAt June 30, 2018 (continued)
Note 10 — Open positions on total return swap contracts (continued)
www.franklintempleton.lu Audited Annual Report 153

As at June 30, 2018, the Company had entered into the following outstanding contracts:
Franklin K2 Alternative Strategies Fund (continued)Tradingcurrency
Notionalamount
Fund receives Fund pays Counterparty Maturitydate
Unrealisedprofit/(loss)
USD
USD 32,073 Performance of Itron Inc. 1-month USD LIBOR +0.20% JPMorgan 05-May-20 610USD 474,883 Performance of KLA-Tencor
Corp.1-month USD LIBOR +0.20% JPMorgan 05-May-20 (63,387)
USD 1,159,945 Performance of MarvellTechnology Group Ltd.
1-month USD LIBOR +0.20% JPMorgan 05-May-20 (32,688)
USD 12,053 Performance of MicrochipTechnology Inc.
1-month USD LIBOR +0.20% JPMorgan 05-May-20 (1,338)
USD 2,604,238 Performance of MicronTechnology Inc.
1-month USD LIBOR +0.20% JPMorgan 05-May-20 (309,153)
USD 270,791 Performance of MicronTechnology Inc.
1-month USD LIBOR +0.40% JPMorgan 05-May-20 (49,651)
USD 73,781 Performance of Microsoft Corp. 1-month USD LIBOR +0.20% JPMorgan 05-May-20 (2,684)USD 8,380 Performance of Microsoft Corp. 1-month USD LIBOR +0.40% JPMorgan 05-May-20 (305)USD 68,479 Performance of NetApp Inc. 1-month USD LIBOR +0.20% JPMorgan 05-May-20 5,239USD 112,920 Performance of NVIDIA Corp. 1-month USD LIBOR +0.20% JPMorgan 05-May-20 (12,153)USD 91,174 Performance of PayPal
Holdings Inc.1-month USD LIBOR +0.20% JPMorgan 05-May-20 (2,030)
USD 409,771 Performance of PayPalHoldings Inc.
1-month USD LIBOR +0.40% JPMorgan 05-May-20 (9,233)
USD 339,725 Performance ofQUALCOMM Inc.
1-month USD LIBOR +0.20% JPMorgan 05-May-20 (16,973)
USD 641,765 Performance of Salesforce.comInc.
1-month USD LIBOR +0.20% JPMorgan 05-May-20 10,045
USD 143,103 Performance ofServiceNow Inc.
1-month USD LIBOR +0.20% JPMorgan 05-May-20 (10,659)
USD 855,003 Performance of Sino-AmericanSilicon Products Inc.
1-month USD LIBOR +0.50% JPMorgan 05-May-20 (15,947)
USD 86,447 Performance of Sino-AmericanSilicon Products Inc.
1-month USD LIBOR +0.55% JPMorgan 05-May-20 (1,618)
HKD 6,174,957 Performance of Sunny OpticalTechnology Group Co. Ltd.
1-month HKD HIBOR +1.25% JPMorgan 05-May-20 (101,463)
HKD 588,000 Performance of TencentHoldings Ltd.
1-month HKD HIBOR +0.30% JPMorgan 05-May-20 (4,742)
HKD 6,468,000 Performance of TencentHoldings Ltd.
1-month HKD HIBOR +1.25% JPMorgan 05-May-20 (52,680)
USD 122,957 Performance of Teradyne Inc. 1-month USD LIBOR +0.20% JPMorgan 05-May-20 (4,496)USD 150,805 Performance of Tesla Inc. 1-month USD LIBOR +0.20% JPMorgan 05-May-20 26,621USD 100,443 Performance of Total System
Services Inc.1-month USD LIBOR +0.20% JPMorgan 05-May-20 (3,062)
USD 80,497 Performance of TransUnion 1-month USD LIBOR +0.20% JPMorgan 05-May-20 776USD 1,133,052 Performance of TransUnion 1-month USD LIBOR +0.40% JPMorgan 05-May-20 10,864USD 591,257 Performance of TriNet
Group Inc.1-month USD LIBOR +0.20% JPMorgan 05-May-20 (6,159)
USD 70,260 1-month USD LIBOR -0.17% Performance of Standard &Poors United States Index
JPMorgan 07-May-20 780
USD 672,062 1-month USD LIBOR -0.25% Performance of S&P SmallCap600 Total Return Index
JPMorgan 07-May-20 10,208
USD 893,728 1-month USD LIBOR -0.30% Performance of S&PTransportation Select IndustryIndex (TR)
JPMorgan 07-May-20 21,510
USD 69,145 1-month USD LIBOR -0.33% Performance of ConsumerDiscretionary Select SectorTotal Return Index
JPMorgan 07-May-20 (703)
USD 864,217 1-month USD LIBOR -0.33% Performance of Dow JonesTransportation Average TotalReturn Index
JPMorgan 07-May-20 34,589
USD 1,511,637 1-month USD LIBOR -0.33% Performance of Dow Jones USTechnology Total Return Index
JPMorgan 07-May-20 62,427
USD 318,638 1-month USD LIBOR -0.33% Performance of NASDAQ 100Total Return Index
JPMorgan 07-May-20 5,802
USD 2,387,037 1-month USD LIBOR -0.33% Performance of PhiladelphiaStock Exchange SemiconductorIndex
JPMorgan 07-May-20 194,509
USD 452,762 1-month USD LIBOR -0.33% Performance of S&P MidCap400 Total Return Index
JPMorgan 07-May-20 5,097
USD 483,452 1-month USD LIBOR -0.33% Performance of S&P NorthAmerican Technology SoftwareIndex
JPMorgan 07-May-20 15,847
USD 328,395 1-month USD LIBOR -0.35% Performance of S&P North USATechnology Total Return Index
JPMorgan 07-May-20 1,853
FRANKLIN TEMPLETON INVESTMENT FUNDS
Notes to the Financial StatementsAt June 30, 2018 (continued)
Note 10 — Open positions on total return swap contracts (continued)
154 Audited Annual Report www.franklintempleton.lu

As at June 30, 2018, the Company had entered into the following outstanding contracts:
Franklin K2 Alternative Strategies Fund (continued)Tradingcurrency
Notionalamount
Fund receives Fund pays Counterparty Maturitydate
Unrealisedprofit/(loss)
USD
USD 82,316 1-month USD LIBOR -0.40% Performance of ConsumerDiscretionary Select SectorTotal Return Index
JPMorgan 07-May-20 (836)
USD 2,835,059 1-month USD LIBOR -0.40% Performance of NASDAQ 100Total Return Index
JPMorgan 07-May-20 51,637
USD 1,660,615 1-month USD LIBOR -0.40% Performance of PhiladelphiaStock Exchange SemiconductorIndex
JPMorgan 07-May-20 110,353
USD 219,246 1-month USD LIBOR -0.40% Performance of Russell MidcapGrowth Index Total ReturnIndex
JPMorgan 07-May-20 4,472
USD 3,144,399 1-month USD LIBOR -0.40% Performance of S&P NorthAmerican Technology SoftwareIndex
JPMorgan 07-May-20 102,990
USD 1,656,661 1-month USD LIBOR -0.40% Performance of S&P North USATechnology Total Return Index
JPMorgan 07-May-20 9,329
USD 630,826 1-month USD LIBOR -0.43% Performance of DB HybridBasket 01 Index
JPMorgan 07-May-20 39,564
USD 930,239 1-month USD LIBOR -0.45% Performance of S&P SmallCap600 Growth Index
JPMorgan 07-May-20 14,659
USD 124,849 1-month USD LIBOR -0.80% Performance of Russell MidcapGrowth Index Total ReturnIndex
JPMorgan 07-May-20 2,507
HKD 3,844,800 Performance of Sunny OpticalTechnology Group Co. Ltd.
1-month HKD HIBOR +1.25% JPMorgan 07-May-20 (44,183)
USD 161,991 1-month USD LIBOR -0.25% Performance of S&P SmallCap600 Total Return Index
JPMorgan 08-May-20 2,443
USD 244,652 1-month USD LIBOR -0.30% Performance of S&PTransportation Select IndustryIndex (TR)
JPMorgan 08-May-20 5,893
USD 169,455 1-month USD LIBOR -0.40% Performance of Dow JonesTransportation Average TotalReturn Index
JPMorgan 08-May-20 6,775
USD 882,381 1-month USD LIBOR -0.40% Performance of NASDAQ 100Total Return Index
JPMorgan 08-May-20 16,097
USD 199,921 1-month USD LIBOR -0.40% Performance of S&P MidCap400 Total Return Index
JPMorgan 08-May-20 2,225
USD 265,882 1-month USD LIBOR -0.80% Performance of Russell 2000Total Return Growth Index
JPMorgan 08-May-20 3,666
USD 115,713 1-month USD LIBOR -0.80% Performance of Russell MidcapGrowth Index Total ReturnIndex
JPMorgan 08-May-20 2,320
USD 74,217 USD-FED EFF Performance of VoceraCommunications Inc.
Morgan Stanley 11-Jul-18 (13,855)
CHF 6,405,802 Performance of LafargeHolcimLtd., B
1-month CHF LIBOR +0.40% Morgan Stanley 25-Jul-18 (498,748)
CHF 10,419,566 Performance of Nestle SA 1-month CHF LIBOR +0.40% Morgan Stanley 25-Jul-18 375,152USD 6,712,000 3-month USD LIBOR Performance of iBoxx USD
Liquid High Yield IndexMorgan Stanley 20-Sep-18 23,290
USD 3,945,390 Performance of Alphabet Inc.,A
USD-FED EFF +0.50% Morgan Stanley 20-Sep-18 723,829
USD 4,631,367 Performance of Caterpillar Inc. USD-FED EFF +0.50% Morgan Stanley 20-Sep-18 (308,208)USD 1,962,775 Performance of Delta Air
Lines Inc.USD-FED EFF +0.50% Morgan Stanley 20-Sep-18 (143,101)
USD 3,343,146 Performance of Knight-Swifttransportation Holdings Inc.
USD-FED EFF +0.50% Morgan Stanley 20-Sep-18 199,157
USD 1,259,787 Performance of Las VegasSands Corp.
USD-FED EFF +0.50% Morgan Stanley 20-Sep-18 83,402
USD 3,640,326 Performance of MonsterBeverage Corp.
USD-FED EFF +0.50% Morgan Stanley 20-Sep-18 196,312
USD 8,432,824 Performance of NVR Inc. USD-FED EFF +0.50% Morgan Stanley 20-Sep-18 1,614,991USD 5,725,314 Performance of Rio Tinto PLC,
ADRUSD-FED EFF +0.50% Morgan Stanley 20-Sep-18 890,696
USD 4,714,160 Performance of Take-TwoInteractive Software Inc.
USD-FED EFF +0.50% Morgan Stanley 20-Sep-18 254,307
USD 272,466 USD-FED EFF -0.35% Performance of Aircastle Ltd. Morgan Stanley 20-Sep-18 2,810USD 590,067 USD-FED EFF -0.35% Performance of Camden
Property TrustMorgan Stanley 20-Sep-18 (40,038)
USD 359,046 USD-FED EFF -0.35% Performance of CanadianNational Railway Co.
Morgan Stanley 20-Sep-18 (7,381)
USD 893,597 USD-FED EFF -0.35% Performance of Domtar Corp. Morgan Stanley 20-Sep-18 (113,248)
FRANKLIN TEMPLETON INVESTMENT FUNDS
Notes to the Financial StatementsAt June 30, 2018 (continued)
Note 10 — Open positions on total return swap contracts (continued)
www.franklintempleton.lu Audited Annual Report 155

As at June 30, 2018, the Company had entered into the following outstanding contracts:
Franklin K2 Alternative Strategies Fund (continued)Tradingcurrency
Notionalamount
Fund receives Fund pays Counterparty Maturitydate
Unrealisedprofit/(loss)
USD
USD 672,231 USD-FED EFF -0.35% Performance of EastmanChemical Co.
Morgan Stanley 20-Sep-18 (93,541)
USD 823,485 USD-FED EFF -0.35% Performance of Eaton Corp.PLC
Morgan Stanley 20-Sep-18 (8,908)
USD 275,661 USD-FED EFF -0.35% Performance of EmersonElectric Co.
Morgan Stanley 20-Sep-18 212
USD 589,207 USD-FED EFF -0.35% Performance of Fastenal Co. Morgan Stanley 20-Sep-18 20,974USD 972,477 USD-FED EFF -0.35% Performance of Ferrari NV Morgan Stanley 20-Sep-18 (72,416)USD 562,621 USD-FED EFF -0.35% Performance of Kimberly-Clark
Corp.Morgan Stanley 20-Sep-18 (15,871)
USD 991,245 USD-FED EFF -0.35% Performance of Kirby Corp. Morgan Stanley 20-Sep-18 (182,825)USD 1,081,859 USD-FED EFF -0.35% Performance of Louisiana-
Pacific Corp.Morgan Stanley 20-Sep-18 12,485
USD 459,687 USD-FED EFF -0.35% Performance of Monro Inc. Morgan Stanley 20-Sep-18 (91,219)USD 394,738 USD-FED EFF -0.35% Performance of PulteGroup Inc. Morgan Stanley 20-Sep-18 (749)USD 515,075 USD-FED EFF -0.35% Performance of Ralph Lauren
Corp.Morgan Stanley 20-Sep-18 35,586
USD 2,212,854 USD-FED EFF -0.35% Performance of Regal BeloitCorp.
Morgan Stanley 20-Sep-18 (113,125)
USD 342,444 USD-FED EFF -0.35% Performance of SchneiderNational Inc., B
Morgan Stanley 20-Sep-18 (52,835)
USD 261,756 USD-FED EFF -0.35% Performance of Sotheby’s Morgan Stanley 20-Sep-18 13,416USD 545,850 USD-FED EFF -0.35% Performance of Starbucks Corp. Morgan Stanley 20-Sep-18 86,158USD 1,201,487 USD-FED EFF -0.35% Performance of Terex Corp. Morgan Stanley 20-Sep-18 (63,698)USD 556,856 USD-FED EFF -0.35% Performance of The Walt
Disney Co.Morgan Stanley 20-Sep-18 (2,042)
USD 269,648 USD-FED EFF -0.35% Performance of Tiffany & Co. Morgan Stanley 20-Sep-18 7,557USD 563,406 USD-FED EFF -0.35% Performance of Trinity
Industries Inc.Morgan Stanley 20-Sep-18 (15,031)
USD 543,084 USD-FED EFF -0.35% Performance of VulcanMaterials Co.
Morgan Stanley 20-Sep-18 5,952
USD 527,365 USD-FED EFF -14.97% Performance of Cracker BarrelOld Country Store Inc.
Morgan Stanley 20-Sep-18 16,357
USD 659,150 USD-FED EFF -3.02% Performance of Tesla Inc. Morgan Stanley 20-Sep-18 (93,030)EUR 3,062,192 EUR-EONIA -0.40% Performance of LVMH Moet
Hennessy Louis Vuitton SEMorgan Stanley 27-Sep-18 (380,306)
EUR 5,221,735 Performance of Celesio AG,144A
EUR-EONIA +0.65% Morgan Stanley 27-Sep-18 (1,267)
EUR 2,292 Performance of Gemalto NV EUR-EONIA +0.65% Morgan Stanley 27-Sep-18 (3)EUR 3,920,473 Performance of Innogy SE, Reg
SEUR-EONIA +0.65% Morgan Stanley 27-Sep-18 36,620
EUR 3,485,740 Performance of RWE AG EUR-EONIA +0.65% Morgan Stanley 27-Sep-18 (114,000)EUR 1,502,725 Performance of thyssenkrupp
AGEUR-EONIA +0.65% Morgan Stanley 27-Sep-18 (236,585)
EUR 310,023 Performance of Vivendi SA EUR-EONIA +0.65% Morgan Stanley 27-Sep-18 (24,309)GBP 3,390,826 GBP-SONIA Performance of Informa PLC Morgan Stanley 01-Oct-18 (687,082)GBP 4,101,288 Performance of NEX Group PLC GBP-SONIA +0.65% Morgan Stanley 01-Oct-18 86,637GBP 8,856,778 Performance of Sky PLC GBP-SONIA +0.65% Morgan Stanley 01-Oct-18 3,425,977GBP 3,771,514 Performance of UBM PLC GBP-SONIA Morgan Stanley 01-Oct-18 655,312GBP 2,686,603 Performance of Vodafone Group
PLCGBP-SONIA +0.65% Morgan Stanley 01-Oct-18 (435,831)
USD 7,039,154 USD-FED EFF -0.35% Performance of AT&T Inc. Morgan Stanley 08-Nov-18 113,617USD 1,858,171 USD-FED EFF -0.35% Performance of CVS Health
Corp.Morgan Stanley 08-Nov-18 (820)
USD 1,954,728 USD-FED EFF -0.35% Performance of MarathonPetroleum Corp.
Morgan Stanley 08-Nov-18 213,504
USD 542,505 USD-FED EFF -0.35% Performance of UnitedTechnologies Corp.
Morgan Stanley 08-Nov-18 8,654
USD 2,282,003 USD-FED EFF -0.67% Performance of VMware Inc., A Morgan Stanley 08-Nov-18 (267,778)USD 9,907,143 Performance of Altaba Inc. USD-FED EFF +0.50% Morgan Stanley 24-Dec-18 2,871,207USD 2,298,667 Performance of Andeavor USD-FED EFF +0.40% Morgan Stanley 24-Dec-18 (210,746)USD 9,038,094 USD-FED EFF -0.35% Performance of Alibaba Group
Holding Ltd., ADRMorgan Stanley 24-Dec-18 (1,869,883)
GBP 193,828 GBP-SONIA -0.35% Performance of InternationalConsolidated Airlines Group SA
Morgan Stanley 18-Jan-19 (3,038)
GBP 376,320 GBP-SONIA -0.63% Performance of Weir Group PLC Morgan Stanley 18-Jan-19 34,169GBP 349,383 Performance of Anglo American
PLC1-month GBP LIBOR +0.50% Morgan Stanley 18-Jan-19 (51,908)
GBP 921,324 Performance of AntofagastaPLC
1-month GBP LIBOR +0.50% Morgan Stanley 18-Jan-19 136,632
GBP 1,224,592 Performance of Rio Tinto PLC 1-month GBP LIBOR +0.50% Morgan Stanley 18-Jan-19 186,318
FRANKLIN TEMPLETON INVESTMENT FUNDS
Notes to the Financial StatementsAt June 30, 2018 (continued)
Note 10 — Open positions on total return swap contracts (continued)
156 Audited Annual Report www.franklintempleton.lu

As at June 30, 2018, the Company had entered into the following outstanding contracts:
Franklin K2 Alternative Strategies Fund (continued)Tradingcurrency
Notionalamount
Fund receives Fund pays Counterparty Maturitydate
Unrealisedprofit/(loss)
USD
EUR 143,747 EUR-EONIA -0.40% Performance of DeutscheLufthansa AG
Morgan Stanley 13-Feb-19 (1,185)
EUR 495,565 EUR-EONIA -0.40% Performance of KoninklijkeAhold Delhaize NV
Morgan Stanley 13-Feb-19 (33,135)
EUR 1,625,064 EUR-EONIA -1.53% Performance of iShares STOXXEurope 600 UCITS ETF
Morgan Stanley 13-Feb-19 (73,943)
EUR 593,258 Performance of Cie Generaledes Etablissements MichelinSCA
1-month EURIBOR +0.50% Morgan Stanley 13-Feb-19 (134,172)
EUR 787,301 Performance of Kering SA 1-month EURIBOR +0.50% Morgan Stanley 13-Feb-19 346,617EUR 1,622,498 Performance of Plastic Omnium
SA1-month EURIBOR +0.50% Morgan Stanley 13-Feb-19 158,412
SEK 4,923,636 1-week SEK STIBOR -0.50% Performance of Boliden AB Morgan Stanley 27-Feb-19 (8,447)SEK 2,334,967 1-week SEK STIBOR -0.50% Performance of SKF AB, B Morgan Stanley 27-Feb-19 14,912JPY 198,689,270 MUTSC -0.40% Performance of ANA
Holdings Inc.Morgan Stanley 08-Apr-19 83,487
USD 546,518 USD-FED EFF -0.35% Performance of SinclairBroadcast Group Inc., A
Morgan Stanley 25-Apr-19 (29,395)
USD 5,788,132 USD-FED EFF -0.35% Performance of The WaltDisney Co.
Morgan Stanley 25-Apr-19 (36,128)
USD 5,285,756 Performance of AT&T Inc. USD-FED EFF +0.40% Morgan Stanley 03-Jun-19 (85,316)USD 2,823,216 Performance of Tribune Media
Co., AUSD-FED EFF +0.40% Morgan Stanley 03-Jun-19 61,270
HKD 14,971,488 Performance of TencentHoldings Ltd.
HKD-HONIX +0.95% Morgan Stanley 12-Jul-19 29,475
EUR 3,339,140 Performance of Christian DiorSA
EUR-EONIA +0.65% Morgan Stanley 04-Sep-19 513,205
EUR 1,803,369 Performance of EDPRenovaveis SA
EUR-EONIA +0.65% Morgan Stanley 04-Sep-19 349,937
USD 6,324,695 Performance of Aetna Inc. USD-FED EFF +0.40% Morgan Stanley 05-Sep-19 309,410USD 5,590,061 Performance of Dell
Technologies Inc., VUSD-FED EFF +0.40% Morgan Stanley 05-Sep-19 539,909
USD 1,599,325 Performance of RockwellCollins Inc.
USD-FED EFF +0.40% Morgan Stanley 05-Sep-19 (52,465)
USD 4,574,961 USD-FED EFF +0.20% Performance of S&P 500 TotalReturn Index
Morgan Stanley 08-Nov-19 (185,295)
USD 1,638,150 USD-FED EFF -0.07% Performance of ConsumerDiscretionary Select SectorTotal Return Index
Morgan Stanley 08-Nov-19 (155,057)
USD 2,809,493 USD-FED EFF -0.15% Performance of S&P 500Utilities Sector Index TotalReturn
Morgan Stanley 08-Nov-19 38,668
USD 41,565 Performance of OneMarket Ltd 1-month USD LIBOR Morgan Stanley 20-Feb-20 41,565USD 7,952,444 Performance of Shire PLC USD-FED EFF +1.25% Morgan Stanley 20-Feb-20 40,225EUR 1,868,060 EUR-EONIA -0.35% Performance of LVMH Moet
Hennessy Louis Vuitton SEMorgan Stanley 16-Apr-20 122,003
EUR 2,774,302 EUR-EONIA -0.35% Performance of Unilever NV,IDR
Morgan Stanley 16-Apr-20 (27,120)
GBP 193,798 GBP-SONIA -0.30% Performance of JD SportsFashion PLC
Morgan Stanley 16-Apr-20 (19,255)
EUR 42,122 Performance of Anima HoldingSpA, Reg S
1-month EUR LIBOR +0.40% Morgan Stanley 16-Apr-20 (4,849)
GBP 1,271,541 Performance of Barclays PLC 1-month GBP LIBOR +0.40% Morgan Stanley 16-Apr-20 (97,668)EUR 3,508,093 Performance of BNP Paribas
SA1-month EUR LIBOR +0.40% Morgan Stanley 16-Apr-20 (114,762)
EUR 6,006,474 Performance of Danone SA 1-month EUR LIBOR +0.40% Morgan Stanley 16-Apr-20 (222,334)GBP 1,372,499 Performance of Hikma
Pharmaceuticals PLC1-month GBP LIBOR +0.40% Morgan Stanley 16-Apr-20 109,816
EUR 5,975,838 Performance of Iliad SA 1-month EUR LIBOR +0.40% Morgan Stanley 16-Apr-20 (603,247)GBP 4,576,278 Performance of ITV PLC 1-month GBP LIBOR +0.40% Morgan Stanley 16-Apr-20 69,420GBP 3,393,018 Performance of Reckitt
Benckiser Group PLC1-month GBP LIBOR +0.40% Morgan Stanley 16-Apr-20 254,077
GBP 2,104,319 Performance of RSA InsuranceGroup PLC
1-month GBP LIBOR +0.40% Morgan Stanley 16-Apr-20 120,178
EUR 2,309,743 Performance of RyanairHoldings PLC
1-month EUR LIBOR +0.40% Morgan Stanley 16-Apr-20 (55,465)
GBP 2,229,279 Performance of Smith &Nephew PLC
1-month GBP LIBOR +0.40% Morgan Stanley 16-Apr-20 72,605
GBP 2,025,884 Performance of Smiths GroupPLC
1-month GBP LIBOR +0.40% Morgan Stanley 16-Apr-20 (139,351)
FRANKLIN TEMPLETON INVESTMENT FUNDS
Notes to the Financial StatementsAt June 30, 2018 (continued)
Note 10 — Open positions on total return swap contracts (continued)
www.franklintempleton.lu Audited Annual Report 157

As at June 30, 2018, the Company had entered into the following outstanding contracts:
Franklin K2 Alternative Strategies Fund (continued)Tradingcurrency
Notionalamount
Fund receives Fund pays Counterparty Maturitydate
Unrealisedprofit/(loss)
USD
EUR 3,186,715 Performance of SocieteGenerale SA
1-month EUR LIBOR +0.40% Morgan Stanley 16-Apr-20 (175,690)
GBP 515,565 Performance of Sports DirectInternational PLC
1-month GBP LIBOR +0.40% Morgan Stanley 16-Apr-20 (49,234)
CHF 264,233 CHF-SARON -0.40% Performance of Kuehne +Nagel International AG
Morgan Stanley 06-May-20 11,509
USD 342,491 Performance of Accenture PLC,A
1-month USD LIBOR +0.50% Morgan Stanley 15-May-20 12
USD 432,627 Performance of AdobeSystems Inc.
1-month USD LIBOR +0.50% Morgan Stanley 15-May-20 (14,040)
USD 1,057,050 Performance of Advanced MicroDevices Inc.
1-month USD LIBOR +0.50% Morgan Stanley 15-May-20 (88,391)
USD 248,239 Performance of Ak SteelHolding Corp., 7.25%, cvt. pfd.
1-month USD LIBOR +0.50% Morgan Stanley 15-May-20 (13,672)
USD 262,550 Performance of AkamaiTechnologies Inc.
1-month USD LIBOR +0.50% Morgan Stanley 15-May-20 (28,257)
USD 407,680 Performance of Alibaba GroupHolding Ltd., ADR
1-month USD LIBOR +0.75% Morgan Stanley 15-May-20 (44,489)
USD 2,847,900 Performance of Alliance DataSystems Corp.
1-month USD LIBOR +0.50% Morgan Stanley 15-May-20 7,936
USD 270,110 Performance of Alphabet Inc.,A
1-month USD LIBOR +0.50% Morgan Stanley 15-May-20 (7,279)
USD 444,772 Performance of Alphabet Inc.,C
1-month USD LIBOR +0.50% Morgan Stanley 15-May-20 (14,576)
USD 804,790 Performance of Amazon.comInc.
1-month USD LIBOR +0.50% Morgan Stanley 15-May-20 (8,389)
USD 2,677,751 Performance of Apple Inc. 1-month USD LIBOR +0.50% Morgan Stanley 15-May-20 (55,571)USD 695,794 Performance of Atento SA 1-month USD LIBOR +0.50% Morgan Stanley 15-May-20 (77,456)USD 437,582 Performance of Atlassian Corp.
PLC1-month USD LIBOR +0.50% Morgan Stanley 15-May-20 (24,263)
USD 616,165 Performance of Blackbaud Inc. 1-month USD LIBOR +0.50% Morgan Stanley 15-May-20 (33,680)USD 1,346,973 Performance of Booking
Holdings Inc.1-month USD LIBOR +0.50% Morgan Stanley 15-May-20 (73,281)
USD 33,308 Performance of China Unicom(Hong Kong) Ltd., ADR
1-month USD LIBOR +0.75% Morgan Stanley 15-May-20 (1,044)
USD 5,548 Performance of ChromaAte Inc.
1-month USD LIBOR +0.55% Morgan Stanley 15-May-20 (167)
USD 274,219 Performance of CognizantTechnology Solutions Corp., A
1-month USD LIBOR +0.50% Morgan Stanley 15-May-20 (6,024)
USD 716,505 Performance of CommScopeHolding Co. Inc.
1-month USD LIBOR +0.50% Morgan Stanley 15-May-20 (29,453)
USD 933,916 Performance of CoStarGroup Inc.
1-month USD LIBOR +0.50% Morgan Stanley 15-May-20 (3,657)
USD 795,418 Performance of Cray Inc. 1-month USD LIBOR +0.50% Morgan Stanley 15-May-20 (43,572)EUR 503,606 Performance of Delivery Hero
AG1-month EURIBOR +0.50% Morgan Stanley 15-May-20 53,154
USD 321,153 Performance of eBay Inc. 1-month USD LIBOR +0.50% Morgan Stanley 15-May-20 (22,040)EUR 934,596 Performance of Edenred 1-month EURIBOR +0.50% Morgan Stanley 15-May-20 9,718USD 121,647 Performance of EPAM
Systems Inc.1-month USD LIBOR +0.50% Morgan Stanley 15-May-20 74
USD 2,062,657 Performance of Equifax Inc. 1-month USD LIBOR +0.50% Morgan Stanley 15-May-20 16,264USD 911,302 Performance of ExlService
Holdings Inc.1-month USD LIBOR +0.50% Morgan Stanley 15-May-20 (45,147)
GBP 1,755,194 Performance of Experian PLC 1-month GBP LIBOR +0.50% Morgan Stanley 15-May-20 35,900USD 865,602 Performance of Fabrinet 1-month USD LIBOR +0.50% Morgan Stanley 15-May-20 (3,802)USD 791,235 Performance of Facebook Inc.,
A1-month USD LIBOR +0.50% Morgan Stanley 15-May-20 (6,902)
JPY 154,970,240 Performance of FANUC Corp. 1-month JPY LIBOR +0.50% Morgan Stanley 15-May-20 (38,880)USD 4,298,568 Performance of FleetCor
Technologies Inc.1-month USD LIBOR +0.50% Morgan Stanley 15-May-20 70,212
USD 1,760,896 Performance of Flex Ltd. 1-month USD LIBOR +0.50% Morgan Stanley 15-May-20 (29,562)USD 1,422,086 Performance of FormFactor Inc. 1-month USD LIBOR +0.50% Morgan Stanley 15-May-20 (77,259)USD 2,078,642 Performance of Genpact Ltd. 1-month USD LIBOR +0.50% Morgan Stanley 15-May-20 (136,986)USD 3,576,702 Performance of Global
Payments Inc.1-month USD LIBOR +0.50% Morgan Stanley 15-May-20 (186,242)
USD 1,010,470 Performance of GoDaddy Inc.,A
1-month USD LIBOR +0.50% Morgan Stanley 15-May-20 (38,741)
USD 485,885 Performance of GuidewireSoftware Inc.
1-month USD LIBOR +0.50% Morgan Stanley 15-May-20 (22,515)
USD 2,600,009 Performance of Harris Corp. 1-month USD LIBOR +0.50% Morgan Stanley 15-May-20 (74,699)USD 761,848 Performance of Hubspot Inc. 1-month USD LIBOR +0.50% Morgan Stanley 15-May-20 (64,760)
FRANKLIN TEMPLETON INVESTMENT FUNDS
Notes to the Financial StatementsAt June 30, 2018 (continued)
Note 10 — Open positions on total return swap contracts (continued)
158 Audited Annual Report www.franklintempleton.lu

As at June 30, 2018, the Company had entered into the following outstanding contracts:
Franklin K2 Alternative Strategies Fund (continued)Tradingcurrency
Notionalamount
Fund receives Fund pays Counterparty Maturitydate
Unrealisedprofit/(loss)
USD
USD 410,190 Performance of HuronConsulting Group Inc.
1-month USD LIBOR +0.50% Morgan Stanley 15-May-20 (3,888)
USD 3,291,447 Performance of II-VI Inc. 1-month USD LIBOR +0.50% Morgan Stanley 15-May-20 (221,229)USD 893,894 Performance of Integrated
Device Technology Inc.1-month USD LIBOR +0.50% Morgan Stanley 15-May-20 (75,665)
USD 356,277 Performance of Intuit Inc. 1-month USD LIBOR +0.50% Morgan Stanley 15-May-20 (8,172)USD 336,649 Performance of IPG Photonics
Corp.1-month USD LIBOR +0.50% Morgan Stanley 15-May-20 (28,766)
EUR 1,265,360 Performance of IrishContinental Group PLC
1-month EURIBOR +0.50% Morgan Stanley 15-May-20 (61,754)
USD 834,816 Performance of iRobot Corp. 1-month USD LIBOR +0.50% Morgan Stanley 15-May-20 (34,156)GBP 656,308 Performance of Just Eat PLC 1-month GBP LIBOR +0.50% Morgan Stanley 15-May-20 (12,368)USD 121,980 Performance of KLA-Tencor
Corp.1-month USD LIBOR +0.50% Morgan Stanley 15-May-20 (11,267)
USD 1,361,707 Performance of MarvellTechnology Group Ltd.
1-month USD LIBOR +0.50% Morgan Stanley 15-May-20 (30,423)
USD 1,368,176 Performance ofMastercard Inc., A
1-month USD LIBOR +0.50% Morgan Stanley 15-May-20 (22,009)
USD 1,025,585 Performance of MercurySystems Inc.
1-month USD LIBOR +0.50% Morgan Stanley 15-May-20 26,110
USD 1,278,787 Performance of NetApp Inc. 1-month USD LIBOR +0.50% Morgan Stanley 15-May-20 12,608USD 792,976 Performance of Netflix Inc. 1-month USD LIBOR +0.50% Morgan Stanley 15-May-20 (1,906)JPY 7,761,600 Performance of Nexon Co. Ltd. 1-month JPY LIBOR +0.50% Morgan Stanley 15-May-20 (6,169)USD 568,187 Performance of NVIDIA Corp. 1-month USD LIBOR +0.50% Morgan Stanley 15-May-20 (61,316)USD 691,553 Performance of ORBCOMM Inc. 1-month USD LIBOR +0.50% Morgan Stanley 15-May-20 (15,387)USD 2,274,195 Performance of PayPal
Holdings Inc.1-month USD LIBOR +0.50% Morgan Stanley 15-May-20 (56,551)
USD 246,869 Performance of QuantennaCommunications Inc.
1-month USD LIBOR +0.50% Morgan Stanley 15-May-20 (16,704)
USD 832,875 Performance of Roku Inc. 1-month USD LIBOR +0.50% Morgan Stanley 15-May-20 (13,811)USD 283,187 Performance of Salesforce.com
Inc.1-month USD LIBOR +0.50% Morgan Stanley 15-May-20 (4,396)
USD 278,034 Performance ofServiceNow Inc.
1-month USD LIBOR +0.50% Morgan Stanley 15-May-20 (20,987)
USD 84,979 Performance of Sino-AmericanSilicon Products Inc.
1-month USD LIBOR +0.55% Morgan Stanley 15-May-20 (4,228)
USD 318,711 Performance of SpotifyTechnology SA
1-month USD LIBOR +0.50% Morgan Stanley 15-May-20 (12,665)
HKD 2,337,000 Performance of TencentHoldings Ltd.
1-month HKD HIBOR +0.30% Morgan Stanley 15-May-20 (11,994)
USD 196,110 Performance of Teradyne Inc. 1-month USD LIBOR +0.50% Morgan Stanley 15-May-20 (6,493)USD 1,803,386 Performance of Tesla Inc. 1-month USD LIBOR +0.50% Morgan Stanley 15-May-20 (78,392)USD 1,121,775 Performance of Total System
Services Inc.1-month USD LIBOR +0.50% Morgan Stanley 15-May-20 (24,479)
USD 286,775 Performance of TransUnion 1-month USD LIBOR +0.50% Morgan Stanley 15-May-20 1,647USD 444,424 Performance of TriNet
Group Inc.1-month USD LIBOR +0.50% Morgan Stanley 15-May-20 (1,712)
USD 577,180 Performance of Trupanion Inc. 1-month USD LIBOR +0.50% Morgan Stanley 15-May-20 (8,832)USD 601,233 Performance of VeriSign Inc. 1-month USD LIBOR +0.50% Morgan Stanley 15-May-20 (20,980)USD 69,206 Performance of Verizon
Communications Inc.1-month USD LIBOR +0.50% Morgan Stanley 15-May-20 3,171
USD 2,275,083 Performance of Visa Inc., A 1-month USD LIBOR +0.50% Morgan Stanley 15-May-20 (46,747)USD 5,690,408 Performance of WEX Inc. 1-month USD LIBOR +0.50% Morgan Stanley 15-May-20 65,377USD 265,025 Performance of Yandex NV, A 1-month USD LIBOR +0.50% Morgan Stanley 15-May-20 (614)USD 843,588 Performance of Zebra
Technologies Corp., A1-month USD LIBOR +0.50% Morgan Stanley 15-May-20 (69,593)
USD 66 Performance of ZillowGroup Inc., C
1-month USD LIBOR +0.50% Morgan Stanley 15-May-20 (7)
USD 2,748,129 1-month USD LIBOR +0.60% Performance of MSCI DailyTotal Return Net EmergingMarkets Taiwan USD Index
Morgan Stanley 19-May-20 95,736
USD 1,570,430 1-month USD LIBOR -0.25% Performance of Dow Jones USTechnology Total Return Index
Morgan Stanley 19-May-20 61,304
USD 12,592,452 1-month USD LIBOR -0.25% Performance of NASDAQ 100Total Return Index
Morgan Stanley 19-May-20 379,235
USD 22,680,585 1-month USD LIBOR -0.25% Performance of PhiladelphiaStock Exchange SemiconductorIndex
Morgan Stanley 19-May-20 1,619,221
USD 341,379 1-month USD LIBOR -0.25% Performance of Russell MidcapGrowth Index Total ReturnIndex
Morgan Stanley 19-May-20 13,115
FRANKLIN TEMPLETON INVESTMENT FUNDS
Notes to the Financial StatementsAt June 30, 2018 (continued)
Note 10 — Open positions on total return swap contracts (continued)
www.franklintempleton.lu Audited Annual Report 159

As at June 30, 2018, the Company had entered into the following outstanding contracts:
Franklin K2 Alternative Strategies Fund (continued)Tradingcurrency
Notionalamount
Fund receives Fund pays Counterparty Maturitydate
Unrealisedprofit/(loss)
USD
USD 3,680,315 1-month USD LIBOR -0.25% Performance of S&P NorthAmerican Technology SoftwareIndex
Morgan Stanley 19-May-20 177,719
USD 218,775 1-month USD LIBOR -0.25% Performance of Standard &Poors United States Index
Morgan Stanley 19-May-20 4,897
USD 321,225 1-month USD LIBOR -0.30% Performance of S&P North USATechnology Total Return Index
Morgan Stanley 19-May-20 8,301
USD 225,519 1-month USD LIBOR -0.35% Performance of ConsumerDiscretionary Select SectorTotal Return Index
Morgan Stanley 19-May-20 5,917
USD 1,036,553 1-month USD LIBOR -0.35% Performance of Russell MidcapGrowth Index Total ReturnIndex
Morgan Stanley 19-May-20 39,843
USD 1,790,483 1-month USD LIBOR -0.35% Performance of S&P MidCap400 Total Return Index
Morgan Stanley 19-May-20 36,851
USD 5,448,204 1-month USD LIBOR -0.40% Performance of S&P SmallCap600 Growth Index
Morgan Stanley 19-May-20 140,771
USD 2,912,555 1-month USD LIBOR -0.40% Performance of S&P SmallCap600 Total Return Index
Morgan Stanley 19-May-20 61,965
USD 2,727,392 1-month USD LIBOR -0.50% Performance of DB HybridBasket 01 Index
Morgan Stanley 19-May-20 102,575
USD 1,289,620 1-month USD LIBOR -0.50% Performance of Dow JonesTransportation Average TotalReturn Index
Morgan Stanley 19-May-20 85,233
USD 1,610,690 1-month USD LIBOR -0.55% Performance of S&PTransportation Select IndustryIndex (TR)
Morgan Stanley 19-May-20 94,486
USD 2,446,675 1-month USD LIBOR -0.75% Performance of S&P North USATechnology Total Return Index
Morgan Stanley 19-May-20 62,777
USD 4,582,602 1-month USD LIBOR -1.00% Performance of Russell 2000Total Return Growth Index
Morgan Stanley 19-May-20 159,947
GBP 2,156,081 GBP-SONIA -0.35% Performance of CME Group Inc. Morgan Stanley 19-May-20 (35,698)USD 436,262 USD-FED EFF -0.75% Performance of Turk Hava
Yollari Anonim Ortakligi (THY),144A
Morgan Stanley 19-May-20 79,473
USD 4,020,979 1-month USD LIBOR -0.25% Performance of NASDAQ 100Total Return Index
Morgan Stanley 20-May-20 120,687
USD 2,771,626 1-month USD LIBOR -0.25% Performance of S&P NorthAmerican Technology SoftwareIndex
Morgan Stanley 20-May-20 133,545
USD 16,408 1-month USD LIBOR -0.25% Performance of Standard &Poors United States Index
Morgan Stanley 20-May-20 363
USD 1,850,113 1-month USD LIBOR -0.30% Performance of S&P North USATechnology Total Return Index
Morgan Stanley 20-May-20 47,813
USD 971,381 1-month USD LIBOR -0.35% Performance of Russell MidcapGrowth Index Total ReturnIndex
Morgan Stanley 20-May-20 37,216
USD 1,208,501 1-month USD LIBOR -0.35% Performance of S&P MidCap400 Total Return Index
Morgan Stanley 20-May-20 24,644
USD 4,040,251 1-month USD LIBOR -0.40% Performance of S&P SmallCap600 Growth Index
Morgan Stanley 20-May-20 103,864
USD 2,087,713 1-month USD LIBOR -0.40% Performance of S&P SmallCap600 Total Return Index
Morgan Stanley 20-May-20 44,229
USD 1,015,097 1-month USD LIBOR -0.55% Performance of S&PTransportation Select IndustryIndex (TR)
Morgan Stanley 20-May-20 59,456
USD 3,329,370 1-month USD LIBOR -1.00% Performance of Russell 2000Total Return Growth Index
Morgan Stanley 20-May-20 116,863
USD 2,503,637 USD-FED EFF -0.40% Performance of TakedaPharmaceutical Co. Ltd.
Morgan Stanley 21-May-20 (1,481)
USD 214,054 USD-FED EFF Performance of MongoDB Inc. Morgan Stanley 30-Jun-20 16,346CAD 369,495 DISC -0.35% Performance of Air Canada, B Morgan Stanley 02-Jul-20 (279)
8,726,067
FRANKLIN TEMPLETON INVESTMENT FUNDS
Notes to the Financial StatementsAt June 30, 2018 (continued)
Note 10 — Open positions on total return swap contracts (continued)
160 Audited Annual Report www.franklintempleton.lu

As at June 30, 2018, the Company had entered into the following outstanding contracts:
Franklin K2 Long Short Credit Fund
Tradingcurrency
Notionalamount
Fund receives Fund pays Counterparty Maturitydate
Unrealisedprofit/(loss)
USD
USD 616,062 Performance of BuckeyePartners LP
1-month USD LIBOR +0.85% Barclays Bank 19-Oct-18 (105,602)
USD 110,700 Performance of EnterpriseProducts Partners LP
1-month USD LIBOR +0.90% Goldman Sachs 23-Nov-18 5,888
USD 93,570 Performance of Gaming andLeisure Properties Inc.
1-month USD LIBOR +0.75% Goldman Sachs 07-Jan-19 (3,222)
USD 222,285 Performance of EnterpriseProducts Partners LP
1-month USD LIBOR +0.90% Goldman Sachs 11-Feb-19 12,190
USD 28,252 Performance of NorthstarRealty Europe Corp.
1-month USD LIBOR +0.65% Goldman Sachs 12-Mar-19 9,282
USD 962,000 3-month USD LIBOR Performance of iBoxx USDLiquid High Yield Index
JPMorgan 20-Sep-18 3,014
USD 302,920 Performance of BuckeyePartners LP
1-month USD LIBOR +0.65% JPMorgan 05-Dec-18 (76,217)
USD 67,137 Performance of Energy TransferEquity LP
1-month USD LIBOR +0.65% JPMorgan 18-Jan-19 (737)
USD 74,210 Performance of Energy TransferPartners LP
1-month USD LIBOR +0.65% JPMorgan 18-Jan-19 (541)
USD 152,872 Performance of BuckeyePartners LP
1-month USD LIBOR +0.80% JPMorgan 02-May-19 (11,697)
USD 463,000 3-month USD LIBOR Performance of iBoxx USDLiquid High Yield Index
Morgan Stanley 20-Sep-18 1,607
USD 87,812 Performance of SunCokeEnergy Partners LP
1-month USD LIBOR +2.50% Morgan Stanley 14-Oct-19 (3,943)
(169,978)
Franklin Strategic Income Fund
Tradingcurrency
Notionalamount
Fund receives Fund pays Counterparty Maturitydate
Unrealisedprofit/(loss)
USD
USD 72,700,000 Performance of Markit iBoxxUSD Liquid Leveraged LoansIndex Series 1 Version 1
3-month USD BBA LIBOR Goldman Sachs 20-Sep-18 1,145,883
USD 44,100,000 Performance of Markit iBoxxUSD Liquid Leveraged LoansIndex Series 1 Version 1
3-month USD BBA LIBOR Goldman Sachs 20-Dec-18 290,567
USD 10,000,000 Performance of Markit iBoxxUSD Liquid Leveraged LoansIndex Series 1 Version 1
3-month USD BBA LIBOR Goldman Sachs 20-Jun-19 (23,180)
1,413,270
Franklin U.S. Low Duration Fund
Tradingcurrency
Notionalamount
Fund receives Fund pays Counterparty Maturitydate
Unrealisedprofit/(loss)
USD
USD 5,800,000 Performance of Markit iBoxxUSD Liquid Leveraged LoansIndex Series 1 Version 1
3-month USD BBA LIBOR Citigroup 20-Sep-18 111,861
USD 34,300,000 Performance of Markit iBoxxUSD Liquid Leveraged LoansIndex Series 1 Version 1
3-month USD BBA LIBOR Goldman Sachs 20-Sep-18 587,250
699,111
Note 11 — Open positions on volatility swap contractsAs at June 30, 2018, the Company had no volatility swap contracts.
FRANKLIN TEMPLETON INVESTMENT FUNDS
Notes to the Financial StatementsAt June 30, 2018 (continued)
Note 10 — Open positions on total return swap contracts (continued)
www.franklintempleton.lu Audited Annual Report 161

As at June 30, 2018, the Company had entered into the following outstanding contracts:
Franklin Diversified Balanced Fund
Nominal Description Interestpaid/received
%
Counterparty Buy/SellProtection
Tradingcurrency
MarketvalueEUR
Unrealisedprofit/(loss)
EUR
3,890,000 CDX.NA.IG.27, Dec. 2021 1.00 Barclays Bank Buy USD (59,461) (25,276)2,400,000 ITRX.EUR.26, Dec. 2021 1.00 Barclays Bank Buy EUR (44,529) (16,410)
(103,990) (41,686)
Franklin Diversified Conservative Fund
Nominal Description Interestpaid/received
%
Counterparty Buy/SellProtection
Tradingcurrency
MarketvalueEUR
Unrealisedprofit/(loss)
EUR
7,650,000 CDX.NA.IG.27, Dec. 2021 1.00 Barclays Bank Buy USD (116,935) (49,708)4,520,000 ITRX.EUR.26, Dec. 2021 1.00 Barclays Bank Buy EUR (83,862) (30,906)
(200,797) (80,614)
Franklin Diversified Dynamic Fund
Nominal Description Interestpaid/received
%
Counterparty Buy/SellProtection
Tradingcurrency
MarketvalueEUR
Unrealisedprofit/(loss)
EUR
2,250,000 CDX.NA.IG.27, Dec. 2021 1.00 Barclays Bank Buy USD (34,393) (14,620)2,430,000 ITRX.EUR.26, Dec. 2021 1.00 Barclays Bank Buy EUR (45,085) (16,615)
(79,478) (31,235)
Franklin Flexible Alpha Bond Fund
Nominal Description Interestpaid/received
%
Counterparty Buy/SellProtection
Tradingcurrency
MarketvalueUSD
Unrealisedprofit/(loss)
USD
1,300,000 American Airlines Group Inc.,senior note, 144A, 5.50%,10/01/19, Dec. 2019 5.00 Barclays Bank Buy USD (74,185) 38,482
2,850,000 Boyd Gaming Corp., senior sub.bond, 7.125%, 02/01/16, Jun.2022 5.00 Barclays Bank Buy USD (417,274) 85,468
1,250,000 DISH DBS Corp., senior note,6.75%, 06/01/21, Dec. 2020 5.00 Barclays Bank Buy USD (62,900) 50,165
4,100,000 Safeway Inc., senior bond, 7.25%,02/01/31, Jun. 2019 5.00 Barclays Bank Buy USD (167,861) 43,279
2,500,000 Safeway Inc., senior bond, 7.25%,02/01/31, Sep. 2019 5.00 Barclays Bank Buy USD (117,320) 150,581
2,400,000 Sanmina-SCI Corp., senior sub.note, 8.125%, 03/01/16, Jun.2019 5.00 Barclays Bank Buy USD (113,798) 189,906
1,000,000 Universal Health Services Inc.,senior secured note, first lien,144A, 3.75%, 08/01/19, Sep.2019 5.00 Barclays Bank Buy USD (58,535) 56,710
600,000 Ally Financial Inc., senior note,7.50%, 09/15/20, Dec. 2022 5.00 Citigroup Buy USD (91,322) 21,536
430,000 American Airlines Group Inc.,senior note, 144A, 5.50%,10/01/19, Dec. 2019 5.00 Citigroup Buy USD (24,538) 12,258
1,450,000 Navient Corp., senior note,5.50%, 01/25/23, Mar. 2019 5.00 Citigroup Buy USD (48,658) 16,548
2,500,000 Tenet Healthcare Corp., seniornote, 6.875%, 11/15/31, Mar.2020 5.00 Citigroup Buy USD (157,589) (44,995)
5,000,000 PHH Corp., senior note, 7.375%,09/01/19, Sep. 2019 5.00 Goldman Sachs Buy USD (275,476) (305,097)
1,000,000 Sanmina-SCI Corp., senior sub.note, 8.125%, 03/01/16, Jun.2019 5.00 Goldman Sachs Buy USD (47,416) 77,401
925,000 Tenet Healthcare Corp., seniornote, 6.875%, 11/15/31, Mar.2019 5.00 Goldman Sachs Buy USD (30,512) 16,601
900,000 Ally Financial Inc., senior note,7.50%, 09/15/20, Dec. 2022 5.00 JPMorgan Buy USD (136,983) 33,313
1,000,000 Boyd Gaming Corp., senior sub.bond, 7.125%, 02/01/16, Jun.2022 5.00 JPMorgan Buy USD (146,412) 25,961
FRANKLIN TEMPLETON INVESTMENT FUNDS
Notes to the Financial StatementsAt June 30, 2018 (continued)
Note 12 — Open positions on credit default swap contracts
162 Audited Annual Report www.franklintempleton.lu

As at June 30, 2018, the Company had entered into the following outstanding contracts:
Franklin Flexible Alpha Bond Fund (continued)Nominal Description Interest
paid/received%
Counterparty Buy/SellProtection
Tradingcurrency
MarketvalueUSD
Unrealisedprofit/(loss)
USD
600,000 DISH DBS Corp., senior note,6.75%, 06/01/21, Jun. 2021 5.00 JPMorgan Buy USD (27,570) 922
950,000 KB Home, senior note, 7.00%,12/15/21, Mar. 2020 5.00 JPMorgan Buy USD (72,451) 28,772
375,000 Nabors Industries Inc., seniornote, 9.25%, 01/15/19, Jun.2020 1.00 JPMorgan Buy USD (1,247) (10,968)
2,250,000 Navient Corp., senior note,5.50%, 01/25/23, Mar. 2020 5.00 JPMorgan Buy USD (161,126) 9,930
2,000,000 Tenet Healthcare Corp., seniornote, 6.875%, 11/15/31, Mar.2019 5.00 JPMorgan Buy USD (65,972) 67,324
1,050,000 The AES Corp., senior note, FRN,4.20178%, 06/01/19, Jun. 2022 5.00 JPMorgan Buy USD (164,776) (18,714)
4,250,000 Energy Transfer Equity LP, seniorsecured bond, first lien, 5.875%,01/15/24, Dec. 2020 5.00 Morgan Stanley Buy USD (452,231) 102,179
1,250,000 DISH DBS Corp., senior note,6.75%, 06/01/21, Dec. 2022 5.00 Barclays Bank Sell USD (25,588) (91,545)
900,000 Morgan Stanley, senior note,3.75%, 02/25/23, Dec. 2022 1.00 Barclays Bank Sell USD 16,306 (3,298)
900,000 The Goldman Sachs Group Inc.,5.95%, 01/18/18, Dec. 2022 1.00 Barclays Bank Sell USD 14,771 (2,790)
950,000 CDX.EM.29, Jun. 2023 1.00 Citigroup Sell USD (37,826) (7,101)4,800,000 Citibank Bespoke 1Y (Dec-18) HY
6-10% Mezz Axe CDX Index, Dec.2018 0.63 Citigroup Sell USD (5,394) (5,395)
260,000 Citibank Bespoke 58 IG/42 HYEquity Tranche 0-3% Index, Jun.2019 1.00 Citigroup Sell USD (22,215) 47,985
10,400,000 Citibank Bespoke Boulder PortfolioCDX Index, Dec. 2019 1.24 Citigroup Sell USD 40,511 40,511
2,700,000 Citibank Bespoke Cambridge Dec19 0-3% Equity Tranche Index,Dec. 2019 1.00 Citigroup Sell USD (553,801) (124,501)
1,000,000 Citibank Bespoke Dec-18 HongKong 3-5% Tranche Index, Dec.2018 1.00 Citigroup Sell USD 134 41,534
550,000 Citibank Bespoke Verona Dec 19Index, Dec. 2019 1.00 Citigroup Sell USD (97,734) 37,016
2,800,000 Citibank Bespoke Verona Dec 19Index, Dec. 2019 0.40 Citigroup Sell USD (884) (884)
1,525,000 General Electric Co., senior note,2.70%, 10/09/22, Dec. 2022 1.00 Citigroup Sell USD 16,700 1,955
2,575,000 Government of Brazil, senior bond,4.25%, 01/07/25, Jun. 2023 1.00 Citigroup Sell USD (190,349) (39,215)
6,850,000 Government of China, senior bond,7.50%, 10/28/27, Jun. 2023 1.00 Citigroup Sell USD 96,576 (35,265)
2,600,000 Government of Colombia, seniorbond, 10.375%, 01/28/33, Jun.2023 1.00 Citigroup Sell USD (28,043) (20,881)
4,140,000 Government of Indonesia, Reg S,5.875%, 03/13/20, Jun. 2023 1.00 Citigroup Sell USD (68,253) (75,161)
935,000 Government of Mexico, seniornote, 4.15%, 03/28/27, Jun.2023 1.00 Citigroup Sell USD (14,312) 4,633
7,500,000 Lisbon 3-7% Bespoke MezzanineTranche Index, Jun. 2019 0.79 Citigroup Sell USD (48,020) (48,020)
10,920,000 MCDX.NA.30, Jun. 2023 1.00 Citigroup Sell USD 230,646 (35,720)1,000,000 Enterprise Products
Operating LLC, senior note,5.20%, 09/01/20, Mar. 2023 1.00 Goldman Sachs Sell USD 16,544 31,981
600,000 Capital One Financial Corp., seniornote, 4.75%, 07/15/21, Dec.2022 1.00 JPMorgan Sell USD 11,640 912
600,000 DISH DBS Corp., senior note,6.75%, 06/01/21, Jun. 2023 5.00 JPMorgan Sell USD (27,590) (19,267)
300,000 Government of Indonesia, Reg S,5.875%, 03/13/20, Jun. 2023 1.00 JPMorgan Sell USD (4,946) (1,181)
FRANKLIN TEMPLETON INVESTMENT FUNDS
Notes to the Financial StatementsAt June 30, 2018 (continued)
Note 12 — Open positions on credit default swap contracts (continued)
www.franklintempleton.lu Audited Annual Report 163
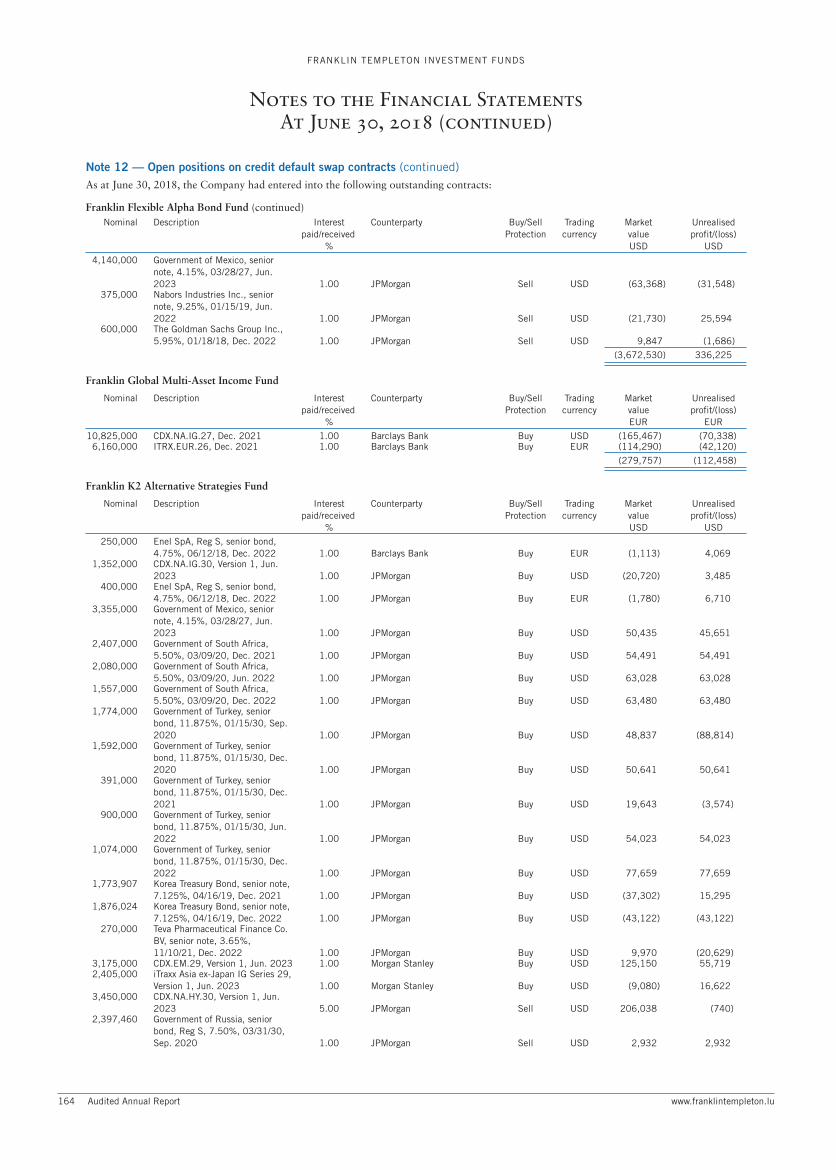
As at June 30, 2018, the Company had entered into the following outstanding contracts:
Franklin Flexible Alpha Bond Fund (continued)Nominal Description Interest
paid/received%
Counterparty Buy/SellProtection
Tradingcurrency
MarketvalueUSD
Unrealisedprofit/(loss)
USD
4,140,000 Government of Mexico, seniornote, 4.15%, 03/28/27, Jun.2023 1.00 JPMorgan Sell USD (63,368) (31,548)
375,000 Nabors Industries Inc., seniornote, 9.25%, 01/15/19, Jun.2022 1.00 JPMorgan Sell USD (21,730) 25,594
600,000 The Goldman Sachs Group Inc.,5.95%, 01/18/18, Dec. 2022 1.00 JPMorgan Sell USD 9,847 (1,686)
(3,672,530) 336,225
Franklin Global Multi-Asset Income Fund
Nominal Description Interestpaid/received
%
Counterparty Buy/SellProtection
Tradingcurrency
MarketvalueEUR
Unrealisedprofit/(loss)
EUR
10,825,000 CDX.NA.IG.27, Dec. 2021 1.00 Barclays Bank Buy USD (165,467) (70,338)6,160,000 ITRX.EUR.26, Dec. 2021 1.00 Barclays Bank Buy EUR (114,290) (42,120)
(279,757) (112,458)
Franklin K2 Alternative Strategies Fund
Nominal Description Interestpaid/received
%
Counterparty Buy/SellProtection
Tradingcurrency
MarketvalueUSD
Unrealisedprofit/(loss)
USD
250,000 Enel SpA, Reg S, senior bond,4.75%, 06/12/18, Dec. 2022 1.00 Barclays Bank Buy EUR (1,113) 4,069
1,352,000 CDX.NA.IG.30, Version 1, Jun.2023 1.00 JPMorgan Buy USD (20,720) 3,485
400,000 Enel SpA, Reg S, senior bond,4.75%, 06/12/18, Dec. 2022 1.00 JPMorgan Buy EUR (1,780) 6,710
3,355,000 Government of Mexico, seniornote, 4.15%, 03/28/27, Jun.2023 1.00 JPMorgan Buy USD 50,435 45,651
2,407,000 Government of South Africa,5.50%, 03/09/20, Dec. 2021 1.00 JPMorgan Buy USD 54,491 54,491
2,080,000 Government of South Africa,5.50%, 03/09/20, Jun. 2022 1.00 JPMorgan Buy USD 63,028 63,028
1,557,000 Government of South Africa,5.50%, 03/09/20, Dec. 2022 1.00 JPMorgan Buy USD 63,480 63,480
1,774,000 Government of Turkey, seniorbond, 11.875%, 01/15/30, Sep.2020 1.00 JPMorgan Buy USD 48,837 (88,814)
1,592,000 Government of Turkey, seniorbond, 11.875%, 01/15/30, Dec.2020 1.00 JPMorgan Buy USD 50,641 50,641
391,000 Government of Turkey, seniorbond, 11.875%, 01/15/30, Dec.2021 1.00 JPMorgan Buy USD 19,643 (3,574)
900,000 Government of Turkey, seniorbond, 11.875%, 01/15/30, Jun.2022 1.00 JPMorgan Buy USD 54,023 54,023
1,074,000 Government of Turkey, seniorbond, 11.875%, 01/15/30, Dec.2022 1.00 JPMorgan Buy USD 77,659 77,659
1,773,907 Korea Treasury Bond, senior note,7.125%, 04/16/19, Dec. 2021 1.00 JPMorgan Buy USD (37,302) 15,295
1,876,024 Korea Treasury Bond, senior note,7.125%, 04/16/19, Dec. 2022 1.00 JPMorgan Buy USD (43,122) (43,122)
270,000 Teva Pharmaceutical Finance Co.BV, senior note, 3.65%,11/10/21, Dec. 2022 1.00 JPMorgan Buy USD 9,970 (20,629)
3,175,000 CDX.EM.29, Version 1, Jun. 2023 1.00 Morgan Stanley Buy USD 125,150 55,7192,405,000 iTraxx Asia ex-Japan IG Series 29,
Version 1, Jun. 2023 1.00 Morgan Stanley Buy USD (9,080) 16,6223,450,000 CDX.NA.HY.30, Version 1, Jun.
2023 5.00 JPMorgan Sell USD 206,038 (740)2,397,460 Government of Russia, senior
bond, Reg S, 7.50%, 03/31/30,Sep. 2020 1.00 JPMorgan Sell USD 2,932 2,932
FRANKLIN TEMPLETON INVESTMENT FUNDS
Notes to the Financial StatementsAt June 30, 2018 (continued)
Note 12 — Open positions on credit default swap contracts (continued)
164 Audited Annual Report www.franklintempleton.lu

As at June 30, 2018, the Company had entered into the following outstanding contracts:
Franklin K2 Alternative Strategies Fund (continued)Nominal Description Interest
paid/received%
Counterparty Buy/SellProtection
Tradingcurrency
MarketvalueUSD
Unrealisedprofit/(loss)
USD
394,000 Government of Russia, seniorbond, Reg S, 7.50%, 03/31/30,Dec. 2021 1.00 JPMorgan Sell USD (1,717) 12,487
476,000 Government of Russia, seniorbond, Reg S, 7.50%, 03/31/30,Jun. 2021 1.00 JPMorgan Sell USD (519) 33,556
426,000 Government of Russia, seniorbond, Reg S, 7.50%, 03/31/30,Jun. 2022 1.00 JPMorgan Sell USD (3,205) 8,670
707,769 411,639
Franklin K2 Global Macro Opportunities Fund
Nominal Description Interestpaid/received
%
Counterparty Buy/SellProtection
Tradingcurrency
MarketvalueUSD
Unrealisedprofit/(loss)
USD
181,000 Government of Mexico, seniornote, 4.15%, 03/28/27, Jun.2023 1.00 JPMorgan Buy USD 2,721 2,463
270,000 Government of South Africa,5.50%, 03/09/20, Dec. 2021 1.00 JPMorgan Buy USD 6,112 6,112
163,000 Government of South Africa,5.50%, 03/09/20, Jun. 2022 1.00 JPMorgan Buy USD 4,939 4,939
444,000 Government of Turkey, seniorbond, 11.875%, 01/15/30, Dec.2021 1.00 JPMorgan Buy USD 22,306 22,305
31,000 Government of Turkey, seniorbond, 11.875%, 01/15/30, Jun.2022 1.00 JPMorgan Buy USD 1,861 628
203,124 Korea Treasury Bond, senior note,7.125%, 04/16/19, Dec. 2021 1.00 JPMorgan Buy USD (4,271) (4,271)
29,282 Korea Treasury Bond, senior note,7.125%, 04/16/19, Dec. 2022 1.00 JPMorgan Buy USD (673) (31)
385,000 Government of Russia, seniorbond, Reg S, 7.50%, 03/31/30,Dec. 2021 1.00 JPMorgan Sell USD (1,678) 12,202
66,000 Government of South Africa,5.50%, 03/09/20, Dec. 2022 1.00 JPMorgan Sell USD (2,691) (2,691)
103,000 Government of Turkey, seniorbond, 11.875%, 01/15/30, Dec.2022 1.00 JPMorgan Sell USD (7,448) (2,927)
21,178 38,729
Franklin K2 Long Short Credit Fund
Nominal Description Interestpaid/received
%
Counterparty Buy/SellProtection
Tradingcurrency
MarketvalueUSD
Unrealisedprofit/(loss)
USD
198,000 Lloyds Bank PLC, 0.00%,02/20/49, Dec. 2022 1.00 Bank of America Buy EUR (982) 1,729
228,000 Avon Products Inc., senior note,6.50%, 03/01/19, Mar. 2020 5.00 Barclays Bank Buy USD (1,722) 6,922
462,000 Dell Inc., senior bond, 7.10%,04/15/28, Jun. 2023 1.00 Barclays Bank Buy USD 28,809 (2,946)
58,000 Hertz Corp., senior note, 5.875%,10/15/20, Jun. 2020 5.00 Barclays Bank Buy USD (9) 337
86,000 Hertz Corp., senior note, 5.875%,10/15/20, Jun. 2023 5.00 Barclays Bank Buy USD 14,927 1,240
74,000 Hertz Corp., senior note, 7.50%,10/15/18, Jun. 2022 5.00 Barclays Bank Buy USD 9,558 (853)
42,000 Pitney Bowes Inc., senior bond,6.25%, 03/15/19, Jun. 2023 1.00 Barclays Bank Buy USD 6,141 308
38,000 Weatherford International Ltd.,senior note, 4.50%, 04/15/22,Jun. 2021 1.00 Barclays Bank Buy USD 3,132 (2,851)
465,000 Avis Budget Car Rental LLC/Finance Inc., senior bond, Reg S,5.25%, 03/15/25, Dec. 2022 5.00 Goldman Sachs Buy USD (27,205) 16,000
FRANKLIN TEMPLETON INVESTMENT FUNDS
Notes to the Financial StatementsAt June 30, 2018 (continued)
Note 12 — Open positions on credit default swap contracts (continued)
www.franklintempleton.lu Audited Annual Report 165

As at June 30, 2018, the Company had entered into the following outstanding contracts:
Franklin K2 Long Short Credit Fund (continued)Nominal Description Interest
paid/received%
Counterparty Buy/SellProtection
Tradingcurrency
MarketvalueUSD
Unrealisedprofit/(loss)
USD
80,000 Dean Foods Co., senior note, ResS, 6.50%, 03/15/23, Dec. 2022 5.00 Goldman Sachs Buy USD (4,741) 623
139,000 Dean Foods Co., senior note, ResS, 6.50%, 03/15/23, Jun. 2023 5.00 Goldman Sachs Buy USD (6,615) (150)
360,000 Ford Motor Co., senior note,4.346%, 12/08/26, Dec. 2022 5.00 Goldman Sachs Buy USD (57,459) 15,882
186,000 Ford Motor Credit Co. LLC, seniornote, 5.00%, 05/15/18, Dec.2022 5.00 Goldman Sachs Buy USD (31,267) 6,626
56,000 Hertz Corp., senior note, 5.875%,10/15/20, Jun. 2020 5.00 Goldman Sachs Buy USD (9) 53
152,000 Hertz Corp., senior note, 5.875%,10/15/20, Jun. 2022 5.00 Goldman Sachs Buy USD 19,633 8,929
387,000 Hertz Corp., senior note, 5.875%,10/15/20, Dec. 2022 5.00 Goldman Sachs Buy USD 59,248 26,371
185,000 K. Hovnanian Enterprises Inc.,secured note, second lien, 144A,10.50%, 07/15/24, Jun. 2023 5.00 Goldman Sachs Buy USD 32,566 1,522
160,000 Kohl’s Corp., senior bond, 4.00%,11/01/21, Jun. 2023 1.00 Goldman Sachs Buy USD 1,540 (2,096)
480,000 Kohl’s Corp., senior bond,6.875%, 12/15/37, Jun. 2023 1.00 Goldman Sachs Buy USD 4,621 (4,804)
281,997 MBIA Inc., senior bond, 6.625%,10/01/28, Dec. 2020 5.00 Goldman Sachs Buy USD (6,703) (29,656)
70,000 Pitney Bowes Inc., senior bond,6.25%, 03/15/19, Jun. 2023 1.00 Goldman Sachs Buy USD 10,235 272
166,000 RR Donnelley & Sons Co., seniornote, 7.875%, 03/15/21, Dec.2022 5.00 Goldman Sachs Buy USD 12,136 5,496
50,000 RR Donnelley & Sons Co., seniornote, 7.875%, 03/15/21, Jun.2023 5.00 Goldman Sachs Buy USD 4,772 2,167
91,000 Transocean Inc., senior bond,3.80%, 10/15/22, Jun. 2023 5.00 Goldman Sachs Buy USD (6,276) (1,680)
241,000 Weatherford International Ltd.,senior note, 4.50%, 04/15/22,Jun. 2021 1.00 Goldman Sachs Buy USD 19,862 (17,791)
280,000 American Axle &Manufacturing Inc., senior bond,6.625%, 10/15/22, Dec. 2022 5.00 JPMorgan Buy USD (28,332) 7,308
166,000 Avis Budget Car Rental LLC/Finance Inc., senior bond, Reg S,5.25%, 03/15/25, Dec. 2022 5.00 JPMorgan Buy USD (9,712) 4,166
98,000 Avis Budget Car Rental LLC/Finance Inc., senior bond, Reg S,5.25%, 03/15/25, Jun. 2023 5.00 JPMorgan Buy USD (4,165) 4,285
381,000 Avon Products Inc., senior note,6.50%, 03/01/19, Mar. 2020 5.00 JPMorgan Buy USD (2,877) 11,728
595,000 Caterpillar Financial ServicesCorp., senior note, 2.25%,12/01/19, Dec. 2021 1.00 JPMorgan Buy USD (12,530) (3,809)
2,350,000 CDX.NA.HY.27, Version 3, Dec.2021 5.00 JPMorgan Buy USD (166,261) (166,267)
1,500,000 CDX.NA.HY.28, Version 2, Jun.2022 5.00 JPMorgan Buy USD (107,019) (107,019)
225,000 Dynegy Inc., senior note, 6.75%,11/01/19, Dec. 2021 5.00 JPMorgan Buy USD (28,284) (33,338)
396,000 Glencore Finance Europe Ltd.,senior bond, Reg S, 6.50%,02/27/19, Dec. 2022 5.00 JPMorgan Buy EUR (68,822) 21,620
342,000 Government of Mexico, seniornote, 4.15%, 03/28/27, Jun.2023 1.00 JPMorgan Buy USD 5,141 4,654
300,000 Government of South Africa,5.50%, 03/09/20, Dec. 2021 1.00 JPMorgan Buy USD 6,792 (11,623)
427,000 Government of South Africa,5.50%, 03/09/20, Jun. 2022 1.00 JPMorgan Buy USD 12,939 12,939
585,000 Government of Turkey, seniorbond, 11.875%, 01/15/30, Dec.2021 1.00 JPMorgan Buy USD 29,389 29,389
FRANKLIN TEMPLETON INVESTMENT FUNDS
Notes to the Financial StatementsAt June 30, 2018 (continued)
Note 12 — Open positions on credit default swap contracts (continued)
166 Audited Annual Report www.franklintempleton.lu

As at June 30, 2018, the Company had entered into the following outstanding contracts:
Franklin K2 Long Short Credit Fund (continued)Nominal Description Interest
paid/received%
Counterparty Buy/SellProtection
Tradingcurrency
MarketvalueUSD
Unrealisedprofit/(loss)
USD
181,000 Government of Turkey, seniorbond, 11.875%, 01/15/30, Jun.2022 1.00 JPMorgan Buy USD 10,865 10,865
111,000 Hertz Corp., senior note, 5.875%,10/15/20, Jun. 2023 5.00 JPMorgan Buy USD 19,266 1,058
13,000 Hertz Corp., senior note, 7.50%,10/15/18, Jun. 2022 5.00 JPMorgan Buy USD 1,679 (545)
4,283,000 ITOCHU Corp., senior note,1.91%, 09/13/19, Jun. 2022 1.00 JPMorgan Buy JPY (1,146) 197
3,783,000 JFE Holdings Inc., senior note,1.326%, 06/08/21, Jun. 2022 1.00 JPMorgan Buy JPY (894) 309
125,000 John Deere Capital Corp., seniornote, 2.80%, 03/04/21, Dec.2021 1.00 JPMorgan Buy USD (2,558) (188)
42,000 K. Hovnanian Enterprises Inc.,secured note, second lien, 144A,10.50%, 07/15/24, Jun. 2023 5.00 JPMorgan Buy USD 7,393 1,309
275,006 Korea Treasury Bond, senior note,7.125%, 04/16/19, Dec. 2021 1.00 JPMorgan Buy USD (5,783) 1,694
132,857 Korea Treasury Bond, senior note,7.125%, 04/16/19, Dec. 2022 1.00 JPMorgan Buy USD (3,054) (3,054)
198,000 Lloyds Bank PLC, 0.00%,02/20/49, Dec. 2022 1.00 JPMorgan Buy EUR (982) 1,942
6,257,000 Marubeni Corp., senior note,1.50%, 06/14/21, Jun. 2022 1.00 JPMorgan Buy JPY (1,488) 195
13,223,000 Mitsui OSK Lines Ltd., seniornote, 1.139%, 07/12/22, Jun.2022 1.00 JPMorgan Buy JPY (463) 769
175,000 Rallye SA, senior note, Reg S,7.625%, 11/04/16, Dec. 2019 5.00 JPMorgan Buy EUR 24,661 19,200
3,330,000 Sharp Corp., senior note, 1.604%,09/13/19, Dec. 2018 1.00 JPMorgan Buy JPY (99) (626)
100,000 United Rentals NorthAmerica Inc., senior bond,6.125%, 06/15/23, Dec. 2021 5.00 JPMorgan Buy USD (13,738) 1,542
189,000 Weatherford International Ltd.,senior note, 4.50%, 04/15/22,Jun. 2021 1.00 JPMorgan Buy USD 15,576 (14,812)
140,000 Pitney Bowes Inc., senior bond,6.25%, 03/15/19, Jun. 2023 1.00 Morgan Stanley Buy USD 20,469 543
230,000 Transocean Inc., senior bond,7.375%, 04/15/18, Dec. 2021 1.00 Morgan Stanley Buy USD 9,622 (28,347)
86,000 Weatherford International Ltd.,senior note, 4.50%, 04/15/22,Jun. 2021 1.00 Morgan Stanley Buy USD 7,087 (8,438)
500,000 Government of Russia, seniorbond, Reg S, 7.50%, 03/31/30,Dec. 2021 1.00 JPMorgan Sell USD (2,179) 23,226
119,000 Government of Russia, seniorbond, Reg S, 7.50%, 03/31/30,Jun. 2022 1.00 JPMorgan Sell USD (895) 2,422
54,000 Government of South Africa,5.50%, 03/09/20, Dec. 2022 1.00 JPMorgan Sell USD (2,202) (2,202)
124,000 Government of Turkey, seniorbond, 11.875%, 01/15/30, Dec.2022 1.00 JPMorgan Sell USD (8,966) (8,966)
(217,378) (196,224)
FRANKLIN TEMPLETON INVESTMENT FUNDS
Notes to the Financial StatementsAt June 30, 2018 (continued)
Note 12 — Open positions on credit default swap contracts (continued)
www.franklintempleton.lu Audited Annual Report 167

As at June 30, 2018, the Company had entered into the following outstanding contracts:
Franklin Strategic Income Fund
Nominal Description Interestpaid/received
%
Counterparty Buy/SellProtection
Tradingcurrency
MarketvalueUSD
Unrealisedprofit/(loss)
USD
1,300,000 Ally Financial Inc., senior note,7.50%, 09/15/20, Dec. 2022 5.00 Citigroup Buy USD (197,864) 46,661
500,000 CSC Holdings LLC, senior bond,7.625%, 07/15/18, Sep. 2018 5.00 Goldman Sachs Buy USD (5,449) 23,789
500,000 CSC Holdings LLC, senior bond,7.625%, 07/15/18, Mar. 2019 5.00 Goldman Sachs Buy USD (16,832) 10,661
400,000 Springleaf Finance Corp., seniornote, J, 6.90%, 12/15/17, Jun.2020 5.00 Goldman Sachs Buy USD (33,107) (11,595)
2,300,000 Ally Financial Inc., senior note,7.50%, 09/15/20, Dec. 2022 5.00 JPMorgan Buy USD (350,067) 85,146
1,400,000 Government of Mexico, seniornote, 4.15%, 03/28/27, Jun.2023 1.00 Barclays Bank Sell USD (21,429) 5,054
2,500,000 CDX.NA.HY.30, Jun. 2023 5.00 Citigroup Sell USD 144,393 (10,382)830,000 Citibank Bespoke 58 IG/42 HY
Equity Tranche 0-3% Index, Jun.2019 1.00 Citigroup Sell USD (70,918) 153,182
5,200,000 Citibank Bespoke Broker Index3-7% Tranche, Jun. 2019 1.30 Citigroup Sell USD (33,140) (33,140)
5,000,000 Citibank Bespoke Cambridge Dec19 0-3% Equity Tranche Index,Dec. 2019 1.00 Citigroup Sell USD (1,025,557) (230,557)
1,870,000 Citibank Bespoke Verona Dec 19Index, Dec. 2019 1.00 Citigroup Sell USD (332,296) 125,854
5,500,000 Citibank Bespoke Verona Dec 19Index, Dec. 2019 0.40 Citigroup Sell USD (1,736) (1,736)
5,200,000 Government of Brazil, senior bond,4.25%, 01/07/25, Jun. 2023 1.00 Citigroup Sell USD (384,394) (79,138)
6,050,000 Government of Colombia, seniorbond, 10.375%, 01/28/33, Jun.2023 1.00 Citigroup Sell USD (65,254) (48,588)
1,600,000 Government of Mexico, seniornote, 4.15%, 03/28/27, Jun.2023 1.00 Citigroup Sell USD (24,490) (5,747)
3,350,000 MCDX.NA.30, Jun. 2023 1.00 Citigroup Sell USD 70,757 (10,958)64,600,000 LCDX.NA.21, Dec. 2018 2.50 Credit Suisse International Sell USD 399,124 (2,579,125)
4,600,000 CDX.EM.29, Jun. 2023 1.00 JPMorgan Sell USD (183,158) (73,618)750,000 CDX.NA.IG.24, Jun. 2025 1.00 JPMorgan Sell USD 321 2,123
3,000,000 Government of Indonesia, Reg S,5.875%, 03/13/20, Jun. 2023 1.00 JPMorgan Sell USD (49,459) (11,810)
2,700,000 Government of Mexico, seniornote, 4.15%, 03/28/27, Jun.2023 1.00 JPMorgan Sell USD (41,327) (20,575)
8,050,000 Government of Argentina, seniornote, Reg S, 7.625%, 04/22/46,Jun. 2023 5.00 Morgan Stanley Sell USD 125,619 (721,484)
(2,096,263) (3,385,983)
Franklin U.S. Low Duration Fund
Nominal Description Interestpaid/received
%
Counterparty Buy/SellProtection
Tradingcurrency
MarketvalueUSD
Unrealisedprofit/(loss)
USD
420,000 Best Buy Co. Inc., senior bond,5.50%, 03/15/21, Jun. 2022 5.00 Barclays Bank Buy USD (69,399) 1,430
700,000 Ally Financial Inc., senior note,7.50%, 09/15/20, Dec. 2022 5.00 Citigroup Buy USD (106,542) 25,125
1,280,000 Best Buy Co. Inc., senior bond,5.50%, 03/15/21, Jun. 2022 5.00 Citigroup Buy USD (211,502) 1,490
392,000 Government of Turkey, seniorbond, 11.875%, 01/15/30, Jun.2023 1.00 Citigroup Buy USD 33,037 14,912
3,050,000 Tenet Healthcare Corp., seniornote, 6.875%, 11/15/31, Mar.2019 5.00 Citigroup Buy USD (100,608) 57,131
5,000,000 CSC Holdings LLC, senior bond,7.625%, 07/15/18, Mar. 2019 5.00 Goldman Sachs Buy USD (168,324) 56,053
FRANKLIN TEMPLETON INVESTMENT FUNDS
Notes to the Financial StatementsAt June 30, 2018 (continued)
Note 12 — Open positions on credit default swap contracts (continued)
168 Audited Annual Report www.franklintempleton.lu

As at June 30, 2018, the Company had entered into the following outstanding contracts:
Franklin U.S. Low Duration Fund (continued)Nominal Description Interest
paid/received%
Counterparty Buy/SellProtection
Tradingcurrency
MarketvalueUSD
Unrealisedprofit/(loss)
USD
1,300,000 Ally Financial Inc., senior note,7.50%, 09/15/20, Dec. 2022 5.00 JPMorgan Buy USD (197,864) 48,166
700,000 Best Buy Co. Inc., senior bond,5.50%, 03/15/21, Jun. 2022 5.00 JPMorgan Buy USD (115,665) 9,877
905,000 Nabors Industries Inc., seniornote, 9.25%, 01/15/19, Jun.2020 1.00 JPMorgan Buy USD (3,009) (25,826)
2,475,000 The AES Corp., senior note, FRN,4.20178%, 06/01/19, Jun. 2022 5.00 JPMorgan Buy USD (388,400) (40,059)
1,000,000 Government of Colombia, seniorbond, 10.375%, 01/28/33, Jun.2023 1.00 Barclays Bank Sell USD (10,786) (4,300)
2,800,000 CDX.EM.29, Jun. 2023 1.00 Citigroup Sell USD (111,487) (55,078)3,575,000 CDX.NA.HY.29, Dec. 2022 5.00 Citigroup Sell USD 220,960 (15,651)3,300,000 CDX.NA.HY.30, Jun. 2023 5.00 Citigroup Sell USD 190,599 (18,275)5,400,000 Citibank Bespoke 1Y (Dec-18) HY
6-10% Mezz Axe CDX Index, Dec.2018 0.63 Citigroup Sell USD (6,069) (6,069)
580,000 Citibank Bespoke 58 IG/42 HYEquity Tranche 0-3% Index, Jun.2019 1.00 Citigroup Sell USD (49,557) 107,042
900,000 Citibank Bespoke Cambridge Dec19 0-3% Equity Tranche Index,Dec. 2019 1.00 Citigroup Sell USD (184,600) (41,500)
2,300,000 Citibank Bespoke Dec-18 HongKong 3-5% Tranche Index, Dec.2018 1.00 Citigroup Sell USD 309 95,529
1,000,000 Citibank Bespoke Verona Dec 19Index, Dec. 2019 1.00 Citigroup Sell USD (177,698) 67,302
1,800,000 Citibank Bespoke Verona Dec 19Index, Dec. 2019 0.40 Citigroup Sell USD (568) (568)
1,860,000 General Electric Co., senior note,2.70%, 10/09/22, Dec. 2022 1.00 Citigroup Sell USD 20,369 2,384
1,200,000 Government of Colombia, seniorbond, 10.375%, 01/28/33, Jun.2023 1.00 Citigroup Sell USD (12,943) (9,637)
1,200,000 Government of Indonesia, Reg S,5.875%, 03/13/20, Jun. 2023 1.00 Citigroup Sell USD (19,784) (21,786)
2,500,000 Government of Mexico, seniornote, 4.15%, 03/28/27, Jun.2023 1.00 Citigroup Sell USD (38,266) (14,820)
1,800,000 Lisbon 3-7% Bespoke MezzanineTranche Index, Jun. 2019 0.79 Citigroup Sell USD (11,525) (11,525)
2,100,000 Simon Property Group LP, seniorbond, 4.375%, 03/01/21, Jun.2022 1.00 Citigroup Sell USD 40,785 34,738
3,100,000 American Tower Corp., senior note,4.50%, 01/15/18, Mar. 2021 1.00 Goldman Sachs Sell USD (12,117) 41,393
900,000 Government of Indonesia, Reg S,5.875%, 03/13/20, Jun. 2023 1.00 JPMorgan Sell USD (14,838) (3,543)
1,200,000 Government of Mexico, seniornote, 4.15%, 03/28/27, Jun.2023 1.00 JPMorgan Sell USD (18,368) (9,144)
905,000 Nabors Industries Inc., seniornote, 9.25%, 01/15/19, Jun.2022 1.00 JPMorgan Sell USD (52,441) 60,874
2,450,000 Simon Property Group LP, seniorbond, 4.375%, 03/01/21, Jun.2022 1.00 JPMorgan Sell USD 47,583 23,789
300,000 Enterprise ProductsOperating LLC, senior note,5.20%, 09/01/20, Dec. 2019 1.00 Morgan Stanley Sell USD 3,513 4,997
(1,525,205) 374,451
FRANKLIN TEMPLETON INVESTMENT FUNDS
Notes to the Financial StatementsAt June 30, 2018 (continued)
Note 12 — Open positions on credit default swap contracts (continued)
www.franklintempleton.lu Audited Annual Report 169

As at June 30, 2018, the Company had entered into the following outstanding contracts:
Franklin Diversified Balanced Fund
Purchase/Saleposition
Description Counterparty Tradingcurrency
Number ofcontracts
purchased/(sold)
CommitmentEUR
MarketvalueEUR
Unrealisedprofit/(loss)
EUR
CommodityOptionPurchase ETFS Physical Gold, Call Option, Strike
Price 126.3353, Sep. 2018 Citigroup USD 26,546 2,721,968 13,501 (3,687)
Future OptionPurchase U.S. Treasury 10 Yr. Note, Call Option,
Strike Price 119.50, Aug. 2018 Citigroup USD 149 15,327,545 137,494 47,001
Index OptionPurchase S&P 500 Index, Put Option, Strike Price
2075, Dec. 2020 Citigroup USD 19 4,420,682 138,229 (9,163)Purchase S&P 500 Index, Put Option, Strike Price
2000, Dec. 2020 Citigroup USD 19 4,420,681 117,088 (47,542)Purchase Euro STOXX 50 Index, Call Option, Strike
Price 3775, Sep. 2018 JPMorgan EUR 494 16,774,264 7,904 (25,777)Purchase S&P 500 Index, Call Option, Strike Price
2975, Sep. 2018 JPMorgan USD 132 30,712,102 14,687 (11,900)Purchase S&P 500 Index, Put Option, Strike Price
2025, Dec. 2020Merrill LynchInternational USD 19 4,420,681 125,545 (13,110)
Purchase S&P 500 Index, Put Option, Strike Price2050, Dec. 2020
Merrill LynchInternational USD 39 9,074,030 270,548 (33,062)
Purchase S&P 500 Index, Put Option, Strike Price2075, Dec. 2020
Merrill LynchInternational USD 19 4,420,682 138,229 277
Sale Euro STOXX 50 Index, Call Option, StrikePrice 3485.54, Jul. 2018 Barclays Bank EUR (1,232) 4,183,379 (3,299) 6,803
Sale FTSE MIB Index, Call Option, StrikePrice 23500 , Sep. 2018 JPMorgan EUR (79) 4,271,188 (22,910) 40,634
786,021 (92,840)
937,016 (49,526)
Franklin Diversified Conservative Fund
Purchase/Saleposition
Description Counterparty Tradingcurrency
Number ofcontracts
purchased/(sold)
CommitmentEUR
MarketvalueEUR
Unrealisedprofit/(loss)
EUR
CommodityOptionPurchase ETFS Physical Gold, Call Option, Strike
Price 126.3353, Sep. 2018 Citigroup USD 34,757 3,563,905 17,676 (4,828)
Future OptionPurchase U.S. Treasury 10 Yr. Note, Call Option,
Strike Price 119.50, Aug. 2018 Citigroup USD 198 20,368,147 182,710 62,458
Index OptionPurchase S&P 500 Index, Put Option, Strike Price
2075, Dec. 2020 Citigroup USD 11 2,559,342 80,027 (5,306)Purchase S&P 500 Index, Put Option, Strike Price
2000, Dec. 2020 Citigroup USD 11 2,559,342 67,788 (27,524)Purchase Euro STOXX 50 Index, Call Option, Strike
Price 3775, Sep. 2018 JPMorgan EUR 431 14,635,036 6,896 (22,490)Purchase S&P 500 Index, Call Option, Strike Price
2975, Sep. 2018 JPMorgan USD 115 26,756,755 12,796 (10,368)Purchase S&P 500 Index, Put Option, Strike Price
2025, Dec. 2020Merrill LynchInternational USD 11 2,559,342 72,684 (7,590)
Purchase S&P 500 Index, Put Option, Strike Price2050, Dec. 2020
Merrill LynchInternational USD 23 5,351,351 159,554 (19,439)
Purchase S&P 500 Index, Put Option, Strike Price2075, Dec. 2020
Merrill LynchInternational USD 11 2,559,342 80,027 160
Sale Euro STOXX 50 Index, Call Option, StrikePrice 3485.54, Jul. 2018 Barclays Bank EUR (412) 1,398,987 (1,103) 2,275
Sale FTSE MIB Index, Call Option, StrikePrice 23500 , Sep. 2018 JPMorgan EUR (69) 3,730,532 (20,010) 35,491
458,659 (54,791)
659,045 2,839
FRANKLIN TEMPLETON INVESTMENT FUNDS
Notes to the Financial StatementsAt June 30, 2018 (continued)
Note 13 — Open positions on option contracts
170 Audited Annual Report www.franklintempleton.lu

As at June 30, 2018, the Company had entered into the following outstanding contracts:
Franklin Diversified Dynamic Fund
Purchase/Saleposition
Description Counterparty Tradingcurrency
Number ofcontracts
purchased/(sold)
CommitmentEUR
MarketvalueEUR
Unrealisedprofit/(loss)
EUR
CommodityOptionPurchase ETFS Physical Gold, Call Option, Strike
Price 126.3353, Sep. 2018 Citigroup USD 13,339 1,367,751 6,784 (1,853)
Future OptionPurchase U.S. Treasury 10 Yr. Note, Call Option,
Strike Price 119.50, Aug. 2018 Citigroup USD 74 7,612,338 68,285 23,343
Index OptionPurchase S&P 500 Index, Put Option, Strike Price
2075, Dec. 2020 Citigroup USD 13 3,024,677 94,578 (6,270)Purchase S&P 500 Index, Put Option, Strike Price
2000, Dec. 2020 Citigroup USD 13 3,024,677 80,113 (32,529)Purchase Euro STOXX 50 Index, Call Option, Strike
Price 3775, Sep. 2018 JPMorgan EUR 325 11,035,700 5,200 (16,958)Purchase S&P 500 Index, Call Option, Strike Price
2975, Sep. 2018 JPMorgan USD 87 20,242,067 9,680 (7,843)Purchase S&P 500 Index, Put Option, Strike Price
2025, Dec. 2020Merrill LynchInternational USD 13 3,024,677 85,899 (8,970)
Purchase S&P 500 Index, Put Option, Strike Price2050, Dec. 2020
Merrill LynchInternational USD 27 6,282,021 187,303 (22,845)
Purchase S&P 500 Index, Put Option, Strike Price2075, Dec. 2020
Merrill LynchInternational USD 13 3,024,677 94,578 190
Sale Euro STOXX 50 Index, Call Option, StrikePrice 3485.54, Jul. 2018 Barclays Bank EUR (841) 2,855,700 (2,252) 4,644
Sale FTSE MIB Index, Call Option, StrikePrice 23500 , Sep. 2018 JPMorgan EUR (52) 2,811,415 (15,080) 26,747
540,019 (63,834)
615,088 (42,344)
Franklin Flexible Alpha Bond Fund
Purchase/Saleposition
Description Counterparty Tradingcurrency
Number ofcontracts
purchased/(sold)
CommitmentUSD
MarketvalueUSD
Unrealisedprofit/(loss)
USD
SwaptionPurchase CDX.NA.HY.30, Strike Price 105,
Jul. 2018 Citigroup USD 6,500,000 6,500,000 19,987 (49,563)Purchase CDX.NA.HY.30, Strike Price 106.50,
Sep. 2018 Citigroup USD 8,500,000 8,500,000 16,651 (5,449)Purchase CDX.NA.IG.30, Strike Price 70,
Sep. 2018 Citigroup USD 27,000,000 27,000,000 72,954 8,154Purchase Interest rate swap
Receiving floating 3-month USD LIBOR /Paying fixed rate 3.06%, Oct. 2018 Citigroup USD 21,000,000 21,000,000 164,262 (45,370)
Purchase Interest rate swapReceiving floating 3-month USD LIBOR /Paying fixed rate 3.26%, Sep. 2018 HSBC Bank USD 10,800,000 10,800,000 24,365 (71,199)
Sale CDX.NA.HY.30, Strike Price 101.50,Jul. 2018 Citigroup USD (6,500,000) 6,500,000 (3,114) 25,811
Sale CDX.NA.IG.30, Strike Price 90,Sep. 2018 Citigroup USD (27,000,000) 27,000,000 (30,402) (3,402)
264,703 (141,018)
Franklin Global Multi-Asset Income Fund
Purchase/Saleposition
Description Counterparty Tradingcurrency
Number ofcontracts
purchased/(sold)
CommitmentEUR
MarketvalueEUR
Unrealisedprofit/(loss)
EUR
CommodityOptionPurchase ETFS Physical Gold, Call Option, Strike
Price 126.3353, Sep. 2018 Citigroup USD 31,400 3,219,686 15,969 (4,361)
Equity OptionSale DP World Ltd., Call Option, Strike Price
24.57, Jul. 2018 JPMorgan USD (15,982) 314,620 (718) 646Sale Sempra Energy, Call Option, Strike Price
121.559, Jul. 2018 JPMorgan USD (3,278) 325,766 (813) 293
(1,531) 939
FRANKLIN TEMPLETON INVESTMENT FUNDS
Notes to the Financial StatementsAt June 30, 2018 (continued)
Note 13 — Open positions on option contracts (continued)
www.franklintempleton.lu Audited Annual Report 171

As at June 30, 2018, the Company had entered into the following outstanding contracts:
Franklin Global Multi-Asset Income Fund (continued)Purchase/Saleposition
Description Counterparty Tradingcurrency
Number ofcontracts
purchased/(sold)
CommitmentEUR
MarketvalueEUR
Unrealisedprofit/(loss)
EUR
Future OptionPurchase U.S. Treasury 10 Yr. Note, Call Option,
Strike Price 119.50, Aug. 2018 Citigroup USD 181 18,619,367 167,022 57,095
Index OptionPurchase S&P 500 Index, Put Option, Strike Price
2075, Dec. 2020 Citigroup USD 21 4,886,016 152,780 (10,127)Purchase S&P 500 Index, Put Option, Strike Price
2000, Dec. 2020 Citigroup USD 20 4,653,349 123,251 (50,044)Purchase Euro STOXX 50 Index, Call Option, Strike
Price 3775, Sep. 2018 JPMorgan EUR 594 20,169,864 9,504 (30,995)Purchase S&P 500 Index, Call Option, Strike Price
2975, Sep. 2018 JPMorgan USD 158 36,761,455 17,580 (14,244)Purchase S&P 500 Index, Put Option, Strike Price
2025, Dec. 2020Merrill LynchInternational USD 20 4,653,349 132,152 (13,800)
Purchase S&P 500 Index, Put Option, Strike Price2050, Dec. 2020
Merrill LynchInternational USD 42 9,772,032 291,360 (35,473)
Purchase S&P 500 Index, Put Option, Strike Price2075, Dec. 2020
Merrill LynchInternational USD 20 4,653,349 145,504 291
Sale Euro STOXX 50 Index, Call Option, StrikePrice 3485.54, Jul. 2018 Barclays Bank EUR (1,065) 3,616,314 (2,852) 5,881
Sale FTSE MIB Index, Call Option, StrikePrice 23500 , Sep. 2018 JPMorgan EUR (95) 5,136,239 (27,550) 48,864
841,729 (99,647)
1,023,189 (45,974)
Franklin Income Fund
Purchase/Saleposition
Description Counterparty Tradingcurrency
Number ofcontracts
purchased/(sold)
CommitmentUSD
MarketvalueUSD
Unrealisedprofit/(loss)
USD
Equity OptionSale Medtronic PLC, Call Option, Strike Price
90, Aug. 2018 Citigroup USD (1,500) 12,841,500 (75,000) 34,727Sale General Motors Co., Call Option, Strike
Price 45, Jul. 2018Merrill LynchInternational USD (2,000) 7,880,000 (10,000) 95,923
Sale Ford Motor Co., Call Option, Strike Price12.87, Sep. 2018
SusquehannaFinancial USD (7,222) 7,994,754 (43,332) 86,389
Sale Anadarko Petroleum Corp., Call Option,Strike Price 75, Aug. 2018 UBS USD (500) 3,662,500 (142,500) (59,400)
(270,832) 157,639
Franklin K2 Alternative Strategies Fund
Purchase/Saleposition
Description Counterparty Tradingcurrency
Number ofcontracts
purchased/(sold)
CommitmentUSD
MarketvalueUSD
Unrealisedprofit/(loss)
USD
Currency OptionPurchase EUR/GBP, Put Option, Strike Price
0.8995, Jan. 2019 Deutsche Bank EUR 1,316,000 1,337,997 39,502 (6,415)
Equity OptionPurchase Allergan PLC, Call Option, Strike Price
165, Jan. 2019 JPMorgan USD 116 1,933,952 182,410 62,543Purchase Allergan PLC, Call Option, Strike Price
170, Aug. 2018 JPMorgan USD 150 2,500,800 92,250 45,194Purchase Allergan PLC, Call Option, Strike Price
185, Jan. 2019 JPMorgan USD 427 7,118,944 301,035 (108,624)Purchase AT&T Inc., Call Option, Strike Price 34,
Sep. 2018 JPMorgan USD 332 1,066,052 16,268 (6,841)Purchase AT&T Inc., Call Option, Strike Price 35,
Jul. 2018 JPMorgan USD 896 2,877,056 2,240 (21,512)Purchase AT&T Inc., Call Option, Strike Price 38,
Jul. 2018 JPMorgan USD 341 1,094,951 341 (51,955)Purchase Bunge Ltd., Call Option, Strike Price 80,
Jul. 2018 JPMorgan USD 77 536,767 1,348 (20,515)Purchase Dell Technologies Inc., V, Call Option,
Strike Price 90, Jul. 2018 JPMorgan USD 116 981,128 20,590 (21,424)Purchase The Walt Disney Co., Call Option, Strike
Price 110, Sep. 2018 JPMorgan USD 201 2,106,681 42,411 17,278
FRANKLIN TEMPLETON INVESTMENT FUNDS
Notes to the Financial StatementsAt June 30, 2018 (continued)
Note 13 — Open positions on option contracts (continued)
172 Audited Annual Report www.franklintempleton.lu

As at June 30, 2018, the Company had entered into the following outstanding contracts:
Franklin K2 Alternative Strategies Fund (continued)Purchase/Saleposition
Description Counterparty Tradingcurrency
Number ofcontracts
purchased/(sold)
CommitmentUSD
MarketvalueUSD
Unrealisedprofit/(loss)
USD
Purchase Time Warner Inc., Call Option, StrikePrice 95, Aug. 2018 JPMorgan USD 380 5,509,348 263,549 60,993
Purchase Time Warner Inc., Put Option, StrikePrice 90, Jul. 2018 JPMorgan USD 77 1,116,368 385 (21,409)
Purchase Twenty-First Century Fox Inc., A, CallOption, Strike Price 35, Jul. 2018 JPMorgan USD 2 9,938 2,980 1,717
Purchase Twenty-First Century Fox Inc., A, CallOption, Strike Price 41, Jan. 2019 JPMorgan USD 174 864,606 166,170 106,772
Purchase Twenty-First Century Fox Inc., A, CallOption, Strike Price 45, Jul. 2018 JPMorgan USD 437 2,171,453 211,945 152,715
Purchase Twenty-First Century Fox Inc., A, CallOption, Strike Price 45, Aug. 2018 JPMorgan USD 1,495 7,428,655 631,638 (40,925)
Purchase Advanced Micro Devices Inc., PutOption, Strike Price 15, Jul. 2018 Morgan Stanley USD 101 151,399 6,717 (901)
Purchase Atlas Air Worldwide Holdings Inc., CallOption, Strike Price 77.5, Jul. 2018 Morgan Stanley USD 36 258,120 990 (1,874)
Purchase Bayer AG, Call Option, Strike Price98.41, Sep. 2018 Morgan Stanley EUR 616 8,061,789 116,959 (171,897)
Purchase Cypress Semiconductor Corp., PutOption, Strike Price 16, Jul. 2018 Morgan Stanley USD 50 77,900 3,500 912
Purchase Dermira Inc., Put Option, Strike Price 7,Jul. 2018 Morgan Stanley USD 176 161,920 1,320 (3,762)
Purchase Innoviva Inc., Put Option, Strike Price12.5, Jul. 2018 Morgan Stanley USD 10 13,800 125 (135)
Purchase Innoviva Inc., Put Option, Strike Price12.5, Aug. 2018 Morgan Stanley USD 89 122,820 2,893 (547)
Purchase J2 Global Inc., Call Option, Strike Price90, Jul. 2018 Morgan Stanley USD 10 86,610 775 (517)
Purchase Navistar International Corp., Call Option,Strike Price 45, Jul. 2018 Morgan Stanley USD 21 85,512 998 (588)
Purchase Redwood Trust Inc., Put Option, StrikePrice 12.5, Oct. 2018 Morgan Stanley USD 272 447,984 4,080 (1,261)
Purchase RingCentral Inc., A, Call Option, StrikePrice 85, Jul. 2018 Morgan Stanley USD 13 91,455 163 (1,702)
Purchase Teladoc Inc., Put Option, Strike Price 30,Jul. 2018 Morgan Stanley USD 82 476,010 410 (2,545)
Purchase Telecom Italia SpA, Call Option, StrikePrice 0.66, Dec. 2018 Morgan Stanley EUR 4,326 3,221,599 211,170 (28,596)
Purchase Tesla Inc., Put Option, Strike Price 200,Jul. 2018 Morgan Stanley USD 19 651,605 751 (6,204)
Purchase Thyssenkrupp AG, Call Option, StrikePrice 25.5, Sep. 2018 Morgan Stanley EUR 2,859 8,125,325 56,759 (176,324)
Purchase Twitter Inc., Call Option, Strike Price 50,Jul. 2018 Morgan Stanley USD 10 43,670 240 (997)
Purchase Vivendi SA, Call Option, Strike Price 23,Sep. 2018 Morgan Stanley EUR 1,868 4,583,203 76,352 (109,980)
Purchase Weibo Corp., ADR, Call Option, StrikePrice 115, Jul. 2018 Morgan Stanley USD 26 230,776 195 (9,985)
Purchase Wright Medical Group NV, Put Option,Strike Price 17.5, Nov. 2018 Morgan Stanley USD 156 404,976 3,120 (162)
Sale Allergan PLC, Put Option, Strike Price120, Jan. 2019 JPMorgan USD (116) 1,933,952 (22,446) 12,770
Sale Bunge Ltd., Put Option, Strike Price 70,Jul. 2018 JPMorgan USD (59) 411,289 (10,767) 8,947
Sale Time Warner Inc., Put Option, StrikePrice 85, Jul. 2018 JPMorgan USD (141) 2,044,258 (302) 19,003
Sale Twenty-First Century Fox Inc., A, CallOption, Strike Price 46, Jan. 2019 JPMorgan USD (174) 864,606 (100,050) (79,469)
Sale Apple Inc., Call Option, Strike Price 190,Aug. 2018 Morgan Stanley USD (20) 370,220 (8,400) 440
Sale Atlas Air Worldwide Holdings Inc., PutOption, Strike Price 70, Jul. 2018 Morgan Stanley USD (36) 258,120 (4,140) (1,496)
Sale Bayer AG, Put Option, Strike Price90.54, Sep. 2018 Morgan Stanley EUR (290) 3,795,323 (82,593) (30,883)
Sale J2 Global Inc., Put Option, Strike Price80, Jul. 2018 Morgan Stanley USD (10) 86,610 (350) 496
Sale Navistar International Corp., Put Option,Strike Price 40, Jul. 2018 Morgan Stanley USD (21) 85,512 (2,573) (130)
Sale RingCentral Inc., A, Put Option, StrikePrice 75, Jul. 2018 Morgan Stanley USD (13) 91,455 (6,825) (5,053)
FRANKLIN TEMPLETON INVESTMENT FUNDS
Notes to the Financial StatementsAt June 30, 2018 (continued)
Note 13 — Open positions on option contracts (continued)
www.franklintempleton.lu Audited Annual Report 173

As at June 30, 2018, the Company had entered into the following outstanding contracts:
Franklin K2 Alternative Strategies Fund (continued)Purchase/Saleposition
Description Counterparty Tradingcurrency
Number ofcontracts
purchased/(sold)
CommitmentUSD
MarketvalueUSD
Unrealisedprofit/(loss)
USD
Sale Twitter Inc., Put Option, Strike Price 42,Jul. 2018 Morgan Stanley USD (10) 43,670 (1,040) (144)
2,183,591 (438,577)
Index OptionPurchase S&P 500 Index, Call Option, Strike Price
3200, Sep. 2018 JPMorgan USD 293 79,648,241 5,860 (161,445)Purchase S&P 500 Index, Put Option, Strike Price
2650, Aug. 2018 JPMorgan USD 281 76,386,197 827,545 (36,384)Purchase Euro STOXX 50 Index, Put Option, Strike
Price 3400, Sep. 2018 Morgan Stanley EUR 355 14,083,733 417,050 (105,262)Purchase FTSE MIB Index, Put Option, Strike
Price 20500, Sep. 2018 Morgan Stanley EUR 105 6,632,601 142,545 (151,924)Purchase S&P 500 Index, Put Option, Strike Price
2600, Jul. 2018 Morgan Stanley USD 685 186,208,345 589,100 (435,164)Purchase S&P 500 Index, Put Option, Strike Price
2625, Jul. 2018 Morgan Stanley USD 205 55,726,583 226,525 (38,570)Purchase STOXX Europe 600 Telecommunications
Price Index, Put Option, Strike Price260, Sep. 2018 Morgan Stanley EUR 652 9,525,099 502,528 72,403
Sale S&P 500 Index, Put Option, Strike Price2500, Aug. 2018 JPMorgan USD (155) 42,134,735 (183,675) (14,584)
Sale S&P 500 Index, Put Option, Strike Price2550, Aug. 2018 JPMorgan USD (126) 34,251,462 (197,820) (45,332)
Sale Euro STOXX 50 Index, Put Option, StrikePrice 3200, Sep. 2018 Morgan Stanley EUR (355) 14,083,733 (179,508) 81,081
Sale FTSE MIB Index, Put Option, StrikePrice 19000, Sep. 2018 Morgan Stanley EUR (105) 6,632,601 (62,536) 106,797
Sale STOXX Europe 600 TelecommunicationsPrice Index, Put Option, Strike Price240, Sep. 2018 Morgan Stanley EUR (652) 9,525,099 (129,439) 35,439
1,958,175 (692,945)
4,181,268 (1,137,937)
Franklin K2 Long Short Credit Fund
Purchase/Saleposition
Description Counterparty Tradingcurrency
Number ofcontracts
purchased/(sold)
CommitmentUSD
MarketvalueUSD
Unrealisedprofit/(loss)
USD
Equity OptionPurchase Bed Bath & Beyond Inc., Call Option,
Strike Price 22.5, Jan. 2019 JPMorgan USD 69 137,483 10,316 4,182Purchase Facebook Inc., A, Put Option, Strike
Price 150, Jan. 2019 JPMorgan USD 10 194,320 2,730 (2,227)Purchase GTT Communications Inc., Put Option,
Strike Price 40, Aug. 2018 JPMorgan USD 27 121,500 3,240 (3,043)Purchase Hudson’s Bay Co., Call Option, Strike
Price 11, Oct. 2018 JPMorgan CAD 45 40,132 4,672 2,707Purchase Kohl’s Corp., Put Option, Strike Price
55, Jan. 2019 JPMorgan USD 41 298,890 8,200 1,160Purchase Kohl’s Corp., Put Option, Strike Price
70, Jan. 2019 JPMorgan USD 41 298,890 27,468 7,133Purchase MBIA Inc., Call Option, Strike Price 10,
Jul. 2018 JPMorgan USD 41 37,064 472 (2,455)Purchase PetMed Express Inc., Put Option, Strike
Price 40, Aug. 2018 JPMorgan USD 56 246,680 9,520 1,031Purchase PG&E Corp., Call Option, Strike Price
50, Sep. 2018 JPMorgan USD 45 191,520 6,300 (3,272)Purchase Teva Pharmaceutical Industries Ltd., Put
Option, Strike Price 15, Jan. 2019 JPMorgan USD 39 94,848 1,268 (5,306)Purchase Trinity Industries Inc., Call Option, Strike
Price 40, Jul. 2018 JPMorgan USD 18 61,668 54 (4,262)
74,240 (4,352)
FRANKLIN TEMPLETON INVESTMENT FUNDS
Notes to the Financial StatementsAt June 30, 2018 (continued)
Note 13 — Open positions on option contracts (continued)
174 Audited Annual Report www.franklintempleton.lu

As at June 30, 2018, the Company had entered into the following outstanding contracts:
Franklin K2 Long Short Credit Fund (continued)Purchase/Saleposition
Description Counterparty Tradingcurrency
Number ofcontracts
purchased/(sold)
CommitmentUSD
MarketvalueUSD
Unrealisedprofit/(loss)
USD
Index OptionPurchase S&P 500 Index, Put Option, Strike Price
2600, Jul. 2018 JPMorgan USD 49 13,320,013 42,140 (30,980)Purchase S&P 500 Index, Put Option, Strike Price
2625, Jul. 2018 JPMorgan USD 15 4,077,555 16,576 (3,234)
58,716 (34,214)
132,956 (38,566)
Templeton Global Equity Income Fund
Purchase/Saleposition
Description Counterparty Tradingcurrency
Number ofcontracts
purchased/(sold)
CommitmentUSD
MarketvalueUSD
Unrealisedprofit/(loss)
USD
Equity OptionSale Total SA, Call Option, Strike Price 53,
Jul. 2018 JPMorgan EUR (179) 1,091,892 (8,806) 2,441
Note 14 — Mortgage dollar rollsAs at June 30, 2018, the Company had entered into the following outstanding mortgage dollar rolls:
Franklin Strategic Income Fund
Nominal Description Countrycode
Tradingcurrency
MarketvalueUSD
Unrealisedprofit/(loss)
USD
Long position19,760,000 FHLMC, 3.50%, 08/01/48 USA USD 19,629,000 (27,466)21,460,000 FHLMC, 4.00%, 08/01/48 USA USD 21,836,411 (44,518)
3,500,000 FNMA, 3.00%, 07/01/33 USA USD 3,478,848 12,0523,500,000 FNMA, 3.00%, 08/01/33 USA USD 3,475,430 (4,610)9,190,000 FNMA, 3.50%, 08/01/48 USA USD 9,133,215 (12,941)9,188,000 FNMA, 4.00%, 08/01/48 USA USD 9,353,815 (14,404)3,800,000 FNMA, 4.50%, 08/01/48 USA USD 3,949,996 (7,110)3,180,000 GNMA II, SF, 3.50%, 08/01/48 USA USD 3,187,701 (4,941)
74,044,416 (103,938)
Note 15 — Securities lendingDuring the year, the Company participated in securities lending programmes through Goldman Sachs and J.P. Morgan as lending agents.
As at June 30, 2018, the market value of the securities on loan and the corresponding collateral received were as follows:
Fundcurrency
LendingAgent
Counterparty Market valueof securities
on loanin Fund currency
Market valueof sovereign bonds
received as collateralin Fund currency
Franklin Biotechnology Discovery Fund USD Goldman Sachs Citigroup 9,143,680 10,116,268Credit Suisse International 2,152,421 2,257,361Deutsche Bank 457,812,603 484,352,360Goldman Sachs 12,753,456 14,111,384Morgan Stanley 12,844,416 15,375,832UBS 5,924,187 6,719,869
500,630,763 532,933,074
Franklin Natural Resources Fund USD Goldman Sachs Barclays Bank 3,885,819 4,091,657Deutsche Bank 4,820,004 5,049,352
8,705,823 9,141,009
Franklin Technology Fund USD Goldman Sachs Deutsche Bank 65,562,290 68,656,109Goldman Sachs 4,659,548 4,877,046Merrill Lynch International 2,109,250 2,296,853UBS 17,728,523 19,783,604
90,059,611 95,613,612
Franklin U.S. Equity Fund USD Goldman Sachs Deutsche Bank 7,857,618 8,201,162
Franklin U.S. Opportunities Fund USD Goldman Sachs Deutsche Bank 58,670,877 63,251,592
FRANKLIN TEMPLETON INVESTMENT FUNDS
Notes to the Financial StatementsAt June 30, 2018 (continued)
Note 13 — Open positions on option contracts (continued)
www.franklintempleton.lu Audited Annual Report 175

During the year, the securities lending programmes generated the following revenues and expenses:
Fundcurrency
LendingAgent
Grossearnings
in Fund currency
Direct and indirectoperational costs
and fees inFund currency
Netearnings
in Fund currency
Franklin Biotechnology Discovery Fund USD Goldman Sachs 3,909,667 312,772 3,596,895Franklin European Growth Fund EUR JPMorgan 820,722 65,658 755,064Franklin European Small-Mid Cap Growth Fund EUR JPMorgan 27,139 2,171 24,968Franklin Natural Resources Fund USD Goldman Sachs 113,570 9,086 104,484Franklin Technology Fund USD Goldman Sachs 560,058 44,805 515,253Franklin U.S. Equity Fund USD Goldman Sachs 19,155 1,532 17,623Franklin U.S. Opportunities Fund USD Goldman Sachs 127,819 10,226 117,593Franklin U.S. Small-Mid Cap Growth Fund USD Goldman Sachs 4,157 333 3,824Franklin Mutual Global Discovery Fund USD JPMorgan 238,746 19,100 219,646Templeton Asian Growth Fund USD JPMorgan 87,381 6,990 80,391Templeton Euroland Fund EUR JPMorgan 314,446 25,156 289,290Templeton Global Fund USD JPMorgan 68,102 5,448 62,654Templeton Global Balanced Fund USD JPMorgan 30,144 2,412 27,732Templeton Global Equity Income Fund USD JPMorgan 25,816 2,065 23,751Templeton Global Income Fund USD JPMorgan 30,590 2,447 28,143Templeton Global Smaller Companies Fund USD JPMorgan 193,001 15,440 177,561Templeton Growth (Euro) Fund EUR JPMorgan 772,670 61,814 710,856
Note 16 — Investment management feesThe Management Company receives from the Company a monthly investment management fee equivalent to a certain percentage per annum (asdetailed below) of each Fund’s average daily net assets during the accounting period. When Funds invest in other Franklin Templeton funds, amanagement fee is not applied to the amounts invested. The following percentages apply in respect of the different Funds as at June 30, 2018.
The Investment Managers, as noted on pages 4 to 6, will be remunerated by the Management Company out of the investment management feereceived from the Company.
No management fee is payable by an investor on the acquisition of Class X and Class Y shares, instead a fee is paid to the Investment Manager oraffiliates under a separate agreement.
Class I Class S Class WOther Classes exceptClass X and Class Y
Franklin Asia Credit Fund 0.55% 0.75%Franklin Biotechnology Discovery Fund 0.70% 0.70% 1.00%Franklin Brazil Opportunities Fund 0.70% 1.00%Franklin Diversified Balanced Fund 0.55% 0.55% 0.85%Franklin Diversified Conservative Fund 0.50% 0.50% 0.80%Franklin Diversified Dynamic Fund 0.60% 0.60% 0.90%Franklin Euro Government Bond Fund 0.30% 0.35%Franklin Euro High Yield Fund 0.60% 0.60% 0.80%Franklin Euro Short Duration Bond Fund 0.25% 0.25% 0.30%Franklin Euro Short-Term Money Market Fund 0.20% 0.25%Franklin European Fund 0.70% 1.00%Franklin European Corporate Bond Fund 0.40% 0.40% 0.45%Franklin European Dividend Fund 0.70% 1.00%Franklin European Growth Fund 0.70% 0.70% 1.00%Franklin European Income Fund 0.60% 0.60% 0.85%Franklin European Small-Mid Cap Growth Fund 0.70% 0.70% 1.00%Franklin European Total Return Fund 0.35% 0.35% 0.40%Franklin Flexible Alpha Bond Fund 0.55% 0.55% 0.75%Franklin GCC Bond Fund 0.55% 0.55% 0.75%Franklin Global Aggregate Bond Fund 0.40% 0.40% 0.65%Franklin Global Aggregate Investment Grade Bond Fund 0.40% 0.65%Franklin Global Convertible Securities Fund 0.60% 0.60% 0.75%Franklin Global Equity Strategies Fund 1.25%Franklin Global Fundamental Strategies Fund 0.70% 0.70% 1.00%Franklin Global Growth Fund 0.70% 1.00%Franklin Global High Income Bond Fund 0.60% 0.80%Franklin Global Listed Infrastructure Fund 0.70% 0.70% 1.00%Franklin Global Multi-Asset Income Fund 0.60% 0.60% 0.85%Franklin Global Real Estate Fund 0.70% 0.70% 1.00%Franklin Global Small-Mid Cap Growth Fund 0.70% 0.70% 1.00%Franklin Gold and Precious Metals Fund 0.70% 1.00%Franklin High Yield Fund 0.60% 0.60% 0.80%Franklin Income Fund 0.60% 0.60% 0.85%Franklin India Fund 0.70% up to 0.70% 0.70% 1.00%Franklin Japan Fund 0.70% 0.70% 1.00%Franklin K2 Alternative Strategies Fund 1.75% up to 1.70% 1.75% 2.05%Franklin K2 Global Macro Opportunities Fund 1.75% 1.75% 2.05%Franklin K2 Long Short Credit Fund 1.75% 1.75% 2.05%Franklin MENA Fund 1.05% 1.05% 1.50%Franklin Natural Resources Fund 0.70% 1.00%Franklin NextStep Balanced Growth Fund 0.85%Franklin NextStep Conservative Fund 0.60% 0.80%Franklin NextStep Dynamic Growth Fund 0.85%
FRANKLIN TEMPLETON INVESTMENT FUNDS
Notes to the Financial StatementsAt June 30, 2018 (continued)
Note 15 — Securities lending (continued)
176 Audited Annual Report www.franklintempleton.lu

Class I Class S Class WOther Classes exceptClass X and Class Y
Franklin NextStep Growth Fund 0.70% 1.00%Franklin NextStep Moderate Fund 0.65% 0.95%Franklin NextStep Stable Growth Fund 0.80%Franklin Real Return Fund 0.75%Franklin Strategic Income Fund 0.55% 0.55% 0.75%Franklin Technology Fund 0.70% 0.70% 1.00%Franklin U.S. Dollar Liquid Reserve Fund 0.20% 0.30%Franklin U.S. Equity Fund 0.70% 0.70% 1.00%Franklin U.S. Government Fund 0.40% 0.40% 0.65%Franklin U.S. Low Duration Fund 0.40% 0.40% 0.65%Franklin U.S. Opportunities Fund 0.70% up to 0.60% 0.70% 1.00%Franklin U.S. Small-Mid Cap Growth Fund 0.70% 1.00%Franklin World Perspectives Fund 0.70% 0.70% 1.00%Franklin Mutual European Fund 0.70% 0.70% 1.00%Franklin Mutual Global Discovery Fund 0.70% 0.70% 1.00%Franklin Mutual U.S. Value Fund 0.70% 0.70% 1.00%Templeton Africa Fund 1.10% 1.10% 1.60%Templeton ASEAN Fund 1.35%Templeton Asian Bond Fund 0.55% up to 0.55% 0.55% 0.75%Templeton Asian Dividend Fund 1.35%Templeton Asian Growth Fund 0.90% 0.90% 1.35%Templeton Asian Smaller Companies Fund 0.90% 0.90% 1.35%Templeton BRIC Fund 1.10% 1.60%Templeton China Fund 1.10% 1.10% 1.60%Templeton Eastern Europe Fund 1.10% 1.10% 1.60%Templeton Emerging Markets Fund 1.00% 1.00% 1.15%Templeton Emerging Markets Balanced Fund 0.90% 1.30%Templeton Emerging Markets Bond Fund 0.70% up to 0.70% 0.70% 1.00%Templeton Emerging Markets Local Currency Bond Fund 0.70% 0.70% 1.00%Templeton Emerging Markets Smaller Companies Fund 1.10% 1.10% 1.60%Templeton Euroland Fund 0.70% 0.70% 1.00%Templeton European Fund 0.70% 0.70% 1.00%Templeton Frontier Markets Fund 1.10% 1.10% 1.60%Templeton Global Fund 0.70% 0.70% 1.00%Templeton Global Balanced Fund 0.60% 0.60% 0.80%Templeton Global Bond Fund 0.55% up to 0.55% 0.55% 0.75%Templeton Global Bond (Euro) Fund 0.55% 0.55% 0.75%Templeton Global Climate Change Fund 0.70% 0.70% 1.00%Templeton Global Currency Fund 0.55% 0.55% 0.75%Templeton Global Equity Income Fund 1.00%Templeton Global High Yield Fund 0.60% 0.85%Templeton Global Income Fund 0.60% up to 0.60% 0.60% 0.85%Templeton Global Smaller Companies Fund 0.70% 1.00%Templeton Global Total Return Fund 0.55% up to 0.55% 0.55% 0.75%Templeton Growth (Euro) Fund 0.70% 0.70% 1.00%Templeton Korea Fund 1.10% 1.60%Templeton Latin America Fund 1.00% 1.00% 1.40%Templeton Thailand Fund 1.10% 1.60%
Note 17 — Soft commissionConsistent with obtaining best execution, brokerage commissions on portfolio transactions for the Company may be directed by the InvestmentManagers to broker-dealers in recognition of research services furnished by them as well as for services rendered in the execution of orders by suchbroker-dealers.
The receipt of investment research and information and related services permits the Investment Managers to supplement their own research andanalysis and makes available to them the views and information of individuals and research staffs of other firms.
Such related services do not include travel, accommodation, entertainment, general administrative goods or services, general office equipment orpremises, membership fees, employee salaries or direct money payment.
Note 18 — Connected party transactionsCertain Directors of the Company are or may also be Officers and/or Directors of one or more of the various Investment Managers of the Funds,among others, Templeton Asset Management Limited and Franklin Templeton Institutional, LLC. All transactions with connected parties wereentered into in the ordinary course of business and under normal commercial terms.
The investment management fees that are accrued by the Company in respect of the Management Company are detailed in note 16 to the financialstatements.
There are no connected brokers in Franklin Templeton Investments, and no transactions were entered into with connected brokers during the yearended June 30, 2018.
During the year ended June 30, 2018, the Company accrued administration and transfer agency fees and shares’ maintenance and service chargesin respect of Franklin Templeton International Services S.à r.l. as Management Company and Principal Distributor of the Funds.
Note 19 — TaxationUnder current tax laws and practice, the Company is not liable in the Grand Duchy of Luxembourg to any taxes on income or on realised orunrealised capital gains.
FRANKLIN TEMPLETON INVESTMENT FUNDS
Notes to the Financial StatementsAt June 30, 2018 (continued)
Note 16 — Investment management fees (continued)
www.franklintempleton.lu Audited Annual Report 177

The Company is liable in the Grand Duchy of Luxembourg to a tax of 0.05% per annum, such tax being paid quarterly, and calculated on the netasset value of each Fund at the end of each relevant quarter (except the Franklin Euro Short-Term Money Market Fund and the Franklin U.S. DollarLiquid Reserve Fund for which the rate is 0.01%). This tax is not applicable for the portion of the assets of a Fund invested in other undertakingsfor collective investment that have already been subject to such tax. Class I shares, Class X shares and Class Y shares may benefit from a reducedrate of 0.01% per annum if all shareholders of these share classes are institutional investors.
Investment income received or capital gains realised by the Company may be subject to tax in the countries of origin. All liabilities in respect oftaxes payable on unrealised capital gains on investments are provided for as soon as there is a reasonable certainty that a liability will crystallise.
No stamp duty or other tax is payable in the Grand Duchy of Luxembourg on the issue of shares in the Company.
The Company is registered for Value Added Tax in the Grand Duchy of Luxembourg and subject to account for Value Added Tax in accordancewith current laws.
Note 20 — Share classesClass A shares: are offered at the applicable net asset value, plus an initial charge of up to 5.75% of the total amount invested varying per assetclass. In addition, a maintenance charge of up to 0.50% per annum of the applicable average net asset value is deducted and paid to the PrincipalDistributor. This charge is accrued daily and is deducted and paid monthly to the Principal Distributor. A contingent deferred sales charge of up to1%, retained by the Principal Distributor, applies to certain redemptions on qualified investments of USD 1 million or more within 18 months afterrepurchase.
Class AS shares: are offered in Singapore to CPF Investors as more fully described in the current prospectus of the Company. Class AS shares areoffered at the applicable net asset value, plus an initial charge of up to 3% of the total amount invested. In addition, a maintenance charge of upto 0.40% per annum of the applicable average net asset value is deducted and paid to the Principal Distributor. This charge is accrued daily and isdeducted and paid monthly to the Principal Distributor.
Class AX shares: are offered at the applicable net asset value, plus an initial charge of up to 5.75% of the total amount invested varying per assetclass. In addition, a maintenance charge of up to 0.50% per annum of the applicable average net asset value is deducted and paid to the PrincipalDistributor. This charge is accrued daily and is deducted and paid monthly to the Principal Distributor. A contingent deferred sales charge of up to1% applies to certain redemptions on qualified investments of USD 1 million or more within 18 months after repurchase.
Class B shares: As from April 1, 2016, no additional Class B Shares are issued. Class B Shares purchased by an Investor prior to April 1, 2016 aresubject to a contingent deferred sales charge up to 4% if such investor sells shares within 4 years of purchase. In addition, a maintenance charge ofup to 0.75% per annum of the applicable average net asset value and a servicing charge of 1.06% per annum of the applicable average net assetvalue are applied. These charges are accrued daily and are deducted and paid monthly to the Principal Distributor and/or other parties. Startingfrom 2011, shares will be automatically converted into Class A shares of the same Fund 7 years after their purchase as more fully disclosed in theprospectus.
Class C shares: are not subject to an initial charge but are subject to a contingent deferred sales charge of 1.00% if an investor redeems shares withinone year of purchase. In addition, a maintenance charge of 1.08% per annum of the applicable average net asset value is deducted. These chargesare accrued daily and are deducted and paid monthly to the Principal Distributor and/or other party.
Class F shares: are not subject to an initial charge but are subject to a contingent deferred sales charge of up to 3% if an investor redeems shareswithin three years of purchase. In addition, a maintenance charge of up to 0.50% per annum of the applicable average net asset value and aservicing charge of 1.00% per annum of the applicable average net asset value are applied. These charges are accrued daily and are deducted andpaid monthly to the Principal Distributor and/or other parties. Class F shares will be automatically converted into Class A shares of the same Fundfree of charge on the monthly scheduled conversion date fixed by the Management Company upon or following the expiry of 36 months after thedate of their purchase.
Class G shares: are not subject to an initial charge but are subject to a contingent deferred sales charge of up to 3% if an investor redeems shareswithin three years of purchase. In addition, a maintenance charge of 0.10% per annum of the applicable average net asset value and a servicingcharge of 1.00% per annum of the applicable average net asset value are applied. These charges are accrued daily and are deducted and paidmonthly to the Principal Distributor and/or other parties. Class G shares will be automatically converted into Class A shares of the same Fund freeof charge on the monthly scheduled conversion date fixed by the Management Company upon or following the expiry of 36 months after the dateof their purchase.
Class I shares: are offered to institutional investors as more fully described in the current prospectus of the Company. Purchases of Class I sharesare not subject to an initial sales charge, nor a contingent deferred sales charge or any maintenance or servicing charges.
Class N shares: are subject to an initial charge of up to 3% of the total amount invested. In addition, a maintenance charge of up to 1.25% perannum of the applicable average net asset value is accrued daily and is deducted and paid monthly to the Principal Distributor. Class N shares maybe offered in certain limited circumstances as more fully described in the current prospectus of the Company.
Class S shares: are not subject to an entry charge, contingent deferred sales charge nor any maintenance or servicing charge. Class S shares may beoffered in certain limited circumstances as more fully described in the current prospectus of the Company.
Class W shares: are not subject to an entry charge, contingent deferred sales charge nor any maintenance or servicing charge. Class W shares maybe offered in certain limited circumstances as more fully described in the current prospectus of the Company.
Class X shares: are not subject to an initial charge and no management fees will be payable by an investor on the acquisition of Class X shares(instead a fee is paid to the Investment Manager or affiliates under an agreement between the Investment Manager and the investor). Class X sharesare offered to institutional investors in certain limited circumstances as more fully described in the current prospectus of the Company.
Class Y shares: are not subject to an initial charge and no management, registrar, transfer, corporate, domiciliary or administration fees will bepayable by an investor on the acquisition of Class Y shares (instead a fee is paid to the Investment Manager or affiliates under an agreement betweenthe Investment Manager and the investor). Class Y shares are offered to institutional investors in certain limited circumstances as more fullydescribed in the current prospectus of the Company.
Class Z shares: are not subject to an initial charge, contingent deferred sales charge nor any maintenance or servicing charge. Class Z shares maybe offered in certain limited circumstances as more fully described in the current prospectus of the Company.
Distributing shares: may have different frequencies. (Mdis) share classes distribute monthly, (Qdis) share classes distribute quarterly and (Ydis)share classes distribute annually.
FRANKLIN TEMPLETON INVESTMENT FUNDS
Notes to the Financial StatementsAt June 30, 2018 (continued)
Note 19 — Taxation (continued)
178 Audited Annual Report www.franklintempleton.lu

Accumulating shares (acc): do not distribute any dividends but the income attributable is reflected in the increased value of the shares. All otherterms and conditions are the same as those which apply to distributing share classes.
Hedged share classes: In respect of hedged share classes, the Company offers the following alternatives:➤ H1: in order to reduce exchange rate fluctuations and return fluctuations, the base currency exposure of the hedged share class is hedged into
a specified alternative currency.➤ H2: a hedging strategy is applied in order to reduce the risk of currency movements between the currency of the hedged share class and other
material currencies of the securities held by the Fund.➤ H4: where currency controls imposed by a country’s monetary authority prevent free movement of currency (“Restricted Currency”), another
hedging methodology is used. The share class is denominated in the base currency of the Fund but hedges the Fund’s base currency into aspecified Restricted Currency for investors in that Restricted Currency.
Note 21 — Expenses reimbursementOn a daily basis, for share classes where the expenses are capped, the level of expenses is calculated and compared to the cap and where the levelof expenses is higher than the cap, this difference is booked as a decrease of expense (the “waiver fees”). On a monthly basis the waiver fees arededucted from the fees received by Franklin Templeton International Services S.à r.l.
The amount of waiver fees is disclosed as “Expenses reimbursement” in the “Statement of Operations and Changes in Net Assets”.
Note 22 — Statement of changes in the investment portfolioA list, specifying for each Fund total purchases and sales transacted during the year under review, may be obtained, upon request, at the registeredoffice of the Company.
Note 23 — Transaction costsTransaction costs are costs incurred to acquire and dispose of financial assets or liabilities. They include fees and commissions paid to agents,brokers and dealers. During the year ended June 30, 2018 the Company incurred the following transaction costs:
Fund Currency AmountFranklin Asia Credit Fund USD –*Franklin Biotechnology Discovery Fund USD 1,544,976Franklin Brazil Opportunities Fund USD 18,335Franklin Diversified Balanced Fund EUR 148,689Franklin Diversified Conservative Fund EUR 121,242Franklin Diversified Dynamic Fund EUR 85,711Franklin Euro Government Bond Fund EUR 1,833Franklin Euro High Yield Fund EUR 7,085Franklin Euro Short Duration Bond Fund EUR 5,370Franklin Euro Short-Term Money Market Fund EUR –*Franklin European Fund EUR 7,498Franklin European Corporate Bond Fund EUR 1,225Franklin European Dividend Fund EUR 99,019Franklin European Growth Fund EUR 583,811Franklin European Income Fund EUR 6,317Franklin European Small-Mid Cap Growth Fund EUR 358,976Franklin European Total Return Fund EUR 18,479Franklin Flexible Alpha Bond Fund USD 56,853Franklin GCC Bond Fund USD –*Franklin Global Aggregate Bond Fund USD –*Franklin Global Aggregate Investment Grade BondFund USD –*Franklin Global Convertible Securities Fund USD 668Franklin Global Equity Strategies Fund USD 142,461Franklin Global Fundamental Strategies Fund USD 673,986Franklin Global Growth Fund USD 64,583Franklin Global High Income Bond Fund USD 450Franklin Global Listed Infrastructure Fund USD 98,895Franklin Global Multi-Asset Income Fund EUR 173,282Franklin Global Real Estate Fund USD 122,690Franklin Global Small-Mid Cap Growth Fund USD 154,776Franklin Gold and Precious Metals Fund USD 167,868Franklin High Yield Fund USD 12,409Franklin Income Fund USD 567,497Franklin India Fund USD 5,134,243Franklin Japan Fund JPY 124,668,320Franklin K2 Alternative Strategies Fund USD 1,905,400Franklin K2 Global Macro Opportunities Fund USD 13,928Franklin K2 Long Short Credit Fund USD 27,971Franklin MENA Fund USD 474,659Franklin Natural Resources Fund USD 443,755Franklin NextStep Balanced Growth Fund USD 52,216Franklin NextStep Conservative Fund USD 7,648Franklin NextStep Dynamic Growth Fund USD 21,883Franklin NextStep Growth Fund USD 5,742Franklin NextStep Moderate Fund USD 15,611Franklin NextStep Stable Growth Fund USD 5,117
Fund Currency AmountFranklin Real Return Fund USD 685Franklin Strategic Income Fund USD 5,809Franklin Technology Fund USD 949,114Franklin U.S. Dollar Liquid Reserve Fund USD –*Franklin U.S. Equity Fund USD 410,614Franklin U.S. Government Fund USD –*Franklin U.S. Low Duration Fund USD 21,763Franklin U.S. Opportunities Fund USD 697,140Franklin U.S. Small-Mid Cap Growth Fund USD 30,006Franklin World Perspectives Fund USD 358,855Franklin Mutual European Fund EUR 675,812Franklin Mutual Global Discovery Fund USD 237,959Franklin Mutual U.S. Value Fund USD 84,760Templeton Africa Fund USD 165,338Templeton ASEAN Fund USD 9,014Templeton Asian Bond Fund USD –*Templeton Asian Dividend Fund USD 3,768Templeton Asian Growth Fund USD 6,877,956Templeton Asian Smaller Companies Fund USD 1,650,398Templeton BRIC Fund USD 498,262Templeton China Fund USD 334,116Templeton Eastern Europe Fund EUR 295,151Templeton Emerging Markets Fund USD 591,580Templeton Emerging Markets Balanced Fund USD 52,995Templeton Emerging Markets Bond Fund USD –*Templeton Emerging Markets Local Currency BondFund USD –*Templeton Emerging Markets Smaller CompaniesFund USD 936,404Templeton Euroland Fund EUR 288,226Templeton European Fund EUR 48,024Templeton Frontier Markets Fund USD 1,070,790Templeton Global Fund USD 857,892Templeton Global Balanced Fund USD 204,572Templeton Global Bond Fund USD –*Templeton Global Bond (Euro) Fund EUR –*Templeton Global Climate Change Fund EUR 479,110Templeton Global Currency Fund USD –*Templeton Global Equity Income Fund USD 58,244Templeton Global High Yield Fund USD 362Templeton Global Income Fund USD 677,788Templeton Global Smaller Companies Fund USD 91,790Templeton Global Total Return Fund USD –*Templeton Growth (Euro) Fund EUR 4,438,133Templeton Korea Fund USD 77,212Templeton Latin America Fund USD 694,472Templeton Thailand Fund USD 451,102
*For debt securities and derivatives, transaction costs are not separately identifiable from the purchase price of the security and therefore cannotbe disclosed separately.
FRANKLIN TEMPLETON INVESTMENT FUNDS
Notes to the Financial StatementsAt June 30, 2018 (continued)
Note 20 — Share classes (continued)
www.franklintempleton.lu Audited Annual Report 179

The Funds use an accounting practice known as equalisation, by which a portion of the proceeds from issue and costs of redemption of shares,equivalent on a per share basis to the amount of undistributed investment income on the date of the transaction, is credited or charged toundistributed income which is disclosed as equalisation in the “Statement of Operations and Changes in Net Assets”. As a result, undistributedinvestment income per share is unaffected by issue or redemptions of shares.
FRANKLIN TEMPLETON INVESTMENT FUNDS
Notes to the Financial StatementsAt June 30, 2018 (continued)
Note 24 — Equalisation
180 Audited Annual Report www.franklintempleton.lu

For the year ended June 30, 2018, the following amounts per share were paid out to distributing share class shareholders.
Accumulated dividends have not been paid out and are reflected as an increase in the �Issue of shares� account in the �Statement of Operations andChanges in Net Assets”.
AnnualDistribution
Jul-2017
Jul-2017
Aug-2017
Sep-2017
Oct-2017
Nov-2017
Dec-2017
Jan-2018
Feb-2018
Mar-2018
Apr-2018
May-2018
Jun-2018
Franklin Asia Credit FundA (Mdis) AUD-H1 0.032 0.032 0.034 0.032 0.033 0.035 0.033 0.031 0.037 0.034 0.036 0.038A (Mdis) SGD-H1 0.032 0.031 0.033 0.031 0.031 0.033 0.032 0.030 0.034 0.033 0.033 0.037A (Mdis) USD 0.033 0.032 0.032 0.032 0.030 0.033 0.032 0.032 0.034 0.033 0.033 0.036Y (Mdis) USD 0.034 0.033 0.035 0.033 0.032 0.034 0.034 0.034 0.036 0.035 0.034 0.039
Franklin Brazil Opportunities FundA (Qdis) HKD 0.161 0.167 0.161 0.162A (Qdis) USD 0.160 0.166 0.159 0.160N (Qdis) USD 0.158 0.164 0.157 0.158
Franklin Diversified Balanced FundA (Qdis) EUR 0.086 0.243 0.111 0.080A (Ydis) EUR 0.709I (Qdis) EUR 0.087 0.247 0.113 0.082I (Ydis) EUR 0.022N (Ydis) EUR 0.503W (Ydis) EUR 0.530
Franklin Diversified Conservative FundA (Qdis) EUR 0.061 0.188 0.099 0.049A (Qdis) USD-H1* 0.023 0.106 0.053A (Ydis) EUR 0.491I (Qdis) EUR 0.061 0.191 0.100 0.050I (Ydis) EUR 0.513N (Ydis) EUR 0.354W (Ydis) EUR 0.373
Franklin Diversified Dynamic FundA (Ydis) EUR 0.548I (Ydis) EUR -W (Ydis) EUR 0.669
Franklin Euro Government Bond FundA (Ydis) EUR 0.100I (Qdis) EUR 0.030 0.021 0.023 0.011
Franklin Euro High Yield FundA (Mdis) EUR 0.021 0.021 0.021 0.022 0.021 0.020 0.021 0.020 0.020 0.021 0.019 0.020A (Mdis) USD 0.031 0.031 0.031 0.034 0.031 0.030 0.031 0.031 0.031 0.032 0.030 0.030A (Mdis) USD-H1 0.036 0.035 0.035 0.036 0.033 0.033 0.034 0.035 0.032 0.033 0.032 0.032A (Ydis) EUR 0.281B (Mdis) EUR 0.039 0.038 0.038 0.040 0.037 0.037 0.037 0.036 0.036 0.037 0.035 0.036B (Mdis) USD 0.032 0.032 0.032 0.034 0.031 0.031 0.031 0.032 0.031 0.033 0.030 0.029I (Ydis) EUR 0.429
Franklin Euro Short Duration Bond FundA (Ydis) EUR 0.074Y (Mdis) EUR 0.008 0.001 0.003 - - 0.009 0.004 0.005 0.007 - - 0.006Y (Mdis) USD-H1* 0.003 0.007 - - 0.010
Franklin European FundΩ
A (Ydis) EUR 0.017
Franklin European Corporate Bond FundA (Ydis) EUR 0.213I (Ydis) EUR 0.214N (Ydis) EUR 0.210Y (Mdis) EUR 0.014 0.015 0.015 0.013 0.015 0.014 0.015 0.015 0.013 0.014 0.015 0.015
Franklin European Dividend FundA (Mdis) SGD-H1 0.042 0.040 0.040 0.042 0.042 0.041 0.041 0.042 0.041 0.039 0.041 0.040A (Mdis) USD 0.035 0.035 0.035 0.036 0.036 0.036 0.036 0.038 0.036 0.035 0.036 0.034A (Mdis) USD-H1* 0.031 0.038A (Ydis) EUR 0.700Y (Mdis) EUR 0.037 0.035 0.035 0.037 0.037 0.036 0.036 0.037 0.036 0.034 0.036 0.035
Franklin European Growth FundA (Ydis) GBP 0.205
FRANKLIN TEMPLETON INVESTMENT FUNDS
Notes to the Financial StatementsAt June 30, 2018 (continued)
Note 25 — Dividends distributed
www.franklintempleton.lu Audited Annual Report 181

AnnualDistribution
Jul-2017
Jul-2017
Aug-2017
Sep-2017
Oct-2017
Nov-2017
Dec-2017
Jan-2018
Feb-2018
Mar-2018
Apr-2018
May-2018
Jun-2018
Franklin European Income FundA (Mdis) EUR 0.024 0.024 0.024 0.024 0.024 0.024 0.024 0.024 0.024 0.024 0.024 0.024A (Mdis) SGD-H1 0.025 0.025 0.025 0.025 0.025 0.025 0.025 0.025 0.025 0.025 0.025 0.025A (Mdis) USD 0.022 0.023 0.023 0.023 0.022 0.023 0.023 0.024 0.024 0.024 0.023 0.023I (Mdis) EUR 0.025 0.025 0.025 0.025 0.025 0.025 0.025 0.025 0.025 0.025 0.025 0.025N (Mdis) EUR 0.024 0.024 0.024 0.024 0.024 0.024 0.024 0.024 0.024 0.024 0.024 0.024N (Mdis) USD-H1 0.021 0.021 0.021 0.021 0.021 0.021 0.021 0.022 0.022 0.022 0.022 0.022W (Mdis) EUR 0.024 0.024 0.024 0.024 0.024 0.024 0.024 0.024 0.025 0.025 0.025 0.025Z (Mdis) EUR 0.024 0.024 0.024 0.024 0.024 0.024 0.024 0.024 0.024 0.024 0.024 0.024
Franklin European Small-Mid Cap Growth FundY (Mdis) EUR 0.009 - 0.011 0.059 0.054 0.022 0.003 0.009 0.006 0.032 0.120 0.039
Franklin European Total Return FundA (Mdis) EUR 0.015 0.009 0.010 0.003 0.013 0.015 0.010 0.010 0.012 0.006 0.013 0.016A (Mdis) USD 0.018 0.010 0.012 0.003 0.016 0.017 0.013 0.012 0.015 0.008 0.014 0.019N (Mdis) EUR 0.017 0.009 0.012 0.003 0.014 0.017 0.012 0.011 0.013 0.007 0.014 0.018
Franklin Flexible Alpha Bond FundA (Qdis) EUR-H1 0.027 0.026 0.021 0.034I (Ydis) GBP-H1 0.132I (Ydis) USD 0.135N (Qdis) EUR-H1 - - - -N (Qdis) USD - - - -Y (Mdis) USD 0.005 0.021 0.021 0.018 0.019 0.018 0.019 0.021 0.023 0.026 0.025 0.028
Franklin GCC Bond FundA (Mdis) USD 0.039 0.039 0.038 0.038 0.039 0.039 0.040 0.052 0.043 0.043 0.035 0.057B (Mdis) USD 0.038 0.038 0.037 0.037 0.037 0.038 0.039 0.050 0.042 0.041 0.033 0.056W (Mdis) USD 0.036 0.035 0.036 0.035 0.036 0.036 0.038 0.048 0.040 0.040 0.033 0.054
Franklin Global Aggregate Bond FundA (Mdis) EUR 0.013 0.012 0.009 0.009 0.010 0.010 0.009 0.011 0.013 0.016 0.015 0.017A (Mdis) USD 0.011 0.010 0.008 0.008 0.007 0.009 0.008 0.010 0.011 0.014 0.014 0.013Y (Mdis) USD 0.021 0.021 0.019 0.019 0.018 0.020 0.018 0.021 0.021 0.026 0.024 0.025Z (Mdis) USD 0.013 0.012 0.010 0.010 0.009 0.011 0.009 0.012 0.013 0.016 0.016 0.015
Franklin Global Convertible Securities FundA (Ydis) EUR 0.030A (Ydis) EUR-H1 0.024
Franklin Global Equity Strategies FundΩ
A (Ydis) EUR 0.008
Franklin Global Fundamental Strategies FundA (Ydis) EUR 0.150N (Ydis) EUR 0.087W (Ydis) EUR 0.072
Franklin Global High Income Bond FundΩ
A (Mdis) HKD 0.048 0.048 0.048 0.048A (Mdis) SGD-H1 0.048 0.048 0.048 0.048A (Mdis) USD 0.048 0.048 0.048 0.048N (Mdis) USD 0.043 0.043 0.043 0.043Y (Mdis) USD 0.058 0.058 0.058 0.058
Franklin Global Listed Infrastructure FundA (Qdis) USD 0.137 0.059 0.087 0.073A (Ydis) EUR 0.360W (Qdis) GBP 0.168 0.072 0.105 0.083Y (Mdis) USD 0.039 0.015 0.024 0.019 0.027 0.033 0.027 0.018 0.023 0.033 0.038 0.055
Franklin Global Multi-Asset Income FundA (Mdis) EUR 0.044 0.043 0.043 0.043 0.043 0.043 0.043 0.041 0.040 0.039 0.039 0.038A (Mdis) SGD-H1 0.042 0.042 0.042 0.042 0.042 0.042 0.042 0.040 0.039 0.038 0.038 0.038A (Mdis) USD-H1 0.042 0.042 0.042 0.042 0.042 0.042 0.042 0.040 0.039 0.039 0.038 0.038A (Qdis) EUR 0.139 0.137 0.138 0.125A (Ydis) EUR 0.581G (Qdis) EUR 0.101 0.121 0.134 0.122I (Mdis) USD-H1 0.043 0.043 0.043 0.043 0.043 0.043 0.043 0.041 0.040 0.040 0.039 0.039I (Qdis) EUR 0.143 0.141 0.142 0.130I (Ydis) EURΩ 0.529N (Mdis) USD-H1 0.042 0.042 0.041 0.041 0.042 0.042 0.042 0.040 0.039 0.038 0.038 0.038N (Qdis) EUR 0.123 0.122 0.122 0.111N (Ydis) EUR 0.515W (Mdis) USD-H1 0.046 0.046 0.045 0.045 0.041 0.046 0.046 0.044 0.043 0.042 0.042 0.042W (Ydis) EUR 0.566Y (Mdis) AUD-H1* 0.003 0.046 0.047 0.047 0.047 0.045 0.044 0.043 0.043 0.043Z (Mdis) USD-H1 0.043 0.042 0.042 0.042 0.043 0.043 0.043 0.041 0.040 0.039 0.039 0.039
FRANKLIN TEMPLETON INVESTMENT FUNDS
Notes to the Financial StatementsAt June 30, 2018 (continued)
Note 25 — Dividends distributed (continued)
182 Audited Annual Report www.franklintempleton.lu

AnnualDistribution
Jul-2017
Jul-2017
Aug-2017
Sep-2017
Oct-2017
Nov-2017
Dec-2017
Jan-2018
Feb-2018
Mar-2018
Apr-2018
May-2018
Jun-2018
Franklin Global Real Estate FundA (Qdis) USD 0.073 0.053 0.061 0.064A (Ydis) EUR-H1 0.335B (Qdis) USD 0.069 0.050 0.056 0.060C (Qdis) USD 0.072 0.051 0.059 0.062W (Qdis) USD 0.081 0.057 0.067 0.071Y (Mdis) USD 0.036 0.009 0.016 0.029 0.007 0.022 0.035 0.003 0.013 0.051 0.011 0.033
Franklin Gold and Precious Metals FundA (Ydis) EUR -
Franklin High Yield FundA (Mdis) AUD-H1 0.045 0.044 0.045 0.045 0.049 0.050 0.044 0.042 0.045 0.044 0.045 0.045A (Mdis) SGD-H1 0.040 0.037 0.038 0.038 0.040 0.041 0.037 0.036 0.037 0.035 0.038 0.038A (Mdis) USD 0.031 0.030 0.030 0.030 0.031 0.033 0.030 0.029 0.029 0.029 0.029 0.030B (Mdis) USD 0.030 0.030 0.029 0.029 0.030 0.032 0.029 0.029 0.027 0.028 0.029 0.028F (Mdis) USD 0.051 0.049 0.048 0.049 0.050 0.052 0.048 0.048 0.046 0.046 0.047 0.048I (Mdis) USD 0.050 0.048 0.048 0.047 0.049 0.052 0.048 0.047 0.046 0.046 0.047 0.048N (Mdis) USD 0.043 0.042 0.041 0.041 0.045 0.044 0.042 0.040 0.040 0.039 0.041 0.040W (Mdis) USD 0.051 0.049 0.048 0.050 0.050 0.052 0.049 0.048 0.047 0.046 0.048 0.048Y (Mdis) USD 0.048 0.047 0.046 0.047 0.046 0.051 0.047 0.045 0.045 0.045 0.046 0.046Z (Mdis) USD 0.047 0.045 0.044 0.045 0.046 0.048 0.045 0.044 0.043 0.043 0.044 0.044
Franklin Income FundA (Mdis) AUD-H1 0.037 0.037 0.037 0.037 0.037 0.037 0.037 0.037 0.037 0.037 0.037 0.037A (Mdis) EUR-H1 0.035 0.035 0.035 0.035 0.035 0.035 0.035 0.034 0.034 0.034 0.034 0.034A (Mdis) SGD-H1 0.032 0.032 0.032 0.032 0.032 0.032 0.032 0.032 0.032 0.032 0.032 0.032A (Mdis) USD 0.045 0.045 0.045 0.045 0.045 0.045 0.045 0.045 0.045 0.045 0.045 0.045A (Mdis) ZAR-H1 0.086 0.388 0.389 0.391 0.394 0.395 0.395 0.396 0.397 0.399 0.402 0.403B (Mdis) USD 0.042 0.042 0.042 0.042 0.042 0.042 0.042 0.042 0.041 0.041 0.041 0.041C (Mdis) USD 0.057 0.057 0.057 0.057 0.057 0.057 0.057 0.057 0.057 0.057 0.057 0.057F (Mdis) USD 0.039 0.039 0.039 0.039 0.039 0.039 0.039 0.039 0.039 0.039 0.039 0.039I (Ydis) EUR-H1 0.409N (Mdis) EUR 0.038 0.037 0.037 0.037 0.037 0.036 0.036 0.035 0.036 0.035 0.036 0.037N (Mdis) EUR-H1 0.035 0.035 0.034 0.034 0.034 0.034 0.034 0.034 0.034 0.034 0.034 0.034N (Mdis) USD 0.035 0.035 0.035 0.035 0.035 0.035 0.035 0.035 0.035 0.035 0.035 0.035W (Mdis) USD 0.039 0.039 0.039 0.040 0.040 0.040 0.040 0.040 0.040 0.040 0.040 0.040Z (Mdis) USD 0.041 0.041 0.041 0.041 0.041 0.041 0.041 0.041 0.041 0.041 0.041 0.041
Franklin India FundA (Ydis) EUR -A (Ydis) GBP -I (Ydis) EUR -Y (Mdis) USD 0.022 0.025 0.010 0.007 0.007 0.005 - 0.001 0.006 - - 0.009
Franklin K2 Alternative Strategies FundA (Ydis) EUR -A (Ydis) EUR-H1 -A (Ydis) USD -N (Ydis) EUR-H1 -W (Ydis) EUR-H1*
Y (Mdis) USD 0.019 0.018 0.020 0.019 0.018 0.020 0.017 0.019 0.021 0.021 0.020 0.022
Franklin K2 Global Macro Opportunities FundA (Mdis) USD - - - - - - - - - - - -A (Ydis) EUR -A (Ydis) USD -
Franklin K2 Long Short Credit FundA (Mdis) USD 0.002 0.010 0.013 0.004 0.011 0.015 0.007 0.014 0.023 0.006 0.018 0.012A (Ydis) EUR 0.030A (Ydis) USD 0.032
Franklin MENA FundA (Ydis) USD 0.003W (Qdis) USD 0.047 0.017 - 0.073
Franklin Natural Resources FundA (Ydis) EUR-H1 -A (Ydis) USD -
Franklin NextStep Balanced Growth FundA (Mdis) HKD 0.010 0.010 0.011 0.014 0.009 0.008 0.010 0.014 0.009 0.014 0.013 0.018A (Mdis) SGD-H1 0.011 0.010 0.011 0.014 0.009 0.009 0.009 0.016 0.009 0.013 0.014 0.017A (Mdis) USD 0.012 0.010 0.011 0.014 0.009 0.009 0.010 0.016 0.009 0.014 0.013 0.018
FRANKLIN TEMPLETON INVESTMENT FUNDS
Notes to the Financial StatementsAt June 30, 2018 (continued)
Note 25 — Dividends distributed (continued)
www.franklintempleton.lu Audited Annual Report 183

AnnualDistribution
Jul-2017
Jul-2017
Aug-2017
Sep-2017
Oct-2017
Nov-2017
Dec-2017
Jan-2018
Feb-2018
Mar-2018
Apr-2018
May-2018
Jun-2018
Franklin NextStep Conservative FundA (Mdis) USD 0.013 0.013 0.012 0.020 0.011 0.014 0.014 0.014 0.012 0.023 0.014 0.027W (Mdis) EUR-H1 0.012 0.011 0.011 0.019 0.010 0.014 0.013 0.012 0.012 0.020 0.014 0.026W (Mdis) GBP-H1 0.013 0.013 0.012 0.019 0.012 0.014 0.013 0.014 0.012 0.022 0.014 0.029W (Mdis) USD 0.013 0.012 0.011 0.020 0.010 0.014 0.013 0.014 0.011 0.022 0.014 0.026
Franklin NextStep Dynamic Growth FundA (Mdis) HKD - - - - - - 0.007 0.016 0.007 0.008 0.012 0.013A (Mdis) SGD-H1 0.010 0.007 0.010 0.011 0.006 0.006 0.006 0.016 0.007 0.008 0.012 0.012A (Mdis) USD 0.010 0.008 0.009 0.011 0.006 0.006 0.007 0.016 0.007 0.009 0.011 0.012
Franklin NextStep Growth FundA (Mdis) USD 0.012 0.008 0.007 0.010 0.005 0.006 0.008 0.015 0.006 0.010 0.009 0.015W (Mdis) EUR-H1 0.011 0.007 0.007 0.009 0.005 0.005 0.007 0.013 0.006 0.009 0.008 0.015W (Mdis) GBP-H1 0.012 0.008 0.007 0.009 0.006 0.006 0.007 0.015 0.006 0.010 0.009 0.016W (Mdis) USD 0.011 0.008 0.006 0.010 0.005 0.005 0.008 0.014 0.006 0.009 0.008 0.015
Franklin NextStep Moderate FundA (Mdis) USD 0.012 0.009 0.010 0.013 0.007 0.009 0.010 0.015 0.009 0.014 0.011 0.018W (Mdis) EUR-H1 0.011 0.008 0.008 0.013 0.007 0.008 0.009 0.013 0.008 0.013 0.010 0.017W (Mdis) GBP-H1 0.012 0.009 0.010 0.013 0.007 0.009 0.010 0.014 0.009 0.014 0.010 0.020W (Mdis) USD 0.012 0.009 0.008 0.013 0.007 0.009 0.009 0.014 0.009 0.013 0.010 0.017
Franklin NextStep Stable Growth FundA (Mdis) HKD 0.015 0.014 0.016 0.021 0.014 0.016 0.016 0.017 0.015 0.023 0.018 0.031A (Mdis) SGD-H1 0.014 0.014 0.015 0.021 0.014 0.016 0.016 0.016 0.015 0.022 0.017 0.031A (Mdis) USD 0.014 0.015 0.015 0.022 0.013 0.016 0.016 0.017 0.015 0.022 0.018 0.030
Franklin Real Return FundΩ
A (Ydis) EUR-H1 0.088
Franklin Strategic Income FundA (Mdis) AUD-H1 0.037 0.029 0.034 0.029 0.037 0.030 0.034 0.035 0.037 0.039 0.040 0.046A (Mdis) EUR 0.035 0.025 0.030 0.026 0.032 0.025 0.031 0.030 0.030 0.032 0.034 0.040A (Mdis) EUR-H1 0.034 0.025 0.030 0.026 0.032 0.026 0.031 0.031 0.031 0.034 0.035 0.041A (Mdis) SGD-H1 0.036 0.027 0.032 0.028 0.034 0.027 0.032 0.033 0.033 0.036 0.037 0.043A (Mdis) USD 0.040 0.031 0.035 0.031 0.037 0.030 0.036 0.038 0.036 0.040 0.040 0.047B (Mdis) USD 0.038 0.030 0.034 0.030 0.035 0.029 0.035 0.036 0.035 0.038 0.039 0.044C (Mdis) USD 0.039 0.031 0.034 0.031 0.036 0.030 0.036 0.036 0.036 0.039 0.040 0.045I (Ydis) USD 0.422N (Mdis) EUR-H1 0.034 0.025 0.029 0.026 0.032 0.026 0.030 0.031 0.030 0.033 0.035 0.041W (Mdis) USD 0.039 0.030 0.035 0.030 0.037 0.029 0.036 0.037 0.035 0.040 0.040 0.046Y (Mdis) USD* 0.029 0.037 0.035 0.039 0.040 0.046
Franklin U.S. Dollar Liquid Reserve FundA (Mdis) USD - - - - - - - - - - - -B (Mdis) USD - - - - - - - - - - - -F (Mdis) USD - - - - - - - - - 0.001 0.004 0.008
Franklin U.S. Equity FundY (Mdis) USD 0.004 0.007 0.011 0.011 0.005 0.012 0.009 0.005 0.013 0.011 0.003 0.009
Franklin U.S. Government FundA (Mdis) HKD 0.016 0.014 0.015 0.014 0.014 0.015 0.015 0.015 0.017 0.017 0.016 0.017A (Mdis) USD 0.015 0.013 0.014 0.013 0.013 0.014 0.014 0.014 0.016 0.016 0.015 0.016B (Mdis) USD 0.005 0.003 0.004 0.003 0.003 0.004 0.004 0.005 0.007 0.007 0.006 0.007I (Mdis) JPY-H1 1.943 1.741 1.840 1.738 1.734 1.830 1.823 1.816 2.008 2.002 1.899 1.995I (Mdis) USD 0.020 0.018 0.019 0.018 0.018 0.019 0.019 0.019 0.021 0.021 0.020 0.021N (Mdis) USD 0.010 0.008 0.009 0.008 0.008 0.009 0.009 0.009 0.011 0.011 0.010 0.011W (Mdis) USD 0.019 0.017 0.018 0.017 0.017 0.018 0.018 0.019 0.021 0.021 0.020 0.021Z (Mdis) USD 0.018 0.016 0.017 0.016 0.016 0.017 0.017 0.017 0.019 0.019 0.018 0.019
Franklin U.S. Low Duration FundA (Mdis) USD 0.011 0.009 0.008 0.009 0.009 0.012 0.009 0.011 0.012 0.017 0.015 0.017B (Mdis) USD - - - - - - - - - - - -C (Mdis) USD - - - - - - - - - - - -N (Mdis) USD - - - - - - - - - - - -W (Qdis) USD 0.038 0.036 0.041 0.052Y (Mdis) USD* 0.015 0.020 0.020 0.027 0.024 0.027
Franklin U.S. Opportunities FundA (Ydis) EUR -A (Ydis) GBP -X (Ydis) USD 0.055Y (Mdis) USD 0.005 0.001 0.009 0.004 0.002 0.008 0.005 0.001 0.008 0.004 0.003 0.010
FRANKLIN TEMPLETON INVESTMENT FUNDS
Notes to the Financial StatementsAt June 30, 2018 (continued)
Note 25 — Dividends distributed (continued)
184 Audited Annual Report www.franklintempleton.lu

AnnualDistribution
Jul-2017
Jul-2017
Aug-2017
Sep-2017
Oct-2017
Nov-2017
Dec-2017
Jan-2018
Feb-2018
Mar-2018
Apr-2018
May-2018
Jun-2018
Franklin Mutual European FundA (Ydis) EUR 0.162A (Ydis) GBP 0.140B (Ydis) EUR -I (Ydis) EUR 0.291W (Ydis) EUR 0.174Y (Mdis) EUR 0.048 0.023 0.025 0.005 0.002 0.021 0.003 0.008 0.018 0.022 0.048 0.121
Franklin Mutual Global Discovery FundA (Ydis) EUR 0.110A (Ydis) GBP 0.100
Franklin Mutual U.S. Value FundA (Ydis) USD -
Templeton Africa FundA (Ydis) EUR 0.100A (Ydis) EUR-H1 0.079
Templeton ASEAN FundΩ
A (Ydis) USD 0.073
Templeton Asian Bond FundA (Mdis) AUD-H1 0.038 0.038 0.037 0.039 0.040 0.033 0.041 0.039 0.037 0.041 0.040 0.035A (Mdis) EUR 0.047 0.044 0.042 0.044 0.044 0.037 0.047 0.044 0.039 0.044 0.043 0.040A (Mdis) SGD 0.041 0.040 0.038 0.039 0.040 0.033 0.042 0.039 0.035 0.040 0.039 0.035A (Mdis) SGD-H1 0.038 0.037 0.036 0.037 0.037 0.032 0.039 0.038 0.034 0.039 0.038 0.033A (Mdis) USD 0.053 0.052 0.049 0.053 0.051 0.044 0.055 0.055 0.046 0.055 0.052 0.046B (Mdis) USD 0.051 0.051 0.048 0.050 0.049 0.043 0.053 0.052 0.044 0.053 0.050 0.044C (Mdis) USD 0.053 0.051 0.048 0.051 0.051 0.043 0.054 0.053 0.046 0.053 0.051 0.045I (Mdis) EUR 0.049 0.047 0.044 0.046 0.047 0.039 0.049 0.046 0.042 0.046 0.045 0.043I (Ydis) EUR-H1 0.480N (Mdis) USD 0.052 0.052 0.048 0.052 0.050 0.043 0.055 0.053 0.046 0.053 0.051 0.045W (Mdis) USD 0.040 0.039 0.037 0.040 0.039 0.033 0.041 0.041 0.036 0.041 0.039 0.035X (Ydis) USDΩ 0.447Y (Mdis) USD 0.045 0.045 0.042 0.045 0.045 0.037 0.048 0.047 0.041 0.047 0.045 0.040
Templeton Asian Dividend FundΩ
A (Mdis) USD 0.017 0.017 0.021 0.023Y (Mdis) USD 0.033 0.027 0.035 0.038
Templeton Asian Growth FundA (Ydis) EUR 0.072A (Ydis) GBP 0.062A (Ydis) USD 0.081I (Ydis) EUR-H2 0.080W (Ydis) EUR 0.128X (Ydis) USDΩ 0.202Y (Mdis) USD 0.022 0.025 0.034 0.012 0.016 0.007 0.015 0.001 0.012 0.042 0.017 0.047Z (Ydis) EUR-H1 0.077Z (Ydis) USD 0.071
Templeton Asian Smaller Companies FundA (Ydis) USD 0.008I (Ydis) USD 0.020W (Ydis) EUR-H1*
W (Ydis) USD*
X (Ydis) USD 0.227Y (Mdis) USD 0.027 0.056 0.039 0.011 0.001 0.002 0.033 0.002 - 0.013 0.021 0.022
Templeton China FundA (Ydis) EUR -A (Ydis) GBP -I (Ydis) GBP -W (Ydis) EUR 0.067
Templeton Eastern Europe FundA (Ydis) EUR -B (Ydis) EUR -
Templeton Emerging Markets FundA (Ydis) USD -W (Ydis) EUR-H1*
Templeton Emerging Markets Balanced FundA (Mdis) HKD* 0.034 0.051A (Mdis) SGD-H1* 0.044A (Mdis) USD* 0.034 0.051A (Qdis) USD 0.075 0.071 0.077 0.107A (Ydis) EUR 0.249A (Ydis) EUR-H1 0.177
FRANKLIN TEMPLETON INVESTMENT FUNDS
Notes to the Financial StatementsAt June 30, 2018 (continued)
Note 25 — Dividends distributed (continued)
www.franklintempleton.lu Audited Annual Report 185

AnnualDistribution
Jul-2017
Jul-2017
Aug-2017
Sep-2017
Oct-2017
Nov-2017
Dec-2017
Jan-2018
Feb-2018
Mar-2018
Apr-2018
May-2018
Jun-2018
Templeton Emerging Markets Bond FundA (Mdis) AUD-H1 0.059 0.061 0.064 0.059 0.064 0.065 0.064 0.062 0.060 0.068 0.060 0.063A (Mdis) HKD 0.064 0.064 0.067 0.061 0.063 0.066 0.068 0.066 0.060 0.070 0.060 0.064A (Mdis) SGD-H1 0.057 0.058 0.060 0.055 0.057 0.059 0.060 0.059 0.054 0.062 0.054 0.059A (Mdis) USD 0.070 0.071 0.072 0.067 0.069 0.072 0.074 0.073 0.065 0.076 0.065 0.070A (Mdis) ZAR-H1 0.189 0.775 0.775 0.740 0.813 0.786 0.723 0.733 0.721 0.853 0.784 0.837A (Qdis) EUR 0.330 0.310 0.313 0.303A (Qdis) GBP 0.251 0.237 0.244 0.227A (Qdis) USD 0.372 0.363 0.370 0.370A (Ydis) EUR-H1 0.683B (Mdis) USD 0.069 0.069 0.070 0.065 0.067 0.069 0.072 0.070 0.063 0.073 0.062 0.068B (Qdis) USD 0.329 0.319 0.325 0.322F (Mdis) USD 0.075 0.076 0.078 0.072 0.074 0.077 0.078 0.078 0.070 0.081 0.069 0.075I (Qdis) GBP-H1 0.194 0.188 0.196 0.190I (Qdis) USD 0.296 0.289 0.296 0.296I (Ydis) EUR-H1 0.693N (Mdis) USD 0.064 0.064 0.066 0.061 0.063 0.066 0.067 0.066 0.059 0.069 0.059 0.064N (Qdis) PLN-H1 0.212 0.215 0.213 0.216W (Qdis) EUR 0.234 0.220 0.223 0.216W (Qdis) GBP 0.228 0.215 0.222 0.207W (Qdis) GBP-H1 0.201 0.195 0.204 0.196W (Qdis) USD 0.182 0.178 0.182 0.182W (Ydis) EUR-H1*
Y (Mdis) USD 0.077 0.077 0.078 0.074 0.075 0.079 0.080 0.080 0.072 0.083 0.072 0.078Z (Mdis) USD 0.061 0.062 0.064 0.059 0.061 0.063 0.065 0.064 0.057 0.067 0.058 0.062
Templeton Emerging Markets Local Currency Bond Fund*
A (Mdis) EUR-H1 - 0.119 0.103 0.087A (Ydis) EURI (Qdis) USD 0.119I (Ydis) EURI (Ydis) EUR-H1N (Qdis) EUR-H1 0.119W (Qdis) EUR-H1 0.119W (Qdis) GBP-H1 0.118W (Qdis) USD 0.119
Templeton Emerging Markets Smaller Companies FundA (Ydis) GBP -A (Ydis) USD -W (Ydis) EUR-H1*
Y (Mdis) USD 0.020 0.038 0.024 0.011 0.003 0.003 0.019 0.003 - 0.010 0.033 0.024Y (Ydis) JPY*
Templeton Euroland FundA (Ydis) EUR 0.190B (Ydis) EUR -
Templeton European FundA (Ydis) USD 0.209
Templeton Frontier Markets FundA (Ydis) GBP 0.181A (Ydis) USD 0.138I (Ydis) GBP 0.432Z (Ydis) EUR-H1 0.120
Templeton Global FundA (Ydis) USD 0.093W (Ydis) USD 0.107X (Ydis) USD 0.173
Templeton Global Balanced FundA (Qdis) USD 0.240 0.180 0.180 0.130C (Qdis) USD 0.139 0.104 0.104 0.075I (Ydis) USD 0.362X (Ydis) USD 0.278
FRANKLIN TEMPLETON INVESTMENT FUNDS
Notes to the Financial StatementsAt June 30, 2018 (continued)
Note 25 — Dividends distributed (continued)
186 Audited Annual Report www.franklintempleton.lu

AnnualDistribution
Jul-2017
Jul-2017
Aug-2017
Sep-2017
Oct-2017
Nov-2017
Dec-2017
Jan-2018
Feb-2018
Mar-2018
Apr-2018
May-2018
Jun-2018
Templeton Global Bond FundA (Mdis) AUD-H1 0.062 0.058 0.061 0.056 0.060 0.058 0.061 0.060 0.059 0.061 0.057 0.058A (Mdis) CAD-H1 0.056 0.052 0.056 0.048 0.055 0.052 0.054 0.054 0.053 0.055 0.049 0.052A (Mdis) EUR 0.096 0.087 0.089 0.079 0.085 0.083 0.089 0.086 0.079 0.082 0.078 0.084A (Mdis) EUR-H1 0.067 0.063 0.065 0.060 0.063 0.061 0.066 0.064 0.060 0.063 0.060 0.062A (Mdis) GBP 0.084 0.078 0.083 0.070 0.076 0.073 0.078 0.076 0.070 0.073 0.068 0.074A (Mdis) GBP-H1 0.056 0.052 0.055 0.047 0.052 0.049 0.053 0.052 0.050 0.052 0.048 0.052A (Mdis) HKD 0.060 0.056 0.057 0.052 0.053 0.053 0.058 0.058 0.052 0.057 0.051 0.053A (Mdis) RMB-H1 0.619 0.584 0.591 0.534 0.569 0.562 0.599 0.593 0.543 0.591 0.548 0.572A (Mdis) SGD 0.065 0.061 0.062 0.055 0.058 0.057 0.061 0.061 0.055 0.058 0.054 0.056A (Mdis) SGD-H1 0.067 0.063 0.065 0.058 0.061 0.060 0.065 0.064 0.059 0.063 0.058 0.061A (Mdis) USD 0.110 0.102 0.105 0.095 0.099 0.097 0.106 0.107 0.095 0.103 0.093 0.097A (Ydis) CHF-H1 0.566A (Ydis) EUR 1.009A (Ydis) EUR-H1 0.552B (Mdis) USD 0.111 0.103 0.106 0.095 0.099 0.098 0.106 0.107 0.095 0.102 0.094 0.096C (Mdis) USD 0.083 0.077 0.079 0.072 0.074 0.073 0.080 0.080 0.071 0.077 0.071 0.072F (Mdis) USD 0.057 0.054 0.055 0.049 0.052 0.051 0.055 0.055 0.049 0.054 0.049 0.050I (Mdis) EUR 0.081 0.073 0.075 0.068 0.072 0.070 0.075 0.074 0.066 0.070 0.067 0.071I (Mdis) GBP 0.079 0.074 0.078 0.066 0.072 0.069 0.075 0.071 0.067 0.069 0.064 0.070I (Mdis) GBP-H1 0.062 0.058 0.061 0.052 0.058 0.055 0.059 0.058 0.056 0.058 0.054 0.058I (Mdis) JPY 7.439 6.989 7.084 6.415 6.836 6.743 7.309 7.182 6.194 6.670 6.311 6.432I (Mdis) JPY-H1 5.590 5.161 5.284 4.870 5.085 4.929 5.353 5.247 4.594 5.122 4.843 4.859I (Ydis) EUR 0.890I (Ydis) EUR-H1 0.564N (Mdis) EUR-H1 0.077 0.072 0.074 0.069 0.073 0.070 0.075 0.074 0.068 0.073 0.068 0.072N (Mdis) USD 0.057 0.054 0.056 0.050 0.052 0.051 0.056 0.056 0.050 0.054 0.049 0.050N (Ydis) EUR-H1 0.550S (Mdis) EUR 0.055 0.049 0.051 0.046 0.049 0.047 0.052 0.051 0.045 0.048 0.045 0.048W (Mdis) EUR 0.063 0.057 0.058 0.052 0.056 0.055 0.058 0.057 0.052 0.054 0.052 0.055W (Mdis) GBP 0.069 0.065 0.068 0.058 0.063 0.060 0.066 0.062 0.058 0.061 0.056 0.062W (Mdis) GBP-H1 0.058 0.055 0.057 0.049 0.054 0.052 0.056 0.054 0.051 0.055 0.051 0.054W (Mdis) USD 0.052 0.049 0.049 0.045 0.047 0.046 0.050 0.051 0.045 0.049 0.045 0.046W (Ydis) CHF-H1*
W (Ydis) EUR 0.659W (Ydis) EUR-H1 0.508Y (Mdis) USD 0.063 0.059 0.061 0.055 0.057 0.056 0.061 0.061 0.055 0.060 0.054 0.056Z (Mdis) GBP-H1 0.058 0.054 0.058 0.051 0.053 0.052 0.056 0.054 0.051 0.054 0.051 0.055Z (Mdis) USD 0.056 0.052 0.054 0.048 0.050 0.050 0.054 0.054 0.049 0.052 0.048 0.050Z (Ydis) EUR-H1 0.557
Templeton Global Bond (Euro) FundA (Ydis) EUR 0.395N (Ydis) EUR 0.309
Templeton Global Climate Change FundA (Ydis) EUR 0.075
Templeton Global Equity Income FundA (Mdis) RMB-H1 0.342 0.342 0.375 0.375 0.375 0.354 0.333 0.333 0.334 0.334 0.334 0.356A (Mdis) SGD 0.021 0.021 0.023 0.023 0.023 0.021 0.020 0.020 0.020 0.020 0.020 0.021A (Mdis) USD 0.032 0.032 0.035 0.035 0.035 0.033 0.031 0.031 0.031 0.031 0.031 0.033AS (Mdis) SGD 0.033 0.033 0.036 0.036 0.036 0.034 0.031 0.031 0.031 0.031 0.031 0.033B (Qdis) USD 0.091 0.099 0.088 0.087N (Mdis) USD 0.030 0.030 0.032 0.032 0.032 0.030 0.029 0.029 0.029 0.029 0.028 0.030Y (Mdis) USD 0.039 0.039 0.042 0.042 0.042 0.040 0.038 0.038 0.038 0.038 0.038 0.040Z (Qdis) USD 0.106 0.117 0.103 0.103
Templeton Global High Yield FundA (Mdis) EUR 0.049 0.047 0.048 0.049 0.051 0.049 0.049 0.047 0.044 0.046 0.045 0.048A (Mdis) USD 0.057 0.055 0.057 0.059 0.058 0.058 0.059 0.058 0.052 0.058 0.054 0.055
Templeton Global Income FundA (Mdis) SGD-H1 0.035 0.028 0.043 0.031 0.026 0.029 0.028 0.021 0.033 0.031 0.036 0.077A (Qdis) EUR-H1 0.123 0.100 0.081 0.084A (Qdis) HKD 0.163 0.127 0.104 0.108A (Qdis) USD 0.186 0.146 0.119 0.124B (Qdis) USD 0.180 0.141 0.115 0.118C (Qdis) USD 0.183 0.144 0.116 0.121N (Qdis) EUR-H1 0.122 0.099 0.080 0.083
Templeton Global Smaller Companies FundA (Ydis) USD -
FRANKLIN TEMPLETON INVESTMENT FUNDS
Notes to the Financial StatementsAt June 30, 2018 (continued)
Note 25 — Dividends distributed (continued)
www.franklintempleton.lu Audited Annual Report 187

AnnualDistribution
Jul-2017
Jul-2017
Aug-2017
Sep-2017
Oct-2017
Nov-2017
Dec-2017
Jan-2018
Feb-2018
Mar-2018
Apr-2018
May-2018
Jun-2018
Templeton Global Total Return FundA (Mdis) AUD-H1 0.066 0.066 0.066 0.062 0.065 0.061 0.062 0.064 0.070 0.073 0.070 0.070A (Mdis) EUR 0.087 0.082 0.081 0.074 0.078 0.073 0.078 0.078 0.079 0.083 0.082 0.087A (Mdis) EUR-H1 0.062 0.059 0.059 0.055 0.058 0.054 0.057 0.058 0.061 0.064 0.063 0.065A (Mdis) GBP 0.076 0.075 0.075 0.065 0.070 0.064 0.069 0.067 0.071 0.074 0.072 0.076A (Mdis) GBP-H1 0.049 0.048 0.048 0.042 0.046 0.042 0.044 0.045 0.048 0.051 0.049 0.052A (Mdis) HKD 0.066 0.064 0.063 0.058 0.059 0.057 0.061 0.063 0.063 0.069 0.065 0.066A (Mdis) RMB-H1 0.662 0.646 0.629 0.587 0.614 0.580 0.612 0.623 0.641 0.701 0.674 0.694A (Mdis) SGD 0.069 0.067 0.066 0.061 0.062 0.059 0.063 0.064 0.064 0.069 0.067 0.068A (Mdis) SGD-H1 0.065 0.063 0.062 0.058 0.060 0.056 0.059 0.061 0.063 0.068 0.065 0.066A (Mdis) USD 0.100 0.097 0.095 0.089 0.090 0.086 0.092 0.096 0.095 0.104 0.098 0.100A (Ydis) CHF-H1 0.666A (Ydis) EUR 1.015A (Ydis) EUR-H1 0.667B (Mdis) USD 0.097 0.093 0.092 0.085 0.087 0.082 0.088 0.092 0.091 0.100 0.093 0.096C (Mdis) USD 0.087 0.085 0.083 0.077 0.079 0.075 0.080 0.084 0.083 0.091 0.085 0.087I (Mdis) EUR 0.086 0.082 0.080 0.074 0.077 0.073 0.077 0.077 0.079 0.083 0.081 0.086I (Mdis) GBP 0.090 0.088 0.088 0.077 0.082 0.076 0.081 0.080 0.084 0.087 0.085 0.090I (Mdis) GBP-H1 0.070 0.068 0.069 0.060 0.065 0.059 0.058 0.064 0.069 0.072 0.070 0.073I (Mdis) JPY 8.025 7.807 7.618 7.110 7.415 7.022 7.544 7.612 7.388 7.987 7.835 7.872I (Mdis) JPY-H1 5.765 5.493 5.427 5.150 5.261 4.897 5.268 5.306 5.225 5.846 5.733 5.668I (Qdis) USD* 0.122 0.192I (Ydis) EUR 1.024I (Ydis) EUR-H1 0.677N (Mdis) EUR-H1 0.071 0.068 0.069 0.065 0.068 0.062 0.067 0.067 0.069 0.075 0.072 0.076N (Mdis) USD 0.051 0.051 0.049 0.046 0.046 0.045 0.047 0.050 0.049 0.054 0.050 0.052N (Ydis) EUR-H1 0.664S (Ydis) USD 0.633W (Mdis) EUR 0.067 0.062 0.061 0.057 0.059 0.056 0.059 0.059 0.060 0.064 0.062 0.066W (Mdis) GBP 0.074 0.072 0.073 0.063 0.067 0.063 0.066 0.066 0.069 0.071 0.070 0.074W (Mdis) GBP-H1 0.054 0.052 0.053 0.047 0.051 0.046 0.049 0.050 0.053 0.056 0.055 0.057W (Mdis) USD 0.055 0.053 0.052 0.048 0.049 0.047 0.051 0.052 0.052 0.057 0.054 0.055W (Ydis) CHF-H1*
W (Ydis) EUR 0.758W (Ydis) EUR-H1*
X (Ydis) USD 0.708Y (Mdis) USD 0.068 0.065 0.065 0.060 0.061 0.059 0.062 0.066 0.065 0.071 0.067 0.068Z (Mdis) GBP-H1 0.062 0.061 0.061 0.054 0.058 0.054 0.057 0.057 0.061 0.065 0.062 0.066Z (Mdis) USD 0.060 0.058 0.058 0.053 0.055 0.052 0.055 0.058 0.058 0.063 0.059 0.061Z (Ydis) EUR-H1 0.667
Templeton Growth (Euro) FundA (Ydis) EUR 0.063A (Ydis) USD 0.072B (Ydis) EUR -I (Ydis) EUR 0.197I (Ydis) USD 0.227W (Ydis) EUR 0.062
Templeton Latin America FundA (Ydis) EUR 0.352A (Ydis) GBP 0.297A (Ydis) USD 0.401I (Ydis) EUR-H2 0.127W (Ydis) USD 0.122
*These fund/ or share classes were launched during the year under reviewΩThese fund/ or share classes were closed during the year under review
Note 26 — Portfolio Turnover RatioThe portfolio turnover ratio, expressed as a percentage, is equal to the total of purchases and sales of securities netted against the absolute valueof subscriptions and redemptions, over average net assets of the Fund for the year. It is effectively a measure of how frequently a Fund buys or sellssecurities.
The portfolio turnover ratio calculation is not applicable to Liquid Reserve and Money Market Funds, as such a ratio is not relevant to such Fundsdue to the short-term nature of the investments.
Note 27 — Total Expense RatioThe Total Expense Ratio (“TER”), expressed as a percentage, represents how the total expenses of the Funds relate to the average net assets of theFunds for the year ended June 30, 2018. The total expenses comprise the investment management fees, the administration and transfer agency fees,the custodian fees and other expenses as summarised in the “Statement of Operations and Changes in Net Assets”.
For share classes launched during the year, the TER is annualised.
FRANKLIN TEMPLETON INVESTMENT FUNDS
Notes to the Financial StatementsAt June 30, 2018 (continued)
Note 25 — Dividends distributed (continued)
188 Audited Annual Report www.franklintempleton.lu

The audited annual reports and unaudited semi-annual reports are available on the following Franklin Templeton Investments website,www.franklintempleton.lu, or may be obtained, free of charge, on request at the registered office of the Company. They are only distributed toregistered Shareholders in those countries where local regulation so requires.
Note 29 — Global Credit FacilityEffective February 9, 2018, the Company, together with other European and U.S. registered investment funds managed by Franklin TempletonInvestments (individually, “Borrower”; collectively “Borrowers”), entered into a joint syndicated senior unsecured credit facility totaling USD2,000 million (Global Credit Facility) to provide a source of funds to the Borrowers for temporary and emergency purposes, including the abilityto meet future unanticipated or unusually large redemption requests.
Under the terms of the Global Credit Facility, the Company will, in addition to interest charged on any borrowings made by the Company and othercosts incurred by the Company, pay its share of fees and expenses incurred in connection with the implementation and maintenance of the GlobalCredit Facility, based upon its relative share of the aggregate net assets of all of the Borrowers, including an annual commitment fee based uponthe unused portion of the Global Credit Facility.
During the financial year ended June 30, 2018, the Company did not use the Global Credit Facility.
Note 30 — AbbreviationsCountries
ARE United Arab EmiratesARG ArgentinaAUS AustraliaAUT AustriaBEL BelgiumBGD BangladeshBHR BahrainBIH Bosnia and HerzegovinaBMU BermudaBRA BrazilCAN CanadaCHE SwitzerlandCHL ChileCHN ChinaCIV Ivory CoastCOL ColombiaCYM Cayman IslandsCZE Czech RepublicDEU GermanyDNK DenmarkECU EcuadorEGY EgyptESP SpainEST Estonia
ETH EthiopiaFIN FinlandFRA FranceGBR United KingdomGEO GeorgiaGHA GhanaGRC GreeceHKG Hong KongHUN HungaryIDN IndonesiaIMN Isle of ManIND IndiaIRL IrelandISL IcelandISR IsraelITA ItalyJEY JerseyJPN JapanKAZ KazakhstanKEN KenyaKHM CambodiaKOR South KoreaKWT KuwaitLKA Sri Lanka
LTU LithuaniaLUX LuxembourgLVA LatviaMAC MacaoMAR MoroccoMDA MoldovaMEX MexicoMUS MauritiusMWI MalawiMYS MalaysiaNGA NigeriaNLD NetherlandsNOR NorwayNZL New ZealandOMN OmanPAK PakistanPAN PanamaPER PeruPHL PhilippinesPOL PolandPRT PortugalPRY ParaguayQAT QatarROU Romania
RUS RussiaSAU Saudi ArabiaSEN SenegalSGP SingaporeSLV El SalvadorSP SupranationalSRB SerbiaSVK SlovakiaSWE SwedenTGO TogoTHA ThailandTUR TurkeyTWN TaiwanTZA TanzaniaUKR UkraineURY UruguayUSA United StatesVNM VietnamZAF South AfricaZMB ZambiaZWE Zimbabwe
Currencies
AED United Arab Emirates DirhamARS Argentine PesoAUD Australian DollarBDT Bangladeshi TakaBRL Brazilian RealCAD Canadian DollarCHF Swiss FrancCLP Chilean PesoCNY Chinese Yuan RenminbiCOP Colombian PesoCZK Czech KorunaDEM Deutsche MarkDKK Danish Krone
EGP Egyptian PoundEUR EuroGBP British Pound SterlingGHS Ghanaian CediHKD Hong Kong DollarHUF Hungarian ForintIDR Indonesian RupiahILS Israeli ShekelINR Indian RupeeJPY Japanese YenKES Kenyan ShillingKRW South Korean WonKWD Kuwaiti Dinar
LKR Sri Lanka RupeeMUR Mauritius RupeeMXN Mexican PesoMYR Malaysian RinggitNGN Nigerian NairaNOK Norwegian KroneNZD New Zealand DollarOMR Omani RialPEN Peruvian Nuevo SolPHP Philippine PesoPKR Pakistan RupeePLN Polish ZlotyQAR Qatari Rial
RON New Romanian LeuRUB Russian RubleSEK Swedish KronaSGD Singapore DollarTHB Thai BahtTRY Turkish LiraTWD New Taiwan DollarUSD US DollarVND Vietnamese DongXOF CFA Franc BCEAOZAR South African Rand
Note 31 —Subsequent eventsThe Franklin U.S. Equity Fund is renamed Franklin Select U.S. Equity Fund from August 1, 2018.
On November 23, 2018, Templeton European Fund will merge into Templeton Euroland Fund.
FRANKLIN TEMPLETON INVESTMENT FUNDS
Notes to the Financial StatementsAt June 30, 2018 (continued)
Note 28 — Audited annual reports and unaudited semi-annual reports
www.franklintempleton.lu Audited Annual Report 189

Calculation Method of the Risk Exposure
Global exposure using the VaR approach
Regulatory VaR limit utilisation
FundMarketRisk Limit Lowest Highest Average Reference portfolio Model type
ConfidenceInterval
Holdingperiod
Observationperiod Leverage*
Franklin BrazilOpportunities Fund
RelativeVaR
200% 24.71% 90.46% 63.38% MSCI Brazil Index (10%)and J.P.Morgan EMBIBrazil Plus Index (90%)
Monte CarloSimulation
99thPercentile
20-Day 1 Jul 2017to 30 Jun
2018
284.11%
Franklin DiversifiedBalanced Fund
AbsoluteVaR
20% 1.49% 3.63% 2.96% N/A Monte CarloSimulation
99thPercentile
20-Day 1 Jul 2017to 30 Jun
2018
169.22%
Franklin DiversifiedConservative Fund
AbsoluteVaR
20% 1.28% 2.07% 1.75% N/A Monte CarloSimulation
99thPercentile
20-Day 1 Jul 2017to 30 Jun
2018
140.43%
Franklin DiversifiedDynamic Fund
AbsoluteVaR
20% 1.62% 4.84% 3.99% N/A Monte CarloSimulation
99thPercentile
20-Day 1 Jul 2017to 30 Jun
2018
181.95%
Franklin FlexibleAlpha Bond Fund
AbsoluteVaR
20% 0.30% 0.62% 0.49% N/A Monte CarloSimulation
99thPercentile
20-Day 1 Jul 2017to 30 Jun
2018
109.63%
Franklin GlobalAggregate BondFund
RelativeVaR
200% 84.49% 124.92% 100.60% Bloomberg BarclaysGlobal AggregateIndex (100%)
Monte CarloSimulation
99thPercentile
20-Day 1 Jul 2017to 30 Jun
2018
10.96%
Franklin GlobalMulti-AssetIncome Fund
RelativeVaR
200% 41.01% 85.97% 62.24% Bloomberg BarclaysMultiverse EUR Hedged (55%),the MSCI All CountryWorld Index (40%)and the BloombergCommodity TotalReturn Index (5%)
Monte CarloSimulation
99thPercentile
20-Day 1 Jul 2017to 30 Jun
2018
179.49%
Franklin K2AlternativeStrategies Fund
AbsoluteVaR
20% 0.83% 4.40% 1.99% N/A Monte CarloSimulation
99thPercentile
20-Day 1 Jul 2017to 30 Jun
2018
193.39%
Franklin K2Global MacroOpportunitiesFund
AbsoluteVaR
20% 1.68% 8.82% 4.58% N/A Monte CarloSimulation
99thPercentile
20-Day 1 Jul 2017to 30 Jun
2018
630.54%
Franklin K2Long ShortCredit Fund
AbsoluteVaR
20% 0.59% 2.19% 1.08% N/A Monte CarloSimulation
99thPercentile
20-Day 1 Jul 2017to 30 Jun
2018
62.74%
Franklin StrategicIncome Fund
RelativeVaR
200% 52.96% 61.92% 56.59% US High Yield (10%),US Mortgage-Backed (10%),US Government (10%),US Credit Corporates (10%),US CommercialMortgage-Backed (5%),Global Treasury ex-US (10%),US Dollar Emerging MarketsSovereign (10%),Emerging Market LocalCurrency Government (10%)and Global High Yield (25%).
Monte CarloSimulation
99thPercentile
20-Day 1 Jul 2017to 30 Jun
2018
37.92%
Franklin U.S. LowDuration Fund
RelativeVaR
200% 75% 113.46% 92.92% Bloomberg Barclays USGovernment/Credit 1-3Y Index.
Monte CarloSimulation
99thPercentile
20-Day 1 Jul 2017to 30 Jun
2018
47.89%
Templeton AsianBond Fund
RelativeVaR
200% 82.12% 95.38% 87.69% JPMorgan Government BondIndex-EmergingMarkets BroadDiversifiedAsia Index (100%)
Monte CarloSimulation
99thPercentile
20-Day 1 Jul 2017to 30 Jun
2018
77.30%
FRANKLIN TEMPLETON INVESTMENT FUNDS
Additional Information - Unaudited
190 Audited Annual Report www.franklintempleton.lu

Calculation Method of the Risk Exposure (continued)
Global exposure using the VaR approach (continued)
Regulatory VaR limit utilisation
FundMarketRisk Limit Lowest Highest Average Reference portfolio Model type
ConfidenceInterval
Holdingperiod
Observationperiod Leverage*
Templeton EmergingMarketsBond Fund
RelativeVaR
200% 80.19% 102.85% 91.21% J.P. Morgan Emerging Markets BondIndex Global (EMBIG) (50%) andJ.P. MorganGovernment BondIndex-EmergingMarkets (GBI-EM) (50%).
Monte CarloSimulation
99thPercentile
20-Day 1 Jul 2017to 30 Jun
2018
55.96%
Templeton EmergingMarkets LocalCurrencyBond Fund**
RelativeVaR
200% 39.40% 100.75% 86.57% JP Morgan GBI-EM GlobalDiversified Index (100%)
Monte CarloSimulation
99thPercentile
20-Day 20 Feb 2018to 30 Jun
2018
2.30%
TempletonGlobal BondFund
RelativeVaR
200% 98.51% 111.21% 104.60% J.P. Morgan Government BondIndex Broad (JGBI Broad) (50%),J.P. Morgan Emerging MarketsBond Index Global (EMBIG) (25%)and J.P. Morgan Government BondIndex-EmergingMarkets (GBI-EM) (25%).
Monte CarloSimulation
99thPercentile
20-Day 1 Jul 2017to 30 Jun
2018
133.11%
Templeton GlobalCurrency Fund
RelativeVaR
200% 54.53% 80.08% 70.05% J.P. Morgan 3 MonthGlobal Cash Index (50%)and the J.P. Morgan EmergingMarkets Currency Index (50%)
Monte CarloSimulation
99thPercentile
20-Day 1 Jul 2017to 30 Jun
2018
87.96%
Templeton GlobalHighYield Fund
RelativeVaR
200% 78.42% 96.15% 88.31% J.P. Morgan GlobalHigh Yield Index (50%),J.P. Morgan Emerging Markets BondIndex Global (EMBIG) (25%) andJ.P. Morgan Government Bond Index-EmergingMarkets (GBI-EM) (25%).
Monte CarloSimulation
99thPercentile
20-Day 1 Jul 2017to 30 Jun
2018
32.67%
Templeton GlobalIncome Fund
RelativeVaR
200% 129.00% 171.56% 138.30% MSCI All Country World Index (50%),the Bloomberg BarclaysMultiverse Index (25%),the Bloomberg Barclays GlobalHigh-Yield Index (12.5%),the J.P. Morgan Emerging MarketsBond Index Global (EMBIG) (6.25%)and the J.P. MorganGovernment Bond Index-Emerging Markets(GBI-EM) (6.25%).
Monte CarloSimulation
99thPercentile
20-Day 1 Jul 2017to 30 Jun
2018
52.92%
Templeton GlobalTotalReturn Fund
RelativeVaR
200% 128.16% 146.03% 136.73% Bloomberg Barclays MultiverseIndex (50%),the Bloomberg Barclays GlobalHigh-Yield Index (25%),the J.P. Morgan EmergingMarkets BondIndex Global (EMBIG) (12.5%) andthe J.P. Morgan GovernmentBond Index-EmergingMarkets (GBI-EM) (12.5%)
Monte CarloSimulation
99thPercentile
20-Day 1 Jul 2017to 30 Jun
2018
124.02%
*The level of leverage calculation method used is the sum of notional approach in line with CSSF Circular 11/512
**This Fund was launched during the year
FRANKLIN TEMPLETON INVESTMENT FUNDS
Additional Information - Unaudited (continued)
www.franklintempleton.lu Audited Annual Report 191

Calculation Method of the Risk Exposure (continued)
Global exposure using the commitment approach
Franklin Asia Credit FundFranklin Biotechnology Discovery FundFranklin Euro Government Bond FundFranklin Euro High Yield FundFranklin Euro Short Duration Bond FundFranklin Euro Short-Term Money Market FundFranklin European Fund*Franklin European Corporate Bond FundFranklin European Dividend FundFranklin European Growth FundFranklin European Income FundFranklin European Small-Mid Cap Growth FundFranklin European Total Return FundFranklin GCC Bond FundFranklin Global Aggregate Investment Grade Bond FundFranklin Global Convertible Securities FundFranklin Global Equity Strategies Fund*Franklin Global Fundamental Strategies FundFranklin Global Growth Fund*Franklin Global High Income Bond Fund*Franklin Global Listed Infrastructure FundFranklin Global Real Estate FundFranklin Global Small-Mid Cap Growth FundFranklin Gold and Precious Metals FundFranklin High Yield FundFranklin Income FundFranklin India FundFranklin Japan FundFranklin MENA FundFranklin Natural Resources FundFranklin NextStep Balanced Growth FundFranklin NextStep Conservative FundFranklin NextStep Dynamic Growth FundFranklin NextStep Growth FundFranklin NextStep Moderate Fund
Franklin NextStep Stable Growth FundFranklin Real Return Fund*Franklin Technology FundFranklin U.S. Dollar Liquid Reserve FundFranklin U.S. Equity FundFranklin U.S. Government FundFranklin U.S. Opportunities FundFranklin U.S. Small-Mid Cap Growth Fund*Franklin World Perspectives FundFranklin Mutual European FundFranklin Mutual Global Discovery FundFranklin Mutual U.S. Value Fund**Templeton Africa FundTempleton ASEAN Fund*Templeton Asian Dividend Fund*Templeton Asian Growth FundTempleton Asian Smaller Companies FundTempleton BRIC FundTempleton China FundTempleton Eastern Europe FundTempleton Emerging Markets FundTempleton Emerging Markets Balanced FundTempleton Emerging Markets Smaller Companies FundTempleton Euroland FundTempleton European FundTempleton Frontier Markets FundTempleton Global FundTempleton Global Balanced FundTempleton Global Bond (Euro) FundTempleton Global Climate Change Fund***Templeton Global Equity Income FundTempleton Global Smaller Companies FundTempleton Growth (Euro) FundTempleton Korea Fund*Templeton Latin America FundTempleton Thailand Fund
*This Fund was closed/merged during the year
**This Fund had its name changed effective on January 31, 2018 (refer to Note 1)
***This Fund had its name changed effective on March 5, 2018 (refer to Note 1)
FRANKLIN TEMPLETON INVESTMENT FUNDS
Additional Information - Unaudited (continued)
192 Audited Annual Report www.franklintempleton.lu

Securities Financing Transactions (SFTs) and Total Return Swaps (TRS)The Company engages in Securities Financing Transactions (as defined in Article 3 of Regulation (EU) 2015/2365, securities financingtransactions include repurchase transactions, securities or commodities lending and securities or commodities borrowing, buy-sell backtransactions or sell-buy back transactions and margin lending transactions) through its exposure on securities lending transactions and total returnswap contracts during the year, in accordance with Article 13 of Regulation. Information on securities lending transactions and total return swapsare detailed below.
Global data
FundFund
currency
Securities lending
Gross Volume ofTRS (1)
TotalSecurities
Lendingand TRS in
% of net assetsMarket value of
securities on loan
in % oflendable
securities’market value
Franklin Biotechnology Discovery Fund USD 500,630,763 23.08 22.91Franklin Diversified Balanced Fund EUR 2,312,669 0.85Franklin Diversified Conservative Fund EUR 3,053,557 0.86Franklin Diversified Dynamic Fund EUR 1,024,656 0.75Franklin Flexible Alpha Bond Fund USD 359,377 0.06Franklin Global Multi-Asset Income Fund EUR 2,685,583 0.83Franklin K2 Alternative Strategies Fund USD 56,516,811 2.34Franklin K2 Long Short Credit Fund USD 233,940 0.24Franklin Natural Resources Fund USD 8,705,823 2.58 2.47Franklin Strategic Income Fund USD 1,459,630 0.15Franklin Technology Fund USD 90,059,611 3.54 3.43Franklin U.S. Equity Fund USD 7,857,618 1.92 1.87Franklin U.S. Low Duration Fund USD 699,111 0.09Franklin U.S. Opportunities Fund USD 58,670,877 1.55 1.51
(1) absolute value of the unrealised gains/(losses)
Concentration data
Securities Lending, ten largest collateral issuers
FundFund
currency IssuerCollateral value
in Fund currency
Franklin Biotechnology Discovery Fund USD Government of Australia 14,111,384Government of Belgium 1,758Government of France 24,800,397Government of Germany 9,617,030Government of Switzerland 55,296United Kingdom Treasury 484,347,209
Franklin Natural Resources Fund USD United Kingdom Treasury 9,141,009
Franklin Technology Fund USD Government of France 2,296,853United Kingdom Treasury 93,316,759
Franklin U.S. Equity Fund USD Government of the Netherlands 8,201,162
Franklin U.S. Opportunities Fund USD Government of Germany 41,945,194Government of the Netherlands 21,306,398
When less than 10 issuers are disclosed, less than 10 issuers are available.
Total return swaps, ten largest collateral issuers
FundFund
currency IssuerCollateral value
in Fund currency
Franklin Flexible Alpha Bond Fund USD U.S. Treasury 441,675United Kingdom Treasury 231,865
Franklin K2 Alternative Strategies Fund USD U.S. Treasury 1,426,443
Franklin K2 Long Short Credit Fund USD U.S. Treasury 81,954
Franklin Strategic Income Fund USD U.S. Treasury 255,535
When less than 10 issuers are disclosed, less than 10 issuers are available.
The above table does not inlude the collateral received in Cash.
Securities Lending, ten largest counterparties
All securities lending counterparties are disclosed in Note 15.
FRANKLIN TEMPLETON INVESTMENT FUNDS
Additional Information - Unaudited (continued)
www.franklintempleton.lu Audited Annual Report 193
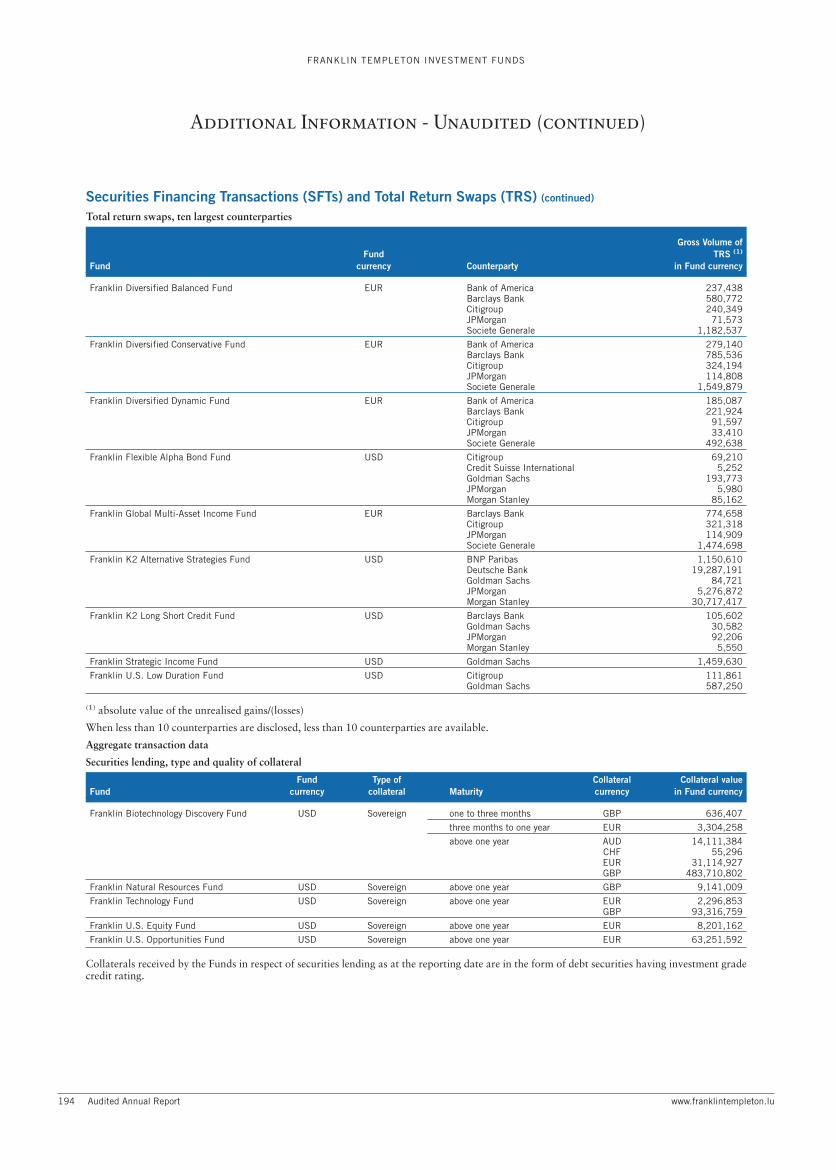
Securities Financing Transactions (SFTs) and Total Return Swaps (TRS) (continued)
Total return swaps, ten largest counterparties
FundFund
currency Counterparty
Gross Volume ofTRS (1)
in Fund currency
Franklin Diversified Balanced Fund EUR Bank of America 237,438Barclays Bank 580,772Citigroup 240,349JPMorgan 71,573Societe Generale 1,182,537
Franklin Diversified Conservative Fund EUR Bank of America 279,140Barclays Bank 785,536Citigroup 324,194JPMorgan 114,808Societe Generale 1,549,879
Franklin Diversified Dynamic Fund EUR Bank of America 185,087Barclays Bank 221,924Citigroup 91,597JPMorgan 33,410Societe Generale 492,638
Franklin Flexible Alpha Bond Fund USD Citigroup 69,210Credit Suisse International 5,252Goldman Sachs 193,773JPMorgan 5,980Morgan Stanley 85,162
Franklin Global Multi-Asset Income Fund EUR Barclays Bank 774,658Citigroup 321,318JPMorgan 114,909Societe Generale 1,474,698
Franklin K2 Alternative Strategies Fund USD BNP Paribas 1,150,610Deutsche Bank 19,287,191Goldman Sachs 84,721JPMorgan 5,276,872Morgan Stanley 30,717,417
Franklin K2 Long Short Credit Fund USD Barclays Bank 105,602Goldman Sachs 30,582JPMorgan 92,206Morgan Stanley 5,550
Franklin Strategic Income Fund USD Goldman Sachs 1,459,630
Franklin U.S. Low Duration Fund USD Citigroup 111,861Goldman Sachs 587,250
(1) absolute value of the unrealised gains/(losses)
When less than 10 counterparties are disclosed, less than 10 counterparties are available.
Aggregate transaction data
Securities lending, type and quality of collateral
FundFund
currencyType of
collateral MaturityCollateralcurrency
Collateral valuein Fund currency
Franklin Biotechnology Discovery Fund USD Sovereign one to three months GBP 636,407
three months to one year EUR 3,304,258
above one year AUD 14,111,384CHF 55,296EUR 31,114,927GBP 483,710,802
Franklin Natural Resources Fund USD Sovereign above one year GBP 9,141,009
Franklin Technology Fund USD Sovereign above one year EUR 2,296,853GBP 93,316,759
Franklin U.S. Equity Fund USD Sovereign above one year EUR 8,201,162
Franklin U.S. Opportunities Fund USD Sovereign above one year EUR 63,251,592
Collaterals received by the Funds in respect of securities lending as at the reporting date are in the form of debt securities having investment gradecredit rating.
FRANKLIN TEMPLETON INVESTMENT FUNDS
Additional Information - Unaudited (continued)
194 Audited Annual Report www.franklintempleton.lu

Securities Financing Transactions (SFTs) and Total Return Swaps (TRS) (continued)
Securities lending, maturity tenor and country of incorporation
Fund Fund currency MaturityCountry of incorporation ofthe Counterparty
Market value ofsecurities on loanin Fund currency
Franklin Biotechnology Discovery Fund USD open maturity Germany 457,812,603Switzerland 8,076,608United States of America 34,741,552
Franklin Natural Resources Fund USD open maturity Germany 4,820,004United Kingdom 3,885,819
Franklin Technology Fund USD open maturity Germany 65,562,290Switzerland 17,728,523United States of America 6,768,798
Franklin U.S. Equity Fund USD open maturity Germany 7,857,618
Franklin U.S. Opportunities Fund USD open maturity Germany 58,670,877
All Funds engaged in securities lending utilise bi-lateral settlement and clearing with their respective counterparty.
Total return swaps, type of collateral and maturity tenor
FundFund
currency Type of collateral MaturityCollateralcurrency
Collateral valuein Fund currency
Franklin Diversified Balanced Fund EUR Cash open maturity EUR 480,000
Franklin Diversified Conservative Fund EUR Cash open maturity EUR 745,000
Franklin Diversified Dynamic Fund EUR Cash open maturity EUR 230,000
Franklin Flexible Alpha Bond Fund USD Sovereign above one year GBP 231,865USD 441,675
Franklin Global Multi-Asset Income Fund EUR Cash open maturity EUR 453,196
Franklin K2 Alternative Strategies Fund USD Cash open maturity USD 310,000
Sovereign three months to one year USD 20,896above one year USD 1,405,547
Franklin K2 Long Short Credit Fund USD Sovereign above one year USD 81,954
Franklin Strategic Income Fund USD Cash open maturity USD 4,120,000
Sovereign above one year USD 255,535
Franklin U.S. Low Duration Fund USD Cash open maturity USD 1,090,000
Collateral amounts disclosed above include collateral received on OTC derivatives other than total return swaps. OTC derivative transactionsentered into by each of the Funds under and ISDA master agreement are netted together for collateral purposes. Therefore, collateral disclosuresprovided above are in respect of all OTC derivative transactions and not just total return swaps.
FRANKLIN TEMPLETON INVESTMENT FUNDS
Additional Information - Unaudited (continued)
www.franklintempleton.lu Audited Annual Report 195

Securities Financing Transactions (SFTs) and Total Return Swaps (TRS) (continued)
Total return swaps, maturity tenor and country of incorporation
Fund Fund currency MaturityCountry of incorporation ofthe Counterparty
Gross Volume of TRS (1)
in Fund curency
Franklin Diversified Balanced Fund EUR three months to one year France 1,182,537United Kingdom 580,772United States of America 549,360
Franklin Diversified Conservative Fund EUR three months to one year France 1,549,879United Kingdom 785,536United States of America 718,142
Franklin Diversified Dynamic Fund EUR three months to one year France 492,638United Kingdom 221,924United States of America 310,094
Franklin Flexible Alpha Bond Fund USD one to three months United States of America 255,243
three months to one year Switzerland 5,252United States of America 98,882
Franklin Global Multi-Asset Income Fund EUR three months to one year France 1,474,698United Kingdom 774,658United States of America 436,227
Franklin K2 Alternative Strategies Fund USD one week to one month United States of America 923,195
one to three months France 123Germany 2,699,936United States of America 6,441,585
three months to one year France 757,107Germany 13,489,623United States of America 12,325,532
above one year France 393,380Germany 3,097,632United States of America 16,388,698
Franklin K2 Long Short Credit Fund USD one to three months United States of America 4,621
three months to one year United Kingdom 105,602United States of America 119,774
above one year United States of America 3,943
Franklin Strategic Income Fund USD one to three months United States of America 1,145,883
three months to one year United States of America 313,747
Franklin U.S. Low Duration Fund USD one to three months United States of America 699,111
(1) absolute value of the unrealised gains/(losses)
All Funds engaged in total return swap contracts utilise bi-lateral settlement and clearing with their respective counterparty.
Data on reuse of collateral
Collaterals received in relation to Securities lending and Total Return Swaps cannot be sold, re-invested or pledged.
Safekeeping of collateral
All the collateral received in relation to Securities Lending is in custody at Goldman Sachs.
All the collateral received in relation to Total Return Swaps is in custody at JPMorgan Bank Luxembourg S.A.
Data on return
The total income earned from the securities lending programme is detailed in Note 15.
The return from total return swap contracts is accrued to the Funds.
FRANKLIN TEMPLETON INVESTMENT FUNDS
Additional Information - Unaudited (continued)
196 Audited Annual Report www.franklintempleton.lu

CollateralThe following table reports the collateral held as at June 30, 2018 to reduce counterparty exposure on OTC derivatives.
Fund Counterparty Cash held ascollateral
Sovereign Bonds held ascollateral
Franklin Diversified Balanced Fund Barclays Bank EUR 480,000 -Franklin Diversified Conservative Fund Bank of America EUR 75,000 -
Barclays Bank EUR 670,000 -Franklin Diversified Dynamic Fund Barclays Bank EUR 230,000 -Franklin Euro High Yield Fund Morgan Stanley USD 370,000 -Franklin Euro Short Duration Bond Fund Bank of America USD 120,000 -Franklin European Growth Fund Deutsche Bank EUR 27,000 -
Goldman Sachs USD 20,000 -Franklin Flexible Alpha Bond Fund HSBC Bank - GBP 175,575
UBS - USD 441,675Franklin Global Fundamental Strategies Fund Bank of America - USD 1,573,010
Barclays Bank USD 370,000 -Citigroup USD 2,540,000 -Deutsche Bank USD 2,150,000 -Goldman Sachs USD 640,000 -HSBC Bank - USD 3,860,699JPMorgan USD 4,730,000 -Standard Chartered USD 280,000 -UBS USD 200,000 -
Franklin Global Multi-Asset Income Fund Barclays Bank EUR 396,196 -Morgan Stanley EUR 57,000 -
Franklin Gold and Precious Metals Fund Morgan Stanley USD 56,000 -Franklin K2 Alternative Strategies Fund Bank of America USD 90,000 -
Goldman Sachs USD 220,000 -JPMorgan - USD 1,426,443
Franklin K2 Global Macro Opportunities Fund JPMorgan - USD 20,367Franklin K2 Long Short Credit Fund JPMorgan - USD 81,954Franklin MENA Fund Morgan Stanley USD 78,000 -Franklin NextStep Balanced Growth Fund Bank of America - USD 212,439Franklin Strategic Income Fund Credit Suisse International USD 520,000 -
Deutsche Bank USD 1,700,000 -Goldman Sachs USD 1,590,000 -Morgan Stanley USD 310,000 -Wells Fargo - USD 255,535
Franklin U.S. Equity Fund Morgan Stanley USD 20,000 -Franklin U.S. Low Duration Fund Deutsche Bank USD 440,000 -
Goldman Sachs USD 650,000 -Franklin U.S. Opportunities Fund Barclays Bank USD 270,000 -Franklin Mutual U.S. Value Fund Morgan Stanley USD 67,000 -Templeton Asian Bond Fund Citigroup USD 1,530,000 -
Deutsche Bank USD 1,440,000 -Goldman Sachs USD 340,000 -JPMorgan USD 1,430,000 -Standard Chartered USD 570,000 -
Templeton Emerging Markets Balanced Fund Bank of America USD 110,000 -Deutsche Bank USD 110,000 -
Templeton Emerging Markets Bond Fund Bank of America - USD 9,413,182Barclays Bank USD 1,020,000 -BNP Paribas EUR 9,055,000 -Deutsche Bank USD 100,000 -Goldman Sachs USD 10,950,000 -Standard Chartered USD 3,260,000 -UBS USD 2,540,000 -
Templeton Global Balanced Fund Goldman Sachs USD 110,000 -HSBC Bank - USD 1,129,883Morgan Stanley USD 10,000 -
FRANKLIN TEMPLETON INVESTMENT FUNDS
Additional Information - Unaudited (continued)
www.franklintempleton.lu Audited Annual Report 197

Collateral (continued)
The following table reports the collateral held as at June 30, 2018 to reduce counterparty exposure on OTC derivatives.
Fund Counterparty Cash held ascollateral
Sovereign Bonds held ascollateral
Templeton Global Bond Fund Bank of America - USD 17,775,326Barclays Bank USD 19,400,000 -Deutsche Bank USD 63,890,000 -Goldman Sachs USD 69,230,000 -HSBC Bank - USD 97,554,378JPMorgan USD 55,470,000 -Standard Chartered USD 30,571,000 -UBS USD 9,811,000 -
Templeton Global High Yield Fund Deutsche Bank USD 210,000 -Morgan Stanley USD 56,000 -
Templeton Global Income Fund Bank of America - USD 416,445Barclays Bank USD 280,000 -Deutsche Bank USD 1,040,000 -Goldman Sachs USD 560,000 -HSBC Bank - USD 618,889JPMorgan USD 7,050,000 -UBS USD 270,000 -
Templeton Global Total Return Fund Bank of America - USD 41,709,948Barclays Bank USD 5,850,000 -Citigroup USD 5,070,000 -Goldman Sachs USD 38,900,000 -HSBC Bank - USD 11,247,639JPMorgan USD 104,680,000 -Standard Chartered USD 7,910,000 -UBS USD 16,690,000 -
Templeton Latin America Fund Bank of America - USD 305,283
FRANKLIN TEMPLETON INVESTMENT FUNDS
Additional Information - Unaudited (continued)
198 Audited Annual Report www.franklintempleton.lu

UCITS Remuneration DisclosureFranklin Templeton International Services S.à r.l. (“FTIS”), as UCITS licensed management company (the “Management Company”) has aremuneration policy (the “Policy”) in place which applies to all UCITS funds (each a “UCITS” and together the “UCITS”) under its management.The Policy has been designed to discourage excessive risk taking, integrating in its performance management systems risk criteria specific to thebusiness units it covers. The policy has a governance structure aimed at preventing internal conflicts of interest.
There are defined procedures in place for the creation, update, review and approval of the Policy as well as for communication andimplementation of the Policy. Senior Management, Human Resources, Compliance and other functions are all involved in this process and thePolicy is approved by Senior Management and the Board of Directors of the Management Company.
Fixed remuneration is defined as base salary plus other benefits which may include pension contributions, life assurance premiums or privatemedical insurance premiums. Levels of fixed remuneration are set with reference to job complexity, level of responsibility, performance and marketbenchmarking data. These levels are reviewed on a regular basis.
Variable remuneration is defined as annual bonuses, long term awards in the form of performance share grants or sales bonus payments. Levels ofvariable remuneration are set with reference to overall corporate and business unit performance as well as individual performance.
The full Policy is available at the registered office of the Management Company. Quantitative information relevant to the Franklin TempletonInvestment Funds is outlined below.
Total amount of fixed remuneration paid by FTIS and its delegates during the year ended September 30, 2017*,**,***€12,122,608
Total amount of variable remuneration paid by FTIS and its delegates during the year ended September 30, 2017*,**,***€ 5,451,637
Number of staff of FTIS and in its delegates as at September 30, 2017 149.5
Total amount of compensation paid by FTIS and its delegates to Senior managers during the year ended September 30, 2017*,**,***€ 4,012,044
Total amount paid by FTIS and its delegates to other members of staff who have a material impact on the profile of UCITS during yearended September 30, 2017*,**,***
€ -
*The total amount of compensation paid by FTIS has been allocated to each UCITS based on their pro rata share of the average month end totalnet assets of FTIS for the year ended September 30, 2017.
** The total amount of compensation paid by the FTIS delegates has been allocated to each UCITS based on their pro rata share of the averagemonth end total net assets of the FTIS delegates for the year ended September 30, 2017.
*** Delegates are Investment Management entities which are subject to regulatory requirements that are equally as effective as those under Article69(3)(a) of the UCITS Directive.
FRANKLIN TEMPLETON INVESTMENT FUNDS
Additional Information - Unaudited (continued)
www.franklintempleton.lu Audited Annual Report 199
Further information regarding Franklin Templeton Investment Funds is available from the following Franklin Templeton Investments offices:
EUROPEBELGIUMFRANKLIN TEMPLETON INTERNATIONAL SERVICES S.à r.l.Belgian Branch Office28, avenue Marnix, 1000 BrusselsBelgiumTél: +32 2 289 62 00 Fax: +32 2 289 62 19www.franklintempleton.be
FRANCEFRANKLIN TEMPLETON FRANCE S.A.20, rue de la PaixF-75002 Paris, FranceTel: +33 (0)1 40 73 86 00 Fax: +33 (0)1 40 73 86 10www.franklintempleton.fr
GERMANY AND AUSTRIAFRANKLIN TEMPLETON INVESTMENT SERVICES GMBHMainzer Landstr. 16Postfach 11 18 0360325 Frankfurt am Main, GermanyTel: +49 (0) 69 272 23 0 Fax: +49 (0) 69 272 23 120Germany Freefone: 08 00 0 73 80 02Austria Freefone: 08 00 29 59 11www.franklintempleton.dewww.franklintempleton.at
ITALYFRANKLIN TEMPLETON INTERNATIONAL SERVICES S.à r.l., ItalianbranchCorso Italia n.120122 Milan, ItalyTel: +39 02 854 591 Fax: +39 02 854 59222Italy freefone: 800 915 919www.franklintempleton.it
LUXEMBOURGFRANKLIN TEMPLETON INTERNATIONAL SERVICES S.à r.l.8A, rue Albert Borschette, L-1246 LuxembourgB.P. 169, L-2011 LuxembourgGrand Duchy of LuxembourgTel: +352 46 66 67 1 Fax: +352 46 66 76www.franklintempleton.lu
THE NETHERLANDSFRANKLIN TEMPLETON INVESTMENTMANAGEMENT LIMITEDNetherlands Branch OfficeWorld Trade Center AmsterdamH-Toren 16e verdiepingZuidplein 1341077 XV Amsterdam, The NetherlandsTel: +31 (0) 20 575 2890 Fax: +31 (0) 20 575 2892Netherlands Freefone: 0800 256 8049www.franklintempleton.nl
POLANDTempleton Asset Management (Poland) TFI S.A.Rondo ONZ 1, Floor 26th00-124 Warsaw, PolandTel: +48 22 337 13 50 Fax: +48 22 337 13 70www.franklintempleton.pl
ROMANIAFRANKLIN TEMPLETON INVESTMENT MANAGEMENT UK –BUCHAREST BRANCHPremium Point, 7th-8th Floor, Buzesti Street 78-80,1st District, Bucharest 011017, RomaniaCDS Line: + 40 21 200 96 28, Overseas: + 40 21 200 96 00Fax Number: + 40 21 200 96 31/32E-mail: [email protected]
SPAIN AND PORTUGALFRANKLIN TEMPLETON INVESTMENTMANAGEMENT LIMITEDSucursal en EspañaJosé Ortega y Gasset, 29-6º28006 Madrid, SpainTel: +34 91 426 3600 Fax: +34 91 577 1857www.franklintempleton.com.eswww.franklintempleton.com.pt
SWEDENFRANKLIN TEMPLETON INVESTMENTMANAGEMENT LIMITEDBlasieholmgatan 5SE-111 48 Stockholm, SwedenTel: +46 8 545 012 30 Fax: +46 8 545 012 39www.franklintempletonnordic.com
SWITZERLANDFRANKLIN TEMPLETON SWITZERLAND LTDStockerstrasse 38CH-8002 Zurich, SwitzerlandTel: +41 (0)44 217 81 81 Fax: +41 (0) 44 217 81 82www.franklintempleton.ch
UNITED KINGDOMLondonFRANKLIN TEMPLETON INVESTMENTMANAGEMENT LIMITEDCannon Place, 78 Cannon StreetLondon EC4N 6HL, United KingdomTel: +44 (0) 20 7073 8500 Fax: +44 (0) 20 7073 8700UK Freefone: 0800 305 306www.franklintempleton.co.uk
EdinburghFRANKLIN TEMPLETON INVESTMENTMANAGEMENT LIMITED5 Morrison Street, Edinburgh EH3 8BH.Tel: +44 (0)131 242 4000 Fax: +44 (0)131 242 4533UK Freefone: 0800 305 306www.franklintempleton.co.uk
MIDDLE EAST AND AFRICASOUTH AFRICAFRANKLIN TEMPLETON INVESTMENTS SA (PTY) LTD.Kildare HouseThe Oval, 1 Oakdale RoadNewlands, Cape Town, 7700South AfricaTel: +27 11 341 2300 Fax: +27 11 484 2301www.franklintempleton.co.za
UNITED ARAB EMIRATESFRANKLIN TEMPLETON INVESTMENTS(ME) LIMITEDGate Building East Wing, 2nd FloorDubai International Financial CentreP.O. Box 506613Dubai, United Arab EmiratesTel: +971 (4) 428 4100 Fax: +971 (4) 428 4140www.franklintempletongem.com
ASIAHONG KONGFRANKLIN TEMPLETON INVESTMENTS(ASIA) LIMITED17/F Chater House, No. 8 Connaught Road CentralHong KongTel: 852 2877 7733 Fax: 852 2877 5401www.franklintempleton.com.hk
SINGAPORETEMPLETON ASSET MANAGEMENT LTD7 Temasek Boulevard#38-03 Suntec Tower OneSingapore 038987Tel: (65) 6241 2662 Fax: (65) 6332 2295www.franklintempleton.com.sg
TAIWANFRANKLIN TEMPLETON SECURITIES INVESTMENTCONSULTING (SINOAM) INC.*8th Floor, #87, Sec. 4Chung Hsiao East RoadTaipei, Taiwan, R.O.C.Tel: 886 2 2781 0088 Fax: 886 2 2781 7788www.franklintempleton.com.tw
* Master agent appointed in Taiwan for FTIF to be offered and sold tothe public in Taiwan.
FRANKLIN TEMPLETON INVESTMENT FUNDS
Franklin Templeton Investments Office Directory
200 Audited Annual Report www.franklintempleton.lu

NORTH AMERICAUSAFRANKLIN TEMPLETON INVESTMENTS100 Fountain ParkwaySt. Petersburg, FL 33716Tel: 1 800 239 3894 Fax: 727 299 8736Email: [email protected]
SOUTH AMERICAARGENTINATEMPLETON ASSET MANAGEMENT LTDIngeniero Butty 220, 11th Floor(C1001 AFB) Buenos Aires, ArgentinaTel: 54 11 4313 0848 Fax: 54 11 4313 0885
FRANKLIN TEMPLETON INVESTMENT FUNDS
Franklin Templeton Investments Office Directory (continued)
Please note that the websites mentioned above are directed at residents within the country stated on these websites. (Please refer to the website disclaimers).
www.franklintempleton.lu Audited Annual Report 201

Franklin Templeton International Services S.à r.l.8A, rue Albert BorschetteL-1246 LuxembourgGrand Duchy of Luxembourgtel: +352 (46) 66-67-1fax: +352 (46) 66-76
FTIF AR RGBR 06/18