socio-ecological impacts of the tazama pipeline in
TRANSCRIPT

Master’s Thesis 2019 60 ECTS
Faculty of Landscape and Society
Socio-Ecological Impacts of the
TAZAMA Pipeline in Protected and
in Non-Protected Areas in Tanzania.
Aziza Athumani Master’s degree in International Environmental Studies

i
Socio-Ecological Impacts of the TAZAMA Pipeline in Protected and
in Non-protected Areas in Tanzania.
By Aziza Athumani

ii
The Department of International Environment and Development Studies, Noragric, is the
international gateway for the Norwegian University of Life Sciences (NMBU). Eight departments,
associated research institutions and the Norwegian College of Veterinary Medicine in Oslo.
Established in 1986, Noragric’s contribution to international development lies in the interface
between research, education (Bachelor, Master and PhD programmes) and assignments.
The Noragric Master Thesis are the final theses submitted by students in order to fulfil the
requirements under the Noragric Master programme “International Environmental Studies”,
“International Development Studies” and “International Relations”.
The findings in this thesis do not necessarily reflect the views of Noragric. Extracts from this
publication may only be reproduced after prior consultation with the author and on condition that
the source is indicated. For rights of reproduction or translation, contact Noragric.
© Aziza Athumani
Noragric Department of International Environment and Development Studies
P.O. Box 5003
N-1432 Ås
Norway
Tel.: +47 67 23 00 00
Internet: http://www.nmbu.no/om/fakulteter/samvit/institutter/noragric

iii
DECLARATION I, Aziza Athumani, declare that this thesis is the result of my research conducted along TAZAMA
pipeline route and the relevant sources of information included other than my own findings have
been acknowledged. This work has not been either partially or full submitted to any other
university than the Norwegian University of Life Sciences (NMBU) for award of any type of
academic degree.
Date: 15Th August 2019 Signature:
Aziza Athumani

iv
ACKNOWLEDGEMENTS The successfully completion of this thesis was due to the supportive effort done by different
participant involved in all the stages.
I am therefore very grateful to my supervisor, Professor Pål Olav Vedeld for his valuable inputs to
ensure this thesis become very successfully. His valuable comments on the early stage of proposal
writing, guidance in the field sites being visited together and involvement in each stage of report
writing made this study effectively completed.
I wish to appreciate the EnPe- PELIGIBO project for financing my master’s degree program at
NMBU and the fieldwork. I wish also to extend my deepest gratitude to all people collaborated
with me at different stages of this thesis as follows;
First, I wish to pass my sincere gratitude to Professor Julius Nyahongo of University of Dodoma
(UDOM) for his guidance and knowledge that assist in completion of this study. Secondly, the
staff of TAZAMA pipeline headquarter especially Engineer Patrick Mzava for his assistance in
getting permit to work along TAZAMA pipeline. Moreover, I would like to extend my special
regards to TAWIRI and TANAPA authority for accepting my proposal and allow me to proceed
with my research in protected areas. I also acknowledge and thank so much the village leaders for
their assistance during the fieldwork.
I would like to express my sincere and heartfelt thanks to my parents Mr & Mrs Athumani Konyo,
my husband Godbless Samuel Shao and my lovely sons Baraka and Brian for their prayer and
emotional support all the time when I was far away from them for the sake of this study.
Lastly, I would like to thank everyone who’s in one way or another made this thesis successfully.
May God bless you all.

v
ABSTRACT This study conducted along TAZAMA pipeline route covering sampling areas on protected and
non-protected in Tanzania. The use of mixed research method involving a household survey,
focused group discussion, interview, participant observation and secondary data enables to grasp
important information which give a better understanding of social and ecological impacts created
by the TAZAMA pipeline.
The study focuses on impacts of the TAZAMA pipeline on household’s livelihoods and on
conservation areas including National Parks located along TAZAMA pipeline route. The
Sustainable Livelihood Approach was on effective theoretical approach in examining the
vulnerability context including risks that affects households’ assets, activities and give outcomes
to the individual livelihoods. Also, The Environmental Governance System Framework was used
to assess the technology, involvement of different actors, their interactions and the outcomes
created which led to changes in the states of the environmental resource along the pipeline route.
The study findings showed that the household’s assets have been affected by oil spills from
TAZAMA pipeline. Households agricultural land was polluted by oil spills led to low crop
production which results into lower incomes. The studied area that is higher affected is Malolo
located in Kilosa district in Morogoro.
Focusing on the ecological impacts, the change of technology such as cathodic stations and pigging
technology to detect and reduce leakage has been observed to avoid the negative impacts especially
in the protected areas.
The good interaction among different actors related to TAZAMA pipeline influence security of
the pipeline as well as beneficiaries to the local community including construction of road, health
center and other support when the community requested for it. This strengthen the relationship
among them regardless the risk being created by TAZAMA pipeline.

vi
KEY TERMS Oil Spills, Protected Areas, Non- Protected Areas, Social and Ecological Impacts, TAZAMA
Pipeline, Sustainable Livelihoods and Environmental Governance Systems.

vii
Contents DECLARATION........................................................................................................................................ iii
ACKNOWLEDGEMENTS ...................................................................................................................... iv
ABSTRACT ................................................................................................................................................. v
KEY TERMS .............................................................................................................................................. vi
LIST OF FIGURES ................................................................................................................................... xi
LIST OF TABLES .................................................................................................................................... xii
LIST OF ABBREVIATIONS AND ACRONYMS ................................................................................xiii
1.2: Background .......................................................................................................................................... 3
1.3: Method and field study ........................................................................................................................ 6
1.3.1: Population.......................................................................................................................................... 6
1.3.2: Agriculture ........................................................................................................................................ 6
1.3.3: Livestock keeping ............................................................................................................................. 7
1.3.4: Ruaha National Parks ...................................................................................................................... 7
1.3.5: Mikumi National Park ..................................................................................................................... 8
1.4: Justification of thesis ........................................................................................................................... 8
1.5: Flow of thesis by chapters ................................................................................................................... 9
CHAPTER TWO – PROBLEM FORMULATION .............................................................................. 11
2.1 Problem statement .............................................................................................................................. 11
2.2: Objectives ........................................................................................................................................... 11
2.2.1: Objective 1- To assess the history and context of the TAZAMA pipeline. ................................ 11
2.2.2: Objective 2- To study how the oil spills affect the livelihood. ..................................................... 12
2.2.3: Objective 3- To assess the Environment Governance Management of oil pipelines ................ 12
2.2.4: Objective 4- Recommendations ..................................................................................................... 12
2.3 Areas for tentative recommendations ............................................................................................... 12
CHAPTER THREE - THEORIES AND LITERATURES ................................................................... 13
3.1 Empirical literature ............................................................................................................................ 13
3.1.1: Oil pipelines on global level ........................................................................................................... 14
3.1.2: Oil pipelines and livelihoods ......................................................................................................... 15
3.1.3: Oil pipelines on human health ....................................................................................................... 16
3.2 Environmental Governance Systems (EGSs) ................................................................................... 16
3.2.1 Technologies and infrastructures ................................................................................................... 17
3.2.2 Environmental resources, processes, their attributes ................................................................... 19

viii
3.2.3 Patterns of interaction, coordination, cooperation and communications between actors ......... 19
3.2.4 Actors ................................................................................................................................................ 19
3.2.5 Institutions ........................................................................................................................................ 21
3.2.6 Resource regimes ............................................................................................................................. 21
3.2.7 Outcomes .......................................................................................................................................... 22
3.3 Sustainable Livelihood Approach...................................................................................................... 23
3.3.1 Introduction of Sustainable Livelihood Approach ....................................................................... 23
3.3.2 Describing Sustainable Livelihood Approach ............................................................................... 24
3.4 Linking the theoretical approaches with objectives and research questions ................................. 28
CHAPTER FOUR – STUDY AREA, METHODOLOGY AND METHODS OF DATA
COLLECTIONS AND ETHICS.............................................................................................................. 30
4.1 Description of study area .................................................................................................................... 30
4.1.1: Villages located along TAZAMA pipeline .................................................................................... 30
4.1.2: Protected areas along TAZAMA pipeline route .......................................................................... 31
4.1.3: Oil leakage reported areas ............................................................................................................. 31
4.2 Methods of data collection .................................................................................................................. 35
4.2.1 Focus group discussion .................................................................................................................... 36
4.2.2 Literature review ............................................................................................................................. 37
4.2.3 Households survey ........................................................................................................................... 38
4.2.4 Interview ........................................................................................................................................... 39
4.2.5 Participant observation ................................................................................................................... 40
4.3 Validity and Reliability ....................................................................................................................... 41
4.4 Data analysis ........................................................................................................................................ 42
4.4.1 Graphic description of data ............................................................................................................ 42
4.4.2 Regression analysis .......................................................................................................................... 42
4.5 Potential limitations and challenges .................................................................................................. 44
4.6: Ethical considerations ....................................................................................................................... 45
CHAPTER FIVE - RESULTS AND DISCUSSIONS ............................................................................ 47
5.1: Assessing the history and context of the TAZAMA pipeline. ........................................................ 47
5.1.1 TAZAMA pipeline establishment and set up ................................................................................ 47
5.1.2: The technology applied during set up of TAZAMA pipeline to avoid leakages and spills ...... 49
5.1.3: Actors involved during set up of the TAZAMA pipeline ............................................................ 50
5.1.4: Approaches used to provide land for construction of the TAZAMA pipeline from local people
.................................................................................................................................................................... 50

ix
5.1.5: The cost and benefit of the TAZAMA pipeline to the local levels ............................................. 52
5:1:5:1: Benefits ........................................................................................................................................ 52
5:1:5:2: Costs ............................................................................................................................................. 54
5:1:5:3: Summary on costs and benefits to the local levels ................................................................... 56
5.2: The impacts of oil spills and household’s livelihood. ...................................................................... 56
5.2.1: Household access to assets.............................................................................................................. 57
5.2.1.1 Natural capital ............................................................................................................................... 58
5.2.1.2: Human capital .............................................................................................................................. 59
5.2.1.3: Social capital ................................................................................................................................ 61
5.2.2: Households livelihoods strategies .................................................................................................. 62
5.2.3: Livelihood outcomes ....................................................................................................................... 63
5.2.4: Outcomes of livelihood incomes and effects on oil spills. ............................................................ 64
5.2.4: Productive land and effects of oil spill .......................................................................................... 67
5.2.5: Effect of the TAZAMA pipeline to the household’s financial capital ........................................ 69
5.2.6: Vulnerability context ...................................................................................................................... 74
5.2.7: Households coping strategies after their productive land polluted by oil Spills ....................... 75
5.2.8: Summary of oil spills and livelihood effects ................................................................................. 77
5.3: Assessing the Environmental Governance Systems (EGSs) of the TAZAMA pipeline in both
protected and unprotected areas. ............................................................................................................ 78
5.3.1: Influence of different actors to ensure environmental sustainability along the TAZAMA
pipeline ....................................................................................................................................................... 78
5.3.2: The roles of institutions in conserving the protected areas in relation to TAZAMA pipeline oil
spills ............................................................................................................................................................ 79
5.3.3: The technology and infrastructure of the TAZAMA pipeline used to prevent/influence
leakages during oil transportation........................................................................................................... 80
5.3.3 Outcomes of the technology used and interaction among actors to the environmental resources
along TAZAMA pipelines ........................................................................................................................ 82
5.3.3.1 In Protected Areas ........................................................................................................................ 82
5.3.3.2 In Non-Protected Areas ................................................................................................................ 83
5.3.4: Initiatives taken to solve some of the problem related to TAZAMA pipelines ......................... 86
5.4: Future perspectives of TAZAMA pipeline and other pipelines..................................................... 88
5.4.1: Future plans based on innovations as the TAZAMA pipeline gets old ...................................... 89
5.4.2: The advice based on construction of oil pipeline in both the protected and in non-protected
Areas .......................................................................................................................................................... 89
CHAPTER SIX- CONCLUSIONS AND RECOMMENDATIONS .................................................... 91

x
6.1: Conclusion .......................................................................................................................................... 91
6.2: Recommendations .............................................................................................................................. 93
List of References ...................................................................................................................................... 95
APPENDIX .............................................................................................................................................. 103
Appendix 1: Village Sketch Maps.......................................................................................................... 103
Appendix 2: Questionnaire for the household survey ......................................................................... 106
Appendix 3: Focus Group Discussion ................................................................................................... 121
3.1: This research tool intends to collect the data from official workers at TAZAMA headquarters.
.................................................................................................................................................................. 121
3.2: Assessing the effects of the TAZAMA pipeline route in Mikumi and Ruaha National Park.
(Interview guide for Mikumi and Ruaha National Park officials) ..................................................... 122

xi
LIST OF FIGURES
Figure 1: Environmental Governance System (EGS) framework………………………………………….17
Figure 2: The illustration of Sustainable Livelihood Framework…………………………………………..24
Figure 3: Map of oil pipeline with its pumping stations between Dare s Salaam and Ndola, Zambia………33
Figure 4: Level of education, along TAZAMA pipeline, 2019…………………………………………….60
Figure 5: The households livelihoods strategies along TAZAMA pipeline………………………………..62
Figure 6: The perceived extent households capital affected by TAZAMA pipeline leakages, Tanzania,
2018………………………………………………………………………………………………………..72
Figure 7: Households yields of onion crop per acre from 2010 to 2017 along the TAZAMA pipeline,
Tanzania…………………………………………………………………………………………………...73
Figure 8: Households coping strategies along TAZAMA pipeline………………………………………...75

xii
LIST OF TABLES
Table 1: Linking the theoretical approaches with objectives and research questions………………………28
Table 2: History of the TAZAMA pipeline leakages from 2000 to 2018…………………………………..51
Table 3: Socio-economic factors by location along TAZAMA pipeline, Tanzania, 2018………………….57
Table 4: The diversifications of assets possessed by households’ lives along TAZAMA Pipeline……….59
Table 5: Households head sex along TAZAMA pipeline…………………………………………………..59
Table 6: Assessment of human capital by location along the TAZAMA pipeline route, Tanzania,2018…..61
Table 7: Linking activities to location along TAZAMA pipeline route, Tanzania, 2018…………………..63
Table 8: The outcomes of TAZAMA pipeline oil spills correlated with different variables………………..64
Table 9: Comparison of households’ productive land before and after oil spills by location……………….68
Table 10: Cash and subsistence crops grown in the villages located along TAZAMA pipeline, Tanzania,
2018………………………………………………………………………………………………………..70
Table 11: The perceived effect of households’ financial capital by the TAZAMA pipeline leakages by
location, Tanzania, 2018…………………………………………………………………………………...71
Table 12: Households perception due to the TAZAMA oil spills in Tanzania, 2018………………………72
Table 13: Cash income changes on the people living along the TAZAMA pipeline in
Tanzania,2018……………………………………………………………………………………………..75
Table 14: Households assets affected by the TAZAMA pipeline leakages and their coping strategies,
Tanzania,2018……………………………………………………………………………………………..76

xiii
LIST OF ABBREVIATIONS AND ACRONYMS
ABRU Animal Behavior Research Unit
AC Alternating Current
CP Cathodic Protection
DC Direct Current
DC District Commissioner
DED District Executive Director
EIAs Environmental Impact Assessments
EMA Environmental Management Act
MINAPA Mikumi National Park
NEMC National Environmental Management Council
TANAPA Tanzania National Park
TAWIRI Tanzania Wildlife Research Institute
TANZAM Tanzania-Zambia highway
TAZAMA Tanzania Zambia Mafuta
VEO Village Executive Officer

xiv

xv

1
CHAPTER ONE – INTRODUCTION
1.1 Introduction
Process of oil extraction, exploration and transportation are an important activity for economic
growth of countries through revenues generated. Still, there are socio- ecological negative impacts
in the areas where such activities are practiced (O'Rourke & Connolly 2003). Countries such as
United Kingdom (UK), United States of America (USA)Norway, Nigeria and those of the Middle
east i.e Kuwait and Iraq has been involved in oil extraction and transportation for a long time and
the sector has become a great source of national incomes for many countries(Murph & Hall 2011).
In most cases, oil has to be transported far from the where is extracted to fulfill market demands.
There are different ways of transporting oil such as pipelines, ships and even railways. The
processes of transporting oil aim at maximize profit as well as ensuring the availability of oil
resources to the designation areas(Pavlenko 2010). Regardless of the potential benefit obtained
from oil transportation through pipelines to the national economy of the countries performed, the
oil transportation has been seen to have more impacts on ecological and social conditions than
securing economic benefits to people along the pipeline routes.
In the case of Africa, for instance Nigeria, oil pollution caused by oil spillages from the oil industry
located in the Niger Delta region has caused massive destruction to farmlands and even forest
ecosystem(Nma 1996). Such productive land was often used to grow crops for both household
consumption and for cash incomes. This tended to affect people’s activities and reduce the
outcomes (Ite et al. 2013). Pipeline leaks affected the people’s farms and often farming activities
done by those people would stop. The outcomes of such spills would often result into food
insecurity, lack of income and even poverty since the people would lose assets and outcomes (Ellis
2000).
The oil spills also pollutes sources of water which most of the community depend on for various
domestic uses(Mwakyusa 2012) . Pollution of water sources forces the people to use much of their
time to search for clean water. The time consumed can be used to do other household productive
activities. In most African countries, women and children suffer much in terms of collecting water

2
for domestic activities (Graham et al. 2016). This can be more severe and can affects livelihood of
people who lives along the pipeline route which experienced oil leakages(Kadafa 2012).
In Tanzania where this study was conducted, there is only one oil pipeline route called TAZAMA
(Tanzania Zambia Mafuta) which started its operation in 1968 (UNDP 1985). However, the nation
has stated to build another crude oil pipeline from Hoima in Uganda to Tanga expected to be
completed by June, 2020 (Mwakyusa 2016).Initially, the TAZAMA pipeline was started by
transporting finished products. However, later after building the refinery in Indeni-Ndola Zambia
they switched from transporting a finished product to crude oil (Griffiths 1969). Currently, the
TAZAMA pipeline transport crude oil from Dar es salaam to Zambia. According to the
information obtained during the study they have a plan to transport finished products in the future.
Moreover, in the time of its operation TAZAMA has experienced leakages which affects both
protected and unprotected areas where it happens.
The TAZAMA oil pipeline is located along the adjacent local community as well as within the
protected areas. The pipeline has created severe impacts to both peoples’ livelihood in rural areas
and to the protected areas such as national parks(TAWIRI 2012; Ugochukwu & Ertel 2008) .The
study found that Mikumi National Park (MINAPA) is a protected area that experience several
numbers oil leakages compared to Ruaha National Park. The oil spills from TAZAMA pipeline
and its associated activities within MINAPA shows negative impacts since is not ecologically
friendly for the park to be interrupted by oil pipelines.
Moreover, there are other villages which are part of non-protected areas namely; Kaloleni
(Mlandizi), Doma, Malolo A, Malolo B and Mgogozi which have been experienced TAZAMA
pipeline leakage. The oil spills from TAZAMA pipeline have repeatedly occurred at different
places and time within these places.
The oil pipeline crossing the protected areas can threaten the sustainability of the national park
resources in the long run (Mwalyosi et al. 1999). Therefore, environmental impacts caused by oil
exploration, extraction and transportation must be treated accordingly to ensure sustainability of
natural resources and wellbeing of the people’s livelihood.

3
1.2: Background
Tanzania is involved in exploration, extraction and transportation of natural resources such as
minerals, coal, petroleum and gas. The transport of oil and gas being carried out through pipelines
experienced detrimental effects on both the environment and on people’s livelihoods mostly
associated with pollution resulted by oil spills (Bukuku & Meena 1995). The pipeline tends to
cross along the peoples’ residences which can cause destruction of people’s property and affect
their livelihoods(Pegg & Zabbey 2013). Major pipelines are the Songo Songo gas pipelines
transporting gas from Mtwara to Dar es Salaam and the TAZAMA pipeline transporting crude oil
from Dar es Salaam to Zambia. These pipelines have had effects on peoples’ livelihoods around
the areas where the pipeline routes crosses including loss off their assets (Mwesiga & Mikova
2017).
The TAZAMA pipeline transports crude oil from Dar es Salaam port to Ndola, Zambia. It started
in 1966 and officially opened in September, 1968 at its Zambian terminal (Griffiths 1969). The
TAZAMA pipeline reaches a total of 1750 kilometers between TIPPA in Dar es salaam port and
Indeni refinery in Ndola Zambia (Phase 2010). The TAZAMA pipeline has been in operation for
more than 40 years. The construction and the transportation of TAZAMA pipeline was intended
to ensure the availability of oil in Zambia since it is a landlocked country and is challenged with
high transaction and transportation costs of goods being imported (Limão & Venables 2001). The
operation of the TAZAMA pipeline was focused on providing oil transport. Its existence
strengthened the cooperation between two project partners namely, the government of Tanzania
and government of Zambia (Griffiths 1969). However, the TAZAMA pipeline has led to negative
environment effects and it has reduced peoples’ wellbeing in rural areas where it has experienced
pipeline leakages.
The TAZAMA pipeline construction and the choice of its route wasn’t planned much for excluding
significant areas as a precaution to reduce risks in case of accidents. It is constructed in such a way
that it crosses both adjacent to many local communities as well as to national parks, specifically
Mikumi and Ruaha National Park. In other places the TAZAMA pipeline is above the ground due
to various factors, also including soil erosion. The exposure of the pipeline above the ground may
create high risks for the people’s lives in those areas.
4
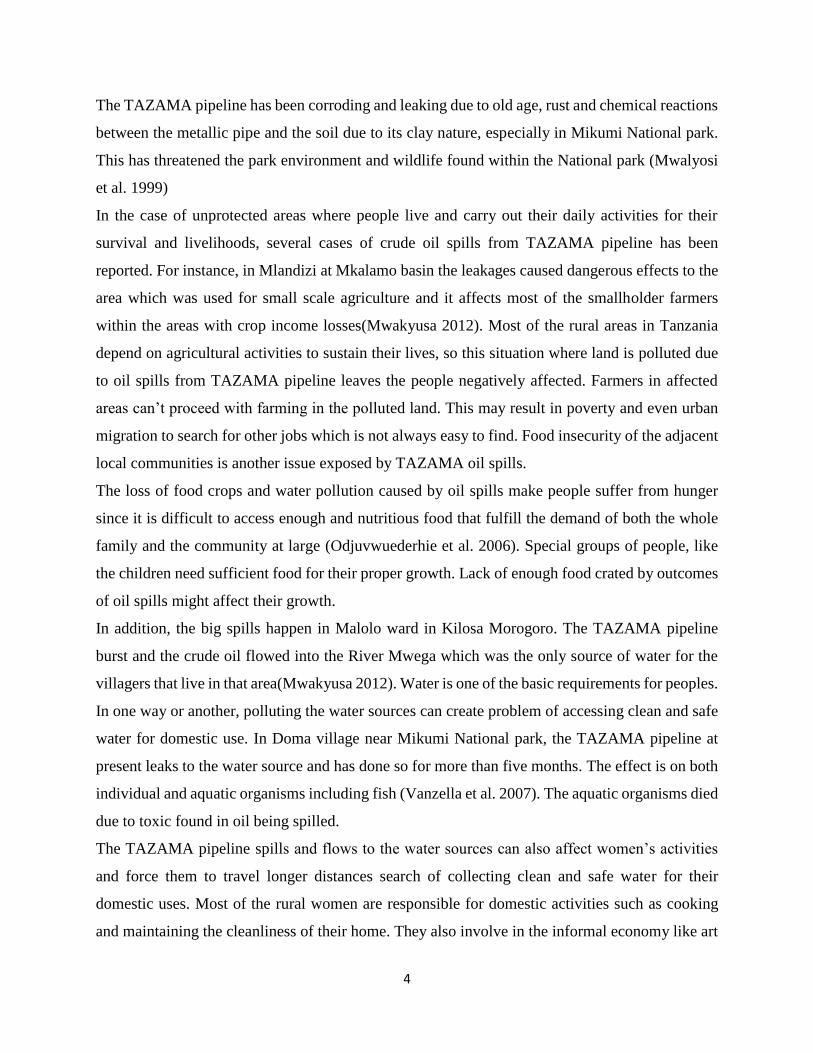
The TAZAMA pipeline has been corroding and leaking due to old age, rust and chemical reactions
between the metallic pipe and the soil due to its clay nature, especially in Mikumi National park.
This has threatened the park environment and wildlife found within the National park (Mwalyosi
et al. 1999)
In the case of unprotected areas where people live and carry out their daily activities for their
survival and livelihoods, several cases of crude oil spills from TAZAMA pipeline has been
reported. For instance, in Mlandizi at Mkalamo basin the leakages caused dangerous effects to the
area which was used for small scale agriculture and it affects most of the smallholder farmers
within the areas with crop income losses(Mwakyusa 2012). Most of the rural areas in Tanzania
depend on agricultural activities to sustain their lives, so this situation where land is polluted due
to oil spills from TAZAMA pipeline leaves the people negatively affected. Farmers in affected
areas can’t proceed with farming in the polluted land. This may result in poverty and even urban
migration to search for other jobs which is not always easy to find. Food insecurity of the adjacent
local communities is another issue exposed by TAZAMA oil spills.
The loss of food crops and water pollution caused by oil spills make people suffer from hunger
since it is difficult to access enough and nutritious food that fulfill the demand of both the whole
family and the community at large (Odjuvwuederhie et al. 2006). Special groups of people, like
the children need sufficient food for their proper growth. Lack of enough food crated by outcomes
of oil spills might affect their growth.
In addition, the big spills happen in Malolo ward in Kilosa Morogoro. The TAZAMA pipeline
burst and the crude oil flowed into the River Mwega which was the only source of water for the
villagers that live in that area(Mwakyusa 2012). Water is one of the basic requirements for peoples.
In one way or another, polluting the water sources can create problem of accessing clean and safe
water for domestic use. In Doma village near Mikumi National park, the TAZAMA pipeline at
present leaks to the water source and has done so for more than five months. The effect is on both
individual and aquatic organisms including fish (Vanzella et al. 2007). The aquatic organisms died
due to toxic found in oil being spilled.
The TAZAMA pipeline spills and flows to the water sources can also affect women’s activities
and force them to travel longer distances search of collecting clean and safe water for their
domestic uses. Most of the rural women are responsible for domestic activities such as cooking
and maintaining the cleanliness of their home. They also involve in the informal economy like art
5
and craft to increase households’ incomes(Omari 1988). Spending more time in collecting water
because the nearby source is polluted hinders women in having time to rest and even undertake
other activities that can increase their income.
However, the effects of the TAZAMA oil spills can also harm individual health since the crude oil
contains heavy metals such as cadmium, copper and lead. Accumulation of heavy metals such as
lead in the human body, especially in men, can affect their male reproductive system by lowering
the sperm count and affects the mobility of the sperms (Suzan & Wadi 1999). This effects on the
individual health can be both short term and long term depending on the amount of oil emitted to
the environment and therefore consumed by human beings (Wiedenhoft, Heither 2017). Since the
crude oil from TAZAMA pipeline leaks and flows to the water source, the peoples’ health in that
area would be also at risk.
In Tanzania, there are institutions that deal with the environmental sustainability through
Environmental Impact Assessments (IEA) such as NEMC (National Environment Management
Council). The NEMC was established in 1983 so that the nation can have a legal institution deal
with environmental conservation issue (Magalla 2018). The establishment of NEMC was due to
agreement made during the Stockholm conference held in 1972 which called upon all nations to
establish and strengthen national environmental Councils to advise governments and the
international community on environmental issue (Malisa 2007)
Apart from those existing institutions which deal with environment sustainability, the pipeline
seems to pass even within protected areas still there is a governance challenge (Sosovele 2011).
The TAZAMA pipeline allowed to pass within sensitive areas probably because during the
construction of TAZAMA pipeline, those institutions such as NEMC where not fully established
yet. The TAZAMA pipeline crosses within Mikumi and Ruaha national parks. In all protected
areas, the oil pipe leads to detrimental effects, though its impacts differ from one case to
another(Mwalyosi et al. 1999).
Environmental resources should be highly protected to ensure the sustainability of natural
resources available to be beneficiaries not only to the current generation but also to the future
generation. Therefore; this study aims to assess the socio-ecological impact of TAZAMA pipeline
on protected and unprotected areas in Tanzania to enhance conservation, developmental strategies
and to prevent hazardous effects on the ecosystem of the particular areas.

6
1.3: Method and field study
The study uses mixed method research with respect to the different research objectives. The choice
of these method enabled the researcher to collect the valid and valuable information from the
sampling population of people lives in villages located along the TAZAMA pipeline. The use of
different methods in data collections including focused group discussion, interview, participant
observation, literature review and households survey enable to obtain the valuable information to
accomplish this study. Therefore, it creates triangulation of data which ensure validity of the study
and providing information from different dimensions. Moreover, it significantly influences the
understanding of the phenomena very well (Bryman 2016)
The study conducted into different authorities such as TAZAMA headquota, villages located along
TAZAMA pipeline as well as Mikumi and Ruaha National Park where TAZAMA pipeline passes
through.
The five villages which included in my study area were Kaloleni, Doma, Malolo A, Malolo B and
Mgogozi. All these villages are found along TAZAMA pipeline route. Kaloleni is located in Janga
ward in Kibaha district very close to Mlandizi town. Doma is located in Mvomero district nearby
Mikumi National Park while Malolo A, Malolo B and Mgogozi are located in Kilosa district.
The villages included in this study have experienced oil spills. However, the impact related to
TAZAMA oil spills differs from one another.
1.3.1: Population
According to the (2012) census, people living in Doma were 13041 (average household size of
3.8) Janga- Kaloleni were 10926 (average household size of 4.0), and Malolo were 10750 (average
household size of 3.8).
The activities dominated in all these villages are agriculture, livestock keeping and business
1.3.2: Agriculture
The individuals live in villages located along TAZAMA pipeline depends on agriculture. Most of
the villages depend on rain seasons for cultivation of their crops while others use irrigation scheme.
For instance, Malolo they have Mwega irrigation scheme whereby farmers use it to grow both cash
crops as well as subsistence crops throughout the year. The involvement in agricultural activities
contributes to the household’s income which influence households’ sustainable livelihoods.

7
1.3.3: Livestock keeping
Within the study area I found that there is ethnic group namely Maasai which mostly deals with
livestock keeping. They migrate with their cattle from one place to another searching for pasture
and water. Maasai own highest livestock number which in some areas for instance Doma the
villagers claim that the Maasai are disturbing farmers.
Apart from that, other households engage in both agriculture and livestock keeping but the number
of animals they keep is very few compared to that of Maasai.
Since the study conducted on both protected and non- protected areas along TAZAMA pipeline
route. The two National Parks where included in this study namely Ruaha and Mikumi National
Parks.
1.3.4: Ruaha National Parks
Ruaha National Park has the area 20,226 square kilometres and it is a largest national park in
Tanzania. The park is more interest since it has several species not regularly seen in other East
African National Park for instance sable antelope and roan antelope(Savidge 1968). The Ruaha
National Park was formally noted to have high population of Elephants carries a high density of
elephants (Norton‐Griffiths 1975). According to (Barnes & Kapela 1991)the Elephants population
has been reduced due to intense poaching occurred in the late 1970s and early 1980s.
In 2008 the park has been extended which makes the Usangu Game reserve be part of Ruaha
national park. The aims of extending the park is to protect the Ihefu wetland and the Great Ruaha
River to ensure its sustainability. Most of the individuals were engaged in irrigation farming which
threaten the water availability depended by wild animals in the park.
The expansion of the park also led people to move from their ancestral land and those who were
doing activities in Usangu wetland were not allowed to continue with their usual livelihood
activities (Sirima 2016).
The TAZAMA pipeline crosses within Ruaha National park along River Ruaha which also is the
area where Elephant pass from one place to another (Nahonyo 2009). The study found that, the
existence of TAZAMA pipeline in Ruaha national park has not pose negative impacts related to
oil spills within the park. However, since the labourers came to clean vegetation along the pipeline
route can contribute to introduction of exotic species as well as littering the park when throwing
away their food leftovers and plastic bottles.

8
1.3.5: Mikumi National Park
Mikumi national park located in Morogoro region- Tanzania. It was established in1964 and it
covers an area of 3,230 km² is the fourth largest in the country which is (Newmark et al. 1996;
Norton et al. 1987)
According to (Vedeld et al. 2012) the people lives close to the park are very poor with the average
income of around 0.45 USD per person per day. This led the park to be surrounded with people
exposed to food insecurity that might be tempted the poor people depend substantially more on
environmental resources that are available within Mikumi national park.
Mikumi national park has been interfered with a lot of infrastructures such as TAZAMA pipeline,
pipeline cathodic stations, TANZAM highway, high voltage powerline, railway and optic fibre.
The existence of the mentioned infrastructure creates a lot of challenges within the park since they
are not ecologically friendly. The study found that, infrastructures contributed to reduce the
population of mammals and birds in various ways including road killing (Benítez-López et al.
2010; Caro et al. 2014)
Mikumi national parks has been affected by pollution related with TAZAMA pipeline spills but
the problem has been reduced when the TAZAMA pipeline management constructed four
Cathodic stations along the pipeline route within the park (Mwalyosi et al. 1999).
1.4: Justification of thesis
Various studies have been conducted in different areas based on the environmental impacts created
by oil spills and pipeline leakages. However, currently there are no extensive studies that assesses
the socio-ecological impacts of TAZAMA pipeline on protected and unprotected areas in Tanzania
in order to enhance conservation and contribute to positive developmental strategies. The
objectives of this study thus set in a way that, can be able to gather information’s related to both
social and ecological aspects. The interconnectedness of these two aspects will contribute to the
cooperation and collaboration among actors involved and contribute on both social and ecological
wellbeing. Therefore, the environmental sustainability as well as improving people’s livelihood
will be attained.
Since the area of study is interest for many researchers more studies have been conducted,
especially within the protected areas. Apart from those previous study there is also the research
centers located within protected areas to make their study more convenient. For instance, in

9
Mikumi National Park there are two organizations doing research within Mikumi National Park
namely TAWIRI and Animal Behavior Research Unit (ABRU). All these deal with studies
focusing on animal behavior especially elephants. Apart from that, there are several researches
done within Mikumi National Park related to the TAZAMA pipeline. Different scholars from
different academic institutions found within Tanzania and outside of the country came to conduct
their study within the park and in villages. The studies relate to the consequences of TAZAMA
pipeline within the park. Currently, this study will assess the socio-ecological impacts of the
TAZAMA pipeline on protected and unprotected areas in Tanzania. The study may enhance on
improve the conservation and developmental strategies to prevent hazardous effects on people in
their villages and land resources within the protected areas.
1.5: Flow of thesis by chapters
The thesis comprises of six chapters. Chapter one gives information’s about background of the
study including overall and even global perspectives. The history of field in which the study has
been conducted and theme of the problem is also described and explained. A brief summary on
methods used to obtain the data also was given to give a clear picture of what has been done to the
field. Moreover, the justification of thesis based on statement, objectives and research questions
its importance and knowledge gaps clarified in this chapter.
Chapter two shows the problem formulation of the study and the guided tools such as objectives
and its related research questions which was used as an indicator when conducting the study. The
statement of the problem was given in this chapter to give the scope of the issue being studied.
Moreover, the areas for tentative recommendations was also identified in this chapter.
Theories and literatures used during the study were identified in chapter three. To make the study
more convenient, in this chapter it clearly shows the theories for statement, objectives and research
question. Also, the existing empirical research globally done by different scholars related to oil
exploration and transportation was identified. The existing empirical research for case in question
was also shown in this chapter. Moreover, the issue of linking problem statement/objectives and
research question to theory- theory ambitions was included. Potentially a revised set of research
questions was also shown.
Chapter four comprises of methodology and methods of the study. The description of the study
area together with its map was shown in this chapter. Since the study used mixed method research
10
design, within this chapter the researcher clearly shows the particular method used in relation with
its objective being assessed using respective method. The Potential limitations and challenges
encountered during the study were also analyzed in chapter four.
In chapter five is where report clearly presented the results and discussion. The results arranged in
chronological order based on the objectives and research questions being set. This enable the flow
of the information obtained to be clearly understood by providing information required in each
objective.
The conclusion of this study made from the satisfactory results obtained from the study being
conducted reflecting the research objectives being set. The list of references used to obtain
different information will be written in the agreed format. The last part will contain appendix list.
The tools used to collect valuable information will be attached in this chapter. Both questionnaire,
group interview guides and any related material which seems to be potential are included in this
part.

11
CHAPTER TWO – PROBLEM FORMULATION
In this session I presented the statement of the problem which explaining the aims of conducting
this research. I specified the research objectives that guided in collection information related to
the research problem.
2.1 Problem statement
Oil transportation through pipeline contribute substantially to the economic growth of the country
(Tanzania) as well as creating good a relationship and support with the neighboring countries.
However, oil transport through the pipeline has been seen to create impacts on both social and
ecological aspect. The environmental pollution from oil spills and leakages have been led to land
pollution on protected areas especially in Mikumi National Park (TAWIRI 2012). Moreover, the
spills from TAZAMA oil pipeline affects the people livelihood in the villages located along the
pipeline. Therefore; this study aims to assess the socio-ecological impact of TAZAMA pipeline on
protected and unprotected areas in Tanzania. The study will enhance conservation and
developmental strategies to prevent hazardous effects on people in their villages and land resource
within the protected areas. To accomplish the aim of this study, a mixed methods research will be
adopted to address the phenomena.
2.2: Objectives
The general research statements
The general statement of this study is to investigate the socio-ecological impacts of TAZAMA
pipeline to protected and unprotected areas in Tanzania.
2.2.1: Objective 1- To assess the history and context of the TAZAMA pipeline.
i. How was TAZAMA pipeline established and set up?
ii. Which technology applied during set up to avoid leakage?
iii. Whose actors were involved during set up of the pipeline?
iv. How local people where approached to leave the area for construction?
v. What are the costs and benefits to the local level?

12
2.2.2: Objective 2- To study how the oil spills affect the livelihood.
i. What productive land do you own now compared to before pipeline established and
the oil spills?
ii. How does the TAZAMA pipeline affect the financial capital of the households’
livelihoods?
iii. What are the other activities you do to compensate for the loss of land polluted by
oil spills?
2.2.3: Objective 3- To assess the Environment Governance Management of oil pipelines
i. What are the roles of institutions in conserving the Mikumi NP in relation to
TAZAMA oil pipeline spills?
ii. What are the involvements of different actors in finding solutions related to
TAZAMA oil spills within the park?
2.2.4: Objective 4- Recommendations
i. What are the future plans based on innovations as TAZAMA pipeline gets old?
ii. What is your advice based on construction of oil pipeline within the protected
areas?
2.3 Areas for tentative recommendations
This study enables to explore how the TAZAMA pipeline contribute to the socio ecological
impacts on areas that passes through. From the findings it also, create awareness about the impacts
on both social and ecological aspects in Tanzania only. Although the TAZAMA pipeline passes
up to Zambia which also experienced pipeline leakages, the study focused only on Tanzania.
Therefore, it will be great if the same or related study could be conducted in Zambian side to
examine the extent of social and ecological impacts as related to TAZAMA pipeline. This study
provides different views and perceptions obtained from various participants involved during the
study. The use of difference techniques such as interviews, observation, content-based analysis
and household survey enabled this study to have data triangulation which will make it unbiased.
Therefore, by the end this research report will be available for various uses in different projects
related to the oil industry.

13
CHAPTER THREE - THEORIES AND LITERATURES
In this the chapter theoretical approaches and relevant literatures used in the study are presented
reflecting the objectives being set. First, the empirical literature which explore the history and
context of oil pipelines and its impacts were described. On top of that the Environmental
Governance Systems (EGSs) framework introduced and its concepts were well defined. Moreover,
the Sustainable Livelihood Approach (SLA) is used to explain the vulnerability context,
households’ assets, activities, outcomes and the policy especially compensation policy in relation
with TAZAMA oil pipelines. Lastly, after the theoretical and relevant literature has been presented
the study also presented the future perspectives of the TAZAMA pipelines as it gets old now.
3.1 Empirical literature
We are all aware that every problem has its origin. The empirical literature is effectively used to
explore and understand the causes of the problem which has been observed and experienced over
the period prevailing in a particular area. With respect to the first objective of this study, the use
of empirical evidence available in various reviews provides information about the socio-ecological
impacts of TAZAMA pipeline on both protected and non- protected areas in Tanzania (Ajzen &
Fishbein 1977). Since every problem has its source, therefore, to deal with the existing problem
effectively one needs to understand the contextual causes of it.
According to (Wilde et al. 2014) strengthen that the existence of pipelines in local community
affects their residential property values. The effect it poses to the individuals associated with its
pipeline accidents and even their future plans such as extension of the pipeline’s reserves. The oil
pipeline leakages are due to various factor such as corrosion, vandalisms and even the age of the
pipeline. As presented by (Nešić 2007) presence of Carbon dioxide (CO2), water condensation and
temperature increase the rate of corrosion on pipelines made of carbon steel. The problem of
pipeline leakage become more worse if the oil pipeline is not regularly maintained the corrosion
results into oil leakages(Mwalyosi et al. 1999).
The oil pipelines leakage can result into civil conflict since it destructs the household’s assets and
affects their capital. In various villages where the oil pipeline accidents happen tends to destroy

14
households crops and turns the productive land to less productive or completely useless that they
cannot harvest even if they apply fertilizers. It can also pollute the water sources and leave the
villagers in dilemma and expose them to the water related problems. The conflicts is associated
with weak political institutional arrangements within the state (Oyefusi 2007).
As presented by (Sovacool 2011) oil pipelines and its associated activities including extension of
its reserve can facilitate human right abuse. He emphasized that, if immediate action would not be
taken by the state it may results into violence. In this case, the decision making intends to solve
problems related to oil pipelines should be transparency to ensure the human rights are not violated.
The collected statements from the fields where this study has been conducted describing the
occurring problem such as loss of household’s assets, pollution of sources of water due to oil spills
and individual perception about compensation policy when TAZAMA pipeline affects their
livelihood were tested by reference to this literature. The historical background of the TAZAMA
pipeline as my point of focus, was collected and the information gathered through. The obtained
information from the field relate with the other cases as reviewed from different articles wrote
about oil pipelines.
3.1.1: Oil pipelines on global level
Oil is the most important source of energy used by human beings for many years. Countries depend
on it to run cars, machines, and engines in their daily production activities. The transport of oil can
be done in various ways including railways, ships or pipelines from one point to their destinations
(Iturbe et al. 2007).
The countries which involve in oil transportation benefit through diversifying the source of
incomes and creating different sources of Government revenues in their states however there are
some challenges (Shankleman 2011). When dealing with oil transportation the countries involved
should adhere to the best mode of transportation that has less impact on the environment.
According to (Frittelli 2014) explains that “railroad spill less crude oil per ton-mile transported
than other modes of land transportation such as oil pipelines”. This is due to the less factor that
railroads can cause accident compared to pipelines. Pipelines can be easily corroded, vandalized
and even the age of the pipeline. This made railroad to spill less compared to oil pipelines.
15
For many years the oil transportation has been a major source of environmental problems through
pollution caused by spills and leakages of the oil pipeline. The factors that affect most of the oil
pipeline which led to the failure and create the negative impacts in the environment includes
corrosion, mechanical and operational factors (El-Abbasy et al. 2014). It has been presented that
transporting oil through pipeline generate hazardous consequences on the environment (Senouci
et al. 2014). The pipeline spills and leakages may also be due to the age of the pipeline as in the
TAZAMA pipeline, local people and others tempering with the pipeline trying to steal oil or
technological components (Flinn 2016). The impacts can be adverse on both socially and
ecologically condition depending on the location where oil spills, the amount of oil spills and the
duration the oil spills take within the area.
Environment sustainability needs more efforts from different actors to cooperate with their ideas
and take proper actions. Issues related with oil pipeline construction, decision making on the
pipeline route needs a better understanding of the environmental policy and acts that explain
clearly the proper ways to set up the oil pipelines (Nwapi 2016). This can avoid or reduce its
negative impacts to the environment and communities’ lives along the pipeline route. The
innovations of the policy are done if the previous one seems not to work properly and make
changes on the existing ones (EMA 2004). In Tanzania the environmental issues are controlled by
the rules and regulation which are under THE ENVIRONMENTAL MANAGEMENT ACT, 2004
(Act No. 20 of 2004) This institution (EMA) can make changes that influence the environment
sustainability.
The arose issues such as pipeline leakages, conflicts due to the expansion of pipelines and improper
selection of pipeline routes are the observed challenges experienced in those areas were the
pipelines passes through (Shahriar et al. 2012). Learning from the risks created by the long-lasting
oil pipelines would help to have the sustainably developed oil sector in the country like Tanzania
which involved in oil transportations.
3.1.2: Oil pipelines and livelihoods
In most of the areas where there are oil pipelines, the local people living along the pipeline route
seems not to be directly benefited. The process of pipeline construction, as well as decision
making, are held by other actors(Barclay & Esteves 2011). In a few cases, project owners opt to
give manual work to some people in the villages such as seasonal slashing the grass along the

16
pipeline route. However, this creates a perception that only a few people are favored, and the
majority are not directly benefited with the existence of TAZAMA pipeline in their areas.
Apart from that, the costs of the oil pipeline to the adjacent local community have several
components. Pipeline leakages have threatened human welfare in many developing countries. For
instance, in Nigeria oil spills affects the farmland, rivers, wetlands, and swamps in the Niger Delta
(Ogwu 2011). The peoples who depend on agriculture for their daily life were left unemployed
due to the unfertile land caused by oil spills.
3.1.3: Oil pipelines on human health
The oil extraction, exploration, and transportation have effects on human health. In most areas
where these activities are being conducted several health cases have been reported including renal
failure, diarrhea, sore eyes, mucositis, esophagitis, itchy skin and chemical pneumonitis
(Ordinioha & Brisibe 2013). The effects are due to the presence of heavy metals (Cadmium,
Copper, and Lead) found in crude oil which is so toxic. This effects on individual health can be
both short term and long term depending on the amount of oil emitted to the environment and
therefore consumed by the human being (Wiedenhoft, H. 2017). However, more investigation
should be conducted to analyze the long-term effect of oil on human health. This will enable those
adjacent local communities’ lives along the pipeline's route to be aware of the risk resulted from
oil pipeline leakages (Martinez-Palou et al. 2011). Since the crude oil from TAZAMA pipeline
leaks and flows to the water source the peoples’ health in that area would be also at risk.
3.2 Environmental Governance Systems (EGSs)
With respect to objective number one of this study the EGS framework was used to study
environmental governance systems. Different variables such as the technology and infrastructures,
environmental resources, processes and their attributes, different actors, pattern of interaction,
outcomes and institutions used during the establishment and set up of the TAZAMA pipeline are
described. Through the EGS framework, the study compares the technology used to reduce or
avoid leakages which contribute to the negative impacts. On top of that, EGS is used to assess the
characteristics of the land resource in Mikumi and Ruaha National Park in relation to existence of
TAZAMA pipeline within their areas. The state of the resource (land) provides feedback as an
outcome to look for appropriate measures taken by the authorities. Issues like the technology used

17
to detect oil spills within the protected and non- protected areas and how they fix it are also
discussed using the EGSs. Moreover, the study assesses the role of different actors towards
protecting household assets from being polluted by TAZAMA pipeline oil spills. The way
political, economic and civil society actors, communicate, coordinate and corporate to resolve the
problem will be addressed accordingly. The role of institutions to prevent pollution and
compensation policy focusing the TAZAMA oil spills addressed reflecting the agreed policies and
institutions.
Figure 1: Environmental Governance System (EGS) framework as adapted from Vatn, (2015).
3.2.1 Technologies and infrastructures
During the construction of TAZAMA pipeline the use the technology and infrastructures present
at that time includes the use of machines and special tools to clear out the vegetations and making
trenches were used to give space for the pipelines to be buried underground about 2–3meters.
During the process the contractors faced difficult especially in areas with rivers and rift valleys

18
which most of the time leaves both contractors and equipment stranded when there is rainfall
(Griffiths 1969). Route selection for the pipeline to pass through is the important means of reducing
environmental and social impacts. The choice of appropriate pipeline route prevents oil spills risks
which mainly affects the local communities live along pipeline routes, biodiversity, conservation
units. The long pipelines including TAZAMA should be planned well to avoid passing through
sensitive features which most of them are relatively easy to avoid. However, other pipelines are
straight and pass directly to the sensitive feature it possibly has not been socially and
environmentally optimized (Goodland 2005). In most cases where the oil pipeline is straight to the
sensitive areas when oil leaks the risk creates is very high.
Technology used to set up the oil pipelines is also important in order to avoid damage to the
sensitive area such as protected areas, a densely populated town, rich biodiversity, old growth
forest and water sources. According to (Goodland 2005) the use of directional drilling which is a
technology that creates a minimal impact trenches for connecting underground pipe needs to be
fully exploited before entering the sensitive area. The process minimizes the risk of pipeline
accidents to the sensitive area.
Pipelines can be built above the ground or buried underground this depend on the technology they
are used by contractors. Being above the ground can be disadvantageous because it interferes with
human actions such as reducing their land use since it should have a reserve where no one is
allowed to practice their activities also, hindering passage of humans, vehicles and wildlife.
However, in few areas a pipeline seems to be above the ground due to soil erosion (Davis &
Brockhurst 2015). The advantage of the pipeline to be above the ground is easily to be seen when
leaks.
The buried pipelines should be coated before suppressed underground. The process of coating the
pipelines inside and outside layers ensure protection and avoid corrosion of the steel pipe. This
maintain the pipelines by increasing their life span also reduce oil leakages that caused by
corrosion. The other means to avoid corrosion in oil pipelines is by building cathodic stations as it
done in Mikumi National Park where the corrosion of TAZAMA pipeline was severe. As presented
by (Goodland 2005) the buried pipelines helps to restore land use to return to its normal, this
reducing long-term impacts, and the risk of sabotage, ruptures from traffic crashes. Other
technology such as conventional technology pipelining is intended for light and medium oil crudes,

19
while the pipelining for heavy and extra-heavy crude oils may be challenging because of their
properties including high viscosities, asphaltene and paraffin deposition (Martinez-Palou et al.
2011). These properties increasing content of formation water, salt content and corrosion issues in
the oil pipelines.
3.2.2 Environmental resources, processes, their attributes
The attribute of the environmental resources tends to show changes when intervene with external
factors including human actions. The process of transporting oil through pipelines contributed to
the environmental negative impacts associated with pipeline leakages and its associated activities.
The characteristics of the environmental resource determine which appropriate action to be taken
to rescue the situation and enable environmental sustainability. On top of that, the attribute of the
environment resource can be well maintained by the influence of the choice of resource regimes.
This can be attained through patterns of interactions between different actors involved in the oil
processes (Vatn 2015). Along TAZAMA pipeline the risks such as oil spills on both protected and
non-protected areas have changed the characteristics of the resources available. Therefore, the
actions of economic actors in this case TAZAMA pipeline owners and the choice of resource
regime will influence the attribute of the environment resources
3.2.3 Patterns of interaction, coordination, cooperation and communications
between actors
For the environmental resources sustainability to be effective different actors involved should be
well coordinated, cooperated in their actions and maintain good communications among
themselves (Vatn 2015). Each actor must be firmly stood to ensure the agreement they made are
implemented. For instance, in the case related with oil pipelines and their impacts to the
environment and community at large the involvement of political actors, economic actors and
society actors in decision making will influence the good relationship among themselves and attain
the aim of protecting the environment.
3.2.4 Actors
The actors and institutions found in the concept of Governance structure. In this category the actors
include; economic actors, political actors and civil society actors. The divisions are based on their

20
goals, capacities, rights and responsibilities in them. The emphasize of it according to Vatn (2015,
pg 143) are as follows;
● civil society actors: “It offers legitimacy to political actors and defining the normative basis
for society”. It has different levels from individual, formation of NGOs to political parties
in ensuring the democratic legitimacy of political action is motivated by the institutions of
civil society.
● Economic actors: “having rights to productive resources”. It can be grouped as
owners/producers and users/ consumers of productive resources with rights to resources
and rules of interactions as governing rules for the economic process. In this study
TAZAMA pipeline owners stands as economic actors since has the right on the
transportation of oil along the pipeline.
● Political actors: “defining the rules for the economic process”. It comprises with Public
authorities and international government organization (IGOs). Public authority like the
state support the interest of its constitutions and the rules in the society (Vatn 2015).
● There issues that can be handled at village level since there is an authority such village
council. However other complex issues are forwarded to the municipal council or state as
the most developed public authority. For instance, complains arises from people lives in
Malolo village based on the compensation after TAZAMA pipeline leaks and affects their
crops and source of water. The nature of the problem was big and can’t be handled at
village level. They involvement of other public authority to solve it was the best option.
International governmental organization is so important since it increase cooperation among
nations in the world (Vatn 2015). There are issues or problems which needs mass joint to solve
them. Issue related to development, trade, environment and production if well cooperated give rise
to more chances of economic growth of the countries involved and protection of the environment
by minimize the level of pollution from their production countries.
Focusing on the impacts of TAZAMA pipeline on both protected and non-protected areas the
actors are described as follows. Since TAZAMA oil pipeline focuses on transporting oil and make
profit this is termed as economic actors. The interest of TAZAMA is to supply oil in Zambia as a
service but also maximizing profit. In other way TAZAMA pipeline is based on both private
property and public property since in the company two-thirds owned by Zambia and one-third by

21
Tanzanian government (Griffiths 1969). Therefore, this needs a wider set of goals to ensure its
effectiveness.
3.2.5 Institutions Different authors define the term institution in various ways as shown below;
According to (North 1991): Institutions are the rules of the game in a society or, more formally,
are the humanly devised constraints that shape human interaction.
Institutions consist of cognitive, normative, and regulative structures and activities that provide
stability and meaning to social behavior (Scott 1995).
Institutions are the conventions, norms and formally sanctioned rules of a society. They provide
expectations, stability and meaning essential to human existence and coordination. It supports
certain values and produce and protect specific interest (Vatn 2015, p. 78.)
From the definitions of institutions explained above each society have the way of living based on
cultural, political and economic rules guiding them. The rules might differ from one society to
another especially at local levels but in other higher levels rules are similar. For instance, rules for
protecting the environment from being polluted by oil spills or the rules of reduce emission of
greenhouse gases these are internationally agreed, and every member state signed the agreement
must follow it.
3.2.6 Resource regimes
Resource regimes are institutions plays a major role in governing use and protection of the
environmental resources as well as processes. Therefore, it comprises the rules concerning access
to environmental resources, and the rules concerning the interactions within and between actors
that have this right and being influenced by decisions regarding them (Vatn 2015).
Resource regimes operate into different levels such as from local to international depend on the
availability of the resources. In international agreements an international resource regime is
defined as a set of, rules, norms, and decision-making procedures that intends to achieve the
predetermined objectives agreed by both member states (actors) thereby organizing their actions
and act accordingly (Chasek & Downie 2006). The conservation of sensitive features such as

22
protected areas can be referred as international resource regime since its aim is to ensure the benefit
of this sensitive feature exist in the current and future generation.
Focusing on the property and use rights, this define access of the available environment resources
for the benefit of those who have rights to use those resources.
As clarified by (Vatn 2015, p. 135.) there are five property and use rights explains the rights to
access, to withdrawal, to management, to exclusion and to alienation:
• Access: The right to enter defined physical property. Individual or households needs the
access of assets so as they can use it for various activities to generate products that fulfill
their needs.
• Withdrawal: The right to obtain the products of a resource (e.g water). The resource such
as water is a basic need for every living organism. Lack of this resource can harm the
sustainability of the livelihood. For instance, the water pollution at River Mwega due to
TAZAMA oil spill affects the villagers right to obtain clean water since they all depend on
this source to obtain water for their daily uses including drinking.
• Management: the right to regulate internal use patterns and transform the resource by
making improvement. In the case of TAZAMA pipeline, the management decided to
switch from transporting finished products to crude oil after managing to construct the
refinery in Zambia. The regulation was made because they have rights to do it.
• Exclusion: the rights to determine who will have an access right and the way that right
might be shifted from one person to another. The issue of privatization of the company can
be the best example of exclusion especially when the owners of resources needs to change
the access right to others under the certain agreements/contracts.
• Alienation: The right to sell or lease either or both; the access, withdrawal, management
and exclusion.
3.2.7 Outcomes
The outcomes are the consequences of interaction of different elements. If the outcomes obtained
reflects the intended objectives, the resource regime with its appropriate technology used should
be reinforced. But if the regime didn’t produce the intended objective changes should be made to
ensure the wanted outcome is achieved (Vatn 2015).

23
Focusing in this study the TAZAMA pipeline aimed to reduce or prevent oil leakage along its
route. The use of technology such as cathodic stations and pigging technology managed to reduce
the rate of oil spills in Mikumi National Park. According to (Angelsen & Larsen 2011) the
outcomes of a regime can be assessed through the following criteria:
Effectiveness refers to the extent to which goals are reached and the contributions of the policy to
reach its goals.
Efficiency, it reflects the economic aspect since it measures the cost taken to reach the goals. Issues
like the cost to use modern technology to prevent oil spills or the cost to find other means of
transporting oil rather than using pipelines in order to avoid passing the pipeline in the National
Parks and adjacent local communities.
Equity, refers to the distribution of costs and benefits
3.3 Sustainable Livelihood Approach
3.3.1 Introduction of Sustainable Livelihood Approach
The Sustainable Livelihoods Approach (SLA) appeared due to the work of Robert Chambers in
the 1980s, and in 1990s the sustainable livelihood approach has been further developed by
Chambers, Conway and others (DFID 2000). The SLA serve as a tool for development work, by
highlighting how to understand, analyses and describe the main factors that affect the livelihoods
of the poor people (Ashley & Carney 1999). The gradual change of peoples' life based on social,
political and even economic status can be attributed to various causes including vulnerability
context, assets, activities, policy and institutional context at local or national level (Ellis 2000).The
Sustainable Livelihood Approach can be used to understand how this livelihood platform such as
presence or absence of assets within their communities can make changes in their lives (Morse &
McNamara 2013; Scones 1998). Through access to resources, various productive activities can be
done to provide desirable outcomes that fulfill households needs. However, the asset access that
people depend on for their sources of income can be constrained by vulnerability factors such as
risk, shocks, varies between the seasons, price fluctuations, and accidents such as oil spills can
obviously bring effects on cropland productivity.

24
According to (Bebbington 1999), assets builds incomes that fulfill people’s needs. The rules based
on access and use of resources improves peoples' livelihood. Therefore, the clearly defined policy
and rules ensured the protection of household’s assets that used by people to sustain their living.
I this study I look on how household's livelihoods live along TAZAMA pipeline might be affected
by the oil spills on their areas. To achieve this, aspects such as households’ assets affected by the
presence of TAZAMA pipeline including productive land, livestock, accessibility of clean water
and their economic status as an outcome were included. Moreover, the study examines the
initiatives the government has taken trying to solve their problems related to oil leakages on their
villages. This may prevent more hazardous impacts and improve the households' livelihoods.
Figure 2: The illustration of Sustainable Livelihood Framework (DFID 1999)
3.3.2 Describing Sustainable Livelihood Approach
Different authors come up with couple of definition that explains the term livelihood.
Livelihood is the situation where human interact with the available resources in their environment
by the influence of the knowledge, they have to ensure their survival (Ingold 2002). In this case

25
people’s activities relate to what has been found in their environment. It comprises the capabilities,
assets (including both material and social resources) and activities required for peoples living.
Another author presented that, livelihood refers to the combination of capabilities, assets and
activities that human has available in their environment which used to ensure their living. The
sustainability of livelihood can be changed due to vulnerability context such as risk, shock,
seasonality and even prices (Chambers & Conway 1992).
It is also suggested that, a livelihood is sustainable when it succeeded to cope with vulnerability
context and recover from it, maintains its capabilities and assets in current and in the future, while
not undermining the natural resource base (Carney & Britain 2002). Therefore, from the core
concept obtained from different authors there is a close connection between human actions and
environmental degradation (Ellis 2000; Schafer 2002). If the environment is degraded by human
actions means the sustainable livelihood will not be achieved.
Main elements of the sustainable livelihoods’ framework approach include; vulnerability context
assets or capital, livelihood strategies, livelihood outcomes, policy, Institutional context (Scones
1998). The combination of this categories if well implemented give rise to the sustainable
livelihood.
The assets or capital in its nominal and operational definition that are generally recognized within
sustainable livelihoods theory, as summarized by (McLEOD 2001a) are;
• Natural (Environmental) capital: Comprises of natural resources such as land, soil, water,
livestock, wildlife, biodiversity, environmental resources, renewable/non-renewable
resources).
• Physical Capital: Basic infrastructure (water, sanitation, energy, transport,
communications), canals, wells, housing, technologies, and the means and equipment of
production.
• Human Capital: Health, knowledge, skills, information, ability to labour, age, sex of
household head
• Social Capital: Social resources (relationships of reciprocity, membership of groups,
networks, marital status, wealth, religion, ethnic groups, access to wider institutions).

26
• Financial Capital: financial resources available (regular payments or pensions, savings,
gold, jewelry, supplies of credit).
Assets are the important tool for households to adapt and overcome the problem of poverty in their
lives (Bebbington 1999). The sustainable livelihood approach is originated on a belief that people
require a variety of assets to achieve positive livelihood outcomes such as natural, physical, human,
social and financial. However, the households to have access of the available asset is influenced
by vulnerability context and institutional contexts (Brooks 2003).
In the case of TAZAMA pipeline, the individuals live along pipeline are having their natural asset
(land) but due to the risk of oil spills or the rule of extending pipeline reserves some of the
households found themselves losing their assets due to vulnerability and institutional contexts.
Adding to this, households have livelihood strategies which comprise the variety and combination
of activities which may give rise to the outcomes. The choices that households make on what to
do in their assets tend to fulfill their basic needs and eradicating the poverty (GLOPP 2008). Issues
like what households have as their assets and the knowledge to transform it by the means of
appropriate choice of the activities diversify households’ incomes (Ellis 2000). Focusing on this
study communities’ lives along TAZAMA pipeline engaging themselves into different activities
such as land cultivation, grazing of animals, business, charcoal and labour work.
Each household having different livelihood strategy, one may have combination of activities while
the other one depends on only one activity. Due to this the household’s income varies from one
another.
Moving to the livelihood outcomes which is one of the elements of the sustainable livelihoods’
framework. The Livelihood outcomes are the achievements or results of livelihood strategies
(DFID 2000). When the households perform the activities, automatically generate something from
it. The outcomes resulted from livelihood strategies are for living standard and wellbeing including
incomes, attainment of food security such as more income and the outcomes for quality and
sustainability of natural resources such as public goods, externalities (Ellis 2000).
The other element is the vulnerability context which refers to the external environment background
in which individual live (DFID 2000). Vulnerability arises when people have to face risk or shock
with insufficient capacity to handle it. In this study the vulnerability reflects the risks (oil spills),

27
shocks (pollution of soil and water due to oil spills), seasonality and price which surrounds
people’s lives. The vulnerability context has a great influence on people’s livelihoods and on the
availability of assets because if the asset such as land has been polluted households who depend
on that land will lose their fertile land which will results into loss of crops, food insecurity and low
income.
Adaptation of vulnerability among households differ between two ways as an adaptation of
vulnerability. Firstly, is by up front risk management whereby a household prepares for the storm
by setting the strategies including change of the asset, spread asset in different locations, diversify
activities and income sources up front (Adger 2006). These strategies enabled to cope with the
arised shock or risk being created. The other adaptation is through responding to shock in order to
hold livelihood strategy. For example, seeking new income sources, sale the movable assets such
as livestock, look for aids from relatives for a relief (Knutsson & Ostwald 2006).
Policies, Institutions and Processes are the other important category in sustainable livelihood
approach. they operate at all levels, from the household, national and to the international level. The
agreement should be made to ensure it is effectively implemented so as to attain the sustainability.
For stance, the risk of oil spills to the local communities should be well treated by focusing the
perception of present and future risk to prevent the impacts to the households (Beamish 2001).
Moreover, the organizations level policies and practices should be well defined and be
implemented into different levels to avoid severely affects the environment (Hoffman & Ventresca
2002) Policies, institutions and processes effectively determine access of assets or capital which
give rise to the choice of livelihood strategies which eventually create household outcomes. On
top of that, they also influence decision making (DFID 2000).
The use of Sustainable Livelihood Approach in this study enabled to assess the risk created by
TAZAMA pipeline including oil spills, pipeline extensions the way it brings shocks to the
households and the adaptation the local communities took to cope with the vulnerability. On top
of that issues related with the use of institutions and policy made and implemented by
TANZANIAN government on environmental issues. The compensation policy is clearly addressed
in discussion part on the way it treated on issues related with pollution due to TAZAMA oil spills.
In addition, pipeline spills have effects on both the environment and on the household’s property
values. For instance, when oil pipeline leaks and channel its oil into river pollutes the river and

28
affects the agricultural activities conducted using irrigation scheme from that river. However, the
effect to the household property may vary depending on the distance from which the leakage
happens, and the time allocated to channel the water into different farms in case it is rotational.
Based on this case, people experienced loss of productive agricultural land resulted from oil mixed
with irrigation water that floats on their farms. This led to the reduction of crop productivity and
loss of household income in the affected area (Simons et al. 2001)
3.4 Linking the theoretical approaches with objectives and research questions
The table 1 below shows the research objective with its research questions and the way it is
connected to the theory. Also, it presents the method used to collect data that gives answers to the
research questions being set.
Table 1: Linking the theoretical approaches with objectives and research questions
OBJECTIVES THEORY METHOD
1. To assess the history and context of the
TAZAMA pipeline.
i. How was TAZAMA pipeline
established and set up?
ii. Which technology applied during set
up to avoid leakage?
iii. Whose actors were involved during
set up of the pipeline?
iv. How local people where approached
to leave the area for construction?
v. What are the costs and benefits to the
local level?
Empirical
theory and
EGS
framework
• Interviewing
key informers
• Existing data

29
2. To study how the oil spills affects the livelihood.
i. What productive land do you own
now compared to before pipeline
established and the oil spills?
ii. How does the TAZAMA pipeline
affect the financial capital of the
households’ livelihoods?
iii. What are the other activities you do to
compensate for the loss of land
polluted by oil spills?
Sustainable
Livelihood
Approach
• Questionnaire
3. To assess the Environment Governance
Management of oil pipelines
i. What are the roles of institutions in
conserving the Mikumi NP in relation
to TAZAMA oil pipeline spills?
ii. What are the involvements of different
actors in finding solutions related to
TAZAMA oil spills within the park?
Environment
Governance
System
Framework
• Focused
group
Interview
• Participant
observation
4. Recommendations
i. What are the future plans based on
innovations as TAZAMA pipeline
gets old?
ii. What is your advice based on
construction of oil pipeline within
the protected areas?
• Focused
group
Interview
• Existing data

30
CHAPTER FOUR – STUDY AREA, METHODOLOGY AND
METHODS OF DATA COLLECTIONS AND ETHICS
In this chapter, the research methodology and data collection methods are presented. The first
part contains the description of the study area in which the field is conducted, and its criteria used
to select the field sites. The next part explains methods of data collection used to gather
information from the respondents found within the field sites. On top of that, procedures of data
analysis are explained. Lastly, the limitations and challenges I face in the field is explained and
how I managed to overcome the arises challenges. The issue of ethical consideration is also
adhered.
4.1 Description of study area
The fieldwork was conducted along the TAZAMA oil pipeline route in Tanzania from September
to December 2018. The TAZAMA pipeline stretches 1710 kilometers between Dar es Salaam port
in Tanzania to Indeni refinery in Zambia. The fieldwork conducted in Tanzania partly covered
areas were the TAZAMA pipeline passes through. The Tanzanian part the TAZAMA pipeline
comprised of 927 km in Tanzania from Dar es Salaam to Mbeya in Tanzania it excluded (Gleave
1992). The targeted area of the fieldwork lies between Dar es Salaam and Mbeya and excludes the
Zambian part of the pipeline. Since the study area is vast, the researcher used purposive sampling
to select the field sites which could be used to gather information related to the objectives and
research questions being set. The criteria for selecting the study areas was based on choosing a site
in which the TAZAMA pipeline passed through both protected and non-protected areas. For this
case the field was conducted in sampled villages located along TAZAMA pipeline, and the
selected protected areas namely; Mikumi National Park and Ruaha National Park. On top of that
other criteria such as areas that leakages reported from Dar es Salaam and Mbeya was also
included. The reasons for the choices of those criteria were as follows.
4.1.1: Villages located along TAZAMA pipeline
The sampling of the villages was made by focusing on those villages where the TAZAMA pipeline
passes through. This enables the process of gathering of information from the respondents in the
local communities along TAZAMA pipeline. Since the TAZAMA pipeline route intervenes with
the adjacent local communities’ lives in Dar es Salaam, Pwani, Morogoro, Njombe, Iringa, and

31
Mbeya regions. Therefore, the villages included in this study were those found in the mentioned
regions. Moreover, the study used a simple random sampling in selecting these villages and
participants that were used in the household survey. From these sampled villages the household
survey and focused group discussion with village leaders were successfully attained. Since the
study aimed at finding out the impacts of TAZAMA pipeline on the households’ livelihoods, each
household found within the sampled villages was having equal chance to participate in the study.
This helped avoiding a bias in the process of choosing respondents participating in the sample.
Issues such as household assets, activities and outcomes of their activities as related to TAZAMA
pipeline was addressed. The advantage of using households’ units is that it enabled one to get
information about the households’ economic capital as well as mapping relationships among
themselves within their villages and which reflects the social capital. A total of 120 participants
from different five villages were involved in this study and respond to the questions asked. Each
participant was representing his/ her household members.
In each village the focused group discussion was conducted with members representing their
appropriate villages.
4.1.2: Protected areas along TAZAMA pipeline route
Protected areas are geographical locations with specific boundaries opt to be conserved because
they contain valuable natural resources such as wild animals and various plants biodiversity (IUCN
2008). It differs by size and the natural resources it contains. Mikumi National Park and Ruaha
National Park were the selected field sites in this study. The choice was based on the availability
of protected areas which TAZAMA pipeline passes through. Moreover, both selected protected
areas have experienced oil leakages from TAZAMA pipeline. During the study t focused group
discussion was conducted involving the working staff from Mikumi and Ruaha National Park. The
focused group discussion was done in different days since each park has its own authority.
4.1.3: Oil leakage reported areas
Many leakages have been reported along TAZAMA pipeline from the early days after starting its
operation up to now. The areas which leakages reported includes; Dar es Salaam, Mlandizi in
Kibaha District, Doma in Mvomero District and Malolo A, Malolo B and Mgogozi in Kilosa
District, Mikumi and Ruaha National Park. The number of leakages reported differ between areas.
The selection of areas focused much on the areas experienced leakages in order to assess the

32
impacts created by TAZAMA pipeline on both protected and non- protected areas in Tanzania.
This criterion enables the study to come across areas that have been affected by oil leakage from
TAZAMA pipeline and have a good image of the existing problem.
The study collected valuable information from different field sites in relation to the objectives set.
Field sites included the TAZAMA headquarter in Dar es Salaam where key informers who
understand better the history and technical issues related to TAZAMA pipeline are found. I
managed to meet the TAZAMA engineering manager, the human resource officer and the pumping
station officer.
The study further covers both protected and non-protected areas due to that there are several
National parks where the TAZAMA pipeline passes through. The researcher managed to visit both
Mikumi National Park in Morogoro, and Ruaha National Park located in Iringa region. In these
protected areas the researcher succeeded to meet the ecological officers, antipoaching officers as
well as park guides who used to guide workers from TAZAMA that came to the park for pipeline
maintenance.
The researcher visited two pumping stations namely Kigamboni in Dar es Salaam and Kisanga
(Elephant pass) in Kilosa. The pumping station operators briefly explain the technology used to
transport crude oil as well as the way they can detect leakage along the TAZAMA pipeline by
using pigging technology.
The study was from September to December 2018. The selected time was good because areas were
easily accessed since it was not the rainy season. Therefore, the transport from one field site to
another was efficient.

33
Figure 3: Map of the TAZAMA oil pipeline route, Tanzania

34
The study area in which the field has been conducted has different topography and can be divided
into three zones: floodplain, plateau and highlands.
The Dar es Salaam and Pwani regions mostly are floodplains, comprising both of flat and an
undulating continuing plain. The pipelines originated from the cost of Indian ocean where most of
the landscape is flat. When the TAZAMA pipeline was extended to Pwani region which is also a
floodplain (Dongus et al. 2009). It has several rivers, with the big once being the Wami and Ruvu
River. Focusing on leakages, the study found that the causes of leakage in the two regions are due
to sabotage mainly close to Dar es salaam and the old age of the pipeline in Pwani region.
In Morogoro region, where the TAZAMA pipeline passes through is a plateau with an altitude of
around 1100m above the sea level, it is characterized by plains and hills and comprise of
moderately fertile, well-drained sandy soils. Although these soils are highly erodible, the area is
intensively used for maize production and livestock keeping (Paavola 2008). The area around
Doma village was also an area where pastrol Maasai where staying. The nature of the soil in
Morogoro region where the pipeline passes through are clay soils which contributes to the leakage
in rural areas. For instance, in Mikumi NP due to clay soil of that area the pipeline corrodes and
results into leakages. The TAZAMA pipeline runs along Mikumi NP for 20 kilometers. These
coverages are highly exposed to the oil spills due to corrosion. However, the TAZAMA
management has taken actions to prevent corrosion and in 1997 they build five cathodic stations
within Mikumi NP (Mwalyosi et al 2012). Other factors causing leakages are geographical features
such as hills with steep slopes which require high pressure to push the oil. Also, old age of the
pipeline in this region contributed to leakages. The study found that no sabotage activities of the
pipeline in Morogoro as compared to Dar es Salaam.
The TAZAMA pipeline runs also in Iringa and Mbeya region which are highland areas. Iringa
with an altitude of 1,550 metres above the sea level and Mbeya with altitude of 1,700 metres.
Moreover, even if most of its area are highlands there also some places categorized into midland
lies at an altitude of 1,200–1,600 m and lowland at a height of 900–1,200 m which also
accommodate the TAZAMA pipeline. The vegetation of these regions consists of clumps of palms
and patches of open grassland. There are also scattered baobab trees and scrubby woodland
especially in Ruaha NP. The TAZAMA pipelines in this region runs in highlands needing high

35
pressure to push the oil. The study found that, leakage in this region is mostly associated with
pressure operated to push the oil along the pipeline.
The activities conducted in the Iringa region are agriculture crops produced includes maize as the
dominant cereal, beans are second most important food crop being grown and a cash crops is
sunflower being the major output. Mbeya has a climate with enough rainfall and there are fertile
soils which enables productions of maize, rice, bananas, beans, potatoes (Irish & sweet), soya nuts
and wheat. The cash crops are coffee (arabica), tea, cocoa, pyrethirum and spices. There is also a
smallholder cultivation of tobacco in Mbeya region.
4.2 Methods of data collection
The study was carried out using a mixed research design comprising both qualitative and
quantitative methods based on the research objectives being set. The use of different methods was
helpful as it provides a variety of information to answer different research questions using different
techniques. This triangulation of data was very important also in this study. The triangulation of
data refers to as use of different techniques to study the same phenomena (Jick 1979). The
triangulation of data ensures the validity of the study and provides information from different
dimensions such as local communities lives along TAZAMA pipeline, village leaders, National
parks working staff and TAZAMA staff. This significantly influences the understanding of
phenomena from various aspects (Bryman 2016). Therefore, mixed research design gives a
triangulation of data in this study using both qualitative and quantitative approaches.
The qualitative method enabled us to collect information which gives a better understanding of the
meaning and perspectives of the history of the TAZAMA pipeline from the field sites (Bryman
2016). Moreover, through qualitative research, the researcher was able to see the world more from
people’s own point of view and their thoughts given in their physical, social and cultural contexts
also related to various issues concerning the TAZAMA pipeline in their locality. Also, it enables
the researcher to learn more about the specific processes that were used in maintaining or changing
their behaviors and relationships related to impacts of TAZAMA oil pipeline (Maxwell 2013).
This includes the way they cope with challenges due to the TAZAMA pipeline leakages within
their villages.

36
The quantitative method enabled the process of collecting the information related to the statistical
and numerical data in relation to the research questions being set. The use of research instruments
such as the household survey assisted to gather the information on impacts caused by TAZAMA
pipeline leakages on households’ livelihoods (Bryman 2016) (See appendix 1).
4.2.1 Focus group discussion
Focus group discussions is a technique used to collect data where several respondents are
interviewed at the same time and this has a great value for social research(Frey & Fontana 1991).
During the process, interaction among respondents was typically very high. This is partly because
in case one of the respondents forget or omit to explain some important points others from the
group of respondents was allowed to make clarifications.
The focus group discussion was helpful because it allowed the respondents to add the correlated
information based on the question being asked (Morgan & Krueger 1993). In this technique I was
the one starting the conversation by explaining the aim of the discussions and suggesting a few
rules like one should talk at the time. This can avoid that some respondents dominate the
discussions. However, if there are any respondents who need to clarify or add points, he/ she would
be showing some signs and would wait until I allowed him/her to talk. The focus group discussion
encourage informants to express their points of view(Vaughn et al. 1996). Before proceeded with
the next question I always asked if there were someone who needed to add something related with
the question being discussed. By making this short pause, the respondents would use it to rethink
and respond accordingly.
Apart from these advantages of focus group discussions it also has some challenges when
conducting it, such as the time cost as every respondent was motivated to speak and sometimes
one may repeat the same point mentioned already. To avoid this, I frequently reminded them to
avoid repetition of points when selected to respond to the question being asked. Moreover, to
conduct focus group discussion demand that the interviewer to has skills in this field otherwise the
process may end up discussing other issues apart from those intended to be attained (Harvey 2011).
To overcome this, I prepared the questions before and during the session I was just put a mark for
those questions that they fully responded.

37
Focus group discussions where conducted at the following field sites; TAZAMA headquarters
involving management, technical team from Kisanga pumping station, working staffs of Mikumi
and Ruaha National Park and the village leaders from five villages being selected. This method
offers valuable information about the history and set up of the TAZAMA pipeline as well as the
people’s perception concerning the existence of TAZAMA pipeline in their villages.
Picture 1: Focus group discussion in village offices at Kaloleni, Mlandizi (Photo by Aisha-
Researcher Assistant)
4.2.2 Literature review
In this study, I managed to gather relevant information from past and present studies using existing
secondary data. The use of a database such as Oria, ScienceDirect, and Google Scholar enabled
me to gather the secondary data related to impacts of oil exploration, extraction and transportation
using pipelines. I reviewed journal articles, reports, newspaper articles and official websites with
information about the impacts of oil pipelines on both protected and non-protected areas. This
enabled me to get both local and even global perspectives of the issue of oil transportation and
their impacts.

38
4.2.3 Households survey
I used a questionnaire prepared in advance focusing the research objective and research questions
comprising of five parts namely part A to part E. (See appendix 1). In this study, the purpose of
the household survey is to assess the impacts of oil spills from TAZAMA pipeline in households
livelihoods. (Hoinville & Jowell 1978). During the process of filing this questionnaire I was
passing around households in the specific village by the aid of one of the village leaders who
introduced me to the household members before I started doing my work.
In sampling the respondents in each household I was interested in talking to household heads or a
household adult believing he/she has all the important information fitting his/her household (Sweet
et al. 1988).
The households sampling was conducted using a simple random sampling whereby the process of
selecting the sample size was done reflecting the population of the respective village. Since I was
interested in all household in the villages that study was conducted in the limiting factor such as
time and budget made me to choose sample size derived from the population. For instance,
sampling in Kaloleni was as follows; Kaloleni is a village within Janga ward other villages found
in this ward are Mbagala, Mwembebaraza and Janga.
Janga ward has a population of 10926 (Tanzania 2012). From the total population of Janga ward I
have excluded household in Mbagala, Mwembebaraza and Janga since they were not bordering
with the TAZAMA pipeline. Therefore, Kaloleni with 2890 population was my point of interest.
I have chosen a sample of 47 households from Kaloleni reflecting the budget and time consumed
to conduct the survey. The choice was randomly selected, and survey was conducted with the help
of the head of the 10 households known in Swahili as “mjumbe wa nyumba 10” who was generally
aware of the members of each household in his/her territory. This reduced households bias from
being included in the study.
This instrument collects the data of the household background information including sex of the
household head, their ethnic group, level of education and others (the part A of appendix 1). The
other information about different factors such as asset including productive land people have
before and after oil spills, the way it altered their incomes and their attitudes towards existing of

39
TAZAMA pipeline in their community. Household opinions about the compensation policy when
TAZAMA pipeline affects their assets is also gathered using this instrument.
Picture 2: Houses smashed due to TAZAMA expanded pipeline reserve in Kaloleni-
Mlandizi, Tanzanian part 2018 (Photo by Aisha- Researcher Assistant)
4.2.4 Interview
The interview is a data collection method based on conversational practices where knowledge is
produced through the interaction between an interviewer and an interviewee. It can be defined as
a conversation that has “the purpose of obtaining descriptions of the life world of the interviewee
in order to interpret the meaning of the described phenomena”(Brinkmann & Kvale 2008). For
instance, when I was interviewing the officer from Kilosa district who was the one of the members
of assessing team investigating the impact of TAZAMA pipeline leakage into the irrigation scheme
in Malolo. The use of semi structured interview allows me to ask more questions related to the
topic being discussed. The added questions provided more information which was also relevant.
This type of interview gives freedom to express their views in different terms.
The interview was conducted in different forms based on conversational practice where knowledge
is produced through the interaction between an interviewer and an interviewee. Before conducting

40
the interview, I prepared the interview guide (differently) relate in the specific informants being
interviewed. I opted to use semi structured interview as one of the types of interview because it
allowed flexibility for both participants (interviewer and interviewee) to go into more details
through the conversational process (Keller & Conradin 2010).
The sample of people being interviewed in this study were; workers of TAZAMA pipeline, the
village leaders, the chairman of the investigation of pollution created by oil spills in Malolo and
the park authority of Mikumi and Ruaha. The selection of this group was usually homogeneous
such as village leaders only at a certain study area which shares the common resources whereby
an interviewer can gather common information from them (Brinkmann & Kvale 2008).
4.2.5 Participant observation
This is method used by a researcher to observe or witness what is happening in the field and record
the information seen. The researcher must be viewing events, actions, norms and values from the
perspective of the people being studied as well as their environment (Ritchie et al. 2014). During
the study the I managed to observe the team working between Park guiders from Mikumi NP and
the TAZAMA labour workers cleaning vegetation along the pipeline. This reflects the individual
behavior in context, the way they cooperate in their works. For instance, in the case of socio-
ecological impacts of TAZAMA Pipeline I was observing the way the environment has been
polluted due to pipeline leakage and how the presence of Pipeline affects the livelihood of the local
community. Through this I also discovered the truth that had been hiding by other informants about
the issues of oil leakage, its extent and their impacts on many household’s livelihoods. The
TAZAMA management reported less oil spills than what it has been observed in the fieldwork
Moreover, the use of this method allowed to observe one of the pumping stations and the way they
operate to reduce leakages in the TAZAMA pipeline.

41
Picture 3: Oil spills in Doma village near Mikumi National Park, October 2018 (Photo by the
researcher)
4.3 Validity and Reliability
According to Bryman (2016), “validity reflects the extent at which a concept being measured is
accurately relates to quantitative study”. In this study both the dependent variable (oil spills) and
independent variable (households’ assets) are concepts that require numerical information which
can be effectively assembled using quantitative research methods using households survey.
The reliability focuses on the accuracy of an instrument used to conduct the study; things like to
what extent the research instrument used will consistently give the same results it will be
repeatedly used in the same situation is highly considered (Bryman 2016). Based on this study the
instrument used to collect data is reliable and enable to get information using different instruments
which gives the same results. The use of random selection sampling method in survey create equal
chance for the households to participate in the study which reflects the reliability.
Apart from that, the selection of the sample of people to be interviewed were made using stratified
random sampling whereby I divided the population into small groups based on the shared

42
characteristics. For instance, in all the villages being studied have leaders, but the interview was
done separately from one village to another. These selecting criteria is specific and provide
accurate information from the population being studied (Bryman 2016). The conversation between
interviewer and interviewee was generally focused on how the impacts of TAZAMA pipeline on
both protected and non-protected areas in Tanzania.
4.4 Data analysis
The data analysis was carried out after having all the primary data collected from the field sites.
Coding and labeling were used to recognize the similarities and differences from the collected data
given by different informants (Bryman 2016). The data being collected and recorded in the form
of a voice recorder, notes and those from the questionnaire were coded in appropriate forms so
that it could be easily analyzed. I reviewed the codes to avoid using different terms to express the
same phenomena (Bryman 2016). Through coding I interpreted different themes and meaning in
each category. This enabled me to get information related to the research questions. I filed and
stored the data obtained from the fields considering their original and reworked data. The data
collected from the questionnaires was first entered into Microsoft Excel, thereafter the data
analysis was conducted using the software R.
4.4.1 Graphic description of data
The study uses different types of graphs to present the obtained data. The bar graph as well as the
histogram are used to present the different variables included in this study. The interpretations were
done by observing the data distribution. For instance, in histograms it shows if the data distribution
reflects to normal distributional curve, positive skew or it is a negative skew by observing the
direction where the tail is laid in which direction. Generally, this was shown in analytical work.
4.4.2 Regression analysis
The study uses regression analysis to predict the outcomes of the measured variable using one
variable or a multiple of variables to observe the changes it may brought about (Field et al. 2012).
When running regression analysis, the variables used were from the questionnaire. The
questionnaire was constructed aiming to obtain information of households’ livelihoods in relation
with TAZAMA pipeline along their adjacent community.

43
The dependent variable used was; What was the amount of oil spread from TAZAMA pipeline
when leakage occurred? This question specifically aimed to measure the coverage of quantity of
oil spread after leakage and was reflecting the scope of the household’s assets being polluted by
oil spills. If the amount of oil spread was very little means also that the impacts of households
being polluted was low.
A question used as independent variable was; To what extent the property destruction caused by
TAZAMA pipeline leakage affects your financial capital?
The control variables such as gender (Q2), age (3), households’ job (Q4) were also included in the
regression analysis.
From the dependent and independent variable being used, I formulated the hypothesis that, “the
more the oil spill and spread after TAZAMA pipeline leaks the more it will affect the household’s
capital.
I use p = 0.05 when measuring the level of significance.
In this study used linear regression models to observe the relationship between variables. It
included the dependent, independent and control variables. All these variables were driven from
the households’ survey questions asked in the field site.
The study assessed the impacts of the amount of oil spread after TAZAMA pipeline spills
(dependent variable) to the household capital (independent variable). This would enable to find
out if there are effects of the oil spills in the households’ capital living along the TAZAMA
pipeline. The results might be indicated if it is positive correlated or not.
The dependent, independent and control variables were added to observe the changes that might
be created after adding other factors. This indicated that in some cases the causes of changes
observed might also influenced by other factors. For instance, household’s capital (independent
variable) might also contribute by age, job, gender and other factors (variables)
Also, the dummy variable with reference category was made using the different villages which
study has been conducted. This enabled to see the variation of amount of oil spread after TAZAMA
pipeline leaks in different villages. I have chosen Kaloleni being a reference category. Therefore,

44
the results obtained after the regression analysis the villages were presented referring Kaloleni as
a reference of impacts being observed based on amount of oil spill spread on their areas.
The Ordinary Least Squares (OLS) was used in this study since it is effective in analyzing linear
relationship. Also, it is the best method corresponds to minimizing the sum of square differences
between the observed and predicted values. The equations are different based on number of
variables involved.
According to Field et al., (2012), it explains that, “For bivariate regression: Y=b0+b1X1+e and for
multivariate regression: Y = b0 + b1X1 + b2X2 + b3X3...+biXi +e whereby;
Y=dependent variable, (The amount of oil spread from TAZAMA pipeline when leakage occurred)
b0=the intercept (constant)”.
b1= the coefficient for variable X (the independent variable) and tells us how much Y (the
dependent variable) will change when X change in one unit.
X1, X2, X3 and Xi= The independent variables as shown below;
• Extent in which the property destructed by TAZAMA pipeline leakage affects household’s
financial capital
• Age
• Gender
• Job
• Leakage scenarios
• Households awareness risks created by TAZAMA pipeline
• Impacts of TAZAMA pipeline policies on the access of households’ resources
• Type of property destructed after TAZAMA pipeline spills
• Villages
e=errors.
4.5 Potential limitations and challenges
Conducting this study required cooperation from various stakeholders such as government
officials, TAZAMA pipeline authority, Mikumi National Park authority, village leaders as well as
45
people living in those areas where the study was conducted. Failure to meet with any stakeholders
during the study may have hindered the triangulation of data. This could again have affected the
validity of the study due to lack of information from different dimensions.
I came across few limitations and challenges when carried out this study. The first challenge
arouses when I was following up to get the research permit from Tanzania National Park
(TANAPA). The process require a lot of procedures and I was running out of time. I managed to
overcome this by travelling to Arusha and submitting my research proposal to Tanzania Wildlife
Research Institute (TAWIRI) as one of the procedures and they wrote a letter to TANAPA to allow
me to proceed with the data collection. TANAPA gave me the permit and allowed me to collect
data in two protected areas namely Mikumi and Ruaha National Parks (See appendix 4).
Other challenge was from the informants where the households survey was conducted. Most of
them demanded to be paid before they responded to the questions being asked. I was using extra
time to convince them that I am a student and what I’m doing is part of my study, so I beg their
cooperation. With the aid of accompanied village leader escorting me during the process they did
understand and allow me to ask them questions for free and spend their time.
Moreover, the geographical location where the study conducted was also a limiting challenge. The
study coverage is mostly in remote areas where transport and other basic needs including
accommodation was not good due to poor infrastructures. However, I tried my best to ensure the
study is conducted effectively and completed on time regardless of the challenges that arouse.
4.6: Ethical considerations
Throughout the whole process of conducting this study I adhered to ethical issues related to
informed consent, confidentiality and acknowledging other people’s work using correct citation
and references. The ethical issues were considered through acknowledged their right sources (Berg
& Lune 2012). The issue of informed consent was highly encouraged to get participants who are
willing to be involved in the study after I introduce to him/her the aim of the study.
Also, concerning the issue of confidentiality I ensured that the identities and records of individuals
were withheld (Bryman 2016). When I assured the individuals about the issue of confidentiality,
the become more confident to express themselves without fear.

46
During the data analysis the process of inserting the data into Microsoft Excel and running software
R each respondent was coded a specific number was given. Later when a reference was made, I
used the number to refer a specific informant. Through this technique confidentiality was
maintained.

47
CHAPTER FIVE - RESULTS AND DISCUSSIONS
In this chapter the results obtained from the fields are presented. The flow of results presented in
this chapter reflects the objectives and research question being set. I give a brief history of the
background for the pipeline establishment and the impacts of the pipeline on people’s livelihoods.
I also look at how the system for governance of the pipelines operate and how they deal with issues
around the spills and their effects on nature and people and the degree of involvement of local
people, the management and compensatory issues. I end with give some future perspectives and
advise for the new planned pipelines.
5.1: Assessing the history and context of the TAZAMA pipeline.
In line with first objective of this study, I have presented the history of establishment of TAZAMA
pipeline. Issues concerning the plans, aims and procedures taken to establish the TAZAMA pipeline
are addressed. Focusing on each research question I provide information’s obtained from the field
which give a better understanding of the history of TAZAMA pipeline.
5.1.1 TAZAMA pipeline establishment and set up
This study bases the history of TAZAMA pipeline from various sources including a focused group
discussion conducted at TAZAMA headquarters in Dar es salaam. The informants reached have
all been working in TAZAMA for more than three years in different positions. The working
experience of the TAZAMA informants makes them confident in responding to the questions being
asked because they know a lot about the TAZAMA pipeline.
The political idea of constructing the TAZAMA pipeline was due to difficulties of transporting oil
from Rhodesia's Umtali refinery to Zambia. Rhodesia was originally a historical region in south
Africa. It was divided by the Zambezi river to form North and South Rhodesia. The territory of
Northern Rhodesia has been Zambia since 1964 and that of Southern became Zimbabwe in 1980
(Soames 1980).
In 1965, the problem of oil transportation to Zambia detoriated when Rhodesia decided to close
the Beira-Umtali pipeline (Griffiths 1969). This resulted in a fuel deficiency in Zambia which was
highly needed for various economic activities including running of machines for general transport.

48
To improve the situation, they opted to transport oil to Zambia using British, Canadian and
American military aircrafts from Nairobi and Dar es Salaam. The cost of this was venture too high.
To reduce the cost and other inconveniences, the transport of oil to Zambia was implemented by
using roads. To improve the road services, the Zambia-Tanzania Road Services Ltd was
established. This had different stakeholders such as, the governments of Zambia and Tanzania (35
per cent each) and the Italian motor manufacturer, Fiat (30 per cent). The process of oil transport
by road was however not very effective due to the nature of the geographical features such as
valleys, rivers and steep mountains found along the road. The situation become worse during the
rainy season because the roads were flooded with water and bridges would be washed away and
this made the trucks carrying oil driven difficult. Due to these inconveniences the stakeholders
decided to find more reliable and permanent solutions to transport of oil to Zambia.
The solution was to build an oil pipeline to link Zambia with the East African coast. Zambia is a
land-locked country and does not have any port for ships carrying oil. Therefore, the oil pipeline
when connected to the coast of east Africa simplified the availability of oil to Zambia.
The TAZAMA pipeline was constructed between 1966-1968. It starts operating almost
immediately after the completion of the construction in 1968. Initially, the TAZAMA pipeline was
transporting finished products (The oil that is ready to be used in machines). As time went by, they
changed and started transporting crude oil. The changes in oil product being transported was due
to the completion of infrastructures (oil refinery) in Ndola. They build a refinery that could be used
to process and convert crude oil to all other products such as diesel, petrol etc.
The Tanzanian government gave land for free for the pipeline to be constructed. This strengthened
the relationship between two countries (Tanzania and Zambia). The pipeline passes through Dar
es salaam, Pwani, Morogoro, Iringa, Njombe and Mbeya regions in Tanzania before entering
Zambia. It did however, created tensions locally as the land in many ways were both used and
traditionally held and controlled by local people and institutions, and the oil pipeline become
problematic.
49
5.1.2: The technology applied during set up of TAZAMA pipeline to avoid
leakages and spills
The TAZAMA pipeline has experienced several leakages since it started its operation. The oil
leakages were due to various causes including both technical and maintenance issues. The
TAZAMA pipeline has managed to reduce/avoid leakages through various strategies by
observing the factors contributing to the oil leakages. Before the pipeline construction they
conducted studies and analysed geographical features such as hills in those areas where the oil
pipeline was planned to pass through. This enabled the technical team to identify which areas that
needed more attention and deal with it accordingly to reduce the situation of oil spills. This was
implemented by connecting pieces of pipelines of different diameters along TAZAMA pipeline
route. The TAZAMA pipeline has diameters of 8 and of 12 millimeters (mm). The variations of
the diameter would depend on the geographical features as one requires different pressures to push
the oil depending on geographical topography. In areas of steep mountains, the diameter of the
TAZAMA pipeline is small (8mm). This will increase the pressure and enable to push the oil over
the heights. This adaptative technology has reduced the oil leakages along TAZAMA pipeline.
Along the TAZAMA pipeline there are several pumping stations facilitating the transportation of
oil. During the setup of the TAZAMA pipeline the constructed pumping stations along the pipeline
route were also used to monitor leakages. In Tanzania there are five (5) pumping stations namely;
Kigamboni, Mikese, Kisanga (Elphans pass), Iringa and Inyala Mbeya. Apart from that there are
two pumping stations in Zambia namely; Chinsali and Katonji. Since the oil is transported by
pressure within the pipeline, the monitoring of leakages along the route is not difficult.
According to pumping station manager at Kisanga pumping station said that “In case there is an
accident at any point along the route causing oil leakage, the pressure if the oil pipeline is lowered.
For instance, the inflate pressure at Kisanga pumping station is 30P/square inch”. Therefore, if the
pressure falls below 30P/square inch, the discharge of oil goes down. This indicates there is a
problem somewhere along the pipeline route between the two pumping stations. Moreover, the fall
in the pressure initiates an alarm at the pumping stations. This notification from the alarm gives
them an alert and they start to act. The first element is to stop pumping of the oil until they repair
the leakage point”.
50
Other factors such as the distance, power, height and capacity of the pump between one station
and another would also be considered in setting up the pipeline so as to avoid leakages along the
TAZAMA pipeline.
5.1.3: Actors involved during set up of the TAZAMA pipeline
The study found that the first presidents of Tanzania and Zambia namely; J. Nyerere and K.
Kaunda were the main actors involved in the decision making during the establishment of the
TAZAMA pipeline. The project was financed by a consortium of Italian banks, Mediobanca and
the agreement was signed between the governments of Italy, Tanzania and Zambia by accepting
to repay the loan after the TAZAMA pipeline starts operating. The involvement of civil society
actors in the project was through participating in jobs offered during the construction of the
TAZAMA pipeline.
5.1.4: Approaches used to provide land for construction of the TAZAMA
pipeline from local people
The study found that during the time of TAZAMA construction most of the land was not occupied
by people because the population density was generally very low in those areas at that time. For
those areas being occupied by indigenous people they were asked to resettle to allow the pipeline
construction. This was the order from the Tanzanian president without compensation.
The informants stressed that giving some lan was not a big deal at that time because most of the
land wasn’t in use. The indigenous people could shift and acquire other productive lands for free.
Due to political stability that Tanzanian had, the whole process was done peacefully. Moreover,
since the land in Tanzania can be grouped into general land, communal such as community-
managed pastoralist lands, village land and even some private land, the nation still has the mandate
to take a land from the owner by following due rules and regulations made for such expropriation
(Nelson 2012) and compensation processes.
TAZAMA constructed the pipeline and allocated a marking showing the TAZAMA pipeline
reserve on both sides of the pipeline. The “pipeline reserve” was 15 meters in each side from where
the pipeline lies. Therefore, it makes a total of 30 meters reserved for TAZAMA pipeline over
1710 km in Tanzania and Zambia. According to the rules of TAZAMA pipeline, emphasize that
“no one is allowed to conduct any activity within the pipeline reserve zone”. If people violate this

51
rule, they can be punished according to the law. For instance, if people build houses within the
pipeline reserve the TAZAMA would demolish them. This was also witnessed by the researcher
during her study in Mlandizi at Kaloleni area in Tanzania. The houses were had been broken by
TAZAMA for being constructed within the pipeline reserve. This land was alienated from local
people with due processes and legal right.
Based on histories of leakages along the TAZAMA pipeline the study has found that, since the
early stage of its operation the pipeline has been facing challenges of oil leakages. However, to
obtain records of the leakages had been a challenge. The TAZAMA authority agreed that there are
leakages, but the records are not clearly documented. I managed to obtain some of the data that
shows the history of the more recent leakages occurred along the pipeline.
Table 2: History of the TAZAMA pipeline leakages from 2000 to 2018 in Tanzania and
Zambia.
Report cycle year on
year
Number of leaks
detected per annum
Total length of all line pipe
replaced per annum in km
From To # Kms
2000 2001 16 0
2001 2002 31 0
2002 2003 26 0.084
2003 2004 36 0.036
2004 2005 25 0
2005 2006 38 0.012
2006 2007 24 0
2007 2008 34 0.214
2008 2009 30 4.5
2009 2010 23 0
2010 2011 24 0
2011 2012 25 7
2012 2013 26 1.718
2013 2018 ? 11.626
358 25.19
Source: (Ministry of Mines 2014) Tazama Pipelines Ltd Engineering & Operations
Information (2001-2013)

52
The study has found that in Tanzania, the frequency of oil spills in areas where the TAZAMA
pipeline passes through is rarely occurred. On non-protected areas the scale of oil spills ranges
from 1-3 cases on those villages that were visited. While in the protected areas, only Mikumi NP
has observed to have several cases of oil spills before the construction of cathodic stations. Ruaha
NP informants presents no cases of oil spills that remembered and that affected their biodiversity.
However, they agreed that there are possibly small leaks that the TAZAMA management fix
immediately during their ordinary operations.
A disaster related to oil spills in Tanzania was highly experienced in Malolo. Other areas have also
experienced the oil spills from TAZAMA pipeline, but a major negative impact was found in
Malolo.
5.1.5: The cost and benefit of the TAZAMA pipeline to the local levels
Any project will accrue both costs and benefits- for nations- and for local people and communities
involved. The production and distribution of costs and benefits tend to accrue to different actors
and can often lead to conflicts and tensions. The costs and benefits have also come in different
time periods; depending on a new technology, appropriation of land, age of pipeline etc.
Also, I have chosen a small section of the total pipeline area and locations, partly to capture the
differences between protected and not protected areas. Below we look further into both benefits
and costs created by TAZAMA pipeline in Tanzania in the areas where this study has been
conducted.
5:1:5:1: Benefits
i. Sources of employment
TAZAMA employed both permanent and pensionable workers in both production of the
infrastructure and in maintenance. Also, there were part time jobs such as clearing the pipeline
route by slashing the area. This part time job was done by local people from the villages located
along the pipeline route. TAZAMA authority has also divided the pipeline area into smaller
segments to simplify the security issue. In each area, there is a group of local people employed and
given bicycles to patrol the pipeline route close to their locality. All these people are being paid by
TAZAMA through the village authorities. Generally, the TAZAMA pipeline contributed to some
local and national income.

53
ii. Social corporate responsibility
TAZAMA has been a part and parcel of the local communities since its inception. The involvement
of social activities conducted in the villages located along the pipeline route has been witnessed
by various people interviewed during the study. Moreover, through various social corporate
responsibility activities TAZAMA has managed to share some benefits with the local people.
According to some informants, they emphasized that “without TAZAMA probably up to now one
of the administrative building in the school might still not have been completed”. The building
was constructed by Kisanga villagers, but due to low income among the villagers they fail to make
the roof of the building and other finishing. TAZAMA helped the task left by villagers by making
the roof of the administrative block”. The headmaster appreciates TAZAMA for their heartfelt
care and support given to the school. He emphasized that even if they need any assistance or help,
they usually communicate with TAZAMA and got immediate response.
iii. Construction and maintenance of the road
TAZAMA has managed to construct a road which join Kisanga and the junction to Kilosa. The
road is approximately 10 kilometre. Even if it is a rough/muddy road due to great maintenance
being done by TAZAMA, the road is consistently used throughout the year. This road simplifies
the movement of both goods and people. It also enables good communication with other areas
bordered to their villages.
iv. Construction of health center
TAZAMA has built a health center at Malolo village. For a long-time people living in Malolo and
the nearest villages were travelling very far to search for health services. The researcher during
her study witnessed the construction of a health center going on. If the completion of this health
center proceeds as planned, it will be one of the best heath centers in Kilosa District. This was
done by the TAZAMA outreach or social corporate responsibility in villages along the pipeline.
During the study the researcher found that, TAZAMA has deposited 120 million in September
2018 in the account as an initial payment for construction of that health center. Due to this payment
the District Commissioner (DC) of Kilosa promised to make a follow up of all the money given
by TAZAMA so that they are all directed and being used in a specific area allocated. According
to village executive officer of one of the villages where the study conducted emphasized that “The

54
close supervision of Kilosa District Commissioner motivates the villagers to volunteer in doing
various activities related to health center construction for free”
5:1:5:2: Costs
As specified before that any project accrues costs and benefits the following are the costs that has
been revealed to TAZAMA pipeline. During the study, the researcher found there are costs created
by TAZAMA to the people leaving along the pipeline route where research has been conducted.
i. Water pollution due to oil leakages
For over 50 years of operation, the TAZAMA pipeline had been associated with the history of oil
leakages. The study had found that sources of water being contaminated by the oil from the
pipeline made people suffer from accessing clean and safe water for their daily uses and for
agriculture. I used different cases that took place along the pipeline in different areas and over
time. For instance, in 2011, oil spills in Mlandizi at Mkalamo basin polluted the water used for
growing vegetables and destroyed the ponds used for small scale fishing.
The water being polluted at Mkalamo basin was used to generate income for smallholder farmers
that lives in the area. Moreover, one incidence happened in 2012 in the Dutch Valley, which led
to lack of clean and safe water for domestic use. It also polluted, the irrigation scheme of the people
living in Malolo A, Malolo B and Mgogozi. In this area the situation was worse since the river
Mwega was the only source of water and villagers depended on it. To address the situation, the
TAZAMA authority took action and brought safe water by using special cars and distribute to the
villages. The service didn’t last long so, they continue afterwards to use water from river Mwega
for washing clothes and bathing and even drinking. This made them suffer from skin diseases and
even stomachache and other health related issues.
On top of that, in 2018, the oil leaks polluted the Msongozi river in Doma which is also the source
of water for the villager’s lives in Doma. During the study, the researcher observes Maasai grazing
their livestock nearby the river and allowed their livestock to drink the polluted water. In the same
area other activities such as domestic activities involving the use of polluted water were also going
on with other groups of people. These are some few cases that can represent the impacts of oil
spills from TAZAMA pipeline on the water sources in Tanzania.

55
ii. Land pollution due to oil spills
In this study area, the land polluted was observed in both protected and non-protected areas in
Tanzania. The scope of the problem varies geographically. The study has found that there are many
places where agricultural land has been polluted and that affects crop productivity. Due to this,
household’s livelihoods had also been affected after their farm had being polluted by oil leakages
from the TAZAMA pipeline. This incidence, as a case of leakage, led to massive destruction of
crops and land.
In addition, the oil leakage had been occurred within the protected areas specifically Mikumi
National Park. The leakage from the TAZAMA pipeline had seen to affect the vegetation of the
park. The study has found that the area being affected was very small compared to the total
coverage of protected area where pipeline passes through. However, even if the area being affected
within the protected area was small, still proper measures should be taken to avoid leakages on
both protected and non-protected areas.
iii. Loss of household’s income
The loss of household’s income was due to loss of their crops when the TAZAMA oil pipeline
leaked. For instance, the farmers whose their productive land were destroyed after TAZAMA
pipeline leaked. Such as, the case of Mwega irrigation scheme being polluted. The households
depended on the Mwega irrigation scheme for generating incomes through irrigation farming.
After the irrigation scheme was being polluted their crops were dried and died, even up to now the
harvest levels has not get recovered.
The study found that people in Malolo and Mgogozi have not been compensated for their losses.
More investigation was done, and I managed to interview the chairman of the committee. During
the interview he said that the compensation committee made comprises with people from
TAZAMA, and the village leaders and District Executive Director (DED) of Kilosa in the year
2012. The informant presents that, during their meeting the following were suggested for the
compensation agenda;
• Compensation should be done by paying every farmer who has affected based on
assessment made or,

56
• Compensation should be done by constructing water tap since the villagers don’t have
clean water source or,
• Compensation should be done by TAZAMA being responsible to produce social services
such as building health centers, making gutters which prevent floods and others.
The last meeting agreed to build the health center in Malolo as a means of compensating for
leakages. Similarly, the same happened in Mlandizi but respondents said that very little
compensation were given. For this case people’s rights have not been considered.
iv. More running costs to the farmers
Households lives along TAZAMA pipeline had been forced to use more inputs for their
agricultural activities. In Doma village, one of the tomato farmers said that “since the pipeline
leaks and pollute the river used to trap water to irrigate his tomato farm the cost had increased
much. He now uses money to search for water far away and has to carry water by a motorcycle
which he has to pay”. Before the TAZAMA pipeline leaks and pollute the river in Doma he was
using that water for free and irrigate his tomato farm.
5:1:5:3: Summary on costs and benefits to the local levels
Generally, the information obtained from the visited sites exposed that the TAZAMA pipeline
docreates more costs than the observed benefits to the local communities’ living along the pipeline.
We see from the Malolo case that people suffer heavily from hosting the pipeline, in terms of costs
of leakages, pollution of water and soils, health hazards etc.… and that perceived benefits do not
match these. But from this case and more generally what can we say. Most of the village we visited
could report rather frequent leakages, varying in shape and scope, but accruing costs and risks and
uncertainties. Each location has had about 1- 6 incidences over the 50-year lifeline. There are thus
substantial room for improvement of the situation, which I return in the section where the
TAZAMA authority and other stakeholders deals with environmental issues.
5.2: The impacts of oil spills and household’s livelihood.
I present household characteristics and assets as based on the livelihood framework. The
livelihood strategies or activities in which households perform in relation with the assets they have

57
are presented before the outcomes. In the last part of this session I present activities households
perform to compensate for the losses of their assets.
5.2.1: Household access to assets
Access to assets is essential for the sustainability of household’s livelihood. Assets influences the
household’s possible strategies which generate outcomes such as incomes, food security and
sustainable use of natural resources (Ellis 2000). This means that households depend on assets to
produce a flow of goods and services as cash incomes or consumption goods.
According to Scoones (1998) and Ellis (2000), the assets or capital are categorized into five
categories; human capital, natural capital, physical capital, social capital, and financial capital. The
income earned from the household’s assets varies depend on the diversification of assets or capital
that the households own. The assets that, households can have might differ, both in rural and urban
areas.
Table 3: Socio-economic factors by location along TAZAMA pipeline, Tanzania, 2018.
Households socio- economic
factor
Kaloleni Malolo A Malolo B Mgogozi Doma Average
total
Mean age of the household’s
heads* (yrs)
39 51 44 39 49 44
Religion Christian (%)* 25 50 68 40 58 48
Religion Muslim (%)* 75 50 32 60 42 52
Mean households’ size
(number)*
5.3 5.3 4 5.1 5.1 5
Mean households land (ha) 1 1.3 1.1 1.8 1.2 1.2
Primary education (%) 49 90 77 90 75 76
Workers/ consumer ratio* 0.19 0.19 0.25 0.2 0.2 0.2
Female head households (%) 49 0 35 30 10 25
Mean total income USD* 3684 2650 2484 3500 3667 3197
Mean income per capital day 1.9 1.4 1.7 1.9 2 1.8
N=120, * indicates significantly difference between locations (p < 0.05)

58
Table 3 showed variations within the five sampled villages along the TAZAMA pipeline. Location
influences the selection of activities to be done by the households living in a particular area. It also
attributed to the available resources such as land, water sources and even the cultural and climatic
conditions. The results showed that Kaloleni has large mean total income (USD) followed by
Doma. These villages are located at the urban areas compared to the other villages.
The diversification of activities that were done by people living in those area made them to earn
more. Most of the rural areas depend on farming and some very few engage in animal grazing.
Reducing activities made them earn less.
Generally, the income per capital day of the people living in villages where this study has been
conducted ranges from 1.4 – 2 USD. The scale reflects that those people are poor because their
income per capital day is 2 USD and below that. Moreover, they have small households land. For
instance, in Kaloleni the mean households land is 1 acre which used for agricultural activities. The
crops obtained from that 1 acre required to fulfill the needs of 5.3 households’ members. Since 1
acre cannot fulfill the needs of 5.3 household members, the risks that created by the TAZAMA
leaks affects them and expose the households in extremely poverty
5.2.1.1 Natural capital
In this study I found that households assets such as agricultural land, livestock, house plots and
business sites differ from urban to rural areas. For instance, Kaloleni (Mlandizi) is a business town
where there are more diversification of households’ assets or capital compared to the rural area
where the majority of the individuals depend on farming for earning their incomes. (See village
coded 4 Mgogozi). They have houses but it is just for living and not for renting to generate
incomes.
this study has found that each household have access of natural assets which are used achieve
their basic needs.
The table below shows the diversifications of assets possessed by households’ living in the villages
where this study has been conducted.

59
Table 4: The diversifications of assets possessed by households’ living along TAZAMA
Pipeline, 2018.
Assets (%) Kaloleni Malolo A Malolo B Mgogozi Doma
Livestock 13 40 26 26 16
Agricultural
land
38 60 64 74 67
House plot 47 0 0 0 17
Restaurant 2 0 0 0 0
None 0 0 10 0 0
The study had found that people living along the TAZAMA pipeline own various assets that they
use as a source of incomes. Kaloleni seems to have more diversified assets including; livestock
13%, agricultural land 38%, house plots that the collects rent from it 47% and 2% have restaurants
and everyone has assets to generate income even if is small. In the case of Malolo B 10% of the
households doesn’t own assets. This indicates that their living depends on working on others farm
by being paid low wages.
5.2.1.2: Human capital
To examine the sex of households’ head in communities’ lives along TAZAMA pipeline where
the study has conducted. The study found that most of the household’s head are men with 60%
while the women who lead their households represented as 40%. This means that in communities
lives along TAZAMA pipeline the top decision making are made by men. Issues related to
distribution of work within the family are supervised by men. Only in few households’ women are
responsible in high decision making for their wellbeing of their families.
Table 5: Households head sex along TAZAMA pipeline, 2018.
Mean Male % Female %
Sex of the households’ head 72 60 48 40
N=120
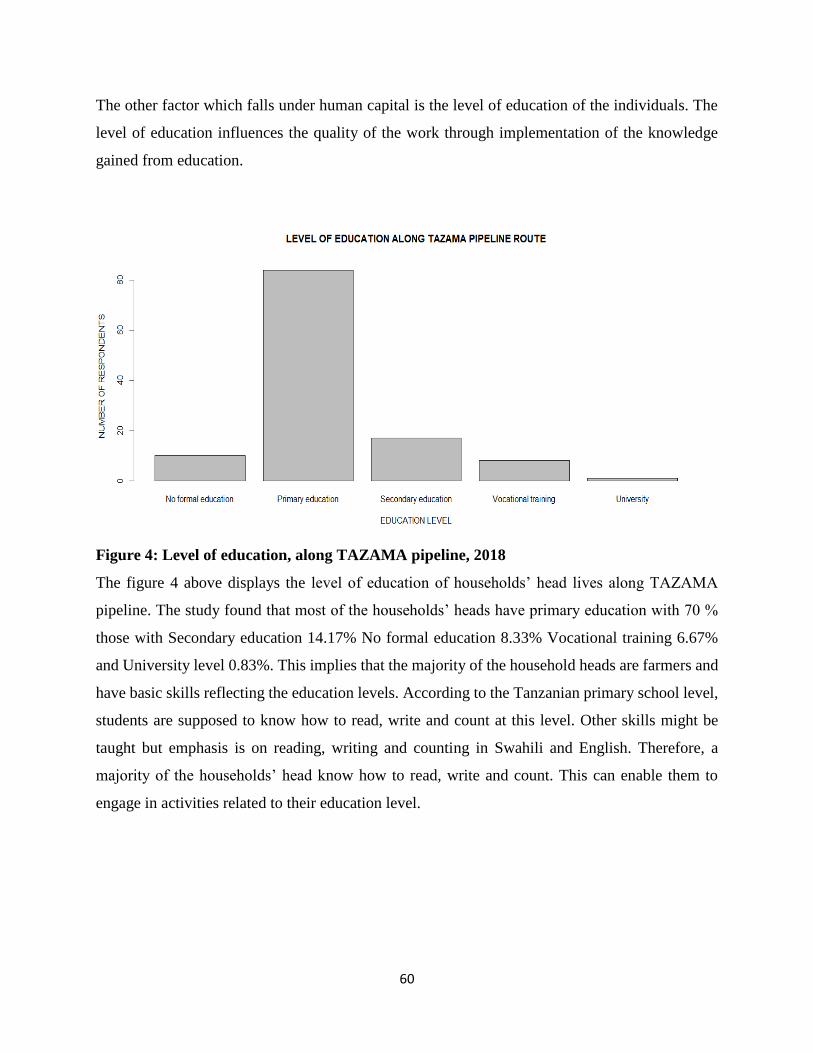
60
The other factor which falls under human capital is the level of education of the individuals. The
level of education influences the quality of the work through implementation of the knowledge
gained from education.
Figure 4: Level of education, along TAZAMA pipeline, 2018
The figure 4 above displays the level of education of households’ head lives along TAZAMA
pipeline. The study found that most of the households’ heads have primary education with 70 %
those with Secondary education 14.17% No formal education 8.33% Vocational training 6.67%
and University level 0.83%. This implies that the majority of the household heads are farmers and
have basic skills reflecting the education levels. According to the Tanzanian primary school level,
students are supposed to know how to read, write and count at this level. Other skills might be
taught but emphasis is on reading, writing and counting in Swahili and English. Therefore, a
majority of the households’ head know how to read, write and count. This can enable them to
engage in activities related to their education level.

61
Table 6: Assessment of human capital by location along the TAZAMA pipeline route,
Tanzania,2018.
Mean Kaloleni Malolo A Malolo B Mgogozi Doma
Mean age of the
households’ head
39 51 44 30 49
Mean sex of the
households’ head
0.51 1 0.6 0.7 0.8
Households size 5.3 5.3 4 5.1 5.1
Mean households head
education level
2.5 2.1 1.9 2.1 2.1
N=120
Households size varies significantly between the five villages that study has been conducted.
Malolo B showing fewer household members of 4 while Kaloleni, Malolo A, Mgogozi and Doma
with approximately 5 households’ size. This implies that in general households living along
TAZAMA pipeline are in the scale of 4 and above.
The mean age of the households’ head in all villages showed that they are adults of between 39–
51. This mean age implies that they are energetic and are capable of doing various work if other
external factors such as illness are free from them.
5.2.1.3: Social capital
In the sampled villages where this study has conducted, I found 24 ethnicity group. 25 different
ethnicities. The ethnic diversification is due to people’s migration searching for potential areas that
provide needs of their interest and also since the study cut across different regions with different
ethnic groups. However, they all spoke Swahili languages that unites them and made
communication easier among themselves.
Generally, people in the area are average and generally poor with an average income of less than
1 USD per day.
People have basically primary education (See figure 4) and are basically worked in agriculture.
Below in section 5.2.2 we look at how people adapt through livelihood strategies.

62
5.2.2: Households livelihoods strategies
The households reported livelihood strategies based on activities that were performed by
households to sustain their living. Livelihood strategies performed by individuals depends on
various factors such as age, education level, ethnic group i.e Maasai and also, geographical
locations with its natural resources available. The key activities agriculture, livestock keeping,
public sectors and business.
Figure 5: The households livelihoods strategies along TAZAMA pipeline
The study found that, majority of the individuals lives in the villages located along TAZAMA
pipeline are farmers with 56% followed by households doing business which are 24%.
Since the livelihood strategies reflects also with ethnic group, this study found that along the
TAZAMA pipeline there are groups of Maasai involved in livestock together with other ethnic
groups which makes up 4% of the people. Apart from that, other livelihood activities performed
by communities’ lives along TAZAMA pipeline are the retired with 3%. These have been working
in both government and private sector but due to their old age they have retired. Moreover, there
are individuals living without job 2.5%, this is due to various factors such as illness and one who
lost his assets as a result of the extension of TAZAMA pipeline reserve.
Culture also attributes to the livelihood strategies as has been observed in various societies around
the world. In this study I found a group of women (6.72%), who are not going out of their house

63
to work so as to generate income. They stay at home taking care of the family and wait for their
husband to bring for them their basic needs.
Activities that depends on certain levels of education has also observed. These are teachers 0.8%
and drivers also with 0.8 %. The last are still students but still they managed their time for studies
and extra time for performing activities after school work. Since they live with their grandparents
that are too old to provide for them each and everything, they are 1.7%.
Table 7: Linking activities to location along TAZAMA pipeline route, Tanzania, 2018.
% Kaloleni Malolo A Malolo B Mgogozi Doma Total
Farming 32 90 84 80 42 66
Animal
grazing
17 10 10 20 25 16
Have
apartment
for renting
34 0 0 0 16 10
Small
businesses
17 0 6 0 17 8
N=120
Here we see that most of the people living along the TAZAMA pipeline engaged in farming
activities (66%). Animal grazing (16), those who build houses and collect rent from it (10 %) and
those doing small business or entrepreneurs (8%)
5.2.3: Livelihood outcomes
Households access to different assets determine the activities to be done, which would create an
outcome. The outcome might be affected depending on the degree of vulnerability. For instance,
if households depend on agricultural land (assets) for farming (activities) to generate their financial
capital (outcomes). Then the vulnerability context such as risks created by the pipeline spills it will
have a negative effect on their assets and their financial capital.

64
5.2.4: Outcomes of livelihood incomes and effects on oil spills.
Outcomes are the results of livelihood strategies or activities derived from different assets that the
households have. The outcome might be affected by vulnerability context involving risks such as
oil spills. For instance, when TAZAMA pipeline spills and the oil flowed to the agricultural land
(natural asset) the outcome might be the loss of income since the crops have been destroyed by the
oil spills.
Table 8: The outcomes of TAZAMA pipeline oil spills correlated with different variables.
Variables
Amount of oil spread after pipeline leaks
Regression model
Gender 0.1477
(0.1335)
Age* 0.0002
(0.0046)
Job* -0.0029
(0.0362)
Leakage scenarios* -0.08424
(0.2186)
Land polluted by oil spills 0.2118
(0.0989)
Households awareness risks created by TAZAMA pipeline* -0.1148
(0.1393)
Impacts of TAZAMA pipeline policies on the access of
households’ resources*
-0.2939
(0.2127)
Type of property destructed after TAZAMA pipeline spills* -0.1056
(0.0676)
Extent in which the property destructed by TAZAMA pipeline
leakage affects household’s financial capital
-0.0526
(0.0802)

65
Dummy set reference category: Kaloleni
Malolo A 0.9763
(0.2737)
Malolo B 0.7694
(0.2487)
Mgogozi 0.5723
(0.3004)
Doma* -0.499886
(0.3202)
Intercept 4.4094
(0.5301)
P-value 6.181e-11
R-squared (Adjusted) 0.4769
N= 120, * indicates Significantly difference impacts of oil spills in household’s financial capital (p < 0.05)
From table 8, regression analysis used to test the research hypothesis which states that, the more
the oil spill and spread after TAZAMA pipeline leaks the more it affects the household’s capital.
The regression coefficient obtained by regression line were recorded accordingly. Both dependent
variable (amount of oil spread after pipeline leaks) , independent variable (the extent household
capital affected due to oil spill) and the control variables including; Gender, Age, Job, Leakage
scenarios, land polluted by oil spills, Households awareness risks created by TAZAMA pipeline,
Impacts of TAZAMA pipeline policies on the access of households’ resources and type of property
destructed after TAZAMA pipeline spills were included to observe the effect it cause to the
dependent variable.
The regression results obtained were as follows; the gradient coefficient is -0.0526 which is
negative. This implies that there is negative correlation between the dependent and independent
variable. That means the households financial capital are not directly affected by the amount of oil
spread after leakage. Therefore, there are other factors that can contribute and affects the

66
household’s financial capital. The control variables (gender, age, job, leakage scenarios, land
size, households awareness risks created by TAZAMA pipeline, impacts of TAZAMA pipeline
policies on the access of households’ resources and type of property destructed after TAZAMA
pipeline spills) contributed to the decrease in amount of oil spread after pipeline leaks by -0.0526
if the extent household capital affected due to oil spill will also increase by 1 unit. The household’s
awareness risks with -0.1148 created by TAZAMA pipeline could contributed to the decrease in
amount of oil spread after pipeline leaks since individuals might take proper actions to prevent and
even to report immediately when the pipeline spills occur.
The P-value is 6.181e-11 which is very low, this reflecting the p-value scale of 0.05 thus, it accepts
the research hypothesis.
The adjusted R2 was increased to 0.3091 equals to (47.7%), This indicates that 47.7% of the
variation of amount of oil spread after pipeline leaks (DV) comes by addition of control variables
(gender, age, job, leakage scenarios, land size, households awareness risks created by TAZAMA
pipeline, Impacts of TAZAMA pipeline policies on the access of households’ resources and Type
of property destructed after TAZAMA pipeline spills) .
The dummy set variable (villages) included to observe the changes it will create in regression
results as other variables included. The gradient coefficient of extent in which household capital
affected due to oil spill showed -0.0526. This indicates that the dummy set variable (villages) has
a great impact on the amount of oil spread after pipeline leaks since the leakages varies by locations
along the TAZAMA pipeline in Tanzania.
Dummy set variable shows different correlation in its categories. The coefficient of Doma has a
negative value of -0.499886 which indicate negative correlation with the amount of oil spread after
pipeline leaks. When households in Doma experiences the oil spread after pipeline leaks it will
have less outcomes on their household capital.
However, the coefficient value of Malolo A is 0.9763, Malolo B is 0.7694 and Mgogozi is 0.5723
shows positive correlation with the amount of oil spread after pipeline leaks. This indicates that
the households live in Malolo A, Malolo B and Mgogozi experiences higher amount of oil spread
after pipeline leaks and flowed into their irrigation scheme.

67
Furthermore, basing on reference category (Kaloleni) in dummy set variable the correlation gives
the following information. The coefficient shows positive values which is very high. This implies
that households live in Malolo A, Malolo B and Mgogozi experiences higher amount of oil spread
after pipeline leaks than those living in Kaloleni (reference category).
The R2 increases to 0.4769 This means 47.69% variation of the amount of oil spread after pipeline
leaks comes as a result of variables included in regression model.
Generally, the effects of oil spills created an outcome that affects the household’s livelihoods. It
shows 0.2118 of the agricultural land were polluted over the villages that experienced oil spills
from TAZAMA pipeline. This affects the people’s activities and create an outcome in their
financial capital for -0.0526. Also, the degree of vulnerability is high as risk management including
awareness about the risk related to the TAZAMA pipeline is -0.1148. Therefore, people should be
informed about the risks that can affects their assets, activities and change their livelihood
outcomes.
Generally, the effects of oil spills on households’ incomes varies by location. The problem is big
for those who experienced the leakage and affects their assets used for productions. In this case
the outcomes (financial capital) have been observed to be low after pipeline leakage. However, for
Tanzania in general the effects of oil spills from the TAZAMA pipeline have not been showing
much effects except for the villages that experienced the leakages.
5.2.4: Productive land and effects of oil spill
Many households’ natural capital (agricultural land) and irrigation surplus, have been reduced after
the TAZAMA pipeline oil spills and the channel of crude oil into their farms and irrigation scheme.
During the study I found that in three villages out of five where fields had been totally polluted by
oil spills from the TAZAMA pipeline. The land has not recovered to be ready for productions. Due
to this, households have suffered and are more exposed to food insecurity and lower incomes.
Table 8 compare previous and current productive land households have in relation to the oil spills.

68
Table 9: Comparison of households’ productive land before and after oil spills by location,
Tanzania, 2018.
From the table 9 above, great effect has been shown in the fifteen groups made up of households’
farmers from Malolo A, Malolo B and Mgogozi. Also, other two villages Kaloleni and Doma their
VILLAGES Productive land households
own before oil spills (Acres)
Productive land remained after oil spills (Acres)
KALOLENI 16.75 15.75
IRRIGATION
GROUPS IN
MALOLO A,
MALOLO B
AND
MGOGOZI
Group 1 115 0
Group 2 70 0
Group 3 66 0
Group 4 97 0
Group 5 119 0
Group 6 101 0
Group 7 122 0
Group 8 54 0
Group 9 112 0
Group 10 78 0
Group 11 79 0
Group 12 173 0
Group 13 57 0
Group 14 41 0
Group 15 62 0
Total 1461 acres 15.75 acres
DOMA 4.5 4

69
land has been polluted due to the TAZAMA pipeline leakages and affects the household’s
livelihood. In addition, the oil spills from TAZAMA pipeline flowed into the irrigation intake
used by the villagers to irrigate their farms. They have the routine to irrigate their farms, initially
those who were in the session during the day of pipeline accident received severe negative impacts.
However, due to the huge amount of oil being flowing even after the repair of the oil pipeline the
effect was seen in the rest of the farms.
Generally, the productive land being destroyed differ by locations. In villages such as Kaloleni
and Doma households that have been affected are those having farms near the leaked point.
Moreover, in Malolo A, Malolo B and Mgogozi have been affected much because the oil leaked
and flowed to the irrigation scheme which all the villagers used for farming activities.
From the table above, 1461 acres seems as minor impacts in general for Tanzanian but is a big
problem for involved people. 1 acre gives 10 bags of maize per year. According to the market price
1 bag of maize = 32.73 USD. Then, 32.73 USD X 10 bags of maize = 327.3 USD. If 1461 acres
multiplied by 327.3 USD =478,185.3 USD
Therefore, the loss for the case per year in 1461 acres is 478,185.3 USD which is a big problem
for people experienced the loss.
5.2.5: Effect of the TAZAMA pipeline to the household’s financial capital
i) Crops grown
The study found that, the households’ living along TAZAMA pipeline involved in agricultural
activities to produce crops for consumptions and surplus. After the crops have been harvested they
store the portion for their food storage and the rest they took it in the market so that they can get
incomes to do other developmental activities including buying building materials for their house,
paying school fees for their children and even other luxurious needs.
The table below shows different types of crops grown in the villages located along TAZAMA
pipeline where this study has been conducted.

70
Table 10: Cash and subsistence crops grown in the villages located along TAZAMA pipeline,
Tanzania, 2018
KALOLENI MALOLO A MALOLO B MGOGOZI DOMA
Cash crops Cassava, maize,
vegetables,
Onions,
maize,
beans,
tomatoes,
rice,
groundnuts
Onions,
maize, beans,
tomatoes,
rice,
groundnuts
Onions,
maize, beans,
tomatoes,
rice,
groundnuts
Tomatoes,
vegetables,
onions,
green
pepper,
maize,
sunflower
Subsistence
crops
Cassava, maize,
groundnuts,
vegetables,
sugarcane
Onions,
maize,
beans,
tomatoes,
rice,
groundnuts,
banana,
sugarcane
Onions,
maize, beans,
tomatoes,
rice,
groundnuts,
banana,
sugarcane
Onions,
maize, beans,
tomatoes,
rice,
groundnuts,
banana,
sugarcane
Maize,
beans,
tomatoes,
onion, green
pepper,
sugarcane

71
ii) Perceived effects of oil spills on financial capital
The effects of oil spills on financial capital seems to range in scale from very low to very high and
it also varies by locations.
Table 11: The perceived effect of households’ financial capital by the TAZAMA pipeline
leakages by location, Tanzania, 2018
% Kaloleni Malolo A Malolo B Mgogozi Doma
Very low 36 0 7 0 0
Low 9 0 3 0 0
Moderate 7 0 0 0 0
High 41 15 53 50 58
Very high 7 85 37 50 42
N=120
The extent in which the TAZAMA pipeline affects the household’s financial capital varies by
location. This was due to the amount of oil leaked and affects their assets used to generate incomes.
The financial capital of the households living in Doma, Malolo A, Malolo B and Mgogozi have
been highly affected. The study found that 85% in Malolo A showed very high effect on their
financial capital. Also, 7% of households living in Kaloleni seemed to have very high effect on
their financial capital as a result of the TAZAMA pipeline leaking.
Therefore, the effects of the household’s financial capital that created by the leaks from the
TAZAMA pipeline differ among households living along the pipeline route. The effects ranges
from very low, low, moderate, high and very high.
From the figure 6 below, the highest bar represents high. This implies that, most of the household’s
financial capital has highly affected by TAZAMA pipeline.

72
Figure 6: The perceived extent of households’ capital affected by the TAZAMA pipeline
leakages, Tanzania, 2018.
The study results show that, the extent in which households capital affected by TAZAMA pipeline
is beyond average. This implies that most of the household’s financial capital are generally highly
affected by TAZAMA pipeline.
Most of the people in the sampled population are farmers and they to continue with agricultural
activities despite that the yields they are getting is not satisfactory compared to the before the leaks.
The farmers state that oil spill from TAZAMA pipeline generated losses in cash crops and led to
household lower financial incomes.
iii) An example of costs of oil spill on financial capital
I made calculations of onion yield to emphasis the point of loss of households’ incomes;
According to the market price average price of 1 onion bag= 35,000/- Tanzanian shillings (TSH)
or 19.91 USD. 1 acre of onion can produce 70 bags of onion
Group number 2 in table 4, have 70 acres
If all was used for onion, they would get 4900 bags of onion
Referring to the market price average price of 1 onion bag= 35,000/- TSH
It would yield 171.5 million TSH or (77954.5 USD/ year)
The loss is 171.5 mil TSH for a full year. As we see the yield level seen to be slightly increasing
but losses will occur for a long time.

73
Figure 7: Households yields of onion crop per acre from 2010 to 2017 along the TAZAMA
pipeline, Tanzania.
The figure 7 above shows the trend of yields in Malolo from 2010 to 2017. During 2010 – 2011
the yields was very high with an average of 71 bags per acre.
In 2012 the TAZAMA oil pipeline spills and affects the households agricultural land in Malolo
this led to the fall of the yields up to 9 bags of onion per acre. Based on my calculation the group
2 alone having 10 acres of onions incurred a loss of 171.5 million TSH or (7795.45 USD) in that
year.
The situation become worse in 2013 and 2014 as yields continue to be low. However, the study
also found that the yields have started to increase from 2015 to 2017 even if it is not reaching their
expected harvest of 70 bags of onion per acre.

74
Generally, the study found that the losses are substantial on both individual, crops production and
for the financial capital of about 7795.45 USD loss per year in villages experienced oil spills. This
effect is great since the financial capital being loss is high and the people doesn’t have enough land
to shift. Also, they are not being compensated for their loss.
5.2.6: Vulnerability context
The vulnerability context in this study is mostly associated with the risk and shocks related to
TAZAMA pipeline spills. The study found that, cost that people incur due to oil spills by losing
land and buying water exposes them to losses of cash and food crops as well as income losses.
The study has found that most of the household lives in villages located along TAZAMA pipeline
have experienced oil spills from the TAZAMA pipeline. This creates shocks among them as it was
accompanied by loss of their assets.
Table 12: Households perception due to the TAZAMA oil spills in Tanzania, 2018
Households
experienced shock
due to oil spills
Percentage (%) Households not
experienced shock
due to oil spills
Percentage (%)
117 97.5 3 2.5
N=120
The shocks obtained were due to the changes of incomes among people living along the TAZAMA
pipeline after pipeline leaks and affects their assets. The table below showed the variation of
incomes in five villages where this study has been conducted. Malolo B has showed the great
changes in total income (USD). This was due to the destruction of crops and land after the
TAZAMA pipeline leaks flowed into the irrigation scheme This income loss created shocks among
the people affected by the TAZAMA pipeline spills.
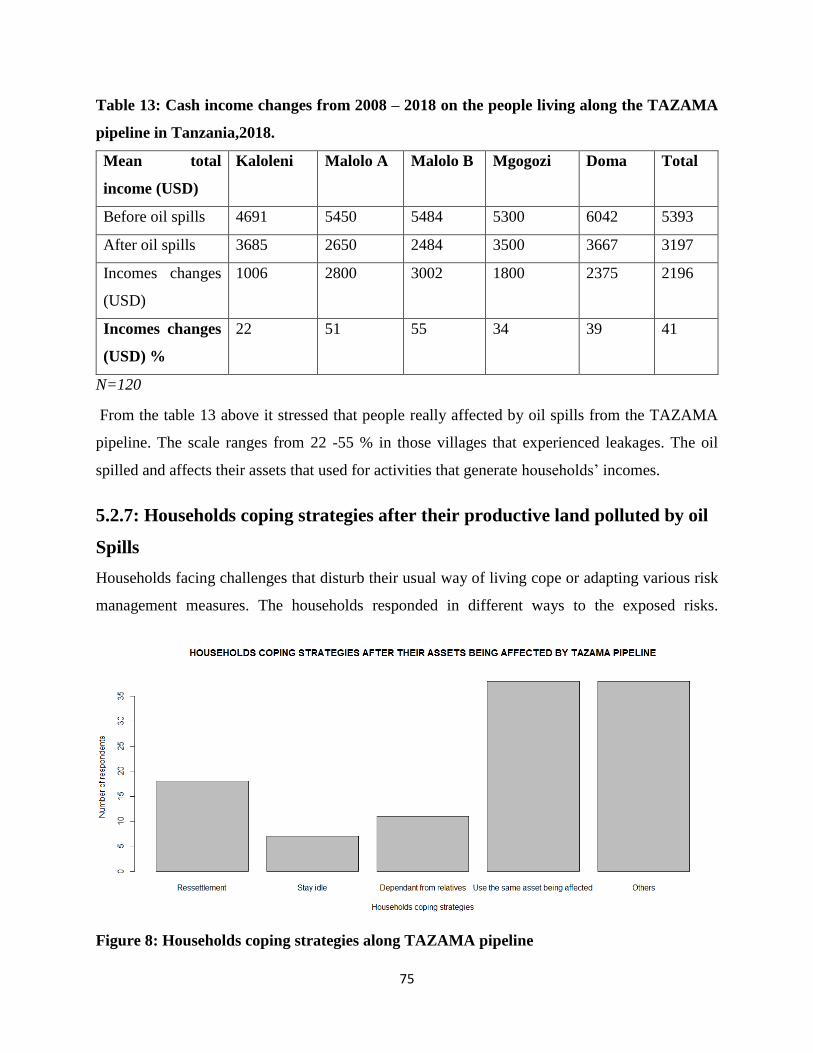
75
Table 13: Cash income changes from 2008 – 2018 on the people living along the TAZAMA
pipeline in Tanzania,2018.
Mean total
income (USD)
Kaloleni Malolo A Malolo B Mgogozi Doma Total
Before oil spills 4691 5450 5484 5300 6042 5393
After oil spills 3685 2650 2484 3500 3667 3197
Incomes changes
(USD)
1006 2800 3002 1800 2375 2196
Incomes changes
(USD) %
22 51 55 34 39 41
N=120
From the table 13 above it stressed that people really affected by oil spills from the TAZAMA
pipeline. The scale ranges from 22 -55 % in those villages that experienced leakages. The oil
spilled and affects their assets that used for activities that generate households’ incomes.
5.2.7: Households coping strategies after their productive land polluted by oil
Spills
Households facing challenges that disturb their usual way of living cope or adapting various risk
management measures. The households responded in different ways to the exposed risks.
Figure 8: Households coping strategies along TAZAMA pipeline

76
About 34% households continue to use the same assets even if being affected. This includes those
who have agricultural land. They continue with farming activities even if the production is not
sufficient due to loss of fertility of their land. For instance, one households stress that they still
would be working in the same farm and land but with the extra use of fertilizer to increase the
production. However, the harvest is not good as it is used to be.
Apart from that there are also another group of households (33%) that have diversified their
activities such as doing labour work in others farm, selling firewood, making local beers and
engaging in small business. All these activities were done to cope with the risks related to
TAZAMA pipeline.
The study has also found that many households (16%) have opted for resettlements from their
villages to nearby village farms. This has mostly presented by people who lived in Malolo ward.
They still live in Malolo but, they shifted their agricultural activities to the nearby village known
as Chabi or Msagani. This does consume much of their time in form of walking long distances
before reaching to their new farms. This strengthened that they have to do it because they don’t
have choice since that is the only way they can do as a coping strategy.
Each household have different coping strategy of choice to rule. Other have decided to stay idle
(6%) and those remain dependent of relatives (10%) mostly were elders.
Table 14: Households assets affected by the TAZAMA pipeline leakages and their coping
strategies, Tanzania,2018.
Mean Households assets Coping strategies
Villages along the TAZAMA
pipeline*
0.4506
(0.1392)
-0.5243
(0.1392)
N=120, * indicates significantly difference between locations (p < 0.05); Standard deviation in
brackets
Here in table 14, we see that in total households’ assets have highly affected having 0.4506 and
the adaptions or coping strategy are serious and costly. People adapt in very different ways
depending on theory options. Move or resettle (almost 16%), they stay idle (6%), they depend on
others (10%), and they carry out a variety of other things (33%) and a big group also just take the
shock and accept losses.

77
5.2.8: Summary of oil spills and livelihood effects
Generally, for Tanzania as whole the land affected by oil spills seems to be low as the state have
a land area of 885800 square kilometer (Komba et al. 2015).
For local people the study results showed that the oil spilled from the TAZAMA pipeline has heavy
effects on the household’s livelihood. People lose capital and income sources; they endure
substantial costs and losses of incomes. Options are not many that could be used by people as
coping strategies and reduce vulnerabilities. The losses are substantial and are basically not much
compensated at all.
Moreover, the people should be informed to make them aware of the risks that might be happened
in their locations related to the TAZAMA pipeline. This would reduce the household’s activities
that can cause accidents including cooking nearby the pipeline and took precautions.
Picture 4: Showing people frying fish for business in Kaloleni near to the TAZAMA pipeline.
(Photo by author)

78
5.3: Assessing the Environmental Governance Systems (EGSs) of the
TAZAMA pipeline in both protected and unprotected areas.
In this section, the Environmental Governance Systems of the TAZAMA pipeline are presented.
Issues such as the influence of different actors in ensuring environmental sustainability along the
TAZAMA pipeline route were addressed. Other aspects relate to leakage prevention and initiatives
being taken are also discussed including the role of institutions as well as the technology and
infrastructure being used. Later, we would look at some the future perspectives of the TAZAMA
pipeline.
5.3.1: Influence of different actors to ensure environmental sustainability
along the TAZAMA pipeline
Political actors have been involved in establishing a political institution with different actors that
dealt with environmental protection in Tanzania. The state established the National Environmental
Management Act of 1983 and the National Environmental Management Council (NEMC) (GOT,
1983). NEMC has the role to arouse public and private participation in natural resource
management programs. Political actors such as MINAPA, local government, village council, local
people and local communities played different roles in the EGM (Environmental Government
Model). They are both active and passive players more and less powerful. These political actors
have roles in ensuring that the rules and regulation are followed. Focusing on the Tanzanian
constitution that was made under Regulation 6 (1)) indicated there are list of projects which
required mandatory Environment Impact Assessments (IEA). One of them are projects involving
the construction of offshore and onshore pipelines and the construction aimed at
expansion/upgrading of pipelines (EMA, 2004, p. 29-30). This created an awareness and a net of
rules and regulation that the projects should be operated along.
The economic actor i.e TAZAMA pipeline owners have influenced environmental sustainability
by ensuring the reduction/ prevention of leakages which is the major environmental problem along
the TAZAMA pipeline route. The efforts they made was to replace the old pipeline which was
corroded and exposed to a risk of leakages. But still there are many leakages along the pipeline.
TAZAMA should be responsible for such risks being created.

79
Also, civil society actors specifically local communities’ lives along TAZAMA pipeline have
inputs on the project. They engaged in security issues to protect the TAZAMA pipeline. Their
major role informers are to report any unusual event taking place in their locality related to the
TAZAMA pipeline. Through this they are to improve security and enable to protect the pipeline
from being sabotaged by local peoples. However, the study has found that, most of the oil leakages
are not caused by local people and sabotage but rather by old age of technology and pipelines and
bad maintenance.
5.3.2: The roles of institutions in conserving the protected areas in relation to
TAZAMA pipeline oil spills
The importance of conserving sensitive areas in Tanzania has been emphasized by different
institutions. The bodies deal with environmental issues such as NEMC has been played a major
role in fulfilling the agreements made and supervised by Ministry of State, Vice President’s Office,
(Environment and Union Matters)
According to EMA (2004, p. 33), any project planned to be implemented should not located in and
should not affect any environmentally sensitive areas such as National Parks. This is one of the
screening criteria used for each project that interfere with the protected areas. The role of the
institution in this case is to ensure the stated criteria is followed regardless the external factors such
as political pressures, corruption and even the pressure from the developed countries. If this
criterion would had been followed by Tanzanian government, the existence of oil pipelines should
not be within the protected areas. Therefore, the TAZAMA pipeline that goes through the
conservation areas indicates that there is weakness in implementing the stated laws and policies
on EIA within the country.
On top of that, there are also projects that required a mandatory EIAs for its implementations. The
supervision is done by the institutions found under the Ministry of State, Vice President’s Office,
(Environment and Union Matters). Among the projects that require a mandatory EIAs is
construction of oil pipelines for transporting petroleum products. (EMA 2004, p. 29). Other small-
scale activities such as fish culture, Bio-gas plant, Horticulture and floriculture may or may not
require EIA that means it’s not mandatory (EMA 2004).

80
5.3.3: The technology and infrastructure of the TAZAMA pipeline used to
prevent/influence leakages during oil transportation
In addition to the technology used during the setup of the TAZAMA pipeline factors that need
considering involves; quality and age of the pipeline, maintenance needs, the diameter of the
pipeline, geographical features where the pipeline will pass through, capacity of the pump and
pressure required to push the oil. There are also more relevant technologies used now by TAZAMA
to detect leakages. The leak detection to prevent hazardous effects is done by a technology called
pigging. During the study it has been presented that, there are two types of pigging namely;
i. Normal pigging
ii. Intelligent pigging.
These pigging are inserted in the TAZAMA pipeline and pushed together with crude oil from one
pumping station to another.
Normal pigging
This is a technology used to trap any residues found within the crude oil being transported along
TAZAMA pipeline. Its main function is just to make and keep the pipeline clean. Within the crude
oil material sometimes there might be dust or any residue that might block the pipeline and led to
pipelines busting. Therefore, this technology helps to make the pipeline clean.
Intelligent pigging
This is technology used in TAZAMA pipeline to detect leakage along the TAZAMA pipeline
route. It also run within the pipeline and pushed with crude oil being transported from one pumping
station to another. Intelligent pigging has the capacity to record the distance in which there is a
leakage or sign of hole, thickness of the pipeline if it is normal or there are changes. The pig sent
from one pumping station to another for let say from Mikese pumping station to Kisanga pumping
station. When the pig reaches Kisanga the operator removes it from the pipeline route by doing
the right procedures including closing the pump for sometimes.
Later, the removed the pig is placed in the computer for analysis. If it shows that there is any
defect, the technician team take immediate action to address the situation. For instance, through
intelligent pigging it is easily to know exactly point where there is a hole along the pipeline. This

81
enable the technician to follow up and fix the problem immediately. Also, if the there is no problem
recorded, the pig will be inserted again in the TAZAMA pipeline to run and detect leakages to the
next pumping station.
Picture 5: Kisanga pumping station, one of the pumping stations along TAZAMA pipeline
route (Photo by author)
The process of running the pig along TAZAMA pipeline is reported done after every three months.
This maintains the regular checkup of the pipeline and prevent leakages along the TAZAMA
pipeline route.
Apart from that there is other technology used to prevent leakage through building of cathodic
stations in areas where leakage is associated with corrosion of the pipeline. It was reported that
Cathodic protection is a technological application which involves electrolysis whereby the electron
reaction occurs on the electrode surfaces found in the electrolysis cell.
According to (Tseng 2003) an electrolysis cell have two chambers, an anode and a cathode
chamber. The anodes are connected and placed closely to the buried oil pipeline. This connection
was more susceptible to corrosion and is protect the buried oil pipe.
Focusing on the cathode chamber, it has the Cathodic Protection (CP). The CP has been proven to
be effective in eliminating the risks of alternating current (AC) and direct current (DC) during

82
electrolysis. Therefore, this process prevented corrosion on buried steel pipelines (Hosokawa et al.
2004).
The TAZAMA pipeline is buried underground in a depth of between 1-2meters. This enabled the
pipeline to not do easily being in contacts with human activities which can create pipeline leakages.
However, sometimes due to soil erosion and other factors related to that the TAZAMA pipeline
may be seen above the ground. It has been emphasized that during the process of pipeline route
clearing the TAZAMA laborer’s also restore the eroded soil and make sure the pipeline not seen
above the ground.
5.3.3 Outcomes of the technology used and interaction among actors to the
environmental resources along TAZAMA pipelines
The outcome is the one of the components of Environmental Government Systems (EGSs) which
needed to be addressed. This study assessed the outcomes created by the technology and
involvement of different actors on the environmental better resources along the TAZAMA
pipeline. The observed outcomes would either accept the technology being used or suggest the
modernization which made the environment conserved. Moreover, the outcomes might be
influenced by the interaction among political, social and economic actors associated with the
TAZAMA pipeline on both protected and non-protected areas.
5.3.3.1 In Protected Areas
40% of the Tanzanian land are protected areas. Mikumi and Ruaha National Park are among the
protected areas found in Tanzania which the TAZAMA pipeline goes through. The land that
regarded as protected area is large and will not be done to avoid new pipeline in protected areas.
In MINAPA the coverage of the TAZAMA pipeline is large and in Ruaha National Park the
pipeline is just intervenes with Ruaha river which was the main source of water flows in the park.
The core value of all protected areas is conservation of the park environment and ensuring
sustainability of the biodiversity found within the park. The TAZAMA pipeline being within these
protected areas interferes with the implementation of conserving the park environment due to its
risks created by the pipeline. The impact created by the pipeline that goes through the protected
areas might be challenged on both environmental and economic aspects. This was due to the facts
that the conserved environment influences the wellbeing of the wild animals found within the

83
protected areas. The existence of wild animals in the park attract tourism and hence becomes a
source of income to the nation. Therefore, to ensure the conservation objectives the park should
be conserved for the benefit of the current and future generations. The park authority should deal
with all the activities seems to threaten the sustainability of the park and their wellbeing. Things
like construction of infrastructures such as pipelines, electric grid and even highways within the
park is highly discouraged. Also, illegal hunting as well as poaching is a criminal offence which
should be discouraged.
This study has found that the existence of TAZAMA pipeline within the park as one of the
infrastructures available at the park interferes the conservation value. The impacts created by the
TAZAMA pipeline however has shown less effect compared to the other infrastructures found
within the Mikumi and Ruaha national park such as tarmac road, electricity power line and
railways.
This study found that, for instance in Mikumi National Park the following are the challenges to
the park related to the infrastructures found within the park;
• The garbage collected along the road (1 ton/month)
• The road killing threatens the life of animals especially gazelle.
• Oil spills from the damaged pipes due the nature of the soil (clay soil), this led to corrosion
of the TAZAMA pipeline and hence leakages.
• Introduction of exotic plants in the park by the casual laborer’s who come to clean the
TAZAMA which threaten the park environment.
• Poaching cases, because some workers in the park may be informers and this could affect
the security issues.
• Animal injuries resulted from open trenches left after the repair of the TAZAMA pipeline
5.3.3.2 In Non-Protected Areas
Since Tanzania has started to invest on transporting oil and gas through pipelines, more pipelines
would continue to be constructed in non-protected areas. This resulted into losses of assets owned
by the household’s lives along the pipelines. The losses might be associated with approaches given
by the government to shift to provide the land for pipeline constructions. Also, the accidents

84
created by the pipelines including oil leakages have been observed to destruct the household’s
assets including subsistence and cash crops which affects their economic status.
In villagers located along the TAZAMA pipeline where the study has been conducted, the
information obtained has shown that there are governance challenges due to the presence of
TAZAMA pipeline in their areas. Issues such as extension of the TAZAMA pipeline reserves has
been contested by people who own land along the pipeline route. For instance, in Mlandizi people
said that at the time they were buying a plot, the mark showing the pipeline reserve was well
marked but surprisingly, the TAZAMA authorities came again and extended the pipeline reserve
which made them lose properties. The pipeline reserve expansion could have a heavy effect in
non-protected areas. The effects could be observed in the total loss of potentially or real
agricultural land. The TAZAMA pipeline has expanded the pipeline reserve to 30 meters.
I have calculated the land that has been lost by taking the length of the pipeline from Tanzania to
Zambian border. The distance of the TAZAMA pipeline from Tanzania to Zambian border is
927km.
If, 927km = 927,000m. Then, the distance in meters of the TAZAMA pipeline from Tanzania to
Zambian border = 927,000m. Since the pipeline reserve extended to 30m, the area that pipeline
took would be 30m x 927,000m = 27,810,000m2 x 2 in both sides = 55,620,000 m2
The total land lost due to the TAZAMA pipeline extension is large and could have been used for
agriculture and other households’ activities.
The involvement of local community in decision making especially in extending the pipeline
reserve was not appropriate both on participation and local involvement. This has resulted into
conflicts between the TAZAMA pipeline and the people’s lives adjacent to the pipeline.

85
Picture 6: The double allocation of TAZAMA pipeline reserve mark in Kaloleni as a result
of extension as shown in the picture above i.e from mark circled red to blue. (Photo by
author)
On top of that, the study has found that there are sabotage cases that have been reported. The local
people have tempered with the TAZAMA pipeline and steal the crude oil. According to TAZAMA
informant’s sabotage cases were reported in 2015 in Dar- es- Salaam and the same year in Mafinga.
Such actions are very dangerous as the oil is explosive and if caught fire it can cause grave
problems. It has been a challenge to control but with the help of informers and security guides
TAZAMA has managed to reduce these problems. Also, disciplinary measures were taken
including sending those people to the court.

86
5.3.4: Initiatives taken to solve some of the problem related to TAZAMA
pipelines
The TAZAMA pipeline in collaboration with park authorities have taken some measures to address
the situation that affects protected areas as follows;
i. Construction of cathodic pumping stations in Mikumi National Park.
Mikumi National Park has experienced many spills within the park. The leakage incidences have
been reduced compared to the previous time. In 1997, TAZAMA constructed four (4) cathodic
stations within Mikumi National Park and this has positively reduced corrosion and hence the
leakages within the park. However, even in 2007-2017 there has some leakages. TAZAMA has
fixed these even the park authorities noticed any great changes of the biodiversity.
Therefore, as presented during the study there were no great challenges created by TAZAMA
pipeline compared to other infrastructures found within MINAPA such as tarmac roads, TAZARA
and TRL railways, high tension electric power and optic fibre cables.
ii. It seems to be good communication and cooperation between TAZAMA pipeline and
the park authorities. The study found that, in every arising issue related to the
TAZAMA pipeline and the park, they communicate well with the TAZAMA authority
and they always responded immediately.
For instance, if incidence of oil spills occurs, the first move is to inform the TAZAMA authority
about the oil leakage. This is done by communicating with the nearest pumping station which can
be either Mikese pumping station or Kisanga pumping station to stop the pumping of the oil along
the TAZAMA pipeline. Thereafter, the technical officer arrives at the accident area and fixes the
pipeline and clean to the extent possible. This study found that there is a good collaboration and
cooperation between the TAZAMA pipeline authority with the protected areas pipeline gone
through from the time of construction till now. For instance, any activities which involved cleaning
of the pipeline route is done by asking help from the park authority. During the clearing of the
pipeline route, the park rangers should be there to guide people from TAZAMA assigned to clean
the pipeline route.
The park authority stated that during the cleaning session the park guides who joined the session
were being paid by the TAZAMA authorities and there is a budget for that. The good cooperation
among these institutions shows the benefits of the TAZAMA pipeline security as well as

87
sustainability of the wildlife found within the park by ensuring the value of protection is adhered
to.
iii. Reducing leakage by changing technology. The transportation of oil operates with a
fixed pressure. For instance, the inflate pressure at Kisanga pumping station is
30P/square inch. Therefore, if happens the pressure falls it indicate there is a problem
at some point and immediate follow up should be done.
Apart from that, the study finds that the oil leakage from the TAZAMA pipeline is also monitored
through normal patrols done by the park staff. If the park staff noticed that there is a leakage
immediate action is to be taken to control it by informing the TAZAMA authority. In this case, the
leakage that can be observed by park staff and even by local communities’ lives nearby if the oil
spills and spread over the earth’s surface.
iv. Thoroughly cleaning of the polluted area due to oil spills. When the oil leaks, all the
cleaning work is done by TAZAMA technical team using a technology which ensure
the area remains clean.
If the oil spill occurred in the park, the role of the park organization was just to provide park guides
to secure them from being harmed by wild animals. Generally, the TAZAMA technician team first
close the oil pipeline and then try to fix it accordingly. Repairing of the pipeline can be done by
changing the piece of the pipeline or just welding it. This depends on the scope of the problem.
Furthermore, the affected soil polluted due to oil leakage is removed and carried away to be
dumped somewhere else.
During the study it has been presented that, when the pipeline spills occurred, the fixing and
repairing of the TAZAMA pipeline took very short time. However, the cleaning of the area spoiled
by oil leakage may take time before cleaned. For instance, in Doma area near Mikumi National
Park the leakage happened on April 2018, technician team from TAZAMA managed to fix and
prevent more leakages. However, till October 2018 when the researcher visited the area, it was
observed a polluted area was still full of oil ponds, also in peoples farms as well as the park.
v. Involvement of civil society actors such as local communities living along TAZAMA
pipeline.
The involvement of local people is proved by village leaders during the focused group discussion
session. People live along TAZAMA pipeline and cooperate with TAZAMA authority in various

88
activities. For instance, when there is need of clearing of TAZAMA pipeline route or any other
activities the labor power are recruited from the selected villagers. However, informants that have
been affected by TAZAMA pipeline extension denied being involved as well in the decision
making. The decision affects their right on accessing the asset as well as experiences destruction
of assets from pollution.
Apart from that, the study found that there are no NGO’s involved in working with matters related
from land pollution related with oil spills in National Park. In MINAPA, the study found that there
are two organizations doing research namely, TAWIRI and ABRU. These organizations deal with
studies focusing on animal behavior especially elephants and do not study oil spills.
Apart from that, there are different scholars from various academic institutions found within
Tanzania and outside, that came to collect data within the park. The studies in one way or another
relate to consequences of TAZAMA pipeline within the park but still no great changes especially
in suggesting the removed of the pipeline and other infrastructures within the park.
In recent times there are a substantial amount of leakages and spoils of oil. This is quite under-
communicated in Tanzania’s public arenas for some reason. The environmental effects occur both
in and outside protected areas but occurring outside it often led to local people incurring losses
and costs, while spills inside the protected areas affect wildlife and biodiversity resources in
general. Some measures have been undertaken but there are still room for improvement, not least
in terms of inviting local people and communities both in planning and in management and
compensation issues. Also, NGOs and other external actors should be involved in this.
Local people benefit very little from this pipeline and the expanded pipeline reserves has caused a
lot of tension and conflicts.
5.4: Future perspectives of TAZAMA pipeline and other pipelines
The TAZAMA pipeline has future plans based on improving the transportation of oil. Those plans
should be set the objectives to reach their goals as well as preventing both social and environmental
consequences. The major plan that the TAZAMA pipeline has is to ensure transportation of oil is
carried through many years to come while resolving the leakage challenges along the pipeline.
Also, to start transporting finished products such as petrol and diesel. For Tanzania as whole the
nation has started to construct the new pipeline from Hoima Uganda to Tanga.
89
5.4.1: Future plans based on innovations as the TAZAMA pipeline gets old
Since the TAZAMA pipeline is getting old apart from doing repair of the pipeline the TAZAMA
authority has a plan to construct a new one. It has been emphasized by the informants from the
protected areas who said that they have heard about the new TAZAMA pipeline construction,
which is planned to transport the finished product, though it’s not officially reflected in formal
documents. To find the truth about this I managed to communicate with one of the technicians of
TAZAMA and verify that its true they are planning to transport finished products in the future, but
the issue is still in the early stages of discussions.
Due to this plan it would better for TAZAMA to include different actors to contribute ideas about
establishment of new pipeline. The study has found the following suggestions to be tracked before
establishing the new pipeline. Firstly, to have table discussions which to analyses the possible
impacts of the new pipelines within the park. If possible, it’s clearly be better to find another route
because they are not ecologically friendly.
Secondly, since the new pipeline aims to transport finished products, it can attract more vandalism
in protected area in the future. Not only that, but the new pipeline will most likely require more
area also within the park. This will result in an increase of vegetation losses due to preparing the
new path of TAZAMA pipeline. Currently, they don’t have any idea about where exactly it will
pass. However, it is mostly likely to pass within protected areas as the previous one and also along
the same path.
5.4.2: The advice based on construction of oil pipeline in both the protected
and in non-protected Areas
Focusing on the information obtained from this study, TAZAMA pipeline is expensive for local
communities even if this is not paid much attention in the media among researchers as in the civil
society.
Important issues such as contracts related to national and international projects should be available
in understandable language specifically SWAHILI, this will ensure the deepest understanding of
what has been written in such contracts. For instance, during the study, one of the informants who
representative of the fellow villagers said that “he saw the contract about compensation issues
related with TAZAMA pipeline but he didn’t understand due to language barrier and when he want

90
clarification about it the answers being given was embarrassing”. Therefore, the issue of language
in writing projects should be keenly observed.
Moreover, the place where the pipeline constructed should observed to avoid contact with people’s
properties and conservation areas. This can reduce the negative impacts and ensure the households
livelihoods and environmental sustainability.
Generally, based on the future perspectives, TAZAMA should adhere to its policy on SCR, for
existing pipelines and that will be relevant also for planning and implementing future planned
pipelines. Issues related to good cooperation and collaboration with the local communities and
fulfilling their rights are among the existing policy on SCR. If this policy is been well implemented
it could be helpful and creates benefits on both of them.
If and when Tanzania plans for a new pipeline to run through Tanzania’s cultural and natural
landscapes, it is crucial that local government and local people are involved in planning,
implementation and decision-making. The systems for compensation and mitigation of oil
leakages for different types are transparently shared and agreed upon and written down in an
understandable language (such as in Kiswahili). A particularly important point of a new pipeline
is if it is to transport final products such as petrol or others directly useful for both local people
and others and that can open for much more sabotage and pilfering than what has been seen up top
now in Tanzania.

91
CHAPTER SIX- CONCLUSIONS AND RECOMMENDATIONS
In this chapter I present the summary of the aims of the study and what have been obtained from
the field. In addition, I offer recommendation concerning what should be done to reduce the
negative impacts of TAZAMA pipeline in both protected and unprotected areas.
6.1: Conclusion
In this study I wanted to assess socio-ecological impacts of TAZAMA pipeline on areas that passes
the Tanzanian landscape through including both protected and non- protected areas. I have
identified the way TAZAMA pipeline was proposed and established. This was based on a literature
review and focus group discussions also conducted with informants from TAZAMA headquarters.
Based on social impacts of TAZAMA pipeline, the use of the Sustainable Livelihood Approach
(SLA) was a good choice in studying household livelihoods of individuals living along TAZAMA
pipeline. What I have found is that there are both positive and negative impacts of the TAZAMA
pipeline to the households’ livelihoods.
The positive part includes a source of temporal jobs, provision of aid from TAZAMA as Social
cooperate responsibility and good cooperation among different actors.
Focusing on the negative impacts, I found that in most areas the negative impacts are much
associated with oil leakages. The TAZAMA pipeline leakages affects majority of household’s
livelihood in various aspects including loss of assets, loss of income and even health problems
related to the impacts of oil spills in their areas. Also, loss of compensation for the loss created by
the pipeline.
When looking at the ecological impacts related with TAZAMA pipeline. I found that the status of
the biodiversity has not changed due to the existence of the TAZAMA pipeline, but the changes
can be due to its associated outcomes including oil leakage. In most of the areas where TAZAMA
passes through, it covers smaller areas compared to the square kilometers of the park or villages
crossing.
The ecological impacts where the study was conducted differs between locations. For instance, in
MINAPA the biodiversity is more associated with water availability rather than other factors,

92
including the oil leakages. According to the park informants, they emphasized in that these areas
that had experienced oil leakages, the plants had not showed any great changes. So, it does not
seem as if oil spills inside the park had any major ecological consequences.
However, in other areas the ecological impacts are much larger and accompanied by negative
outcomes. In all five villages that this study has been conducted it showed the negative impacts to
the environment created by the TAZAMA pipeline. Focusing on Malolo village where the River
Mwega was severely polluted by TAZAMA oil spills, it resulted in the death of aquatic organisms
such as fish, crocodiles and aquatic plants found in the riverbeds. Apart from that, the oil spills
channeled to the Mwega irrigation intake and flowed onto the household’s farms making the crops
dried and loss of soil fertility in appropriate farms. These were substantial costs of this leakage.
The other observed ecological impacts caused by TAZAMA oil pipeline on the environment is
based on the conservation value. TAZAMA is not ecologically friendly, since the crude oil
transported is very toxic so even if the spills are not large it seems not recommended to cross the
pipeline in sensitive areas including villages, rivers and National Parks.
When looking at the Environmental Governance Systems (EGSs), I found that the technology used
has been improved and this is supported by the reductions of number of oil spills along TAZAMA
pipeline. However, there is lack of uniformity in social corporate responsibility in all villages
located along the TAZAMA pipeline. It stressed that other villages got benefits from SCR while
others they didn’t receive it. In addition, the lack of compensation among households whose their
assets have been destroyed is against their rights. The TAZAMA pipeline should compensate them.
Cleaning up after oil spills was not good in some areas. For instance, in Doma there is pond of
crude oil which last for four (4) months from April 2018 to September 2018 without cleaning. I
found this case when I visited the field site. The same case is in Malolo where the corroded pipeline
replaced left at the Dutch valley since 2012 when the accidents occurred. In this area even the mud
containing crude oil that was removed from the leakage point and collected near to the valley.
They should take them far away for proper disposal.
The interaction between actors seems to be good. However, they have a concern that there is lack
of compensation for the loss of assets especially to the local people affected by oil spills. The
outcomes of oil spills to the household’s livelihood leads to losses of household’s assets and losses

93
of incomes. This situation reveals to others opt to migrate to find other farms far away from where
they used to live and do their farming. They have not been compensated for their loss of assets and
incomes. The contract with local people should be improved.
6.2: Recommendations
The study results have clearly showing that there are costs incurred for local people living along
the TAZAMA pipeline. Households assets have been destroyed, including land, water sources,
livestock, health and house properties.
Focusing on health issues, even if the few people have been taken to the hospital for health checkup
many claim to be sick since the accidents happened. They might be affected by oil spills from
TAZAMA. Without being health of individuals cannot do productive work for the betterment of
their families and national at large.
Also, it is recommended that samples of root crops such as cassava, potatoes, yams and onions
should be taken for investigation to find if the pollutants from the oil spill are still existing in the
soil. If it may prevent individuals from consuming food that are contaminated by hazardous
chemicals from TAZAMA pipeline oil spills.
The issue of compensation for individuals that have been affected in one way or another by the
TAZAMA pipeline should not neglected. If people would not be compensated it might create
conflicts between people living along the pipeline. Moreover, since a large part of the pipeline
security is done by the villagers living along the TAZAMA pipeline, ignoring their right to be
compensated might led to insecurity of the pipeline.
The TAZAMA pipeline route and its associated activities also affect the wellbeing of the wild
animals in protected areas in different ways such as; The act of bringing people inside the park for
the aim of clearing the pipeline route contribute to the pollution. People come with plastic bottles
containing beverages and after consuming it they just through away without proper waste disposal.
This recommended the provision of education and information to the labou rer’s on the importance
of keeping the environment clean during their working sessions.
Moreover, security issues were also discussed. According to the antipoaching officer of MINAPA
he said that “it is difficult to identify the people who has bad intentions for the wildlife. People

94
may enter in the park as pipeline workers but in other way may be informers or spies within the
park”. This may result to other poaching issues. It is recommended that the park authority should
increase security within the park and have sufficient information of everyone entering the park.
The education concerning the dangerous risk related to the TAZAMA pipeline should be well
provided. This will make people living along TAZAMA pipeline be aware about the accidents that
might happen because of their activities and to act accordingly. For instance, the study found that
people frying fish for business very close to where the TAZAMA pipeline passes through.
Since the crude oil being transported along TAZAMA pipeline is explosive it might cause severe
impacts if the fire would be in contact with even small spills from the TAZAMA pipeline.
Education and information could made local people aware of the risks related to the TAZAMA
pipeline. The education and information can be done through village meetings, seminars and in
Radio and Televisions.
Generally, the involvement of different stakeholders including local people living along the
TAZAMA pipeline route should be invited in to avoid negative impacts and sentinels of the
TAZAMA pipeline on both protected and non-protected areas in Tanzania.

95
List of References
Adger, W. N. (2006). Vulnerability. Global environmental change, 16 (3): 268-281.
Ajzen, I. & Fishbein, M. (1977). Attitude-behavior relations: A theoretical analysis and review of
empirical research. Psychological Bulletin, 84 (5): 888-918.
Angelsen, A. & Larsen, H. O. (2011). Measuring livelihoods and environmental dependence:
Methods for research and fieldwork. London and Washington,DC,: Earthscan.
Ashley, C. & Carney, D. (1999). Sustainable livelihoods: Lessons from early experience. UK:
Department for international Development.
Barclay, M. A. & Esteves, A. M. (2011). Enhancing the benefits of local content: integrating social
and economic impact assessment into procurement strategies. Impact Assessment and
Project Appraisal, 29 (3): 205-215.
Barnes, R. & Kapela, E. (1991). Changes in the Ruaha elephant population caused by poaching.
African Journal of Ecology, 29 (4): 289-294.
Beamish, T. D. (2001). Environmental Hazard and Institutional Betrayal: Lay-Public Perceptions
of Risk in the San Luis Obispo County Oil Spill. Organization & Environment, 14 (1): 5-
33.
Bebbington, A. (1999). Capitals and Capabilities: A Framework for Analyzing Peasant Viability,
Rural Livelihoods and Poverty. World Development, 27 (12): 2021-2044.
Benítez-López, A., Alkemade, R. & Verweij, P. A. (2010). The impacts of roads and other
infrastructure on mammal and bird populations: a meta-analysis. Biological conservation,
143 (6): 1307-1316.
Berg, B. L. & Lune, H. (2012). Qualitative research methods for the social sciences. 8 ed. Boston:
Pearson.
Brinkmann, S. & Kvale, S. (2008). Ethics in qualitative psychological research. The Sage
handbook of qualitative research in psychology, 24 (2): 263-279.
Brooks, N. (2003). Vulnerability, risk and adaptation: A conceptual framework. Tyndall Centre
for Climate Change Research Working Paper, 38 (38): 1-16.
Bryman, A. (2016). Social Research Methods. 5 ed.

96
Bukuku, P. & Meena, H. (1995). Energy and environment challenges in Southern Africa: the case
of Tanzania.
Carney, D. & Britain, G. (2002). Sustainable livelihood approaches: progress and possibilities for
change.,(Department for International Development: London).
Caro, T., Dobson, A., Marshall, A. J. & Peres, C. A. (2014). Compromise solutions between
conservation and road building in the tropics. Current biology, 24 (16): R722-R725.
Chambers, R. & Conway, G. (1992). Sustainable rural livelihoods: practical concepts for the 21st
century: Institute of Development Studies (UK).
Chasek, P. S. & Downie, D. L. (2006). Global environmental politics. Boulder, Colo: Westview
Press.
Davis, P. & Brockhurst, J. (2015). Subsea pipeline infrastructure monitoring: A framework for
technology review and selection. Ocean Engineering 104: 540-548.
DFID. (1999). Sustainable Livelihoods Guidance Sheets. In Department for International
Development. Available at: https://www.soas.ac.uk/cedep-demos/000_P528_RF_K3736-
Demo/unit1/page_22.htm (accessed: 26.4.2019).
DFID. (2000). Sustainable Livelihoods Guidance Sheets: Department for International
Development.
Dongus, S., Nyika, D., Kannady, K., Mtasiwa, D., Mshinda, H., Gosoniu, L., Drescher, A. W.,
Fillinger, U., Tanner, M. & Killeen, G. F. (2009). Urban agriculture and Anopheles habitats
in Dar es Salaam, Tanzania. Geospatial Health: 189-210.
El-Abbasy, M. S., Senouci, A., Zayed, T., Mirahadi, F. & Parvizsedghy, L. (2014). Artificial neural
network models for predicting condition of offshore oil and gas pipelines. Automation in
Construction, 45: 50-65.
Ellis, F. (2000). Rural livelihoods and diversity in developing countries: Oxford university press.
EMA. (2004).
Field, A. P., Miles, J. & Field, Z. (2012). Discovering statistics using R. London: Thousand Oaks,
California: Sage.
Flinn, C. M. (2016). Black gold in the black market: Tackling the issue of international oil
smuggling through technology, public policy, and internal corporate controls. Tex. Int'l LJ,
51: 119.

97
Frey, J. H. & Fontana, A. (1991). The group interview in social research. The Social Science
Journal, 28 (2): 175-187.
Frittelli, J. (2014). Shipping US crude oil by water: vessel flag requirements and safety issues:
Congressional Research Service.
Gleave, M. (1992). The Dar es Salaam Transport Corridor, An Appraisal. . African Affairs, 91
(363): 249-267.
Goodland, R. (2005). Oil and Gas Pipelines Social and Environmental Impact Assessment: State
of the Art. International Association of Impact Assessment.
Graham, J. P., Hirai, M. & Seung-Sup, K. (2016). An Analysis of Water Collection Labor among
Women and Children in 24 Sub-Saharan African Countries. PLoS ONE, 11 (6).
Griffiths, I. L. (1969). THE TAZAMA OIL PIPELINE. Geographical Association, 54 (2): 214-
217.
Harvey, W. S. (2011). Strategies for conducting elite interviews. Qualitative research, 11 (4): 431-
441.
Hoffman, A. J. & Ventresca, M. J. (2002). Organizations, policy and the natural environment:
Institutional and strategic perspectives: Stanford University Press.
Hoinville, G. & Jowell, R. (1978). Survey research practice.
Hosokawa, Y., Kajiyama, F. & Nakamura, Y. (2004). New cathodic protection criteria based on
direct and alternating current densities measured using coupons and their application to
modern steel pipelines. Corrosion, 60 (3): 304-312.
Ingold, T. (2002). The perception of the environment: essays on livelihood, dwelling and skill:
Routledge.
Ite, A. E., Ibok, U. J., Ite, M. U., Petters, S. W. & (2013). Petroleum Exploration and Production:
Past and Present Environmental Issues in the Nigeria’s Niger Delta. American Journal of
Environmental Protection, 1 (4): 78-90.
Iturbe, R., Flores, C., Castro, A. & Torres, L. G. (2007). Sub-soil contamination due to oil spills
in zones surrounding oil pipeline-pump stations and oil pipeline right-of-ways in
Southwest-Mexico. Environmental Monitoring and Assessment, , 133 (1): 387-398.
Jick, T. D. (1979). Mixing Qualitative and Quantitative Methods: Triangulation in Action.
Adminstrative Science Quarterly, 24.
98
Kadafa, A. A. (2012). Oil exploration and spillage in the Niger Delta of Nigeria. Civil and
Environmental Research, 2 (3): 38-51.
Keller, S. & Conradin, K. (2010). Semi-structured interviews: Retrieved July.
Knutsson, P. & Ostwald, M. (2006). A Process-Oriented Sustainable Livelihoods Approach–A
Tool For Increased Understanding of Vulnerability, Adaptation and Resilience. Mitigation
and Adaptation Strategies for Global Change.
Komba, E. V., Mdegela, R. H., Msoffe, P., Nielsen, L. N. & Ingmer, H. (2015). Prevalence,
antimicrobial resistance and risk factors for thermophilic Campylobacter infections in
symptomatic and asymptomatic humans in Tanzania. Zoonoses and public health, 62 (7):
557-568.
Limão, N. & Venables, A. J. (2001). Infrastructure, Geographical Disadvantage, Transport Costs,
and Trade. The World Bank Economic Review, 15 (3): 451-479.
Magalla, A. (2018). Environmental Protection in Tanzania Co-ordination between the Ministries
and Principal Legislation. Available at SSRN 3292113.
Malisa, A. E. (2007). NATIONAL ENVIRONMENT MANAGEMENT COUNCIL.
Martinez-Palou, R., Mosqueira, M. d. L., Zapata-Rendon, B., Mar-Juarez, E., Bernal-Huicochea,
C., Clavel-Lopez, J. d. l. C. & Jorge-Aburto. (2011). Transportation of heavy and extra-
heavy crude oil by pipeline:A review. Journal of Petroleum Science and Engineering, , 75
(3-4): 274-282.
Maxwell, J. A. (2013). Qualitative Research Design an Interactive Approach. 3 ed. Los Angeles:
SAGE Publication, Inc. .
McLEOD, R. (2001a). The impact of regulations and procedures on the livelihoods and asset base
of
the urban poor: a financial perspective. Paper presented at the International Workshop on
Regulatory Guidelines for Urban Upgrading, Bourton-on-Dunsmore, May 17-18, 2001.
Ministry of Mines, E. a. W. D. (2014). Study on the Supply of Petroleum Products into Zambia.
FINAL REPORT CORPUS LEGAL PRACTITIONERS.
Morgan, D. L. & Krueger, R. A. (1993). When to use focus groups and why. Successful focus
groups: Advancing the state of the art, 1: 3-19.

99
Morse, S. & McNamara, N. (2013). Sustainable livelihood approach: A critique of theory and
practice: Springer Science & Business Media.
Murph, D. J. & Hall, C. A. (2011). Energy return on investment, peak oil, and the end of economic
growth. . Annals of the New York Academy of Science, 1219: 52-72.
Mwakyusa, A. (2012). Tanzania: Crude Oil Causes Suffering for Farmers in Mlandizi. Tanzania
Daily News.
Mwakyusa, A. (2016). Tanzania: Oil Pipeline 'Ready June 2020'. Tanzania Daily News.
Mwalyosi, R., Hughes, R. & Howlett, D. J. B. (1999). Orientation to the Use of Environmental
Impact Assessment in Tanzania: Resource Handbook. International Institute for
Environment and Development and Institute for Resource Assessment.
Mwesiga, T. & Mikova, K. (2017). Mtwara Gas Project Conflict: Impacts on Local Communties’
Socio-economic Activities (Part 1). Social Sciences, 6 (3): 63-72.
Nahonyo, C. L. (2009). Feasibility Study on Elephant Movement between the Greater Ruaha
Ecosystem and Selous Ecosystem in Central Eastern, Tanzania.
Nelson, F. (2012). Natural conservationists? Evaluating the impact of pastoralist land use practices
on Tanzania's wildlife economy. Pastoralism: Research, Policy and Practice, 2 (1): 15.
Nešić, S. (2007). Key issues related to modelling of internal corrosion of oil and gas pipelines – A
review. Corrosion Science, 49 (12): 4308-4338.
Newmark, W. D., Boshe, J. I., Sariko, H. I. & Makumbule, G. K. (1996). Effects of a highway on
large mammals in Mikumi National Park, Tanzania. African Journal of Ecology, 34 (1):
15-31.
Nma, A. A. D. A. (1996). Chronic effects of oil spill on soil properties and microflora of a
rainforest ecosystem in Nigeria. Water, Air, and Soil Pollution, 86 (1-4): 1-11.
North, D. C. (1991). Institutions. Journal of Economic Perspectives, 5 (1): 97-112.
Norton‐Griffiths, M. (1975). The numbers and distribution of large mammals in Ruaha National
Park, Tanzania. African Journal of Ecology, 13 (2): 121-140.
Norton, G. W., Rhine, R. J., Wynn, G. W. & Wynn, R. D. (1987). Baboon diet: a five-year study
of stability and variability in the plant feeding and habitat of the yellow baboons (Papio
cynocephalus) of Mikumi National Park, Tanzania. Folia Primatologica, 48 (1-2): 78-120.
Nwapi, C. (2016). A survey of the literature on local content policies in the oil and gas industry in
East Africa. SPP Research Paper (9/16).

100
O'Rourke, D. & Connolly, S. (2003). JUST OIL? THE DISTRIBUTION OF ENVIRONMENTAL
AND SOCIAL IMPACTS OF OIL PRODUCTION AND CONSUMPTION. Annual
Review of Environment and Resources, 28.
Odjuvwuederhie, E., I, Douglason, G., O & Felicia, N., A. (2006). The effect of oil spillage on
crop yield and farm income in delta state, Nigeria. Journal of Central European
Agriculture, 7 (1): 41- 48. .
Ogwu, F. A. (2011). Challenges of oil and gas pipeline network and the role of physical planners
in Nigeria. Forum Ejournal. 41-51 pp.
Omari, C. K. (1988). Rural women, informal sector and household economy in Tanzania. WIDER
Working Papers 79, World Institute for Development Economics Research.
Ordinioha, B. & Brisibe, S. (2013). The human health implications of crude oil spills in the Niger
delta, Nigeria: An interpretation of published studies. Nigerian medical journal: journal of
the Nigeria Medical Association, 54 (1): 10.
Oyefusi, A. (2007). Oil-dependence and civil conflict in Nigeria. Centre for the Study of African
Economies (CSAE).
Paavola, J. (2008). Livelihoods, vulnerability and adaptation to climate change in Morogoro,
Tanzania. Environmental Science & Policy, 11 (7): 642-654.
Pavlenko, V. I., & Glukhareva, E. K. . (2010). Development of Oil And Gas Production And
Transportation Infrastructure of Russian West Arctic Offshore Regions. International
Society of Offshore and Polar Engineers.
Pegg, S. & Zabbey, N. (2013). Oil and water: the Bodo spills and the destruction of traditional
livelihood structures in the Niger Delta. Community Development Journal, 48 (3): 391-
405.
Phase, R. A. S. (2010). Main Report. Track record, December.
Ritchie, J., Lewis, J., Lewis, J., Nicholls, C. M. & Ormston, R. (2014). Qualitative Research
Practice: A Guide for Social Science Students and Researchers. 2 ed. London: SAGE
Publication L.t.d.
Savidge, J. M. (1968). Elephants in The Ruaha National Park, Tanzania-Management Problem.
East African Agricultural and Forestry Journal, 33 (sup1): 191-196.
Schafer, J. (2002). Supporting livelihoods in situations of chronic conflict and political instability:
Overview of conceptual issues: Citeseer.
101
Scones, I. (1998). Sutainable rural livelihid: A framerk franalysis (Institute of Development
Studies, Discussion Paper 295). Brightn, UK: University of Sussex.
Scott, W. R. (1995). Institutions and organizations. Foundations for organizational science.
London: A Sage Publication Series.
Senouci, A., Elabbasy, M., Elwakil, E., Abdrabou, B. & Zayed, T. (2014). A model for predicting
failure of oil pipelines. Structure and Infrastructure Engineering, 10 (3): 375-387.
Shahriar, A., Sadiq, R. & Tesfamariam, S. (2012). Risk analysis for oil & gas pipelines: A
sustainability assessment approach using fuzzy based bow-tie analysis. Journal of Loss
Prevention in the Process Industries, 25 (3): 505-523.
Shankleman, J. (2011). Oil and State Building in South Sudan. United States Institute of Peace.
Special Report, 282.
Sirima, A. (2016). The Social and Economic Impacts of Ruaha National Park Expansion.
Soames, L. (1980). From Rhodesia to Zimbabwe. International Affairs. Royal Institute of
International Affairs 1944-, 56 (3): 405-419.
Sosovele, H. (2011). Governance challenges in Tanzania’s environmental impact assessment
practice. African Journal of Environmental Science and Technology, 5 (2).
Sovacool, B. K. (2011). The interpretive flexibility of oil and gas pipelines: Case studies from
Southeast Asia and the Caspian Sea. Technological Forecasting and Social Change, 78
(4): 610-620.
Suzan & Wadi. (1999). EFFECTS OF LEAD ON THE MALE REPRODUCTIVE SYSTEM IN
MICE. Journal of Toxicology and Environmental Health, Part A,, 56 (7): 513-521.
Sweet, J., Bumpass, L. & Call, V. (1988). The design and content of the National Survey of
Families and Households.
Tanzania, N. (2012). Population and housing census: population distribution by administrative
areas. Ministry of Finance, Dar es Salaam.
TAWIRI. (2012). Priority Areas for Research for Tanzania National Parks (TANAPA),
Ngorongoro Conservation Area Authority (NCAA), Wildlife Division (WD) and Tanzania
forest service(TFS).
Tseng, A. (2003). Electrolysis system: Google Patents.

102
Ugochukwu, C., N, C. & Ertel, J. (2008). Negative impacts of oil exploration on biodiversity
management in the Niger De area of Nigeria. Impact Assessment and Project Appraisal,
26 (2): 139-147.
UNDP. (1985). Zambia Energy Assessment Status Report
Vanzella, T., Martinez, C. & Cólus, I. (2007). Genotoxic and mutagenic effects of diesel oil water
soluble fraction on a neotropical fish species. Mutation Research/Genetic Toxicology and
Environmental Mutagenesis, 631 (1): 36-43.
Vatn, A. (2015). Environmental Governance. Institution policies and Actions. Cheltenham, UK.
Northampton, MA, USA: Edward Elgar publishing.
Vaughn, S., Schumm, J. S. & Sinagub, J. M. (1996). Focus group interviews in education and
psychology: Sage.
Vedeld, P., Jumane, A., Wapalila, G. & Songorwa, A. (2012). Protected areas, poverty and
conflicts: A livelihood case study of Mikumi National Park, Tanzania. Forest policy and
economics, 21: 20-31.
Wiedenhoft, H. (2017). The Effects of Oil Polllution on Aquatic Ecosytems. Sciencing.
Wiedenhoft, H. (2017). The Effects of Oil Pollution on Aquatic Ecosystems. Sciencing.
Wilde, L., Loos, C. & Williamson, J. (2014). Pipelines and Property Values: An Eclectic Review
of the Literature. Journal of Real Estate Literature, 20 (2): 245-259.

103
APPENDIX
Appendix 1: Village Sketch Maps
1.1: Sketch map of Malolo A, Malolo B and Mgogozi showing TAZAMA pipeline spills and
effect to the River Mwega

104
1.2: Sketch map of Kaloleni

105
1.3: Sketch map of Doma village showing nearby assets being affected by oil spills

106
Appendix 2: Questionnaire for the household survey
PART A: GENERAL INFORMATION (TAARIFA ZA JUMLA)
Questionnaire number (Dodoso namba) ……………………………….
1. Interviewee name (Optional)/Jina (sio lazima) ……………………………..
2. Gender: Male/Mwanaume ( )
Female/Mwanamke ( )
3. Age of respondent. (Miaka yako) ………………………………………
4. What ethnic group or tribe to do you belong to? (Kabila lako)……………………
5. What religion do you practice? (Dini yako) ………………………………………
6. Main occupation (Kazi yako kuu) ……………………………………
7. What is your education level? (Elimu yako)
a) No education/ sijasoma
b) Primary education/ elimu ya msingi
c) secondary education/ elimu ya sekondari
d) Vocational training/ elimu ya ufundi
e) University/ elimu ya chuo kikuu
8. For how long have you lived in this village/area? (Ni kwa muda gani umeishi
kijijini hapa?)
a) Less than 1 year/ chini yam waka mmoja
b) 1 - 10 years/ miaka
c) 11 - 20 years/ miaka
d) 21 - 30 years/ miaka
e) Above 31 years/ Zaidi ya miaka 31

107
9. What is your title in the household? (cheo chako ni kipi katika familia)
a) Father/baba
b) Mother/mama
c) Son/mtoto wa kiume
d) Daughter/mtoto wa kike
e) Others, Specify/ cheo kingine, tafadhali taja-----------------------------
10. How many household members in your family? (Mko wangapi katika familia yako)
a) Less than 3 persons/ chini ya watu watatu
b) 4 - 6 persons/watu
c) 7 - 9 persons/watu
d) 10 - 12 persons/watu
e) Above 12 persons/watu
11. How many households’ members depend on you for their daily needs?
(Unategemewa na watu wangapi kwa mahitaji yao ya kila siku?)
a) None/ sina anayenitegemea
b) 1 - 3 persons/watu
c) 4 - 6 persons/ watu
d) 7 - 9 persons/watu
e) Above 10 persons/ Zaidi ya watu 10
12. Have you experience TAZAMA oil pipe burst in this village? (Umewahi
kushuhudia bomba la mafuta la TAZAMA likipasuka hapa kijijini)
Yes/ ndio ( )
No/ hapana ( )

108
13. If yes, how often does the TAZAMA oil leaks in this village? (Kama jibu ni ndio
ni mara ngapi bomba la mafuta la TAZAMA limevuja kijijini hapa)
a) Always/kila mara
b) Very often/ mara nyingi sana
c) Often/ mara nyingi
d) Rarely/ nadra
e) Never/ haijawahi tokea
14. What are the causes of the TAZAMA oil spillage in this village? (Nini kilisababisha
bomba la TAZAMA kuvuja hapa kijijini?)
a) Broken pipe /bomba kupasuka
b) Age of the pipeline/ uchakavu wa bomba kwa kua lina miaka mingi
c) Peoples temper with pipeline/ watu kutaka kupasua bomba
d) Others (Please specify) sababu nyingine, tafadhali taja………………………
15. How long did the oil spills takes before they fix the pipeline? (ni muda gani bomba
hutengenezwa baada ya kupasuka?)
a) Immediately/mara moja
b) 1- 3 days/siku
c) 4 - 6 days/siku
d) 7 - 27 days/siku
e) More than 28 days/ Zaidi ya siku 28
16. What was the amount of oil spread from TAZAMA pipeline when leakage
occurred? (Ni mafuta kiasi gani huvuja baada ya bomba kupasuka?)
a) Very little/ kiasi kidogo sana
b) Little/ kiasi kidogo
c) High/kiasi kingi
d) Very high/ kiasi kingi sana
e) Extremely high/ kiasi cha juu mno

109
PART B: HOW DOES TAZAMA PIPELINE ROUTE AFFECTS THE ASSET OF THE
HOUSEHOLDS’ LIVELIHOOD? (JINSI GANI BOMBA LA TAZAMA LILIVYOATHIRI
MAISHA YA FAMILIA KATIKA KAYA ZAO)
1. Which assets do your household possess/own now than before TAZAMA pipeline
constructed? (Ni mali zipi unazmiliki sasa tofauti na zamani kabla ya bomba la
TAZAMA halijajengwa?)
a) Agricultural land/ardhi kwaajili ya kilimo
b) Livestock/mifugo
c) Forest/ shamba la miti(msitu)
d) Water wells/ visima vya maji
e) Others, Specify/ nyingine, tafadhali taja …………………
2. Does the existence of TAZAMA pipeline in your area affects your assets? (je
uwepo wa bomba la TAZAMA kwenye eneo hili umeharibu mali zako?)
Yes/ndio ( )
No/hapana ( )
3. If Yes, how does the TAZAMA pipeline affects your household asset? (Kama jibu
ni ndio, kwa kiasi limeathiri mali za familia yako?)
a) Increased/ zimeongezeka
b) Decreased/ zimepungua
c) Not changed/ hazijabadilika
d) All taken as a pipeline land reserve/mali yote imechukuliwa kama akiba ya bomba
e) Others (specify)/ nyingine, tafadhali taja…………………….
4. Does the TAZAMA pipeline leaks nearby your household assets? (Je bomba la
TAZAMA limevuja karibu na mali za familia yako?)
Yes/ndio ( )
No/hapana ( )

110
5. If Yes, which property destruction did you get due to TAZAMA pipeline leakage?
(Kama jibu ni ndio, ni mali zipi zilizoharibiwa kutokana na kuvuja kwa bomba la
TAZAMA)
a) Crop land/ ardhi ya kilimo
b) Livestock/ mifugo
c) Habitat loss/ ukosefu wa makazi
d) Water sources/ vyanzo vya maji
e) Others (Please specify)/ nyingine, tafadhali taja …………………………...
6. If the asset destructed is land, what is the size of your land (x) polluted due to
TAZAMA pipeline leakage? (Kama mali iliyoharibika ni ardhi, ni kiasi gani cha
ardhi (x) kilichoharibika)
a) 𝑥 < 1 acre/ chini ya hekari moja
b) 1 ≤ 𝑥 < 2 acres/ kuanzia keha moja mpaka heka mbili
c) 2 ≤ 𝑥 < 3 acres /ekari
d) 3 ≤ 𝑥 < 4 acres /ekari
e) 𝑥 ≥ 4 acres/ kuanzia ekari nne na zaidi
7. What is the size of the productive land (x) remained after the TAZAMA pipeline
leaks in your area? (Ni kiasi gani cha ardhi yenye rutuba kimebakia baada ya
bomba la TAZAMA kuvulja katika eneo lako?)
a) None/ hakuna
b) < 1 acre/ chini ya ekari moja
c) 1 ≤ 𝑥 < 2 acres/ekari
d) 2 ≤ 𝑥 < 3 acres/ekari
e) Above 3 acres/ Zaidi ya ekari tatu
8. From question 5, if asset destructed is water sources how long you take to search
for clean water to sustain household livelihood? (Kutoka swali namba tano, kama
mali iliyoharibiwa ni vyanzo vya maji ni muda gani unatumia kutafuta maji safi na
salama kwa matumizi ya familia yako?)

111
a) Less 10 minutes/ chini ya dakika 10
b) 11 - 30 minutes/dakika
c) 31 - 59 minutes/dakika
d) 60 - 120 minutes/dakika
e) More than 121 minutes/Zaidi ya dakika 121
9. From question 5, if asset destructed were livestock what happened to them and
affect the household livelihood? (Kutoka namba 5, kama mali iliyoharibika ni
mifugo ni kipi kilitokea kwa mifugo na kuathiri Maisha ya familia yako)
a) None/ hakuna
b) Sickness/iliumwa
c) Death/ilikufa
d) Low productivity/ uzalishaji wao ulipungua
e) Others, Specify/ nyingine, tafadhali taja…………………
10. To what extent the property destruction caused by TAZAMA pipeline leakage
affects your financial capital? (ni kwa kiasi gani bomba la TAZAMA limeathiri
kipato chako kiuchumi?)
a) Very low/Kwa kiasi kidogo sana
b) Low/kwa kiasi cha chini
c) Moderate/ wastani
d) High/kwa kiasi kikubwa
e) Very high/kwa kiasi kikubwa sana

112
PART C: ASSESING THE HOUSEHOLDS’ ACTIVITIES AFFECTED DUE TO
TAZAMA PIPELINE LEAKAGE IN THEIR VILLAGES LOCATED ALONG THE
PIPELINE ROUTE. (TATHMINI YA SHUGHULI ZA KIFAMILIA ZILIZOATHIRIKA
KUTOKANA NA UVUJAJI WA BOMBA LA TAZAMA KATIKA VIJIJI VYAO)
1. Which activities were you doing to generate income before the TAZAMA pipeline
leaks and affect your asset? (Ni shughuli gani uliyokua unaifanya kukupatia kipato
kabla ya bomba la TAZAMA halijaathiri mali zako?)
a) Farming/kilimo
b) Livestock keeping/ufugaji
c) Hunting/uwindaji
d) Selling water/kuuza maji
e) Other, Specify/ nyingine, tafadhali taja………………….
2. How much did you earn in a monthly basis in Tanzanian shillings (Tshs) from the
activities you were doing before the TAZAMA pipeline leaks? (Ni kiasi gani cha
fedha ulichokuwa unapata kwa mwezi kutokana na shughuli zako kabla bomba la
TAZAMA halijavuja?)
a) Less than 50,0000 /=Tshs (22.7 USD)/chini ya shilingi 50,000
b) 50,000 -100,000/= Tshs (22.7- 45 USD)
c) 100,001-200,000/=Tshs (45- 90 USD)
d) 200,001- 300,000/= Tshs (90- 136 USD)
e) Above 300,001/= Tshs (136 USD)/ Zaidi ya shilingi 300,001/=
3. Did you adjust your activities after TAZAMA pipeline leaks and affect your
household livelihood? (Je umebadili shughuli uliyokua unaifanya baada ya
bomba la TAZAMA kuvuja na kuathithiri Maisha ya familia yako)
Yes/ndio ( )
No/hapana ( )

113
4. If yes, what are the other activities did you do after the TAZAMA pipeline leaks
and affect the previous one? (Kama jibu ni ndio ni shughuli gani unayofanya sasa
baada ya ile ya awali kuathirika na uvujaji wa bomba la TAZAMA)
………………………………………………………………………………………
………………………………………………………………………………………
………………………………………………………………………………………
5. How much you earn now in a monthly basis in Tanzanian shillings after the
TAZAMA pipeline leaks and affects your activities? (Ni kiasi gani unapata sasa
kwa mwezi baada ya bomba la TAZAMA kuvuja na kuathiri shughuli zako?)
a) Less than 50,000/= Tshs (22.7 USD)/ chini ya shilingi 50,000/
b) 50,000-100,000/= Tshs(22.7- 45 USD)
c) 100,001-200,000/= Tshs (45- 90 USD)
d) 200,001- 300,000/= Tshs (90- 136 USD)
e) Above 300,001/= Tshs (136 USD) Zaidi ya shilingi 300,001/=
6. How does this income generated from your activities used for? (Nini matumizi ya
kipato unachopata kutokana na shughuli zako?)
a) Buying food for the households/ kununua chakula cha familia
b) Paying school fees/kulipa ada za shule
c) Medical fees/gharama za matibabu
d) Luxurious/starehe
e) Others(specify)/nyingine, tafadhali taja………………………….

114
PART D: ASSESSING MEASURES TAKEN BY HOUSEHOLDS TO BE AWARE OF
THE RISKS RELATED TO TAZAMA PIPELINE LEAKAGE. (TATHMINI ZA HATUA
ZILIZOCHUKULIWA NA KAYA/FAMILIA KUJIKINGA NA HATARI ZITOKANAZO NA
UVUJAJI WA BOMBA LA TAZAMA)
1. Did you receive any instructions/ knowledge from TAZAMA officials on how to react
with the risks related to TAZAMA pipeline leakage? (Je umewahi kupokea maelekezo
yoyote kutoka TAZAMA jinsi ya kujikinga na hatari zitokanazo na bomba la
TAZAMA?)
Yes/ndio ( )
No/hapana ( )
2. If Yes, how does the knowledge delivered to you? (Kama jibu ni ndiyo, ni njia gani
ilitumika kufikisha maarifa hayo?)
a) Seminars/semina
b) Campaign/kampeni
c) Media e.g. TV, radio/vyombo vya habari
d) Schools curriculum/mitaala ya shule
e) Others (specify)/ nyingine, tafadhali taja……………………………
3. If No, what do you think is the best way to spread the knowledge on how to overcome
risks related to TAZAMA pipeline leakage? (Kama jibu ni hapana, unafikiri ni njia gani
itumike kufikisha maarifa ya kujikinga na hatari zitokanazo na uvujaji wa bomba la
TAZAMA?)
.............................................................................................................................................
.............................................................................................................................................
.............................................................................................................................................

115
4. Does the income you earn from your activities after risk due to TAZAMA pipeline
leakage fulfill your basic needs for the household livelihoods? (Je kipato unachokipata
sasa baada ya bomba la TAZAMA kuvuja na kuathiri shughuli zako kinakidhi mahitaji
ya familia yako?)
Yes/ndio ( )
No/hapana ( )
5. If No, what do you do to overcome the shock of income loss created by risk due to
TAZAMA pipeline leakage? (Kama jibu ni hapana unafanyaje kuukabili mshtuko
ulioupata wa kupoteza kipato sababu ya uvujaji wa bomba la TAZAMA?)
.............................................................................................................................................
.............................................................................................................................................
.............................................................................................................................................
6. Did you receive compensation for the loss/risks of your assets due to TAZAMA pipeline
leakage that affects household livelihood? (Je umepewa fidia kutokana na kupoteza mali
zako kulikosababishwa na uvujaji wa bomba la TAZAMA?)
Yes /ndio ( )
No/hapana ( )
7. If yes what is the type of compensation did you received? (Kama jibu ni ndio, ulipokea
nini kama fidia?)
a) Money/fedha
b) Replaced land/ardhi mbadala
c) Livestock/mifugo
d) Food crops/mazao ya chakula
e) Others (specify)/ nyingine, tafadhali elezea………………………………………
8. Did the compensation received is enough to sustain your household livelihood?
Yes/ndio ( )
No/hapana ( )

116
9. If No, from question 6 what did you do to sustain the household’s livelihood? (Kama jibu
ni hapana, kutoka swali namba 6, unafanya nini kutimiza mahitaji ya familia yako?)
a) Resettlement/ulihama
b) Stay idle/ kukaa bila kazi
c) Depend from relatives’ aids/kutegemea msaada kutoka kwa ndugu
d) Use the remain asset/kutumia mali ilyobaki
e) Others (specify)/nyingine, tafadhali taja…………………….
10. Does the TAZAMA pipeline leakage affects the health of your household members? (Je
uvujaji wa bomba la TAZAMA umeathiri afya ya wanafamilia wako?)
Yes/ndio ( )
No/hapana ( )
11. If Yes, which diseases are currently affecting your households’ members than before the
TAZAMA pipeline leakage? (Kama jibu ni ndiyo, ni ugonjwa gani unaowapata
wanafamilia wa kaya yako sasa hivi ukilinganisha na kabla bomba la TAZAMA
halijavuja?)
a) Skin diseases/ugonjwa wa ngozi
b) Diarrhea/kuharisha
c) Flu/mafua
d) Typhoid fever/homa ya matumbo
e) Others (specify)/ nyingine, tafadhali taja…………………….
12. Currently, how often does the households’ members get ill or sick than before the
TAZAMA pipeline leaks? (Kwa kipindi hiki ni mara ngapi wanafamilia wanaugua
ukilinganisha na wakati uliopita kabla bomba la TAZAMA halijavuja?)
a) Always/kila siku
b) Very often/mara nyingi sana
c) Often/mara nyingi
d) Rarely/mara chache
e) Never/hakuna

117
13. How much cost you incur per month for treatment of these diseases that affect your
household members as related to TAZAMA pipeline leakage? (Ni gharama kiasi gani
unatumia kwa mwezi kwa ajili ya matibabu ya familia yako ikihusianishwa na uvujaji wa
bomba la TAZAMA)
a) None/hakuna
b) Less than 10,000/= Tshs (4.5 USD)/chini ya 10,000/=
c) 10,000 – 20,0000/= Tshs(4.5- 9 USD)
d) 20,001- 30,000/= Tshs (9-14 USD)
e) Above 30,001/= Tshs (14 USD) /zaidi ya shilingi 30,001/=

118
PART E: POLICIES, RULES AND REGULATIONS OF TAZAMA PIPELINE
AFFECTS HOUSEHOLD LIVELIHOOD. (SERA, KANUNI NA TARATIBU ZA BOMBA LA
TAZAMA ZINAVYOATHIRI MAISHA YA KAYA/FAMILIA)
1. Do you know any policies, rules and regulations of TAZAMA pipeline? (Je unajua
chochote kuhusu sera,kanuni na taratibu za bomba la TAZAMA? )
Yes /ndiyo ( )
No/hapana ( )
2. If Yes, state them (Kama jibu ni ndiyo, zitaje)
i. …………………………………………………………………………..
ii. …………………………………………………………………………..
iii. …………………………………………………………………………..
3. Do the existing policies, laws, rules and regulations of TAZAMA pipeline affects the
culture, norms and values that determine the access of households’ livelihood resources
to sustain their daily life? (Je uwepo wa sera, kanuni na taratibu za bomba la TAZAMA
zinaathiri tamaduni na maadili za umiliki wa rasilimali za kuendesha familia na
Maisha ya kila siku)
Yes/ndio ( )
No/hapana ( )
4. If Yes, how does the TAZAMA pipeline policies, laws, rules and regulations affects
the culture, norms and values that determine the access of households’ livelihood
resources to sustain their daily life? (Kama jibu ni ndio, sera,kanuni na taratibu za
bomba la TAZAMA zimeathiri vipi tamaduni na maadili ya umiliki wa rasilimali
zinazoendesha Maisha ya kila siku kwa familia)
..........................................................................................................................................
..........................................................................................................................................
..........................................................................................................................................

119
5. How far does your asset is from the pipeline route? (Ni umbali gani mali zako zilipo
kutoka bomba la TAZAMA?)
a) < 5 meters/ chini ya mita 5
b) 6 - 10 meters/mita
c) 11- 20 meters/mita
d) 21-30 meters/mita
e) Above 31 meters/Zaidi ya mita 31
6. If the TAZAMA owners advised, you to resettlement or conduct activities far away
from the pipeline route how would you react? (Kama wamiliki wa TAZAMA
watakushauri kuhama au kufanya shughuli zako mbali na bomba la TAZAMA
utasemaje?)
a) Neutral/sina la kusema
b) Strongly disagree/sitakubali kabisa
c) Disagree/sitakubali
d) Agree/nitakubali
e) Strongly agree/nitakubali kabisa
7. Do you think the measures taken by the government to compensate the households’
destructive resources caused by TAZAMA pipeline leakage are effective? (Je unafikiri
hatua zilizochukuliwa na serikali za kufidia uharibifu wa mali za wananchi zina
ufanisi?)
Yes/ndiyo ( )
No/hapana ( )

120
8. If no, what do you suggest could be the best way to compensate the households’
destructive resources caused by TAZAMA pipeline leakage? (Kama jibu ni hapana je
unafikiri nini kifanyike ili kulipa fidia stahiki kulingana na uharibifu wa mali
uliosababishwa na uvujaji wa bomba la TAZAMA?)
i. ……………………………………………
ii. ……………………………………………
iii. …………………………………………….

121
Appendix 3: Focus Group Discussion
3.1: This research tool intends to collect the data from official workers at
TAZAMA headquarters.
The aim of using this focused group interview is to enable the researcher to get data on history,
pipeline location, monitoring, control and technical issues related to the Socio- ecological impact
of TAZAMA pipeline to protected and unprotected areas in Tanzania.
PART A: GENERAL INFORMATION
1. Interviewee name (Optional)………………………………………………...
2. Gender: Male ( )
Female ( )
3. Age ……………………
4. Position……………………………………
5. How long did you work in this department?.........................................
PART B: ASSESSING THE HISTORY AND CONTEXT OF THE TAZAMA PIPELINE.
1. When was the TAZAMA pipeline constructed?
2. Whose actors were involved in planning, policy making and deciding on the construction
of TAZAMA pipeline?
3. Which regions did it passes through?
4. What were the participation of local people in the planning, policy making, and decision
made for the TAZAMA pipeline as it passes along their adjacent community?
5. When does it starts operating?
6. How deep are the pipes buried from the surface?
7. How do you detect leakages along the pipeline?
8. How many accidents are experienced in the past 10 years (from 2007-2017) involving
TAZAMA pipeline leakages?
9. How much oil lost due to pipe burst in the past 10 years?
10. What are the impacts the TAZAMA pipeline caused to the peoples’ livelihood and the
environment?
11. Did the project conduct Environmental Impacts Assessments (EIA)?
122
12. What were the status of the environmental resources in 1968?
13. How does the TAZAMA pipeline contribute to the change of the characteristics of the
environmental resources?
14. What are other plans for transporting oil as TAZAMA pipeline gets old now?
15. What are the benefits of TAZAMA pipeline to the local communities located along the
pipeline?
16. Which means do you use to educate people about preventive measures to take when there
is leakage?
17. What are the challenges peoples face when the oil spills occurred in their area?
18. What measures did you take to ensure the households’ livelihood in relation to oil spills?
19. How do you interact with the local people lives along TAZAMA pipeline route to avoid
the negative impacts and strengthen cooperation?
3.2: Assessing the effects of the TAZAMA pipeline route in Mikumi and
Ruaha National Park. (Interview guide for Mikumi and Ruaha National Park
officials)
1. Have you experience TAZAMA oil pipeline spills in this National Park?
2. Which areas within the park leaks most and why?
3. How are oil spills within the park cleaned?
4. How long it takes to fix the pipeline spills after an accident?
5. Which initiative the TAZAMA pipeline authority took to prevent oils spills in the land of
this National Park?
6. What is the contribution of NGO’s to protect the land pollution in relation to oil spills in
this National Park?
7. How does the TAZAMA pipeline oil spills affects protected land in this National Park?
8. What is the status of the biodiversity in the area that is mostly affected by oil spills in this
park?
9. What are other observed effects caused by TAZAMA oil pipeline spills within this park?
10. In what ways does the TAZAMA pipeline route and its associated activities affects the
wellbeing of the wild animals in this National Park?

123

Postboks 5003 NO-1432 Ås, Norway+47 67 23 00 00www.nmbu.no