socio-economic and demographic determinants of unmet need for family planning in india and its conse
DESCRIPTION
ÂTRANSCRIPT
Research on Humanities and Social Sciences www.iiste.org ISSN 2222-1719 (Paper) ISSN 2222-2863 (Online) Vol.3, No.3, 2013
62
Socio-economic and Demographic Determinants of Unmet Need for Family Planning in India and its Consequences
Subhash Barman
Population Studies Unit, Indian Statistical Institute, 203, B. T. Road, Kolkata-700 108, West Bengal, India E-mail : [email protected], [email protected]
Abstract Objective of this study is to investigate the likelihood of unmet need for family planning in Indian states by some socio-economic and demographic characteristics among the currently married women aged 20-39 years. To find out the differentials of unmet need for contraceptive use, Logistic regression technique is applied to National Family Health Survey (NFHS 3) data. Of the socio-economic and demographic variables, number of living children, ethnicity, wealth status of household, media exposure, occupation of the respondents, child death experience, sex composition of children are found to be significantly effective in determining unmet need for contraception of the currently married women. The results of the study show that unmet need for family contraception is more in the EAG states as compared to the South Indian and rest Indian states Key Words : Unmet need for family planning, contraceptive use, currently married women, EAG states, South Indian states, rest Indian states, spacing birth, limiting birth. 1.Introduction The concept of ‘unmet need’ describes the condition of fecund women of reproductive age who either wish to postpone the next birth (spacers) or who wish to stop child bearing (limiters) but are not using a contraceptive method. Women having unwanted or mistimed pregnancies and who became pregnant because of non-usage of contraception as well as those who recently gave birth but are not at risk of becoming pregnant or amenorrhoeic and their pregnancies were unintended are also considered to have unmet need. Devi et al. (1996) studied that unmet need for family planning are especially high among women residing in rural areas, women whose husbands are illiterate, illiterate women, Muslim women, Scheduled Tribe women and women not exposed to messages of family planning. Unmet need for family planning was high among the women who did not have any media exposure or did not discuss about family planning with their husbands ( Srivastava et al. 2011). Proportion of unmet need for family planning is much higher among the women reside in the rural areas, at the younger ages and women having less than three children. Educational level of the women and work status is found to be highly significant with respect to their unmet need (Laya 2012). Unmet need for contraception is higher in the younger age group. With the increase in the educational level, the prevalence of spacers in the unmet need has significantly increased and that of limiters decreased. The prevalence of spacers significantly decreases and limiters increases with the increase in number of living children (Bhattacharya et al. 2006). Roy Karmakar et al. (2011) studied that the gap between contraceptive need and practice requires increase in contraceptive options by incorporation of natural and traditional methods which are safe, simple and should be provided by healthcare providers. It is estimated that more than 100 million women globally specifically in less developed countries or about 17% of all married women would prefer to avoid pregnancy but are not using any form of contraceptive method (Ross and Winfrey, 2002). Also in the less developed countries, about one-fourth of all pregnancies are unintended (Haub and Herstad, 2002), while an estimated 18 million unsafe abortions take place each year (Murray and Lopez, 1998), thereby contributing high risk of maternal mortality and injuries. Meeting the demand for family planning is likely to lead to achieving one of the national policy, that is, reducing the total fertility rate. The immediate objective of NPP 2000 was to address the unmet need for contraception. The medium-term objective was to bring the TFR to replacement levels by 2010 through vigorous implementation of inter-sectoral operational strategies. The long-term objective was to achieve a stable population by 2045, at a level consistent with the requirements of sustainable economic growth, social development, and environmental protection. Among other reasons, population growth of India continues to be high on account of large size of population in the reproductive age group. High fertility continues due to unmet need for contraception. Urgent steps are required to make contraception more widely available, accessible, and affordable. Around 74 percent of the population lives in the rural areas, reproductive health and basic health infrastructure and services often do not reach the villages, and, accordingly, vast number of people can not avail of these services.
Research on Humanities and Social Sciences www.iiste.org ISSN 2222-1719 (Paper) ISSN 2222-2863 (Online) Vol.3, No.3, 2013
63
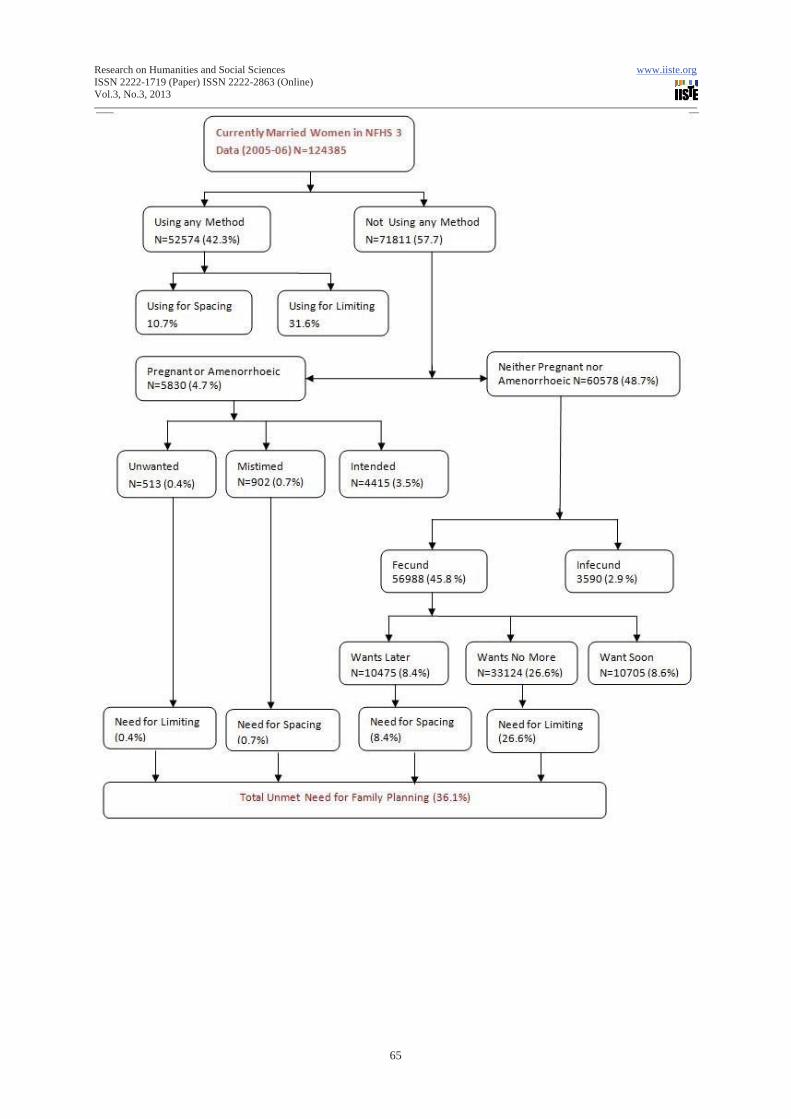
High wanted fertility due to high infant mortality rate. Repeated child births are seen as an insurance against multiple infant deaths and accordingly, high infant mortality stymies all efforts at reducing TFR. Over 50 percent of girls get married below age 18, the minimum legal age of marriage, resulting in a typical reproductive pattern of “ too early, too frequent, too many”. Around 33 percent births occur at intervals less than 24 months, which also results in high infant mortality rate. In India, women with unmet need for family planning constitute a significant fraction of all married women of reproductive age. Data from National Family Health Survey (NFHS 3, 2005-06) shows that among the currently married women 7 per cent women had unmet need for limiting and 6 per cent had unmet need for spacing at the national level. In India more than half of the women (56 per cent) have a met need for family planning. Including met and unmet need, 69 per cent of currently married women have a demand for family planning. Unmet need for family planning decreases with age, from 27 per cent for women age 15-19 to 2 per cent for women age 45-49. Younger women (age 15-24) have greater unmet need for spacing than for limiting. For older women reverse pattern is followed. The unmet need for limiting increases through age 25-29 then decreases continuously (NFHS 3, 2005-06). 2. Previous Literature Bongrats and Brace (1995) using survey data and related anthropological studies, studied the causes of unmet need and concludes that the conventional explanation for unmet need is inadequate. The principal reason for nonuse are lack of knowledge, fear of side effects, and social and familial disapproval. This finding underscore the need for expanded investment in services that not provide contraceptives, but also attend to closely related health and social needs of prospective clients. Chiezah and Adamchak (1995) studied updates and extends for unmet need and total demand for family planning for Jamaican women in the reproductive age group, 15-49. Assefa Hailemariam & Fikrewoled Haddis (2011) studied that unmet need for spacing is more prevalent than unmet need for limiting. Women with unmet need for both spacing and limiting are more likely to be living in rural areas, have lower level of education, lower level of knowledge about family planning method, have no work other than household chores, and have never been visited by a family planning worker. Anthony, O. et. al. (2009) studied that there is significant lag between the knowledge and the use of common methods of family planning. They further studied that husband’s disapproval, fear of side effects and religious belief were the main constraints of contraceptive use. 3. Main Focus of the study The main focus of this study are : (1) to estimate the differentials of unmet need for family planning (spacing and limiting) in three regions of India namely, Empowered Actions Group states (EAG), South Indian states and rest Indian states; and (2) to explore the impact of socio-economic and demographic predictor variables on likelihood of unmet need for family planning (spacing and limiting) of the women aged 20-39 years in three regions of the country. Efforts is also made to study the impact of some socio-economic and demographic characteristics, namely, education level of the women, number of living children, religion, caste, education level of husband, exposure to media, female autonomy, sex composition of the children, experience of child death, place of residence, wealth status of households on the unmet need for spacing and unmet need for limiting of the women aged 20-39 years of these regions. 4. Materials and Methods Data used in this study were taken from National Family Health Survey 3 (NFHS 3), a sample survey conducted in the year 2005-06, by International Institute for Population Sciences (IIPS), Mumbai, India. The survey covered 124385 currently married women aged 15-49 years at the national level. The currently married women were first divided into two categories : (1) using a method (N=52574, 42.3%) and (2) not using a method (N= 71811, 57.7%). The non-users were then divided into (1) pregnant or amenorrhoeic women (N=5830, 4.7%) and (2) neither pregnant nor amenorrhoeic (N=60578, 48.7%). The pregnant or amenorrhoeic women were classified by whether birth or pregnancy was unwanted (0.4%), mistimed (0.7%) or intended (3.5%). The women having unwanted and mistimed pregnancies were regarded as one component of total unmet need. The women neither pregnant nor amenorrhoeic are divided into two categories : (a) Fecund and (b) infecund. The fecund women are classified into three categories : (a) want no more children, (b) want later and (c) want soon. The women want no more children and want later having need for limiting and need for
Research on Humanities and Social Sciences www.iiste.org ISSN 2222-1719 (Paper) ISSN 2222-2863 (Online) Vol.3, No.3, 2013
64
spacing respectively. The currently married women of reproductive age desire no more children but using no contraception are designated as ‘unmet need for family limitation’. On the other hand women do not want to have the next child immediately but desire to wait for at least two years but using no contraception are designated as ‘unmet need for spacing’. The total unmet need for family planning is 36.1%, sum of the fecund women want later and want no more children, and the women having unwanted and mistimed pregnancies (women never had sex, declared infecund and sterilized are excluded from the calculation of unmet need). Binary Logistic Regression model was used to identify factors associated with unmet need for spacing, unmet need for limiting and total unmet need separately. In the model, number of living children, sex composition of living children, experience of child mortality, place of residence, respondents’ education, partners’ education, religion of the household head, caste of the household head, wealth status of household, media exposure, work status of respondents are used as explanatory variables. All regression models were estimated using STATA 10.0. The respondents (women) are categorized by age into two categories : 20-29 and 30-39, because usage of contraception are very less below 20 years of age and beyond 40+ years of age, hence the question of unmet need are less important in <20 and 39+ age categories. Indian states are divided into three groups : Empowered Actions Group States (EAG), South Indian states and rest Indian states. The states, namely, Madhya Pradesh, Uttar Pradesh, Uttaranchal, Jharkhand, Bihar, Rajasthan, Orissa and Chhattisgarh are designated as Empowered Actions Group (EAG) states where fertility, infant death and under 5 mortality are higher than the national average. In these states (EAG) usage of contraception is less as compared to South Indian states and also the national average and hence demand for unmet need for family planning is high as compared to the national average. In our analysis, the EAG states are considered as the reference category. On the other hand, the states, namely, Andhra Pradesh, Tamil Nadu, Kerala and Karnataka are named as the South Indian states. In these states, fertility, infant death, under 5 mortality are less as compared to the national average. Excluding the EAG and South Indian states, 17 other states are included in the rest Indian states category.
Research on Humanities and Social Sciences www.iiste.org ISSN 2222-1719 (Paper) ISSN 2222-2863 (Online) Vol.3, No.3, 2013
65
Research on Humanities and Social Sciences www.iiste.org ISSN 2222-1719 (Paper) ISSN 2222-2863 (Online) Vol.3, No.3, 2013
66
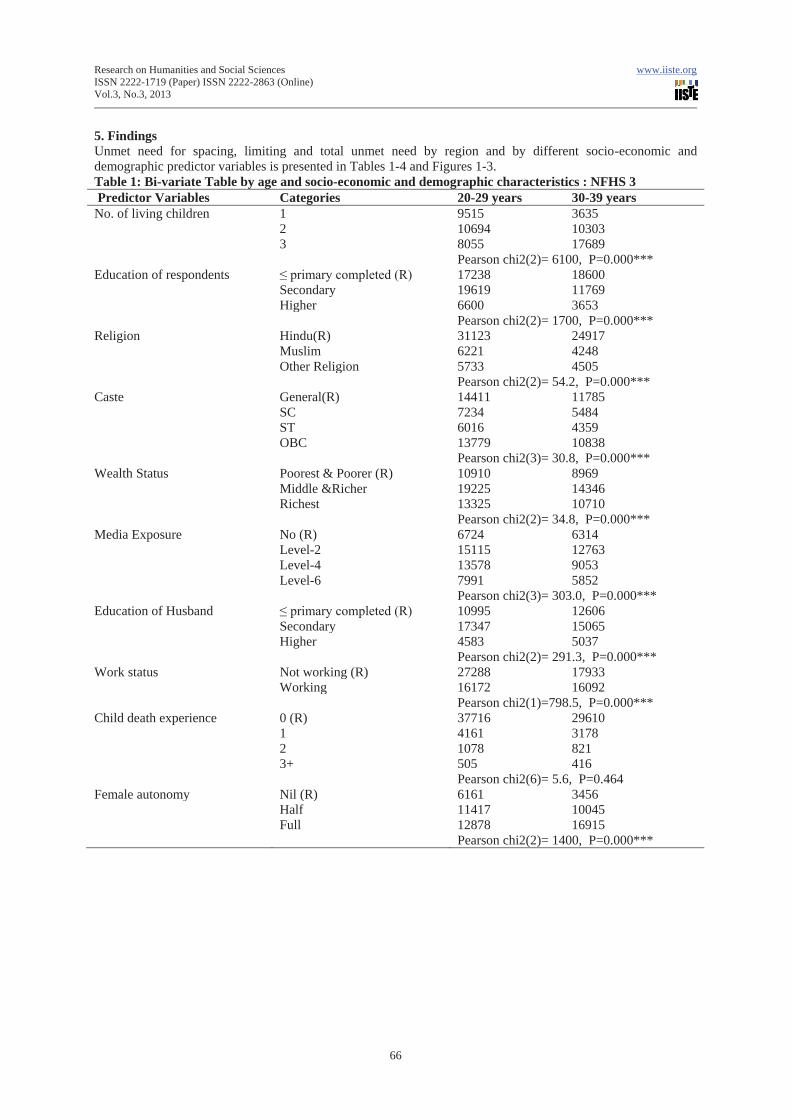
5. Findings Unmet need for spacing, limiting and total unmet need by region and by different socio-economic and demographic predictor variables is presented in Tables 1-4 and Figures 1-3. Table 1: Bi-variate Table by age and socio-economic and demographic characteristics : NFHS 3 Predictor Variables Categories 20-29 years 30-39 years No. of living children 1 9515 3635
2 10694 10303 3 8055 17689
Pearson chi2(2)= 6100, P=0.000*** Education of respondents ≤ primary completed (R) 17238 18600 Secondary 19619 11769 Higher 6600 3653 Pearson chi2(2)= 1700, P=0.000*** Religion Hindu(R) 31123 24917 Muslim 6221 4248 Other Religion 5733 4505 Pearson chi2(2)= 54.2, P=0.000*** Caste General(R) 14411 11785 SC 7234 5484 ST 6016 4359 OBC 13779 10838 Pearson chi2(3)= 30.8, P=0.000*** Wealth Status Poorest & Poorer (R) 10910 8969 Middle &Richer 19225 14346 Richest 13325 10710 Pearson chi2(2)= 34.8, P=0.000*** Media Exposure No (R) 6724 6314 Level-2 15115 12763 Level-4 13578 9053 Level-6 7991 5852 Pearson chi2(3)= 303.0, P=0.000*** Education of Husband ≤ primary completed (R) 10995 12606 Secondary 17347 15065 Higher 4583 5037 Pearson chi2(2)= 291.3, P=0.000*** Work status Not working (R) 27288 17933 Working 16172 16092 Pearson chi2(1)=798.5, P=0.000*** Child death experience 0 (R) 37716 29610 1 4161 3178 2 1078 821 3+ 505 416 Pearson chi2(6)= 5.6, P=0.464 Female autonomy Nil (R) 6161 3456 Half 11417 10045 Full 12878 16915 Pearson chi2(2)= 1400, P=0.000***
Research on Humanities and Social Sciences www.iiste.org ISSN 2222-1719 (Paper) ISSN 2222-2863 (Online) Vol.3, No.3, 2013
67
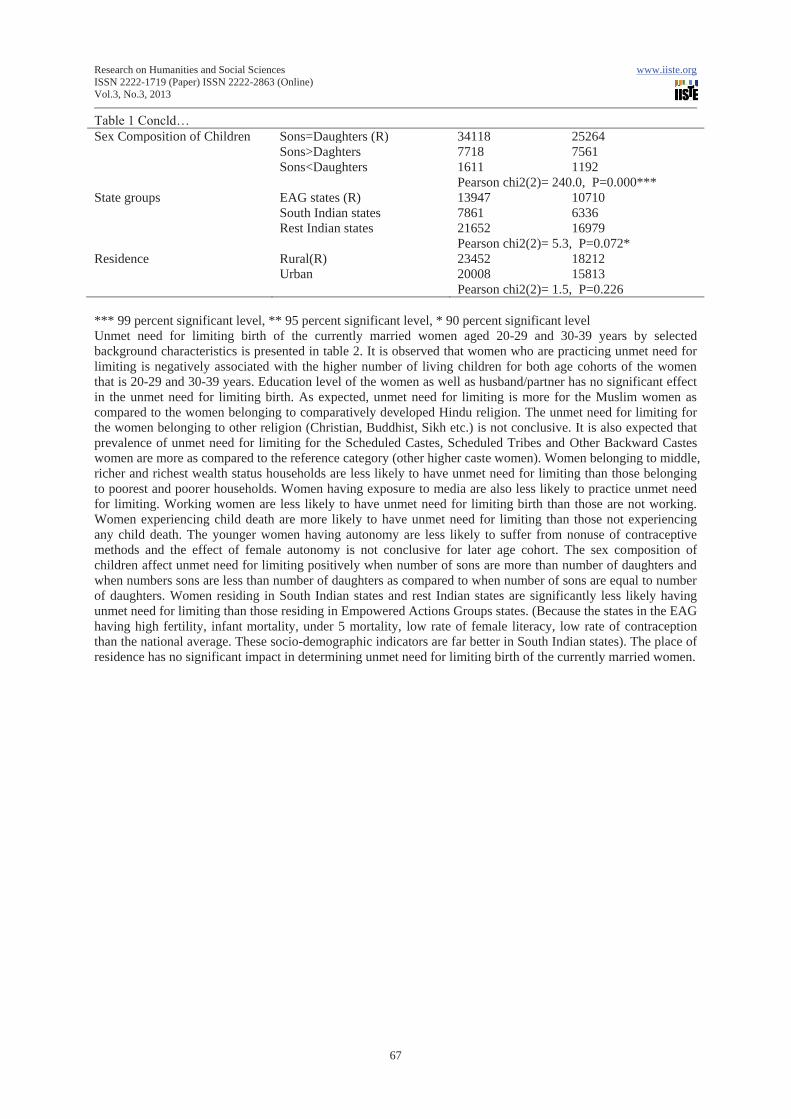
Table 1 Concld… Sex Composition of Children Sons=Daughters (R) 34118 25264 Sons>Daghters 7718 7561 Sons<Daughters 1611 1192 Pearson chi2(2)= 240.0, P=0.000*** State groups EAG states (R) 13947 10710 South Indian states 7861 6336 Rest Indian states 21652 16979 Pearson chi2(2)= 5.3, P=0.072* Residence Rural(R) 23452 18212 Urban 20008 15813 Pearson chi2(2)= 1.5, P=0.226 *** 99 percent significant level, ** 95 percent significant level, * 90 percent significant level Unmet need for limiting birth of the currently married women aged 20-29 and 30-39 years by selected background characteristics is presented in table 2. It is observed that women who are practicing unmet need for limiting is negatively associated with the higher number of living children for both age cohorts of the women that is 20-29 and 30-39 years. Education level of the women as well as husband/partner has no significant effect in the unmet need for limiting birth. As expected, unmet need for limiting is more for the Muslim women as compared to the women belonging to comparatively developed Hindu religion. The unmet need for limiting for the women belonging to other religion (Christian, Buddhist, Sikh etc.) is not conclusive. It is also expected that prevalence of unmet need for limiting for the Scheduled Castes, Scheduled Tribes and Other Backward Castes women are more as compared to the reference category (other higher caste women). Women belonging to middle, richer and richest wealth status households are less likely to have unmet need for limiting than those belonging to poorest and poorer households. Women having exposure to media are also less likely to practice unmet need for limiting. Working women are less likely to have unmet need for limiting birth than those are not working. Women experiencing child death are more likely to have unmet need for limiting than those not experiencing any child death. The younger women having autonomy are less likely to suffer from nonuse of contraceptive methods and the effect of female autonomy is not conclusive for later age cohort. The sex composition of children affect unmet need for limiting positively when number of sons are more than number of daughters and when numbers sons are less than number of daughters as compared to when number of sons are equal to number of daughters. Women residing in South Indian states and rest Indian states are significantly less likely having unmet need for limiting than those residing in Empowered Actions Groups states. (Because the states in the EAG having high fertility, infant mortality, under 5 mortality, low rate of female literacy, low rate of contraception than the national average. These socio-demographic indicators are far better in South Indian states). The place of residence has no significant impact in determining unmet need for limiting birth of the currently married women.
Research on Humanities and Social Sciences www.iiste.org ISSN 2222-1719 (Paper) ISSN 2222-2863 (Online) Vol.3, No.3, 2013
68
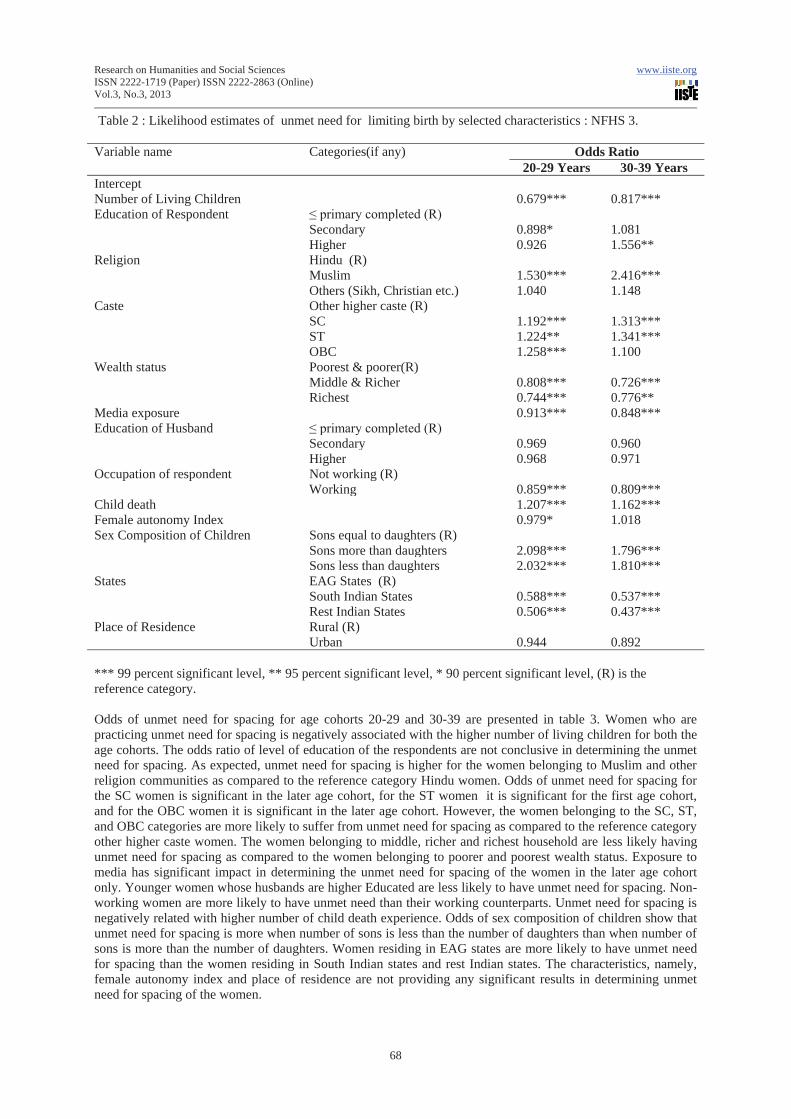
Table 2 : Likelihood estimates of unmet need for limiting birth by selected characteristics : NFHS 3. Variable name Categories(if any) Odds Ratio
20-29 Years 30-39 Years Intercept Number of Living Children 0.679*** 0.817*** Education of Respondent ≤ primary completed (R)
Secondary 0.898* 1.081 Higher 0.926 1.556**
Religion Hindu (R) Muslim 1.530*** 2.416*** Others (Sikh, Christian etc.) 1.040 1.148
Caste Other higher caste (R) SC 1.192*** 1.313*** ST 1.224** 1.341*** OBC 1.258*** 1.100
Wealth status Poorest & poorer(R) Middle & Richer 0.808*** 0.726*** Richest 0.744*** 0.776**
Media exposure 0.913*** 0.848*** Education of Husband ≤ primary completed (R)
Secondary 0.969 0.960 Higher 0.968 0.971
Occupation of respondent Not working (R) Working 0.859*** 0.809***
Child death 1.207*** 1.162*** Female autonomy Index 0.979* 1.018 Sex Composition of Children Sons equal to daughters (R)
Sons more than daughters 2.098*** 1.796*** Sons less than daughters 2.032*** 1.810***
States EAG States (R) South Indian States 0.588*** 0.537*** Rest Indian States 0.506*** 0.437***
Place of Residence Rural (R) Urban 0.944 0.892
*** 99 percent significant level, ** 95 percent significant level, * 90 percent significant level, (R) is the reference category. Odds of unmet need for spacing for age cohorts 20-29 and 30-39 are presented in table 3. Women who are practicing unmet need for spacing is negatively associated with the higher number of living children for both the age cohorts. The odds ratio of level of education of the respondents are not conclusive in determining the unmet need for spacing. As expected, unmet need for spacing is higher for the women belonging to Muslim and other religion communities as compared to the reference category Hindu women. Odds of unmet need for spacing for the SC women is significant in the later age cohort, for the ST women it is significant for the first age cohort, and for the OBC women it is significant in the later age cohort. However, the women belonging to the SC, ST, and OBC categories are more likely to suffer from unmet need for spacing as compared to the reference category other higher caste women. The women belonging to middle, richer and richest household are less likely having unmet need for spacing as compared to the women belonging to poorer and poorest wealth status. Exposure to media has significant impact in determining the unmet need for spacing of the women in the later age cohort only. Younger women whose husbands are higher Educated are less likely to have unmet need for spacing. Non-working women are more likely to have unmet need than their working counterparts. Unmet need for spacing is negatively related with higher number of child death experience. Odds of sex composition of children show that unmet need for spacing is more when number of sons is less than the number of daughters than when number of sons is more than the number of daughters. Women residing in EAG states are more likely to have unmet need for spacing than the women residing in South Indian states and rest Indian states. The characteristics, namely, female autonomy index and place of residence are not providing any significant results in determining unmet need for spacing of the women.
Research on Humanities and Social Sciences www.iiste.org ISSN 2222-1719 (Paper) ISSN 2222-2863 (Online) Vol.3, No.3, 2013
69
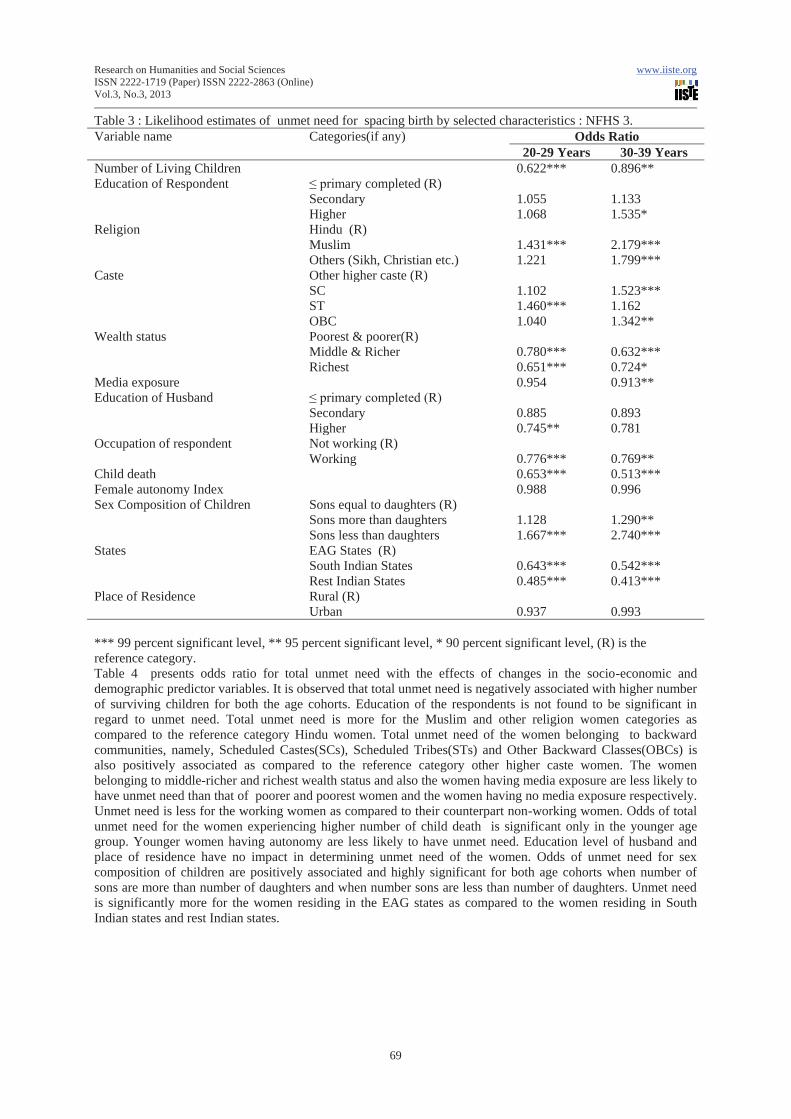
Table 3 : Likelihood estimates of unmet need for spacing birth by selected characteristics : NFHS 3. Variable name Categories(if any) Odds Ratio
20-29 Years 30-39 Years Number of Living Children 0.622*** 0.896** Education of Respondent ≤ primary completed (R)
Secondary 1.055 1.133 Higher 1.068 1.535*
Religion Hindu (R) Muslim 1.431*** 2.179*** Others (Sikh, Christian etc.) 1.221 1.799***
Caste Other higher caste (R) SC 1.102 1.523*** ST 1.460*** 1.162 OBC 1.040 1.342**
Wealth status Poorest & poorer(R) Middle & Richer 0.780*** 0.632*** Richest 0.651*** 0.724*
Media exposure 0.954 0.913** Education of Husband ≤ primary completed (R)
Secondary 0.885 0.893 Higher 0.745** 0.781
Occupation of respondent Not working (R) Working 0.776*** 0.769**
Child death 0.653*** 0.513*** Female autonomy Index 0.988 0.996 Sex Composition of Children Sons equal to daughters (R)
Sons more than daughters 1.128 1.290** Sons less than daughters 1.667*** 2.740***
States EAG States (R) South Indian States 0.643*** 0.542*** Rest Indian States 0.485*** 0.413***
Place of Residence Rural (R) Urban 0.937 0.993
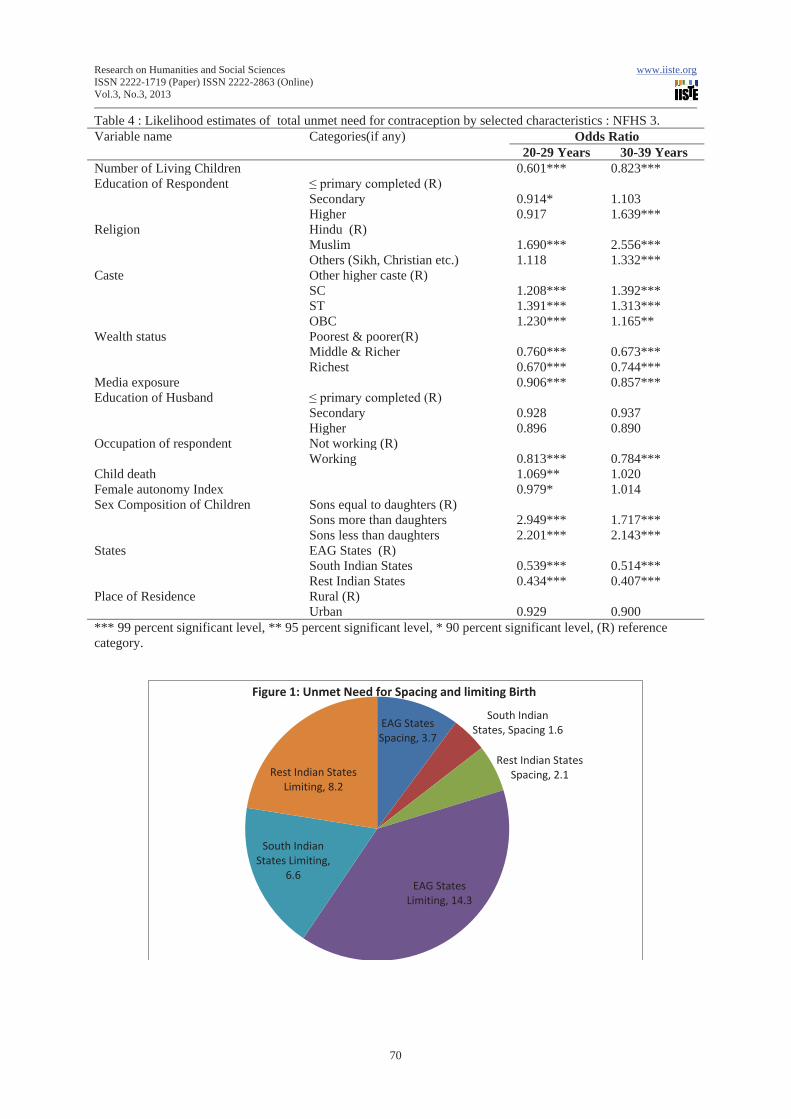
*** 99 percent significant level, ** 95 percent significant level, * 90 percent significant level, (R) is the reference category. Table 4 presents odds ratio for total unmet need with the effects of changes in the socio-economic and demographic predictor variables. It is observed that total unmet need is negatively associated with higher number of surviving children for both the age cohorts. Education of the respondents is not found to be significant in regard to unmet need. Total unmet need is more for the Muslim and other religion women categories as compared to the reference category Hindu women. Total unmet need of the women belonging to backward communities, namely, Scheduled Castes(SCs), Scheduled Tribes(STs) and Other Backward Classes(OBCs) is also positively associated as compared to the reference category other higher caste women. The women belonging to middle-richer and richest wealth status and also the women having media exposure are less likely to have unmet need than that of poorer and poorest women and the women having no media exposure respectively. Unmet need is less for the working women as compared to their counterpart non-working women. Odds of total unmet need for the women experiencing higher number of child death is significant only in the younger age group. Younger women having autonomy are less likely to have unmet need. Education level of husband and place of residence have no impact in determining unmet need of the women. Odds of unmet need for sex composition of children are positively associated and highly significant for both age cohorts when number of sons are more than number of daughters and when number sons are less than number of daughters. Unmet need is significantly more for the women residing in the EAG states as compared to the women residing in South Indian states and rest Indian states.
Research on Humanities and Social Sciences www.iiste.org ISSN 2222-1719 (Paper) ISSN 2222-2863 (Online) Vol.3, No.3, 2013
70
Table 4 : Likelihood estimates of total unmet need for contraception by selected characteristics : NFHS 3. Variable name Categories(if any) Odds Ratio
20-29 Years 30-39 Years Number of Living Children 0.601*** 0.823*** Education of Respondent ≤ primary completed (R)
Secondary 0.914* 1.103 Higher 0.917 1.639***
Religion Hindu (R) Muslim 1.690*** 2.556*** Others (Sikh, Christian etc.) 1.118 1.332***
Caste Other higher caste (R) SC 1.208*** 1.392*** ST 1.391*** 1.313*** OBC 1.230*** 1.165**
Wealth status Poorest & poorer(R) Middle & Richer 0.760*** 0.673*** Richest 0.670*** 0.744***
Media exposure 0.906*** 0.857*** Education of Husband ≤ primary completed (R)
Secondary 0.928 0.937 Higher 0.896 0.890
Occupation of respondent Not working (R) Working 0.813*** 0.784***
Child death 1.069** 1.020 Female autonomy Index 0.979* 1.014 Sex Composition of Children Sons equal to daughters (R)
Sons more than daughters 2.949*** 1.717*** Sons less than daughters 2.201*** 2.143***
States EAG States (R) South Indian States 0.539*** 0.514*** Rest Indian States 0.434*** 0.407***
Place of Residence Rural (R) Urban 0.929 0.900
*** 99 percent significant level, ** 95 percent significant level, * 90 percent significant level, (R) reference category.
EAG States Spacing, 3.7
South Indian States, Spacing 1.6
Rest Indian States Spacing, 2.1
EAG States Limiting, 14.3
South Indian States Limiting,
6.6
Rest Indian States Limiting, 8.2
Figure 1: Unmet Need for Spacing and limiting Birth
Research on Humanities and Social Sciences www.iiste.org ISSN 2222-1719 (Paper) ISSN 2222-2863 (Online) Vol.3, No.3, 2013
71
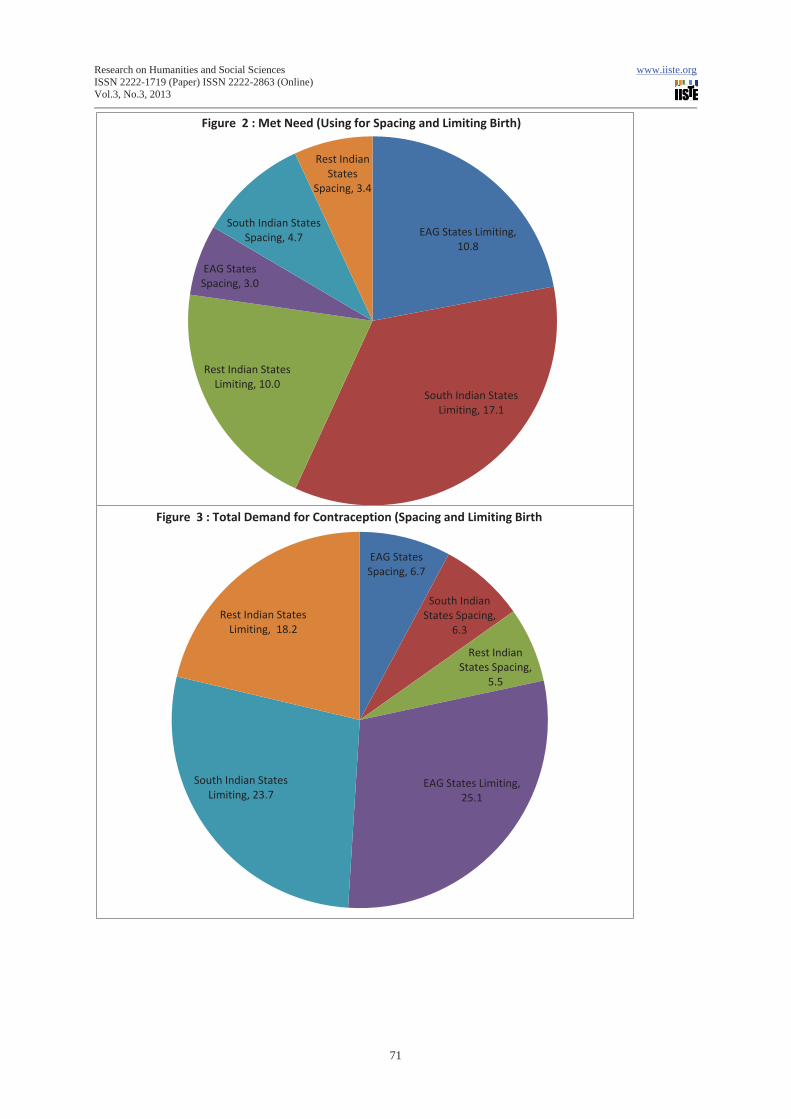
EAG States Limiting, 10.8
South Indian States Limiting, 17.1
Rest Indian States Limiting, 10.0
EAG States Spacing, 3.0
South Indian States Spacing, 4.7
Rest Indian States
Spacing, 3.4
Figure 2 : Met Need (Using for Spacing and Limiting Birth)
EAG States Spacing, 6.7
South Indian States Spacing,
6.3
Rest Indian States Spacing,
5.5
EAG States Limiting, 25.1
South Indian States Limiting, 23.7
Rest Indian States Limiting, 18.2
Figure 3 : Total Demand for Contraception (Spacing and Limiting Birth
Research on Humanities and Social Sciences www.iiste.org ISSN 2222-1719 (Paper) ISSN 2222-2863 (Online) Vol.3, No.3, 2013
72
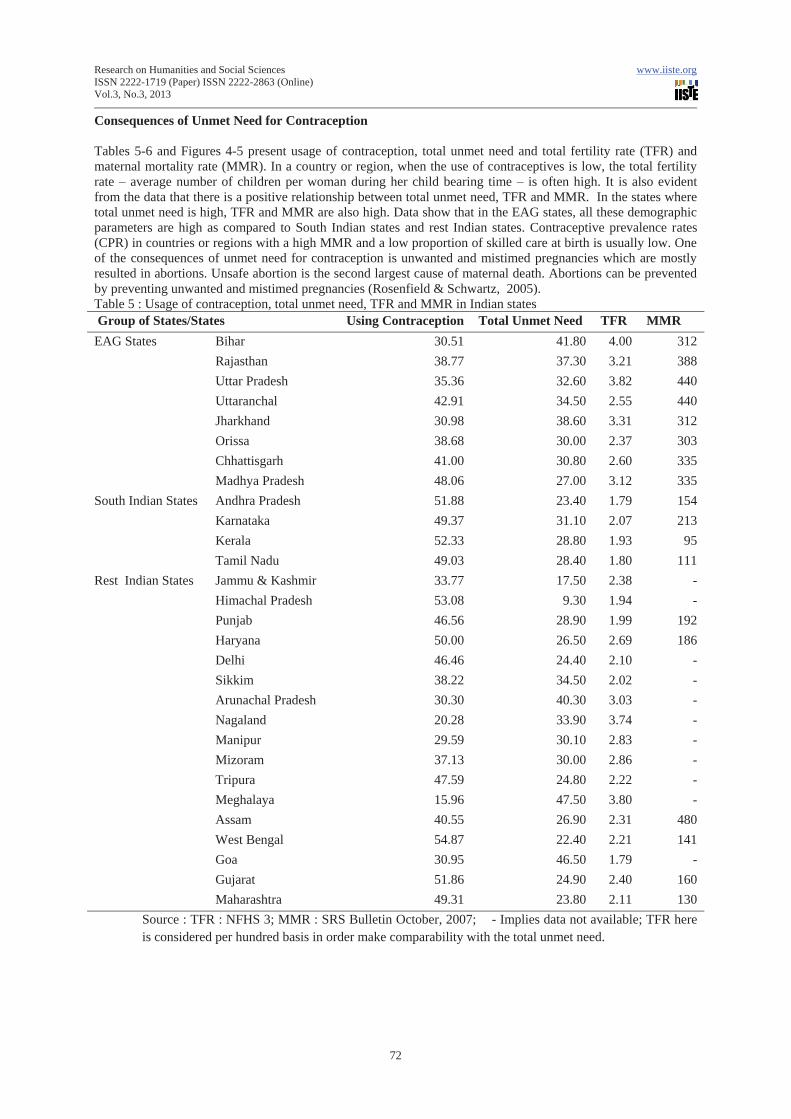
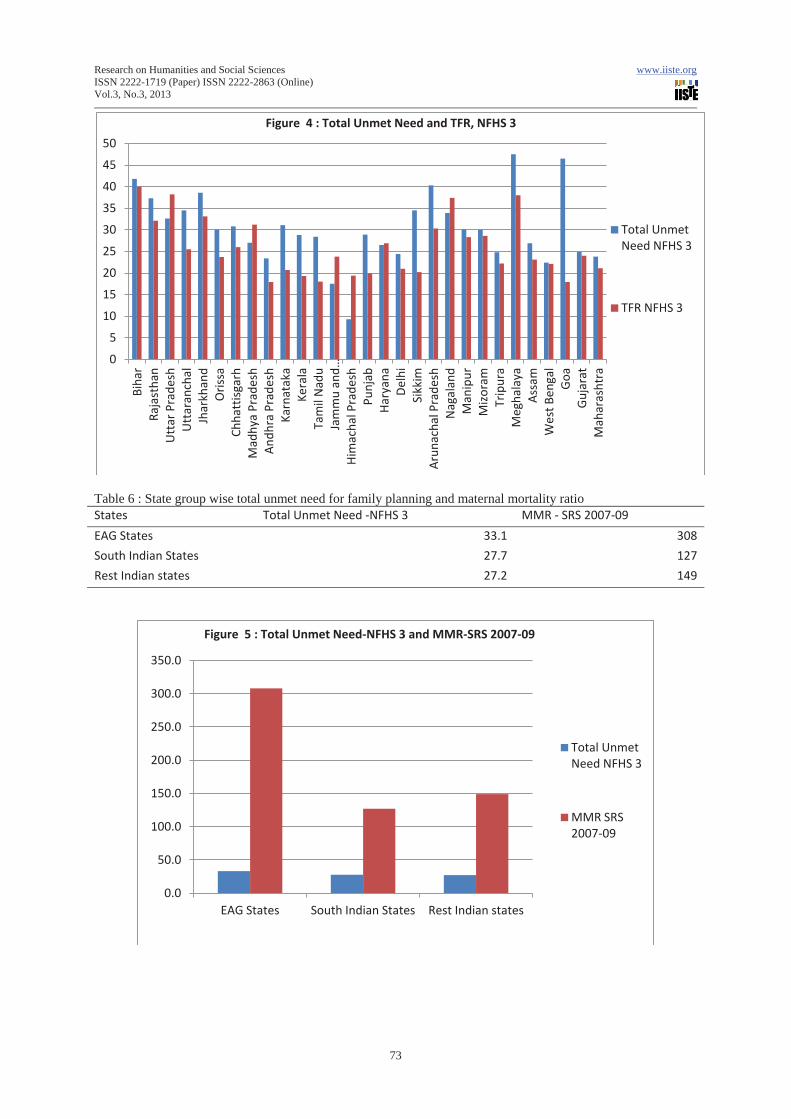
Consequences of Unmet Need for Contraception Tables 5-6 and Figures 4-5 present usage of contraception, total unmet need and total fertility rate (TFR) and maternal mortality rate (MMR). In a country or region, when the use of contraceptives is low, the total fertility rate – average number of children per woman during her child bearing time – is often high. It is also evident from the data that there is a positive relationship between total unmet need, TFR and MMR. In the states where total unmet need is high, TFR and MMR are also high. Data show that in the EAG states, all these demographic parameters are high as compared to South Indian states and rest Indian states. Contraceptive prevalence rates (CPR) in countries or regions with a high MMR and a low proportion of skilled care at birth is usually low. One of the consequences of unmet need for contraception is unwanted and mistimed pregnancies which are mostly resulted in abortions. Unsafe abortion is the second largest cause of maternal death. Abortions can be prevented by preventing unwanted and mistimed pregnancies (Rosenfield & Schwartz, 2005). Table 5 : Usage of contraception, total unmet need, TFR and MMR in Indian states Group of States/States Using Contraception Total Unmet Need TFR MMR EAG States Bihar 30.51 41.80 4.00 312
Rajasthan 38.77 37.30 3.21 388 Uttar Pradesh 35.36 32.60 3.82 440 Uttaranchal 42.91 34.50 2.55 440 Jharkhand 30.98 38.60 3.31 312 Orissa 38.68 30.00 2.37 303 Chhattisgarh 41.00 30.80 2.60 335 Madhya Pradesh 48.06 27.00 3.12 335
South Indian States Andhra Pradesh 51.88 23.40 1.79 154 Karnataka 49.37 31.10 2.07 213 Kerala 52.33 28.80 1.93 95 Tamil Nadu 49.03 28.40 1.80 111
Rest Indian States Jammu & Kashmir 33.77 17.50 2.38 - Himachal Pradesh 53.08 9.30 1.94 - Punjab 46.56 28.90 1.99 192 Haryana 50.00 26.50 2.69 186 Delhi 46.46 24.40 2.10 - Sikkim 38.22 34.50 2.02 - Arunachal Pradesh 30.30 40.30 3.03 - Nagaland 20.28 33.90 3.74 - Manipur 29.59 30.10 2.83 - Mizoram 37.13 30.00 2.86 - Tripura 47.59 24.80 2.22 - Meghalaya 15.96 47.50 3.80 - Assam 40.55 26.90 2.31 480 West Bengal 54.87 22.40 2.21 141 Goa 30.95 46.50 1.79 - Gujarat 51.86 24.90 2.40 160 Maharashtra 49.31 23.80 2.11 130
Source : TFR : NFHS 3; MMR : SRS Bulletin October, 2007; - Implies data not available; TFR here is considered per hundred basis in order make comparability with the total unmet need.
Research on Humanities and Social Sciences www.iiste.org ISSN 2222-1719 (Paper) ISSN 2222-2863 (Online) Vol.3, No.3, 2013
73
Table 6 : State group wise total unmet need for family planning and maternal mortality ratio States Total Unmet Need -NFHS 3 MMR - SRS 2007-09
EAG States 33.1 308
South Indian States 27.7 127
Rest Indian states 27.2 149
0
5
10
15
20
25
30
35
40
45
50 B
ihar
R
ajas
than
U
ttar
Pra
desh
U
ttar
anch
al
Jhar
khan
d O
riss
a C
hhat
tisga
rh
Mad
hya
Prad
esh
And
hra
Prad
esh
Kar
nata
ka
Ker
ala
Tam
il N
adu
Jam
mu
and …
Him
acha
l Pra
desh
P
unja
b H
arya
na
Del
hi
Sik
kim
A
runa
chal
Pra
desh
N
agal
and
Man
ipur
M
izor
am
Tri
pura
M
egha
laya
A
ssam
W
est B
enga
l G
oa
Guj
arat
M
ahar
asht
ra
Figure 4 : Total Unmet Need and TFR, NFHS 3
Total Unmet Need NFHS 3
TFR NFHS 3
0.0
50.0
100.0
150.0
200.0
250.0
300.0
350.0
EAG States South Indian States Rest Indian states
Figure 5 : Total Unmet Need-NFHS 3 and MMR-SRS 2007-09
Total Unmet Need NFHS 3
MMR SRS 2007-09
Research on Humanities and Social Sciences www.iiste.org ISSN 2222-1719 (Paper) ISSN 2222-2863 (Online) Vol.3, No.3, 2013
74
Discussion From the foregoing findings of the study it is evident that the characteristics, namely, number of living children, ethnicity, wealth status of household, exposure to family planning messages, work status of women, child death experience, female autonomy and sex composition of children are significantly influencing unmet need for contraception of the currently married women. It is also evident that unmet need for contraception is more in the Empowered Actions Group states as compared to South Indian and rest Indian states. One of the reasons behind this is low rate of female literacy in these states as compared to national average. Illiterate women are less capable in making decision related to family planning. Low literacy rate of the women alone contribute significantly to non-use of contraception in many regions. Literacy rate specifically female literacy is low among the Scheduled Castes, Scheduled Tribes population. High concentration of Scheduled Castes and Scheduled Tribes population in the EAG states led to low rate of contraceptive use. In Kerala and other South Indian states female literacy rate is high and concentration of Scheduled Castes and Scheduled Tribes population is less which led to high proportion of contraceptive usage in these states. In most of the EAG states, per capita income is low as compared to the national average which is one of the important reasons for low contraceptive usage in the region. Wealth status of household is represented as a proxy for per capita income of the households, and distribution of households in the low wealth quintiles is high in the EAG states. Family planning can reduce maternal mortality by reducing number of unwanted and mistimed pregnancies, and thereby reducing the number of abortions, and proportions of births at high risk (Lee et al. 1998)) There is a strong positive association between unmet need for contraception use and maternal mortality as shown in Figure 5. It has been estimated that meeting women’s need for modern contraceptives would prevent about one quarter to one-third of all maternal deaths, saving 140,000 to 150,000 lives in a year (Vernon R 2008). It also prevent similar proportion of injuries, infections, and long-term disabilities that result from unwanted and mistimed pregnancies, abortions, child births at high risk, during adolescence, older age, high parity and short birth intervals that affect an estimated 15 million women annually (United Nation Population Fund, 2004 and 2005; Marston & Cleland, 2004). Therefore, meeting the unmet need for family planning is also a part of the strategies to reduce maternal mortality. Conclusion Family planning is an effective measure which can serve as the public health intervention with multiple societal and individual benefits. Not only that but also family planning helps couples achieve desired number of children and can reduce maternal and child mortality. By providing family planning accessories, there may be a positive impact in spacing birth of children, one of the risk factors for maternal and child deaths. Effective use of family planning methods may contribute to improved maternal and child health which may help women avoid unwanted pregnancy when the risks are high specifically at older ages of women. In almost all the states, there are too some extent unmet need for contraception, more specifically the states in the EAG region where special attention is needed. The main reason for high unmet need for contraception in the EAG region are low female literacy rate and poverty which become the constraint for effective use of family planning methods. The only way to control population growth is to reduce unmet need and increase the usage of family planning methods.
Notes
1.Empowered Actions Group states (EAG) : The National Population Policy (NPP) has listed short and long term goals to be achieved for population stabilisation and achievement of Key Socio-Demographic Indicators by the year 2010 and 2045. One of the key objectives is attainment of TFR (Total fertility rate) of 2.1 by 2010 for the country. It is felt that although progress in some states is satisfactory, poor performance in EAG states is proving to be a constraint to national progress. Therefore, more focused interventions are needed on the issues of reproductive and child health care in these states for attainment of the demographic goal set in the NPP, 2000. It is necessary to provide an impetus for strengthening the primary health care infrastructure, a prerequisite for efficient delivery of family welfare services. 2. Scheduled Castes (SCs), Scheduled Tribes (STs), and Other Backward Classes (OBCs) are the weaker sections or backward communities, whereas the other higher castes are the advanced group of population of the Indian society and also the reference category. Backwardness of these communities are ranked in ascending order as : Scheduled Tribes < Scheduled Castes < Other Backward Classes. Some special facilities in the matter
Research on Humanities and Social Sciences www.iiste.org ISSN 2222-1719 (Paper) ISSN 2222-2863 (Online) Vol.3, No.3, 2013
75
of education and employment in the government and semi-government departments are provided to these weaker sections of population as described in the Constitution of the country.
References Anthony, O., Igwegbe, Joseph,O. Ugboaja, Emmanuel, N. Monago. (2009). Prevalence and determinants of unmet need for family planning in Nnewi, south-east Nigeria. International Journal of Medicine and Medical Sciences, 1(8), 325-329. Assefa, H., Fikrewold, H. (2011). Factors affecting unmet need for family planning in southern nations, nationalities and peoples region, Ethiopia. Ethiopean Journal of Health Sciences, 21(2), 77-89. Bhattacharya SK, Ram R, Goswami DN, Gupta UD, Bhattacharya K and ray S (2006). Study of unmet need for family planning among women of reproductive age group attending immunization clinic in a Medical College in Kolkata. Indian Journal of Community Medicine 31(2). Bongrats, J. and Bruce, J.(1995). The causes of unmet need for contraception and the social content of services, Studies in Family Planning, 26(2), 57-75. Chiezah, M. A. and Adamchak, D.J. (1995). Unmet need for family planning in Jamaica. Journal of Biosocial Science, 27(3), 319-324. Haub, C. and Herstad, B. (2002). Family planning worldwide 2002 data sheet. Washington DC : Population Reference Bureau. Laya KS (2012). Prevalance and determinants of unmet need for family planning among women in India. Research and Social Practices in Social Sciences 7(2) 59-70. Muray, C. and Lopez, A. (1998). Eds.,Health dimensions of sex and reproduction. In Global Burden of Disease, Vol.3.Boston : Harvard University Press, p. 280. Radha Devi D, Rastogi SR, Ratherford RD (1996). Unmet need for family planning in Uttar Pradesh. National Family Health Survey Subject Report No. 1 1-27 Ross, J.A, and Winfrey, W.L. (2002). Unmet need for contraception in the developing world and former Soviet Union : An updated estimate. International Family Planning Perspectives, 28(3). Roy Karmakar P, Halder P, Bisoi S, Guha Roy T, Choudhuri R, Sarkar TK and Choudhury SP (2011). Bridging the unmet need in contraceptive practice with natural methods : a study from Kolkkata, India. The Health 2(3) 78-81. Srivastava DK, Goutam P, Goutam R, Gour N, Bansal M (2011). A study to assess the unmet need of family planning in Gwalior district and to study the factors that helps in determining it. National Journal of Community Medicine 2(1) 28-31. United Nations Population Fund (UNFPA) (2004, 2005). University of Aberdeen. Maternal Mortality Updates 2004 : Delivering into Good Hands. New Yprk : UNFPA; 2005. Available at : www.unfpa.org/upload/lib_pub_file/381_filename_mmupdate05_eng21.pdf. Lee, K., Lousiana, L, Gill, W.Cleland, J. (1998). Family Planning policies and programmes in eight low income countries : a comparative policy analysis. Social Science & Medicine, 47(7), 949-959. Marston, C., & Cleland, J. (200). The effects of contraception on obstetric outcomes. Department of Primary Care and Social Medicine Publication : Geneva. United Nation (2005). World population prospects. Comprehensive tables. Economic and social affairs (The 2004 revision, Vol I). United Nations, New York. Rosenfield, A. & Schwartz, K. (2005). Improving the health of women in developing countries : the time is now. Journal of Midwifery and Women’s Health, 50(4), 272-274. Vernon, R. (2008). Meeting the family planning needs of postpartum women. FRONTERS Programme Brief No. 10. Washington , DC: Population Council; 2008. Available at : www. popcouncil.org/pdfs/frontlers/pbriefs/PB10.pdf.
This academic article was published by The International Institute for Science,
Technology and Education (IISTE). The IISTE is a pioneer in the Open Access
Publishing service based in the U.S. and Europe. The aim of the institute is
Accelerating Global Knowledge Sharing.
More information about the publisher can be found in the IISTE’s homepage:
http://www.iiste.org
CALL FOR PAPERS
The IISTE is currently hosting more than 30 peer-reviewed academic journals and
collaborating with academic institutions around the world. There’s no deadline for
submission. Prospective authors of IISTE journals can find the submission
instruction on the following page: http://www.iiste.org/Journals/
The IISTE editorial team promises to the review and publish all the qualified
submissions in a fast manner. All the journals articles are available online to the
readers all over the world without financial, legal, or technical barriers other than
those inseparable from gaining access to the internet itself. Printed version of the
journals is also available upon request of readers and authors.
IISTE Knowledge Sharing Partners
EBSCO, Index Copernicus, Ulrich's Periodicals Directory, JournalTOCS, PKP Open
Archives Harvester, Bielefeld Academic Search Engine, Elektronische
Zeitschriftenbibliothek EZB, Open J-Gate, OCLC WorldCat, Universe Digtial
Library , NewJour, Google Scholar