socio-economic assessment of haida gwaii / queen charlotte ... · socio-economic assessment of...
TRANSCRIPT
Socio-Economic Assessment of Haida Gwaii / Queen Charlotte Islands Land Use Viewpoints Final Report – March 31st, 2006 Commissioned by the Integrated Land Management Bureau, Coast Region Ministry of Agriculture and Lands
Prepared by: Pierce Lefebvre Consulting 3705 West 18th Ave. Vancouver, BC V6S 1B3 Tel: (604) 224-0648 Fax: (604) 224-5722 [email protected]

Pierce Lefebvre Consulting
Acknowledgements and Disclaimer This study was commissioned solely by the Province of BC (Integrated Land Management Bureau, BC Ministry of Agriculture and Lands) to inform government decision-making and the public at large. Ministry staff provided management, data and report editing support for the project, as well as introductions to other provincial government agencies for data and advice. It should be understood that this assessment is not endorsed by the Council of the Haida Nation and was initiated by the Province after the final working meeting of the Haida Gwaii / Queen Charlotte Islands Community Planning Forum in February of 2005. The analysis of impacts on potential timber harvesting activity relies substantially on timber supply forecasting models developed for HG/QCI by Gowlland Technologies Ltd. and Cortex Consultants Inc. In developing the socio-economic estimates prepared for this study, the consultants have made several forecasts and assumptions utilizing information gathered under the time and resource constraints imposed on this study. Socio-economic impact assessments are subject to a high degree of uncertainty, particularly as forecasts extend over periods of several decades. The forecasts and assumptions utilized herein are thought to be reasonable and suitable for the purposes of this analysis, but should not be relied upon for other purposes. The analysis was carried out in general accordance with the methods and requirements presented in the Ministry of Agriculture and Lands document titled Guidelines for Socio-Economic and Environmental Assessment (SEEA) (draft, 2006, available on request from ILMB).
Pierce Lefebvre Consulting
Pierce Lefebvre Consulting (PLC) specializes in providing economic and management consulting services to a wide variety of private and public sector clients. Claude Pierce is an economist with over 20 years experience, including twelve years as principal of PLC, four years as an independent consultant, and eight years with Colliers Macaulay Nicolls. Sylvie Lefebvre is a professional economist and a Certified Management Consultant. She has over 20 years of consulting experience including twelve years as a principal of PLC, and ten years at Price Waterhouse. Sylvie Lefebvre and Claude Pierce have conducted over 40 socio-economic impact assessment (SEA) studies and cost/benefit analyses related to resource analysis in all major industrial sectors in BC, including forestry, mining, energy, aquaculture, tourism, recreation, transportation, and the commercial fishing industry. Recent work by PLC includes an SEA of the Morice Land and Resource Management Plan (2004), an SEA of the Southern Rocky Mountain Management Plan (2003), an SEA of the Recovery Plan for Grizzly Bears in the North Cascades of BC (2003), and a broad SEA of the cumulative impacts of the Provincial Government’s Strategic Land Use Plans on Key Sectors in BC (2001).

Pierce Lefebvre Consulting
Socio-Economic Assessment of Haida Gwaii / Queen Charlotte Islands Land Use Viewpoints TABLE OF CONTENTS EXECUTIVE SUMMARY ............................................................................................................... i
1 INTRODUCTION ..................................................................................................................... 1 1.1 PROJECT METHODOLOGY................................................................................................... 1 1.2 BRIEF OVERVIEW OF RECENT LAND USE CONFLICTS ON HG/QCI........................................ 3 1.3 BASE CASE PERSPECTIVES AND LUP VIEWPOINTS.............................................................. 4
2 ECONOMIC DEVELOPMENT AND WELL BEING ................................................................. 8 2.1 ECONOMIC STRUCTURE...................................................................................................... 8 2.2 FORESTRY ....................................................................................................................... 10
2.2.1 Overview of Current Conditions .............................................................................. 10 2.2.2 Overview of HG/QCI Forest Industry Potential........................................................ 14 2.2.3 Assessment of HG/QCI LUP Impacts...................................................................... 21
2.3 MINING AND MINERAL EXPLORATION................................................................................. 37 2.3.1 Overview of Mining Sector on HG/QCI.................................................................... 37 2.3.2 Potential for Mineral Development on HG/QCI........................................................ 39 2.3.3 Impacts of the HG/QCI Land Use Plan Viewpoints on the Mineral Sector .............. 40
2.4 ENERGY........................................................................................................................... 47 2.4.1 Overview of Sector .................................................................................................. 47 2.4.2 Impact of Land Use Plan on Energy Sector ............................................................ 48
2.5 NON-TIMBER FOREST PRODUCTS, AGRICULTURE, TRAPPING AND COMMERCIAL FISHING ... 49 2.5.1 Non-Timber Forest Products ................................................................................... 49 2.5.2 Agriculture ............................................................................................................... 51 2.5.3 Trapping Sector....................................................................................................... 51 2.5.4 Commercial Fishing and Fish Processing ............................................................... 52
2.6 TOURISM AND OUTDOOR RECREATION.............................................................................. 53 2.6.1 Overview of HG/QCI Tourism Sector ...................................................................... 53 2.6.2 Tourism Potential and Issues .................................................................................. 55 2.6.3 Overview of Outdoor Public Recreation on HG/QCI................................................ 63 2.6.4 Overall Socio-Economic Impacts from Tourism and Recreation Sector.................. 65 2.6.5 Impact of HG/QCI Land Use Plan on the Tourism and Recreation Sectors............ 66
3 HAIDA LAND USE VISION.................................................................................................... 71
4 COMMUNITY SUSTAINABILITY........................................................................................... 74 4.1 OVERVIEW OF HG/QCI COMMUNITIES............................................................................... 74 4.2 IMPACTS OF LUP VIEWPOINTS ON COMMUNITIES .............................................................. 76
5 CONCLUSIONS TO SOCIO-ECONOMIC ASSESSMENT.................................................... 81 5.1 ECONOMIC WELL BEING ................................................................................................... 81 5.2 NET ECONOMIC VALUE AND GOVERNMENT REVENUES ...................................................... 82 5.3 COMMUNITY SUSTAINABILITY ............................................................................................ 84 5.4 HAIDA LAND USE VISION AND SPECIFIC HAIDA INTERESTS................................................. 84
Pierce Lefebvre Consulting
LIST OF TABLES Table 1 Key Elements of the SEA Scenarios ......................................................................... 6 Table 2 HG/QCI Harvest by Management Unit .................................................................... 11 Table 3 Impacts on Harvest Volume Potential for Each Management Scenario.................. 21 Table 4 Summary of Harvest Level Projections for Scenarios ............................................. 24 Table 5 Impacts of LUP Viewpoints on Forested Area Currently Accessible for Harvest .... 25 Table 6 Summary of Estimated Employment Impacts for Various HG/QCI Harvest Levels. 32 Table 7 Annual Impacts on Net Economic Value for Various HG/QCI Harvest Levels ........ 33 Table 8 Estimated Long Term Employment Impacts for Various HG/QCI Harvest Levels... 34 Table 9 Mineral ARIS Exploration Expenditures in HG/QCI, 1980 – 2004........................... 38 Table 10 Impacts of HG/QCI Land Use Plan Proposed Protected Areas on Mining Values.. 41 Table 11 Impacts of No-Mining Watersheds on HG/QCI Mining Values................................ 43 Table 12 Combined Impacts of LUP Viewpoints and Perspectives on the Mining Sector...... 45 Table 13 Summary of Impacts on Mining Sector.................................................................... 46 Table 14 Estimated Net Economic Value from Mushroom Harvest in Average Year............. 50 Table 15 HG/QCI Mushroom and Agricultural Land Reserve ................................................ 50 Table 16 Number of HG/QCI Tourism Activities/Services ...................................................... 55 Table 17 Socio-Economic Impacts of HG/QCI Sportfishing Lodges and Charters................. 59 Table 18 Socio-Economic Impacts from Adventure Operators and Gwaii Haanas ................ 61 Table 19 Hunting Effort by Guided Hunting Clients in HG/QCI .............................................. 62 Table 20 Summary of Socio-Economic Impacts from Tourism and Recreation Sector.......... 65 Table 21 Impact of Land Use Viewpoints on Scenic Areas in HG/QCI .................................. 67 Table 22 Impact of Land Use Plan Viewpoints on Recreational Values in HG/QCI............... 67 Table 23 Summary of Potential Short Term (First Decade) Population Impacts.................... 77 Table 24 Annual Average Direct PY of Employment By Sector and By LUP Option ............. 82 Table 25 Summary of Estimated Annual Net Economic Value by Sector .............................. 83 Table 26 Impacts on Annual Government Revenues from Resource Use on HG/QCI .......... 83 Table 27 List of HG/QCI Licenses for Timber Harvesting ...................................................... 86 Table 28 Total Employment Impacts (First Decade) and Key Assumptions .......................... 87 Table 29 Timber Harvest and Stumpage Revenues in HG/QCI, 1994-2004.......................... 88 Table 30 Harvest Billing System History by Invoice Date, 1998-2005 ................................... 89 Table 31 Total Net Economic Value from HG/QCI from Each Management Scenario .......... 90 Table 32 Composition of the Harvest for Each Management Scenario.................................. 90 Table 33 Viewpoints 1 and 2 Old Growth Retention Targets by Landscape Unit .................. 91 Table 34 Woodshed Impact Analysis ..................................................................................... 92 Table 35 Socio-Economic Impacts from Mining: the Huckleberry Mine Example .................. 95 Table 36 Key Parameters for Average Major Metal Mine in BC............................................. 96 Table 37 Public Recreation Days in HG/QCI ......................................................................... 97 Table 38 Hunting Effort in HG/QCI and Related Socio-Economic Impacts ............................ 98 Table 39 Angling Effort for HG/QCI........................................................................................ 99 Table 40 Expenditures and Net Economic Value per Recreation Day................................... 99 Table 41 Employment and Before Tax Income Dependency, 2001..................................... 100 Table 42 HG/QCI Population................................................................................................ 101 Table 43 School Enrolment for School District 50 (HG/QCI)................................................ 102
Pierce Lefebvre Consulting
LIST OF CHARTS Chart 1 Employment and Income Dependency on HG/QCI................................................... 9 Chart 2 HG/QCI Harvest Billing System Reported Volume.................................................. 10 Chart 3 HG/QCI Average Stumpage Revenues, 1993-2005................................................ 12 Chart 4 Average Log Prices for Coastal Species, 1992-2005.............................................. 13 Chart 5 HG/QCI Stumpage Rates and Average Coastal Log Prices (Current $/m3) ........... 14 Chart 6 HG/QCI Timber Harvest Volume Projections .......................................................... 23 Chart 7 Percentage of Harvest that is Old-Growth Timber for Each Scenario ..................... 26 Chart 8 Projected Harvest Composition in Decade 3, 5 and 7 for Each Scenario ............... 27 Chart 9 Mineral Potential of HG/QCI.................................................................................... 37 Chart 10 Selected Indicators of HG/QCI Mineral Potential as a Percentage of BC ............... 40 Chart 11 Origins and Leisure Activities of Visitors to HG/QCI, 2002 ..................................... 54 Chart 12 Percentage of Recreation User Days by Type of Activity for HG/QCI..................... 63 Chart 13 Selected Tourism and Recreation Activities in HG/QCI as a % of BC (2001/2002) 64 Chart 14 HG/QCI Population by Community, 1981 and 2001................................................ 75 Chart 15 Employment Dependencies for HG/QCI by Community, 2001................................ 78 Chart 16 HG/QCI School Enrolment, 2000/01 and 2004/05 .................................................. 79 LIST OF APPENDICES APPENDIX 1 FORESTRY ......................................................................................................... 85 APPENDIX 2 MINING................................................................................................................ 95 APPENDIX 3 TOURISM AND RECREATION ........................................................................... 97 APPENDIX 4 COMMUNITY SUSTAINABILITY....................................................................... 100 APPENDIX 5 GEOGRAPHIC INFORMATION SYSTEM (GIS) DATA..................................... 105 APPENDIX 6 LIST OF SELECTED REFERENCES................................................................ 109

Pierce Lefebvre Consulting
Executive Summary The Haida Gwaii / Queen Charlotte Islands (HG/QCI or “the Islands”) Community Planning Forum has adopted ecosystem-based management (EBM) as a framework for guiding future land and resource management on the Islands. Specific EBM goals agreed to in developing the Land Use Plan are to:
• protect, maintain and restore ecosystem integrity; • maintain spiritual and cultural values; • enhance sustainable economic opportunity within the inherent limits of the land to provide
opportunity; and • foster social and community wellbeing.
Two viewpoints for the strategic direction of land and resource management on HG/QCI, which share many elements of common agreement, have emerged from the planning process. The viewpoints arise as a result of those aspects of the Land Use Plan that were not agreed upon by the Community Planning Forum. LUP Viewpoint 1 generally provides for more extensive extractive resource development than LUP Viewpoint 2, while LUP Viewpoint 2 generally puts greater emphasis on conservation. In this socio-economic assessment (SEA) report, the two viewpoints are compared to two different base case perspectives, referred to as the Current Management scenario and the Current Reality scenario.
Current Management (AAC) ”Current Management” is defined as a baseline scenario that represents the current legislative framework for land and resource management. Consistent with the Ministry of Forests and Range (MOFR) Timber Supply Review (II) Process, timber harvest projection and ecological value modelling1 assumptions reflect current legal land designations for parks and protected areas and forest practice requirements mandated by the Forest Practices Code (FPC) and the Forest and Range Practices Act (FRPA). This scenario approximates current allowable annual cut levels on the Islands. It is referred to as “Base Case 2” in timber harvest projection and ecological value modelling reports. Current Reality (Actual Harvest) ”Current Reality” is an alternate baseline scenario that reflects management practices on the Islands that are incremental to Current Management, including those current practices that are not legally mandated. Timber harvest projection and ecological value modelling assumptions are consistent with the Current Management scenario, with three significant exceptions: • the protected landbase includes all 14 Haida Protected Areas, none of which are
treated as protected areas in the Current Management scenario; • a maximum harvest level of 600,000 m3/yr is applied to Tree Farm Licence
39, as opposed to the 1,150,000 m3/yr specified under the Current Management
1 Computer based landscape event simulation models developed specifically for HG/QCI by Cortex Consultants and Gowlland Technologies supported the HG/QCI land use planning process. These models provided perspective on maximum potential rates of timber harvest, and corresponding impacts on certain types of habitat supply, for various management regime scenarios.

Executive Summary
Pierce Lefebvre Consulting
ii
scenario; and • stand level retention requirements are increased by 20% over those applied in the
Current Management scenario. This Current Reality scenario approximates current actual harvest levels on the Islands. It is referred to as “Base Case 3c” in some timber harvest projection and ecological value modelling reports. LUP Viewpoint 1 “LUP Viewpoint 1” represents a Land Use Plan scenario defined by the consensus recommendations and the Viewpoint 1 recommendations identified in the January 2006 LUP Recommendations Report. LUP Viewpoint 2 “LUP Viewpoint 2” represents a Land Use Plan scenario defined by the consensus recommendations and the Viewpoint 2 recommendations identified in the January 2006 LUP Recommendations Report.
The purpose of this assessment is to analyse the social and economic implications of the two Land Use Plan viewpoints for HG/QCI. A separate ecological risk assessment (ERA) of the same two viewpoints, has been completed by Veridian Ecological Consulting2. Methodology and Assumptions The analysis was carried out in general accordance with the methods and requirements presented in the Ministry of Agriculture and Lands document titled Guidelines for Socio-Economic and Environmental Assessment (SEEA) (draft, 2006, available on request from ILMB). This assessment relies substantially on published information and public databases that describe relevant social and economic parameters on the Islands, and has not benefited from consultation with local stakeholders or the Haida Nation. Most of the research and analysis for this assessment occurred over a six-month period in 2005. The socio-economic impact assessment is supported by the HG/QCI landscape models developed by Cortex Consultants and Gowlland Technologies for the LUP process, and in particular, by projections of maximum achievable sustainable timber harvest levels under various management regimes (Cortex Consultants Inc. 2005).
2 Veridian Ecological Consulting Ltd. (Rachel F. Holt). March 2006. HG/QCI Land Use Viewpoints: Ecological Risk Assessment.

Executive Summary
Pierce Lefebvre Consulting
iii
SUMMARY OF RESULTS The following paragraphs summarize the findings for each major set of values, namely economic well being, community sustainability, and Haida Land Use Vision. Economic Well Being The HG/QCI Land Use Plan embodies an economic and social vision to diversify the private sector portion of the HG/QCI economy away from a high dependence on declining timber harvesting activity, toward a “new economy” relying more on local wood processing, various forms of tourism, and other small scale initiatives. The proponents of this vision expect that this new economy would be more supportive of “the Islands way of life”, and be more ecologically responsible. The two LUP viewpoints differ significantly in the degree of transition required to get to the “new economy”. With respect to timber harvesting, LUP Viewpoint 1 attempts to re-establish the forest industry on a firmer social and ecological footing, while restoring access to some of the timber resources that have been alienated from the industry through ongoing land use conflict. Viewpoint 2 envisions substantially reduced timber harvesting activity, and associated employment, that would be offset by increases in “new economy” activities. Mining has been a significant contributor to economic diversification in HG/QCI in the past, but land use conflict and ecological concerns are currently impeding exploration and development. Both LUP viewpoints attempt to provide more certain access to mineral resources, with more clearly defined local expectations as to how mineral development should proceed. LUP Viewpoint 2 would provide access for mineral exploration and development to a significantly smaller proportion of the most prospective mineral potential on HG/QCI than would LUP Viewpoint 1. The two LUP viewpoints do not differ appreciably in their provision for expansion of tourism and recreation activities. While LUP Viewpoint 2 would provide somewhat more protection of natural features on HG/QCI that support tourism and recreation, it would also prohibit bear hunting activity. The following table summarizes estimates of the local employment impacts that could result from each LUP viewpoint relative to the base case perspectives. As demonstrated in the table, the local employment provided through timber harvesting is very substantially greater than local employment from all other private sector activities combined (including allowance for potential future employment in local wood processing). Any significant loss of timber harvesting employment would require a very large expansion of other sectors to realize the Community Planning Forum’s stated objective of “no net job loss”.

Executive Summary
Pierce Lefebvre Consulting
iv
Annual Average Direct Employment By Sector and By LUP Viewpoint (PY)
Projections of Annual Average Direct Employment Held by Local Residents by
Sector
Current Management
(AAC)
Current Reality (Actual
Harvest)
LUP Viewpoint 1 LUP Viewpoint 2
Forest Sector (Decade 1) Based on projections of maximum sustainable timber harvest rates, given constraints prescribed by each scenario and MOFR harvest flow policies
730 (assuming log market,
social and environmental
constraints allow full timber harvesting
potential to be realized)
445 (may not be
sustainable without improvement to
current log market prices)
620 (assuming log market,
social and environmental constraints allow full timber harvesting potential to be
realized)
215 (assuming log markets
allow full timber harvesting potential to
be realized)
Sportfishing Lodges 75 75 75 (Unknown Impact)
75 (Unknown Impact)
Guided Hunting 5 5 5 0
Adventure Tourism/ Gwaii Haanas 35 35 35+ (Benefit)
35+ (Benefit)
Non-Timber Forest Products 25 25 25+ (Benefit)
25+ (Benefit)
Public Recreation N/A N/A N/A N/A
Total 870 585 760 350
Potential in Wood Processing Potential Employment from Additional Local Wood Processing/ Niche Product Manufacturing
25 25 25 25
Note: This table provides estimates of employment impacts based on assumed levels of timber harvest and impact coefficients per m3 of timber harvest; these calculated impacts have been rounded from those presented in the main text of the SEA, so as not to imply a degree of precision that does not exist. The 230 PY of local forest sector employment expected to be at risk in Decade 1 under LUP Viewpoint 2 (relative to the Current Reality Scenario) would require more than a doubling of activity in every other sector to offset the jobs at risk, and likely much more than a doubling to offset income at risk. We therefore consider it very unlikely that the employment gains in other sectors would completely offset the losses in the forestry sector, at least over the next decade or two, and LUP Viewpoint 2 appears to be a high-risk vision if local employment is key to economic wellbeing. LUP Viewpoint 1 may provide for higher local employment prospects in the forest sector, while providing at least as much expansion potential in other sectors as LUP Viewpoint 2. The risk of forest industry employment decline under LUP Viewpoint 2 would fall primarily on the HG/QCI communities that are more dependent on forestry such as Sandspit and Port Clements. Most of the gains in local employment through increased tourism activity are likely to be concentrated in the Haida communities of Skidegate and Old Massett and their neighbouring communities of Queen Charlotte City and Masset. These communities are already most strongly supported by the stabilizing influence of the public sector. From a net economic value perspective, the costs related to changes in forest industry and other industrial activity under each LUP viewpoint are balanced against benefits associated with maintaining or expanding recreation value, backcountry tourism, and botanical forest products.

Executive Summary
Pierce Lefebvre Consulting
v
Summary of Estimated Annual Net Economic Value by Sector
Annual Net Economic Value by Sector ($ million)
Current Management
(AAC)
Current Reality (Actual
Harvest)
LUP Viewpoint 1
LUP Viewpoint 2
Forest Sector (Decade 1) $35 $20 $30 $10
Sportfishing Lodges $5.80 $5.80 $5.80 (Unknown Impacts)
$5.80 (Unknown Impacts)
Guided Hunting $0.03 $0.03 $0.03 $0.00
Adventure Tourism/ Gwaii Haanas $0.30 $0.30 $0.30 + (Benefit)
$0.30 + (Benefit)
Non-Timber Forest Products $0.10 $0.10 $0.10 + (Benefit)
$0.10 + (Benefit)
Public Recreation $0.80 $0.80 $0.8 + (Benefit)
$0.8 + (Benefit)
Total $42 $27 $37 $17 Note: This table provides estimates of impacts based on assumed levels of timber harvest (assuming projected timber harvest potential is realized) and impact coefficients per m3 of timber harvest; these calculated impacts have been rounded from those presented in the main text of the SEA, so as not to imply a degree of precision that does not exist. The table indicates that the net economic value derived from land and resource based activities under LUP Viewpoint 2 could be less than half the level expected under LUP Viewpoint 1. The table also highlights that while sportfishing and adventure tourism bring significant economic activity to HG/QCI and the province, their contribution to the flow of net economic value from the HG/QCI area is relatively small, as sportfishing lodges, charters and adventure touring businesses pay little rent directly to government for the use of natural resources. The net economic value accounting is incomplete, however, as it does not include externalities arising from human activities including forestry, mining, and sportfishing. Concerns expressed by planning table representatives, as well as the environmental risk assessment for HG/QCI (Veridian Ecological Consulting Ltd. 2005), indicate that there are negative externalities associated with the current management of timber harvesting, sportfishing lodges and potential mining activities. The extent to which these negative externalities will be reduced by HG/QCI Land Use Plan management direction should be set against the raw net economic value cost implications presented in the above table. While we have been unable to quantify either the base case level of these externalities, or the extent of their potential reduction through LRMP initiatives, there is some expression of this reduction in the benefits noted to other sectors, interests, and environmental values. Community Sustainability Community capacity building, local empowerment, and stakeholder consensus (to the extent it was achieved) are key benefits of the planning process to HG/QCI communities. The impacts on community resilience are mixed, with benefits such as greater ecological integrity, greater economic diversity, greater local governance and maintenance of recreation values counterbalanced (and likely overshadowed in the case of LUP Viewpoint 2) by the costs associated with the jobs at risk. HG/QCI has a history of land use conflicts over the past two decades that have diminished forest and mining industry activity and contributed to economic decline on the Islands. The

Executive Summary
Pierce Lefebvre Consulting
vi
communities of Sandspit and Port Clements have been most affected by the curtailment of timber harvesting and mining activity. Some of the offsetting economic benefits expected from the creation of Gwaii Haanas National Park Reserve and Haida Heritage Site have not yet materialized, partly as a result of the need to preserve the wilderness nature of the Haida cultural sites. Placing half of the current forest industry jobs held by local residents at risk under LUP Viewpoint 2 indicates a high-risk scenario from a community stability perspective that could make worse the economic hardship currently experienced by some HG/QCI communities. Adopting LUP Viewpoint 1, without stakeholder consensus and the support of local communities, would diminish the positive social impacts one would expect to gain from a consensus land use plan. Haida Land Use Vision and Specific Haida Interests The following comments are based entirely on published expressions of Haida interests, and not on any interview, discussion, evaluation or assessment by Haida Nation representatives. The Haida Nation should benefit from LUP Viewpoints 1 and 2 through the protection of cultural heritage resources, as well as any incremental benefits to fish and wildlife populations, and culturally significant ecosystems. LUP Viewpoint 1 appears to improve on the Current Reality scenario in the management of cultural cedar, salmon habitat, black bear habitat, bird habitat and beaches. It does not improve management for culturally significant plants or bear hunting, and somewhat reduces the size of Haida Protected Areas relative to Current Reality. LUP Viewpoint 2 fully addresses important values cited in the Haida Land Use Vision, and provides enhancements to LUP Viewpoint 1 management for all important Haida values except beaches, where management would be similar under either viewpoint. LUP Viewpoint 1 is likely to lead to a higher level of industrial activity and local employment, in which Haida people can participate, than LUP Viewpoint 2. Conclusions: Both LUP Viewpoint 1 and LUP Viewpoint 2 better facilitate the Haida Land Use Vision than either the Current Management or Current Reality scenario, however LUP Viewpoint 2 provides a stronger reflection of the HLUV than LUP Viewpoint 1. The potential impacts of the LUP viewpoints on the economic development and well being indicators, as well as the community sustainability indicators are quite different between the two viewpoints. LUP Viewpoint 2 engenders a higher degree of risk to economic well being, and community sustainability as lost local employment potential in timber harvesting is unlikely to be completely offset by increased employment potential in other industries. LUP Viewpoint 1 is similar to LUP Viewpoint 2 in maintaining and providing for expansion of botanical forest products, tourism, and recreation activities, but with less curtailment of timber harvesting and mineral resource development potential. Relative to the Current Reality management scenario, LUP Viewpoint 1 appears to provide equal or better prospects for all values. The timber harvesting potential projected under LUP Viewpoint 1 may be difficult to achieve, however, if improvements to ecological integrity and adherence to

Executive Summary
Pierce Lefebvre Consulting
vii
the Haida Land Use Vision are not sufficient to provide local community endorsement of the projected levels of those activities. The following chart provides a rough characterisation of the socio-economic costs and benefits associated with the two Land Use Plan viewpoints.
Fore
stry
Min
ing
Agr
icul
ture
Ener
gy
Gui
ding
/Tra
ppin
g
Bota
nica
ls
Tour
ism
Recr
eatio
n
LUP Viewpoint 1 c c c c b b b b b b
LUP Viewpoint 2 C C c c C b b b c B
LUP Viewpoint 1 B b b b b b b b
LUP Viewpoint 2 C c c C b b b c B
Difference Between LUP Viewpoint 1 and LUP Viewpoint 2LUP Viewpt. 2 minus LUP Viewpt. 1 C c C C b
LUP Viewpt. 1 minus LUP Viewpt. 2 B b B B cC
omm
unity
Sus
tain
abili
ty
Hai
da L
and
Use
Vis
ion
Relat ive to Current Management (BC2)
Relat ive to Current Reality (BC3c)
Economic Dev. & Well Being
HG/ QCI LUP Socio- Econom ic I m pact
Assessm ent Sum m ary
Legend: c = small costs, C=moderate costs, C = significant costs; b = small benefits, B=moderate benefits, B = significant benefits. Where cells in the grid are left blank, no impacts are expected. Note: The columns in the chart are independent from one another in the sense that a significant benefit (B) to say the guide-outfitting sector is not necessarily of the same magnitude or social significance as a significant benefit (B) to the forest sector. The chart does not attempt to weight the relative value or significance of the different sectors, interests or values. The following tables summarize the estimated impacts of each management scenario on the socio-economic indicators used in this SEA.

Executive Summary
Pierce Lefebvre Consulting
viii
FOREST INDUSTRY
Summary of Forest Industry Potential and Socio-Economic Impacts
Current Management (AAC)
Current Reality (Actual Harvest) LUP Viewpoint 1 LUP Viewpoint 2
CURRENT SITUATION
Economic Contribution to HG/QCI
• Forest Industry on HG/QCI accounts for 36% of before-tax income and 28% of total basic employment (2001 data, 2001 timber harvest was 1.2 million m3 or 16% higher than 3 year average of 1 million m3).
• Public sector is the only sector on HG/QCI which employs more people than forestry.
Current AAC of HG/QCI is 1.8 million m3; last 10 year harvest
averages 1.3 million m3
2004 harvest was 1.0 million m3
Stumpage Rate
• 3 year average stumpage rate is $15.38 per m3 for HG/QCI. • In 2004, average stumpage was $6.78 per m3. • Trade disputes, the high C$/US$ exchange rate and higher
harvesting costs affect log prices and stumpage rates in HG/QCI.
Between 1998 and 2003, between 12% and 25% of
HG/QCI volume yields minimum stumpage rate of $0.25 per m3
In 2004/2005, 50% of HG/QCI timber yields minimum stumpage of
$0.25 per m3
POTENTIAL
Higher Harvest Levels
• Timber Harvesting Land Base (THLB) on HG/QCI accounts for 25% of the HG/QCI landbase and 30% of the forested landbase.
• Legislated protected areas (i.e. Gwaii Haanas, etc.) protect 21% of the HG/QCI forested lands.
• Non-Contributing Land Base (NCLB) has the potential to increase timber harvest if economic climate and/or harvest technology improve (NCLB is about 40% of the landbase).
Current harvest limited by conservation, land use conflicts, high harvesting costs and low
log prices. About 40% of HG/QCI forest
area is not protected but deemed inoperable – this could change
over time
One licensee, accounting for 24% of HG/QCI
harvest, reports harvesting 26% of his harvest in
NCLB (6% of total HG/QCI harvest)
Protecting part of NCLB impacts future harvest
potential
Protecting larger share of NCLB reduces future
harvest potential
Potential for More On-Island Processing
• Limited to niche products with the possibility of some log home manufacturing (although log home manufacturing has not developed despite support of now defunct Small Business Forest Enterprise Program.
• Wood processing is generally not viable on HG/QCI mainly due to lack of HG/QCI market for low grade logs, chips & by-products, high transport costs on finished products relative to logs, and high power costs (twice the rates on the mainland power grid).
HG/QCI wood processing limited to a few small manufacturers
May be opportunities for small niche products and possibly log home manufacturing
As per current reality
May be opportunities to manufacture for niche
markets, capitalizing on forest practices certification and
branding
Potential for More Jobs for Local Residents
• Local residents hold 60% of forest industry harvesting jobs, a higher % than the sportfishing, commercial fishing and non-timber forest products (NTFP) industries.
For many years, large tenure holders and contractors provided year round stable employment,
which encouraged employees to be local residents.
The more sporadic harvest and increasing trend
towards hiring contractors may be reducing the
proportion of employees who reside on HG/QCI
As per Current Management
Recommendations for increased local control of forest resources may or may not increase % of forest industry jobs held by local residents
Transition to 2nd growth Harvesting
• Transition to second growth harvesting has begun, and is expected to accelerate rapidly between 40 and 60 years from now.
• Concern about the marketability of second growth timber, and a potential reduction in associated harvesting jobs through more mechanized harvesting.
About 8.5% of harvest over the past several years has been from second growth stands,
mostly fire-established stands with a high value cedar
component.
Proportion of second growth harvest is expected to increase to about 15% over the next few years.
Model indicates that 2nd growth component can be less than 15% for 3 decades. Should not
have a significant impact on overall
harvesting employment coefficient.
Model indicates that 2nd growth component can be less than 20% for 3 decades. Should not
have a significant impact on overall
harvesting employment coefficient.

Executive Summary
Pierce Lefebvre Consulting
ix
Summary of Forest Industry Potential and Socio-Economic Impacts
Current Management (AAC)
Current Reality (Actual Harvest) LUP Viewpoint 1 LUP Viewpoint 2
LUP IMPACTS
Land Use Certainty
• Land use conflicts on HG/QCI have been a significant factor in the decline of timber harvest volumes in recent years.
• It is difficult to assess the relative land use “certainty benefits” associated with LUP Viewpoints 1 and 2 since neither viewpoint is a consensus agreement.
Has resulted in land use conflicts and prevented industry from
harvesting current AAC; In last 3 years, industry harvest
equals 55% of AAC
Operations curtailed awaiting resolution of land
use issues
May not be sufficient to deliver a locally endorsed “social
contract” for harvesting
May not be sufficient to support a viable forest
sector
Decade 1 Average Annual Timber Harvest (m3)
• 3 year average harvest is 1 million m3, partly a result of agreements to lower harvest in TFL 39 during land use planning process and partly due to less favourable log market conditions.
1,877,000 m3 (Current AAC; would likely
require improvement to current log market prices, and would conflict with key social and
environmental values)
1,142,000 m3 (may not be sustainable without improvement to
current log market prices)
1,600,000 m3 (would likely require
improvement to current log market prices, and may conflict with some
key social and environmental values)
549,000 m3 (would likely require
improvement to current log market prices)
Long Term Harvest (m3)
• A modest “falldown” from the Decade 1 potential harvest rate is required for the Current Management scenario, but not the Current Reality scenario.
1,607,000 m3 See note above
1,143,000 m3 See note above
1,407,000 m3 See note above
691,000 m3 See note above
Impact by Woodshed Class
Higher valued woodsheds outside existing legislated PAs • % Forested areas accessible for harvest • % THLB accessible for harvest
100% 100%
95% 91%
95% 97%
84% 84%
Lower valued woodsheds outside existing legislated PAs • % Forested areas accessible for harvest • % THLB accessible for harvest
100% 100%
61% 70%
66% 77%
57% 64%
% of Old Growth Harvest
• Much stricter old growth requirements under LUP Viewpoint 2 but lower overall rate of harvest allows limited old growth to be spread over time.
• Second growth has operational advantages (little decay, high volume stands with smaller piece-size, gentler slope terrain), but lower stand value as more rapidly growing, hence coarser grain.
• Second growth has recently represented 8.5% of total HG/QCI harvest (1999 to 2003), and is expected to increase to 15% in next few years.
Landscape model projects about 97% old growth available in
Decade 1
Above 80% for 4 decades
Landscape model projects about 97% old growth available in Decade 1
Above 80% for 3 decades,
and 70% for 4th and 5th decades
Landscape model projects about 97% old
growth available in Decade 1
Above 80% for 3
decades, down to 68% in the 4th decade and
25% in the 5th
Landscape model projects about 97% old
growth available in Decade 1
Above 80% for 3 decades, 60% in
Decade 4 and 20% in Decade 5
Harvesting Costs and Operability
• Off-Islands, an analysis of EBM practices and stand level retention has estimated that the impacts of these practices may result in weighted average cost increases of $5.58 per m3 for the Central Coast and $8.87 per m3 for the North Coast.
• HG/QCI LUP has no specific stand level retention guidelines; Increased landscape level retention may affect overall costs as less wood is available for the same unit cost of road development. Engineering costs may also increase to design and build around cedar, old growth, MAMU, and other landscape level reserve areas.
Harvesting practices more sensitive to other values are resulting in higher harvesting
costs
In 2004/2005, 50% of timber volumes yield
minimum stumpage of $0.25 per m3; low capacity to absorb higher harvesting
costs; variable retention practices may already be
influencing operability
Greater landscape level retention may result in
higher per unit harvesting costs than Current Management
Greater landscape level retention may result in
higher per unit harvesting costs than
LUP Viewpoint 1

Executive Summary
Pierce Lefebvre Consulting
x
Summary of Forest Industry Potential and Socio-Economic Impacts
Current Management (AAC)
Current Reality (Actual Harvest) LUP Viewpoint 1 LUP Viewpoint 2
Annual Decade 1 Employ-ment
• Direct PY in HG/QCI - Local Residents
730 PY (Decade 1) 285 PY more than Current Reality assuming harvest
potential realized
445 PY (Decade 1) similar to 2002-2004 average of 403 PY
(may not be sustainable without improvement to
current log market prices)
620 PY (Decade1) 175 PY more than
Current Reality assuming harvest potential realized
215 PY (Decade 1) or approx. half the
Current Reality employment, and 30%
of the jobs under Current Management
• Direct PY in HG/QCI - Non-Locals 415 PY 250 PY 355 PY 120 PY • Total BC Direct Employment Related to HG/QCI Forest Industry
(harvesting, processing & pulp and paper) 2,205 PY 1,345 PY 1,880 PY 645 PY
• Total BC Employment (HG/QCI, other BC areas, direct harvesting, processing, indirect and induced) . 4,330 PY 2,635 PY 3,690 PY 1,265 PY
Estimated Annual Stumpage Revenues ($ million)
• Assume stumpage rate of $15.38 per m3, the average between 2002-2004 for all viewpoints .
• Possible EBM impact on harvesting costs could eliminate some stumpage revenues.
$29 million (Decade 1) $18 million (Decade 1) $25 million (Decade 1)
does not consider possible costs of EBM
$8 million (Decade 1) does not consider
possible costs of EBM
Annual Net Economic Value (also referred to as economic rent)
• Net Economic Value assumes no rents to capital, labour rents of 5% of direct income and stumpage revenues as a proxy for public sector rents. Theoretically, the net economic value should be net of any external costs or ‘negative externalities’ imposed on other interests (e.g. environmental or social disturbances) but these are difficult to quantify.
• Challenge is for the mainstream industry to re-establish economic rent by rebuilding international markets for its products, containing timber harvesting costs while pursuing responsible sustainable harvesting practices.
$35 million (Decade 1) but likely to be negative externalities related to
environmental and social values
$20 million (Decade1) but likely to be some
externalities related to environmental and social
values
$30 million (Decade 1) but likely to be some
externalities related to environmental and
social values
$10 million (Decade 1) but likely to be fewer negative externalities than other scenarios
Note: This table provides estimates of impacts based on assumed levels of timber harvest and impact coefficients per m3 of timber harvest; these calculated impacts have been rounded from those presented in the main text of the SEA, so as not to imply a degree of precision that does not exist. MINERALS AND ENERGY
Summary of Current Situation/ Socio-Economic Impacts on Mining and Energy
Current Management (CM)
Current Reality (CR)
LUP Viewpoint 1 & LUP
Perspective 1
LUP Viewpoint 2 & LUP
Perspective 2 Plan Impacts on Mineral Resource: % of Landbase Accessible to Mining 78% 57% 60% 47%
% of Very High Metallic Mineral Potential Area Accessible to Mining 70%
HG/QCI holds 1.9% of BC’s very high mineral potential
61% 63% 50%
% of Very High Industrial Mineral Potential Area Accessible to Mining 79%
HG/QCI holds 4% of BC’s very high industrial mineral potential
58% 61% 49%
Executive Summary
Pierce Lefebvre Consulting
xi
Summary of Current Situation/ Socio-Economic Impacts on Mining and Energy
Current Management (CM)
Current Reality (CR)
LUP Viewpoint 1 & LUP
Perspective 1
LUP Viewpoint 2 & LUP
Perspective 2
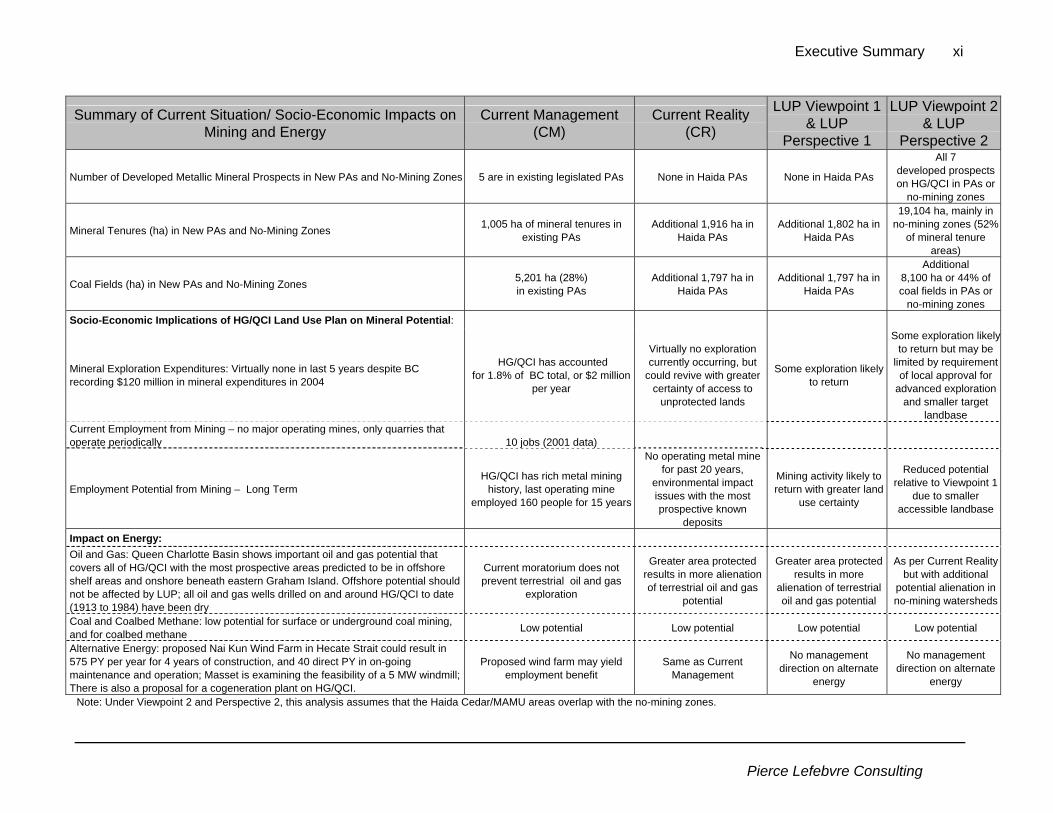
Number of Developed Metallic Mineral Prospects in New PAs and No-Mining Zones 5 are in existing legislated PAs None in Haida PAs None in Haida PAs
All 7 developed prospects on HG/QCI in PAs or
no-mining zones
Mineral Tenures (ha) in New PAs and No-Mining Zones 1,005 ha of mineral tenures in existing PAs
Additional 1,916 ha in Haida PAs
Additional 1,802 ha in Haida PAs
19,104 ha, mainly in no-mining zones (52%
of mineral tenure areas)
Coal Fields (ha) in New PAs and No-Mining Zones 5,201 ha (28%) in existing PAs
Additional 1,797 ha in Haida PAs
Additional 1,797 ha in Haida PAs
Additional 8,100 ha or 44% of coal fields in PAs or
no-mining zones Socio-Economic Implications of HG/QCI Land Use Plan on Mineral Potential:
Mineral Exploration Expenditures: Virtually none in last 5 years despite BC recording $120 million in mineral expenditures in 2004
HG/QCI has accounted for 1.8% of BC total, or $2 million
per year
Virtually no exploration currently occurring, but
could revive with greater certainty of access to
unprotected lands
Some exploration likely to return
Some exploration likely to return but may be
limited by requirement of local approval for
advanced exploration and smaller target
landbase Current Employment from Mining – no major operating mines, only quarries that operate periodically
10 jobs (2001 data)
Employment Potential from Mining – Long Term HG/QCI has rich metal mining
history, last operating mine employed 160 people for 15 years
No operating metal mine for past 20 years,
environmental impact issues with the most prospective known
deposits
Mining activity likely to return with greater land
use certainty
Reduced potential relative to Viewpoint 1
due to smaller accessible landbase
Impact on Energy: Oil and Gas: Queen Charlotte Basin shows important oil and gas potential that covers all of HG/QCI with the most prospective areas predicted to be in offshore shelf areas and onshore beneath eastern Graham Island. Offshore potential should not be affected by LUP; all oil and gas wells drilled on and around HG/QCI to date (1913 to 1984) have been dry
Current moratorium does not prevent terrestrial oil and gas
exploration
Greater area protected results in more alienation of terrestrial oil and gas
potential
Greater area protected results in more
alienation of terrestrial oil and gas potential
As per Current Reality but with additional
potential alienation in no-mining watersheds
Coal and Coalbed Methane: low potential for surface or underground coal mining, and for coalbed methane Low potential Low potential Low potential Low potential
Alternative Energy: proposed Nai Kun Wind Farm in Hecate Strait could result in 575 PY per year for 4 years of construction, and 40 direct PY in on-going maintenance and operation; Masset is examining the feasibility of a 5 MW windmill; There is also a proposal for a cogeneration plant on HG/QCI.
Proposed wind farm may yield employment benefit
Same as Current Management
No management direction on alternate
energy
No management direction on alternate
energy
Note: Under Viewpoint 2 and Perspective 2, this analysis assumes that the Haida Cedar/MAMU areas overlap with the no-mining zones.

Executive Summary
Pierce Lefebvre Consulting
xii
NON-TIMBER FOREST PRODUCTS (NTFP), AGRICULTURE, TRAPPING AND COMMERCIAL FISHING
Summary of Current Situation/ Socio-Economic Impacts on NTFP, Agriculture, Trapping and
Commercial Fishing Current Management Current Reality LUP Viewpoint 1 LUP Viewpoint 2
Non-Timber Forest Products: Between August and October, some 300 mushroom pickers (1/3 locals or approx. 25 PY of employment); annual net economic value of $0.1 million; future potential constrained by transportation costs to non-local markets and Haida concerns around further commercialization of culturally significant plants and berries.
Local HG/QCI residents hold 25 PY of employment
Local HG/QCI residents hold 25 PY of employment
Agreement to investigate measures to support mushroom harvesting areas and enhance productivity
Same as LUP Viewpoint 1
Agriculture: Provides seasonal direct employment and indirect employment to approximately 20 local residents and generates $0.1 million in before tax income mainly in the Tlell area; any significant growth beyond supplying local markets is limited due to high transportation costs to off-Islands markets. LUP viewpoints affect % of Agricultural Land Reserve (ALR) in protected areas (PAs):
10% of ALR in PAs 35% of ALR in PAs 27% of ALR in PAs 35% of ALR in PAs
Trapping: Trapping is a cultural activity for the Haida; there are 80 traplines that provide seasonal income to a number of residents. Seasonal employment
Seasonal employment (20 traplines have reported harvesting in last decade)
No specific management direction targeted at traplines but initiatives to maintain wildlife habitat may benefit marten and other fur bearing animals
Commercial Fishing and Fish Processing: In 2001, BC Stats reports 90 direct jobs in commercial fish harvesting and 45 in fish processing. Some evidence of employment decline in that sector since 2001. Most of commercial and sport fisheries depend on large non-local stocks from the Skeena and Nass rivers, and from Alaska; local stocks contribute to Haida subsistence fishery, freshwater sportfishing and some small portion of the ocean fishery. Declining salmon stocks limit growth of commercial fishing sector.
Forest and Range Practices Act provides management direction for riparian areas
Forest and Range Practices Act provides management direction for riparian areas
High degree of protection (67%) of hydroriparian ecosystems through protected areas and old growth reserve deployment.
Specific recommendations to protect hydroriparian ecosystems in all fish bearing watersheds; also includes the protection of six specific watersheds with high fisheries values from mining.
TOURISM AND RECREATION Summary of Current Situation/ Socio-Economic
Impacts on Tourism and Recreation Current Management Current Reality LUP Viewpoint 1 LUP Viewpoint 2
Plan Impacts:
Scenic Areas: Marine based activities dominate tourism & recreation; protection of scenic areas and viewscapes are most important along shoreline
25% of landbase (in addition to legislated PAs) is designated as scenic area requiring visual quality management
20% of scenic areas are in Haida PAs; this includes 53% of scenic areas with retention VQO (high level of visual quality management)
Virtually same as Current Reality
Slightly better than Current Reality due to Haida Cedar and MAMU zones protecting another 5% of scenic areas
Protected Areas: A large proportion of tourism and recreation activities occur in or near legislated PAs;
4% of fishing lodges, 45% of anchorages and 45% of trails are in or near protected areas
38% of fishing lodges, 69% of anchorages and 64% of trails are in or near protected areas
33% of fishing lodges, 69% of anchorages and 53% of trails are in or near protected areas
Virtually the same as Current Reality; 1.5% more trails are protected due to Haida Cedar & MAMU zones
Executive Summary
Pierce Lefebvre Consulting
xiii
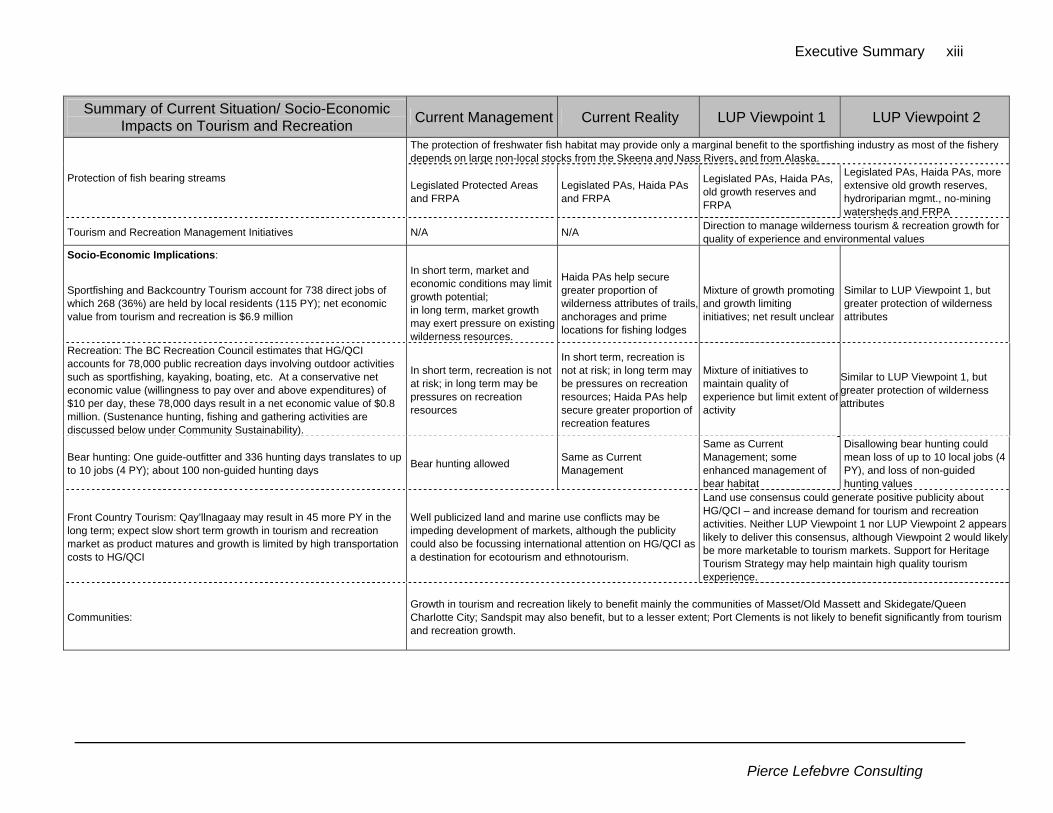
Summary of Current Situation/ Socio-Economic Impacts on Tourism and Recreation Current Management Current Reality LUP Viewpoint 1 LUP Viewpoint 2
The protection of freshwater fish habitat may provide only a marginal benefit to the sportfishing industry as most of the fishery depends on large non-local stocks from the Skeena and Nass Rivers, and from Alaska.
Protection of fish bearing streams Legislated Protected Areas and FRPA
Legislated PAs, Haida PAs and FRPA
Legislated PAs, Haida PAs, old growth reserves and FRPA
Legislated PAs, Haida PAs, more extensive old growth reserves, hydroriparian mgmt., no-mining watersheds and FRPA
Tourism and Recreation Management Initiatives N/A N/A Direction to manage wilderness tourism & recreation growth for quality of experience and environmental values
Socio-Economic Implications:
Sportfishing and Backcountry Tourism account for 738 direct jobs of which 268 (36%) are held by local residents (115 PY); net economic value from tourism and recreation is $6.9 million
In short term, market and economic conditions may limit growth potential; in long term, market growth may exert pressure on existing wilderness resources.
Haida PAs help secure greater proportion of wilderness attributes of trails, anchorages and prime locations for fishing lodges
Mixture of growth promoting and growth limiting initiatives; net result unclear
Similar to LUP Viewpoint 1, but greater protection of wilderness attributes
Recreation: The BC Recreation Council estimates that HG/QCI accounts for 78,000 public recreation days involving outdoor activities such as sportfishing, kayaking, boating, etc. At a conservative net economic value (willingness to pay over and above expenditures) of $10 per day, these 78,000 days result in a net economic value of $0.8 million. (Sustenance hunting, fishing and gathering activities are discussed below under Community Sustainability).
In short term, recreation is not at risk; in long term may be pressures on recreation resources
In short term, recreation is not at risk; in long term may be pressures on recreation resources; Haida PAs help secure greater proportion of recreation features
Mixture of initiatives to maintain quality of experience but limit extent of activity
Similar to LUP Viewpoint 1, but greater protection of wilderness attributes
Bear hunting: One guide-outfitter and 336 hunting days translates to up to 10 jobs (4 PY); about 100 non-guided hunting days Bear hunting allowed Same as Current
Management
Same as Current Management; some enhanced management of bear habitat
Disallowing bear hunting could mean loss of up to 10 local jobs (4 PY), and loss of non-guided hunting values
Front Country Tourism: Qay’llnagaay may result in 45 more PY in the long term; expect slow short term growth in tourism and recreation market as product matures and growth is limited by high transportation costs to HG/QCI
Well publicized land and marine use conflicts may be impeding development of markets, although the publicity could also be focussing international attention on HG/QCI as a destination for ecotourism and ethnotourism.
Land use consensus could generate positive publicity about HG/QCI – and increase demand for tourism and recreation activities. Neither LUP Viewpoint 1 nor LUP Viewpoint 2 appears likely to deliver this consensus, although Viewpoint 2 would likely be more marketable to tourism markets. Support for Heritage Tourism Strategy may help maintain high quality tourism experience.
Communities:
Growth in tourism and recreation likely to benefit mainly the communities of Masset/Old Massett and Skidegate/Queen Charlotte City; Sandspit may also benefit, but to a lesser extent; Port Clements is not likely to benefit significantly from tourism and recreation growth.

Executive Summary
Pierce Lefebvre Consulting
xiv
HAIDA LAND USE VISION
Key Haida Concern Concerns Current Management Current Reality LUP Viewpoint 1 LUP Viewpoint 2
Haida Protected Areas • The Haida have delineated important landscapes that are referred to as the “Haida Protected Areas”
None are officially legislated as protected areas by the
provincial or federal governments
All are defacto protected areas in short term
(harvest deferrals); total protected is 41.4% of
landbase
Protects all but a small portion of Haida Protected Areas – total protected is
38% of landbase
Protects all Haida Protected Areas and provincial study areas, which with legislated
areas add to 42% of landbase
Tsuuaay (cedar)
• Possible shortage of high quality cedar for cultural uses – e.g. canoes, poles and longhouses;
• Large population of introduced deer has impacted regeneration of cedar in harvested areas
• 19th century burn area between the lower Yakoun and Tlell rivers needs special consideration as future source of monumental cedar
CMTs protected by Conservation Heritage Act; free use permit system to
make cultural cedar available; district cedar strategy to
improve regeneration success
Same as Current Management, but with
additional cedar retention in HPAs
Current Reality plus old growth reserves for
possible supply of cultural use cedar
LUP Viewpoint 1 plus more old growth reserves, and
additional 2% of the landbase set aside for cedar areas;
commitment to further inventory and development of
cedar strategy
Tsiin (salmon)
• Particularly concerned with declining populations of sockeye salmon
• Historical damage to Ain River and Copper River watersheds has had a profound impact on salmon populations in those streams
• Other major salmon systems of concern include: Davidson, Naden, Awun, Mamin, Yakoun, Deena and Mathers
• Insufficient protection for small stream habitats or stream headwaters under current forest harvesting management
Hydroriparian ecosystem management through FPC
and FRPA
Current Management plus additional
hydroriparian protection in HPAs
Current Reality plus some additional protection through old growth
reserves
Current Reality plus specific additional hydroriparian
reserves; rate of cut management for watersheds;
no-mining watersheds
Taan (black bear)
• Rate of cutting of bear den trees, usually large cedar trees
• Second growth forests do not contain large standing cedar trees for bear dens
• Bear populations stressed by diminishing suitable habitat, deer browse of vegetation may be an issue
• Black bear sport hunting is increasing, and is disrespectful of creatures held to be relatives of the Haida people
Some habitat protection through FRPA; bear hunting
permitted
Some habitat protection through FRPA; bear
hunting permitted
Currently Reality plus some provisions for protection of
denning and shoreline habitat, and escape trees in
harvested areas
Same as Viewpoint 1 except bear hunting prohibited,
access management planning required, possibly higher
escape tree retention

Executive Summary
Pierce Lefebvre Consulting
xv
Key Haida Concern Concerns Current Management Current Reality LUP Viewpoint 1 LUP Viewpoint 2
Kil (plants)
• Little regard given by logging industry to special plants with medicinal powers and food values
• Commercialization of non-timber forest products a threat to traditional use
• Special concerns include medicinal plants that grow in old growth riparian forests such as devil’s club
No specific management for culturally important plants
No specific management for culturally important
plants
No specific management for culturally important
plants; introduced species recommendations may help
to limit current impacts to plants
Haida Cultural Value surveys; protect rare cultural and medicinal plants; plant
enclosures; commercial harvest of medicinal plants
and yew prohibited; introduced species
recommendations may help to limit current impacts to plants;
increased hydroriparian protection
Xiit’lit (birds) – specific concerns for marbled murrelet (MAMU), goshawks, saw whet owls and heron
• Special concern with birds that live in old growth forests
• Introduced species such as rats, raccoons, and squirrels pose a problem
• Tight canopy of mid-seral conifer forests not suitable habitat for many types of birds
• Birds of special concern include goshawks, marbled murrelet, heron and saw whet owls
• Shoreline birds such as falcons and eagles appear to be still high in numbers
MAMU and goshawks receive protection as red-listed
species; designated Wildlife Habitat Areas (WHAs);
protection limited to 2 WHAs for each species in addition to
PAs and OGMAs
MAMU and goshawks receive protection as red-listed species; designated Wildlife Habitat Areas – protection limited to 2
WHAs for each species, in addition to HPAs, PAs
and OGMAs
Increased protection of MAMU habitat over current management in PAs and
old growth reserves; increased protection of goshawk nest sites (all known are protected); develop strategies to maintain and restore
habitat for red and blue-listed species
Increased MAMU protection: all HLUV MAMU zones, and
all highly suitable MAMU habitat plus 70% of
moderately suitable habitat; 1% of the landbase is set
aside for Haida MAMU areas; retain known and potentially suitable goshawk nest areas
and reserve all highly suitable foraging habitat; protection of Haida identified known saw-
whet owl and blue heron nests
Sk’waii (beach)
• Beaches are of concern as they are vulnerable to pollution from human sewage, oil, seepage from mining sites
• Log dumps cause environmental damage in sheltered bays
• Concern that streams that have been heavily logged and damaged by landslides and erosion result in more silt and gravel being washed out of stream channels into the sea
Legislated PAs and UREPs Current Management plus Haida Protected
Areas;
Current Reality plus 50 metre reserve buffer on
coastal shorelines; restrictions on fishing or other lodge development
Current Reality plus 50 metre reserve buffer on coastal shorelines; restrictions on
fishing or other lodge development
Socio-Economic Concerns
• There is room for forestry and other commercial activities but they must be sustainable and managed with more respect and greater responsibility for other values
• The HLUV recognizes that the economic component of the plan is incomplete
Damage to traditional Haida lifestyle, cultural and
sustenance resource base, combined with frustration
over lack of participation in economic development associated with HG/QCI resource development
Greater protection of traditional Haida values
than Current Management, but less
industrial activity in which to potentially participate
Similar protection of Haida traditional values as Current Reality, but
somewhat more industrial activity in which to
potentially participate
Extensive protection of traditional Haida values, but
substantially reduced industrial activity in which to
potentially participate

Executive Summary
Pierce Lefebvre Consulting
xvi
IMPACTS OF ESTIMATED CHANGES IN FOREST INDUSTRY EMPLOYMENT ON HG/QCI POPULATION Summary of Potential Short Term (First Decade) Population Impacts from HG/QCI Timber Harvesting
Current Management Current Reality Viewpoint 1 Viewpoint 2
Total Potential Timber Harvest (m3) (Decade 1) 1,877,000 1,142,000 1,600,000 549,000
(would likely require improvement to current log market prices, and would
conflict with some key social and environmental values)
(may not be sustainable without improvement to current log
market prices)
(would likely require improvement to current log
market prices, and may conflict with some key social and
environmental values)
(would likely require improvement to current log
market prices)
HG/QCI Employment (PY to Local Residents): Direct 730 445 620 215 Indirect & Induced 275 170 235 80 Total 1,005 615 855 295
Population Impacts 1,795 1,090 1,530 525
Change Over Current Reality Base Case +705
(assuming timber harvest potential realized)
0 (assuming timber harvest
potential realized)
+440 (assuming timber harvest
potential realized)
-565 (assuming timber harvest
potential realized) % of Total 2004 Population +13% 0% +8% -11% Note: This table provides estimates of impacts based on assumed levels of timber harvest and impact coefficients per m3 of timber harvest; these calculated impacts have been rounded from those presented in the main text of the SEA, so as not to imply a degree of precision that does not exist. COMMUNITY SUSTAINABILITY Indicators Comments Impacts for Each Option Current Management Current Reality LUP Viewpoint 1 LUP Viewpoint 2
Governance (Level of local control, stakeholder communication and consensus)
• Stakeholder /local Islands consensus is not currently achieved.
• HG/QCI LUP suggests the establishment of a HG/QCI Board/Committee to continue to discuss and monitor land use plan objectives
Prevailing sense of alienation from significant resource use decisions
Establish the HG/QCI Land Use Board/ Committee to provide input into decision making; Level of consensus on LUP not likely strong enough to significantly reduce sense of alienation
Establish the HG/QCI Board/ Committee to make decisions on the use of local resources; would likely require legislative changes Would likely significantly reduce sense of governance alienation

Executive Summary
Pierce Lefebvre Consulting
xvii
Indicators Comments Impacts for Each Option Current Management Current Reality LUP Viewpoint 1 LUP Viewpoint 2
Community Resiliency (Population by community, Haida population, % of jobs held by local residents and school enrolment)
• In the last 25 years, the HG/QCI population has fluctuated between 5,000 and 5,700 people; 5,200 people currently reside in HG/QCI.
• The larger communities of Masset/Old
Massett and Queen Charlotte City/Skidegate are most resilient; Port Clements and Sandspit are smaller and less resilient.
• HG/QCI communities have adjusted to
change, but not without significant hardship. • Masset is surviving the closure of the
Canadian military base, but its population has dropped by 41% since 1981 and it has benefited from important government support.
• Sandspit has also suffered a 42% decline in
population drop largely as a result of the creation of Gwaii Haanas.
Port Clements and Sandspit each have declining populations, currently at approximately 400 and 500 people, and they are the most likely to benefit from a strengthening of the forest sector.
Port Clements and Sandspit are struggling to retain services expected in a fully functioning community; for example, student enrolment has been declining at the local schools in each of these two communities.
Port Clements and Sandspit have the most to gain from LUP Viewpoint 1 as they are currently most at risk; all communities would likely benefit from increased economic activity
LUP Viewpoint 2 is likely to negatively impact Port Clements and to a lesser extent, Sandspit, the two communities that are the least resilient. The other communities are larger, more diversified and more resilient, but all will likely suffer, as only a small part of negative employment and income impacts from LUP Viewpoint 2 are likely to be offset by gains in tourism and other sectors.
Economic Diversification (employment by sector, incidence of low income, access to growth opportunities for human settlements)
• In the last 25 years, HG/QCI has become less diversified with the loss of the Canadian Forces Base and the decline in mining and commercial fishing.
• Tourism and sportfishing provide a growing
contribution to diversification but proportion of jobs held by local residents is low.
• Maintaining the industrial base (forestry and
mining) offer an opportunity to enhance diversification, particularly if future development is managed for no, or very limited cost to tourism growth.
Reaching harvest levels equal to AAC would result in major socio-economic benefits, and restore some of the prosperity that prevailed on HG/QCI in late 1980s; however, there is major uncertainty regarding ability of forest sector to reach these harvest levels without improvements to log markets and major social and political unrest.
Deferral of timber harvest pending a land use plan and uncertainty regarding landbase accessible to mining is deterring development.
Could revitalize forest industry but would likely require improvement to current log market prices, and may conflict with some key social and environmental values; Restoring accessibility to mining industry of HG/QCI landbase outside PAs may restore mineral exploration and development; LUP Viewpoint 1 likely to be sufficient to support development of tourism and recreation sector, as well as other elements of diversification strategy such as Non-Timber Forest Products.
More constraints on forest and mining industry likely to result in less diversification than under LUP Viewpoint 1; Benefit to tourism unlikely to offset forest industry losses; adoption of EBM will benefit research funding, but local impacts may be limited.

Executive Summary
Pierce Lefebvre Consulting
xviii
Indicators Comments Impacts for Each Option Current Management Current Reality LUP Viewpoint 1 LUP Viewpoint 2
Quality of Life (Recreation opportunities, viewscapes, water quality and air quality)
• Recreation opportunities, scenic viewscapes, water quality and air quality in HG/QCI are not currently at risk, but the Land Use Plan is likely to add certainty to the protection of those values.
Limited or no impact in short term, but in longer term, quality of life may deteriorate as recreation opportunities and water quality could be compromised
Similar to Current Management, although many recreation areas, viewscapes and beaches are in Haida Protected Areas
Similar to Current Reality but with additional shoreline protection, and restrictions on fishing lodge development in areas of high recreational value or cultural significance
Similar to LUP Viewpoint 1, but likely to add certainty regarding protection of recreation values, scenic viewscapes and water quality.
• Gwaii Haanas and Naikoon Park protect important heritage sites; Haida Protected Areas are assumed to preserve important cultural and archaeological values.
Protection of cultural and historical values is limited to Gwaii Haanas and Naikoon Park, and Heritage Conservation Act; local agreement on CMTs
Haida Protected Areas are assumed to preserve many significant cultural and archaeological values
Haida Protected Areas somewhat reduced (parts of DuuGussd, and Tlell areas).
Haida Protected Areas, as well as Cedar and MAMU areas will preserve cultural and archaeological values Cultural/historical and
archaeological issues (cultural cedar protection, local access to food gathering/botanical forest products, fishing and hunting)
• Concern that local agreement for access to monumental cedar not sufficient in long run
• Little regard for botanical forest products in timber harvesting plans
Limited risk in the short term to local access to food gathering, botanical forest products and fishing and hunting populations; in long term, more of those values may be at risk
Limited risk in the short term to local access to food gathering, botanical forest products and fishing and hunting populations; in long term, more of those values may be at risk
Mushroom management zones and other botanical forest product management initiatives may provide added certainty to NTFP related activities
Enhanced management of riparian areas and watersheds likely to help protect long term fishing values; low harvest rates likely to preserve food gathering sites and botanical forest products sites; protection of cultural plants from commercial harvest

Pierce Lefebvre Consulting
1
1 Introduction The purpose of this Socio-Economic Assessment (SEA) is to analyse the social and economic implications of two Land Use Plan (LUP) viewpoints for Haida Gwaii / Queen Charlotte Islands (HG/QCI). These two viewpoints result from the HG/QCI LUP Community Planning Forum process, a 17 month consensus seeking planning forum, which attempted to develop a strategic land use plan which could be endorsed and supported by all represented interests. This process ended in February 2005, with substantial agreement on many land and resource management issues, but with differing viewpoints and perspectives that were unable to be reconciled on several significant components of a comprehensive land use plan package. This socio-economic assessment was requested by the Integrated Land Management Bureau, BC Ministry of Agriculture and Lands, to help provide an understanding of the potential social and economic impacts of proposed agreements and alternate viewpoints resulting from the HG/QCI Community Planning Forum process. The agreements, viewpoints and perspectives are summarized in the January 2006 HG/QCI Land Use Plan Recommendations Report, prepared by the HG/QCI LUP Process Management Team. In general, the viewpoints and perspectives on issues where no agreement was reached are labelled as “Viewpoint 1” and “Viewpoint 2” or “Perspective 1” and “Perspective 2” for the purpose of consolidating the agreements and viewpoints into two comprehensive land use plan scenarios.
1.1 Project Methodology The methodology for this project is largely consistent with the methods and requirements presented in the Ministry of Agriculture and Lands document titled Guidelines for Socio-Economic and Environmental Assessment (SEEA) (draft, 2006). (BC MSRM. 2003) The key indicators include: • Economic Well Being (local and provincial) – Expected economic activity by sector including
indicators such as number of existing jobs, potential number of direct jobs, indirect and induced jobs, income etc.
• Net Economic Value by sector (mainly provincial) –
For commercial sectors, the net economic value (or economic rent) represents the above-normal financial returns from a commercial activity that occur as a result of the product or service generated by that activity being in relatively fixed supply relative to demand. Rent can accrue to the entrepreneur, be captured by the land and/or resource owner (government) or be incorporated in wages paid to labour.
As noted in the 2003 Guiding Principles, relying solely on easily identified government resource tax revenues to compare the Net Benefits from various commercial sectors likely leads to an underestimate of the Net Benefits of sectors characterized by a large number of small producers, for example the tourism sector. If no other data are available, a more equitable and practical approach may be to add a conservative proportion (say 5%) of
Pierce Lefebvre Consulting
2
gross sales revenue and total wage costs to government resource tax revenues to calculate the Total Net Benefit of a commercial sector. (BC MSRM. 2003. pages 6 and 7)
For non-commercial activities such as recreation and the benefits associated with
environmental resources, the net benefits fall into two categories: use-related values (e.g. recreation, food gathering, air and fresh water) and existence-related values.
Net economic value estimates should be net of any external costs or ‘negative
externalities’ imposed on third parties (e.g. environmental or social disturbances). Externalities are difficult to value, but may be significant.
• Community Sustainability (mainly local) – Expected social impacts on population, income
levels, community governance, community resiliency and economic diversification and stability.
• Haida Land Use Vision and Specific Haida Nation concerns – Specific Haida Nation concerns
as reported in the Haida Land Use Vision. (Council of Haida Nation. 2004) Information has been gathered from the following data sources: • review of existing studies; a list of selected references is included as an Appendix at the end
of this report; • collection of data from public sources; and • review of Geographic Information System (GIS) data prepared by the British Columbia
Integrated Land Management Bureau (ILMB), Coast Region. This analysis overlays various resource values and activities (e.g. timber harvesting land base, mineral potential, tourism uses, Haida values, etc.) with the boundaries of the areas subject to specific resource management direction (e.g. Protected Areas, No Mining Zones, etc.).
The SEA has been completed without consulting the Haida Nation or local stakeholders, although forest licensees were contacted as part of a recent project to prepare timber harvesting employment coefficients for HG/QCI. Consultants have also been in contact with provincial government representatives regarding various socio-economic and environmental values. Most of the research and analysis for this assessment occurred over a six month period in 2005. The SEA does not present specific LUP targets against which plan implementation may be evaluated. Some of the indicators used in the SEA, however, may be useful to evaluate plan implementation. The HG/QCI Land Use Plan Recommendations Report includes an important economic diversification strategy. Where possible, the analysis of potential LUP impacts on each sector draws on the various studies that have been completed for HG/QCI to comment on specific opportunities such as second growth timber harvesting, botanical forest products and sportfishing lodges.

Pierce Lefebvre Consulting
3
1.2 Brief Overview of Recent Land Use Conflicts on HG/QCI There has been a long history of conservation initiatives on HG/QCI, which formally started with the creation of Naikoon Provincial Park in 1973. At approximately the same time, members of the Haida Nation and conservationists proposed the protection of the South Moresby area. With the continuation of logging in that region, however, land use conflicts in HG/QCI escalated, and in 1985, culminated in the Haida Nation and their supporters peacefully blockading logging roads to the Windy Bay watershed on Lyell Island. In 1985 the Haida Nation designated South Moresby as a Haida Heritage Site, and in 1988 the governments of BC and Canada signed the South Moresby Agreement, thereby designating the area as a National Park Reserve. In 1993, the Gwaii Haanas Agreement was signed, setting out the terms of co-operative management between the Haida Nation and the Government of Canada. The agreement includes support for the Haida Gwaii Watchmen program established in 1981 by the Skidegate Band Council and the Haida Nation to provide guardians for the main historical Haida village sites in the South Moresby Area, thereby addressing concerns about the potential for vandalism and other damage. (Parks Canada web site, accessed July 7th, 2005, www.pc.gc.ca/pn-np/bc/gwaiihaanas/edu/index_e.asp) Land use issues and conflicts have persisted after the establishment of Naikoon Provincial Park, and Gwaii Haanas as HG/QCI has continued to attract international attention for its environmental and cultural values. Key concerns of local residents related to land use and resource extraction (primarily timber) have included: • proportion of local resource related jobs going to off-Islands residents; • declining timber harvesting employment resulting from the use of mechanized equipment; • lack of on-island resource processing facilities; • lack of local control of resources; and • rate of timber harvest that is viewed by many residents as being unsustainable. The Haida Nation has many of the same concerns as local residents in general, but also has the following additional concerns: • protection of areas of special importance for cultural and social reasons, known has the Haida
Protected Areas; • protection of riparian areas and fishing resources; and • safeguarding cedar for traditional uses. In the last 25 years, various land use processes have been established to try to resolve these issues. These have included the South Moresby Planning Table, the Island Community Stability Initiative and the Tlell Local Resource Use Planning Process. In March 2003 the Province and the Haida Nation signed an agreement to jointly develop a Land Use Plan for the Islands, and to co-manage a multi-stakeholder Community Planning Forum (CPF) process tasked with providing recommendations for a Land Use Plan. In February 2005 the final CPF meeting was held, and agreement was reached on some but not all aspects of a plan. The January 2006 HG/QCI LUP Recommendations Report includes consensus recommendations as well as viewpoints on issues where agreement was not reached.

Pierce Lefebvre Consulting
4
On March 22, 2005, the Haida Nation and other local residents set up a blockade of two public roads on Graham Island thereby blockading access to Weyerhaeuser operations and the BC Forest Service offices citing several issues, including the interim protection of areas identified in the Haida Land Use Vision until a final Land Use Plan agreement is reached. On May 11th, 2005, the blockade was suspended following development of a memorandum of understanding between the Haida Nation and the BC Government. The agreement commits the government and the Haida to complete and implement a land use plan, building upon the work completed by the Community Planning Forum. This SEA report provides a socio-economic assessment of two Land Use Plan viewpoints that are based on Community Planning Forum recommendations. (HG/QCI LUP Process Management Team. January 2006. HG/QCI Land Use Plan Recommendations Report).
1.3 Base Case Perspectives and LUP Viewpoints The 2003 MSRM Guiding Principles for conducting socio-economic assessments state, “In most cases, the benchmark scenario should essentially be the “status quo” including any recent regulations, and assuming that external factors such as commodity prices, regulatory policy and treaty negotiations follow pre-determined trends or remain the same”. 3 The economic, social and political situation on HG/QCI makes it difficult to determine what represents the status quo. As a result, this SEA reviews four scenarios, which include a ”Current Management” base case, a ”Current Reality” base case and two land use viewpoints , referred to as “LUP Viewpoint 1” and “LUP Viewpoint 2”.
Current Management ”Current Management” is a baseline scenario that is defined by the current legislative framework for land and resource management. Consistent with the MOFR Timber Supply Review (II) process, timber harvest projection and ecological value modelling4 assumptions reflect current legal land designations for parks and protected areas and forest practice requirements mandated by the Forest Practices Code (FPC) and the Forest and Range Practices Act (FRPA). This scenario is referred to as “Base Case 2” in some timber harvest projection and ecological value modelling reports. Current Reality ”Current Reality” is an alternate baseline scenario that reflects management practices on the Islands that are incremental to Current Management, including those current practices that are not legally mandated. Timber harvest projection and ecological value modelling assumptions are consistent with the Current Management scenario, with three significant exceptions:
3 BC Ministry of Sustainable Resource Management, Socio-Economic and Environmental Assessment for Land and Resource Management Planning in British Columbia: Guiding Principles, 2003. page 3. 4 Computer based landscape event simulation models developed specifically for HG/QCI by Cortex Consultants and Gowlland Technologies supported the HG/QCI land use planning process. These models provided perspective on maximum potential rates of timber harvest, and corresponding impacts on certain types of habitat supply, for various management regime scenarios.
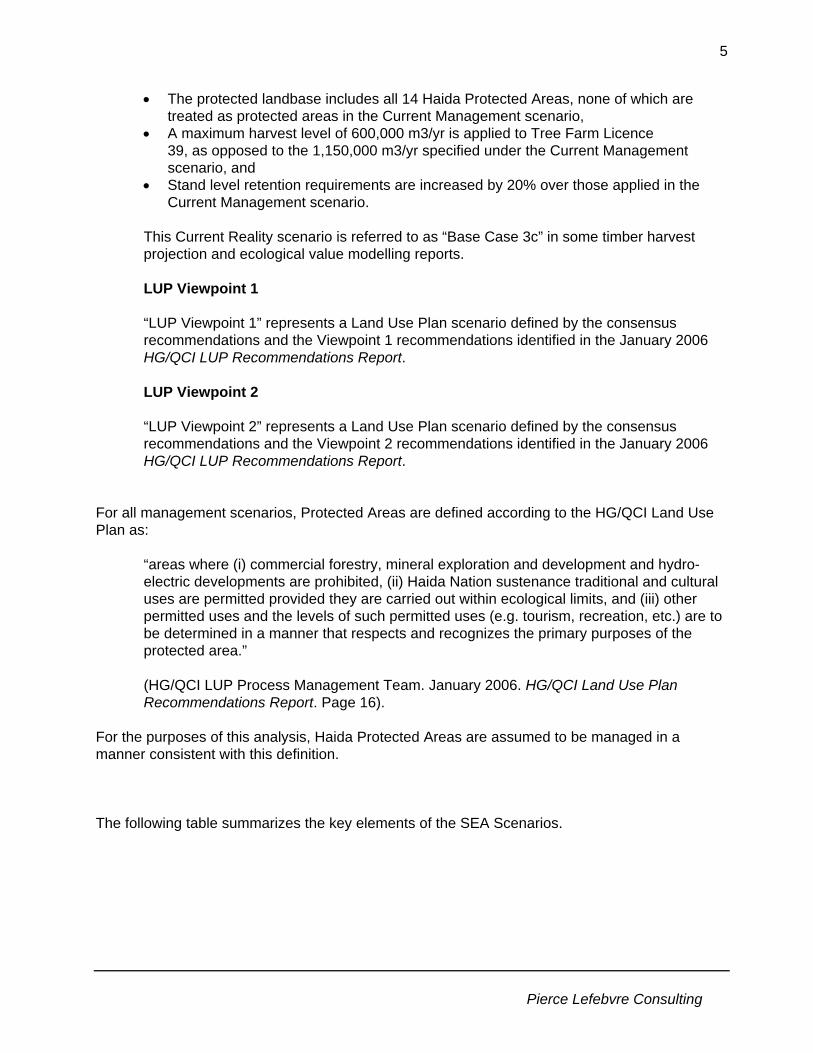
Pierce Lefebvre Consulting
5
• The protected landbase includes all 14 Haida Protected Areas, none of which are treated as protected areas in the Current Management scenario,
• A maximum harvest level of 600,000 m3/yr is applied to Tree Farm Licence 39, as opposed to the 1,150,000 m3/yr specified under the Current Management scenario, and
• Stand level retention requirements are increased by 20% over those applied in the Current Management scenario.
This Current Reality scenario is referred to as “Base Case 3c” in some timber harvest projection and ecological value modelling reports.
LUP Viewpoint 1 “LUP Viewpoint 1” represents a Land Use Plan scenario defined by the consensus recommendations and the Viewpoint 1 recommendations identified in the January 2006 HG/QCI LUP Recommendations Report. LUP Viewpoint 2 “LUP Viewpoint 2” represents a Land Use Plan scenario defined by the consensus recommendations and the Viewpoint 2 recommendations identified in the January 2006 HG/QCI LUP Recommendations Report.
For all management scenarios, Protected Areas are defined according to the HG/QCI Land Use Plan as:
“areas where (i) commercial forestry, mineral exploration and development and hydro-electric developments are prohibited, (ii) Haida Nation sustenance traditional and cultural uses are permitted provided they are carried out within ecological limits, and (iii) other permitted uses and the levels of such permitted uses (e.g. tourism, recreation, etc.) are to be determined in a manner that respects and recognizes the primary purposes of the protected area.” (HG/QCI LUP Process Management Team. January 2006. HG/QCI Land Use Plan Recommendations Report. Page 16).
For the purposes of this analysis, Haida Protected Areas are assumed to be managed in a manner consistent with this definition.
The following table summarizes the key elements of the SEA Scenarios.

Pierce Lefebvre Consulting
6
Table 1 Key Elements of the SEA Scenarios
Value Current Management
Current Reality LUP Viewpoint 1 LUP Viewpoint 2
Protected Areas
Legislated PAs only (Gwaii Haanas, Naikoon, VK)
Existing legislated Areas and Haida Protected Areas
All HPAs except for a. Tlell (EBM area) b. Parts of DuuGuusd (EBM Area)
All Haida Protected Areas and Provincial Study Areas
Protected Areas as a % of Total Land Area
22.4% 41.4% 37.7% 42%
(excludes Haida LUV cedar & Marbled Murrelet areas)
Old Growth Retention / Coarse Filter
As per old growth policy / order =13-28% by BEO and LU/BEC =1/3 target today (4%) for low BEO’s
Same as Current Management
Limit amount of harvest from TFL 39 to 600,000 m3/ yr.
Stand level retention increased by 20%
Min. 20% retention each AU x BEC island wide LU targets as per table on Viewpoint 1 old growth
retention targets by landscape unit in Appendix 1
Min. 70% retention each AU x BEC, island-wide Min. 30, 50, 70% by LU as specified in Table on
Viewpoint 2 old growth retention targets by landscape unit in Appendix 1.
Must retain all current old to meet targets today. Second growth recruitment can be phased in overtime, full % must be reserved in 250 years
Riparian Management Assumptions
As per FPC/FRPA riparian reserves
Same as Current Management
As per Current Management 50 metre reserve all shorelines
80 metre reserves on S1-S5 streams 80 metre reserves on lakes, wetlands and
shorelines
Watershed Management
Terrain class 4 = 40% out; Terrain class 5 = 90% out
Same as Current Management
As per Current Management
Reserve all class 4 and 5 terrain Rate of cut = Max. 20% of forested area over 20
years MAMU No specific MAMU
assumptions (addressed by PAs and Old growth)
Same as Current Management
Addressed by Protected Areas and Old Growth Reserve all Class 1 habitat and HLUV areas Reserve 70% Class 2 habitat Include Class 3 habitat in OGMA’s within targets
for old forest retention Goshawk 2 Goshawk WHA’s
removed from THLB. Same as Current
Management Reserve known goshawk nest areas (200 ha) Reserve known and predicted goshawk nest areas
(200 ha) and highly suitable foraging Cedar
No specific cedar assumptions
Same as Current Management
Addressed through Protected Area and Old Growth Assumptions
Reserve all HLUV cedar zones
Visual Quality Known Scenic Areas and associated VQO’s
Same as Current Management
Scenic Areas as per VLI (slight increase over Current Management Case)
Same as Viewpoint 1
Black Bear Habitat
No specific assumptions
Same as Current Management
Agreement on most black bear recommendations. Timber supply impacts addressed by assumptions for old growth, stand level biodiversity and riparian management.
Bear hunting viewpoints have implications for
Same as Viewpoint 1, except that bear hunting is not permitted under Viewpoint 2
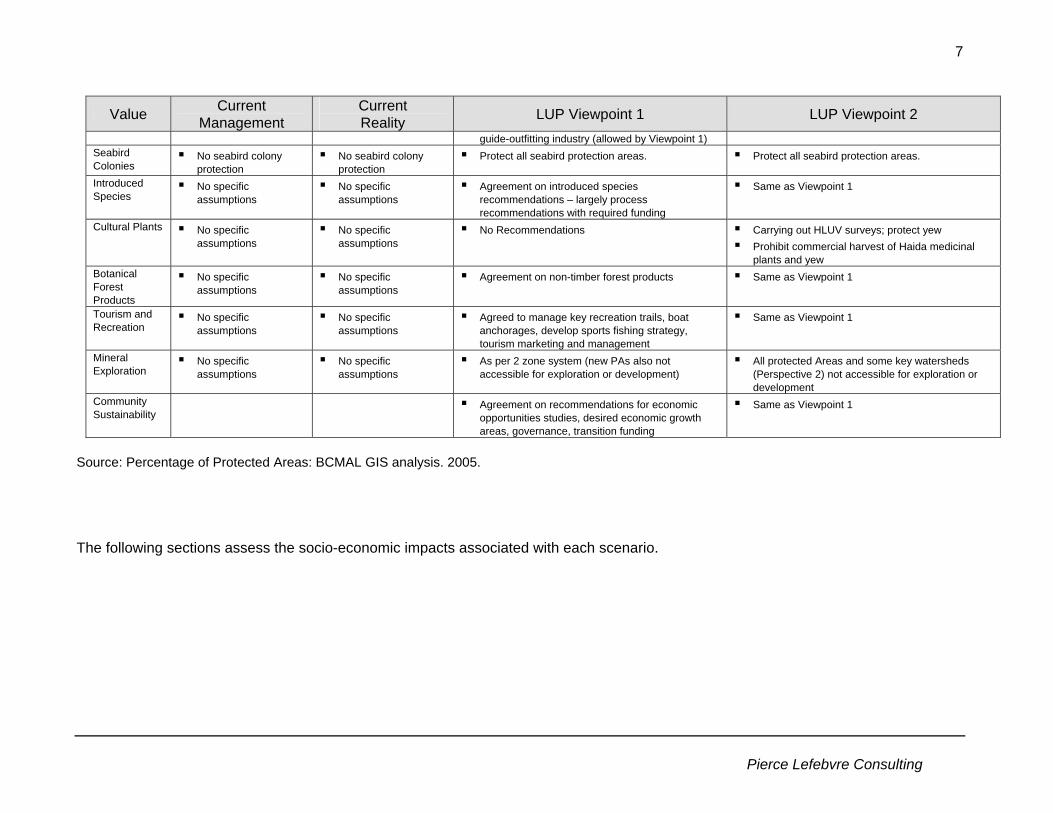
Pierce Lefebvre Consulting
7
Value Current Management
Current Reality LUP Viewpoint 1 LUP Viewpoint 2
guide-outfitting industry (allowed by Viewpoint 1) Seabird Colonies
No seabird colony protection
No seabird colony protection
Protect all seabird protection areas. Protect all seabird protection areas.
Introduced Species
No specific assumptions
No specific assumptions
Agreement on introduced species recommendations – largely process recommendations with required funding
Same as Viewpoint 1
Cultural Plants No specific assumptions
No specific assumptions
No Recommendations Carrying out HLUV surveys; protect yew Prohibit commercial harvest of Haida medicinal
plants and yew Botanical Forest Products
No specific assumptions
No specific assumptions
Agreement on non-timber forest products Same as Viewpoint 1
Tourism and Recreation
No specific assumptions
No specific assumptions
Agreed to manage key recreation trails, boat anchorages, develop sports fishing strategy, tourism marketing and management
Same as Viewpoint 1
Mineral Exploration
No specific assumptions
No specific assumptions
As per 2 zone system (new PAs also not accessible for exploration or development)
All protected Areas and some key watersheds (Perspective 2) not accessible for exploration or development
Community Sustainability
Agreement on recommendations for economic opportunities studies, desired economic growth areas, governance, transition funding
Same as Viewpoint 1
Source: Percentage of Protected Areas: BCMAL GIS analysis. 2005. The following sections assess the socio-economic impacts associated with each scenario.

Pierce Lefebvre Consulting
8
2 Economic Development and Well Being
2.1 Economic Structure This section of the report provides a brief overview of the current structure of the HG/QCI economy. Each sector discussed in this overview is then reviewed in more detail in subsequent subsections. The information presented is drawn from the document Summary of Current Economic Conditions in HG/QCI, prepared in November 2004 by MSRM staff for the HG/QCI Community Planning Forum. That publication in turn draws heavily on the BC Stats data on economic dependency for HG/QCI. 5,6 2001 economic dependency data (based on 2001 Census data) for HG/QCI show the following: • The public (government) sector (health/ education/ Haida/ provincial and federal
administration) is the largest source of employment and the second largest source of employment income (after forestry) on HG/QCI. BC Stats considers government a “basic” industry because government spending is dependent on factors external to the local economy, particularly in the short term. In the longer term, the strength of other economic sectors may affect some of those factors (such as population), and have an impact on the size of the government sector.
• Forestry related harvesting and processing is the largest source of basic income on HG/QCI
and the second largest source of employment. In 2001, the forest sector accounted for 36% of before-tax income and 28% of total employment (direct and indirect, but excluding induced). The average annual timber harvest over the three years from 2002 to 2004 was 14% lower than the 1.2 million m3 of timber harvested in 2001, which has likely led to a decline in forest sector employment and income from the levels reported for 2001.
• The tourism sector is the third largest source of jobs. In 2001, tourism accounted for 12% of
basic employment and 5% of before-tax income, reflecting the seasonal nature of the sector and lower average earnings. Tourism is a growth sector and a source of economic diversification for HG/QCI, although growth in some types of activity appears to have levelled off. This is discussed in more detail in the tourism section.
5 The BC Stats “economic dependency” estimates show the relative importance of different sources of “basic” income, or income flowing into the region from the outside. Basic income is assumed to drive the local or regional economy. Basic industries include resource industries and tourism, which are export-oriented, and their supplying industries, as well as the public sector. Basic income includes wages and salaries earned in basic industries as well as non-employment sources of income from outside the region (e.g. pension and investment income, government transfer payments). Non-basic sectors are defined as those businesses that serve local demand generated as a result of basic activities (e.g. local grocery stores and other retail outlets). Basic sector employment comprises “direct” and “indirect” employment, while non-basic sector comprises “induced” employment. 6 The discussion of economic dependencies is based on the report British Columbia’s Heartland at the Dawn of the 21st Century - 2001 Economic Dependencies and Impact Ratios for 63 Local Areas, by Dr. Garry Horne for BC Stats, January 2004, and on tables generated in conjunction with the report.

Pierce Lefebvre Consulting
9
• The commercial fishing and fish processing sector is also significant. In 2001, commercial fishing, fish processing and trapping accounted for 7% of total basic employment and 4% of before-tax income. The number of resident salmon vessels has dropped from approximately 80 vessels in the 1990s to approximately 12 in 2004. (BC MSRM. 2004. page 13).
• Other basic sectors include construction, transportation, and other manufacturing not
attributed to a basic sector. Mining has been important to HG/QCI in the past, but the last operating metal mine ceased operations in 1983. The harvesting of non-timber forest products provides seasonal employment, and the production and sale of Haida cultural artwork provides employment for an unknown number of Haida artists.
• In 2001, approximately 19% of before-tax income was from non-employment income. This
included: o 13% from government transfer payments such as welfare payments, old age
security pensions, guaranteed income supplements, Canada Pension Plan, Employment Insurance benefits, Federal Child Tax benefits and other income; and
o 6% from other non-employment income such as investment income and retirement pensions.
The following chart shows 2001 employment dependency and income dependency for HG/QCI. Chart 1 Employment and Income Dependency on HG/QCI
HG/QCI Employment and Before-Tax Income Dependencies, 2001
12%
41%
6%4%
36%
4% 5% 4%2%
19%
8%
28% 30%
0%
5%
10%
15%
20%
25%
30%
35%
40%
45%
Forestry Fish & Trapping Tourism Public Sector Construction Other Non-Employment
Employment Before Tax Income
Note: Data do not add to 100% due to rounding. Source: 2003 Community Dependency Model for HG/QCI based on Canada Census data for 2001; as reported in: BC MSRM. 2004. page 4. The next sections of the report provide an assessment of how each industry sector may be affected by the HG/QCI LUP recommendations.

Pierce Lefebvre Consulting
10
2.2 Forestry
2.2.1 Overview of Current Conditions The major forest licensees operating on HG/QCI include Cascadia Forest Products (formerly Weyerhaeuser) (TFL39), Husby Forest Products (TSA 25), Teal Jones Group/ J.S. Jones Timber (TFL 47 & TSA 25) and BC Timber Sales. (See Appendix 1 for further detail) There are no major processing facilities in HG/QCI, but there is one medium size facility that employs approximately 25 workers. In addition, there are 3 smaller processing facilities employing more than 5 people on a regular basis, and approximately 10 one or two man sawmills that operate intermittently.7 The annual timber harvest on HG/QCI reached a peak of about 2.6 million m3 in the mid 1980’s8, before trending down to present levels. Harvest levels have averaged 1.27 million m3 over the last 10 years (1995 through to 2004), 1.2 million over the last 8 years (1997 through to 2004) and 1.04 million m3 over the last 3 years (2002 through 2004). Chart 2 HG/QCI Harvest Billing System Reported Volume
-
200,000
400,000
600,000
800,000
1,000,000
1,200,000
1,400,000
1,600,000
1,800,000
Volu
me
(m3)
1994 1995 1996 1997 1998 1999 2000 2001 2002 2003 2004
Year
HG/QCI Harvest Billing System Reported Volume
HBS Volume
10 yr avg
3 yr avg
Source: Prepared by Ministry of Agriculture and Lands from MOFR Harvest Billing System data. The current Allowable Annual Cut (AAC) from Crown lands on HG/QCI ranges between 1.2 million m3 and 1.73 million m3 depending on what is considered the applicable harvest level constraint for TFL 39 (Block 6). The AAC for TFL 39 was established by the Chief Forester in November 2001 at 3.66 million m3, including an assumed contribution from Block 6 (HG/QCI) of 1,150,000 m3, of which 125,000 m3 were partitioned in consideration of Haida declared protected areas. In June 2002, however, Weyerhaeuser agreed to reduce the harvest from TFL 39 (Block 6) to a maximum of 600,000 m3 per annum until a sustainable harvest level is confirmed through the land use planning process. The HG/QCI harvest for TFL 39 has averaged 540,739 m3 over 7 Source: Pierce Lefebvre Consulting. 2005. HG/QCI Timber Harvest and Processing Employment Survey. BC MSRM. page 1. 8 Source: BC Ministry of Forests as reported in Canadian Forest Service, Brad Stennes and Bill Wilson. 2000. The Queen Charlotte Islands A Discussion of Forest Sector Development. Page 9.

Pierce Lefebvre Consulting
11
the last 3 years (2002 through 2004), 713,665 m3 over the last 8 years, and 775,286 m3 over the last 10 years. The following table summarizes the 3 year, 8 year and 10 year harvest for HG/QCI, as well as the AAC by management unit. Table 2 HG/QCI Harvest by Management Unit
Management Unit 3 Year Average Harvest
8 Year Average Harvest
10 Year Average Harvest
Current AAC
TSA 25 QCI (note 1) 343,013 326,966 326,239 361,000(475,000)
TFL 25 57,617 75,056 82,870 115,000
TFL 39 (note 2) 540,739 713,665 775,286 1,150,000
TFL 47 95,824 86,277 89,366 100,000
Total LUP (note 3) 1,037,193 1,201,964 1,273,761 1,726,000Notes: 1. The Current Management AAC for TSA 25 (QCI) includes the potential harvest from the Duu Guusd Haida Protected Area,
temporarily excluded from harvest consideration under a Part 13 Order, which reduced the AAC, by 114,000 m3 to the “Current AAC” of 361,000 m3.
2. The assumed 1.15 million m3 Block 6(HG/QCI) AAC contribution for TFL 39 includes a partition of 125,000 m3 for Haida declared areas.
3. The harvest data and the AACs include the TSA forest licences and TFLs. The harvest data also include the Timber Licences’ harvests (approximately 20,000 m3) while the AAC does not. (Pierce Lefebvre Consulting. 2005. page 2)
Source: Based on reported volumes by scale date from the Ministry of Forests Harvest Billing System (provided by Glenn Farenholtz of ILM Bureau (BCMAL), May 27th, 2005). As noted earlier, in 2001 the forest industry accounted for some 28% of basic sector employment and 36% of basic before-tax income in the HG/QCI local area, at a level of harvest of approximately 1.2 million m3. Annual harvest levels dropped to approximately 900,000 m3 by 2004 resulting in a 3-year average (2002-2004) of 1.04 million m3. Nevertheless, the forest sector remains a dominant basic economic sector on HG/QCI. A survey of forest industry employment in HG/QCI9 shows the industry has generated a 3-year average of 632 PY of employment on HG/QCI (2002-2004), with local HG/QCI residents holding 403 PY (or 64%) of the forest industry employment (60% of all harvesting jobs and virtually all on-Islands processing jobs). Timber harvesting employees working on HG/QCI but residing elsewhere reside on the North Coast (4%), Vancouver Island (17%), the Lower Mainland (9%) and elsewhere in BC (10%).10 Annual stumpage revenues from HG/QCI dropped to $6.1 million in 2004, down from a 3-year average of approximately $16.0 million ($2004) and only a fraction of the $75.4 million ($2004) collected in 1996, when stumpage rates reached an average of $46.5 per m3 ($2004) and 1.62 million m3 of timber was harvested. These stumpage revenues and harvest levels are based on reported volumes by scale date from the Ministry of Forests (MOF) Harvest Billing System (HBS)
9 Pierce Lefebvre Consulting. 2005. HG/QCI Timber Harvest and Processing Employment Survey. BC MSRM. page 9. 10 Appendix 1 provides a comparison of different sets of data on forest employment for HG/QCI and concludes that the data are generally consistent considering differences in survey methodology and purpose. The different data sources reviewed in Appendix 1 are: the Pierce Lefebvre Consulting 2005 survey of HG/QCI forest licensees, a survey completed for the HG/QCI Community Planning Forum by Betsy Cardell, and the 2001 Census of Canada Experienced Labour Force data.

Pierce Lefebvre Consulting
12
(provided by Glenn Farenholtz of BCMAL, May 27th, 2005). More recent HBS reports (Sept. 28, 2005) run by scale date indicate 2004 harvest to be 1,081,635 m3, increasing the three year average by a small amount (4%). Slightly different harvest volumes and stumpage revenues can be obtained when data are tabulated by scale date versus invoice date, but the trends are the same. The two sets of data are presented in Appendix 1. Chart 3 HG/QCI Average Stumpage Revenues, 1993-2005
HG/QCI Average Stumpage Revenues ($2004 Million and Current $)
$0
$10
$20
$30
$40
$50
$60
$70
$80
1993 1994 1995 1996 1997 1998 1999 2000 2001 2002 2003 2004
$2004Current $
HG/ QCI Av e r a ge Stum pa ge Ra te s ( $ 2 0 0 4 pe r m 3 ) by Ma na ge m e nt Unit
$0
$10
$20
$30
$40
$50
$60
$70
1993 1994 1995 1996 1997 1998 1999 2000 2001 2002 2003 2004
TFL 24
TFL 25
TFL 39
TFL 47
TSA 25
Grand Total
HG/QCI Stumpage Revenues ($2004 Million) by Management Unit
$0
$5
$10
$15
$20
$25
$30
$35
10 year Average 8 year Average 3 year Average 2004
TFL 47TFL 24 & 25TSA 25TFL 39
Source: Prepared by Pierce Lefebvre Consulting based on data provided by ILM Bureau (BCMAL).

Pierce Lefebvre Consulting
13
One of the main reasons for the lower stumpage rates in recent years has been the drop in realized lumber prices, which since 2001 has partly resulted from trade disputes between Canada and the United States, and an increase in the value of the Canadian dollar. Between 2001 and 2004, the Canadian dollar increased by 32% relative to the U.S. dollar from C$ 0.63 per US$ at year-end in 2001 to C$ 0.83 per US$ at year-end 2004. The following chart presents log prices for coastal species between 1992 and 2005. Chart 4 Average Log Prices for Coastal Species, 1992-2005
Log Prices for Coastal Species, 1992-2005 (Current $/m3)
0
50
100
150
200
250
300
Cypress 145 219 218 165 143 158 124 118 169 172 188 158 131 118
Cedar 84 101 89 90 102 134 131 118 129 131 159 133 114 99
Spruce 106 164 191 263 276 191 121 106 120 121 122 102 101 119
Fir 86 148 151 151 148 141 115 112 108 106 110 110 110 95
Hem- Bal 50 72 89 114 84 76 69 69 70 65 68 55 55 50
Average All Species 74 103 109 117 107 110 99 95 101 107 115 94 87 80
1992 1993 1994 1995 1996 1997 1998 1999 2000 2001 2002 2003 2004 2005
Source: Prepared by Pierce Lefebvre Consulting based on the Ministry of Forests Revenue Branch, Historical Coast Log Market Reports (2002-2005) and from the Council of Forest Industries Log Sales Report (1992-2001). To facilitate a comparison between average stumpage rates on HG/QCI and log prices, the following chart plots average coastal log prices with average stumpage rates using different plot scales. In that chart, average stumpage rates for 1998 to 2005 in HG/QCI are based on the harvest billing system by date of invoice instead of by scale date, which explains the slightly different rates than previously discussed.

Pierce Lefebvre Consulting
14
Chart 5 HG/QCI Stumpage Rates and Average Coastal Log Prices (Current $/m3)
$5.00
$10.00
$15.00
$20.00
$25.00
$30.00
$35.00
$40.00
$45.00
1994
1995
1996
1997
1998
1999
2000
2001
2002
2003
2004
2005
*
$75
$80
$85
$90
$95
$100
$105
$110
$115
$120
Average Stumpage Rate
Average Coastal LogPrices
Note: *Data for 2005 are for Jan. to June in the case of Average Stumpage Rates, and for 3 months ending April 30/05 for Coastal Log Prices Source: Prepared by Pierce Lefebvre Consulting based on: • Average Stumpage Rate for 1998-2005: BC Ministry of Forests Harvest Billing System, Harvest Reports by Date of Invoice,
coniferous harvest from Crown lands, all grades, all products. • Average Stumpage Rate for 1994-1997: Based on reported volumes by scale – provided by Glenn Farenholtz, ILMB (BCMAL)
on May 27th, 2005. • Average Coastal Log Prices are from the Ministry of Forests Revenue Branch, Historical Coast Log Market Reports, All Grades,
All Species (2002-2005) and from the Council of Forest Industries Log Sales Report (1992-2001). Log prices directly affect stumpage rates, as do harvesting costs. The cumulative effect of higher harvesting costs and lower log prices has resulted in a much greater percentage of the harvest being sold at the minimum stumpage rate of $0.25 per m3. The Ministry of Forests Harvest Billing System shows that the percentage of total harvest charged the minimum stumpage rate between 1998 and 2003 ranged between 12% and 25%. By comparison, in 2004 and 2005 (first 6 months) that percentage jumped to approximately 50%. Appendix 1 provides more detail.
2.2.2 Overview of HG/QCI Forest Industry Potential This section of the assessment provides a brief review of the potential for sustaining and /or expanding forest industry activity on HG/QCI. Issues touched on include the rate of harvest, the transition to second growth harvesting, the potential for on-island processing, and the potential for increasing the proportion of forest industry workers who are Islands residents. This section is based on various publicly available studies (as referenced in the following paragraphs) that have assessed the forest industry potential of HG/QCI in recent years. 2.2.2.1 Potential Rate of Harvest on HG/QCI The currently defined timber harvesting land base (THLB) on HG/QCI comprises about 25% of the total area on the islands, and 30% of the total forested area. Of the remaining 70% of forested area, about 21% is protected by federal statute (14% Gwaii Haanas) or provincial statute (7% Naikoon and others), about 2% is Private, Federal or Indian Reserve land, and about 3% is agricultural land. This leaves about 44% of forested land, the vast majority of which is considered to be either physically and/or economically inoperable. Haida Declared Protected Areas (including Duu Guusd) cover an additional 19% of the forested land base and 15% of the THLB

Pierce Lefebvre Consulting
15
(BCMAL GIS data, 2005). The protection of Gwaii Haanas, continuing pressure for further conservation, land use conflict, relatively high and increasing harvesting costs, and declining log prices are the main reasons for the 60% reduction in timber harvest levels from the peak harvest of 2.6 million m3 in the mid 1980’s, to the 1.04 million m3 average harvest level between 2002 and 2004. In the most recent MOFR timber supply reviews for the management units on HG/QCI the Chief Forester provided for a total AAC of 1,865,000 m3 (before considering the 114,000 m3 Part 13 Order reduction for the Duu Guusd designated area). These determinations were made giving consideration to non-timber forest values as prescribed by the Forest Practices Code and other policy direction. As will be discussed later, the THLB and management regime assumptions which comprise this “Current Management” base case lead to a possible long term total harvest level of 1,607,000 m3 per annum after the “falldown” transition to predominantly second growth harvesting. As noted earlier, a large proportion of the forested land base is considered inoperable for the purposes of the MOFR timber supply analysis. Operability is influenced by market prices for logs and harvesting technology. To the extent that these factors change over time, (and they have changed in the past) the extent of the operable land base will also change. In fact operability adjustments have already occurred since the most recent timber supply reviews, as harvesting has been observed on lands deemed to be inoperable in the timber supply review process. One of the licensees, accounting for 24% of the HG/QCI harvest between 2002 and 2004, reported that 26% of their areas logged between 2000 and 2005 were in the Non-Contributing Land Base (NCLB) and 74% were in the THLB. Forest development plans for that licensee show an even greater trend towards harvesting in the NCLB with 36% of the proposed cutblocks in the NCLB vs 64% in the THLB. (Source: personal communication with Leah Malkinson. ILMB (BCMAL). September 2005). There may be opportunities in the future to increase the rate of harvest if technology and/or timber markets expand the operability margins on HG/QCI. 2.2.2.2 Transition from Old Growth Harvesting to Second Growth Harvesting The transition from old growth harvesting to second growth harvesting in the BC coastal forest industry is well underway, with the second growth proportion of the coastal harvest expected to increase from approximately 12% in 2000 to between 27% and 45% by 2010.11 On HG/QCI an estimated 45% of the timber harvesting land base comprises second growth stands of ages less than 110 years (Cortex Consultants and Himark Forest Consultants. July 2004. page 3). Harvesting in second growth stands comprised about 8.5% of the total HG/QCI harvest between 1999 and 2003, mostly in higher value, fire-established stands with a significant component of higher valued cedar. The second growth proportion of the harvest is expected to increase to about 15% over the next few years. In the longer term, Weyerhaeuser forecasted that 50% of its annual harvest from TFL 39 would be taken from second growth by about 2040. For TFL 25, Western Forest Products plans to 11 Pearse, Dr. Peter, Ready for Change - Crisis and Opportunity in the Coastal Forest Industry, 2001.
Pierce Lefebvre Consulting
16
begin the transition to second-growth in 2015 and complete it in 2042. J.S. Jones expects that over the next 20 years, the TFL 47 harvest will comprise entirely second-growth. 12 The TSR2 (October 2000) QCI TSA Analysis Report (page 32) indicates that the transition to managed stands from natural stands in the TSA will begin about 100 years from now and be complete about 150 years from now. The Second-Growth Timber Opportunities report (Cortex and Himark. July 2004. page 13) notes, however, that a substantial portion of the harvest in the QCI TSA will come from fire-established second-growth stands in the short to mid term, and that the transition to harvest-origin second-growth stands is expected to begin in about 20 years. The economic opportunity in harvesting second-growth timber on HG/QCI has been explored in some depth in the Cortex and Himark study (July 2004) undertaken for MSRM. Harvesting second-growth offers operational advantages over old growth harvesting, including higher volumes per hectare, little decay or rot defect, little breakage, better recovery ratios, more uniform log sizes, less steep slope terrain, and greater feasibility of mechanical harvesting techniques (Cortex and Himark. July 2004. Table 5, page 10). The one large disadvantage of second-growth timber is the generally lower stand value ($/m3) caused by the more rapidly growing, and hence coarser-grained wood. The economic operability of second growth stands is currently driven by the proportion of high quality cedar in a given stand or block. Some fire-origin stands can be profitably harvested due to a significant and valuable cedar component, while harvest in other stands with a larger hemlock component must wait until market conditions for hemlock improve. Harvest-origin second growth stands typically have higher hemlock and Sitka spruce components, and cannot generally be profitably harvested under current market conditions unless development costs are very low for specific stands. Markets for second growth Sitka spruce and second growth hemlock are currently underdeveloped, but are being actively pursued by the BC forest industry. There is some expectation that second-growth Sitka spruce markets can be developed in the medium term to the point where the spruce component of some second-growth stands can substantially carry development costs, and the hemlock component can then also be profitably harvested in spite of a lower cedar component in these stands. The Cortex and Himark (July 2004) report suggests that anomalies in the stumpage system may be contributing to the current lack of development of the second-growth Sitka spruce resource on HG/QCI. Second-growth harvesting may employ different harvesting techniques than the predominantly old growth harvesting currently occurring on the Islands, which may reduce employment coefficients (jobs per 1,000 m3 harvested) and alter the types of jobs associated with timber harvesting activities. Greater use of mechanized harvesting and less new infrastructure development (roads, bridges, etc.) could reduce labour requirements for some elements of the timber harvesting process. The scalability of efficient second-growth harvesting techniques to the relatively small HG/QCI license volumes, particularly during the second growth transition period, will influence the extent to which harvesting employment coefficients would be lower for second growth harvesting. The transition from old growth to second growth harvesting may assist the development of log home manufacturing on HG/QCI, keeping in mind that a HG/QCI-based log home manufacturer
12 The August 1, 2003 AAC determination for TFL 47 requires that no more than 60,000 m3 of the 100,000 m3 AAC attribution to the Moresby Island Management Unit be harvested from old growth forests.

Pierce Lefebvre Consulting
17
had some success in the Asian market prior to the latest economic downturn in that region (Canadian Forest Service, Brad Stennes and Bill Wilson. 2000. page 36). 2.2.2.3 Potential for Additional On-Island Wood Processing In 2000, Brad Stennes and Bill Wilson of the Canadian Forest Service (CFS) completed a study of wood processing opportunities on HG/QCI titled The Queen Charlotte Islands A Discussion of Forest Sector Development. As outlined in that study, the main opportunity for local wood processing on HG/QCI is to develop special niche industries that capitalize on the local timber supply, and to develop local wood processing opportunities to service the construction sector on the Islands, (particularly in the building of fishing lodges and other tourism oriented facilities). There may also be opportunities for log home manufacturing since log home building is best suited to second growth timber. (Canadian Forest Service, Brad Stennes and Bill Wilson. 2000. page 36). Large scale wood processing on HG/QCI would be at a comparative disadvantage relative to mills based in the Lower Mainland or the BC Interior, and wood processing plants even in those regions are required to be very competitive to remain in operation.13 Some of the disadvantages of operating on HG/QCI are outlined below. No Local Market for Low-Grade Logs, Chips and Other By-Products: The wood processing industry in British Columbia is achieving significant efficiency by developing processing clusters of primary and secondary manufacturers that are able to increase the total value extracted from each cubic metre (m3) of timber harvested. These clusters include sawmills, pulpmills, remanufacturers, veneer and panel board plants, typically grouped in regions such as the Lower Mainland or the Central Interior, that have convenient transportation access to product markets. Wood processing on HG/QCI is at a significant disadvantage to other locations due to the lack of cost effective access to market opportunities for chips, sawdust, low grade lumber, trim blocks and other by-products. • Chips are an important by-product of timber processing. Recovery rates for sawlogs
(excluding 12% bark) are as follows: lumber (41%), chips (36%) and hog fuel and sawdust (23%). Shingle logs (45%) have slightly higher recovery rates than sawlogs. Peeler logs have higher veneer recovery rates (65%) but chips remain approximately 20% of the log, with hog fuel and sawdust accounting for 15%. (Pierce Lefebvre Consulting and D.A. Ruffle & Associates. 2002. page 25)
• Selling chips to pulp mills can enhance the value of lumber production by as much as $100
per thousand board feet. (Canadian Forest Service, Brad Stennes and Bill Wilson. 2000. page 31).
• The wood processing sector in Alaska has faced significant problems since the demise of the
pulp industry in that region as the lack of market opportunities for chips and by-products has
13 The competitiveness of sawmilling on the BC Coast is well documented in various reports. For example, see Pierce Lefebvre Consulting and D.A. Ruffle & Associates. 2003. Analysis of Woodflow in the Coast Region.

Pierce Lefebvre Consulting
18
rendered wood processing much less viable. The pulp mill in Ketchikan closed in 1997 and the one in Sitka closed in 1994. (Canadian Forest Service, Brad Stennes and Bill Wilson. 2000. page 24).
• Hog fuel (bark and other wood waste) disposal may also be a constraint to wood processing
on HG/QCI, although a co-generation facility planned for HG/QCI would help alleviate that problem. Abfam Enterprises Ltd., the largest wood processing plant on HG/QCI generates 25,000 to 30,000 tonnes of waste per year, and the proposed co-generation plant would process some 50,000 tonnes of wood waste per year. Power produced would be distributed by BC Hydro14.
High Transportation Cost: It is less costly to ship HG/QCI raw logs to manufacturing facilities on the Mainland than to process the logs harvested on HG/QCI and ship the finished lumber to the Mainland for manufacture or further distribution to Asian or U.S. markets. The transportation cost disadvantage per mfbm of lumber manufactured from HG/QCI logs is estimated at approximately $42 per mfbm for lumber processed in the Lower Mainland from logs barged from HG/QCI, compared to an estimated $90 per mfbm if the HG/QCI logs are processed into lumber on HG/QCI and shipped as lumber to the Mainland: • The log shipping cost differential of $42 per mfbm ($11.21 / 0.264) is based on a lumber
recovery factor of 0.264 mfbm/m315, and log handling and barging costs for HG/QCI of $21.81 per m3 compared to an average of $10.60 for the Mainland and Sunshine Coast, a disadvantage of $11.21 per m3. (Pierce Lefebvre Consulting and D.A. Ruffle & Associates Ltd. 2002. page 36)
• The cost of shipping lumber from HG/QCI of $90 per mfbm is based on 2000 data and
assumes ‘back-haul’ trucking costs16 of $1,500 per load for 16,000 to 17,000 board feet of lumber. (Canadian Forest Service, Brad Stennes and Bill Wilson, 2000. page 31).
Shipping logs out of HG/QCI is relatively less expensive than shipping lumber as a result of the very large self-loading and unloading barges used to ship logs out of HG/QCI, and the efficient use of waterways. Barging could potentially lower lumber shipping costs from HG/QCI from $90 per mfbm to $40 per mfbm if a full size barge were used out of HG/QCI, and could be fully loaded, which requires a very substantial (medium size in the provincial context) milling operation. Manufacturers on HG/QCI typically ship to Asia via the southern ports rather than Prince Rupert, where smaller volumes can be more easily consolidated for cost effective shipping (Canadian Forest Service, Brad Stennes and Bill Wilson, 2000. page 31). Wood processing facilities on HG/QCI are at a particular disadvantage in serving the U.S. market as railway access is an essential requirement for BC sawmills serving the U.S. Partly as a result of this, 56% of the sawmilling capacity in the Coast Forest Region is located in the Lower
14 QCI Chamber of Commerce. 2005.Minutes of the Annual General Meeting of the QCI Chamber of Commerce. March 6th, 2005. Port Clements. 15 BC Ministry of Forests. 2003. Major Primary Timber Processing Facilities in BC. 16 Backhaul rate refers to the practice of charging lower shipping rates for goods shipped counter to the normal direction of goods flow . Backhaul rates are applied when containers and trucks tend to return empty, as is usually the case between Skidegate on HG/QCI and Port Hardy or Prince Rupert.
Pierce Lefebvre Consulting
19
Mainland, 42% is on Vancouver Island and 2% is in HG/QCI and other locations along the Coast.17 This compares to 17% of the Coast Forest Region log supply deriving from Lower Mainland forests, 62% deriving from Vancouver Island and 21% from HG/QCI, Central Coast and North Coast.18 High Power Cost • The cost of power to commercial and industrial users on the Islands is approximately double
the rates on the mainland power grid. (HG/QCI Land Use Planning Process. 2003. page 173) • North Island Power Corporation of Vancouver is considering a 6 MW wood waste co-
generation facility in Port Clements, BC. There are also proposals to develop wind power and tidal power generating facilities, but it is unlikely that the cost of power from those sources would be much lower than from current sources. The proposed Nai Kun Wind development currently at the conceptual stage does not plan to supply electric power to HG/QCI. 19
Value-Added Processing The most feasible value-added wood processing opportunity may be log home manufacturing as log home production is best suited to second growth timber and requires relatively less capital investment than some of the other wood processing ventures.20 Local log structure building expertise may also allow potential new tourism facilities proposed for HG/QCI to be built from timber produced on the Islands. There will continue to be possibilities for the woodcrafts/artisan community to utilize local wood and develop local products on a small scale. The recent termination of the Section 21 BC Timber Sales program that favoured value-added manufacturing/processing operations has likely increased the challenge of establishing a cost effective timber supply for value added manufacturers. (Small businesses can continue to bid on Section 20 sales, which are awarded to the highest stumpage bidder, and are made available to market loggers and small businesses. Most Section 20 sale blocks are harvested by on-island contractors, and the logs are generally sold on the Vancouver Log Market.) (HG/QCI Land Use Planning Process. 2003. page 173) There are 45 log home manufacturers currently operating in BC21. Some log home manufacturers are very small with less than 5 full time employees while some of the larger operations have approximately 40 full time employees22. The BC Log and Timber Builders Association estimates that the BC log home industry supports 1,800 people and sales of $114 million of which 83% is exported. (Based on 1997 data; source: 17 Pierce Lefebvre Consulting and D.A. Ruffle & Associates Ltd. 2003. Analysis of Woodflow in the Coast Region. Pages 19, 50, 51 and 52. 18 Ibid, Table 5, Page 15. Represents percentage of annual timber supply before imports and exports are taken into account. 19 QCI Chamber of Commerce. 2005. 20 For example, a log home construction company capable of producing hand-crafted and machine profiled product lines may require a capital investment of approximately $1 million (Source: Crane Management Consultants Ltd. and Peter Drake and Associates. 1997). 21 Ministry of Forests. Survey of Manufacturing Facilities. 2004. 22 For example, in 2005, Sitka Log Homes, one of the larger log home builders in BC reported employing 35 full time employees. Source: Grdadlnik Helena. BC’s Global Symbol? The Log Cabin. The Tyee. September 2, 2005. www.thetyee.ca/vies/2005/08/26/LogCabin.

Pierce Lefebvre Consulting
20
www.bclogandtimbrebuilders.com/aboutus.html) 2.2.2.4 Potential for Increasing the Share of Jobs Held by Local Residents Increasing the proportion of forest industry workers that are HG/QCI residents could increase the local social and economic benefits derived from the Islands’ forest resources. The percentage of HG/QCI forest sector jobs held by local residents is already much higher than in other industries such as the commercial fishing sector, the sportfishing sector and the botanical forest products industry. The 2005 HG/QCI forest industry survey shows that local residents on average, hold 60% of local timber harvesting jobs and 92% of local wood processing jobs (Pierce Lefebvre Consulting. 2005. page 6). By comparison, HG/QCI residents hold approximately 25% of local jobs in sportfishing lodges (GSGislason and Associates. 2003a. page 10), and one third of the local jobs in the botanical forest products sector. (BC MSRM. 2004. page 12) There is some expectation that more local control of timber resources could result in a greater percentage of forestry jobs held by HG/QCI residents. While there are arguments to support this assumption (more of the forestry planning and management functions may be undertaken locally, and small manufacturing operations may have better access to timber), it should be noted that large tenure holders such as Weyerhaeuser and their contractors on HG/QCI have provided relatively stable, year-round employment that has encouraged employees to become or remain local Island residents. Smaller tenure holders and logging contractors may find it more difficult to provide a similar level of employment stability. 2.2.2.5 General Observations As with much of the coastal BC forest industry, the industry on HG/QCI is struggling to remain viable in the current market circumstances. The economic rents23 that were generated by the HG/QCI forest industry in the past resulted from strong international markets for specific products, an efficient logging sector that successfully minimized harvesting and log transportation costs, and high log utilization efficiency delivered through off-Islands processing clusters. These factors combined to enhance timber values and create economic rents, which resulted in high wage jobs for industry participants and substantial stumpage revenues for the provincial government. Over the past decade, these economic rents have been substantially reduced by changes in international forest product markets and increasing harvesting costs (although past harvesting practices likely entailed more unaccounted for negative externalities24 related to environmental and social values, which may have inflated the apparent economic rent levels to some degree). The challenge for the mainstream industry is to re-establish economic rent by rebuilding international markets for its products, containing timber harvesting costs while pursuing responsible and sustainable harvesting practices, and reinvesting in processing facilities that make efficient use of the current and evolving timber profile. An additional challenge on HG/QCI is to find niche forest product market opportunities based on
23 As defined in the Section 1.1 Project Methodology, the net economic value (or economic rent) represents the above-normal financial returns from a commercial activity that occur as a result of the product or service generated by that activity being in relatively short supply relative to demand. 24 Theoretically, the net economic value estimates should be net of any external costs or ‘negative externalities’ such as environmental or social disturbances.

Pierce Lefebvre Consulting
21
locally available timber, which are best supplied by smaller scale manufacturing facilities. If such opportunities can be identified, some portion of the timber supply may find a higher and better use, and hence generate increased economic rent. There may be an additional opportunity to develop a strong brand through marketing efforts and forest practices certification, thereby further enhancing economic rent.
2.2.3 Assessment of HG/QCI LUP Impacts This section summarizes the potential forest sector impacts of each of the base case and LUP viewpoint management scenarios. The assessment reviews the potential impacts on harvest volumes, stumpage, employment, and net economic value. The assessment of impacts on stumpage, employment and net economic value focuses primarily on the first decade impacts, but also outlines potential impacts beyond the first decade. 2.2.3.1 Impact on Harvest Volume Potential Through the use of simulation models, Cortex Consultants and Gowlland Technologies have assessed the impacts of the management scenarios on the THLB25, total area harvested, the average age of harvest, harvest volumes and many other variables. The following table shows the maximized annual short term (first decade) and long term harvest level projections for each management scenario, by forest management unit. It should be noted that these harvest projections are theoretical maximum annual average volumes by decade, given the constraints imposed by each management scenario. Actual harvest levels will be subject to future market conditions and operational realities. Table 3 Impacts on Harvest Volume Potential for Each Management Scenario
Annual Harvest Volume Potential (m3)
Current Management
Current Reality
LUP Viewpoint 1
LUP Viewpoint 2
Short Term Potential (1st Decade) QCI TSA 475,000 290,000 358,000 136,000 TFL 25 140,000 140,000 140,000 77,000 TFL 39 1,150,000 600,000 991,000 292,000 TFL 47 112,000 112,000 112,000 43,000
Total Short Term 1,877,000 1,142,000 1,600,000 549,000 Long Term Potential
QCI TSA 330,000 188,000 260,000 127,000 TFL 25 293,000 236,000 270,000 103,000 TFL 39 832,000 600,000 739,000 392,000 TFL 47 153,000 119,000 137,000 68,000
Total Long Term (m3) 1,607,000 1,143,000 1,407,000 691,000 Corresponding Cortex Scenario BC2 BC3c Viewpoint 1 Viewpoint 2
25 A key assumption in the simulation models is the forested area that is currently in the non-contributing land base (about 40% of forested area) remains non-contributing through time.

Pierce Lefebvre Consulting
22
LUP Viewpoint 1 LUP Viewpoint 2 Change in Annual
Harvest Volume Potential (m3)
Change From Current Management
Change From Current Reality
Change From Current Management
Change From Current Reality
Short Term Potential QCI TSA -25% 23% -71% -53% TFL 25 0% 0% -45% -45% TFL 39 -14% 65% -75% -51% TFL 47 0% 0% -62% -62%
Total Short Term -15% 40% -71% -52% Long Term Potential
QCI TSA -21% 38% -62% -32% TFL 25 -8% 14% -65% -56% TFL 39 -11% 23% -53% -35% TFL 47 -10% 15% -56% -43%
Total Long Term (m3) -12% 23% -57% -40% Source: Cortex Consultants. November 17th, 2004 (Current Management and Current Reality Cases); and Gowlland Technologies and Cortex Consultants, September 2, 2005. (LUP Viewpoints 1 and 2). The model simulations indicate that under LUP Viewpoint 1 harvest levels would have to decline from those possible under the Current Management scenario, but could increase substantially from those possible under the Current Reality scenario. Under LUP Viewpoint 2, potential timber harvest levels would decline substantially from those possible under both the Current Management and Current Reality scenarios. Under both LUP viewpoints , the short term (1st decade) impacts on harvest potential are somewhat more significant than the long term impacts. The Cortex/Gowlland harvest projection analysis for the management scenarios follows MOFR modelling policy for harvest flow projections, requiring the short term harvest level to be maintained for as long as possible without compromising the long term level (to minimize short term impacts), while limiting the harvest changes between decades to no more than 10% and maintaining a smooth transition to the long term level. The different combinations of land base exclusions, old growth retention, management for cultural values, and management for fish and wildlife values assumed in the four scenarios yield quite different potential timber harvest volume flow profiles. The harvest flow volume projections by decade are shown in the following chart.

Pierce Lefebvre Consulting
23
Chart 6 HG/QCI Timber Harvest Volume Projections
HG/ QCI Timber Harvest Volume Project ion
0200,000400,000600,000800,000
1,000,0001,200,0001,400,0001,600,0001,800,0002,000,000
1 2 3 4 5 6 7 8 9 10 11 12 13 14 15
Decades
m3
Current Mgmt
Current Reality
LUP Viewpoint 1
LUP Viewpoint 2
• Under the Current Management scenario, the harvest potential steps down from 1.877 million
m3 in the first decade to the long run harvest potential level of 1.607 million m3 in Decade 10, with reductions beginning in the second decade.
• Under the Current Reality scenario, the harvest level in Decade 1 can be equal to the long
term harvest level, but during Decades 2 through to 4, harvest levels must decline modestly before climbing back to the long term level in Decade 7.
• The harvest flow projection for LUP Viewpoint 1 declines a little more steeply than the Current
Management scenario in Decades 2 through 4, then rises modestly in Decades 5 and 6 before settling at the long term level in Decade 7.
• Under LUP Viewpoint 2, harvest levels are most constrained in Decade 1, and can then rise
somewhat in Decades 2 through 4, before reaching the long term level in Decade 5 of 691,000 m3.
In their analysis of the LUP viewpoints , Cortex/Gowlland compare harvest flow projections for LUP Viewpoint 1 and LUP Viewpoint 2 with the Current Management base case, and incrementally assess the impacts of different elements of the Viewpoint 2 management regime on harvest volume potential (Cortex and Gowlland, September 2005, Tables 4 and 7). The following table shows the impacts on harvest volume potential of LUP Viewpoint 1 and LUP Viewpoint 2, and also the incremental effects of additional management initiatives as one moves from the less restrictive LUP Viewpoint 1 management regime to the more restrictive LUP Viewpoint 2 management regime. The table also notes that harvest levels for the Current Reality scenario are 39% lower in the short term and 29% lower in the long term, than the Current Management scenario.
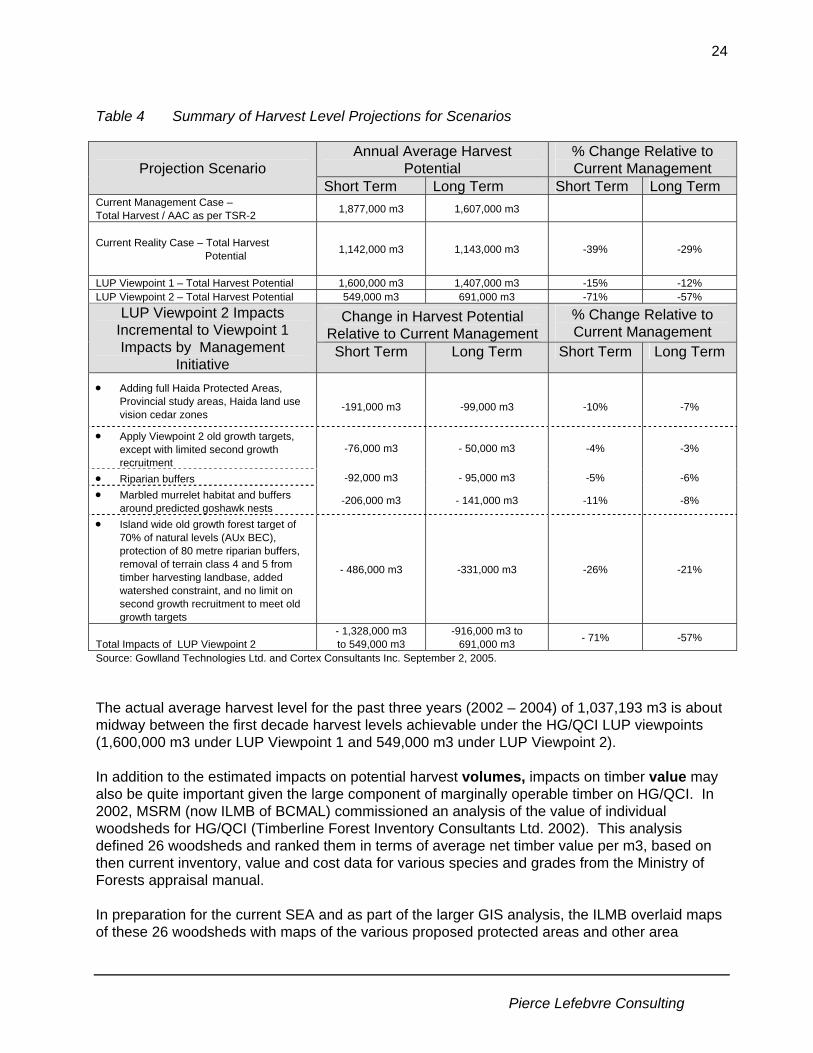
Pierce Lefebvre Consulting
24
Table 4 Summary of Harvest Level Projections for Scenarios
Annual Average Harvest Potential
% Change Relative to Current Management Projection Scenario
Short Term Long Term Short Term Long Term Current Management Case – Total Harvest / AAC as per TSR-2 1,877,000 m3 1,607,000 m3
Current Reality Case – Total Harvest Potential
1,142,000 m3 1,143,000 m3 -39% -29%
LUP Viewpoint 1 – Total Harvest Potential 1,600,000 m3 1,407,000 m3 -15% -12% LUP Viewpoint 2 – Total Harvest Potential 549,000 m3 691,000 m3 -71% -57%
Change in Harvest Potential Relative to Current Management
% Change Relative to Current Management
LUP Viewpoint 2 Impacts Incremental to Viewpoint 1 Impacts by Management
Initiative Short Term Long Term Short Term Long Term
• Adding full Haida Protected Areas, Provincial study areas, Haida land use vision cedar zones
-191,000 m3
-99,000 m3
-10%
-7%
• Apply Viewpoint 2 old growth targets, except with limited second growth recruitment
-76,000 m3 - 50,000 m3 -4% -3%
• Riparian buffers -92,000 m3 - 95,000 m3 -5% -6% • Marbled murrelet habitat and buffers
around predicted goshawk nests -206,000 m3 - 141,000 m3 -11% -8%
• Island wide old growth forest target of 70% of natural levels (AUx BEC), protection of 80 metre riparian buffers, removal of terrain class 4 and 5 from timber harvesting landbase, added watershed constraint, and no limit on second growth recruitment to meet old growth targets
- 486,000 m3 -331,000 m3 -26% -21%
Total Impacts of LUP Viewpoint 2
- 1,328,000 m3 to 549,000 m3
-916,000 m3 to 691,000 m3 - 71% -57%
Source: Gowlland Technologies Ltd. and Cortex Consultants Inc. September 2, 2005. The actual average harvest level for the past three years (2002 – 2004) of 1,037,193 m3 is about midway between the first decade harvest levels achievable under the HG/QCI LUP viewpoints (1,600,000 m3 under LUP Viewpoint 1 and 549,000 m3 under LUP Viewpoint 2). In addition to the estimated impacts on potential harvest volumes, impacts on timber value may also be quite important given the large component of marginally operable timber on HG/QCI. In 2002, MSRM (now ILMB of BCMAL) commissioned an analysis of the value of individual woodsheds for HG/QCI (Timberline Forest Inventory Consultants Ltd. 2002). This analysis defined 26 woodsheds and ranked them in terms of average net timber value per m3, based on then current inventory, value and cost data for various species and grades from the Ministry of Forests appraisal manual. In preparation for the current SEA and as part of the larger GIS analysis, the ILMB overlaid maps of these 26 woodsheds with maps of the various proposed protected areas and other area

Pierce Lefebvre Consulting
25
specific management zones, to help determine the impacts of the protected area components of LUP Viewpoints 1 and 2 on timber values. The data pertain only to forested area currently available for harvesting and excludes all forested areas that are currently under Canada and BC statutory protection. The analysis shows the following: • Under LUP Viewpoint 1, for the 12 woodsheds with higher (positive) timber values, only 5.5%
of forested areas (2.8% of the current THLB component) currently available for harvest would be protected, whereas 33.6% of the forested areas (23.2% of the current THLB component) for 14 woodsheds with lower timber values would be protected.
• Adding the full Haida Protected Areas, the Haida LUV Cedar areas and Haida LUV MAMU
areas under LUP Viewpoint 2 would result in protecting 16.3% of forested areas (15.8% of the current THLB component) for the 12 higher valued woodsheds, and 43.5% of forested areas (36.5% of the current THLB component) for the 14 lower valued woodsheds.
• The higher valued woodsheds that would be most affected by the higher degree of protection
under Viewpoint 2 relative to Viewpoint 1 are: Tlell, Dinan, Alliford, Tasu, Skidegate, Ferguson and Newcombe.
This information is summarized in the table below for forested area, and further information for both forested area and THLB is available in Appendix 1 of this report. Table 5 Impacts of LUP Viewpoints on Forested Area Currently Accessible for Harvest
Viewpoint 1 Woodsheds with Positive
Values per m3
Rank of Woodshed by Value per m3
Total Area
Canada and BC Legislated
Haida Protected
Total Viewpoint
1
Total Viewpoint
2
Skonun 1 22,591 2.2% 7.5% 9.8% 11.1% Moresby 2 11,686 0.0% 0.0% 0.0% 1.7% Tlell 3 26,868 0.0% 0.0% 0.0% 34.7% Dinan 4 46,790 0.0% 4.4% 4.4% 14.5% Alliford 5 32,582 0.0% 7.1% 7.1% 13.8% Tasu 6 6,902 0.0% 0.0% 0.0% 9.7% Sewall 7 12,869 0.0% 2.4% 2.4% 3.5% Kootenay 8 35,912 0.0% 8.4% 8.4% 10.7% Skidegate 9 21,341 0.0% 2.3% 2.3% 7.1% Ferguson 10 85,451 0.0% 8.1% 8.1% 25.3% Newcombe 11 3,509 0.0% 0.0% 0.0% 8.8% Kuper 12 11,345 0.0% 0.0% 0.0% 0.1%
Total Positive Valued Woodsheds 317,846 0.2% 5.3% 5.5% 16.3%
Total Negative Valued Woodsheds 314,454 0.0% 33.6% 33.6% 43.5%
Source: ILM Bureau (BCMAL) GIS Analysis. 2005. Another aspect of the potential timber value impacts resulting from the LUP viewpoints is the influence each viewpoint may have on the required rate and timing of transition to harvesting second growth stands. An analysis of the timber harvest projection data prepared by

Pierce Lefebvre Consulting
26
Cortex/Gowlland for the base cases and two LUP viewpoints provides the following observations. • Nearly 100% of the current harvest is old growth timber, and this can remain the case for at
least the first decade for all scenarios including Viewpoints 1 and 2. • The percentage of old growth timber in the harvest will have to begin falling the soonest (in
the second decade) under LUP Viewpoint 2, but it can remain above 80% of the total timber harvest for 3 decades.
• The Current Reality projection can maintain the old growth component of the harvest above
70% for the longest (through decade 5), before dropping sharply in decade 6. • In spite of the much stricter old growth retention requirements under LUP Viewpoint 2, the
trend in the old growth proportion of the harvest is not as different from the other scenarios as might be expected. This is due to the much lower overall rate of harvest attainable under LUP Viewpoint 2, which allows the more limited old growth available for harvest to be spread further over time.
This is demonstrated in the following chart. Chart 7 Percentage of Harvest that is Old-Growth Timber for Each Scenario
Proport ion of Projected Harvest That is Old Growth
0%10%20%30%40%50%
60%70%80%90%
100%
1 2 3 4 5 6 7 8 9 10
Decades
Old
Gro
wth
Pro
port
ion
Current Mgmt .Current Realit yLUP Viewpoint 1LUP Viewpoint 2
It should be noted that the harvest projection data on the following charts, result from model simulations, and are different than the data presented earlier from the Cortex and Himark study (July 2004) on each licensee’s plans for second growth transition. In the harvest simulation models, an “oldest first” rule is applied that may not meet the test of practicality when undertaking actual harvest development plans.

Pierce Lefebvre Consulting
27
Chart 8 Projected Harvest Composition in Decade 3, 5 and 7 for Each Scenario
Projected Harvest Composit ion in Decade 3
0
200,000
400,000
600,000
800,000
1,000,000
1,200,000
1,400,000
1,600,000
1,800,000
Cur rentManagem ent
Cur rent Reality LUP Viewpoint 1 LUP Viewpoint 2
m3 Old Growth
2nd Growth
Projected Harvest Composit ion in Decade 5
0
200,000
400,000
600,000
800,000
1,000,000
1,200,000
1,400,000
1,600,000
1,800,000
CurrentManagem ent
Current Reality LUP Viewpoint 1 LUP Viewpoint 2
m3 Old Growth
2nd Growth
Projected Harvest Composit ion in Decade 7
0
200,000
400,000
600,000
800,000
1,000,000
1,200,000
1,400,000
1,600,000
1,800,000
Cur rentManagem ent
Cur rent Reality LUP Viewpoint 1 LUP Viewpoint 2
m3 Old Growth
2nd Growth
Source: The data for the preceding charts is derived from supporting harvest projection data provided by Cortex Consultants Inc. and Gowlland Technologies; file titled hgml_SEA_outputs 2nd growth trans; July 2005. 2.2.3.2 Impacts on Harvesting Costs and Operability The LUP viewpoints are founded on an ecosystem based management (EBM) approach to land and resource use that has also been introduced to other land use planning processes in Coastal
Pierce Lefebvre Consulting
28
BC The two LUP viewpoints proposed on Haida Gwaii (and particularly Viewpoint 2) would impose some timber harvesting constraints that are over and above those imposed by the Forest and Range Practices Act (formerly Forest Practices Code). In addition to the potential volume and value impacts noted above, these constraints may lead to some increase in harvesting costs. In an analysis prepared by BC Ministry of Forests and MSRM for the Central Coast and North Coast land and resource management planning processes it is noted that: “The operational costs of implementing eco-system based management (EBM) is a function of higher variable costs and lower volumes over which to amortize fixed costs (e.g. infrastructure development costs for dumps, roads and bridges).” (BC MOF and MSRM, Chuck Rowan and Glenn Farenholtz. 2004. page iii). The study focussed on the increased stand level retention requirements embodied in the EBM initiatives in each of the two draft LRMP recommendations, which was thought to be the most significant component driving potential cost increases. The Central Coast analysis estimates the cost impacts to range between $3 and $9 per m3, or a 4% to 12% increase over the costs expected under the base case management regime (FRPA), for different types of stands depending on existing infrastructure, volume per hectare developed, and volume of timber accessed per kilometre of road. Further analysis undertaken for the North Coast and Central Coast LRMPs on stand level retention recommendations resulting from government to government discussions26 estimated that the weighted average cost increases might be $5.58/m3 for the Central Coast (ranging from $1.08/m3 to $22.75/m3 across individual woodsheds), and $8.87/m3 for the North Coast (with a range of $4.86/m3 to $21.37/m3 across woodsheds). No studies have yet been undertaken for HG/QCI on the potential harvesting cost impacts of the two LUP viewpoints being assessed. Partial retention logging is already widely practiced on the Islands, and the LUP viewpoints do not prescribe specific stand level retention requirements, however incremental landscape level retention is likely to result from several of the management recommendations being put forward. Increases in landscape level retention may directly affect overall costs, as less wood is available for the same unit cost of road development. Engineering costs may also increase to build and log around cedar, old growth, MAMU, and other landscape level reserve areas. It is reasonable to assume that such costs would be higher for LUP Viewpoint 2 than for LUP Viewpoint 1. Increases in harvesting costs can lead to “operability effects” which occur when timber that was previously marginally economic to harvest becomes uneconomic due to the increase in costs. In the operability analysis of government to government recommendations27 it was estimated that the average EBM harvesting cost increase of $5.58/m3 in the Central Coast plan area might lead to a reduction in operable volume of 8% using the previous 10 year average species and grade values for logs. The similar estimate for the North Coast is a 16% reduction in operable volume based on the estimated $8.87/m3 average harvesting cost increase. These estimates resulted from a complex analysis and set of assumptions concerning timber inventories, terrain conditions, harvesting technologies, cost drivers, log market prices, stumpage system responses, and other factors. It should be noted that there is considerable uncertainty about whether operability impacts would actually occur, and about the timing and magnitude of the potential impacts noted
26 BC MSRM. March 2005. North and Central Coast LRMPs – Operability Analysis of Government to Government Recommendations for Stand level Retention. 4 pages; obtained from: BCMAL,Glenn Farenholtz. August 31st, 2005. 27 Ibid.

Pierce Lefebvre Consulting
29
above. No “operability effect” studies have been undertaken for the HG/QCI LUP viewpoints, but the Woodshed Analysis report (Timberline Forest Inventory Consultants Ltd. 2002) indicates that under recent log price and harvesting practice regimes, many of the HG/QCI woodsheds are at or below the margin of economic operability. This suggests that the introduction of more restrictive harvesting practices may lead to operability impacts on HG/QCI if recent log price levels continue. 2.2.3.3 Impacts on Stumpage Revenues Stumpage revenues collected by government in any given year are a function of the stumpage rates applied to timber harvested and the volumes of the various species and grades of timber harvested. An estimation of the potential impacts of the HG/QCI LUP viewpoints on stumpage revenues requires estimates of future harvest volumes and future stumpage rates. The harvest volume projections by decade noted earlier for the two base cases and two LUP viewpoints will be used as the volume estimates, recognizing that there may be additional volume impacts due to the “operability effects” noted above. Determining an appropriate average stumpage rate to apply to these volume estimates is problematic. As noted earlier average stumpage rates have shown significant variation over the past several years, through the interplay of market preferences, log prices and harvesting costs. Various factors may influence average stumpage rates in HG/QCI in the future including: • The BC Ministry of Forests and Range (MOFR) has introduced a new market based pricing
stumpage system (MPS) in coastal BC which is intended is to be more responsive to market forces than the previous system. It is not clear if historical stumpage rates are a reasonable indicator of future rates under this new system.
• The species mix of the HG/QCI harvest may change due to market forces and/or
management initiatives proposed by the LUP viewpoints. • The mix of old growth and second growth for HG/QCI will change over time, and could be
influenced by management initiatives proposed by the LUP viewpoints. • Evolving forest harvesting practices have led to increases in harvesting costs, which in turn
have led to reductions in average stumpage rates for any given set of market circumstances. • Log prices vary widely based on lumber markets and the value of the Canadian dollar relative
to other currencies and in particular the US $. • The coastal forest industry is undergoing structural changes that may be having permanent
impacts on stumpage rates, limiting the usefulness of past rates as an indicator of future rates.
Typically, the most recent 8 year period of historical stumpage data will capture a full log market price cycle, which in the case of HG/QCI would suggest that $20.56 (2004$) might be an appropriate indicator of average stumpage levels. On the other hand, the recent drop in average stumpage rates to a twelve year low of $6.78 per m3 in 2004 may indicate structural change in the industry and its resource base, which suggests that the more recent 3 year average of $15.38
Pierce Lefebvre Consulting
30
per m3 (which captures both high and low log price periods) might be a better indicator of future stumpage rates. For the purpose of this assessment we will use the 3 year average of $15.38 per m3 in the stumpage impact assessment calculations shown later under “Impacts on Net Economic Value”. 2.2.3.4 Impacts on Employment In 2005, Pierce Lefebvre Consulting conducted the HG/QCI Timber Harvest and Processing Employment Survey on behalf of MSRM. (Pierce Lefebvre Consulting. 2005) The survey provides data from the major timber harvesting licensees and their contractors and establishes current employment coefficients (jobs per cubic metre of timber harvested and processed) at both the local and provincial level. The review of the forest industry potential on HG/QCI suggests that the current employment coefficients should provide a reasonable approximation of the employment impacts of future harvest levels, at least for the first decade of the projection: • The percentage of forest industry jobs held by local residents is fairly high (60%) relative to
other industries, and is unlikely to increase significantly in the near future (although it could decline if the industry becomes more fragmented or seasonal).
• The comparative disadvantage of HG/QCI as a location for wood processing makes it unlikely
that large on-Islands wood processing facilities will develop in the near future. Additional smaller niche market operations and log structure manufacturing for the HG/QCI and Asian markets may add somewhat to local processing employment.
In the longer term, employment coefficients for timber harvesting activities on the Islands may be affected by the increasing portion of harvesting activity expected to be directed to second growth stands. As noted earlier, the timber harvest projection model indicates that second growth harvest is expected to form less than 20% of the overall harvest for the first 3 decades of the projection under all of the modelled management scenarios. By Decade 6, the proportion of second growth harvest is expected to be over 60% for all modelled management scenarios. Table 28 in Appendix 1 demonstrates the breakdown of the calculated employment coefficient for timber harvesting by type of activity. Activities for which the required labour component is likely to fall with second growth harvesting include harvesting/falling and road building28, which together account for about half of the jobs per 1,000 m3 harvested. If the jobs associated with these activities fall by 50% when harvesting the second growth component of the timber harvest, then the overall direct jobs per 1,000 m3 in the HG/QCI forest industry could be expected to fall by 5%29 over the first three decades of the projection. Similarly, by Decade 6 when the proportion of second growth is expected to be over 60%, the overall direct jobs per 1,000 m3 in the HG/QCI forest industry might be expected to fall by 15%.30 The impact of the second growth harvesting transition on employment coefficients may be influenced by many factors, the net result of which is not clear. For example, most of the second growth harvest in the first 5 decades of the projection is expected to come from fire generated
28 Activities for which the required labour component is not likely to be affected by the transition to second growth include silviculture, planning and administration, log hauling/trucking, dryland sort, barging/towing and other support services. 29 Calculated as 50% of the jobs reduced by 50% for 20% of the harvest = 0.5 x 0.5 x 0.2 = 0.05. 30 Calculated as 50% of the jobs reduced by 50% for 60% of the harvest = 0.5 x 0.5 x 0.6 = 0.15.

Pierce Lefebvre Consulting
31
second growth stands, rather than managed stands resulting from previous harvest31. The fire generated stands may require road building effort similar to old growth stands, with a smaller decline in employment coefficients than for managed stands. Another complicating factor is the degree to which more mechanized (and less labour intensive) second growth harvesting techniques can be applied to the modest volumes of second growth expected to be harvested in the early decades of the projection. Under all management scenarios examined, the total volume of second growth timber projected to be harvested across all licensees is less than 200,000 m3 per year for the first three decades. There are likely many other factors, aside from the transition to second growth harvesting, that could influence the timber harvesting employment coefficient over time. Implementation of ecosystem based management for timber harvesting, for example, could increase the planning and administration component of the coefficient, while changes in harvesting equipment technology could decrease the harvesting/falling component. The primary purpose of these coefficients is to provide an indication of the relative differences in employment expected from the various land management scenarios. The fact that these coefficients are likely to change over time (to an unpredictable degree) could have some impact on the relative employment differences between scenarios. The impact is not likely to be large however, as the coefficient changes would affect all scenarios. The application of coefficients to measure the impacts from a change in timber volumes suggests that employment changes would occur concurrently with a change in harvest level. While harvesting employment may be closely tied to the level of cut, processing and silviculture may actually not immediately reflect changes in harvesting activity. Processing employment changes may be more closely related to thresholds where, at some specific degree of change in timber supply, mills may change the number of shifts operating or, for larger changes in timber supply, mills may start up or shut down. Moreover, changing productivity and growth in the forest sector as well as other unknown variables may affect the coefficients in the long term. Further, indirect and induced impacts will adjust over a longer period of time as spending levels adjust and businesses recognize and adjust for the change in business activity. The time-frame over which the full impacts would occur is unknown. Table 6 following shows the estimated employment impacts associated with the projected first decade harvest levels for HG/QCI under the four management regime scenarios. More detail is presented in Appendix 1. The analysis shows that harvesting the current AAC (referred to as the Current Management scenario) could result in 286 more direct PY of employment each year in HG/QCI and 864 more direct PY of employment in BC, compared to the Current Reality scenario. LUP Viewpoint 1 could result in a 40% gain in HG/QCI employment over the Current Reality scenario, or an additional 178 PY of direct employment. Viewpoint 2 could result in a 52% loss in HG/QCI employment for the first decade of the projection. The table also shows that the calculated Current Reality direct employment is approximately 9% higher than the observed actual average employment for the years 2002 to 2004.
31 See Table 31 in Appendix 1 for an indication of the expected split between the harvest of “Thrifty” stands (forests regenerated naturally after fire events) and managed stands.

Pierce Lefebvre Consulting
32
The provincial employment impacts are significant, as BC residents who do not reside in HG/QCI hold approximately 40% of the direct harvesting jobs on HG/QCI. Moreover, the analysis assumes that approximately 7% of the HG/QCI harvest is exported out of province, leaving 93% to generate processing employment in BC. As with the stumpage revenue impact estimates, there could be some further employment impacts associated with “operability effects”, as discussed earlier. Table 6 Summary of Estimated Employment Impacts for Various HG/QCI Harvest Levels Summary of Short Term (First Decade) Employment from HG/QCI Harvest
Current Management
Current Reality
LUP Viewpoint
1
LUP Viewpoint
2
Actual Average
2002-2004 Total Harvest 1,877,0001 1,142,0002 1,600,0003 549,0004 1,037,193
% of Exports 7% 7% 7% 7% 7%
Volume Processed in BC 1,743,589 1,060,830 1,486,277 509,979 963,473
Employment (PY)5
HG/QCI (PY to Local Residents) See Note 1 See Note 2 See Note 3 See Note 4
Direct 730 444 622 213 403
Indirect & Induced 277 168 236 81 153
Total 1,006 612 858 294 556
Province (includes HG/QCI Impacts)
Direct 2,207 1,343 1,882 646 1,220
Indirect & Induced 2,124 1,292 1,810 621 1,173
Total 4,331 2,635 3,692 1,267 2,393Notes: 1. Would likely require improvement to current log market prices, and would conflict with key social and environmental values.
2. May not be sustainable without improvement to current log market prices. 3. Would likely require improvement to current log market prices, and may conflict with key social and environmental values. 4. Would likely require improvement to current log market prices. 5. This table provides estimates of impacts based on assumed levels of timber harvest and impact coefficients per m3 of timber harvest; the presentation of these calculated impacts implies a degree of precision that does not exist but the represented precision is retained to maintain the integrity of the data and methodology.
2.2.3.5 Impacts on Net Economic Value The major assumptions underlying the estimates of average annual net economic value for the forest sector are described following. • Stumpage revenues are used as a proxy of public sector rent. • Labour rents are estimated as 5% of total wages and salaries for direct labour (the rationale
for this is explained in Section 1.1 of this report). • Industry rents are considered minimal. Between 1995 and 1999, the B.C. forest industry
reported total earnings before taxes that averaged 0.8% of total sales revenues and a 5-year average return on capital of 2.9%, which is below what might be considered a “reasonable average return”.32 More recent data are not readily available but recent reports on the forest industry in Coastal BC suggest that the industry is not earning “above normal returns” to capital.
32 PriceWaterhouseCoopers. 1999. The Forest Industry in British Columbia. page 4.
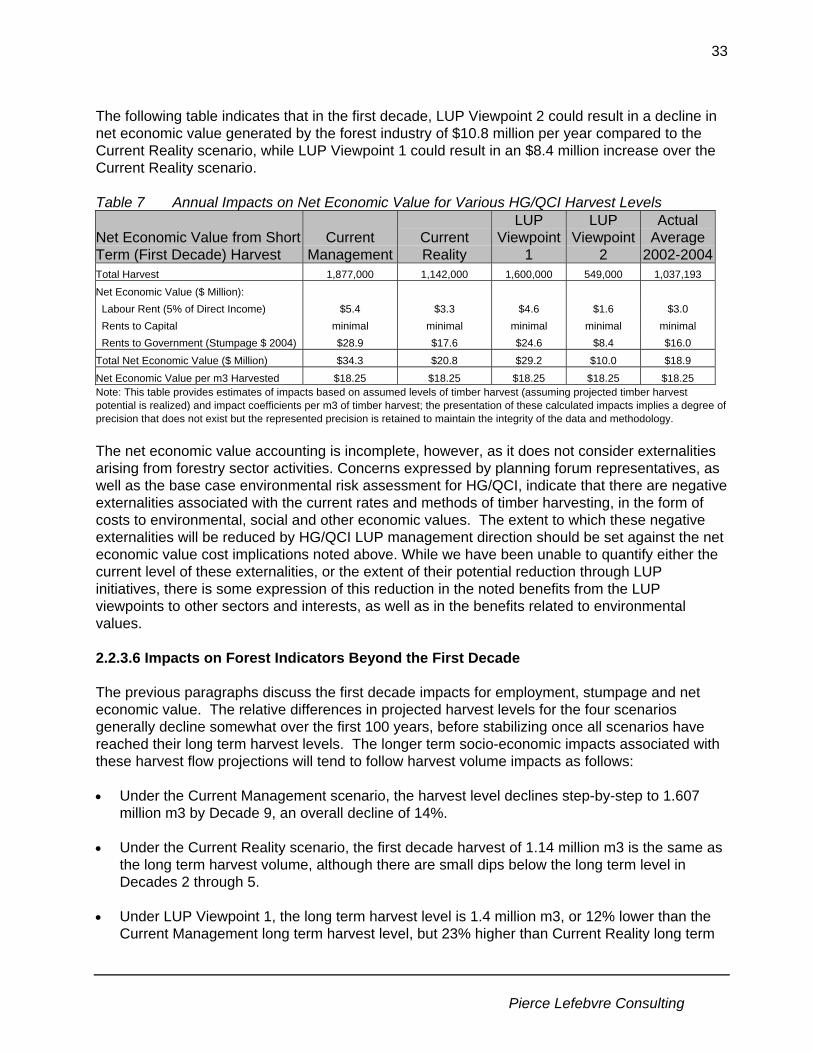
Pierce Lefebvre Consulting
33
The following table indicates that in the first decade, LUP Viewpoint 2 could result in a decline in net economic value generated by the forest industry of $10.8 million per year compared to the Current Reality scenario, while LUP Viewpoint 1 could result in an $8.4 million increase over the Current Reality scenario. Table 7 Annual Impacts on Net Economic Value for Various HG/QCI Harvest Levels
Net Economic Value from Short Term (First Decade) Harvest
Current Management
Current Reality
LUP Viewpoint
1
LUP Viewpoint
2
Actual Average
2002-2004Total Harvest 1,877,000 1,142,000 1,600,000 549,000 1,037,193 Net Economic Value ($ Million): Labour Rent (5% of Direct Income) $5.4 $3.3 $4.6 $1.6 $3.0 Rents to Capital minimal minimal minimal minimal minimal Rents to Government (Stumpage $ 2004) $28.9 $17.6 $24.6 $8.4 $16.0 Total Net Economic Value ($ Million) $34.3 $20.8 $29.2 $10.0 $18.9 Net Economic Value per m3 Harvested $18.25 $18.25 $18.25 $18.25 $18.25 Note: This table provides estimates of impacts based on assumed levels of timber harvest (assuming projected timber harvest potential is realized) and impact coefficients per m3 of timber harvest; the presentation of these calculated impacts implies a degree of precision that does not exist but the represented precision is retained to maintain the integrity of the data and methodology. The net economic value accounting is incomplete, however, as it does not consider externalities arising from forestry sector activities. Concerns expressed by planning forum representatives, as well as the base case environmental risk assessment for HG/QCI, indicate that there are negative externalities associated with the current rates and methods of timber harvesting, in the form of costs to environmental, social and other economic values. The extent to which these negative externalities will be reduced by HG/QCI LUP management direction should be set against the net economic value cost implications noted above. While we have been unable to quantify either the current level of these externalities, or the extent of their potential reduction through LUP initiatives, there is some expression of this reduction in the noted benefits from the LUP viewpoints to other sectors and interests, as well as in the benefits related to environmental values. 2.2.3.6 Impacts on Forest Indicators Beyond the First Decade The previous paragraphs discuss the first decade impacts for employment, stumpage and net economic value. The relative differences in projected harvest levels for the four scenarios generally decline somewhat over the first 100 years, before stabilizing once all scenarios have reached their long term harvest levels. The longer term socio-economic impacts associated with these harvest flow projections will tend to follow harvest volume impacts as follows: • Under the Current Management scenario, the harvest level declines step-by-step to 1.607
million m3 by Decade 9, an overall decline of 14%. • Under the Current Reality scenario, the first decade harvest of 1.14 million m3 is the same as
the long term harvest volume, although there are small dips below the long term level in Decades 2 through 5.
• Under LUP Viewpoint 1, the long term harvest level is 1.4 million m3, or 12% lower than the
Current Management long term harvest level, but 23% higher than Current Reality long term

Pierce Lefebvre Consulting
34
level. The “falldown” from the Decade 1 harvest level is somewhat more rapid through Decades 2 to 4 than under Current Management, but then the harvest level increases in Decades 6 and 7 under LUP Viewpoint 1, to narrow the gap with the Current Management scenario.
• Under LUP Viewpoint 2, the harvest level can increase progressively through Decades 4,5
and 6 to the long term level in Decade 7 which is 25% higher than the Decade 1 level of 549,000 m3. The impact of Viewpoint 2 on net economic value, relative to the Current Reality scenario, is reduced from approximately $10.8 million annually in Decade 1 to approximately $7.5 million annually by Decade 9.
The following table summarizes the estimated employment impacts assuming the long term timber harvest levels discussed above. All other assumptions (i.e. percentage of exports, % of PYs to local residents, employment coefficients33) remain the same. Table 8 Estimated Long Term Employment Impacts for Various HG/QCI Harvest Levels
Summary of Long Term Employment from HG/QCI Harvest
Current Management
Current Reality
LUP Viewpoint
1
LUP Viewpoint
2
Actual Average
2002-2004Total Harvest 1,607,0001 1,143,0002 1,407,0003 691,0004 1,037,193% of Exports 7% 7% 7% 7% 7%Volume Processed in B.C. 1,492,780 1,061,759 1,306,995 641,886 963,473
Employment (PYs)5 HG/QCI (PYs to Local Residents) See Note 1 See Note 2 See Note 3 See Note 4
Direct 625 444 547 269 403Indirect & Induced 237 169 207 102 153Total 862 613 754 371 556
Province (includes HG/QCI Impacts) Direct 1,890 1,344 1,655 813 1,220Indirect & Induced 1,818 1,293 1,592 782 1,173Total 3,708 2,637 3,247 1,594 2,393
Notes: 1. Would likely require improvement to current log market prices, and would conflict with key social and environmental values. 2. May not be sustainable without improvement to current log market prices. 3. Would likely require improvement to current log market prices, and may conflict with key social and environmental values. 4. Would likely require improvement to current log market prices. 5. Employment estimates are calculated from employment coefficients that are based on current industry productivity, harvest practices and forest management assumptions, and will not likely reflect industry operating conditions in the future. The employment estimates should be viewed as indicators of the general magnitude of change, rather than as precise estimates of changes in employment levels.
The main differences between the long term estimated employment impacts and the short term estimates presented in Table 6 are as follows: • Long Term employment for LUP Viewpoint 2 increases from 213 direct PYs for local
residents in Decade 1 to 269 PYs to local residents by Decade 5, reflecting the increase in the potential timber harvest level from 549,000 m3 in Decade 1 to 691,000 m3 by Decade 5.
• Since LUP Viewpoint 1 and Current Management long term harvest levels both show a
gradual falldown effect, the gap between those two scenarios and LUP Viewpoint 2 narrows 33 As noted earlier in this section there are many uncertainties regarding employment coefficients over the longer term.

Pierce Lefebvre Consulting
35
considerably in the long term (Viewpoint 2 harvest potential is 34% of Viewpoint 1 harvest potential in Decade 1, but 49% of Viewpoint 1 harvest potential by the time the potential stabilized long term harvest rate for each scenario is reached).
2.2.3.7 Impacts on Land and Resource Use Certainty Conflicts on HG/QCI between the forest industry and the Haida Nation, conservation groups, and other communities have been a significant factor in the decline in timber harvest volumes in recent years. Reaching a consensus agreement between all parties on the harvesting land base and appropriate harvesting practices would help restore confidence in the forest sector in HG/QCI, and allow industry a better chance to deal with the economic challenges of harvesting the full sustainable annual volume determined by such an agreement. It would also provide a framework for a locally and provincially sanctioned social contract for users of timber lands and timber resources on the Islands, which could contribute to building international markets for HG/QCI forest products through marketing and certification initiatives. It is difficult to assess the relative “certainty benefits” provided to the forest industry by LUP Viewpoints 1 and 2, since neither can be considered a consensus agreement, and therefore neither is likely to deliver much “certainty”. Viewpoint 1 may inject a renewed sense of confidence and growth potential in the industry, but may not deliver the “social contract” needed for the industry to move forward. Viewpoint 2 would likely reduce many of the ongoing land use conflicts faced by the industry, but would not likely generate the industry enthusiasm needed to enhance the viability of the industry on HG/QCI. Summary of Forest Industry Impacts The following tables summarize the forest industry current conditions, potential and impacts.
HG/QCI FOREST INDUSTRY - CURRENT SITUATION AND POTENTIAL Economic Contribution to HG/QCI
• Forest sector generates 36% of basic before-tax income and 28% of total basic employment (2001 data) • Current AAC: 1.8 million m3 • 10 year harvest averages 1.3 million m3; 2004 harvest was 1.0 million m3
Potential for Higher Harvest Levels
• Harvest limited by conservation, land use conflicts, high harvesting costs and low log prices • Under Current Management, about 40% of HG/QCI forest area is not protected but deemed inoperable – this could
change over time
Potential for More On-Island Processing
• Lumber manufacturing and conventional wood processing likely not viable on HG/QCI except for small niche manufacturers and possibly log home manufacturing (although log home manufacturing has not developed despite support of now defunct Small Business value added program)
• May be opportunities for manufacturing for niche markets, capitalizing on forest practices certification and branding
Potential for More Jobs for Local Residents
• For many years, large tenure holders and contractors provided stable year round employment, which encouraged employees to be local residents; the more sporadic harvest and increasing trend towards hiring contractors may have affected the proportion of forest sector workers who reside on HG/QCI. Local residents now hold 60% of local forest industry jobs
• Recommendations for increased local control of forest resources may or may not increase proportion of forest industry jobs held by local residents
Transition to 2nd Growth Harvesting
• Timber supply model indicates that 2nd growth component of harvest can be less than 20% for 3 decades under all management scenarios. Should not have a significant impact on overall harvesting employment coefficient.
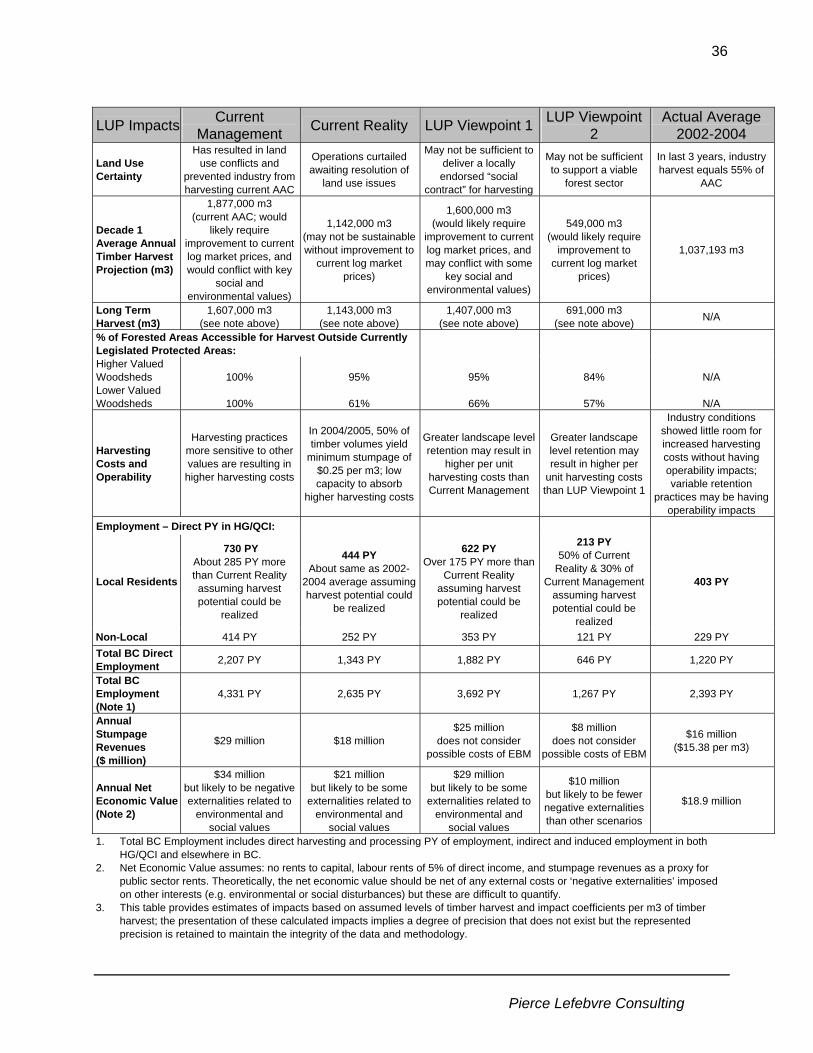
Pierce Lefebvre Consulting
36
LUP Impacts Current Management Current Reality LUP Viewpoint 1 LUP Viewpoint
2 Actual Average
2002-2004
Land Use Certainty
Has resulted in land use conflicts and
prevented industry from harvesting current AAC
Operations curtailed awaiting resolution of
land use issues
May not be sufficient to deliver a locally endorsed “social
contract” for harvesting
May not be sufficient to support a viable
forest sector
In last 3 years, industry harvest equals 55% of
AAC
Decade 1 Average Annual Timber Harvest Projection (m3)
1,877,000 m3 (current AAC; would
likely require improvement to current log market prices, and would conflict with key
social and environmental values)
1,142,000 m3 (may not be sustainable without improvement to
current log market prices)
1,600,000 m3 (would likely require
improvement to current log market prices, and may conflict with some
key social and environmental values)
549,000 m3 (would likely require
improvement to current log market
prices)
1,037,193 m3
Long Term Harvest (m3)
1,607,000 m3 (see note above)
1,143,000 m3 (see note above)
1,407,000 m3 (see note above)
691,000 m3 (see note above) N/A
% of Forested Areas Accessible for Harvest Outside Currently Legislated Protected Areas:
Higher Valued Woodsheds
100%
95%
95%
84%
N/A
Lower Valued Woodsheds
100%
61%
66%
57%
N/A
Harvesting Costs and Operability
Harvesting practices more sensitive to other values are resulting in
higher harvesting costs
In 2004/2005, 50% of timber volumes yield
minimum stumpage of $0.25 per m3; low capacity to absorb
higher harvesting costs
Greater landscape level retention may result in
higher per unit harvesting costs than Current Management
Greater landscape level retention may result in higher per
unit harvesting costs than LUP Viewpoint 1
Industry conditions showed little room for increased harvesting costs without having operability impacts; variable retention
practices may be having operability impacts
Employment – Direct PY in HG/QCI:
Local Residents
730 PY About 285 PY more than Current Reality assuming harvest potential could be
realized
444 PY About same as 2002-
2004 average assuming harvest potential could
be realized
622 PY Over 175 PY more than
Current Reality assuming harvest potential could be
realized
213 PY 50% of Current
Reality & 30% of Current Management
assuming harvest potential could be
realized
403 PY
Non-Local 414 PY 252 PY 353 PY 121 PY 229 PY Total BC Direct Employment 2,207 PY 1,343 PY 1,882 PY 646 PY 1,220 PY
Total BC Employment (Note 1)
4,331 PY 2,635 PY 3,692 PY 1,267 PY 2,393 PY
Annual Stumpage Revenues ($ million)
$29 million $18 million $25 million
does not consider possible costs of EBM
$8 million does not consider
possible costs of EBM
$16 million ($15.38 per m3)
Annual Net Economic Value (Note 2)
$34 million but likely to be negative externalities related to
environmental and social values
$21 million but likely to be some
externalities related to environmental and
social values
$29 million but likely to be some
externalities related to environmental and
social values
$10 million but likely to be fewer negative externalities than other scenarios
$18.9 million
1. Total BC Employment includes direct harvesting and processing PY of employment, indirect and induced employment in both HG/QCI and elsewhere in BC.
2. Net Economic Value assumes: no rents to capital, labour rents of 5% of direct income, and stumpage revenues as a proxy for public sector rents. Theoretically, the net economic value should be net of any external costs or ‘negative externalities’ imposed on other interests (e.g. environmental or social disturbances) but these are difficult to quantify.
3. This table provides estimates of impacts based on assumed levels of timber harvest and impact coefficients per m3 of timber harvest; the presentation of these calculated impacts implies a degree of precision that does not exist but the represented precision is retained to maintain the integrity of the data and methodology.

Pierce Lefebvre Consulting
37
2.3 Mining and Mineral Exploration
2.3.1 Overview of Mining Sector on HG/QCI In 2001, the mining industry in HG/QCI accounted for 10 direct jobs, 4 indirect jobs, and $0.1 million in before-tax basic income. (BC MSRM. 2004. page 13) Currently operating mines on HG/QCI consist of sand and gravel operations, and private quarries that operate intermittently. Throughout the last century, the mining industry has played an important role in the socio-economic context of HG/QCI. The most recently operating metal mine was an iron mine in Tasu on Moresby Island that employed 160 people, which permanently closed in 1983. In the 1990s the proposed development of a large open pit operation (the Specogna gold deposit on the Harmony property near Port Clements) was deemed not feasible, primarily due to potential impacts on sensitive environmental values (Yakoun River watershed). The land area of HG/QCI has significant metallic and industrial mineral potential. The GIS data prepared for this assessment shows that the entire HG/QCI landbase is rated as having very high or high metallic and industrial mineral capability. Comparable BC data show that 39% of the BC landbase is rated as having very high or high metallic mineral capability, and 42% is rated as having very high or high industrial mineral capability. The balance is rated as having moderate, low or very low metallic and industrial mineral capability. Chart 9 Mineral Potential of HG/QCI
Meta llic Minera l Capability - HG/ QCI vs BC% by Ca tegory
21%
40%
0%0%
49%51%
22% 17%
0%
20%
40%
60%
80%
100%
Very High High Moderate Low & VeryLow
HG/ QCIB.C.
Notes: HG/QCI data: ILM Bureau (BC MAL) GIS data. 2005. Appendix 5 provides more detail. BC data: Based on BC Ministry of Energy and Mines (BC MEM) database as provided by Dorthe Jakobsen of BC MEM, November, 8th, 2005. Despite the high mineral potential of HG/QCI, mineral exploration in HG/QCI has virtually stopped since 1999. A review of the provincial government Assessment Report Indexing System (ARIS) database shows that no notices of work were submitted between 2000 and 2003, and only one notice for a very small dollar value of work was submitted in 2004. This contrasts with earlier periods through the 1980s and 1990s, when there was much more mineral exploration and development activity.
I ndustr ial Mineral Capability - HG/ QCI vs BC% by Category
18% 18%
40%
27%
0%0%
73%
23%
0%
20%
40%
60%
80%
100%
Very High High Moderate Low & VeryLow
HG/ QCIB.C.

Pierce Lefebvre Consulting
38
Table 9 Mineral ARIS Exploration Expenditures in HG/QCI, 1980 – 2004
Period HG/QCI ARIS
Expenditures ($2004) (note 1)
BC ARIS Expenditures
($2004) – (note 1)
HG/QCI Share of BC Expenditures
1980-1984 11,840,465 307,311,765 3.85% 1985-1989 5,351,633 466,150,588 1.15% 1990-1994 833,638 250,665,882 0.33% 1995-1999 5,947,379 185,852,941 3.20%
2000-2004 (note 2) 9,701 116,481,287 0.01% Average Annual
1980 - 2004 959,313 53,058,499 1.81%
Notes; 1. Exploration expenditures in current dollars were converted to 2004$ using the annual average Consumer Price Index (CPI) as
reported in Statistics Canada, CANSIM, table (for fee) 326-0002 and Catalogue nos. 62-001-XPB and 62-010-XIB; Statistics Canada obtains annual average indexes by averaging the indexes for the 12 months of the calendar year.
2. BC ARIS expenditures for 2004 are estimated at $60 million based on 50% of the BC Ministry of Energy and Mines estimate of total mineral exploration expenditures for 2004 of $120 million. ARIS reported expenditures have represented about half of total estimated mineral exploration expenditures in BC in recent years.
Source: BC Ministry of Energy and Mines. Assessment Report Indexing System. http://www.em.gov.bc.ca/mining/Geolsurv/Aris/default.htm In 2002, the BC government legislated a two zone system for mining along with a “single window” permitting process for exploration and development of mineral resources. • Mineral exploration and mining are prohibited in all protected areas, parks and ecological
reserves. • Elsewhere, mineral exploration and mining development is permitted subject to various
provincial rules and regulations (e.g. Mines Act (including the Health, Safety and Reclamation Code and the Mineral Exploration Code (MEC)), the Environmental Assessment Act and the Forest and Range Practices Act). Under these regulations, the mining industry is required to obtain approvals to follow strict procedures before development can proceed. Under the Environmental Assessment Act, large scale development projects such as a metal or industrial mine must assess the environmental, social, economic, cultural and heritage impacts of a project, including the impacts on species at risk.
For British Columbia as a whole, mineral exploration expenditures in BC were highest between 1988 and 1990 when they reached in excess of $200 million per year. Mineral exploration expenditures dropped in the late 1990s to approximately $50 million per year and remained in that range until 2004 when exploration expenditures reached an estimated $120 million.34 Higher metal and coal prices appear to be the main reason for the increase in exploration expenditures in 2004, but improvements in the BC investment climate (including greater land use certainty) may also have played a significant role. The BC Ministry of Energy and Mines provides a list of operating mines, major development projects and major exploration projects currently underway in BC for 2004. There are no operating mines, development projects or exploration projects listed in HG/QCI for 2004. 35 Mineral exploration tends to occur where there is a reasonable probability that a mineral deposit
34 BC Ministry of Energy and Mines. 2004. British Columbia Mining and Mineral Exploration Review 2004. page 1. 35 Ibid. pages 3, 4, 7, 10, 11 and 12.
Pierce Lefebvre Consulting
39
can be identified, developed and mined. Land use certainty is a factor in assessing this probability.
2.3.2 Potential for Mineral Development on HG/QCI Mining firms operating on HG/QCI would face some of the same cost disadvantages as forest products manufacturing firms, such as high power and other input costs. Transportation costs for mined mineral shipments from HG/QCI may be an advantage, rather than the disadvantage it is for manufactured forest products, given that most potential mine sites on HG/QCI would be relatively close to tidewater, and the majority of BC’s mineral production is shipped overseas. In 2004, net mining revenues from BC mines by market area shows that approximately 57% of revenues were earned from minerals shipped to overseas markets compared to 43% shipped to BC, other parts of Canada and the US. (PriceWaterhouseCoopers. 2005. Appendix 5) Bulk shipments to Asian markets may entail transportation time and cost advantages over most areas of BC. The potential for acid mine drainage to affect environmental values, and the potential for the boom/bust nature of mine development to affect social values, have been major concerns of the Haida Nation and HG/QCI residents for at least 25 years36. The combination of limited local support for large scale mining development in general, and the concerns over environmental impacts in sensitive ecosystems in particular, appears to be restraining industry interest in the HG/QCI mineral potential. The metallic and industrial mineral potential in HG/QCI is, in general, higher than average for BC. HG/QCI has approximately 1.1% of the BC landbase and between 2.5% and 3% of the high/very high metallic mineral and industrial potential for BC. If HG/QCI had mining employment in proportion to its share of the provincial landbase, the Islands would have about 100 direct PY employed in the sector (This number is based on taking 1.1% of 2004 mining industry employment in BC of 9,400 people, including the aggregate, coal, industrial minerals and metals mining sectors)37. By comparison, the Tasu iron mine employed 160 people for 16 years from 1967 to 1983. Appendix 2 to this report provides some indication of the socio-economic impacts that might be expected from a significant open pit metal mining operation in BC.
36 See for example Official Report of DEBATES OF THE LEGISLATIVE ASSEMBLY (Hansard) WEDNESDAY, JUNE 30, 1982, Morning Sitting p. 8,537. 37 BC Ministry of Energy, Mines and Petroleum Resources (MEMPR). 2005. BC Mineral Economy Sector Snapshot Summaries – 2004. www.em.gov.bc.ca/mining/miningstats/04mineconsnap.htm. Accessed November 10th, 2005.

Pierce Lefebvre Consulting
40
Chart 10 Selected Indicators of HG/QCI Mineral Potential as a Percentage of BC
Selected Ind icators of HG/ QCI Mineral Act ivit yas a Percentage of B.C.
2.7%2.5%
1.8%
1.1%
0%
2%
4%
Total Area ExplorationExpenditures1980- 2004
High/ Very HighIndustr ial MineralPotential Lands
High/ Very HighMetallic MineralPotential Lands
Source: Prepared by Pierce Lefebvre Consulting based on BC MEMPR data. Appendix 2 provides more detail.
2.3.3 Impacts of the HG/QCI Land Use Plan Viewpoints on the Mineral Sector Management initiatives proposed in the HG/QCI LUP Recommendations Report (January 2006) that may have impacts on the mining sector include: • establishing more protected areas, • establishing watershed boundaries, outside of protected areas, within which mining and/or
mineral exploration will not be permitted, • establishing consultation protocols with the Haida Nation and local communities, and • reinforcing the two-zone system for mining and establishing secure access to the landbase
outside of protected areas and no-mining zones. The January 2006 H/G QCI Land Use Plan Recommendations Report notes the following: “No vote was taken on the Minerals section at the February 2004 CPF meeting and therefore the extent of agreement is unclear. Hence, management direction clauses in this section, including those components where alternative opinions have been expressed, are characterized here as “perspectives” rather than “viewpoints.” 38 The Socio-Economic Assessment differentiates between the expected impacts of the LUP Viewpoints, which propose differing sets of protected areas, and the LUP Perspectives towards mining. The main differences between Perspectives 1 and 2 in a socio-economic impact context are the potential impacts of the differing consultation protocols and the potential impacts of the no-mining watersheds suggested under Perspective 2. It is important to note that in the last two decades, the Haida Nation and other local residents have been very reluctant to support any mineral exploration or development on HG/QCI. The potential for HG/QCI to benefit from mineral exploration and development will depend on the ability of companies to conduct mineral exploration and development with some reasonable
38 HG/QCI LUP Process Management Team. 2006. Haida Gwaii / QCI Land Use Plan Recommendations Report, Page 89.

Pierce Lefebvre Consulting
41
expectation of being able to mine economically and environmentally feasible deposits when found. Any additional land use certainty, even on a smaller portion of the Islands landbase, would be considered a benefit over the current investment climate for the mineral sector in which virtually no exploration or development is taking place on HG/QCI. The following paragraphs review the potential impacts of these initiatives on the mining sector. 2.3.3.1 New Protected Areas and Haida LUV Cedar and MAMU Areas The following table highlights the distribution of mineral value indicators across protected areas and non-protected areas for the two base case perspectives and the two LUP viewpoints. For LUP Viewpoint 2, the table also shows the mining values in the Haida LUV Cedar and MAMU areas. Management intent with respect to mineral exploration or development activities in the Haida LUV cedar and MAMU areas under LUP Viewpoint 2 is not clear from the HG/QCI Land Use Plan Final Recommendations Report. For the purposes of this analysis it is assumed that under the “two-zone system” mining would not be specifically excluded from these areas. Table 10 Impacts of HG/QCI Land Use Plan Proposed Protected Areas on Mining Values
Current Management
Current Reality
LUP Viewpoint 1 LUP Viewpoint 2
HG/QCI Mineral Values
Total HG/QCI
(ha)
Private, Fed
lands & IR Protected General Protected General Protected General Protected
Haida Cedar/ MAMU
General
Total Landbase 1,004,764 2.2% 22.4% 75.4% 41.4% 56.5% 37.7% 60.1% 42.0% 3.0% 52.9%
Metallic Mineral Potential (ha)
Very High 490,352 2.5% 29.8% 67.7% 38.8% 58.7% 36.9% 60.6% 39.9% 2.3% 55.2%
High 505,570 1.7% 15.3% 83.1% 43.8% 54.5% 38.4% 59.9% 43.9% 3.7% 50.8%
Industrial Mineral Potential (ha)
Very High 724,693 0.5% 21.2% 78.4% 41.8% 57.7% 39.1% 60.5% 42.5% 3.0% 54.0%
High 271,229 6.5% 25.6% 67.9% 40.1% 53.4% 33.9% 59.6% 40.2% 3.2% 50.1% Mineral Tenures/ Claims (ha) 36,400 0.3% 2.8% 96.9% 8.0% 91.7% 7.7% 92.0% 8.0% 15.2% 76.4%
Coal Fields Area (ha) 18,564 31.8% 28.0% 40.2% 37.7% 30.5% 37.7% 30.5% 37.9% 1.2% 29.1%
Metallic Mineral Occurrences
Developed Prospect 7 0.0% 71.4% 28.6% 71.4% 28.6% 71.4% 28.6% 71.4% 0.0% 28.6%
Past Producer 20 10.0% 75.0% 15.0% 75.0% 15.0% 75.0% 15.0% 75.0% 0.0% 15.0%
Prospect 15 0.0% 53.3% 46.7% 60.0% 40.0% 60.0% 40.0% 60.0% 0.0% 40.0%
Showing 108 0.9% 40.7% 58.3% 54.6% 44.4% 53.7% 45.4% 55.6% 2.8% 40.7%
Total 150 2.0% 48.0% 50.0% 58.7% 39.3% 58.0% 40.0% 59.3% 2.0% 36.7% The above table shows the following:
• The 22% of the landbase currently managed as legislated protected areas account for 30% of the very high metallic mineral potential areas, 48% of metallic mineral occurrences (with substantially higher proportions of the Prospects (53%), Past Producers (75%), and Developed Prospects (71%)). The current protected areas also contain 28% of the coal fields by area.

Pierce Lefebvre Consulting
42
• The three other scenarios, Current Reality, LUP Viewpoint 1 and LUP Viewpoint 2 nearly
double the proportion of HG/QCI that is protected area. Protecting those areas will preclude mining from occurring on 38% of the HG/QCI landbase under LUP Viewpoint 1, 41% under the Current Reality and 42% under Viewpoint 2 (excluding the HLUV Cedar and MAMU areas). The impacts on mineral values of the new protected areas are not as significant as the proportional increase in protected area, with no incremental impacts at all on metallic Developed Prospects or metallic Past Producers.
• The legislated protected areas under Current Management cover 3% of mineral tenured
area on HG/QCI. The Haida Protected Areas under the Current Reality scenario and under LUP Viewpoint 2 cover an additional 5% of mineral tenured area. Haida Protected Areas with existing mineral tenures include the Yakoun River (1,245 acres), Gwaii Gawgaay/Kootenay Inlet (527 hectares), Tlall (114 hectares), Duu Guusd (25 hectares) and Kun Xaalas (6 hectares).
• The Haida LUV cedar and MAMU areas appear to include a disproportionate portion of
mineral tenure areas (15.2% would be in Haida LUV cedar or MAMU areas) relative to the total size of those areas (3.0% of the total landbase is in Haida LUV cedar or MAMU areas). Most of this results from Cultural Cedar areas, which cover 4,380 ha. or 12% of existing mineral tenured area. It is not clear what impact, if any, the Haida LUV cedar or MAMU area designations would have on those mineral tenures/claims.
2.3.3.2 Impacts of No-Mining Zones The HG/QCI Land Use Plan Recommendations Report provides two perspectives regarding mineral exploration and development outside protected areas:
“Perspective 1: Maintain access for exploration outside protected areas consistent with the Province’s two zone system for mining.
Perspective 2: Prohibit exploration, access roads, and mining in Protected Areas, ecologically sensitive reserves, and important fisheries watersheds (i.e. Yakoun, Copper, Ain, Davidson, Naden, Awun)” 39
This section examines the potential impacts of no-mining zones under Perspective 2. LUP Perspective 2 specifies 6 no-mining zones for HG/QCI in addition to the protected areas. Together these cover approximately 110,000 hectares or 11% of HG/QCI. The no-mining zones do not overlap any protected areas, but they do overlap approximately 10,000 hectares of the 30,000 hectares in Haida LUV cedar and MAMU areas, mostly in the Yakoun watershed. This overlap likely captures most of the mineral tenure area in the Haida LUV cedar and MAMU areas. The following table shows that the Yakoun and Copper watersheds have a high proportion of the mineral tenures, mineral claims, ARIS expenditures and metallic mineral developed prospects in HG/QCI. 39. Source: HG/QCI LUP Process Management Team. 2006. Haida Gwaii / QCI Land Use Plan Recommendations Report, page 91.

Pierce Lefebvre Consulting
43
Table 11 Impacts of No-Mining Watersheds on HG/QCI Mining Values
No Mining Zones (Selected Watersheds) Copper Yakoun
Other No-Mining
Total - No Mining
Total HG/QCI % of Total
Total Area 16,090 57,359 35,912 109,360 1,004,764 11%
Metallic Mineral Potential
Very High 16,087 34,220 50,307 490,352 10%
High 23,097 35,848 58,945 505,570 12%
Industrial Mineral Potential
Very High 16,087 10,543 35,848 62,478 724,693 9%
High 46,773 46,773 271,229 17%
Mineral Tenures/ Claims (ha) 16,175 8 16,183 36,400 44%
Coal Fields Area (ha) 6,303 6,303 18,564 34%
ARIS
Number of Sites 8 94 102 406 25%
Expenditures (1986) 91,729 6,470,152 6,561,881 17,382,362 38%
Metallic Mineral Occurrences
Developed Prospect 1 1 7 14%
Showing 2 10 12 108 11%
Past Producer & Prospect 35 0%
Total 2 11 13 150 9%
Coal Occurrences
Developed Prospect 2 2 2 100%
Past Producer 1 0%
Prospect 1 1 3 33%
Showing 1 1 1 100%
Total 4 4 7 57%Source: ILM Bureau (BCMAL) GIS Data. 2005. More details for the other no-mining zones are presented in Appendix 5. The data show that the proposed Yakoun no-mining zone would include 16,175 hectares of mineral tenures or 44% of all mineral tenures in HG/QCI, which could result in compensation issues. The mineral tenures in the Yakoun no-mining zone and the Haida Yakoun River protected area (another 1,245 hectares) pertain mainly to the Cinola Gold Deposit property south of Port Clements. Proposals to mine this deposit in the late 1980s were not pursued to development, mainly for environmental reasons. Current technologies for extracting gold require the use of cyanide or mercury, and the relatively high levels of pyrite at the Cinola site may result in acid mine drainage. Development of this site would require new technologies.40 There may also be compensation issues associated with mineral tenures/claims in the Gwaii Gawgaay/Kootenay Inlet Haida protected area (527 hectares in mineral tenures), Tlell (114 hectares in mineral tenures), Duu Guusd (25 hectares in mineral tenures) and Kun Xaalas (6 hectares).
40 Haida Gwaii/QCI Land Use Process. 2004. Meeting Summary: Community Planning Forum Meeting #7, March 12 and 13, 2004. Queen Charlotte Visitor Information Centre.

Pierce Lefebvre Consulting
44
2.3.3.3 Impacts on Land Use Certainty The lack of exploration activity on HG/QCI, compared to resurgent mineral exploration activity in BC over the past three years, may result in part from land use uncertainty on the Islands. The conditions under which mining development could proceed in HG/QCI are currently not obvious, and potential developers face a higher level of uncertainty than in some other areas of the province. LUP Perspectives 1 and 2 provide guidance on Haida Nation and other local community expectations with respect to future mineral development in HG/QCI, including management intent to secure access to the land base for mineral exploration. The Perspectives differ in the portions of the overall land base that would be protected from mineral exploration and/or development, but both perspectives provide for exploration and development in non-protected areas under conditions designed to minimize impacts to the environment and other resource values. LUP Perspective 1 provides a stronger statement of adherence to the province wide “two-zone system” for mining, while LUP Perspective 2 requires “local approval” prior to advanced exploration and development rather than the consensus seeking local consultation required under LUP Perspective 1. LUP Perspective 1 appears to provide more certainty of access to a greater proportion of the HG/QCI landbase than does LUP Perspective 2. 2.3.3.4 Socio-Economic Implications of Land Use Plan Viewpoints and Perspectives on the Mineral Sector Currently, there is no metal mining activity and virtually no mineral exploration in HG/QCI, as the recent upsurge in BC mineral exploration expenditures is not evident in HG/QCI. While geology and environmental concerns may explain this lack of exploration activity, land use uncertainty may also be a significant factor. There is no widely accepted methodology to estimate the employment and other socio-economic potential that might be associated with the mining sector in HG/QCI once greater land use certainty is achieved, nor what the likely impacts might be of protecting additional portions of the landbase from mining development. Given the hidden nature of the resource and other unknowns regarding future mineral values and mining technologies, all methodologies that are broadly applied to the landbase are highly speculative. In 2003, BriMar Consultants Ltd. and Finisterre Holdings Inc. estimated the value of various mineral tracts for the Coast Information Team (CIT).41 They estimated the employment, cash flows, B.C. direct taxes, and investment for the mineral tracts on the B.C. Coast, assuming various development probabilities. Their report estimates that each hectare of mineral tract may generate significant employment, taxes and cash flows, however, it is difficult to relate these results to current or historical employment and mining activity in the metal mining sector in B.C.42
41 BriMar Consultants Ltd. and Finisterre Holdings Inc. 2003. Economic Gains Spatial Analysis (EGSA) Minerals Sector Study. Coast Forest Conservation Initiative, Coast Information Team. 42 Green, Tom. 2003. Review of the March 2003 EGSA Minerals Sector Study by BriMar and Finisterre. Rainforest Solutions Project.
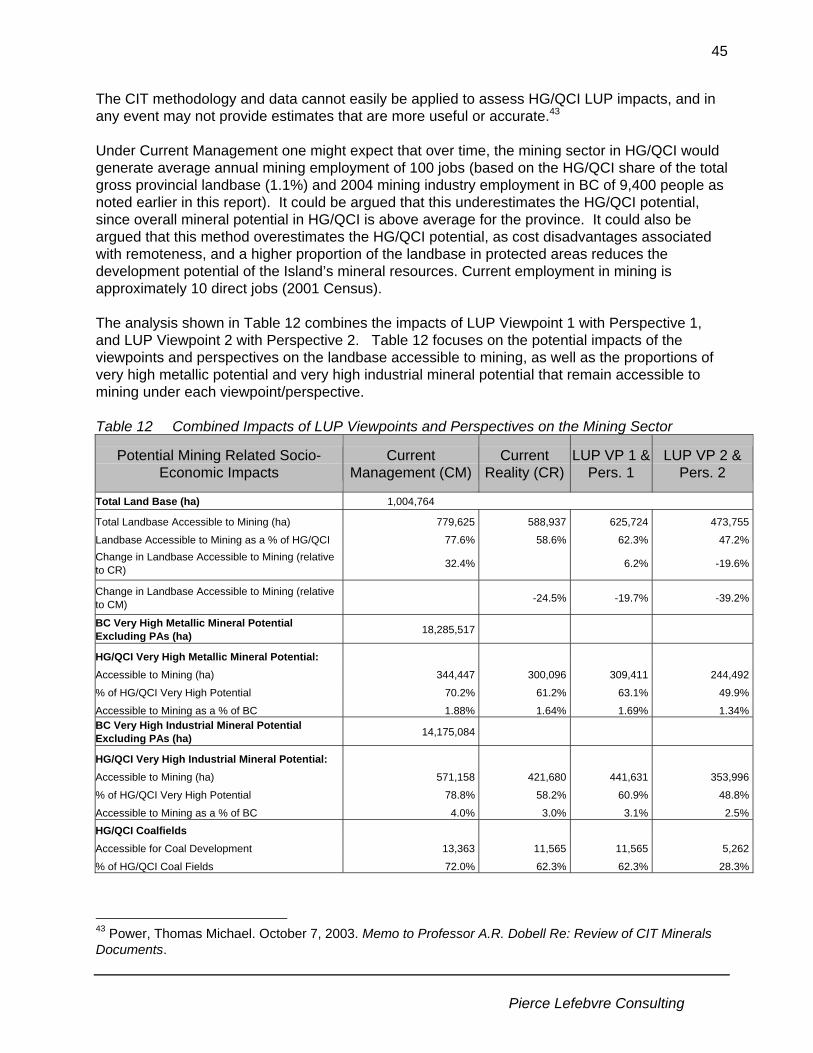
Pierce Lefebvre Consulting
45
The CIT methodology and data cannot easily be applied to assess HG/QCI LUP impacts, and in any event may not provide estimates that are more useful or accurate.43 Under Current Management one might expect that over time, the mining sector in HG/QCI would generate average annual mining employment of 100 jobs (based on the HG/QCI share of the total gross provincial landbase (1.1%) and 2004 mining industry employment in BC of 9,400 people as noted earlier in this report). It could be argued that this underestimates the HG/QCI potential, since overall mineral potential in HG/QCI is above average for the province. It could also be argued that this method overestimates the HG/QCI potential, as cost disadvantages associated with remoteness, and a higher proportion of the landbase in protected areas reduces the development potential of the Island’s mineral resources. Current employment in mining is approximately 10 direct jobs (2001 Census). The analysis shown in Table 12 combines the impacts of LUP Viewpoint 1 with Perspective 1, and LUP Viewpoint 2 with Perspective 2. Table 12 focuses on the potential impacts of the viewpoints and perspectives on the landbase accessible to mining, as well as the proportions of very high metallic potential and very high industrial mineral potential that remain accessible to mining under each viewpoint/perspective. Table 12 Combined Impacts of LUP Viewpoints and Perspectives on the Mining Sector
Potential Mining Related Socio-Economic Impacts
Current Management (CM)
Current Reality (CR)
LUP VP 1 & Pers. 1
LUP VP 2 & Pers. 2
Total Land Base (ha) 1,004,764
Total Landbase Accessible to Mining (ha) 779,625 588,937 625,724 473,755
Landbase Accessible to Mining as a % of HG/QCI 77.6% 58.6% 62.3% 47.2%Change in Landbase Accessible to Mining (relative to CR) 32.4% 6.2% -19.6%
Change in Landbase Accessible to Mining (relative to CM) -24.5% -19.7% -39.2%
BC Very High Metallic Mineral Potential Excluding PAs (ha) 18,285,517
HG/QCI Very High Metallic Mineral Potential:
Accessible to Mining (ha) 344,447 300,096 309,411 244,492
% of HG/QCI Very High Potential 70.2% 61.2% 63.1% 49.9%
Accessible to Mining as a % of BC 1.88% 1.64% 1.69% 1.34%BC Very High Industrial Mineral Potential Excluding PAs (ha) 14,175,084
HG/QCI Very High Industrial Mineral Potential:
Accessible to Mining (ha) 571,158 421,680 441,631 353,996
% of HG/QCI Very High Potential 78.8% 58.2% 60.9% 48.8%
Accessible to Mining as a % of BC 4.0% 3.0% 3.1% 2.5%HG/QCI Coalfields Accessible for Coal Development 13,363 11,565 11,565 5,262
% of HG/QCI Coal Fields 72.0% 62.3% 62.3% 28.3%
43 Power, Thomas Michael. October 7, 2003. Memo to Professor A.R. Dobell Re: Review of CIT Minerals Documents.
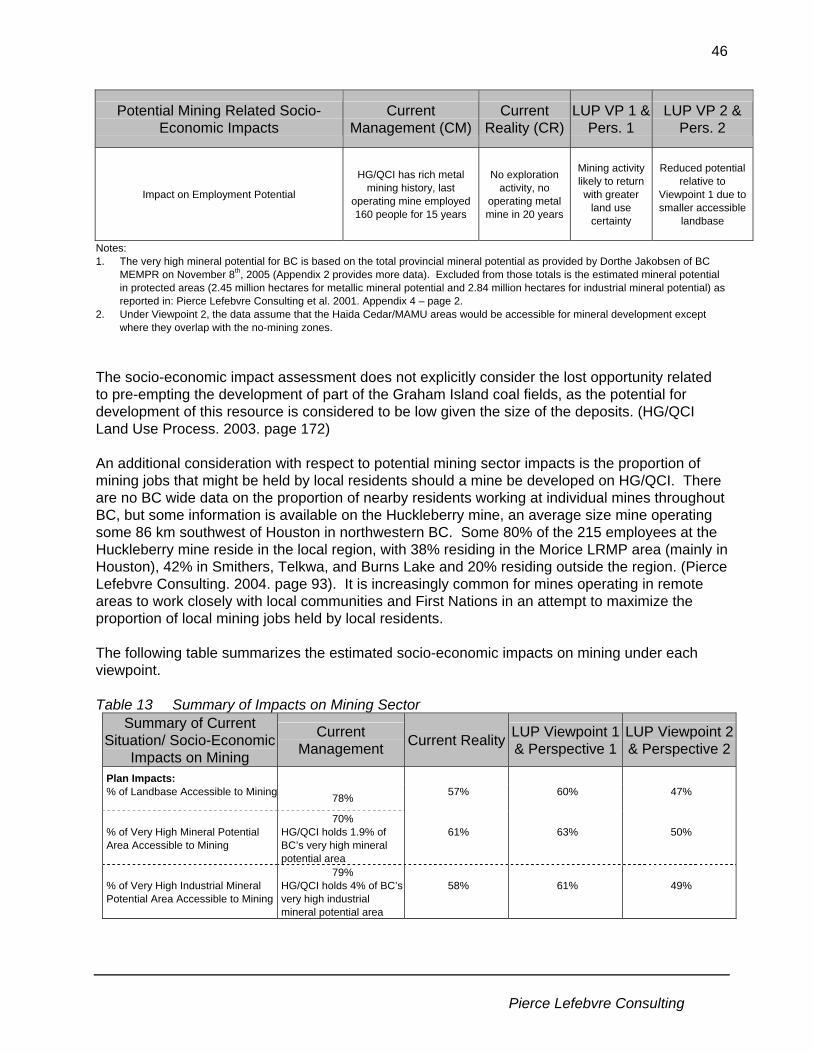
Pierce Lefebvre Consulting
46
Potential Mining Related Socio-Economic Impacts
Current Management (CM)
Current Reality (CR)
LUP VP 1 & Pers. 1
LUP VP 2 & Pers. 2
Impact on Employment Potential
HG/QCI has rich metal mining history, last
operating mine employed 160 people for 15 years
No exploration activity, no
operating metal mine in 20 years
Mining activity likely to return with greater
land use certainty
Reduced potential relative to
Viewpoint 1 due to smaller accessible
landbase
Notes: 1. The very high mineral potential for BC is based on the total provincial mineral potential as provided by Dorthe Jakobsen of BC
MEMPR on November 8th, 2005 (Appendix 2 provides more data). Excluded from those totals is the estimated mineral potential in protected areas (2.45 million hectares for metallic mineral potential and 2.84 million hectares for industrial mineral potential) as reported in: Pierce Lefebvre Consulting et al. 2001. Appendix 4 – page 2.
2. Under Viewpoint 2, the data assume that the Haida Cedar/MAMU areas would be accessible for mineral development except where they overlap with the no-mining zones.
The socio-economic impact assessment does not explicitly consider the lost opportunity related to pre-empting the development of part of the Graham Island coal fields, as the potential for development of this resource is considered to be low given the size of the deposits. (HG/QCI Land Use Process. 2003. page 172) An additional consideration with respect to potential mining sector impacts is the proportion of mining jobs that might be held by local residents should a mine be developed on HG/QCI. There are no BC wide data on the proportion of nearby residents working at individual mines throughout BC, but some information is available on the Huckleberry mine, an average size mine operating some 86 km southwest of Houston in northwestern BC. Some 80% of the 215 employees at the Huckleberry mine reside in the local region, with 38% residing in the Morice LRMP area (mainly in Houston), 42% in Smithers, Telkwa, and Burns Lake and 20% residing outside the region. (Pierce Lefebvre Consulting. 2004. page 93). It is increasingly common for mines operating in remote areas to work closely with local communities and First Nations in an attempt to maximize the proportion of local mining jobs held by local residents. The following table summarizes the estimated socio-economic impacts on mining under each viewpoint. Table 13 Summary of Impacts on Mining Sector
Summary of Current Situation/ Socio-Economic
Impacts on Mining
Current Management Current Reality LUP Viewpoint 1
& Perspective 1 LUP Viewpoint 2 & Perspective 2
Plan Impacts: % of Landbase Accessible to Mining 78% 57%
60%
47%
% of Very High Mineral Potential Area Accessible to Mining
70% HG/QCI holds 1.9% of BC’s very high mineral potential area
61%
63%
50%
% of Very High Industrial Mineral Potential Area Accessible to Mining
79% HG/QCI holds 4% of BC’s very high industrial mineral potential area
58%
61%
49%

Pierce Lefebvre Consulting
47
Summary of Current Situation/ Socio-Economic
Impacts on Mining
Current Management Current Reality LUP Viewpoint 1
& Perspective 1 LUP Viewpoint 2 & Perspective 2
Number of Developed Metallic Mineral Prospects in New PAs and No-Mining Zones
5 are in existing legislated PAs None in Haida PAs None in Haida PAs
All 7 developed prospects on HG/QCI in PAs or
no-mining zones
Mineral Tenures (ha) in New PAs and No-Mining Zones
1,005 ha of mineral tenures in existing PAs
Additional 1,916 ha in Haida PAs
Additional 1,802 ha in Haida PAs
19,104 ha, mainly in no-mining zones (52%
of mineral tenure areas)
Coal Fields (ha) in New PAs and No-Mining Zones
5,201 ha (28%) in existing PAs
Additional 1,797 ha in Haida PAs
Additional 1,797 ha in Haida PAs
Additional 8,100 ha or 44% of coal fields in PAs or
no-mining zones Socio-Economic Implications:
Mineral Exploration Expenditures: Virtually none on HG/QCI in last 5 years despite a strong resurgence in BC mineral exploration expenditures in 2004 and 2005
Could return to HG/QCI accounting for
1.8% of BC, or $2 million per year
Virtually no exploration currently occurring, but could revive with greater
certainty of access tounprotected lands
Some exploration likely to return with greater certainty of access to
unprotected lands
Smaller accessible landbase and “local
approval” requirement may restrain activity
Impact on Employment Potential
HG/QCI has rich mining history, last operating mine employed 160 people for 15 years;
No exploration activity, no operating
mine in 20 years
Mining activity likely to return with greater land
use certainty
Reduced potential relative to Viewpoint 1
due to smaller accessible landbase
Note: Under Viewpoint 2, this analysis assumes that the Haida Cedar/MAMU areas would be accessible for mineral development except where they overlap with the no-mining zones.
2.4 Energy
2.4.1 Overview of Sector The Background Report reviews the potential for energy production on HG/QCI. The following summarizes the discussion for oil and gas, coal and coalbed methane, as well as alternative energy. Oil and Gas Estimates for the Queen Charlotte Basin show resource potential equal to all of the gas found to date in the traditional gas producing areas of northeastern BC, and about three times the oil found in northeastern BC (using a 25% oil recovery factor). The most prospective areas are predicted to be in the offshore shelf areas of Dixon Entrance, Hecate Strait and Queen Charlotte Sound as well as onshore beneath eastern Graham Island. All wells drilled to date (1913-1984), both onshore and offshore were dry (HG/QCI Land Use Planning Process. 2003. Background Report. page 171). In 1972, the federal government established a moratorium on offshore oil and gas exploration, and the transit of crude oil tankers through Dixon Entrance, Hecate Strait and Queen Charlotte Sound. The Haida Nation also passed a motion to support the moratorium on oil and gas exploration, and in 1981, the Province of BC also declared a similar moratorium. The Haida Nation has not indicated any interest in having the moratorium lifted, although the federal and BC governments are currently assessing the potential for development of west coast offshore resources (HG/QCI Land Use Planning Process. 2003. Background Report. page 171).

Pierce Lefebvre Consulting
48
Coal and Coalbed Methane Coal deposits on HG/QCI are primarily on Graham Island and the potential for surface or underground coal mining is considered to be low. Similarly, the potential for coalbed methane is also low. (HG/QCI Land Use Planning Process. 2003. Background Report. page 172) Alternative Energy Currently at the conceptual stage for HG/QCI is the proposed Nai Kun Wind farm, which is a large scale offshore wind farm that would provide electricity to as many as 240,000 houses in BC through the mainland power grid. Electrical power would not be supplied to HG/QCI from this project as currently conceived. The project would consist of up to 350 wind turbine towers located in the shallow waters of Hecate Strait off the north tip of HG/QCI. The project would create some 2,300 person years of direct employment in BC over the four years of construction (i.e. 575 PY per year) and approximately 40 on-going direct jobs in wind farm operation and maintenance. Nai Kun Wind Development Inc. continues its discussions with the Haida Nation and the Tsimshian First Nation. Nai Kun has obtained the support of the Department of Fisheries and Oceans, and of the Haida Nation, to proceed with the construction of a single windmast for detailed measurement of the wind, and to conduct a wave and seabed survey. Energy production from the first turbines could begin by 2007.44 The City of Masset is examining the feasibility of a 5 MW windmill to displace costly diesel power. There is also a proposal for a co-generation power plant located on HG/QCI that would process some 50,000 tonnes of wood waste per year. The Geological Survey of Canada has assigned moderate geothermal potential to Moresby Island but no high-temperature resources have been identified that could be used for electricity generation. Graham Island has not been assigned any potential and the bottom hole temperatures recorded for that area preclude the use of geothermal resources for electricity generation. (HG/QCI Land Use Process. 2003. Background Report. page 172)
2.4.2 Impact of Land Use Plan on Energy Sector Both offshore and terrestrial oil and gas potential were excluded from consideration in the HG/QCI Land Use Plan process. With no specific management direction or mapping related to the oil and gas potential on HG/QCI, little comment can be made on the potential impacts of the LUP viewpoints on these values. The greater extent of protected areas under LUP Viewpoint 2 (particularly if the no-mining watersheds proposed by Perspective 2 are included) relative to LUP Viewpoint 1, could be expected to alienate a greater portion of the onshore oil and gas potential. The Land Use Plan viewpoints do not include specific management direction with respect to other energy resources such as coal bed methane, geothermal energy, and wind power.
44 Source: www.naikun.ca/indix.cfm?content=fap; accessed August 8th, 2005.

Pierce Lefebvre Consulting
49
2.5 Non-Timber Forest Products, Agriculture, Trapping and Commercial Fishing
2.5.1 Non-Timber Forest Products HG/QCI provides a variety of opportunities for Haida and other Islands residents to gather berries, wild mushrooms and other wild foods and plants. Mushroom harvesting provides an important income supplement to approximately 100 HG/QCI residents. The mushroom picking season typically starts in August and ends in October. In an average year, some 300 pickers (one third locals, or approximately 25 PY of local employment) can each earn several thousand dollars per year harvesting between 125,000 pounds and 350,000 pounds of mushrooms in any one year. In 2000, pickers received between $2.50 and $4.50 per pound of mushrooms, but prices have been as low as $0.50 per pound. (BC MSRM. 2004. page 12) In 2004, prices were quite low, and an estimated 150 pickers (with 100 of them being local residents) were harvesting mushrooms.45 There are no tenure or licensing requirements for the mushroom picking industry, and as a result, there is no government captured rent generated by that sector. The net economic value from mushroom harvesting is estimated in Table 14 on the next page. Other non-timber forest products on HG/QCI that have potential, include the following. • Yew bark (May to August): bark from yew trees is used in the production of a cancer
treatment drug, and at one time harvesting yew bark on HG/QCI provided approximately 5 seasonal jobs for local residents;
• Salal: used mainly in the floral industry, salal harvesting generates industry revenues of $55
million dollars with most of the current production being from Vancouver Island; and • Berries, forest moss, and floral wreath. (Weldwood, Dwight. 2004. pages 2 and 3) The high cost of transportation from HG/QCI is an issue for all non-timber forest products that target the non-local market. Moreover, the Haida Nation is concerned with any further commercialization of NTFP and the harvesting of culturally important trees and plants.
45 Weldwood, Dwight. 2004. Non-Timber Forest products. HG/QCI Planning Forum Meeting #11. July 2004. page 1.

Pierce Lefebvre Consulting
50
Table 14 Estimated Net Economic Value from Mushroom Harvest in Average Year
Estimated Net Economic Value from Mushroom Harvest in HG/QCI Average Year
Labour Rent (5% of Pickers Wages and Salaries) $31,250 Industry Rent (5% of Total Revenues) $90,625 Public Sector Rent 0
Total $121,875
Assumptions: Volume (pounds) 250,000 Selling Price per Pound $7.25 Payment to Pickers $2.50 Wages and Salaries $625,000 Industry Revenues $1,812,500 Industry Rent as a % of Revenues 5% Labour Rent as a % of Wages and Salaries 5%
Notes: 1. The assumptions are based on 2000 data and are expected to reflect an average year. More recent data are not available, but
prices in 2004 were much lower than average. 2. Section 1.1 in this report (Project Methodology) defines economic rent and explains the net economic value assumptions. Source: Tedder et al., 2000. as reported in: BC MSRM. 2004. Summary of Current Economic Conditions. Pages 11 and 12. Impacts of HG/QCI Land Use Plan Viewpoints The HG/QCI land use plan identifies some 52,125 hectares of mushroom management zones. It is not clear whether protected areas designated under the Land Use Plan viewpoints would allow the harvesting of mushrooms for commercial purposes. The following table shows the proportion of mushroom management zones in protected areas under each viewpoint. The table shows that the mushroom zones are not in currently legislated protected areas (Current Management), and that Current Reality, LUP Viewpoint 1 and LUP Viewpoint 2 result in approximately 5% of the mushroom management zones being in protected areas. Under Viewpoint 2, the proposed Haida cedar and MAMU areas include an additional 7.1% of the mushroom management zones. It is not known whether non-Haida pickers would be permitted to harvest mushrooms commercially in those zones. Table 15 HG/QCI Mushroom and Agricultural Land Reserve
Current Management
Current Reality
LUP Viewpoint 1 LUP Viewpoint 2 HG/QCI
Mushroom and ALR
Total HG/QCI
(ha)
Private, Fed
lands & IR Protected General Protected General Protected General Protected Haida
Cedar/MAMU General
Total Land Base 1,004,764 2.2% 22.4% 75.4% 41.4% 56.5% 37.7% 60.1% 42.0% 3.0% 52.9%Mushroom Management Zones 52,125 7.9% 0.0% 92.1% 4.9% 87.2% 4.9% 87.2% 5.1% 7.1% 79.8%Agricultural Land Reserve (ALR) 29,373 10.6% 10.0% 79.4% 34.9% 54.5% 26.6% 62.8% 35.0% 8.4% 46.0% There is agreement in the recommended Land Use Plan to investigate increasing the minimum timber harvest age in mushroom management areas, enabling mushroom harvesting access, and

Pierce Lefebvre Consulting
51
considering forest silviculture techniques that maximize mushroom productivity. It is not clear what impacts these initiatives could have on the viability of mushroom harvesting activities, but they are presumed in this analysis to be beneficial to mushroom harvesting. The HG/QCI Land Use Plan recommendations dealing with culturally important plants do not cite any CPF consensus recommendations, but do include viewpoint recommendations to prohibit the commercial harvest of Haida medicinal plants and yew trees. These initiatives could limit the development of some non-timber forest product potential.
2.5.2 Agriculture Agriculture is a significant part of HG/QCI history, with original settlers at the beginning of the 20th century clearing lands for homes and gardens mainly on Graham Island. Most farms failed due to the high draining costs, high transportation costs, lack of markets and isolation and only a handful of settlers remained after the Great Depression of the 1930s. (HG/QCI LUP. 2003. Background Report. Page 181) The food and agriculture sector on HG/QCI provides some seasonal employment for small home-farm businesses selling a variety of produce to local stores and local farmers’ markets. In 2001, BC Stats reported that the food and agriculture sector accounted for 20 direct and indirect jobs, or 1% of basic sector employment, and generated $0.1million of before tax income (between $5,000 and $10,000 per job). (BC MSRM. 2004. page 4) Currently, agriculture and grazing occurs mainly in the Tlell area. The GIS data prepared for this assessment shows 29,373 hectares of Agriculture Land Reserve (ALR), which is approximately 10,000 hectares less than the 40,500 hectares reported in the HG/QCI Land use Plan Background Report. (HG/QCI Land Use Process. 2003. page 181) The GIS data show that 10% of the ALR consists of private lands/federal lands and Indian Reserves and another 10% is in legislated protected areas (Current Management scenario), mainly in Naikoon Provincial Park. Haida Protected Areas (Current Reality and LUP Viewpoint 2) account for approximately 25% of the ALR. Haida Protected Areas that include some ALR include Nang Xaldangass (Massett Inlet/ Naden Harbour), Yakoun River and Yakoun Lake, Kumdis Slough/ Yakoun Bay, Kun Xalaas (Gray Bay/Cumshewa Head) and the Tlell area. The management intent for the Haida Protected Areas with respect to agriculture is not clear. Under LUP Viewpoint 1, approximately 27% of the ALR would be in protected areas (including Haida Protected Areas) compared to 35% under the Current Reality scenario and LUP Viewpoint 2.
2.5.3 Trapping Sector There are approximately 80 traplines on HG/QCI, but only one quarter have reported harvesting over the past decade and only a few have operated consistently over the period. According to the Ministry of Water, Land and Air Protection (MWLAP) (as reported in HG/QCI Land Use Process. 2003. Background Report. Pages 164 and 165), 2/3 of the trapping has occurred on Graham Island, and 54% of the harvest is marten.

Pierce Lefebvre Consulting
52
Trapping is an important cultural activity for the Haida, and trapping on the Islands provides seasonal income for a number of HG/QCI residents. (HG/QCI Land Use Process. 2003. Background Report. page 164) There is no specific management direction for trapping in the LUP recommendations, but management initiatives to maintain wildlife habitat may contribute to maintaining or enhancing fur bearing animal populations.
2.5.4 Commercial Fishing and Fish Processing In 2001, the fish harvesting sector accounted for 190 jobs in HG/QCI, including 90 in fish harvesting, 45 in fish processing and 55 indirect jobs linked to that sector. In 2004, MSRM staff reported that “these statistics do not seem to be supported by local information, which indicates that most of the fisheries employment is in processing, and that most trolling licences are held by owner/operators based out of ports on Vancouver Island and the Lower Mainland”. (BC MSRM. 2004. page 13) The potential growth of the commercial salmon fishery is limited, as salmon stocks have been declining. (BC MSRM. 2004. page 13) There are an estimated 12 resident salmon vessels, down from approximately 80 vessels in the early 1990s. The local fish processing industry has diversified, away from salmon and more toward processing other local fisheries such as halibut, crab and herring. Herring roe-on-kelp is an important source of income for Haida Nation fishermen. ( BC MSRM. 2004. pages 13 and 14) While there are some important salmon, trout and char streams on HG/QCI such as the Yakoun River, Davidson Creek, Tlell River, and Pallant Creek, most of the commercial and sport salmon fishery depends on large non-local stocks from the Skeena and Nass Rivers, and from Alaska. (BC MSRM. 2004. page 13) LUP Viewpoint 2 provides specific management recommendations to protect hydroriparian ecosystems in all fish bearing watersheds from adverse impacts associated with logging. Perspective 2 also includes the protection of six specific watersheds with high fisheries values, from mineral exploration and/or mining. LUP Viewpoint 1 does not include specific management initiatives with respect to hydroriparian ecosystems that are incremental to the Forest and Range Practices Act, but does achieve a high degree of protection (67%) of these ecosystems through protected areas and old growth reserve deployment. This is discussed more thoroughly in the Ecological Risk Assessment for the HG/QCI Land Use Plan Viewpoints (Veridian Ecological Consulting, 2006). Hydroriparian ecosystem protection should be beneficial to the modest proportion of the commercial fishing and fish processing industries that relies on HG/QCI freshwater streams, with LUP Viewpoint 2 providing a greater degree of protection than LUP Viewpoint 1.
Pierce Lefebvre Consulting
53
2.6 Tourism and Outdoor Recreation Tourism and recreation are becoming increasingly important to the socio-economic foundations of HG/QCI. Tourism and outdoor recreation are defined for the purposes of this assessment as follows: • The tourism industry is based on spending by non-resident travellers to the Islands on such
activities as accommodation and food, recreation activities and transportation (defined in this way, tourism would include business travellers);
• Outdoor recreation is defined as non-commercial outdoor activities enjoyed by residents and non-residents of the Islands (extracted from BC MSRM. 2004. page 9). Public recreation does not involve the use of a commercial guide for which a fee is paid.
The following sections of the report review the contribution of the HG/QCI tourism sector to the Islands economy, the growth potential of that sector and the likely impacts of the HG/QCI Land Use Plan on tourism. The extent of public recreation activities and the impacts of the Land Use Plan on public recreation are also reviewed.
2.6.1 Overview of HG/QCI Tourism Sector BC Stats estimates that in 2001, tourism on HG/QCI was the third most significant employment generator, accounting for 12% of basic sector employment (292 direct and indirect jobs), behind the public sector (41%) and the forest sector (28%). (BC MSRM. 2004. pages 4 and 10) The tourism sector’s contribution to HG/QCI basic sector income (5% of total before-tax income) is not as high as the contribution to basic sector employment, which reflects the seasonal nature of the employment and the relatively low wages and salaries (average of $16,100 per direct and indirect job linked to tourism). The BC Stats and Canada Census data are based on the occupation and income of HG/QCI residents at the time of the Canada Census. As a result, the economic dependency data do not reflect the jobs and income generated through hiring individuals who do not reside in HG/QCI. The tourism sector generates significant employment for non-locals. In particular, the HG/QCI recreational fishing lodge industry in 2002 generated 520 jobs, of which, 115 (22%) were held by local residents. (GSGislason & Associates Ltd. 2003a. pages 9 and 10). Some of the factors contributing to the growth of tourism on HG/QCI over the last 25 years include: • In 1982, BC Ferries started a regular car ferry service from Prince Rupert to Skidegate
thereby fostering the growth of motor vehicle touring, and as a result the food, accommodation, service and retail sector serving the tourism sector; local residents account for 93% of winter ferry traffic and 37% of summer ferry traffic. (BC Ferries. 2004. page 18)
• In 1981, UNESCO declared Nan Sdins Illnagaay (Ninstints) a World Heritage Site and in the
late 1980s, Gwaii Haanas National Park was created, generating significant opportunities for wilderness eco-tourism and contributing to the perception of HG/QCI as an international tourist destination.
• The increased popularity of fishing lodges and the fact that HG/QCI has some of the most

Pierce Lefebvre Consulting
54
productive sport fishing tidal waters in BC have led to an increase in fishing lodges, from none prior to 1985 to 23 fishing lodges/vessels currently in operation (and one more under construction).
• The increased popularity of eco-tourism and cultural tourism worldwide has contributed to the
growth of kayaking and boating in HG/QCI. Since 2001, growth in some HG/QCI tourism activity measures (e.g. ferry traffic, air traffic, fishing activity, park visitation) appears to have levelled off.46 Ferry traffic for the year ending March 2005 on the Skidegate to Prince Rupert route was 46,585 passengers (two way traffic counts), up 0.3% from 46,585 passengers for 2004 and roughly the same as the level over the last 5 years. (BC Ferries. 2005. page 7) Ten years ago ferry passenger traffic on that route was 53,314 passengers, but the drop may be primarily due to less local ferry travel. During the summer months, most if not all ferry sailings to and from the mainland are fully booked for vehicle traffic.47 The 2004 Haida Nation Tourism Business Opportunities Plan estimates that some 51,470 people visited HG/QCI in 2002 (return trips), which excludes travel by local residents (estimated at 14% of total air, ferry and boat traffic). Over half (55%) of the visitors to HG/QCI are BC residents. As shown on the following charts, some 49% of visitors to HG/QCI are attracted primarily by marine related activities such as fishing, boating, kayaking and beach activities. The other 51% visits HG/QCI for the outdoor activities, the cultural experiences, to relax or simply to visit friends and family. (Meadfield Consulting Inc. et al. 2004. pages 31, 32 and 33) Chart 11 Origins and Leisure Activities of Visitors to HG/QCI, 2002
Origins of Visitors to Haida Gwaii, 2002
British Columbia
55%Other
Canada25%
Overseas3%U.S.A.
17%
Primary Leisure Activities of Visitors to HG/QCI, 2002
Fishing27%
Sightseeing19%
Hiking10%
Kayaking7%
Relaxing4%
Walking3%
Camping2%
Boating2%
Other13%
Beach Activities13%
Source: 1. Origins of Visitors to Haida Gwaii, 2002: Meadfield Consulting Inc. et al. 2004. Prepared for Council of the Haida Nation and
Haida Tribal Society. page 32. 2. Primary Leisure Activities of Visitors: Based on data from Tourism BC survey during summer of 2002. As summarized in
Meadfield Consulting Inc. et al. 2004. page 33. 46 Estimates of total overnight visitor volume for BC have remained near the 22,000,000 level for the past 4 years (Tourism British Columbia, BC Tourism Performance Annual Estimates 2001 through 2004, http://www.tourismbc.com/template_list.asp?id=137, Accessed Sept.21, 2005). 47 For the Skidegate to Prince Rupert ferry, average vehicle utilization by week of service for 2004 ranges between 80% and 100% throughout the summer. (BC Ferries. 2004. page 23) The HG/QCI Land Use Plan Socio-Economic Base Case completed as part of the HG/QCI process refers to a long standing issue of wasted vehicle space on the HG/QCI ferry when commercial vehicle reserves are ultimately not used, but without sufficient notice to replace the space with tourist traffic that is being turned away because ferries are deemed “full”. (Holman, G. 2004. page 40).

Pierce Lefebvre Consulting
55
Visitor preferences are consistent with tourism activities and services offered on HG/QCI as some 41% of tourism businesses report offering marine based activities such as fishing, motor boat tours, etc. The following table shows the number of tourism operators that provide various activities and services. Individual operators often report more than one activity and the number of activities greatly exceeds the number of operators. (HG/QCI Land Use Planning Process. Background Report. 2003. page 154). Table 16 Number of HG/QCI Tourism Activities/Services
Number of HG/QCI Tourism Operators that Report Following Activity/ Services Total % of Total Front Country: Accommodation - B&B, Other < 5 rooms 34 17% Accommodation - Hotel, Motel, Other > 5 rooms 11 6% Museum 3 2% Golf course 2 1% Air Transport / Tours 7 4% 57 29% Marine-Based Marina 3 2% Fishing Lodges 17 9% Motor Boat Tours 8 4% Saltwater Fishing Charters 33 17% Sailing Adventures 6 3% Sea kayaking 12 6% Scuba diving 2 1% 81 41% Land-Based/ Freshwater Charters Land Transport / Tours 11 6% Camping 7 4% Freshwater fishing charters 6 3% Heritage Viewing 25 13% Hiking / Nature Viewing 6 3% Hunting (guide-outfitter) 1 1% Other 4 2% 60 30% Total Number of Activities 198 100%
Note: Individual operators often offer more than one activity, and the above number of activities greatly exceeds the number of operators. Source: HG/QCI Land Use Planning Process. Background Report. 2003. page 154.
2.6.2 Tourism Potential and Issues This section reviews the tourism potential of HG/QCI and some of the factors that may influence the growth prospects of that sector. 2.6.2.1 Front Country Tourism The growth of front country tourism is somewhat constrained by the remote location of HG/QCI and the high cost of reaching the Islands. Expanding the tourist season through the development

Pierce Lefebvre Consulting
56
of festivals and events in the shoulder season, and continuing to develop cultural tourism may be the best opportunities for growth. The most significant new front country tourism initiative currently underway on HG/QCI is construction of the Qay’Ilnagaay Lodge and Heritage Centre, located just outside Skidegate near the existing museum. The Qay’llnagaay project includes a 28 room high-end destination lodge, a restaurant, interpretive centre, a centre for performing arts to seat 250 people, the Bill Reid School of Art and teaching centre, a canoe shed, and an expanded museum and gift shop. The project was first envisioned in the 1970s, but really began in earnest approximately 10 years ago when construction of some of the project components commenced. The total cost for the Qay’llnagaay project is $19.2 million, with funding from a variety of sources including the Gwaii Trust Fund (a $60 million provincial and federal fund), Parks Canada, Indian and Northern Affairs Canada, the Gwaalagaa Naay Corporation (Skidegate Band Council) and the Haida Gwaii Museum Society. The projected cost for the lodge is $5.5 million and a partnership has been formed between the Gwaalagaa Naay Corporation and an experienced resort operator. The two initiatives will create approximately 45 full time and part time jobs, excluding the 100 person years of construction employment. (Indian and Northern Affairs Canada. www.ainc-inac.gc.ca/nr/ecd/bc/qlh_e.html. Accessed August 3rd, 2005,). Once in full operation, Qay’Ilnagaay may offer opportunities for pocket cruises to visit HG/QCI. Pocket cruises did visit some of the Haida heritage sites in Gwaii Haanas in the late 1980s, but the large groups of visitors proved unmanageable, and in the early 1990s the cruise ship visits were discontinued to protect the wilderness nature and integrity of the Haida heritage sites and the integrity of the park. (Gajda, Anna. 2003. Gwaii Haanas National Park Reserve and Haida Heritage Site. page 4). The Haida Nation Tourism Business Opportunities Plan provides detail on the existing cultural tourism resource base, and suggests that cultural tourism offers opportunities for growth. HG/QCI already has an extensive network of art, craft and retail outlets that display and sell Haida art, as well as periodic cultural music and dance performances at various venues. (Meadfield Consulting Inc. et al. 2004. page 20) Major retail shops/art galleries include the museum at Qay’llnagaay (which includes a gift shop), three gift shops in Skidegate, and another three or four in Old Massett. In addition, there are 6 individual artist carvers and weavers who work in Old Massett and sell their art directly to the public. There are also gift and retail shops in the communities of Masset, Queen Charlotte City, Port Clements and Sandspit. There is no available estimate of the number of individuals who derive an income from producing and selling Haida art in HG/QCI, or the potential for further market development. The tourism market in the summer is reasonably well developed, and the most growth potential may be in attracting tourists to the Islands in the shoulder season through the development of cultural festivals and events, and the development of Haida cultural heritage tours/ learning vacations. (Meadfield Consulting Inc. et al. 2004. page A-47). The availability of cedar for carving canoes, paddles and artifacts is essential to continued development of the Haida art markets. Haida Nation individuals and groups can obtain “Free Use Permits” (FUP) of up to 50 m3 of cedar, free of stumpage charges, per individual per year, for cultural and traditional use provided the timber is not used for commercial purposes or for

Pierce Lefebvre Consulting
57
construction of residential buildings. A report on FUPs in HG/QCI by a University of Toronto Faculty of Forestry student (Pansino, Christine. 2004. page 5) shows that between 1996 and 2002, total FUP timber volume on HG/QCI has averaged 620 m3 per year, and ranged between 126 m3 in 1996, and 1,245 m3 in 2001. In 2003, the Haida Nation obtained FUPs for 24,932 m3 of cedar but this included 10,000 m3 for the Qay’Ilnagaay Heritage Centre, 13,000 m3 for a proposed cultural centre in Old Massett, and 1,932 m3 for other uses. The report concludes that cultural demand for cedar is projected to increase with increased Haida population and the resurgence in the arts and cultural activities. (Pansino, Christine. 2004. page 5) There are many other aspects of front country tourism that may offer potential such as developing better camping facilities, restaurants and other services for tourists visiting HG/QCI. The Haida Nation Tourism Business Opportunities Plan lists the development of accommodation and campgrounds/RV parks as having very high product potential (Meadfield Consulting Inc. et al. 2004. page A-48). The Village of Old Massett is developing additional camping facilities on North Beach at Hiellen, near Tow Hill. One of the key constraints to tourism growth is the remoteness of HG/QCI and the relatively high cost to reach the islands. BC Ferry Services Inc. for example, estimated a deficit of $ 10.5 million on the Prince Rupert-Skidegate route for fiscal 2003/2004 (revenues were estimated at $4.1 million and expenses are $14.6 million). The deficit is covered by various grants and subsidies from provincial and federal agencies.48 Expanding the tourist season with festivals and events in the shoulder season, particularly when BC Ferries does not operate at capacity, may be an effective way to facilitate growth in tourism. 2.6.2.2 Fishing Lodges and Guided Angling The guided sport fishing sector includes fishing lodges and sport fishing charters. There are 23 sport fishing lodges/vessels that are currently operating in HG/QCI and an estimated 30 saltwater and/or freshwater fishing charters. The first sportfishing lodge on HG/QCI began operation on Langara Island in 1985. The number of lodges/vessels increased to 8 by 1990, 13 by 1994, and 23 lodges/vessels in 2005.49 Together these lodges/vessels have a capacity for 602 guests. (Meadfield Consulting Inc. 2004. page 17; supplemented by data from individual web sites). In 2002, a survey of 18 sportfishing lodges (8 land or shore-based and 10 floating) in HG/QCI reported a capacity of 519 beds, or approximately 16% less than what exists today, and 520
48 By comparison, the Inside Passage Route is subsidized by approximately $7 million per year, with budgeted revenues of approximately $11 million and expenses of $18 million. Source: BC Ferries. 2004. Northern Strategy Public Consultation. Page 28; also, BC Ferry Services Inc. 2005. Annual Report to the BC Ferry Commissioner. page 7. 49 The number of sportfishing lodges/vessels varies slightly depending on whether individual lodges/vessels owned by the same operator are counted as separate operations. For example, the Queen Charlotte Lodge has a charter boat, the MV Driftwood, which is associated with the lodge but is counted as a separate operation. The 23 lodges/vessels include Westwind Tugboat Adventures even though it operates only part of the season in the QCI area.

Pierce Lefebvre Consulting
58
seasonal and full time jobs (245 PY). (GSGislason & Associates Ltd. 2003a. pages 4 and 6). The percentage of jobs held by local residents grew from an estimated 9% in 1994, to 22% (115 jobs or 50 PY) by 2002. There is one locally owned and staffed lodge in Masset and several companies have made concerted efforts to hire QCI residents. (GSGislason & Associates Ltd. 2003a. pages 9 and 10) The presence of fishing lodges is highly contentious for the Haida Nation as operations are seasonal, most of the employees are hired off-Islands, and groceries and supplies are generally brought in from off-Islands. (HG/QCI Land Use Planning Process. 2003. page 156) HG/QCI lodges in 2002 reported 13,300 clients, which represent 26% of the estimated 51,470 visitors to HG/QCI in 2002. In 2002, 51% of the clients of fishing lodges were from the U.S. and 4% were from overseas markets. The value of the Canadian dollar relative to the American dollar is important in keeping HG/QCI competitive relative to lodges in Alaska and elsewhere, and the strengthening of the Canadian dollar in the last three years has negatively affected the industry in HG/QCI. This is a very competitive industry that competes not only against other fishing lodges, but also against other travel market segments with non-fishing alternatives, particularly in the important corporate and incentive segment of the industry. Factors such as the cost of fuel, air charters, insurance and the regulatory environment are important in keeping the industry competitive. (GSGislason & Associates Ltd. 2003a. pages 11 and 12) There are approximately 30 saltwater and/or freshwater fishing charters operating on HG/QCI. The number of operators reporting that they offer sportfishing charters is higher, at 33 operators for saltwater fishing and 6 for freshwater fishing (HQ/QCI Land Use Planning Process. 2003. page 154), but these include some of the fishing lodges, and most freshwater guides also offer saltwater fishing charters. The Visitor Information Centre lists 27 fishing charters operating on HG/QCI, 26 are based in HG/QCI and one is based in Prince Rupert.50 The popularity of sportfishing charters has declined in Coastal BC in the last decade, with the number of sportfishing charters declining by 50% between 1994 and 2002. (GSGislason & Associates Ltd. 2003b. page 1) HG/QCI accounts for 20% of the Class 2 Waters in BC and HG/QCI has eight Class 2 streams under the BC Classified Waters Systems, including Yakoun, Tlell, Copper, Pallant, Mamin, Honna, Deena and Datlamen. In 2002/2003, there were six individuals registered as freshwater fishing guides with a combined quota of 3,228 user days. (HG/QCI Land Use Planning Process. 2003. Background Report. page 157) The socio-economic impacts of the guided angling and sportsfishing lodges in HG/QCI are estimated in Table 16 following. The table shows that sportfishing lodges and charters in 2004 generated an estimated 178 seasonal jobs for local residents in HG/QCI, which translates into 76 direct PY of employment. Sportfishing on HG/QCI also generates indirect and induced impacts from the local purchases of goods and services. BC Stats estimates that in HG/QCI, every direct PY of employment in the tourism sector generates 0.13 PY in indirect and induced employment (assuming no migration). (Horne, Dr. Garry. BC Stats. 2003)
50 Queen Charlotte Islands Visitor Information website. www.qcinfo.ca/fishing.html; accessed July 5th, 2005.

Pierce Lefebvre Consulting
59
Table 17 Socio-Economic Impacts of HG/QCI Sportfishing Lodges and Charters
Economic Impacts of Sportfishing Lodges and Sportfishing Charters
Number of Operators Employment
Person Years
Wages and Salaries
($ million)
Industry Revenues $ million)
Government Revenues ($
million)
Net Economic Value ($ million)
Sportfishing Lodges - 2004 Est. Local HG/QCI Residents 133 58 $1.9 Non-Residents 470 226 $8.9 Total - Lodges 2004 Est. 23 603 284 $10.8 $44.1 $2.9 $5.64
Sportfishing Charters - 2004 Local HG/QCI Residents 30 45 18 $0.6 $1.8 Non-Residents unknown unknown unknown unknown unknown Total – Charters 30 45 18 $0.6 $1.8 $0.02 $0.14
Lodges and Charters - 2004 Local HG/QCI Residents 178 76 $2.5 Non-Residents 470 226 $8.9 Total Lodges and Charters - 2004 53 648 302 $11.4 $45.9 $2.92 $5.78
Assumptions: Impact per Charter Business 1.5 0.6 $0.02 $0.06 $0.0006
Sportfishing Lodges - 2002 Local HG/QCI Residents 115 50 $1.6 Non-Residents 405 195 $7.7 Total - Lodges 2002 520 245 $9.3 $38.0 $2.50
Number of Lodges - 2004 23
Net Economic Value as a % 5% 5% Notes: 1. The 2004 estimates are based on 2002 data after adjusting for a 16% increase in client bed capacity from 519 client beds in 2002
to 602 client beds in 2004. 2. The number of operations varies slightly depending on whether different lodges/vessels that are owned by the same operator are
counted as one or two operations. 3. The net economic value is estimated as 5% of direct wages and benefits, 5% of total industry revenues and the contribution to
governments in terms of hotel tax, GST and PST. Source: Data are updated based on the number of operators for 2004, derived from a review of various websites and listings of fishing lodges and charter companies operating in HG/QCI. Economic data assumptions are based on: • GSGislason & Associates ltd. 2003b. Saltwater Fishing Charters in BC - An Economic Profile. Economic Development Branch.
BC MSRM Skeena Region. page 1. • GSGislason & Associates Ltd. 2003a. QCI Fishing Lodge Industry. BC Ministry of Agriculture, Food and Fisheries. pages 9 and
10. The above table also shows the provincial impacts of the sportfishing sector in HG/QCI in terms of direct employment, direct wages and salaries, and net economic value. The province-wide net economic value generated by sportfishing on and near HG/QCI is estimated at $5.78 million. 2.6.2.3 Ecotourism and Adventure Travel Ecotourism on HG/QCI consists primarily of adventure tours into Gwaii Haanas and elsewhere around HG/QCI. In HG/QCI, kayaking, boat touring and sailing adventures are typically offered in conjunction with the touring of ancient Haida villages. Visitation to Gwaii Haanas is approximately 10,000 visitor nights annually, which represents approximately 2,000 visitors per year, or approximately 4% of the 51,470 people visiting HG/QCI

Pierce Lefebvre Consulting
60
each year. The Gwaii Haanas Park Management Plan restricts the number of visitors to 11,000 user days for guided activities, 11,000 user days for independent visitors and 11,000 user days for Haida operators, for a total of 33,000 visitor nights. Gwaii Haanas is therefore operating at one third of permitted capacity, although the “carrying capacity” of Gwaii Haanas may be closer to 12,000 user days/nights than the maximum of 33,000 user days/nights. There was some expectation when Gwaii Haanas was created that it would attract 70,000 visitors per year, but the need to retain the integrity of the ecosystems and cultural sites has led to the capacity restrictions. (Gajda, Anna. Gwaii Haanas National Park Reserve and Haida Heritage Site. 2003. pages 4 and 10) Fees for visiting Gwaii Haanas are $10 per night, and frequent users can purchase season passes that offer discounted rates. At $10 per night, the 10,000 visitor nights translate into fees of approximately $100,000. The Haida Watchmen program provides guided tours to the five most frequently visited cultural sites in Gwaii Haanas from May to September, thereby providing employment to approximately 20 people. There are an estimated 11 adventure operators that offer adventure tours on HG/QCI. This is in addition to sportfishing charters that also offer boat and wildlife tours (for example, Aay Oo Guiding Services Inc. is a Haida owned sportfishing charter based in Skidegate that has branched out into offering cultural boat and bus tours of HG/QCI). Also excluded are companies that offer “front country” bus tours and air tours of HG/QCI, as well as adventure companies that are based in other areas of Coastal BC and may offer one or two tours to HG/QCI as part of their product line. In summer 2005, Parks Canada listed 17 commercial operators that were licensed to operate in Gwaii Haanas, and 4 others that were licensed in 2004 but had not yet renewed their licence. Of these, 9 were based in HG/QCI including Aay Oo Guiding Services from Skidegate, 2 from Rose Harbour at the southern tip of HG/QCI, and another 6 from Queen Charlotte City and other communities on HG/QCI. The other 8 licensed operators are based in BC (mainly in Southern BC) and Alberta, and tend to offer HG/QCI as one of the destinations for their sailing and kayaking tours. (Parks Canada. www.pc.gc.ca/pn-np/bc/gwaiihaanas/visit/visit7_e.asp. accessed July 7th, 2005). Estimating the employment impacts of adventure tour operators is highly speculative without a detailed survey of operators, as each offers a unique product. For example, out of 6 kayaking tour operators operating in HG/QCI, two have lodging facilities in Rose Harbour, three operate tours with a mothership boat and one offers a multitude of tours possibilities. The following table summarizes the estimated direct economic impacts of these adventure operators:

Pierce Lefebvre Consulting
61
Table 18 Socio-Economic Impacts from Adventure Operators and Gwaii Haanas
Economic Impacts from Adventure Tour Operators Estimated for 2004 Number of Operators 11 Operators Direct Employment 60 Jobs Direct Person Years 25 Person Years
Indirect and Induced PY in HG/QCI 3 Person Years Wages and Salaries ($ million) $1.00 Million Industry Revenues $ million) $2.50 Million
Government Revenues ($ million) $0.02 Million Net Economic Value ($ million) $0.20 Million
Gwaii Haanas – Additional Impacts
Additional Net Economic Value Related to Gwaii Haanas $0.1 Million Notes: 1. Estimates include data for the following operations:
Marine Tours • Anvil Cove Charters • Moresby Explorers • Archipelago Ventures Ltd. • Queen Charlotte Adventures • Butterfly Tours • Rose Harbour Guest House • Dawn Mist Tours Land Tours • Gwaii Eco Tours • Delkatla Bay Birding Tours • Gwaii Haanas Guest House & Kayaks • Hunjaa-Laa-Guusuus - Gilbert Parnnell
2. The list of operators is based on information from the Queen Charlotte Visitor Information Centre. 3. Economic impact data, including government revenues per operator, are estimated based on information from the individual web
sites of each operator as well as data from: Stuart Gale & Associates and Pierce Lefebvre Consulting. 2003. Building Blocks for Economic Development and Analysis. Sea Kayaking Tour Operators. BC MSRM. page 6.
4. The net economic value for operators is estimated as 5% of direct wages and benefits, 5% of total industry revenues, and $1,500 per operator in government permitting fees. Section 1.1 of this report (Project Methodology) defines net economic value and explains the assumptions.
5. Additional net economic value related to Gwaii Haanas includes the fees for visiting the park (10,000 visitor nights at $10 per night). Estimates of “willingness to pay” over and above user fees are included in the net economic value attributed to “public recreation”.
As indicated above, adventure tour operators generate an estimated 60 direct jobs in HG/QCI, which translates to approximately 25 Person Years of direct employment and $1 million in direct wages and salaries. The adventure tourism sector would also generate indirect and induced employment. The net economic value from these operations is estimated at $0.2 million. Most adventure touring companies based in HG/QCI offer tours that are marine based. There are many trails on HG/QCI, and there may be some limited opportunity for adventure touring companies to offer a broader range of land based adventures, for example, ATV touring and mountain biking. 2.6.2.4 Guided Hunting There is one guide-outfitter on HG/QCI and most of his business is related to black bear trophy hunting (although deer hunts, elk hunts, guided fishing and wildlife viewing are also offered by this operator).

Pierce Lefebvre Consulting
62
Table 19 Hunting Effort by Guided Hunting Clients in HG/QCI
Guide Outfitting HG/QCI –
2001/2002 Season BC - 2002 % of BC Kills (All Big Game) 37 (note 1) 4,182 0.9% Hunting Clients (All Non-BC Residents) 58 5,144 1.1% Hunter Days 336 44,487 0.8%
Notes: 1. For HG/QCI, the breakdown of number of kills and number of hunters by residents and non-residents are based on the number of
hunter days. All big game kills in the HG/QCI season by non-residents are black bear. (Based on BC Ministry of Water, Land and Air Protection Big Game Hunting Statistics for 2001/2002, as reported in Economic Planning Group et al. 2003. page 48.) More detail is presented in Appendix 3.
2. A more recent analysis of the number of bears killed in HG/QCI shows that non-residents killed an average of 15 black bears per year between 1981 and 1999, 48 black bears in 2000 and an average of 36 black bears per year in 2001, 2002 and 2003. (Source: personal communication with Leah Malkinson, ILM Bureau/ BCMAL based on data from the BC Ministry of Environment).
Source: HG/QCI: Based on BC Ministry of Water, Land and Air Protection Big Game Hunting Statistics for 2001/2002, as reported in: Economic Planning Group et al. 2003. page 48. More detail is presented in Appendix 3. BC Data: Pacific Analytics Inc. 2003. The Guide Outfitting Industry in BC - An Economic Analysis of 2002. page 6 and 7. Hunting by BC and local residents in HG/QCI is much more significant than guided hunting, due to the abundance of Sitka black-tailed deer on HG/QCI. Deer is not a native species to HG/QCI and the lack of natural predators has allowed the deer population to grow to undesirable levels. As a result, during hunting season, individual hunters are allowed to kill as many as 15 deer each. (HG/QCI Land Use Planning Process. Background Report. Page 163) There is limited potential for increasing guided hunting opportunities in HG/QCI as non-resident hunters currently prefer to hunt moose, bear and other large mammals rather than the small deer that populate the Islands. The net economic value for the guide-outfitter operating on HG/QCI is estimated at $32,534 per year, based on average socio-economic impacts per guided hunting day for the Skeena region and 336 guided hunting days for HG/QCI. The net economic value estimate assumes public sector rents of $12,768 (based on $38 per guided hunting day in licenses and taxes), labour rents of $6,595 (assuming 5% of wages and salaries), and industry rents of $13,171 (assuming 5% of estimated revenues). Appendix 3 provides detail on these estimates. 2.6.2.5 Conclusion The tourism sector continues to offer a real and significant opportunity to diversify the economy of HG/QCI. The tourism market in HG/QCI may be maturing however, with key indicators such as ferry traffic and the number of visitors to the islands actually dropping. The sportfishing and adventure travel tourism sector will face challenges in the coming years, particularly if the Canadian dollar remains relatively high compared to the US dollar. The distance of HG/QCI from major centres and the cost to reach HG/QCI will continue to act as a constraint to growth. Ferry capacity will be a barrier to increasing summer vehicle traffic to HG/QCI. As a result, any opportunity to extend the tourist season into the shoulder seasons may be most beneficial to the HG/QCI economy.
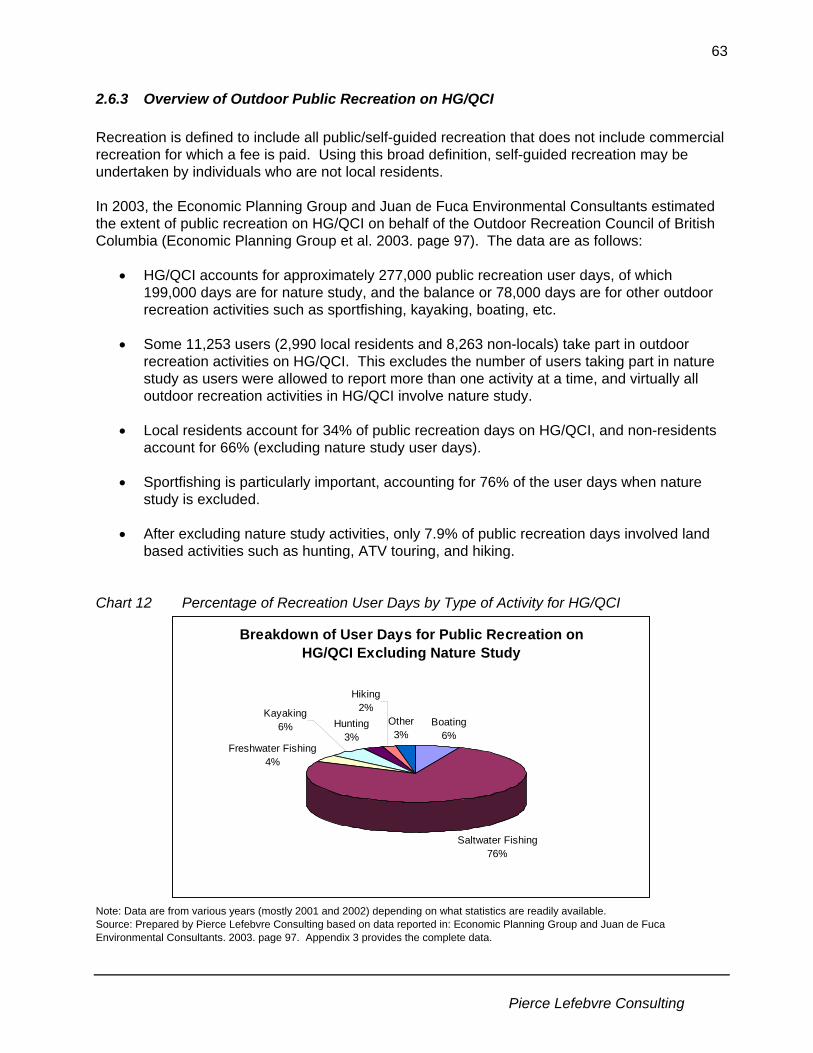
Pierce Lefebvre Consulting
63
2.6.3 Overview of Outdoor Public Recreation on HG/QCI Recreation is defined to include all public/self-guided recreation that does not include commercial recreation for which a fee is paid. Using this broad definition, self-guided recreation may be undertaken by individuals who are not local residents. In 2003, the Economic Planning Group and Juan de Fuca Environmental Consultants estimated the extent of public recreation on HG/QCI on behalf of the Outdoor Recreation Council of British Columbia (Economic Planning Group et al. 2003. page 97). The data are as follows:
• HG/QCI accounts for approximately 277,000 public recreation user days, of which 199,000 days are for nature study, and the balance or 78,000 days are for other outdoor recreation activities such as sportfishing, kayaking, boating, etc.
• Some 11,253 users (2,990 local residents and 8,263 non-locals) take part in outdoor
recreation activities on HG/QCI. This excludes the number of users taking part in nature study as users were allowed to report more than one activity at a time, and virtually all outdoor recreation activities in HG/QCI involve nature study.
• Local residents account for 34% of public recreation days on HG/QCI, and non-residents
account for 66% (excluding nature study user days).
• Sportfishing is particularly important, accounting for 76% of the user days when nature study is excluded.
• After excluding nature study activities, only 7.9% of public recreation days involved land
based activities such as hunting, ATV touring, and hiking. Chart 12 Percentage of Recreation User Days by Type of Activity for HG/QCI
Breakdown of User Days for Public Recreation on HG/QCI Excluding Nature Study
Boating6%
Saltwater Fishing76%
Hunting3%
Other3%
Hiking2%Kayaking
6%
Freshwater Fishing4%
Note: Data are from various years (mostly 2001 and 2002) depending on what statistics are readily available. Source: Prepared by Pierce Lefebvre Consulting based on data reported in: Economic Planning Group and Juan de Fuca Environmental Consultants. 2003. page 97. Appendix 3 provides the complete data.

Pierce Lefebvre Consulting
64
The importance of sportfishing is also highlighted in the following chart which shows that HG/QCI accounts for 9% of BC’s non-resident tidal angler days and 3.2% of BC’s resident angler days, compared to HG/QCI covering only approximately 1.1% of the BC landbase. Chart 13 Selected Tourism and Recreation Activities in HG/QCI as a % of BC (2001/2002)
Selected B.C. Tourism & Recreat ion Act ivit ies in HG/ QCI as a % of B.C.
9.0%
3.2%
0.1%
2.6%1.1%
0.8%0.4%0.4%0%
2%
4%
6%
8%
10%
12%
Freshwaterangler days
ResidentHunting Days
ResidentHunters
Non- ResidentHunter Days
Land Area Big Gam eResidentHarvest
Resident TidalAngler Days
Non- ResidentTidal Angler
Days
Source: Various – Appendix 3 provides the complete data. The above chart shows that hunting on HG/QCI accounts for 2.6% of the number of big game kills by BC residents, a result of the deer harvest. The hunting statistics on HG/QCI are understated as Haida people do not report hunting statistics to the Province. The Haida population represents approximately 37% of the total HG/QCI population (Census Data 2001, Appendix 4 provides more detail), and given the traditional importance of hunting as food source for the Haida Nation, the HG/QCI hunting statistics are likely to be understated by at least 59%. Public recreation includes camping and recreation activities such as swimming, picnicking, and other beach activities that take place in provincial and national parks. These are not specifically referred to in the Outdoor Recreation Council of BC data, except to the extent that they may be included in the 199,000 “nature study” recreation days. HG/QCI has numerous national and provincial park campsites, recreation camping sites, and private campgrounds and RV parks. These are detailed in the Haida Nation Tourism Business Opportunities Plan and include the 2 campgrounds in Naikoon Park (combined capacity of 83 sites), 7 recreation sites on Crown lands, including sites in Rennell Sound, Gray Bay and Moresby Camp, and various privately owned and municipal campsites near the various HG/QCI communities. (Meadfield Consulting Inc. 2004. page 7) There are also various wilderness sites in Gwaii Haanas national park. HG/QCI also has various hiking trails. Some of the most popular are in Naikoon Provincial Park and include Cape Fife Trail, East Beach Hike, Hike to Blow Hole, and the Pesuta Shipwreck hike. Other popular hikes are located in Rennell Sound, Skidegate (Spirit Lake Hiking trail), Queen Charlotte (Sleeping Beauty hike and Riley Creek Trail), Tlell, and Yakoun Lake. There are no popular, designated and well-marked trails in Gwaii Haanas. The net economic value of non-commercial recreation activities may be represented by the
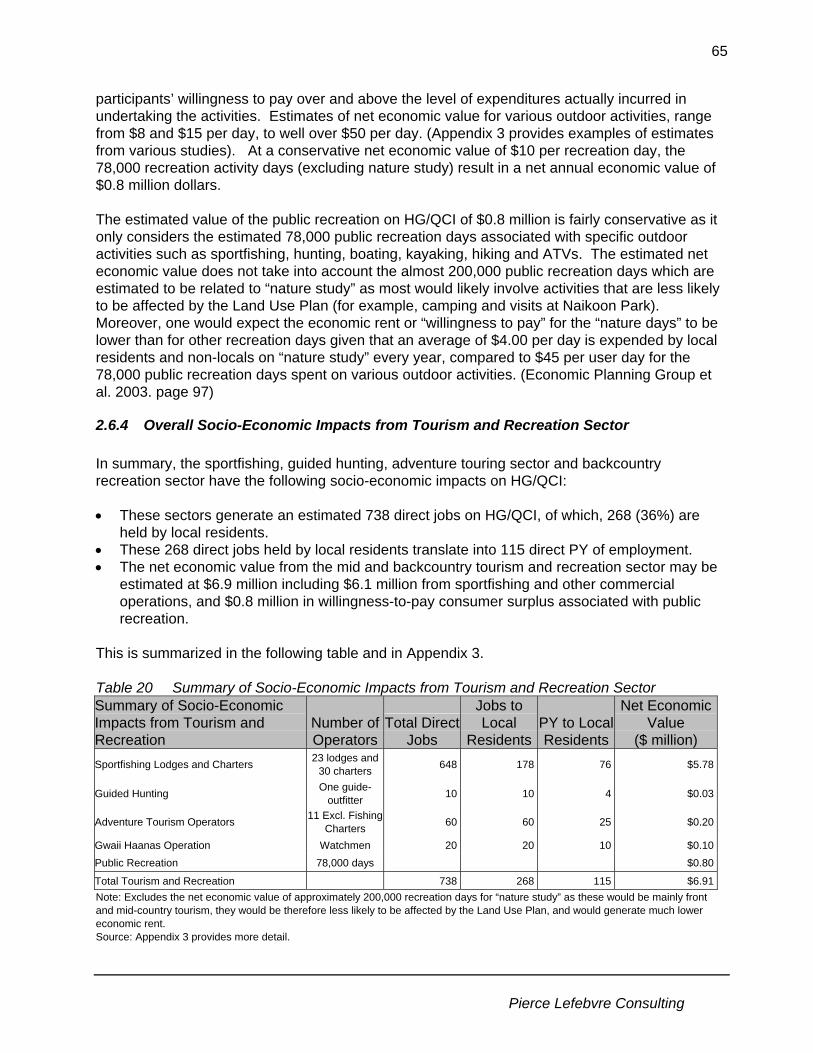
Pierce Lefebvre Consulting
65
participants’ willingness to pay over and above the level of expenditures actually incurred in undertaking the activities. Estimates of net economic value for various outdoor activities, range from $8 and $15 per day, to well over $50 per day. (Appendix 3 provides examples of estimates from various studies). At a conservative net economic value of $10 per recreation day, the 78,000 recreation activity days (excluding nature study) result in a net annual economic value of $0.8 million dollars. The estimated value of the public recreation on HG/QCI of $0.8 million is fairly conservative as it only considers the estimated 78,000 public recreation days associated with specific outdoor activities such as sportfishing, hunting, boating, kayaking, hiking and ATVs. The estimated net economic value does not take into account the almost 200,000 public recreation days which are estimated to be related to “nature study” as most would likely involve activities that are less likely to be affected by the Land Use Plan (for example, camping and visits at Naikoon Park). Moreover, one would expect the economic rent or “willingness to pay” for the “nature days” to be lower than for other recreation days given that an average of $4.00 per day is expended by local residents and non-locals on “nature study” every year, compared to $45 per user day for the 78,000 public recreation days spent on various outdoor activities. (Economic Planning Group et al. 2003. page 97)
2.6.4 Overall Socio-Economic Impacts from Tourism and Recreation Sector In summary, the sportfishing, guided hunting, adventure touring sector and backcountry recreation sector have the following socio-economic impacts on HG/QCI: • These sectors generate an estimated 738 direct jobs on HG/QCI, of which, 268 (36%) are
held by local residents. • These 268 direct jobs held by local residents translate into 115 direct PY of employment. • The net economic value from the mid and backcountry tourism and recreation sector may be
estimated at $6.9 million including $6.1 million from sportfishing and other commercial operations, and $0.8 million in willingness-to-pay consumer surplus associated with public recreation.
This is summarized in the following table and in Appendix 3. Table 20 Summary of Socio-Economic Impacts from Tourism and Recreation Sector Summary of Socio-Economic Impacts from Tourism and Recreation
Number of Operators
Total Direct Jobs
Jobs to Local
ResidentsPY to Local Residents
Net Economic Value
($ million) Sportfishing Lodges and Charters 23 lodges and
30 charters 648 178 76 $5.78
Guided Hunting One guide-outfitter 10 10 4 $0.03
Adventure Tourism Operators 11 Excl. Fishing Charters 60 60 25 $0.20
Gwaii Haanas Operation Watchmen 20 20 10 $0.10Public Recreation 78,000 days $0.80
Total Tourism and Recreation 738 268 115 $6.91Note: Excludes the net economic value of approximately 200,000 recreation days for “nature study” as these would be mainly front and mid-country tourism, they would be therefore less likely to be affected by the Land Use Plan, and would generate much lower economic rent. Source: Appendix 3 provides more detail.

Pierce Lefebvre Consulting
66
2.6.5 Impact of HG/QCI Land Use Plan on the Tourism and Recreation Sectors The impacts of the Land Use Plan on tourism and recreation may be assessed from the following perspectives: • The extent to which scenic areas gain increased protection through the Land Use Plan; • The extent to which tourism and recreation facilities and features are insulated from extractive
resource development incursion; • The extent to which fish and wildlife habitat are protected from resource development
activities; • The extent to which specific tourism and recreation management initiatives encourage or
discourage tourism and recreation activities; and • The extent to with the Land Use Plan provides greater land use and operational certainty for
tourism service providers, as well as a more positive international perception of a locally endorsed, environmentally benign and socially responsible tourism industry.
2.6.5.1 Protection of Scenic Areas Marine based activities dominate the tourism and recreation sectors on HG/QCI, and as a result, the protection of scenic areas and viewscapes along the shoreline of HG/QCI is important to these sectors. A visual inventory has been developed identifying 255,655 hectares of scenic areas (outside Gwaii Haanas, Naikoon Park and other legislated protected areas) which warrant special management practices to protect viewscapes. These represent approximately 25% of the landbase of HG/QCI, and are managed according to three different Visual Quality Objective (VQO) classifications: retention, partial retention and modification. Agreement was reached in the LUP process to enable this visual inventory and the associated visual quality classes, subject to further public review to confirm the visual quality classes. The LUP agreement includes various management recommendations with respect to the implementation of visual quality management. The analysis that follows assumes that the socio-economic value of a scenic area is better preserved by excluding resource development activities entirely, rather than managing resource development activities according to requirements of the various VQO classifications (i.e. if some level of protection is good, a higher level of protection is better). This assumption may not be valid if applying a higher degree of protection to say, retention VQO areas, does not result in greater visual quality than visual management under the retention VQO class.

Pierce Lefebvre Consulting
67
Table 21 Impact of Land Use Viewpoints on Scenic Areas in HG/QCI
Current Management
Current Reality
LUP Viewpoint 1 LUP Viewpoint 2 HG/QCI
Community Watersheds and
Scenic Areas
Total HG/QCI
(ha)
Private, Fed
lands & IR Protected General Protected General Protected General Protected Haida Cedar/
MAMU General
Total Land Base 1,004,764 2.2% 22.4% 75.4% 41.4% 56.5% 37.7% 60.1% 42.0% 3.0% 52.9%Scenic Areas (Timber Supply Review 2): R- Retention 52,365 3.6% 0.9% 95.5% 53.6% 42.8% 53.2% 43.3% 55.5% 3.2% 37.7%PR - Partial Retention 148,947 1.5% 0.1% 98.4% 14.9% 83.6% 14.1% 84.4% 16.8% 4.6% 77.1%M - Modification 54,343 4.3% 0.0% 95.7% 4.0% 91.7% 3.8% 91.9% 4.5% 6.3% 84.9%
Total Scenic Areas 255,655 2.5% 0.2% 97.3% 20.5% 76.9% 19.9% 77.6% 22.1% 4.7% 70.7% By definition, under the Current Management scenario, none of those scenic areas are within the protected areas. Under the Current Reality scenario and LUP Viewpoint 1, more than half of the full retention scenic areas and approximately 15% of the partial retention areas would become part of protected areas. As shown on the table, LUP Viewpoint 2 would be even more protective of viewscapes mainly because it would also protect the scenic areas in Haida Cedar and MAMU areas, bringing the total of retention VQO areas fully protected to almost 60%, and partial retention VQO areas fully protected to over 20%. 2.6.5.2 Protection of Tourism and Recreational Values The following table shows the degree to which the proposed protected areas (PAs) under each land use scenario would help conserve tourism and recreation values. Table 22 Impact of Land Use Plan Viewpoints on Recreational Values in HG/QCI
Current Management
Current Reality
LUP Viewpoint 1 LUP Viewpoint 2 HG/QCI
Tourism and Recreation
Values
Total HG/QCI
Private, Fed
Lands & IR Protected General Protected General Protected General Protected
Haida Cedar/ MAMU
General
Total Land Base 1,004,764 2.2% 22.4% 75.4% 41.4% 56.5% 37.7% 60.1% 42.0% 3.0% 52.9% Existing Tourism Facilities: Fishing Lodges 24 37.5% 4.2% 58.3% 37.5% 25.0% 33.3% 29.2% 37.5% 0.0% 25.0% Other Lodges 23 82.6% 13.0% 4.3% 13.0% 4.3% 13.0% 4.3% 13.0% 0.0% 4.3% Other Facilities 33 81.8% 3.0% 15.2% 3.0% 15.2% 3.0% 15.2% 3.0% 0.0% 15.2% Existing Tourism Features: Anchorages 51 2.0% 45.1% 52.9% 68.6% 29.4% 68.6% 29.4% 68.6% 0.0% 29.4% Recreation Trails (km) 247 7.3% 45.2% 47.6% 64.1% 28.6% 53.4% 39.3% 64.1% 1.5% 27.1% Note: The number of sportfishing lodges/vessels includes 23 lodges that are currently operating in HG/QCI and one under construction. About half of the lodges are floating lodges, and the land use designation for these and the anchorages are based on the nearest point of land. The data in the above table show the following:

Pierce Lefebvre Consulting
68
• Under Current Management, only 1 of 24 fishing lodges/vessels is in a PA, whereas under LUP Viewpoint 1, 33% (8 lodges) would be in or near PAs. Under the Current Reality scenario and LUP Viewpoint 2, 38% (9 lodges) would be in or near PAs. Some 38% (8 fishing lodges), and over 80% of other lodging facilities are on private lands and would not be directly affected by any land use plan viewpoints.
• Under Current Management, 45% of anchorages, and 45% of recreation trails are in or near
existing legislated PAs. The other three management scenarios show the same number of anchorages (35 anchorages) near protected areas, but under LUP Viewpoint 1, some 53% of trails would be in PAs and under the Current Reality and LUP Viewpoint 2, some 64% of trails would be in PAs and another 1.5% would be in Haida cedar and MAMU areas.
2.6.5.3 Protection of Fish and Wildlife Habitat Sportfishing is the most important recreational activity on HG/QCI. As noted earlier in the commercial fishing section, there are some important salmon, trout and char streams on HG/QCI such as the Yakoun River, Davidson Creek, Tlell River, and Pallant Creek, but most of the commercial, sport and subsistence salmon fishery depends on large non-local stocks from the Skeena and Nass River and from Alaska (BC MSRM. 2004. page 14). LUP Viewpoint 2 provides specific management recommendations to protect hydroriparian ecosystems in all fish bearing watersheds from adverse impacts associated with logging. Perspective 2 also includes the protection of six specific watersheds with high fisheries values, from mineral exploration and/or mining. LUP Viewpoint 1 does not include specific management initiatives with respect to hydroriparian ecosystems, that are incremental to the Forest and Range Practices Act, but does achieve a high degree of protection (67%) of these ecosystems through protected areas and old growth reserve deployment. This is discussed more thoroughly in the Ecological Risk Assessment for the HG/QCI Land Use Plan Viewpoints (Veridian Ecological Consulting, 2006). Hydroriparian ecosystem protection should be beneficial to the modest proportion of the recreational sport fishing activity that relies on HG/QCI freshwater streams, with LUP Viewpoint 2 providing a greater degree of protection than Viewpoint 1. Wildlife habitat preservation resulting from protected areas and old growth management areas recommended in the LUP viewpoints should help support wildlife viewing, guided hunting and non-guided hunting. Both LUP Viewpoint 1 and LUP Viewpoint 2 provide enhanced levels of habitat protection relative to Current Management, however Viewpoint 2 provides more protection than Viewpoint 1 through more protected areas, more old growth retention and more extensive riparian reserves. The Land Use Plan recommendations include agreed upon specific management direction for black bears, including provisions for denning habitat, escape trees, critical shoreline habitat, and avoidance of human/bear conflict. Viewpoint 2 provides additional measures for management of critical riparian bear habitats as well as suggestions for access management. These measures should help to maintain or enhance the unique HG/QCI bear populations, and the recreation and tourism activities that depend on them. LUP Viewpoint 2 would prohibit black bear hunting except for ceremonial use or in the event of specific safety issues. Disallowing bear hunting on HG/QCI could result in the loss of up to 10
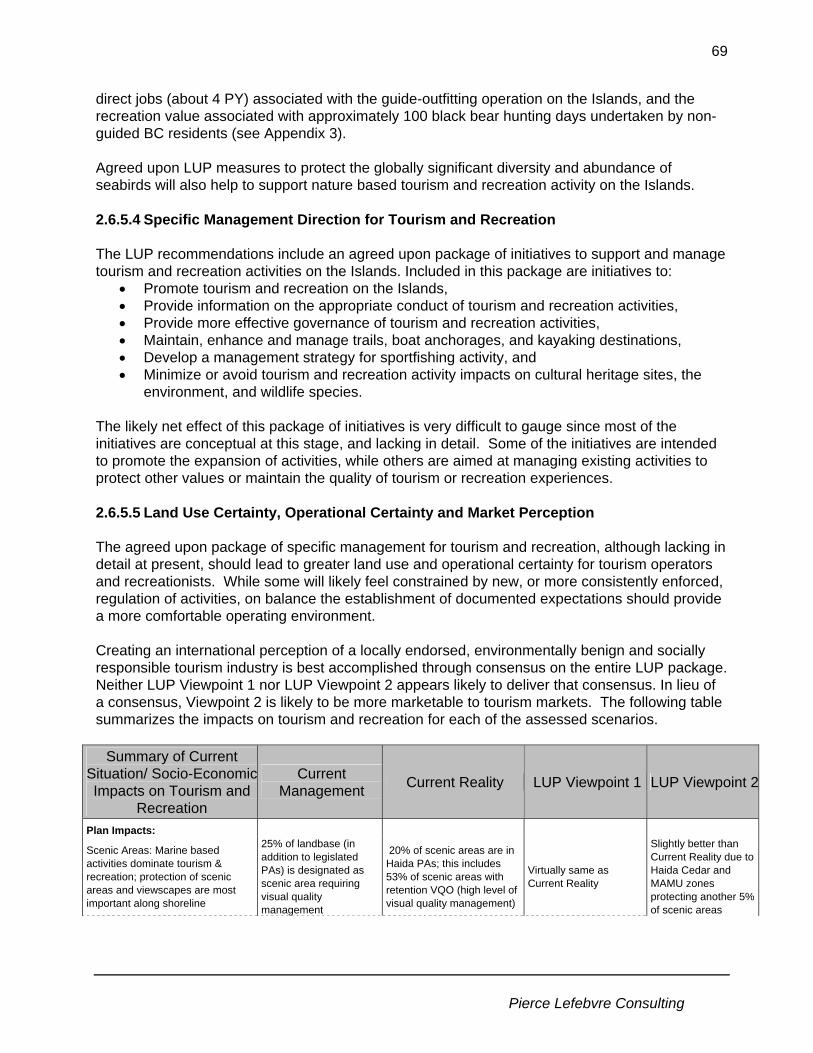
Pierce Lefebvre Consulting
69
direct jobs (about 4 PY) associated with the guide-outfitting operation on the Islands, and the recreation value associated with approximately 100 black bear hunting days undertaken by non-guided BC residents (see Appendix 3). Agreed upon LUP measures to protect the globally significant diversity and abundance of seabirds will also help to support nature based tourism and recreation activity on the Islands. 2.6.5.4 Specific Management Direction for Tourism and Recreation The LUP recommendations include an agreed upon package of initiatives to support and manage tourism and recreation activities on the Islands. Included in this package are initiatives to:
• Promote tourism and recreation on the Islands, • Provide information on the appropriate conduct of tourism and recreation activities, • Provide more effective governance of tourism and recreation activities, • Maintain, enhance and manage trails, boat anchorages, and kayaking destinations, • Develop a management strategy for sportfishing activity, and • Minimize or avoid tourism and recreation activity impacts on cultural heritage sites, the
environment, and wildlife species. The likely net effect of this package of initiatives is very difficult to gauge since most of the initiatives are conceptual at this stage, and lacking in detail. Some of the initiatives are intended to promote the expansion of activities, while others are aimed at managing existing activities to protect other values or maintain the quality of tourism or recreation experiences. 2.6.5.5 Land Use Certainty, Operational Certainty and Market Perception The agreed upon package of specific management for tourism and recreation, although lacking in detail at present, should lead to greater land use and operational certainty for tourism operators and recreationists. While some will likely feel constrained by new, or more consistently enforced, regulation of activities, on balance the establishment of documented expectations should provide a more comfortable operating environment. Creating an international perception of a locally endorsed, environmentally benign and socially responsible tourism industry is best accomplished through consensus on the entire LUP package. Neither LUP Viewpoint 1 nor LUP Viewpoint 2 appears likely to deliver that consensus. In lieu of a consensus, Viewpoint 2 is likely to be more marketable to tourism markets. The following table summarizes the impacts on tourism and recreation for each of the assessed scenarios.
Summary of Current Situation/ Socio-EconomicImpacts on Tourism and
Recreation
Current Management Current Reality LUP Viewpoint 1 LUP Viewpoint 2
Plan Impacts:
Scenic Areas: Marine based activities dominate tourism & recreation; protection of scenic areas and viewscapes are most important along shoreline
25% of landbase (in addition to legislated PAs) is designated as scenic area requiring visual quality management
20% of scenic areas are in Haida PAs; this includes 53% of scenic areas with retention VQO (high level of visual quality management)
Virtually same as Current Reality
Slightly better than Current Reality due to Haida Cedar and MAMU zones protecting another 5% of scenic areas

Pierce Lefebvre Consulting
70
Summary of Current Situation/ Socio-EconomicImpacts on Tourism and
Recreation
Current Management Current Reality LUP Viewpoint 1 LUP Viewpoint 2
Protected Areas: A large proportion of tourism and recreation activities occur in or near legislated PAs;
4% of fishing lodges, 45% of anchorages and 45% of trails are in or near protected areas
38% of fishing lodges, 69% of anchorages and 64% of trails are in or near protected areas
33% of fishing lodges, 69% of anchorages and 53% of trails are in or near protected areas
Virtually the same as Current Reality; 1.5% more trails are protected due to Haida Cedar & MAMU zones
The protection of freshwater fish habitat may provide only a marginal benefit to the sportfishing industry as most of the fishery depends on large non-local stocks from the Skeena and Nass Rivers, and from Alaska.
Protection of fish bearing streams Legislated Protected Areas and FRPA
Legislated PAs, Haida PAs and FRPA
Legislated PAs, Haida PAs, old growth reserves and FRPA
Legislated PAs, Haida PAs, more extensive old growth reserves, hydroriparian mgmt., no-mining watersheds and FRPA
Tourism and Recreation Management Initiatives N/A N/A
Direction to manage wilderness tourism & recreation growth for quality of experience and environmental values
Socio-Economic Implications:
Sportfishing and Backcountry Tourism account for 738 direct jobs of which 268 (36%) are held by local residents (115 PY); net economic value from tourism and recreation is $6.9 million
In short term, market and economic conditions may limit growth potential; in long term, market growth may exert pressure on existing wilderness resources.
Haida PAs help secure greater proportion of wilderness attributes of trails, anchorages and prime locations for fishing lodges.
Mixture of growth promoting and growth limiting initiatives; net result unclear
Similar to LUP Viewpoint 1, but greater protection of wilderness attributes
Recreation: HG/QCI accounts for 78,000 public recreation days involving outdoor activities, which translates to an estimated net economic value (willingness to pay over and above expenditures) of $0.8 million.
In short term, recreation is not at risk; in long term may be pressures on recreation resources
In short term, recreation is not at risk; in long term may be pressures on recreation resources; Haida PAs help secure greater proportion of recreation features
Mixture of initiatives to maintain quality of experience but limit extent of activity
Similar to LUP Viewpoint 1, but greater protection of wilderness attributes
Bear hunting: One guide-outfitter and 336 hunting days translates to up to 10 jobs (4 PY); about 100 non-guided hunting days
Bear hunting allowed Same as Current Management
Same as Current Management; some enhanced management of bear habitat
Disallowing bear hunting could mean loss of up to 10 local jobs (4 PY), and loss of non-guided hunting values
Front Country Tourism: Qay’llnagaay may result in 45 more PY in the long term; expect slow short term growth in tourism and recreation market as product matures and growth is limited by high transportation costs to HG/QCI
Well publicized land and marine use conflicts may be impeding development of markets although the publicity could also be focussing international attention on HG/QCI as a destination for ecotourism and ethnotourism.
Land use consensus could generate positive publicity about HG/QCI – and increase demand for tourism and recreation activities. Neither LUP Viewpoint 1 nor LUP Viewpoint 2 appears likely to deliver this consensus, although Viewpoint 2 would likely be more marketable to tourism markets. Support for the Heritage Tourism Strategy may help maintain high quality tourism experience.
Communities:
Growth in tourism and recreation likely to benefit mainly the communities of Masset/Old Massett and Skidegate/Queen Charlotte City; Sandspit may also benefit, but to a lesser extent; Port Clements is not likely to benefit significantly from tourism and recreation growth.

Pierce Lefebvre Consulting
71
3 Haida Land Use Vision The Haida Land Use (HLUV) Vision was presented to the Community Planning Forum as part of the HG/QCI Land Use Planning Process in May 2004. The HLUV has the following objectives:
“The Haida Land Use Vision (HLUV) reflects our understanding of how things function together and how they have changed through time. It conveys our concern about the damage that has occurred in recent times, and addresses the need to ensure continuity and sustainability for the generations to come. In this way, Yah’guudang (Respect for this Place) is brought forward in the context of Haida Title. To sustain Haida culture, a land use plan must adequately address certain priorities, beginning with the well-being of the land. We need to clearly understand the changes that have occurred to ecological conditions and our culture, and then provide directions for restoring and maintaining balance. That’s the objective of the HLUV, which is organized into three parts.” (Council of Haida Nation. 2004. Haida Gwaii Yah’guudang (Respect for this Place) Haida Land Use Vision. page 5)
The Haida Land Use Vision is centred on three main themes:
(1) Well Being of the Land: The HLUV describes Haida connection to the land, forests, rivers, lakes, and the life that inhabits them including cedar, salmon, and other wildlife and plants.
(2) Condition of the Land: The HLUV describes in general terms changes that have occurred to the land through human activity, and the condition of life forms with which the Haida have close connection such as cedar, salmon, bear, birds and plants.
(3) Natural Ability of the Land to Function and Provide: The HLUV considers the balance between resource use and the regeneration capabilities of the land and its living resources.
The HLUV focuses on 6 core values, namely Tsuuaay (cedar), Tsiin (salmon), Taan (bear), Kil (plants), Xiit’lit (birds) and Sk’waii (beaches). Some of the concerns and recommendations with respect to these values are summarized below.
HLUV Value Concerns Proposed HLUV Solution
Land and Cultural Values
• The Haida have delineated important landscapes that are referred to as the “Haida Protected Areas”
• Set aside mapped Haida Protected Areas from all development
Tsuuaay (cedar)
• Possible shortage of high quality cedar for cultural uses – e.g. canoes, poles and longhouses
• Large population of introduced deer has impacted regeneration of cedar in harvested areas
• 19th century burn area between the lower Yakoun and Tlell rivers needs special consideration as future source of monumental cedar
• Set aside mapped areas for archaeological and cultural cedar
Tsiin (salmon)
• Particularly concerned with declining populations of sockeye salmon
• Historical damage to Ain River and Copper River
• Set aside riparian forest areas, restore degraded watersheds

Pierce Lefebvre Consulting
72
HLUV Value Concerns Proposed HLUV Solution
watersheds has had a profound impact on salmon populations in those streams
• Other major salmon systems of concern include: Davidson, Naden, Awun, Mamin, Yakoun, Deena and Mathers
• Insufficient protection for small stream habitats or stream headwaters under current forest harvesting management
Taan (black bear)
• Rate of cutting of bear den trees, usually large cedar trees • Second growth forests do not contain large standing cedar
trees for bear dens • Bear populations stressed by diminishing suitable habitat,
deer browse of vegetation may be an issue • Black bear sport hunting is increasing, and is disrespectful
of creatures held to be relatives of the Haida people
• Set aside habitat areas for bear in areas planned for timber harvesting
Kil (plants) • Little regard given by logging industry to special plants with medicinal powers and food values
• Commercialization of non-timber forest products a threat to traditional use
• Special concerns include medicinal plants that grow in old growth riparian forests such as devil’s club
• Set aside areas to protect food and medicine plants
Xiit’lit (birds)
• Special concern with birds that live in old growth forests • Introduced species such as rats, raccoons, and squirrels
pose a problem • Tight canopy of mid-seral conifer forests not suitable
habitat for many types of birds • Birds of special concern include goshawks, marbled
murrelet, heron and saw whet owls • Shoreline birds such as falcons and eagles appear to be
still high in numbers
• Set aside mapped areas for marbled murrelet, goshawk, saw whet owl, and blue heron nesting and foraging habitat
Sk’waii (beach)
• Beaches are of concern as they are vulnerable to pollution from human sewage, oil, seepage from mining sites
• Log dumps cause environmental damage in sheltered bays
• Concern that streams that have been heavily logged and damaged by landslides and erosion result in more silt and gravel being washed out of stream channels into the sea
• Set aside areas to protect life along shore and intertidal zones
Socio-Economic Concerns
• There is room for forestry and other commercial activities but they must be sustainable and managed with more respect and greater responsibility for other values
• The HLUV recognizes that the economic component of the plan is incomplete
• Economic needs must be brought into balance with the capacity of the land to function and provide
Impact Assessment of Land Use Options The following table reviews how each land use scenario addresses some of the Haida concerns. The content of the table is based entirely on published expressions of Haida interests, and not on any interview, discussion, evaluation or assessment by Haida Nation representatives.

Pierce Lefebvre Consulting
73
Key Haida Concern Current Management Current Reality LUP Viewpoint 1 LUP Viewpoint 2
Haida Protected Areas
None are officially legislated as protected areas by the provincial or federal governments
All are defacto protected areas in short term(harvest deferrals) ; total protected is 41.4% of landbase
Protects all but a small portion of Haida Protected Areas – total protected is 38% of landbase
Protects all Haida Protected Areas and provincial study areas, which with legislated areas add to 42% of landbase
Tsuuaay (cedar)
CMTs protected by Conservation Heritage Act; free use permit system to make cultural cedar available; district cedar strategy to improve regeneration success
Same as Current Management, but with additional cedar retention in HPAs
Current Reality plus old growth reserves for possible supply of cultural use cedar
LUP Viewpoint 1 plus more old growth reserves, and additional 2% of the landbase set aside for cedar areas; commitment to further inventory and development of cedar strategy
Tsiin (salmon) Hydroriparian ecosystem management through FPC and FRPA
Current Management plus additional hydroriparian protection in HPAs
Current Reality plus some additional protection through old growth reserves
Current Reality plus specific additional hydroriparian reserves; rate of cut management for watersheds; no-mining watersheds
Taan (black bear)
Some habitat protection through FRPA; bear hunting permitted
Some habitat protection through FRPA; bear hunting permitted
Currently Reality plus some provisions for protection of denning and shoreline habitat, and escape trees in harvested areas
Same as Viewpoint 1 except bear hunting prohibited, access management planning required, possibly higher escape tree retention
Kil (plants) No specific management for culturally important plants
No specific management for culturally important plants
No specific management for culturally important plants; introduced species recommendations may help to limit current impacts to plants
Haida Cultural Value surveys; protect rare cultural and medicinal plants; plant enclosures; commercial harvest of medicinal plants and yew prohibited; introduced species recommendations may help to limit current impacts to plants; increased hydroriparian protection
Xiit’lit (birds) – specific concerns for marbled murrelet (MAMU), goshawks, saw whet owls and heron
MAMU and goshawks receive protection as red-listed species; Designated Wildlife Habitat Areas (WHAs); Protection limited to 2 WHAs for each species in addition to PAs and OGMAs
MAMU and goshawks receive protection as red-listed species; Designated Wildlife Habitat Areas – protection limited to 2 WHAs for each species, in addition to HPAs, PAs and OGMAs
Increased protection of MAMU habitat over current management in PAs and old growth reserves; Increased protection of goshawk nest sites (all known are protected); Develop strategies to maintain and restore habitat for red and blue-listed species
Increased MAMU protection: all HLUV MAMU zones, and all highly suitable MAMU habitat plus 70% of moderately suitable habitat; 1% of the landbase is set aside for Haida MAMU areas; protect highly suitable MAMU habitat; retain known and potentially suitable goshawk nest areas and reserve all highly suitable foraging habitat; Protection of Haida identified known saw-whet owl and blue heron nests
Sk’waii (beach) Legislated PAs and UREPs Current Management plus Haida Protected Areas;
Current Reality plus 50 metre reserve buffer on
coastal shorelines; restrictions on fishing or other lodge development
Current Reality plus 50 metre reserve buffer on coastal
shorelines; restrictions on fishing or other lodge development
Socio-Economic Concerns
Damage to traditional Haida lifestyle, cultural and sustenance resource base, combined with frustration over lack of participation in economic development associated with HG/QCI resource development
Greater protection of traditional Haida values than Current Management, but less industrial activity in which to potentially participate
Similar protection of Haida traditional values as Current Reality, but somewhat more industrial activity in which to potentially participate
Extensive protection of traditional Haida values, but substantially reduced industrial activity in which to potentially participate

Pierce Lefebvre Consulting
74
4 Community Sustainability
4.1 Overview of HG/QCI Communities BC Stats estimates the 2004 HG/QCI population at 5,220 people, up slightly from 5,150 in 2001, but down 8% from 5,691 people in 1986.51 The main factors that have contributed to the population declines in the last two decades are: • The closure of Canadian Forces Base Masset, which resulted in a loss of 300 jobs between
1996 and 1998 (HG/QCI Land Use Planning Process. Background Report. 2003. page 4). • A decline in commercial fishing employment of approximately 90 jobs since 1996 (BC MSRM.
2004. page 13). • A decline in the timber harvest from a peak harvest level of 2.6 million m3 in 1986 to the
current levels of approximately 1 million m3 (3 Year Average). Using existing employment coefficients, this would represent a loss of almost 1,000 PY of HG/QCI employment with local residents holding approximately 600 of those jobs.
• The decline of Tasu and Sewall, two villages on Moresby Island; Tasu had approximately
400 people throughout the 1970s until 1983 when the mine closed and the town was abandoned; Sewall had over 100 residents active in the logging industry until approximately 1990. Various tourism and other development proposals in the 1990s for Tasu have failed to materialize. In 1995, the Skeena-Queen Charlotte Regional District adopted the Moresby Island Official Community Plan and designated Tasu, Sewall and Pecofi Bay52 as development permit areas with the hope that tourism and other development would occur.53
Offsetting these negative pressures on employment and population, there has been substantial growth in the sportsfishing sector and tourism partly as a result of the establishment of Gwaii Haanas and spending from the South Moresby Forest Replacement Account. Also, the Haida population has benefited from amendments to the Indian Act (Bill C-31) put into effect on June 28, 1985, which restored Indian and Band status that had been lost as a result of rules that were discriminatory. The major communities on HG/QCI are Masset/Old Massett, Queen Charlotte City/Skidegate and Sandspit. The two Haida communities of Old Massett and Skidegate have a combined population of 1,450 people (2001), which accounts for approximately 80% of the 1,805 people of Aboriginal descent residing in HG/QCI (2001 Census). 51 Includes an estimate of the Net Census Undercount (people not counted in 2001 Census), which explains the slightly different results when adding the Census community data. Appendix 3 provides more detail on population data. 52 Pecofi Bay was the site of a fish cannery in the early part of the century and is a 39 acre parcel of private land north of Gwaii Haanas park boundary; in 1995 uses of the land included a tourist retreat and forestry operations. 53 Skeena-Queen Charlotte Regional District. 1995. Moresby Island Official Community Plan. Bylaw 236; Plan Policies-Third Reading; Adopted December 15, 1995.

Pierce Lefebvre Consulting
75
The following chart shows population changes between 1981 and 2001 by major HG/QCI community. Chart 14 HG/QCI Population by Community, 1981 and 2001
HG/QCI Population, 1981 and 2001
1,569
580
322380 422
754
524
926
707 743
516 538435
25
1,070 1,045
0
200
400
600
800
1,000
1,200
1,400
1,600
1,800
Masset Old Massett QC City Skidegate PortClements
OtherGraham I.
Sandspit OtherMoresby I.
19812001
Source: Statistics Canada Census data. As reported by the HG/QCI Land Use Planning Process. 2003. Background Report. page 9.
The population data show the following: • The combined population of Old Massett and Skidegate, the two major Haida communities,
has increased by 60% from 902 in 1981 to 1,450 by 2001. Various factors may have led to this increase including changes to the Indian Act in 1985. In 2001, an estimated 2,035 Haida people lived off reserves with approximately 720 residing in the Lower Mainland, 390 people residing in the Southern region of the province, and 930 residing in northern BC54 There appears to be further potential to attract Haida people to HG/QCI if social conditions, education opportunities or job prospects improve on the Islands.
• Outside Old Massett and Skidegate, the HG/QCI population has dropped by 26% from 4,719
in 1981 to 3,485 in 2001. The largest drop was on Moresby Island, mainly the result of establishing the Gwaii Haanas protected area (population dropped from 1,278 people in 1981 to 460 people in 2001, including Sandspit residents and those residing outside Sandspit). The population of Masset dropped by 41% (643 people), mainly the result of the closure of the Masset military base.
• The population of Port Clements increased by 36% between 1981 and 2001, but mainly as a
result of the amalgamation with Juskatla in 1985. Port Clements’ population peaked in 1996 at 558 people before dropping back to 516 people by 2001.
54 BC Stats. Off Reserve Population by Band Groups. 2001 Census. Web site accessed July 5th, 2005: www.bcstats.gov.bc.ca/data/lss/abor/or_pop.pdf

Pierce Lefebvre Consulting
76
• Queen Charlotte City population was about the same in 2001 as it was in 1981, although it was higher at over 1,200 people in 1996.
4.2 Impacts of LUP Viewpoints on Communities The HG/QCI LUP makes various recommendations aimed at bolstering community sustainability in three major areas: Governance, Community Resiliency and Economic Diversification. The HG/QCI LUP also refers to the need to improve the quality of life of HG/QCI residents and the desire to maintain and improve the “island way of life”. Governance The HG/QCI LUP suggests two major initiatives aimed at increasing local involvement in land and resource use decision making on the Islands: • an assessment of various governance structures involving land use and resource decision
making, such as the Gwaii Trust, the Island Community Sustainability Initiative (ICSI), Protocol Agreement, etc.; and
• establishing a HG/QCI Resource Management Board/Committee/Council that will provide input into decisions (LUP Viewpoint 1) and/or make decisions (LUP Viewpoint 2) affecting HG/QCI land and resources.
The Current Management structure has resulted in major land use and resource conflicts in HG/QCI in the past, and various land use planning exercises, including this one, have failed to reach consensus. Island communities have a prevailing sense of alienation from the decision making process on significant land and resource use issues.
The decision making powers extended to the Resource Board, Committee or Council under LUP Viewpoint 2 would likely go some way toward diminishing the sense of governance alienation on the Islands, but would likely require BC legislative changes. The lack of community endorsement of LUP Viewpoint 1, combined with the advisory role recommended for the Resource Board, Committee or Council, would likely result in a smaller impact on governance alienation than LUP Viewpoint 2. Population, Economic Diversification and Community Resilience The LUP recommendations and strategies supporting community sustainability on HG/QCI go beyond land use planning issues, and this socio-economic assessment focuses only on those indicators most likely to be affected by strategic land use planning. The following table shows the estimated impacts of varying timber harvest activity levels on the HG/QCI population. This assesses only the potential negative population impacts that could result from a loss in forestry employment, and does not consider whether the plan viewpoints could result in employment increases in other sectors such as tourism or recreation, thereby offsetting the loss of forest industry jobs. Impacts on population would only occur if individuals who no longer have work in the community choose to leave. The employment multipliers used in assessing the loss of indirect and induced PY are the “no-migration” multipliers, which assume that individuals who lose their job will receive

Pierce Lefebvre Consulting
77
transfer payments and remain on HG/QCI in the very short term. The “migration” multipliers would yield greater employment and population impacts.55 Moreover, the employment multipliers assume that the public sector is a basic sector. In the long term, the public sector may be affected by long term population changes resulting from varying economic activity. Table 23 Summary of Potential Short Term (First Decade) Population Impacts
Summary of Short Term (First Decade) Population Impacts from HG/QCI Harvesting
Current Management
Current Reality
Viewpoint 1
Viewpoint 2
Average 2002-2004
Total Harvest (m3 per annum) 1,877,000 1,142,000 1,600,000 549,000 1,037,193% of Exports 7% 7% 7% 7% 7%Volume Processed in BC (m3 per annum) 1,743,589 1,060,830 1,486,277 509,979 963,473HG/QCI Employment (PY to Local Residents) (assuming projected timber harvest potential is realized)
Direct 730 444 622 213 403Indirect & Induced 277 168 236 81 153Total 1,006 612 858 294 556
Population Impacts (note 1) 1,793 1,091 1,528 524 991
Change Over Current Reality Base Case 702 0 438 -566 -100
% of Total 2004 Population (note 2) 13% 0% 8% -11% -2%Notes 1. Based on the 2001 Population/Labour Force ratio of 1.78 based on Statistics Canada 2001 population data of 4,935 people (as
reported by the HG/QCI Land Use Planning Process. 2003. Background Report. page 9) and Statistics Canada 2001 labour force data of 2,770 people (as reported in BC MSRM. 2004. page 2).
2. Based on 2004 population of 5,220 people (including Net Census Undercount). Appendix 4 provides more detail on population data.
3. This table provides estimates of impacts based on assumed levels of timber harvest and impact coefficients per m3 of timber harvest; the presentation of these calculated impacts implies a degree of precision that does not exist but the represented precision is retained to maintain the integrity of the data and methodology.
The table indicates that a reduced timber harvest level of approximately 549,000 m3 under LUP Viewpoint 2 could result in an 11% decline in population from the Current Reality scenario in the first decade, or approximately 524 people (assuming that job loss ultimately results in relocation off the Islands). The following chart shows the basic sector employment dependency for Masset, Port Clements and for the rest of HG/QCI. The chart shows that the forest sector accounts for 8% of basic employment in Masset, compared to 42% for Port Clements. The rest of HG/QCI includes the Haida communities of Old Massett and Skidegate, as well as Queen Charlotte City, Tlell and Sandspit.
55 Using logging employment as an example, the HG/QCI migration employment multiplier (direct, indirect and induced per direct PY) is 1.54 compared to 1.37 for the no-migration multiplier. The multipliers for HG/QCI are based on the report British Columbia’s Heartland at the Dawn of the 21st Century - 2001 Economic Dependencies and Impact Ratios for 63 Local Areas, by Dr. Garry Horne for BC Stats, January 2004, and on tables generated in conjunction with the report (Tables 3.2 and 3.3).

Pierce Lefebvre Consulting
78
Chart 15 Employment Dependencies for HG/QCI by Community, 2001
Employment Dependencies for HG/ QCI , 2001
48%
27%
38%41%
8%
42%
18%
6%
12%
0%
8% 8%
2%6% 6%
12%
3% 3% 4%
30% 28%
13%10%
16%
0%
10%
20%
30%
40%
50%
60%
Masset Port Clements Other HG/ QCI Total HG/ QCI
Publ ic Sector Forestry Tour ismFish & Trapping Construct ion Other
Note: Data for Masset and Port Clements add to 98% and 99%, respectively due to rounding. Source: Based on BC Stats Community Dependency Model for HG/QCI developed from Census Canada data (data as reported in BC MSRM. 2004. Summary of Current Economic Conditions HG/QCI. page 4.) The bulk of any forest industry triggered population decline would likely occur in the communities that are most dependent on the forest industry, namely Sandspit, Port Clements and to a lesser extent Queen Charlotte City. Masset and Old Massett are less dependent on the forest sector and would be less likely to be affected. Port Clements and Sandspit have each experienced population declines, and currently have in the range of 400 to 500 people (see Appendix 4 for details). At these population levels communities, struggle to retain the services expected in a fully functioning community, and both of these communities would likely suffer further erosion of community infrastructure with any further loss of population. For example, any population drop in Port Clements and/or Sandspit might be troublesome for the schools in those communities. Agnes L. Mathers Elementary and Secondary school in Sandspit, and Port Clements Elementary in Port Clements, are the two smallest schools on HG/QCI, with each having approximately 60 students compared to over 150 students each for the other 4 schools. The schools in Sandspit and Port Clements have seen a decline in enrolment since the year 2000. While there is no minimum size regulation for schools, smaller schools are more costly to operate. Agnes L. Mathers in Sandspit offers kindergarten to Grade 12, and is at risk, particularly for the higher grade children because of its proximity to Queen Charlotte City. Port Clements Elementary is also at risk as a result of the relatively close proximity to the school in Masset.

Pierce Lefebvre Consulting
79
Chart 16 HG/QCI School Enrolment, 2000/01 and 2004/05 HG/ QCI School Enrolment, 2 0 0 0 / 0 1 and 2 0 0 4 / 0 5
956
151 149203 19522418667 81
781
18917756 59
0
200
400
600
800
1,000
1,200
Agnes LMathers El. &
Sec.
George MDawson Sec.
Por t Clem entsEl.
QueenChar lotte Sec.
Sk'aadgaaNaay El.
Tahayghen El. Total
2000
2004/ 05
Source: School District 50 (HG/QCI), FY 2005/2006 Budget Presentation. BC Ministry of Education. December 2004. Student Enrolment Reports, 2000/01 to 2004/05. The operator of TFL 47 (Teal Jones) bases its harvesting operations in Sandspit. TFL 47 has a high degree of second growth forest ready for harvest, which is of marginal operability under current economic and market conditions. Under LUP Viewpoint 2, the maximum achievable average harvest level in the first decade is expected to drop by 62% to 43,000m3. This low harvest volume may alter the viability of maintaining a significant operations base in Sandspit. Teal Jones announced in September 2005 that it would shut down its HG/QCI operations indefinitely. Sandspit has the main HG/QCI airport, and is the main gateway to Gwaii Haanas, giving it some degree of economic diversity, but the loss of its forest industry activity and associated employment would be a severe blow to the community. The communities of Masset and Old Massett are not likely to be impacted significantly by a decline in forest employment. Both communities are the most diversified on HG/QCI relying on the public sector, tourism, the commercial fishing and fish processing sector, as well as forestry. Northwest Community College opened a campus in Masset in June 2005, which should contribute to the resiliency of the community. The communities of Queen Charlotte City/Skidegate are likely to be more resilient to a decline in forest industry employment than Sandspit or Port Clements, but perhaps less resilient than Masset/Old Massett. Queen Charlotte City/ Skidegate are the best located to reap the benefits of increased tourism, particularly with the development of the Qay’llnagaay Centre/ Bill Reid School of Art currently under construction. While tourism is likely to continue to grow, the extent to which local residents will be successful in capturing tourism employment is unclear. Sportfishing lodges generate an estimated 648 full time and seasonal jobs, but local HG/QCI residents hold only approximately 25% of these (an estimated 178 jobs or 76 PY of employment). The HG/QCI LUP Economic Diversification and Stability Strategy lists various opportunities for further diversification of the economic structure of HG/QCI, although prospects for most of these are not directly affected by land use planning. As noted earlier in this assessment, these opportunities include the following.

Pierce Lefebvre Consulting
80
• Log home manufacturing: As discussed in the forest section, the best wood processing
opportunities might be log home manufacturing, which could result in 20 or 25 jobs being created in the near future.
• Tourism: There is likely to be growth in the tourism sector in the next decade, particularly with
the Qay’Ilnagaay Centre/ Bill Reid School of Arts currently under construction. Most of the tourism jobs however are likely to be in Queen Charlotte City, Skidegate, Masset, Old Massett and surrounding smaller communities such as Tlell.
• Sportfishing: There may be opportunities for some growth in sportfishing, although the
current relatively high Canadian/US dollar exchange rate is negatively affecting the cost competitiveness of HG/QCI lodges relative to lodges in Alaska.
• Energy: There is opportunity for a wind power plant to proceed off Naikoon Park, but this is at
the conceptual stage and is unlikely to play a significant role over the next 5 to 10 years. • Non-timber forest products: the mushroom harvest is already important to the local economy,
and there may be other NTFP opportunities such as salal. • The Gwaii Trust, Coast Sustainability Trust Fund, the South Moresby Forest Replacement
Account, and other research funds: HG/QCI has benefited from funding from various adjustment funds which has contributed to diversification projects including the Qay’Ilnagaay Centre/ Bill Reid School of Arts currently under construction. A significant amount of biological and land use research has been funded in the last 20 years.
Other opportunities mentioned in the HG/QCI LUP Economic Diversification and Stability Strategy include mariculture (oyster farming), wild meat processing, leather products, local food production, high end wooden boat building, bottled water, and independent consultants. The Land Use Plan Recommendations suggest various strategies to increase local benefits from the use of HG/QCI resources. In the case of timber resources there is some expectation that greater local control will lead to greater local employment. As discussed earlier, it may be challenging for smaller local operations to offer the stable year-round employment required for community building and stability. The LUP Recommendations also suggest transition strategies to support economic structural changes, and in particular, to address business and job losses related to the HG/QCI LUP. Suggested strategies include: • assess employment impacts, and adhere to a “no net job loss or better” principle; • phase implementation of the land use planning recommendations to accommodate the
creation of new jobs and a new economy; • provide assistance to workers and businesses affected by the LUP; and • re-allocate timber harvesting tenures (LUP Viewpoint 2). This socio-economic assessment does not assess the practicality of these strategies, nor does it assess the funding that might be required for implementation.

Pierce Lefebvre Consulting
81
5 Conclusions to Socio-Economic Assessment The HG/QCI Land Use Plan viewpoints provide two visions for the strategic direction of land and resource management on HG/QCI, which share many elements of common agreement. The viewpoints arise as a result of those aspects of the Land Use Plan that were not agreed upon by the Community Planning Forum. LUP Viewpoint 1 generally provides for more extensive extractive resource development than Viewpoint 2, while Viewpoint 2 generally puts greater emphasis on conservation. The two viewpoints are compared to two different base case perspectives, Current Management and Current Reality.
5.1 Economic Well Being The HG/QCI Land Use Plan embodies an economic and social vision to diversify the private sector portion of the HG/QCI economy away from a high dependence on declining timber harvesting activity, toward a “new economy” relying more on local wood processing, various forms of tourism, and other small scale initiatives. It is expected that this new economy would be more supportive of “the Islands way of life”, and be more ecologically responsible. The two LUP viewpoints differ very significantly in the degree of transition required to get to the new economy. With respect to timber harvesting, LUP Viewpoint 1 attempts to re-establish the forest industry on a firmer social and ecological footing, while restoring access to some of the timber resources that have been alienated from the industry through ongoing land use conflict. Viewpoint 2 envisions very substantially reduced timber harvesting activity, and associated employment, that would be offset by increases in “new economy” activities. Mining has been a significant contributor to economic diversification in HG/QCI in the past, but is not currently, due in part to land use conflict and ecological concerns impeding exploration and development. Both LUP viewpoints attempt to provide more certain access to mineral resources, with more clearly defined local expectations as to how mineral development should proceed. LUP Viewpoint 2 would provide access for mineral exploration and development to a significantly smaller proportion of the most prospective mineral potential on HG/QCI than LUP Viewpoint 1. The two LUP viewpoints do not differ appreciably in their provision for expansion of tourism and recreation activities. While LUP Viewpoint 2 would provide somewhat more protection of natural features on HG/QCI that support tourism and recreation, it would also prohibit bear hunting activity. The following table summarizes estimates of the local employment impacts that could result from each LUP viewpoint relative to the base case perspectives. As shown, the local employment provided through timber harvesting is very substantially greater than local employment from all other private sectors combined (including allowance for potential future employment in local wood processing). Any significant loss of timber harvesting employment will require a very large expansion of other sectors, if the Community Planning Forum’s objective of “no net job loss” is to be realized.

Pierce Lefebvre Consulting
82
Table 24 Annual Average Direct PY of Employment By Sector and By LUP Option Projections of Annual Average
Direct Employment Held by Local Residents by Sector
Current Management
(AAC)
Current Reality (Actual
Harvest) LUP Viewpoint 1 LUP Viewpoint 2
Forest Sector (Decade 1) Based on projections of maximum sustainable timber harvest rates, given constraints prescribed by each scenario and MOFR harvest flow policies
730 (assuming log market,
social and environmental constraints allow full
timber harvesting potential to be realized)
445 (may not be
sustainable without improvement to
current log market prices)
620 (assuming log market,
social and environmental constraints allow full timber harvesting potential to be
realized)
215 (assuming log markets
allow full timber harvesting potential to
be realized)
Sportfishing Lodges 75 75 75 (Unknown Impact)
75 (Unknown Impact)
Guided Hunting 5 5 5 0
Adventure Tourism/ Gwaii Haanas 35 35 35+ (Benefit)
35+ (Benefit)
Non-Timber Forest Products 25 25 25+ (Benefit)
25+ (Benefit)
Public Recreation N/A N/A N/A N/A
Total 870 585 760 350
Potential in Wood Processing Potential Employment from Additional Local Wood Processing/ Niche Product Manufacturing 25 25 25 25 Note: This table provides estimates of impacts based on assumed levels of timber harvest and impact coefficients per m3 of timber harvest; the presentation of these calculated impacts implies a degree of precision that does not exist but the represented precision is retained to maintain the integrity of the data and methodology. The 231 PY of local forest sector employment expected to be at risk in Decade 1 under LUP Viewpoint 2 (relative to the Current Reality Scenario) would require more than a doubling of activity in every other sector to offset the jobs at risk, and likely much more than a doubling to offset income at risk. We therefore consider it very unlikely that the employment gains would completely offset the losses in the forestry sector, at least over the next decade or two, and LUP Viewpoint 2 appears to be a high-risk vision if local employment is key to economic wellbeing. LUP Viewpoint 1 may provide for higher local employment prospects in the forest sector, while providing at least as much expansion potential in other sectors as LUP Viewpoint 2. The risk of forest industry employment decline under LUP Viewpoint 2 would fall primarily on the HG/QCI communities that are more dependent on forestry such as Sandspit and Port Clements. Most of the gains in local employment through increased tourism activity are likely to be concentrated in the Haida communities of Skidegate and Old Massett and their neighbouring communities of Queen Charlotte City and Masset. These communities are already most strongly supported by the stabilizing influence of the public sector.
5.2 Net Economic Value and Government Revenues From a net economic value perspective, the costs related to changes in forest industry and other industrial activity under each LUP viewpoint are balanced against benefits associated with maintaining or expanding recreation value, backcountry tourism, and botanical forest products. Table 25 indicates that the net economic value derived from land and resource based activities under LUP Viewpoint 2 could be less than half the level expected under LUP Viewpoint 1. The table also highlights that while sportfishing and adventure tourism bring significant economic activity to HG/QCI and the province, their contribution to the flow of net economic value from the HG/QCI area is relatively small, as sportfishing lodges, charters and adventure touring

Pierce Lefebvre Consulting
83
businesses pay little rent directly to the provincial government for the use of natural resources. Table 25 Summary of Estimated Annual Net Economic Value by Sector Annual Net Economic Value by Sector ($ million)
Current Management
Current Reality LUP Viewpoint 1 LUP Viewpoint 2
Forest Sector $34.3 $20.8 $29.2 $10.0
Sportfishing Lodges $5.80 $5.80 $5.80 (Unknown Impacts)
$5.80 (Unknown Impacts)
Guided Hunting $0.03 $0.03 $0.03 $0.00
Adventure Tourism/ Gwaii Haanas $0.30 $0.30 $0.30 + (Benefit)
$0.30 + (Benefit)
Non-Timber Forest Products $0.10 $0.10 $0.10 + (Benefit)
$0.10 + (Benefit)
Public Recreation $0.80 $0.80 $0.8 + (Benefit)
$0.8 + (Benefit)
Total $41.3 $27.9 $36.2 $17.0 Note: This table provides estimates of impacts based on assumed levels of timber harvest (assuming projected timber harvest potential is realized) and impact coefficients per m3 of timber harvest; the presentation of these calculated impacts implies a degree of precision that does not exist but the represented precision is retained to maintain the integrity of the data and methodology. The net economic value accounting is incomplete, however, as it does not include externalities arising from human activities including forestry, mining, and sportfishing. Concerns expressed by planning table representatives, as well as the environmental risk assessment for HG/QCI (Veridian Ecological Consulting Ltd. 2005), indicate that there are negative externalities associated with the current management of timber harvesting, sportfishing lodges and potential mining activities. The extent to which these negative externalities will be reduced by HG/QCI Land Use Plan management direction should be set against the raw net economic value cost implications presented in Table 25. While we have been unable to quantify either the base case level of these externalities, or the extent of their potential reduction through LRMP initiatives, there is some expression of this reduction in the benefits noted to other sectors and interests, as well as to environmental values. These external costs would likely be lower under LUP Viewpoint 2 than under LUP Viewpoint 1. The following table summarizes the impacts of each viewpoint on government revenues that are directly linked to resource use. Table 26 Impacts on Annual Government Revenues from Resource Use on HG/QCI
Existing Annual Government Revenues by Sector ($ million)
Current Management
Current Reality LUP Viewpoint 1 LUP Viewpoint 2
Forest Sector - Stumpage & Royalties $28.87 $17.56 $24.61 $8.44
Sportfishing Lodges $2.92 $2.92 $2.92 $2.92
Guided Hunting $0.03 $0.03 $0.03 $0.00
Adventure Tourism $0.02 $0.02 $0.02 $0.02
Gwaii Haanas $0.10 $0.10 $0.10 $0.10
Non-Timber Forest Products $0.00 $0.00 $0.00 $0.00
Total $31.94 $20.63 $27.68 $11.48 Note: This table provides estimates of impacts based on assumed levels of timber harvest (assuming projected timber harvest potential is realized) and impact coefficients per m3 of timber harvest; the presentation of these calculated impacts implies a degree of precision that does not exist but the represented precision is retained to maintain the integrity of the data and methodology. As indicated in the BC MSRM 2003 Guiding Principles, the impacts on government revenues should focus on government revenues directly generated from resource use such as stumpage fees for harvesting crown timber; royalties for accessing mineral resources; and tourism and

Pierce Lefebvre Consulting
84
recreation fees. General income tax and sales tax effects of the management scenarios can also affect provincial government revenues, but such effects may not be incremental, particularly if capital and labour affected by each scenario are, or can be employed elsewhere in the province. Moreover, employment level changes which result in population changes may have somewhat offsetting impacts on tax revenues and government service expenditures. In general, the SEAs should not include estimates of personal income and sales tax revenues. (BC MSRM. 2003. page 10)
5.3 Community Sustainability Community capacity building, local empowerment, and stakeholder consensus (to the extent it was achieved) are key benefits of the planning process to HG/QCI communities. The impacts on community resilience are mixed, with benefits such as greater ecological integrity, greater economic diversity, greater local governance and maintenance of recreation values, counterbalanced (and likely overshadowed in the case of LUP Viewpoint 2) by the socio-economic costs associated with the jobs at risk. HG/QCI has a history of land use conflicts over the past two decades that have diminished forest and mining industry activity and contributed to economic decline on the Islands. The communities of Sandspit and Port Clements have been most affected by the curtailment of timber harvesting and mining activity. Some of the offsetting economic benefits expected from the creation of Gwaii Haanas have not yet materialized, partly as a result of the need to preserve the wilderness nature of the Haida cultural sites. Placing half of the current forest industry jobs held by local residents at risk under LUP Viewpoint 2 indicates a high-risk scenario from a community stability perspective that could exacerbate the economic hardship currently experienced by HG/QCI communities. Adopting LUP Viewpoint 1 without stakeholder consensus and the support of local communities would diminish the positive social impacts one would expect to gain from a consensus land use plan.
5.4 Haida Land Use Vision and Specific Haida Interests The following comments are based entirely on published expressions of Haida interests, and not on any interview, discussion, evaluation or assessment by Haida Nation representatives. The Haida Nation should benefit from LUP Viewpoints 1 and 2 through the protection of cultural heritage resources, as well as any incremental benefits to fish and wildlife populations, and culturally significant ecosystems. LUP Viewpoint 1 appears to improve on the Current Reality scenario in the management of cultural cedar, salmon habitat, black bear habitat, bird habitat and beaches. It does not improve management for culturally significant plants or bear hunting, and somewhat reduces the size of Haida Protected Areas relative to Current Reality. LUP Viewpoint 2 fully addresses important values cited by the Haida Land Use Vision, and provides enhancements to LUP Viewpoint 1 management for all important Haida values except beaches, where management would be similar under either viewpoint. LUP Viewpoint 1 is likely to lead to a higher level of industrial activity and local employment, in which Haida people can participate, than LUP Viewpoint 2.

Pierce Lefebvre Consulting
85
APPENDIX 1 FORESTRY This Appendix provides detailed data on the forest sector impacts for each Base Case and each viewpoint. This includes the following tables: • Table 27 provides data on the major forest licensees operating on HG/QCI. • Table 28 provides data on the employment impacts, direct and indirect in HG/QCI and
elsewhere in the province. • Tables 29 and 30 provide data on historical stumpage revenues from HG/QCI including the 3
year average (2002-2004), the 8 year average (1998-2004) and the 10 year average (1995-2004. Table 29 also provides the percentage of volume sold at the minimum stumpage of $0.25 per m3.
• Table 31 provides data on the net economic value and data on direct employment income
from HG/QCI based on the direct Person Years of employment and average wages per PY. • Tables 32 and 33 provide detailed data on the composition of the harvest data projections for
each scenario in terms of old growth and managed stands. • Table 34 provides an analysis of the percentage of protected areas for each of the 26
woodsheds in HG/QCI. This appendix also provides a comparison of different sets of data on local forest industry employment.

Pierce Lefebvre Consulting
86
Table 27 List of HG/QCI Licenses for Timber Harvesting
2002 2003 2004 1.15 million m3 600,000 m3
TSA - QCI 25:
QCI license – A16869 213,163 m3 including 179,506 m3 conventional & 33,657 m3 low vol. cedar 158,414 236,054 229,357 213,163
QCI license – A 16871 17,577 m3 including 14,801 m3 conventional & 2776 m3 low vol. Cedar 65,842 0 0 17,577
QCI – A75084 7,956 m3 0 0 0 7,956Road Permit 0 0 311
TFL Forest Ltd. (owned by Teal Jones Group/ J.S. Jones Timber) (Note 1)
QCI – A16870 15,945 m3 including 13,427 m3 conventional & 2,518 m3 low vol. cedar 18,486 40,552 15,626 15,945
242,742 276,606 245,294 254,641 254,641
TIMBER LICENSES 6 Timber Licenses See Note 2 21,000 21,000TL: Teal Jones Group TL 184 & TL 253 Located within boundaries of TSA 25 53,305 8,824 13,256Total TSA and TL Vol. - Major Licensees
Includes harvest from TSA and from Timber Licenses within boundaries of TSA 25 296,047 285,430 258,550
Teal Jones Group/ J.S. Jones (was TimberWest Forest Corp. license)
TFL 47 (Moresby Island Management Unit, Block 18 of TFL 47)
100,000 m3 84,338 86,990 117,794 100,000 100,000
Western Forest Products TFL 25, Block 6 115,000 m3 including a BC Timber Sales component of 10,335 m3 per year 47,853 50,076 76,966 115,000 115,000
Weyerhaeuser TFL 39, Block 6
AAC of 1,150,000 m3 including partition of 125,000 m3 for Haida Declared Areas and a BC Timber Sales component of 56,324 m3 per year; In June 2002, Weyerhaeuser agreed to reduce harvest to 600,000 m3
619,000 349,000 423,389 1,150,000 600,000
751,191 486,066 618,149 1,365,000 815,000
1,047,238 771,496 876,699
BC Timber Sales and Other Adjustements
BC Timber Sales Apportionment incl. 91,978 m3 for TSA 25 (QCI) and as noted above for TFL 25 and TFL 39; also includes a few other small licenses, woodlots and other; see note 3.
232,106 156,127 27,913 106,359 106,359
TOTAL HARVEST MOF volume data by scale date (note 4) 1,279,344 927,623 904,612 1,747,000 1,197,000
TREE FARM LICENSES (TFLs):
Husby Forest Products/ Sitkana Timber Ltd./ Dawson Harbour Logging Co. Ltd.
Total TSA, TFL and TL Vol. Major Licensees
Total TFL Vol. - Major Licensees
Current AAC (m3) with TFL 39 Vol. ofName of License
Holder Detail/ Location Comment on AAC and Harvest LevelsTimber Harvest (m3)
Sub-Total TSA - Major Licensees
Notes: 1 Previously owned by TimberWest Forest Corp. 2 The timber harvest for the Timber Licenses in HG/QCI was reported as 21,000 m3 for 2003 (Pierce Lefebvre Consulting et al.,
2003). 3 Small licenses include QCI – A16874 license of 272 m3 held by Sound Spars Enterprise Ltd., QCI - A16876 license of 484 m3
held by Kano Logging Co. Ltd., 4 woodlots (apportionment of 6,500 m3), and a Community Forest/ Forest Service Reserve (apportionment of 7,125 m3).
4 Total harvest is based on reported volumes by scale date from the Ministry of Forests (MOF) Harvest Billing System (provided by Glenn Farenholtz of MSRM, March 24th, 2005).
5 All other harvest data are from the Pierce Lefebvre Consulting survey of HG/QCI licensees conducted for this project. The scaled data provided by licensees may differ from the MOF data due to timing and reporting differences.
Source: As reported in Pierce Lefebvre Consulting. 2005. HG/QCI Timber Harvest and Processing Employment Survey. BC MSRM. page 2.

Pierce Lefebvre Consulting
87
Table 28 Total Employment Impacts (First Decade) and Key Assumptions
TOTAL INDUSTRY Estimated PY for
HG/QCI Residents Harvesting Employment - Person Years (PY) 2002 2003 2004 % Local
(2004) 2004 3 Year
AverageHarvesting 273 285 244 61% 150 164
Planning and Administration 87 79 64 55% 35 42
Log Hauling / Trucking 44 42 37 62% 23 26
Barging / Towing 7 8 8 53% 4 4
Road Building 113 110 96 66% 63 70
Silviculture 32 24 19 66% 13 17
Dryland 10 9 8 100% 8 9
Shop 10 9 8 50% 4 5
Falling 15 14 12 80% 10 11
Other (mechanical) 17 16 14 8% 1 1
Other (pilot and cookhouse) 5 5 4 0% 0 0
Haida (CMT) 1 1 1 100% 1 1
TOTAL 615 603 516 60% 312 349
Local Processing Employment - PY
Processing Plants in HG/ QCI 47 58 58 92% 53 50
TOTAL 662 660 573 64% 365 402 Note: The survey participants were provided with the first six categories on the table, but some respondents added other categories such as shop, falling, etc. Source: Pierce Lefebvre Consulting. 2005. page 6.
Direct Person Years (PYs) per 000 m3 Harvested in HG/QCI Direct Employment Coefficients for HG/QCI
- Harvesting and Silviculture HG/QCI Residents Non-Residents Total B.C.
Harvesting/Falling 0.169 0.103 0.272
Planning and Administration 0.041 0.033 0.074
Log Hauling / Trucking 0.025 0.015 0.039
Barging / Towing 0.004 0.004 0.008
Road Building 0.067 0.035 0.102
Silviculture 0.016 0.008 0.024
Dryland 0.009 0.000 0.009
Other (shop, mechanical, pilot, Haida (CMT), etc.) 0.006 0.023 0.029
Total 0.337 0.220 0.557 Source: HG/QCI data are from the survey of licensees; Pierce Lefebvre Consulting. 2005. page 6.
Key Assumptions (First Decade)
PY per 000 m3 (1)
Current Management
Current Reality
LUP Viewpoint 1
LUP Viewpoint 2
Average 2002-2004
Total Harvest 1,877,000 1,142,000 1,600,000 549,000 1,037,193
% of Exports (note 2) 7% 7% 7% 7% 7%
Volume Processed in BC 1,743,589 1,060,830 1,486,277 509,979 963,473
Total Primary Processing PY
Wood Processing 0.4608 804 489 685 235 444
Pulp and Paper 0.2055 358 218 305 105 198
Total Primary Processing PY 0.6664 1,162 707 990 340 642

Pierce Lefebvre Consulting
88
Total Short Term Employment Impacts and Key Assumptions (First Decade)
PY per 000 m3
(1)
Current Management
Current Reality
LUP Viewpoint
1
LUP Viewpoint
2
Actual Average
2002-2004
Multi-plier (All/
Direct)HG/QCI Residents
Direct – Harvesting in HG/QCI 0.3366 632 384 538 185 349 1.37
Direct – Processing in HG/QCI 0.0562 98 60 83 29 54 1.44
Sub-Total Direct 730 444 622 213 403
Indirect & Induced in HG/QCI 0.1588 277 168 236 81 153
Total HG/QCI 1,006 612 858 294 556
Province (non-HG/QCI Residents)
Direct – Harvesting in HG/QCI 0.2205 414 252 353 121 229
Direct - Wood Processing 0.4047 706 429 601 206 390
Direct – Pulp & Paper 0.2055 358 218 305 105 198
Sub-Total 1,478 899 1,260 432 817
Indirect & Induced 1.0592 1,847 1,124 1,574 540 1,021
Total Non-HG/QCI Residents 3,325 2,023 2,834 972 1,837
Province (All B.C.BC Residents)
Direct Harvesting 0.5570 1,046 636 891 306 578 1.93
Direct Wood Processing 0.4608 804 489 685 235 444 1.92
Direct Pulp & Paper 0.2055 358 218 305 105 198 2.15
Sub-Total 2,207 1,343 1,882 646 1,220
Indirect & Induced 1.2180 2,124 1,292 1,810 621 1,173
Total 4,331 2,635 3,692 1,267 2,393 Notes: 1. Harvesting jobs are based on total harvest; processing jobs are based on the harvest that is harvested and processed in BC. 2. The percentage of exports is calculated based on the 2002 to 2004 (3-year) total harvest and the 3-year total volume processed.
Slightly different results are obtained when using the arithmetic average of the percentage exports over the 3 years. 3. May not add exactly due to rounding of the employment coefficients. Employment coefficients for induced employment are
calculated based on jobs and the total harvest processed in BC. 4. This table provides estimates of impacts based on assumed levels of timber harvest and impact coefficients per m3 of timber
harvest; the presentation of these calculated impacts implies a degree of precision that does not exist but the represented precision is retained to maintain the integrity of the data and methodology.
Source: Employment coefficients and % of exports are from: Pierce Lefebvre Consulting. 2005. page 5.. Employment multipliers were provided by Ian McLachlan of BCMAL on August 30th, 2005, and are based on BC Stats and the 2001 Census data. The following tables show timber harvest and stumpage revenues based on reported volumes by scale data from the Ministry of Forests and Range (MOFR) Harvest Billing System. (Provided by BC MSRM, May 27th, 2005). Slightly different revenues and stumpage revenues can be obtained from the MOFR Revenue Branch where harvest volumes are tabulated by invoice date, but the trends are the same. These results are shown in Table 11. Table 29 Timber Harvest and Stumpage Revenues in HG/QCI, 1994-2004
HBS Harvest HBS Revenue ($2004) Average Stumpage ($2004)1994 1,622,040 $47,586,119 $29.341995 1,499,914 $48,384,312 $32.261996 1,621,981 $75,382,211 $46.48
1997 1,403,032 $63,661,140 $45.371998 1,019,457 $27,516,089 $26.99
1999 1,356,615 $15,129,399 $11.152000 1,469,636 $25,538,110 $17.38

Pierce Lefebvre Consulting
89
HBS Harvest HBS Revenue ($2004) Average Stumpage ($2004)2001 1,255,397 $18,014,959 $14.35 2002 1,279,344 $25,160,109 $19.67 2003 927,623 $16,555,162 $17.85 2004 904,612 $6,141,110 $6.79
Management Unit
3 Year Average Harvest - m3
3 Year Average Stumpage ($2004/m3)
3 Year Average Revenue ($2004)
TSA 25 QCI 343,013 $15.83 $ 5,428,677
TFL 25 57,617 $6.72 $ 387,002
TFL 39 540,739 $17.97 $ 9,717,713
TFL 47 95,824 $4.37 $ 418,735
Total LUP 1,037,193 $15.38 $ 15,952,127 Management Unit
10 Year Average Harvest - m3
10 Year Average Stumpage ($2004/m3)
10 Year Average Revenue ($2004)
TSA 25 326,239 $25.29 $ 8,249,189
TFL 25 82,870 $22.60 $ 1,872,979
TFL 39 775,286 $27.39 $ 21,231,500
TFL 47 89,366 $8.89 $ 794,593
Total LUP 1,273,761 $25.24 $ 32,148,260 Management Unit
8 Year Average Harvest - m3
8 Year Average Stumpage ($2004/m3)
8 Year Average Revenue ($2004)
TSA 25 326,966 $18.41 $ 6,020,280
TFL 25 75,056 $17.30 $ 1,298,848
TFL 39 713,665 $23.72 $ 16,930,543
TFL 47 86,277 $5.39 $ 464,839
Total LUP 1,201,964 $20.56 $ 24,714,510 Source: Based on reported volumes by scale data from the Ministry of Forests and Range (MOFR) Harvest Billing System. (Provided by Glenn Farenholtz of BC MSRM, May 27th, 2005). The Revenue Branch MOFR website reports harvest volumes and stumpage revenues by invoice dates, which gives slightly different results, but the trends are the same. Table 30 Harvest Billing System History by Invoice Date, 1998-2005
Year Billed Volume
Average Stumpage Rate Billed Value % Volume @ Minimum
Stumpage ($0.25)
1998 1,007,135 $24.94 $25,118,669 15.2% 1999 1,303,308 $10.37 $13,519,342 21.7% 2000 1,442,234 $16.26 $23,444,026 22.1% 2001 1,182,287 $14.42 $17,052,037 25.0% 2002 1,184,184 $19.49 $23,083,758 12.6% 2003 750,664 $18.72 $14,049,850 12.4% 2004 1,040,912 $8.93 $9,300,226 47.9% 2005 (6 Months) * 461,706 $7.11 $3,283,053 57.7%
Note: * Data for 2005 are for the January to June period only. Source: BC Ministry of Forests and Range Harvest Billing System, Harvest Reports by Date of Invoice; Includes coniferous harvest from Crown lands, all grades, all products.

Pierce Lefebvre Consulting
90
The following tables show the total net economic value for HG/QCI from the short term harvest and long term harvest under each management scenario. Table 31 Total Net Economic Value from HG/QCI from Each Management Scenario
Net Economic Value from Short Term (First Decade) Harvest
Current Management
Current Reality
LUP Viewpoint
1
LUP Viewpoint
2 Average
2002-2004Net Economic Value ($ Million): From Labour (5% of Direct Income) $5.4 $3.3 $4.6 $1.6 $3.0 Net Economic Value from Capital minimal minimal minimal minimal minimal Public Sector Rent (Stumpage $ 2004) $28.9 $17.6 $24.6 $8.4 $16.0 Total Net Economic Value ($ Million) $34.3 $20.8 $29.2 $10.0 $18.9 Net Economic Value per m3 Harvested $18.25 $18.25 $18.25 $18.25 $18.25
Total Direct Before Tax Income Impacts - Short Term Impacts (First Decade) ($ Million)
Average Before Tax Income Per
Direct PY Current
ManagementCurrent Reality
LUP Viewpoint
1
LUP Viewpoint
2 Average
2002-2004Province (All BC Residents)
Direct Harvesting $53,258 $55.7 $33.9 $47.5 $16.3 $30.8 Direct Wood Processing $38,076 $30.6 $18.6 $26.1 $8.9 $16.9 Direct Pulp & Paper Processing $59,786 $21.4 $13.0 $18.3 $6.3 $11.8
Total $107.7 $65.5 $91.8 $31.5 $59.5 Notes: 1. Total direct PY and after tax income are from the 2001 Dependency Tables (BC Stats, 2004). 2. BC coast direct PY and after tax income include data for the Mid-Coast, QCI, Chilliwack, Squamish, Sunshine Coast, South
Island, Campbell River, Port McNeil and North Coast Forest Districts. 3. Ratio of after tax to before tax is based on HG/QCI data. 4. This table provides estimates of impacts based on assumed levels of timber harvest and impact coefficients per m3 of timber
harvest; the presentation of these calculated impacts implies a degree of precision that does not exist but the represented precision is retained to maintain the integrity of the data and methodology.
Source: BC Stats 2003 BC Community Dependency Model based on 2001 Census Information Table 32 Composition of the Harvest for Each Management Scenario
Decade Volume Old Growth Thrif ty Managed 2nd Growth Volume Old Growth Thrifty Managed 2nd Growth1 1,898,968 1,851,272 47,680 17 47,696 1,158,487 1,130,489 27,998 0 27,998
2 1,860,889 1,821,061 39,817 11 39,829 1,128,765 1,096,071 32,694 0 32,694
3 1,788,363 1,724,839 63,043 481 63,524 1,108,102 957,702 150,009 392 150,400
4 1,737,174 1,390,112 316,752 30,309 347,061 1,084,759 820,836 263,593 329 263,922
5 1,716,625 587,025 1,062,102 67,497 1,129,599 1,098,531 773,909 286,431 38,192 324,622
6 1,736,496 499,046 907,588 329,861 1,237,449 1,142,670 426,603 618,710 97,357 716,067
7 1,702,506 416,562 1,060,354 225,590 1,285,944 1,159,028 199,549 674,875 284,604 959,478
8 1,661,136 320,479 469,067 871,591 1,340,658 1,159,063 149,569 623,337 386,157 1,009,494
9 1,633,673 280,334 260,516 1,092,824 1,353,340 1,159,044 119,776 545,659 493,609 1,039,268
10 1,626,034 182,541 225,875 1,217,618 1,443,493 1,159,039 103,258 298,193 757,588 1,055,781
Current Management Current RealityComposit ion Composit ion

Pierce Lefebvre Consulting
91
Decade Volume Old Growth Thrif ty Managed 2nd Growth Volume Old Growth Thrifty Managed 2nd Growth1 1,620,824 1,580,633 40,174 17 40,191 563,333 547,208 16,125 0 16,125
2 1,486,225 1,459,083 27,128 14 27,142 601,419 538,942 62,434 43 62,477
3 1,395,848 1,238,857 156,622 370 156,992 657,939 524,763 133,087 90 133,176
4 1,355,820 912,077 411,886 31,857 443,744 677,223 414,160 253,284 9,778 263,063
5 1,380,328 343,666 988,894 47,768 1,036,662 677,228 133,192 530,348 13,688 544,036
6 1,409,912 269,925 904,989 234,997 1,139,986 677,238 117,051 406,554 153,633 560,187
7 1,418,345 256,751 970,162 191,432 1,161,594 684,326 70,928 392,909 220,488 613,398
8 1,418,336 178,922 376,964 862,449 1,239,414 684,318 61,149 245,708 377,461 623,169
9 1,418,333 150,582 196,716 1,071,035 1,267,751 684,314 38,320 52,116 593,878 645,994
10 1,418,344 135,167 82,419 1,200,758 1,283,177 684,326 23,205 12,503 648,617 661,120
Composit ion Composit ionLUP Viewpoint 1 LUP Viewpoint 2
Table 33 Viewpoints 1 and 2 Old Growth Retention Targets by Landscape Unit
Viewpoint 1 # Landscape
Unit Biodiversity Emphasis
Retention Target (%)
# Landscape Unit
Biodiversity Emphasis
Retention Target (%)
1 Athlow High 70 13 Tlell High 50 2 Beresford High 70 14 Yakoun Lake Moderate 50 3 Jalun High 70 15 Rennell Moderate 50 4 Bigsby Protected Area n/a 16 Honna Low 20 5 Skincuttle Protected Area n/a 17 Ian Low 30 6 Kunghit Protected Area n/a 18 Sewell Low 30 7 Gowgaia Protected Area n/a 19 Lower Yakoun Low 20 8 Lyell Protected Area n/a 20 Masset Inlet Low 20 9 Gudal High 70 21 Louise Island Low 30
10 Hibben High 70 22 Skidegate Lake Low 20 11 Naikoon High 70 23 Tasu Low 20 12 Otun Moderate 50 24 Eden Moderate 40
Viewpoint 2 # Landscape
Unit Biodiversity Emphasis
Retention Target*
# Landscape Unit
Biodiversity Emphasis
Retention Target
1 Athlow High 70% 13 Tlell High 70% 2 Beresford High 70% 14 Yakoun Lake High 70% 3 Jalun High 70% 15 Rennell Moderate 50% 4 Bigsby Protected Area n/a 16 Honna Moderate 50% 5 Skincuttle Protected Area n/a 17 Ian Moderate 50% 6 Kunghit Protected Area n/a 18 Sewell Moderate 50% 7 Gowgaia Protected Area n/a 19 Lower Yakoun Moderate 50% 8 Lyell Protected Area n/a 20 Masset Inlet Moderate 50% 9 Gudal High 70% 21 Louise Island Low 30%
10 Hibben High 70% 22 Skidegate Lake Low 30% 11 Naikoon High 70% 23 Tasu Low 30% 12 Otun High 70% 24 Eden Low 30%
*% of natural levels of old forest

Pierce Lefebvre Consulting
92
Table 34 Woodshed Impact Analysis
Name MVI MVI Rank Area Type Size (ha)
Canada and BC
LegislatedHaida
Protected
Haida LUV Cedar and
MAMUTotal
Protected
Canada and BC
LegislatedHaida
Protected
Haida LUV Cedar and
MAMUTotal
ProtectedSkonun 16.69 1 Forested Area 22,591 2.2% 7.5% 0.0% 9.8% 2.4% 7.5% 1.2% 11.1%
THLB 5,497 0.0% 13.7% 0.0% 13.7% 0.3% 13.7% 3.2% 17.1%Moresby 10.94 2 Forested Area 11,686 0.0% 0.0% 0.0% 0.0% 0.0% 0.0% 1.7% 1.7%
THLB 8,173 0.0% 0.0% 0.0% 0.0% 0.0% 0.0% 0.8% 0.8%Tlell 9.56 3 Forested Area 26,868 0.0% 0.0% 0.0% 0.0% 0.0% 34.7% 0.0% 34.7%
THLB 9,660 0.0% 0.0% 0.0% 0.0% 0.1% 35.9% 0.0% 36.0%Dinan 8.55 4 Forested Area 46,790 0.0% 4.4% 0.0% 4.4% 0.0% 4.4% 10.1% 14.5%
THLB 30,682 0.0% 0.8% 0.0% 0.8% 0.0% 0.8% 11.4% 12.2%Alliford 8.16 5 Forested Area 32,582 0.0% 7.1% 0.0% 7.1% 0.2% 9.6% 4.0% 13.8%
THLB 22,052 0.0% 3.8% 0.0% 3.8% 0.2% 7.1% 4.0% 11.3%Tasu 6.32 6 Forested Area 6,902 0.0% 0.0% 0.0% 0.0% 0.0% 0.0% 9.7% 9.7%
THLB 1,436 0.0% 0.0% 0.0% 0.0% 0.0% 0.0% 23.5% 23.5%Sewall 4.39 7 Forested Area 12,869 0.0% 2.4% 0.0% 2.4% 0.0% 2.4% 1.0% 3.5%
THLB 3,378 0.0% 3.9% 0.0% 3.9% 0.0% 3.9% 3.3% 7.1%Kootenay 4.2 8 Forested Area 35,912 0.0% 8.4% 0.0% 8.4% 1.8% 8.4% 0.6% 10.7%
THLB 14,106 0.0% 6.5% 0.0% 6.5% 0.3% 6.5% 0.6% 7.4%Skidegate 4.15 9 Forested Area 21,341 0.0% 2.3% 0.0% 2.3% 0.1% 3.2% 3.8% 7.1%
THLB 8,263 0.0% 0.1% 0.0% 0.1% 0.0% 0.8% 6.7% 7.5%Ferguson 2.07 10 Forested Area 85,451 0.0% 8.1% 0.0% 8.1% 0.3% 15.1% 9.9% 25.3%
THLB 57,121 0.0% 3.0% 0.0% 3.0% 0.1% 11.4% 10.4% 21.9%Newcombe 0.28 11 Forested Area 3,509 0.0% 0.0% 0.0% 0.0% 0.0% 0.0% 8.8% 8.8%
THLB 1,333 0.0% 0.0% 0.0% 0.0% 0.0% 0.0% 11.3% 11.3%Kuper 0.18 12 Forested Area 11,345 0.0% 0.0% 0.0% 0.0% 0.1% 0.0% 0.0% 0.1%
THLB 681 0.0% 0.0% 0.0% 0.0% 0.0% 0.0% 0.0% 0.0%Otun -0.05 13 Forested Area 10,305 0.0% 4.1% 0.0% 4.1% 0.0% 4.1% 0.0% 4.1%
THLB 473 0.0% 26.9% 0.0% 26.9% 0.0% 26.9% 0.0% 26.9%Hancock -1.05 14 Forested Area 13,650 0.0% 14.6% 0.0% 14.6% 0.1% 14.6% 0.0% 14.6%
THLB 1,998 0.0% 41.4% 0.0% 41.4% 0.0% 41.4% 0.0% 41.4%Security -1.4 15 Forested Area 9,022 0.0% 23.0% 0.0% 23.0% 0.3% 23.0% 0.0% 23.3%
THLB 905 0.0% 30.2% 0.0% 30.2% 0.0% 30.2% 0.0% 30.2%Deena -1.77 16 Forested Area 13,670 0.0% 10.7% 0.0% 10.7% 0.0% 10.7% 2.9% 13.6%
THLB 8,201 0.0% 5.9% 0.0% 5.9% 0.0% 5.9% 2.6% 8.5%Eden -2.82 17 Forested Area 45,639 0.0% 8.1% 0.0% 8.1% 0.2% 8.1% 7.9% 16.2%
THLB 16,964 0.0% 12.0% 0.0% 12.0% 0.4% 12.0% 12.7% 25.0%Louise -4.14 18 Forested Area 23,252 0.0% 0.0% 0.0% 0.0% 0.0% 0.0% 5.6% 5.6%
THLB 12,649 0.0% 0.0% 0.0% 0.0% 0.0% 0.0% 5.9% 5.9%Talunkwani -7.45 19 Forested Area 5,133 0.0% 0.0% 0.0% 0.0% 0.0% 0.0% 0.0% 0.0%
THLB 3,373 0.0% 0.0% 0.0% 0.0% 0.0% 0.0% 0.0% 0.0%Rennell -8.98 20 Forested Area 16,615 0.0% 0.0% 0.0% 0.0% 0.0% 0.0% 13.7% 13.7%
THLB 3,282 0.0% 0.0% 0.0% 0.0% 0.0% 0.0% 15.0% 15.0%Conspicuous -9.32 21 Forested Area 95,787 0.0% 65.1% 0.0% 65.1% 0.1% 83.4% 2.2% 85.6%
THLB 23,753 0.0% 47.1% 0.0% 47.1% 0.1% 71.1% 4.8% 75.9%Iron Side -10.99 22 Forested Area 21,802 0.0% 99.3% 0.0% 99.3% 0.3% 99.3% 0.0% 99.6%
THLB 3,153 0.0% 99.2% 0.0% 99.2% 0.4% 99.2% 0.0% 99.6%Seal -11.33 23 Forested Area 16,052 0.0% 65.1% 0.0% 65.1% 0.0% 65.2% 3.1% 68.4%
THLB 1,440 0.0% 48.1% 0.0% 48.1% 0.0% 48.2% 4.4% 52.7%Kano -11.97 24 Forested Area 15,491 0.0% 1.8% 0.0% 1.8% 0.0% 1.8% 7.6% 9.5%
THLB 655 0.0% 1.8% 0.0% 1.8% 0.0% 1.8% 11.9% 13.7%Hump -13.15 25 Forested Area 12,508 0.0% 0.0% 0.0% 0.0% 0.0% 0.0% 2.2% 2.2%
THLB 3,994 0.0% 0.0% 0.0% 0.0% 0.0% 0.0% 4.0% 4.0%Dawson -19.76 26 Forested Area 15,528 0.0% 7.7% 0.0% 7.7% 11.0% 7.7% 0.0% 18.7%
THLB 445 0.0% 18.8% 0.0% 18.8% 3.3% 18.8% 0.0% 22.1%Summary Area Type Total Area (ha)
Positive MVI Total Positive MVI Forested Area 317,846 0.2% 5.3% 0.0% 5.5% 0.5% 10.4% 5.4% 16.3%THLB 162,382 0.0% 2.8% 0.0% 2.8% 0.1% 8.4% 7.3% 15.8%
Negative MVI Total Negative MVI Forested Area 314,454 0.0% 33.6% 0.0% 33.6% 0.6% 39.2% 3.7% 43.5%THLB 81,285 0.0% 23.2% 0.0% 23.2% 0.1% 30.2% 6.2% 36.5%
LUP Viewpoint 1 - Forest Area Protected LUP Viewpoint 2 - Forest Area Protected
Pierce Lefebvre Consulting
93
Comparison of Different Sets of Data on Forest Employment for HG/QCI In early January 2006, the BC Integrated Land Management Bureau requested Pierce Lefebvre Consulting to explain and compare different sets of forest industry employment data for HG/QCI. The three main sources of data for forest sector employment in HG/QCI are:
• Cardell, Betsy. September 30, 2004. Survey completed for HG/QCI Community Planning Forum.
• Pierce Lefebvre Consulting. 2005. Haida Gwaii/QCI Timber Harvest and Processing
Employment Survey. BC Ministry of Agriculture and Lands.
• 2001 Census of Canada Experienced Labour Force data, as reported in: BC MSRM. 2004. Summary of Current Economic Conditions – Haida Gwaii / Queen Charlotte Islands. Prepared for HG/QCI Community Planning Forum.
In general, the data from the three sources are generally consistent, considering differences in survey methodology and purpose. The results from each data source are as follows: 2004 Survey by Betsy Cardell Employers who responded to the survey reported 370 employees as locals (83%) and 78 (17%) as non-locals for a total of 448 employees. These figures include all office and hourly employees and in some cases workers who have been laid off who should be working. Only one employer declined to participate in the survey. The survey did not attempt to collect data on timber harvest, or try to link employment to timber harvested. The results are dated September 30, 2004. 2005 Pierce Lefebvre Consulting Timber Harvest and Processing Employment Survey The Pierce Lefebvre Consulting Survey was conducted in early 2005, and the results were reported in June 2005. The survey links employment and harvest data and estimates employment coefficients per 1,000 m3 of timber harvested on the Islands. Data are reported for 3 years (2002, 2003 and 2004), and a 3-year average is calculated. All the major licensees and some smaller operations participated. Survey data cover an average of 87% of the total harvest for HG/QCI over the 3 year period. The industry employment impact data from the survey were extrapolated to the total harvest. The data are tabulated in terms of Person Years (PY) of employment. The data assume a job is full-time (one PY) if the work year consistently lasts 8 to 12 months per year, or at least 180 days per year. Part time employment data were collected and converted to PY of employment using 180 days per PY. The results show total harvesting and processing employment on HG/QCI of 573 Person Years (PY) for 2004, of which 369 PY are held by local residents (64%) and 204 PY are held by non-HG/QCI residents. Higher employment data are reported for 2002 and 2003, reflecting the higher timber harvest for those years. The results of the Pierce Lefebvre Consulting survey show higher employment resulting from the

Pierce Lefebvre Consulting
94
HG/QCI harvest overall than the Betsy Cardell 2004 survey (573 PY instead of 448 employees), but virtually the same number of local residents holding forest industry employment on HG/QCI (369 PY instead of 370 workers). 2001 Census of Canada Experienced Labour Force data, as reported in: BC MSRM. 2004. Summary of Current Economic Conditions – Haida Gwaii / Queen Charlotte Islands The Census of Canada data on experienced labour force survey is based on residency, and as a result does not estimate the number of individuals working on HG/QCI but residing elsewhere, but would include people living on HG/QCI but working off-Islands. The Census data are based on a survey of households, not employers, as is the case with the Betsy Cardell survey and the Pierce Lefebvre Consulting survey. In 2001, the experienced labour force involved in forestry (harvesting and processing) on HG/QCI is reported as 530 people.56 This compares with the 370 employees reported by Betsy Cardell, and the 369 PY of employment reported in the Pierce Lefebvre Consulting survey. Ignoring the differences in survey methodology and purpose, this would suggest a decline in forest sector employment for the Islands between 2001 and 2004. This may be due, at least in part, to the decline in timber harvest on HG/QCI over this period. The 2001 Experienced Labour Force survey data show that of the 530 HG/QCI residents involved in the forest industry, 425 people were involved in timber harvesting and 105 people were involved in timber processing. By comparison, the 369 PY of employment reported for 2004 by Pierce Lefebvre Consulting include 312 PY in timber harvesting and 58 PY in timber processing. The Betsy Cardell survey results do not differentiate between harvesting and processing employment.
56 Source: 2001 Census of Canada Experienced Labour Force data, as reported in: BC MSRM. 2004. Summary of Current Economic Conditions – Haida Gwaii / Queen Charlotte Islands. page 2..

Pierce Lefebvre Consulting
95
APPENDIX 2 MINING This Appendix provides some indication of the socio-economic impacts associated with metal mining activities in BC. Average socio-economic data and net economic value estimates for all operating metal mines in BC are not readily available. Included in this appendix are some 2002 benchmark data for one large BC metal mine, and aggregated 2001 data from BC MEM on three large metal mines operating in BC. The following data for the Huckleberry mine were compiled for the Morice LRMP Socio-Economic and Environmental Assessment (SEEA).57 The Huckleberry mine is an operating open pit copper, gold, silver and molybdenum mine some 86 km southwest of Houston (BC) that generates 215 PY of annual employment. 58 The following tables show the socio-economic impacts from the Huckleberry mine as an example of an “average” metal mine currently operating in BC. Table 35 Socio-Economic Impacts from Mining: the Huckleberry Mine Example
Economic Impacts of the Huckleberry Mine 2002 Direct Impacts $ per PY
Direct Employment 215 PY Direct Employment Income $13.90 Million $64,665 Direct GDP $38.95 Million $181,163 Direct Provincial Taxes and Levies $1.90 Million $8,837
Source: Based on Pacific Analytics Inc. et al., Morice LRMP Base Case Socio-Economic Assessment, 2003; as reported in: Pierce Lefebvre Consulting. 2004. page 93. Net Economic Value per PY for an Average Metal Mine - The Huckleberry Mine Example
Morice Area, $ Million
$ per PY
Public Sector Rent Gov't revenues excl. income taxes $0.95 $4,419 Labour Rent 5 % of direct wages and salaries $0.7 $3,233 Industry Rent to Capital Minimal Minimal Minimal TOTAL NET ECONOMIC VALUE $1.645 $7,652 See Notes to Table 35 on following page
57 Pierce Lefebvre Consulting. 2004. Socio-Economic and Environmental Assessment: Morice LRMP Table Final Land Use Recommendation. Prepared for MSRM Skeena Region. Pages 92 and 93. 58 The Huckleberry mine employs about 25% less than the BC average metal mine operating in 2004, after excluding Highland Valley Copper. For 2004, the BC MEMPR reports 2,701 people working in 7 operating metal mines, which includes 950 working at Highland Valley Copper, the largest base metal mine in Canada and one of the largest in the world, and an average of 292 workers per operating mine for the other 6 mines. (Based on BC MEMPR. 2005. www.em.gov.bc.ca/mining/miningstats/04mineconsap.thm. Accessed November 10th, 2005; also, BC MEM. 2005. BC Mining Plan).

Pierce Lefebvre Consulting
96
Notes to Table 35: 1. Public sector rents are assumed to equal approximately half of the $1.9 million reported in the Morice LRMP Base Case SEA for
provincial government revenues (see above table), as the $1.9 million includes direct corporate taxes as well as employee income taxes. The B.C. mining industry in 2002 paid $333 million in federal and provincial government revenues of which about half were for direct corporate taxes ($179 million) and the other half ($154 million) were for employee related income taxes (PriceWaterhouseCoopers. May 2003. The Mining Industry in B.C. – 2002. page 25).
2. Industry economic rents to capital are deemed to be minimal as average returns in the industry over the past ten years to not appear to be above a normal average return on investment; 59
Source: prepared by Pierce Lefebvre Consulting and reported in Pierce Lefebvre Consulting. 2004. page 93. The following table shows 2001 BC MEM estimates of the some average economic parameters associated with a new major metal mine. Table 36 Key Parameters for Average Major Metal Mine in BC
Economic Impact Indicator Average Parameters for Major Metal Mine in BC
• Number of jobs (Person Years (PY)) 335 jobs (PY) • Average mine life 16 years • Development capital $392 million • Average sales revenues $ 172 million per year
Notes: 1. While the average major mine life may be 16 years, there are often clusters of deposits that allow mining to continue
for much longer within a given area. 2. The above analysis is based on three of the 12 major metal mines then operating in B.C.: Eskay Creek in Northwest
B.C. (Homestake Canada – gold and silver), Myra Falls on Vancouver Island (Boliden Limited – copper, zinc, lead, gold and silver) and the Kemess mine northeast of Prince George (Northgate Exploration, copper and gold). In MEM’s view, these parameters represented the average size of major metal mines then operating in B.C.
Source: B.C. MEM, Issues in the Estimation of Mineral Value in Land-Use Planning, prepared by Karen Koncohrada, January 2001.
59 In BC, the after-tax return on shareholders investment from 1995 to 2004 for the BC mining industry has averaged 7.5% per year. (based on PriceWaterhouseCoopers, The Mining Industry in BC – 2004, page 20).
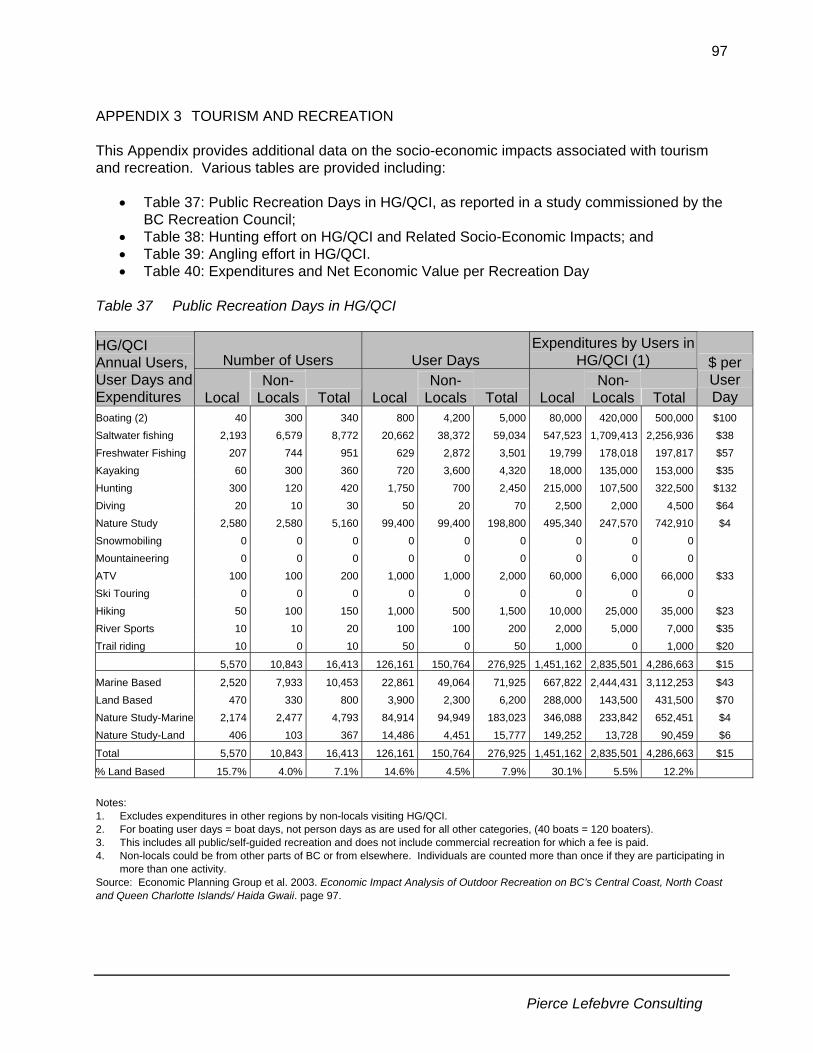
Pierce Lefebvre Consulting
97
APPENDIX 3 TOURISM AND RECREATION This Appendix provides additional data on the socio-economic impacts associated with tourism and recreation. Various tables are provided including:
• Table 37: Public Recreation Days in HG/QCI, as reported in a study commissioned by the BC Recreation Council;
• Table 38: Hunting effort on HG/QCI and Related Socio-Economic Impacts; and • Table 39: Angling effort in HG/QCI. • Table 40: Expenditures and Net Economic Value per Recreation Day
Table 37 Public Recreation Days in HG/QCI
Number of Users User Days Expenditures by Users in
HG/QCI (1) HG/QCI Annual Users, User Days and Expenditures Local
Non-Locals Total Local
Non-Locals Total Local
Non-Locals Total
$ per User Day
Boating (2) 40 300 340 800 4,200 5,000 80,000 420,000 500,000 $100 Saltwater fishing 2,193 6,579 8,772 20,662 38,372 59,034 547,523 1,709,413 2,256,936 $38 Freshwater Fishing 207 744 951 629 2,872 3,501 19,799 178,018 197,817 $57 Kayaking 60 300 360 720 3,600 4,320 18,000 135,000 153,000 $35 Hunting 300 120 420 1,750 700 2,450 215,000 107,500 322,500 $132 Diving 20 10 30 50 20 70 2,500 2,000 4,500 $64 Nature Study 2,580 2,580 5,160 99,400 99,400 198,800 495,340 247,570 742,910 $4 Snowmobiling 0 0 0 0 0 0 0 0 0 Mountaineering 0 0 0 0 0 0 0 0 0 ATV 100 100 200 1,000 1,000 2,000 60,000 6,000 66,000 $33 Ski Touring 0 0 0 0 0 0 0 0 0 Hiking 50 100 150 1,000 500 1,500 10,000 25,000 35,000 $23 River Sports 10 10 20 100 100 200 2,000 5,000 7,000 $35 Trail riding 10 0 10 50 0 50 1,000 0 1,000 $20
5,570 10,843 16,413 126,161 150,764 276,925 1,451,162 2,835,501 4,286,663 $15
Marine Based 2,520 7,933 10,453 22,861 49,064 71,925 667,822 2,444,431 3,112,253 $43 Land Based 470 330 800 3,900 2,300 6,200 288,000 143,500 431,500 $70 Nature Study-Marine 2,174 2,477 4,793 84,914 94,949 183,023 346,088 233,842 652,451 $4 Nature Study-Land 406 103 367 14,486 4,451 15,777 149,252 13,728 90,459 $6
Total 5,570 10,843 16,413 126,161 150,764 276,925 1,451,162 2,835,501 4,286,663 $15
% Land Based 15.7% 4.0% 7.1% 14.6% 4.5% 7.9% 30.1% 5.5% 12.2% Notes: 1. Excludes expenditures in other regions by non-locals visiting HG/QCI. 2. For boating user days = boat days, not person days as are used for all other categories, (40 boats = 120 boaters). 3. This includes all public/self-guided recreation and does not include commercial recreation for which a fee is paid. 4. Non-locals could be from other parts of BC or from elsewhere. Individuals are counted more than once if they are participating in
more than one activity. Source: Economic Planning Group et al. 2003. Economic Impact Analysis of Outdoor Recreation on BC’s Central Coast, North Coast and Queen Charlotte Islands/ Haida Gwaii. page 97.

Pierce Lefebvre Consulting
98
Table 38 Hunting Effort in HG/QCI and Related Socio-Economic Impacts Level of Hunting Effort by BC
Residents HG/QCI -
2001/2002 Season BC - 2001 HG/QCI as a % of BC (2001)
Number of BC Resident Hunters 521 123,773 0.4% Hunter Days - BC Residents 3,537 939,944 0.4% Big Game Harvest 975 37,479 2.6% Area (Million Hectares) 1.0 94.7 1.1%
HG/QCI, 2001/2002 Season Number of Kills by Species Resident Non-Res. Total Elk 5 5 Mule (Black Tailed) Deer 960 0 960 Black Bear 10 37 47
Total 975 37 1,012
Number of Hunters
Elk 36 0 36 Mule (Black Tailed) Deer 469 0 469 Black Bear 16 58 74
Total 521 58 579
Number of Hunter Days
Elk 191 0 191 Mule (Black Tailed) Deer 3,250 0 3,250 Black Bear 96 336 432
Total 3,537 336 3,873 Notes: 1. For HG/QCI, the breakdown of number of kills and number of hunters by residents and non-residents are based on the number of
hunter days. All big game kills in the HG/QCI season by non-residents are black bear. 2. As is the case for all of BC, the HG/QCI data on resident hunting exclude the hunting effort by Haida people as they are not
required to report the hunting effort to the province. Source: HG/QCI: Based on BC Ministry of Water, Land and Air Protection Big Game Hunting Statistics for 2001/2002, as reported in: Economic Planning Group et al. 2003. page 48. BC Data: Based on WLAP Resident Survey Statistics as reported in: GSGislason & Associates Ltd.. 2003. Resident Hunting in B.C. - An Economic Profile. BC MSRM. page 6.
Guide Outfitting – Net Economic Value Guide Outfitting – Socio-Economic Impacts
HG/QCI Net Economic Value
Impacts Per Guide: Based on Skeena Region 2002 Data: Total Employment 10 jobs per guide outfitter PY of Employment 4 PY per guide outfitter Wages and Salaries per PY $32,976 $ per PY Total Wages and Salaries $131,904 wages & salaries per guide Public Sector Rent - Licences and Taxes $38 $ per client day Industry Revenues per Client Day $784 $ per day Net Economic Value (NEV) Estimate for HG/QCI: Number of Client Days for HG/QCI 336 days for HG/QCI Total Revenues (336 client days @ $784 per day) $263,424 NEV : 5% of total revenues $13,171 Public Sector Rent - Licences and Taxes ( 336 days @ $38 per day) $12,768 $ per client day for 336 days $12,768
Wages and Salaries $131,904 NEV: 5% of wages & salaries $6,595 Total Net Economic Value $32,534 Note: Section 1.1 of this report defines net economic value (NEV) and explains the NEV assumptions. Source of Skeena Region Data: Pacific Analytics Inc. 2003. The Guide Outfitting Industry in British Columbia: An Economic Analysis of 2002 – Main Report. pages 23 and 24.

Pierce Lefebvre Consulting
99
Table 39 Angling Effort for HG/QCI
Total Angler Days Total Fish Caught Self Guided Angler Days Tidal Waters Angler
Days and Fish Caught
HG/QCI BC % of BC HG/QCI BC
% of BC
% of Total
BC Residents 49,268 1,555,016 3.2% 96,377 2,010,969 4.8% 90% 44,341
Canadian Non- BC Residents 19,635 158,822 12.4% 50,748 379,878 13.4% 50% 9,818
Other Non- BC Residents 19,505 274,139 7.1% 57,771 670,319 8.6% 25% 4,876
Sub-Total - Non-Residents 39,140 432,961 9.0% 108,519 1,050,197 10.3%
Total 88,408 1,987,977 4.4% 204,896 3,061,166 6.7% 59,035
Freshwater Angling 3,501 4,402,000 0.1% Source: Tidal Angler Days: Based on Keith Brickly, DFO, Ottawa - BC Tidal Sport Fishing Summaries as reported in: Economic Planning Group et al., 2003. page 21. BC Freshwater Angling data: GSGislason & Associates Ltd. 2003. Freshwater Angling in BC – An Economic Profile. BC MSRM and MWLAP. HG/QCI Freshwater Angling Days: Economic Planning Group et al. 2003. page 97. Table 40 Expenditures and Net Economic Value per Recreation Day
Activity Type Expenditures per Day Net Economic Value per Day
Outdoor Activities in Natural Areas and Wildlife Viewing
$45 -(EC-1996); Depends on activities: $10 (locals hiking) to $60 (locals ATV) (ORC-2003) $8.2 per day -(EC-1996)
Resident Hunting $50 - (EC-1996) $123 - (ORC- 2003)
$17.90/day - (EC- 1996) and $55/day - (MELP-1998)
Resident Angling $29 - (EC – 1996) $31 - (ORC– 2003) $12.2 - (EC-1996)
Wildlife Viewing $5 - (ORC-2003) $18 - (EC-1996)
$22 - (MELP-1998)
$7.6 - (EC-1996) and $44/day (MELP-1998)
Total $10 to $20 (EC-1996); $50 range (MELP-1996)
Source: • Expenditures and net economic value: Environment Canada (EC). 1996. The Importance of Nature to Canadians: The Economic
Significance of Nature Related Activities in 1996. www.ec.gc.ca, web site accessed February 2004. • Net Economic Value: Reid, Roger. 1998. Economic Value of Wildlife Activities in British Columbia, 1996. BC Ministry of
Environment, Lands and Parks (MELP), Victoria. Tables 21(page 3) & 23 (page 26); BC Environment 1995. BC Resident Hunter Survey; BC Ministry of Water, Land and Air Protection (WLAP). 2001. Economic Benefits of BC's Provincial Parks.
The Economic Planning Group et al. 2003. Economic Impact Analysis of Outdoor Recreation on British Columbia’s Central Coast, North Coast and Queen Charlotte Islands/Haida Gwaii. Outdoor Recreation Council (ORC) of British Columbia. page 102.

Pierce Lefebvre Consulting
100
APPENDIX 4 COMMUNITY SUSTAINABILITY This Appendix provides detailed data on the community economic base and population in HG/QCI. This includes the following tables:
- Table 41 provides data on employment and before tax income dependency for Masset, Port Clements and the rest of HG/QCI; the data are based on the 2001 Canada Census data;
- Table 42 provides data on HG/QCI population in 1981, 1991, 1996 and 2001 for all major communities; Table 41 also provides data on the percentage of HG/QCI population which is of aboriginal ancestry; and
- Table 43 provides data on school enrolment between 2000 and 2005. This Appendix also provides an analysis of the relevance of the 2001 Census population and labour force data given that the validity of this data has been questioned by some HG/QCI residents. The concern is that the Census process for Old Masett was not completed satisfactorily, and that the population and labour force data produced by the Census for Old Masett are either missing or not useful. Table 41 Employment and Before Tax Income Dependency, 2001
HG/QCI Basic Sector Employment Masset Port
ClementsRest of HG/QCI
Total HG/QCI
Number of Jobs
Before Tax Income ($
Million) % of Total
Forestry 8% 42% 30% 28% 672 32.3 36% Mining 0% 0% 1% 1% 14 0.1 0% Fish & Trapping 10% 0% 8% 8% 191 3.8 4% Agriculture & Food 0% 5% 1% 1% 20 0.1 0% Tourism 18% 6% 13% 12% 292 4.7 5% Public Sector 48% 27% 38% 41% 966 27 30% Construction 2% 16% 6% 6% 134 3.5 4% Other Basic 12% 3% 3% 4% 95 1.6 2% Transfer Payments 11.3 13% Non-Employment 5.5 6% Sub-Total - Direct and Indirect 98% 99% 100% 100% 2,384 89.9 100% Induced Employment 508 8.9 Total (may not add due to rounding) 98% 99% 100% 100 2,892 98.8 Source: 2003 Community Dependency Models for HG/QCI – Based on 2001 Canada Census data (BC Stats. 2003), as reported in: BC MSRM. 2004. Summary of Current Economic Conditions HG/QCI. page 4.

Pierce Lefebvre Consulting
101
Table 42 HG/QCI Population
HG/QCI Population 1981 1991 1996 2001 % Change 1981-2001 2004 Est.
Graham Island Masset 1,569 1,476 1,293 926 -41% Old Massett Village 580 632 692 707 22% Port Clements* 380 483 558* 516 36% Tlell 100 138 185 223 123% Skidegate Village 322 469 695 743 131% Queen Charlotte City (RD Area F) 1,070 933 1,222 1,045 -2% Other Graham Island (RD Area D Excl. Tlell) 322 421 335 315 -2% Total Graham Island 4,343 4,552 4,980 4,475 3% Moresby Island Sandspit 754 702 568 435 -42% Other Moresby Island 524 62 50 25 -95% Total Moresby Island 1,278 764 618 460 -64% HG/QCI Forest District Population 5,620 5,316 5,598 4,935 -12% Old Massett and Skidegate 902 1,101 1,387 1,450 61% Other 4,718 4,215 4,211 3,485 -26% 1986 1991 1996 2001 2004 Est. BC Stats Estimates and Projections 5691 5,475 5,829 5,150 N/A 5,221 Notes: *Port Clements amalgamated with Juskatla in 1985. The BC Stats estimates and projections are slightly different from the community population data reported in the HG/QCI Background report. This is likely due to the BC Stats data including estimates of the Net Census Undercount (population that was not counted at the time of the Census). Source: Based on Statistics Canada Census data as reported in: HG/QCI Land Use Planning Process. 2003. Background Report. Page 9. BC Stats: BC Stats. 2004. Local Health Area 50 - Queen Charlotte Islands Statistical Profile.
HG/QCI Population 2001 % of Total 2004 Haida Nation and Other Aboriginal 1,805 37%
Visible Minority 65 1%
Rest of Population 3,050 62%
Total 4,920 100% 5,221 Source: BC Stats. 2004. Local Health Area 50 - Queen Charlotte Statistical Profile.

Pierce Lefebvre Consulting
102
Table 43 School Enrolment for School District 50 (HG/QCI) HG/QCI Headcount - Includes Only School
Age Children Location 2000/01 2001/02 2002/03 2003/04 2004/05
% Change 2000/01 to
2004/05 Agnes L Mathers Elementary-Jr & Secondary Sandspit 67 51 45 52 56 -16%
George M Dawson Secondary Masset 186 206 189 183 177 -5%
Port Clements Elementary Port Clements 81 75 67 65 59 -27% Queen Charlotte Secondary (note 1) QC City 203 203 167 155 151 -10%
Sk'aadgaa Naay Elementary Skidegate 224 221 213 212 189 -16%
Tahayghen Elementary Masset 195 192 183 169 149 -24%
Total School Age Children 956 948 864 836 781 -18% Adult Student Enrolled in Schools 76 58 112 96 40 -47%
Total Student Population 1,032 1,006 976 932 821 Number of PY Students
2000/01 2001/02 2002/03 2003/04 2004/05 2005/06
District 50 (HG/QCI) Enrolment not available 948 870 830 792 750 Notes: 1. The student population for Queen Charlotte Secondary School for 2001/02 was estimated based on the District 50 Enrolment,
and enrolment at other schools. The student population was assumed the same for 2000/01 as for 2001/02. Source: BC Ministry of Education. December 2004. Student Enrolment Reports, 2000/01 to 2004/05; Number of FTE students: School District 50 (HG/QCI). 2005. FY 2005/2006 Budget Presentation. Review of Census Data Regarding Old Massett Some HG/QCI residents have expressed concern about the accuracy of 2001 Census data for the Islands, and in particular the data for Old Massett (Masset 1 IR). The concern is that the Census process for Old Masett was not completed satisfactorily, and that the population and labour force data produced by the Census for Old Masett are either missing or not useful. Pierce Lefebvre Consulting has undertaken a brief review of this issue, with our findings described in the following paragraphs. 2001 Census of Canada Data Old Masett (Masset 1 IR) and Skidegate (Skidegate 1 IR) Census data are gathered from households, with 80% of households receiving a “short form” (7 question) survey that gathers basic information on population by age, sex, and marital status, and 20 % of households receiving a “long form” (59 question) survey which gathers additional information on ethnic background, migration, housing characteristics, income, labour force participation, occupations and industries. The “long form” responses are weighted to provide estimates for the total population, given that the survey starts with a 20% sample. The census data are gathered, edited, interpreted and published using rigorous methodology that has been developed over the past 350 years of census taking in Canada (see Statistics Canada 2001 Census Handbook, http://www12.statcan.ca/english/census01). The methodology includes policies and procedures to maximize the number of completed, useable survey forms and to assist respondents in providing accurate information. The data generated by the questionnaires are then subjected to error checking and cleansing procedures to filter out and correct for various

Pierce Lefebvre Consulting
103
potential sources of error. Missing or inconsistent responses are corrected through imputation using “deterministic” and/or “minimum-change hot-deck” methods. Two different automated systems were used to carry out this processing, the Nearest-neighbour Imputation Method (NIM), which was expanded for the 2001 Census and implemented in a system called CANCEIS (CANadian Census Edit and Imputation System) and SPIDER (System for Processing Instructions from Directly Entered Requirements). See: Statistics Canada 2001 Census Handbook, Section 2.6, Data Processing, pages 15 – 20 for more detail. Statistics Canada policies and procedures for the publication of Census results include provisions to suppress the publication of data where the confidentiality of individual responses may be at risk, or where survey techniques or response rates are not considered to have produced reliable data. The smaller the geographic area or population unit being queried, the more likely data suppression issues may arise. The “short form” census questions provided data for Old Masett (Masset 1 IR) and for Skidegate (Skidegate 1 IR) which were considered to be sufficiently accurate to be individually reportable under the Statistics Canada data quality policy (usable survey response rate greater than 75%), These data include total population as well as breakdowns by sex, age group, and marital status. Data based on “long form” questions are available for Skidegate, but have been suppressed for Old Masett due to a non-response rate which is over 25% for the “long form” sample. This does not mean that the long form data for Old Masett do not exist, but simply that they do not meet Statistics Canada’s required confidence level for statistical accuracy, since they were generated from a statistically small sample size and augmented with interpolated data. The “long form” question results/estimates for Old Masett are included when combined within larger geographic area or population queries (i.e. if data is requested for Old Masett and Skidegate combined as shown in Table 2: HG/QCI Experienced Labour Force by Community in Summary of Current Economic Conditions, Haida Gwaii/Queen Charlotte Islands, prepared for HG/QCI Community Planning Forum by MSRM, Nov. 25, 2004, pg. 2). Implications for the Socio-Economic Assessment of the HG/QCI Land Use Plan Options 2001 Census data are utilized in both the Summary of Current Economic Conditions report (MSRM, Nov. 2004) and in Section 4.2 of this socio-economic assessment. The primary use of this data is to indicate population counts and trends for the Islands as a whole, and for various sub-areas and communities on the Islands. The 2001 population count data are derived from the “short form” questions in the Census survey, for which Statistics Canada indicates there were sufficient response rates for all sub-areas and communities (including Old Masett) to provide a reasonable level of confidence in the data. Census data is also utilized to indicate the composition of the experienced labour force on the Islands, as well as employment and income dependency by sector. This data is dependent on the “long form” census survey for which, as discussed earlier, Old Masett on its own did not provide a sufficient response rate to generate data considered by Statistics Canada to be reliable or reportable. Therefore, there is no breakdown of any of the labour force or economic dependency data for Old Masett on its own, but Old Masett data is included in data for broader geographic aggregations.

Pierce Lefebvre Consulting
104
The influence of potentially unreliable Old Masett labour force data is diminished when it is combined with better quality labour force data for other geographic areas or communities on the Islands. For example, Table 2: HG/QCI Experienced Labour Force by Community in Summary of Current Economic Conditions, Haida Gwaii/Queen Charlotte Islands reports labour force data by industry for Old Masett and Skidegate combined, but not for Old Masett on its own. The total experienced labour force for the two communities combined is 705 people (rounded to the nearest 5), whereas for Skidegate alone it is 350 (from Statistics Canada 2001 Community Profiles, http://www12.statscan.ca/english/profil01/CP01/Details). Similarly, Table 3: Basic Sector Income and Employment in Haida Gwaii/QCI (2001) in Summary of Current Economic Conditions, Haida Gwaii/Queen Charlotte Islands reports basic sector employment dependency by industry for Masset, Port Clements and the Rest of HG/QCI. This data is generated by the 2003 Community Dependency Model for Haida Gwaii/Queen Charlotte Islands (BC Stats, 2003) which is based on 2001 Census information. In this table, the potentially unreliable results for Old Masett are aggregated with Skidegate, Queen Charlotte City, Tlell and Sandspit under the “Rest of HG/QCI” category. This socio-economic assessment does not make extensive use of the labour force data derived from the 2001 Census. Most of the local employment data by industry sector cited in the report are taken from recent local industry surveys undertaken for various purposes including supporting the land use planning process. In estimating the potential impacts of land use plan options this SEA report uses the Census labour force data only for the purposes of determining an Islands wide labour force to population ratio (Table 22, Section 4.2). This ratio is then applied to the estimates of potential changes in local employment to derive potential population impacts associated with changes in local employment. The qualitative comments in this SEA related to the impacts on individual communities consider the basic sector employment dependency data noted above, as well as the HG/QCI Timber Harvest and Processing Employment Survey (Pierce Lefebvre Consulting, June 2005) which included a question on HG/QCI forestry workers community of residence. The statistical significance of the Old Masett Census labour force data appears to be questionable on its own, and does not meet the Statistics Canada requirements for publication. When combined with data from other Island communities, the confidence level in the combined data rises, and is assumed to give a reasonable representation of actual labour force characteristics in 2001.

Pierce Lefebvre Consulting
105
APPENDIX 5 GEOGRAPHIC INFORMATION SYSTEM (GIS) DATA
VIEWPOINT 1 VIEWPOINT 2
HG QCI SEA Source Table Private,
Fed ands, and Indian Reserves
Canada and BC
Legislated Protected
Haida Protected
Haida LUV Cedar and
Mamu
General EBM Total
Private, Fed ands, and Indian Reserves
Canada and BC
Legislated Protected
Haida Protected
Haida LUV Cedar and
Mamu
General EBM Total
Total Land Base Total Area 21,642 225,139 153,901 0 604,082 1,004,764 21,642 230,961 190,688 30,320 531,153 1,004,764 FORESTS TIMBER HARVESTING LANDBASE 6,640 0 23,462 0 213,584 243,687 6,640 227 37,511 16,638 182,669 243,687 Management Units QC TSA Total Area 10,983 157 135,434 0 308,813 455,388 10,983 4,931 165,622 11,487 262,365 455,388 Management Units TFL 25 Total Area 0 0 19 0 53,757 53,777 0 301 19 893 52,564 53,777 Management Units TFL 39 Total Area 10,620 0 15,547 0 216,013 242,180 10,620 651 22,147 17,424 191,338 242,180 Management Units TFL 47 Total Area 1 0 2,620 0 24,857 27,479 1 2 2,620 497 24,358 27,479 Woodlots YES Total Area 135 0 0 0 3,875 4,010 135 0 0 7 3,869 4,010
Mushroom Management Zones Total Area 4,120 0 2,568 0 45,437 52,125 4,120 112 2,571 3,712 41,609 52,125 Community Watersheds Total Area 1,072 0 0 0 6,795 7,867 1,072 0 0 713 6,082 7,867
Retention Total Area 1,879 458 27,377 0 22,651 52,365 1,879 1,468 27,608 1,668 19,742 52,365 Scenic Areas - TSR VQOs
Partial Retention Total Area 2,268 82 20,879 0 125,719 148,947 2,268 2,895 22,146 6,818 114,821 148,947
Modification Total Area 2,329 15 2,061 0 49,938 54,343 2,329 285 2,167 3,438 46,124 54,343 6,475 555 50,317 0 198,308 255,655 6,475 4,647 51,921 11,924 180,687 255,655
AGRICULTURE ALR Total Area 3,114 2,943 4,877 0 18,438 29,373 3,114 2,993 7,294 2,471 13,501 29,373
MINERALS Very High Total Area 12,430 145,905 35,036 0 296,980 490,352 12,430 151,202 44,352 11,521 270,847 490,352 Metallic Mineral
Potential High Total Area 8,512 77,107 116,922 0 303,028 505,570 8,512 77,337 144,380 18,629 256,711 505,570 Moderate Total Area 0 0 0 0 0 0 0 0 0 0 0 0 Low Total Area 0 0 0 0 0 0 0 0 0 0 0 0 Very High plus High 20,943 223,012 151,958 0 600,008 995,922 20,943 228,539 188,732 30,150 527,558 995,922
Very High Total Area 3,273 153,535 129,527 0 438,357 724,693 3,273 158,740 149,478 21,523 391,679 724,693 Industrial Mineral Potential High Total Area 17,670 69,477 22,431 0 161,651 271,229 17,670 69,799 39,254 8,627 135,879 271,229 Moderate Total Area 0 0 0 0 0 0 0 0 0 0 0 0 Very High plus High 20,943 223,012 151,958 0 600,008 995,922 20,943 228,539 188,732 30,150 527,558 995,922

Pierce Lefebvre Consulting
106
VIEWPOINT 1 VIEWPOINT 2
HG QCI SEA Source Table Private,
Fed ands, and Indian Reserves
Canada and BC
Legislated Protected
Haida Protected
Haida LUV Cedar and
Mamu
General EBM Total
Private, Fed ands, and Indian Reserves
Canada and BC
Legislated Protected
Haida Protected
Haida LUV Cedar and
Mamu
General EBM Total
Mineral Tenures Mineral Tenure Total Area 0 0 0 0 0 0 0 0 0 0 0 0
Mineral Claims Mineral Total Area 107 1,005 1,802 0 33,486 36,400 107 1,005 1,916 5,547 27,826 36,400
Mineral Claims Placer Total Area 0 0 0 0 19 19 0 0 0 0 19 19
Coal Fields Total Area 5,904 5,201 1,797 0 5,661 18,564 5,904 5,241 1,797 219 5,402 18,564
ARIS Number of Sites Count 6 76 42 0 282 406 6 78 60 26 236 406
ARIS Expenditures (1986) Dollars 125,938 2,908,492 1,753,830 0 12,594,103
17,382,362 125,938 2,917,535 2,614,741 791,603 10,932,546
17,382,362
Developed Prospect Count 0 5 0 0 2 7 0 5 0 0 2 7
Metallic Mineral Occurrences Past Producer Count 2 15 0 0 3 20 2 15 0 0 3 20 Prospect Count 0 8 1 0 6 15 0 8 1 0 6 15 Showing Count 1 44 14 0 49 108 1 45 15 3 44 108 Total Count 3 72 15 0 60 150 3 73 16 3 55 150
Developed Prospect Count 1 0 1 0 0 2 1 0 1 0 0 2
Coal Occurrences (points) Past Producer Count 0 0 0 0 1 1 0 0 0 0 1 1 Prospect Count 3 0 0 0 0 3 3 0 0 0 0 3 Showing Count 1 0 0 0 0 1 1 0 0 0 0 1 Total Count 5 0 1 0 1 7 5 0 1 0 1 7
Oil Basin (Oil & Gas Potential)
Queen Charlotte Basin Total Area 21,641 225,147 153,884 0 604,097 1,004,769 21,641 230,979 190,671 30,321 531,158 1,004,769
Tourism and Recreation Existing Tourism Facilities Fishing Lodges Count 9 1 7 0 7 24 9 1 8 0 6 24 Other Lodges Count 19 3 0 0 1 23 19 3 0 0 1 23 Other Facilities Count 27 1 0 0 5 33 27 1 0 0 5 33 Existing Tourism Features Anchorages Count 1 23 12 0 15 51 1 23 12 0 15 51
Km of Trail Recreation Trails
Total Length 18 112 20 0 97 247 18 112 47 4 67 247
Favourite Recreation Count 0 0 0 0 0 0 0 0 0 0 0 0

Pierce Lefebvre Consulting
107
VIEWPOINT 1 VIEWPOINT 2
HG QCI SEA Source Table Private,
Fed ands, and Indian Reserves
Canada and BC
Legislated Protected
Haida Protected
Haida LUV Cedar and
Mamu
General EBM Total
Private, Fed ands, and Indian Reserves
Canada and BC
Legislated Protected
Haida Protected
Haida LUV Cedar and
Mamu
General EBM Total
Sites
Recreation Opp. Spectrum
Roaded Modified Total Area 8,354 60 3,207 0 147,020 158,641 8,354 255 5,094 8,924 136,014 158,641
Roaded Natural Total Area 2,001 0 2,216 0 32,914 37,131 2,001 42 2,563 2,372 30,154 37,131
Primitive Total Area 0 108 0 0 3,615 3,723 0 397 0 118 3,208 3,723 Rural Total Area 544 0 28 0 133 706 544 0 28 3 131 706
Semi Primitive Mot Total Area 4,400 987 60,302 0 131,217 196,906 4,400 3,623 66,728 7,457 114,698 196,906
Semi Prim Non-Mot Total Area 2,164 68 87,421 0 255,422 345,074 2,164 1,669 115,549 10,338 215,355 345,074
Urban Total Area 695 0 0 0 37 733 695 0 0 3 34 733 UA Total Area 3,484 223,915 726 0 33,725 261,850 3,484 224,975 726 1,106 31,560 261,850
WILDLIFE Marbled Murrelet Habitat Hab Class 1 Total Area 2,744 41,542 27,243 0 86,615 158,144 2,744 42,019 36,640 14,376 62,364 158,144 Hab Class 2 Total Area 594 7,262 6,627 0 42,095 56,577 594 7,552 9,344 3,262 35,826 56,577 Hab Class 3 Total Area 250 2,044 11,383 0 11,585 25,262 250 2,154 13,099 1,033 8,726 25,262 Seabird colonies (point counts) YES Count 4 55 4 0 37 100 4 61 4 0 31 100 Seabird Colonies (rec'd protection) Total Area 9 399 1,086 0 684 2,177 9 476 1,086 0 606 2,177 Northern Goshawk Known Nests Total Area 0 200 302 0 1,764 2,265 0 200 381 251 1,434 2,265
Northern Goshawk Predicted Nests Total Area 149 1,000 1,289 0 7,483 9,921 149 1,001 1,889 203 6,679 9,921
NOTES: THLB (Timber Harvesting Land Base) including all Partial and Contributing Area. "Other" Canada and BC legislated protected areas include Pure Lake, Drizzle Lake, Tow Hill, Rose Spit and Lepas Bay. Source: ILM Bureau (BCMAL) GIS Data. 2005. provided by John Sunde (BC MAL). October and November 2005.

Pierce Lefebvre Consulting
108
No Mining Zones
(Selected Watersheds)
Ain Awun Copper Davidson Naden YakounTotal -
No Mining
Total HG/QCI
% of Total
Total Area 4,119 7,216 16,090 11,888 12,689 57,359 109,360 1,004,764 10.9%
Metallic Mineral Potential
Very High 16,087 34,220 50,307 490,352 10.3%
High 4,089 7,216 11,878 12,666 23,097 58,945 505,570 11.7%
Sub-Total - Very High & High 57,316 109,252 995,922 11.0%
Industrial Mineral Potential
Very High 4,089 7,216 16,087 11,878 12,666 10,543 62,478 724,693 8.6%
High 46,773 46,773 271,229 17.2%
Sub-Total - Very High & High 57,316 109,252 995,922 11.0%
Mineral Tenures/ Claims (ha) 8 16,175 16,183 36,400 44.5%
Coal Fields Area (ha) 6,303 6,303 18,564 34.0%
ARIS
Number of Sites 8 94 102 406 25.1%
Expenditures (1986) 91,729 6,470,152 6,561,881 17,382,362 37.8%
Metallic Mineral Occurrences
Developed Prospect 1 1 7 14.3%
Showing 2 10 12 108 11.1%
Other 35 0.0%
Total 2 11 13 150 8.7%
Coal Occurrences
Developed Prospect 2 2 2 100.0%
Past Producer 1 0.0%
Prospect 1 1 3 33.3%
Showing 1 1 1 100.0%
Total 4 4 7 57.1%
Community Watersheds (ha) 18 18 7,867 0.2%

Pierce Lefebvre Consulting
109
APPENDIX 6 LIST OF SELECTED REFERENCES BC Ministry of Agriculture and Lands. 2006. Guidelines for Socio-Economic and Environmental Assessment (SEEA) (draft). 106 pages. BC Ferries. 2004. Northern Strategy Public Consultation. 73 pages. BC Ferry Services Inc. 2005. 2004/2005 Annual Report to the BC Ferry Commissioner. 72 pages. BC Ministry of Energy and Mines. 2005. BC Mining Plan. 41 pages. BC Ministry of Energy and Mines. British Columbia Mining and Mineral Exploration Overview 2004. 18 pages. BC Ministry of Forests (Chuck Rowan) and BC Ministry of Sustainable Resource Management (Glenn Farenholtz). Draft December 2004. Economic Implications of Stand Level Retention Recommendations developed for the Central Coast LRMP Planning Process. 25 pages. BC Ministry of Forests (S. Tedder, D. Mitchell, and S. Farran). 2000. Seeing the Forest Beneath the Trees: The Social and Economic Potential of Non-Timber Forest Products and Services In the Queen Charlotte Islands/ Haida Gwaii. BC Ministry of Forests, October 2000. Queen Charlotte Timber Supply Area Analysis Report, 143 pages. BC Ministry of Forests. 2003. Major Primary Timber Processing Facilities in BC 48 pages. BC Ministry of Forests. March 25th, 2003. Notice to Exporters Concerning Order-In-Council (OIC) 121. BC MOF and MSRM, Chuck Rowan and Glenn Farenholtz. 2004. Economic Implications of Stand Level Retention Recommendations Developed for the Central Coast LRMP Planning Process. 21 pages. BC MSRM. 2004. Summary of Current Economic Conditions – Haida Gwaii / Queen Charlotte Islands. Prepared for HG/QCI Community Planning Forum. 16 pages. Canadian Forest Service (Brad Stennes and Bill Wilson). 2000. The Queen Charlotte Islands - A Discussion of Forest Sector Development. Working Paper 2000.01. 68 pages. Cortex Consultants Inc. (Doug Williams and Mike Buell). August 2004. Economic Gain Spatial Analysis – Timber CIT Region. Coast Information Team. Cortex Consultants Inc. 2005. Summary of Timber Supply Analysis of EBM Scenarios.

Pierce Lefebvre Consulting
110
Cortex Consultants Inc. and Gowlland Technologies Ltd. November 17, 2004. Haida Gwaii / Queen Charlotte Islands LUP Timber Supply Analysis – Analysis of Base Cases. Prepared for Ministry of Sustainable Resource Management. 14 pages. Cortex Consultants Inc. and Hi-Mark Consultants Inc. July 2004. Second Growth Timber Opportunities on Haida Gwaii / QCI. BC MSRM. 47 pages. Council of the Haida Nation. 2004. Haida Gwaii YAH’GUUDANG (Respect for this Place) Haida Land Use Vision. 18 pages. Crane Management Consultants Ltd. and Peter Drake and Associates. 1997. Feasibility Study for Log Home Construction in the Lakes District. Lakes Development Society. 81 pages. Economic Planning Group and Juan de Fuca Environmental Consultants. 2003. Economic Impact Analysis of Outdoor Recreation on BC’s Central Coast, North Coast and Queen Charlotte Islands/ Haida Gwaii. Outdoor Recreation Council of BC. 119 pages. EcoTech Environmental Consultants (Don J. Harrison). 2004. Review and Assessment of the Metallic Mineral Potential of Haida Gwaii. For Forest Ethics, Greenpeace, Sierra Club of Canada (BC Chapter) and Rainforest Action Network. Gadja, Anna. 2004. Backcountry Management Approach in Gwaii Haanas National Park Reserve and Haida Heritage Site. 12 pages. Glen E. Bridges and Associates Inc. 2002. Construction Aggregates – Building Block Profile. prepared for BC MSRM with support from BC Ministry of Energy and Mines. Gowlland Technologies Ltd. and Cortex Consultants Inc. September 2, 2005. Haida Gwaii / Queen Charlotte Islands Timber Supply Analysis – Analysis of Viewpoints. Prepared for Ministry of Sustainable Resource Management.13 pages. GSGislason and Associates. 2003a. QCI Fishing Lodge Industry. BC Seafood Sector and Tidal Water Recreational Fishing: A Strengths, Weaknesses, Opportunities and Threats Assessment. 14 pages. GSGislason and Associates. 2003b. Saltwater Fishing Charters in BC – An Economic Profile, prepared for Economic Development Branch. BC MSRM. 7 pages. HG/QCI Land Use Process. 2003. Haida Gwaii / QCI Background Report. BC MSRM. 213 pages. HG/QCI LUP Process Management Team. 2006. Haida Gwaii / Queen Charlotte Islands Land Use Plan Recommendations Report. 202 pages. Holman, G. 2004. HG/QCI Land Use Plan Socio-Economic Base Case (Final Draft). HG/QCI LUP and BC MSRM. 66 pages.

Pierce Lefebvre Consulting
111
Horne, Dr. Garry. BC Stats. 2004. British Columbia’s Heartland at the Dawn of the 21st Century, 2001 Economic Dependencies and Impact Ratios for 63 Local Areas. BC Ministry of Management Services. 105 pages. Meadfield Consulting Inc and Economic Growth Solutions Inc. in association with Sandra White and Associates. 2004. Haida Nation Tourism Business Opportunities Plan. Council of the Haida Nation and Haida Tribal Society. 49 pages. Pacific Analytics Inc. 2003. The Guide Outfitting Industry in British Columbia: An Economic Analysis of 2002 – Main Report. 43 pages. Pacific Analytics Inc. and EcoTech Consulting. 2004. Revitalizing BC’s Coastal Economy, A New Economic Vision for the North and Central Coast and Haida Gwaii. 112 pages. Pansino, Christine. 2004. A Feasibility Analysis of Free-Use-Permits for the Development of a Cedar Conservation Strategy: HG/QCI, BC University of Toronto Faculty of Forestry. Forest Conservation student paper under supervision of Andy Kenney and Leonard Munt. 39 pages. Parks Canada. 2005. Gwaii Haanas National Park Reserve and Haida Heritage Site. http://www.pc.gc.ca/pn-np/bc/gwaiihaanas/edu/index_e.asp. Accessed July 7th, 2005. Pearse, Dr. Peter H. 2001. Ready for Change, Crisis and Opportunity in the Coastal Forest Industry, A Report to the Minister of Forests on British Columbia’s Coastal Forest Industry. BC Ministry of Forests. Pierce Lefebvre Consulting and D.A. Ruffle & Associates Ltd. 2002. Study of Pollution Prevention Opportunities in the Coastal Forest Industry with Respect to Dioxins and Furans. Canadian Council of Ministers of the Environment. 63 pages. Pierce Lefebvre Consulting, Stuart Gale & Associates and Brimar Consultants. 2001. Socio-Economic Impact Assessment of the Provincial Government's Strategic Land Use Plans on Key Sectors in B.C. BC MSRM. 130 pages. Pierce Lefebvre Consulting. 2004. Morice Land & Resource Management Plan Socio-Economic and Environmental Assessment: Morice LRMP Table Final Land Use Recommendation. MSRM Skeena Region. 143 pages. Pierce Lefebvre Consulting. 2005. Haida Gwaii/QCI Timber Harvest and Processing Employment Survey. BC Ministry of Agriculture and Lands. 11 pages. PriceWaterhouseCoopers, The Mining Industry in BC – 2002, 30 pages. PriceWaterhouseCoopers. 2005. The Mining Industry in British Columbia 2004. 43 pages. QCI Chamber of Commerce. 2005. Minutes of the Annual General Meeting of the QCI Chamber of Commerce. March 6th, 2005. Port Clements. 3 pages.

Pierce Lefebvre Consulting
112
Redstone Strategy Group, LLC. 2003. Coastal BC Economic Development Sector Overviews. Various presentations to Conservation Investments and Incentives Initiatives. Timberline Forest Inventory Consultants Ltd. 2002. HG/QCI LUP Woodshed Analysis – Final Report. BC Ministry of Sustainable Resource Management Coast Region. 31 pages. Veridian Ecological Consulting Ltd. (Rachel F. Holt). 2006. HG/QCI Land Use Viewpoints: Ecological Risk Assessment. Prepared for BC MSRM. 61 pages. Veridian Ecological Consulting Ltd. (Rachel F. Holt). 2005. Environmental Conditions Report: For the Haida Gwaii / Queen Charlotte Islands Land Use Plan. Prepared for BC MSRM. Available at: http://srmwww.gov.bc.ca/cr/qci/hgqci_env.htm. 191 pages. Von Schilling Forest Management. 2003. A Selected Survey of Silvicultural Systems and Harvesting Practices in HG/QCI. BC MSRM. 86 pages Weldwood, Dwight. 2004. Non-Timber Forest Products. HG/QCI Planning Forum Meeting #11. July 2004. 4 pages.