socio-economic baseline survey of the fishing communities of lake victoria,...
TRANSCRIPT

IFMP Socio-economics Series 1
SOCIO-ECONOMIC BASELINE SURVEY OF THE FISHING COMMUNITIES OF LAKE VICTORIA,
UGANDA
Konstantine Odongkara
Implementation of a Fisheries Management Plan Project
National Fisheries Resources Research Institute
Jinja, Uganda: March, 2006

Socio-economic Baseline Survey, Uganda
National Fisheries Resources Research Institute, 2006
i
Acknowledgements
The author would like to acknowledge the support provided by the Director and staff of
NAFIRRI during the implementation of the survey.
Special thanks go to the IFMP LTTAs Mr. Mark Aeron-Thomas and Dr. Fiona Nunan
and to the Socio-economic Research and Monitoring Regional Working Group
members, namely Mrs Caroline Kirema-Mukasa, Mr. Paul Onyango and Dr. Richard
Abila for contributing to the formulation of the study.
Appreciation goes to the following persons who made various contributions in data
collection, processing and report drafting, namely: Agnes Nasuuna, Michael Kaidhiwa,
Anne Nyapendi, Edward Balaba, Sarah Namukasa, John Baptist Lusala, Sylvia Ocida,
Julian Kiwuwa, James Ogwal, Christopher Wanobere, Gorretti Wageno, Abubaker
Ntambi, Rosemary Waya, Bwambale Mbilingi and Godwin Khisa.
Thanks to Steven Mukasa, Charles Mbago and Vincent Bagaga who were the drivers
during field data collection and to Salim Mukose, Steven Wesige and Abdu Sonko who
were the coxswains on the boat travels.
Special thanks go to the District and Sub-county Fisheries Officers, Assistant Fisheries
Officers and BMU Executives as well as members of the different stakeholder groups
who supported the survey by providing information.

Socio-economic Baseline Survey, Uganda
National Fisheries Resources Research Institute, 2006
ii
Acronyms
BMU Beach Management Unit
CAS Catch Assessment Survey
CBS Central Broadcasting Service
CSO Civil Society Organisation
EC European Commission
FAL Functional Adult Literacy
FMP Fisheries Management Plan
HIV Human Immune Virus
IFMP Implementation of Fisheries Management Plan
LTTA Long Term Technical Assistant
LVEMP Lake Victoria Environmental management Project
LVFO Lake Victoria Fisheries Organization
LVFRP Lake Victoria Fisheries Research Project
NAFIRRI National Fisheries Resources Research Institute
NARO National Agricultural Research Organization
NGOs Non Governmental Organizations
NP-M Nile Perch Mixed
NP-O Nile Perch Only
SPSS Statistical Package for Social Scientist
WG Working Group

Socio-economic Baseline Survey, Uganda
National Fisheries Resources Research Institute, 2006
iii
Figure 1: Sketch Map of Lake Victoria, Uganda

Socio-economic Baseline Survey, Uganda
National Fisheries Resources Research Institute, 2006
iv
EXECUTIVE SUMMARY
Purpose
1. The purpose of the Socio-economic Baseline Survey of the Fishing Communities was
to provide information on the fish landing beaches, people involved in fisheries, their
livelihood activities and facilities available to them.
Beach level data
2. Beaches on Lake Victoria could be distinguished between Nile perch, tilapia, mukene
and mixed beaches.
3. There were people employed in repairing or making fishing boats and gear at most of
beaches surveyed. There were more people making a living from processing and
trading fish at mukene beaches than at other beaches.
4. Nile perch was landed by fishers and by collector boats and mainly sold fresh to
factories at most beach types, except at mukene beaches. Smoking was the most
common method for processing Nile perch at most beaches. Salting and sun-drying
of Nile perch was practiced on limited scale at mixed beaches.
5. Tilapia was landed by fishers at most beaches but also by collector boats at a few.
Smoking was the main processing method for tilapia but the fish was also salted and
sun-dried.
6. Mukene was fished and landed within restricted beaches and mostly sun-dried before
sale. Different fish products were sold in different units, making comparison of
prices difficult.
7. Access to social facilities, namely clinics, dispensaries, hospitals, primary and
secondary schools and community halls, varied as these were located either in the
same village, at the Sub-county or elsewhere in the District.
Characteristics of stakeholders
8. Fishers on Lake Victoria came from different tribes but the majority were the
Baganda, followed by the Basoga and the Samia.
9. Most fishers were born in districts other than those where they operated.
10. Men highly dominated among boat owners, crew members and in other related
activities but only to a lesser extent among processors and traders.

Socio-economic Baseline Survey, Uganda
National Fisheries Resources Research Institute, 2006
v
11. The majority of people in the fisheries were married. However, there was a large
proportion of single men, especially among the crew members. There were also
significant proportions of separated and widowed women as well as men at the
beaches.
12. The largest proportions of fishers were of the age group of 19-29 years, followed by
30-39 years. Crew members represented the youngest group, with most of them
between the age brackets of 19-39 and some at 18 years and below.
13. Most fishers did not complete primary education and quite a few had no education
completely. Considering gender aspects, women were less educated, compared to
men.
14. Few children from the beaches went to nursery schools. Most parents had children in
primary school but only a few had them in secondary schools and tertiary
institutions.
15. Children dropped out of school continuously through the primary and secondary
education.
Housing characteristics
16. The majority of the people owned houses, most of whom owned semi-permanent
houses, followed by temporary houses and lastly permanent houses. Those who did
not own houses slept in rented houses, with friends or in the open.
Asset ownership
17. Many fishers reported owning land, which they used to construct houses and grow
food crops.
18. Very few of them owned fish ponds, which were not even put to use. None of the
fishers practiced fish farming. The low level of aquaculture was attributed to the lack
of skills, limited access to pond resources and the large capital outlays needed to start
pond fish farming.
19. Only a few of the people owned a cow. The low level of animal rearing was
attributed to the concentration on fishing and absence of grazing land.
20. Bicycles were the main means of transport owned by many people, particularly boat
owners and traders.
21. Generally, fishers did not own vehicles because of the poor access roads and poverty.

Socio-economic Baseline Survey, Uganda
National Fisheries Resources Research Institute, 2006
vi
22. Fishers saved only small proportions of their daily earnings. For those who did, they
did not save their earnings in secure and profitable ways. Very few had bank
accounts, which they maintained outside the districts.
Livelihood, health and consumption status
23. Many of the people relied on incomes from boats and gears throughout the year.
Fish trading and processing also contributed significantly to the livelihoods of a
number of households.
24. Net making and repair was an activity practiced by few fishers. Boat building and
repair was practiced by few stakeholders and only during a few months in the year.
Some of the people relied on incomes from trading in food commodities, which they
supplied to fishing communities.
25. The health of fishers was affected by malaria, bilharzhia, HIV/AIDS and diarrhea,
among other diseases. Most fishers used the lake as their main source of drinking
water.
26. Most of the people reported that they got enough food for their households, having
two meals a day. Tilapia was the most preferred fish as sauce in fresh form, followed
by the smoked form.
Information, communication and outreach
27. Most of the people listened to the radio for information, mainly tuning to Radio
CBS. The majority, however, did not read newspapers at all.
Fisheries management
28. Most of the beaches had resident or visiting fisheries staff. However, some fishers
reported that their beaches were never visited by the staff.
29. The most common information received from staff was on fishing gears, methods
and minimum size of fish to be harvested. The least information received was on fish
business management.
30. Majority of the people were not members of any fishermen or traders organization.
Some of the stakeholders did not understand the roles of the BMUs. Many of them
were not even members of the BMUs as reported at the time of survey.

Socio-economic Baseline Survey, Uganda
National Fisheries Resources Research Institute, 2006
vii
Expenditures of stakeholders
31. The highest expenditure priorities among the fisheries stakeholders were food,
education and health. Contrary to the general belief, the data revealed that leisure and
clothing were not considered high priorities among them.
32. Investments were also not a priority, due to insufficiency of the earnings to meet
existing needs.
Boat owners and rent-ins
33. The majority of the boat owners owned one boat each, mostly hand paddled sesse
targeting tilapia. Nets and hooks were the most commonly owned fishing gears.
34. The choice of boats and gears was based mainly on skill requirements, costs and the
risks involved with them.
Fishing crew (barias)
35. Most of the fishing crew worked on ssesse hand propelled boats targeting Nile perch
and were paid under a share system. They often change boats, in search for better
earnings, particularly during lean fishing seasons.
Fish processors and traders
36. Most processors were involved in smoking, for which they owned smoking kilns and
targeted Nile perch.
37. Most traders dealt in fresh Nile perch and tilapia, followed by smoked fish. The
quantities of fish traded varied significantly between categories of traders and
between low and high seasons.
Training received
38. Very few respondents had ever received training in relation to their business. Those
who received did so in the areas of quality control and fish processing.
Recommendations
39. In view of the importance of the socio-economic indicators for fisheries management
and development planning, it is recommended that regular monitoring surveys be
carried out bi-annually to up-date the information on them.
Socio-economic Baseline Survey, Uganda
National Fisheries Resources Research Institute, 2006
viii
Table of contents
Page
EXECUTIVE SUMMARY ii
Table of contents ix
List of Tables x
List of Charts xiii
1. OVERVIEW OF RESEARCH 1
2. BEACH LEVEL DATA 6
3. CHARACTERISTICS OF STAKEHOLDERS 23
4. HOUSING CHARACTERISTICS 32
5. ASSET OWNERSHIP 37
6. LIVELIHOOD, HEALTH AND CONSUMPTION STATUS 44
7. INFORMATION, COMMUNICATION AND OUTREACH 56
8. FISHERIES MANAGEMENT 62
9. EXPENDITURES OF STAKEHOLDERS 70
10. BOAT OWNERS AND RENT-INs 71
11. FISHING CREW (BARIAS) 80
12. FISH TRADERS AND PROCESSORS 86
13. TRAINING RECEIVED 99
14. CONCLUSIONS AND RECOMMENDATIONS 101
15. References 104
Appendix 1: List of Beaches Surveyed 105
Appendix 2: Beach Level Questionnaire 106
Appendix 3: Socio-economic Baseline Survey Questionnaire 109

Socio-economic Baseline Survey, Uganda
National Fisheries Resources Research Institute, 2006
ix
List of Tables
Page Table 2.1: Beaches surveyed, by beach type 6 Table 2.2: Beaches with people employed in repairing or making fishing boats, by beach type 6 Table 2.3: Number of people employed in repairing or making fishing boats per beach 7 Table 2.4: Beaches with people employed in repairing or making fishing gear by beach type 7 Table 2.5: Number of people employed in repairing or making fishing gear per beach 7 Table 2.6: Beaches with people employed in supplying the fishing industry in other ways 7 Table 2.7: Beaches where Nile perch is landed, collected or traded in fresh form, by beach type
8
Table 2.8: Beaches where Nile perch is processed, by beach type 8 Table 2.9: Beaches where Tilapia was landed, collected or traded in fresh form 9 Table 2.10: Beaches where Tilapia was processed 9 Table 2.11: Beaches where mukene was landed, collected and traded fresh 10 Table 2.12: Beaches where mukene was processed 10 Table 2.13: Number of people making a living by: processing and trading Nile perch 11 Table 2.14: Number of people making a living by processing and trading tilapia: 11 Table 2.15: Number of people making a living by processing and trading mukene: 11 Table 2.16: Typical, highest and lowest prices of fresh Nile perch per kg in USh 12 Table 2.17: Typical, highest and lowest prices of fresh whole Tilapia in USh 12 Table 2.18: Typical, highest and lowest prices of fresh mukene per bag in USh 12 Table 2.19: Typical, highest and lowest prices of smoked Nile perch per kg in USh 13 Table 2.20: Typical, highest and lowest prices of smoked whole Tilapia in USh 13 Table 2.21: Typical, highest and lowest prices of salted and sun dried Nile perch per kg in USh
14
Table 2.22: Typical, highest and lowest prices of sun dried whole Tilapia in USh 14 Table 2.23: Typical, highest and lowest prices of sun dried mukene per bag in USh 15 Table 2.24: Typical, highest and lowest prices of fried whole Tilapia in USh 15 Table 2.25: The largest number of boats owned by anyone at the beach 16 Table 2.26: Respondents who own boats at other beaches as well 16 Table 2.27: Functioning of the dispensary 16 Table 2.28: Location of the nearest dispensary 17 Table 2.29: Who operated the dispensary 17 Table 2.30: Whether there is a functioning clinic 17 Table 2.31: Location of the nearest clinic 18 Table 2.32: Who operated the clinic 18 Table 2.33: Functioning of the hospital 18 Table 2.34: Location of the nearest hospital 19 Table 2.35: Who operated the hospital 19 Table 2.36: Functioning of the primary school 19 Table 2.37: Location of the nearest primary school 20 Table 2.38: Who operated the primary school 20 Table 2.39: Functioning of the secondary school 20 Table 2.40: Location of the nearest secondary school 20 Table 2.41: Who operated the secondary school 21 Table 2.42: Functioning of the community hall 21 Table 2.43: Location of the nearest community hall 22 Table 2.44: Who operated the community hall 22 Table 3.1: Distribution of respondents by tribe 23 Table 3.2: Birth places by category of respondents 24

Socio-economic Baseline Survey, Uganda
National Fisheries Resources Research Institute, 2006
x
Table 3.3: Activities respondents were involved in 24 Table 3.4: Other fisheries related activities respondents were involved in 25 Table 3.5: Sex of respondents by stakeholder category 25 Table 3.6: Marital status of stakeholders 26 Table 3.7: Marital status by sex of respondent 26 Table 3.8: Distribution of age of respondents by stakeholder category 27 Table 3.9: Educational status by category of respondents 28 Table 3.10: Education level by sex of respondent 28 Table 3.11: Sex of Heads of House Hold 29 Table 3.12: Marital status of Heads of House Hold 29 Table 3.13. Relationship of respondent to head of household 29 Table 3.14: Adult males and females belonging to the households 30 Table 3.15: Male and female children belonging to the households 30 Table 3.16: No. of children in the household still in education and those who have left 31 Table 4.1: Number of houses owned by respondents 33 Table 4.2: Respondent’s houses located in the village 33 Table 4.3: Respondent’s houses located in the Sub-county 34 Table 4.4: Respondent’s houses located in the district 35 Table 4.5: Respondent’s houses located in other districts 35 Table 4.6: Respondent’s houses outside the district but within the country 36 Table 5.1: Respondents who owned land 37 Table 5.2: Respondents’ ranking of the different uses of land 37 Table 5.3: Respondents reporting ownership of animals and birds 38 Table 5.4: numbers of animals and birds owned by respondents 38 Table 5.5: Bicycles, motorcycles and vehicles owned by respondents 39 Table 5.6: Number of bicycles, motorcycles and vehicles owned 39 Table 5.7: What respondents slept on at home 40 Table 5.8: Types of fuel used for cooking 40 Table 5.9: Respondents with bank accounts. 41 Table 5.10: Location of respondents’ bank accounts. 41 Table 5.11: Availability of a savings scheme 42 Table 5.12: Respondents who belonged to saving schemes 42 Table 5.13: Types of savings scheme 43 Table 5.14: Respondents not yet saving but who would use such a scheme if it were available
43
Table 6.1: Mean number of months the activity contributes to household income in a year 44 Table 6.2: Respondents’ ranking of the different livelihood alternatives 46 Table 6.3: Number of persons in the household who suffered infection in the last year 47 Table 6.4: The main source of drinking water for use at home 48 Table 6.5: Respondents who had a latrine at the house where they stay 48 Table 6.6: Where respondents who had no latrines went 48 Table 6.7: How often the respondents and their households got enough food to eat 49 Table 6.8: The usual number of meals eaten in respondents’ households in a day 49 Table 6.9: The main sauces in the households 51 Table 6.10: The second sauces in the households 51 Table 6.11: Fish species eaten most often 52 Table 6.12: Fish species the respondents liked best 52 Table 6.13: Why the fish was liked best 53 Table 6.14: In what state respondents most liked to eat fish 53 Table 6.15: What state of fish respondents ate most 54 Table 6.16: The best reason why respondents liked fish in this state 54

Socio-economic Baseline Survey, Uganda
National Fisheries Resources Research Institute, 2006
xi
Table 6.17: Number of days respondents usually ate fish in a week 55 Table 7.1: What time of day they usually listened to the radio 57 Table 7.2: Which radio stations they liked listening to most 58 Table 7.3: Language most used on the preferred radio station 58 Table 7.4: Time preferred to receive information on fisheries on the radio 59 Table 8.1: Year when the BMU was formed 67 Table 9.1: Respondents’ ranking for the different expenditure areas 70 Table 10.1: Respondents’ ownership of boats 71 Table 10.2: Number of other boats owned by respondents 73 Table 10.3: Number of respondents owning the different types of gear 74 Table 10.4: Extent to which respondents’ choices of boats and gears were based on different considerations
75
Table 11.1: Types of boat the crew worked on 80 Table 11.2: Types of species the crew had mainly been catching 81 Table 11.3: Number of other members there were in the crew 82 Table 11.4: How the crew were paid for work on the boat 82 Table 11.5: Crew members’ share of the catch 83 Table 11.6: How often the crew got fish to eat in addition as payment 84 Table 11.7: Number of other boats crew worked on 84 Table 11.8: Number of beaches crew had worked on in the last year 84 Table 11.9: How frequently crew had problems with getting work compared to previous years
85
Table 12.1: Fish species respondents processed most 86 Table 12.2: The fish product forms respondents processed mostly 87 Table 12.3: Processing assets owned 87 Table 12.4: Where respondents dried mukene. 87 Table 12.5: Where respondents stored their fish 88 Table 12.6: No. of kgs of Nile perch respondents sold each day most of the time 88 Table 12.7: Kgs of tilapia respondents sold each day most of the time 89 Table 12.8: Number of whole tilapia respondents sold each day most of the time 89 Table 12.9: Kgs of mukene respondents sold each day most of the time 90 Table 12.10: Fish species respondents dealt in mostly 92 Table 12.11: Fish product form respondents dealt in mostly 92 Table 12.12: Who the respondents bought from 92 Table 12.13: To whom the respondents sold the fish 92 Table 12.14: Where respondents sold fish 93 Table 12.15: How far the market where respondents sold was 93 Table 12.16: Means mostly used to transport fish to market 93 Table 12.17: Selected statements and when they are true (%) 94 Table 12.18: Number of trips to market for Nile perch per week 95 Table 12.19: Quantities of Nile perch traded per trip (Kgs) 96 Table 12.20: Number of trips to market for Tilapia per week 97 Table 12.21: Quantities of tilapia traded per trip (Kgs) 97 Table 12.22: Number of trips to market for Mukene per week 98 Table 12.23: Quantities of mukene traded per trip (Kgs) 98 Table 12.24: Number of trips for other fish per week 99 Table 12.25: Quantities of other traded fish traded per trip 99 Table 13.1: The most relevant training received by respondents. 100

Socio-economic Baseline Survey, Uganda
National Fisheries Resources Research Institute, 2006
xii
List of Charts
Page Chart 3.1: Activities most important to the respondents 25 Chart 3.2: Age distribution of respondents 27 Chart 4.1: Respondents owning the different types of houses 32 Chart 6.1: Respondents’ main staple food in their households 50 Chart 6.2: Respondents’ second staple food in their households 50 Chart 7.1: Respondents who owned a radio 56 Chart 7.2: Frequency of listening to the radio 57 Chart 7.3: Respondents who ever heard fisheries programmes on radio 59 Chart 7.4: Respondents who owned TVs 60 Chart 7.5: Frequency of TV watching 60 Chart 7.6: Frequency of reading newspapers 61 Chart 7.7: Preferred media for fisheries information 61 Chart 8.1: Presence of a Fisheries Officer at the landing site 62 Chart 8.2: Frequency of visits by the Fisheries Officer 63 Chart 8.3: Respondents who have ever been provided with fisheries information 63 Chart 8.4: Respondents who have received information on the different areas 65 Chart 8.5: Respondents who were members of fishermen’s or traders’ organizations 66 Chart 8.6: Respondents with a BMU at their beaches 67 Chart 8.7: Respondents who were members of BMUs 68 Chart 8.8: Respondents’ attendance of BMU Assembly meeting over the last year 68 Chart 8.9: Members support to their BMUs 69 Chart 9.1: Respondents’ expenditure areas of first priority 70 Chart 10.1: Ownership of boats operated by respondents 71 Chart 10.2: Types of boats used 72 Chart 10.3: Means of boat propulsion 72 Chart 10.4: Species targeted 73 Chart 10.5: Number of respondents owning the different gears by numbers 74 Chart 10.6: Respondents who usually went fishing with their own boats 76 Chart 10.7: Respondents who used crew 76 Chart 10.8: Considerations in choice of crew 77 Chart 10.9: Respondents’ main buyers of fish 78 Chart 10.10: Beaches where respondent fished during the different months 78 Chart 10.11: Fish species targeted during the different months of the year 79 Chart 11.1: Crew who worked on boats with outboard engines 80 Chart 11.2: Number of years worked as crew member 81 Chart 11.3: Crew members’ share with and without deduction of fishing costs 83 Chart 12.1: Activities of processors/traders 86 Chart 12.2: No. of respondents using the different processing materials 91 Chart 12.3: Availability of materials to respondents for fish processing 91 Chart 12.4: Respondents’ views on the start and end of high fish trading months 94 Chart 12.5: Respondents’ views on the start and end of low fish trading months 95

Socio-economic Baseline Survey, Uganda
National Fisheries Resources Research Institute, 2006
1
1. OVERVIEW OF RESEARCH
Introduction
The Socio-economic Baseline Survey of the Fishing Communities of Lake Victoria was
one of the main studies carried out under the programme of the Socio-economic
Research and Monitoring Working Group on Lake Victoria. The programme is aimed at
monitoring changes in socio-economic conditions of communities around the lake and
how the management regime affects such conditions.
Baseline information on the socio-economic status of the primary fishery stakeholders,
namely fishers, boat owners, artisanal processors and traders, is essential for planning, for
any subsequent periodic evaluations of the changes and for impact assessments.
The collection of socio-economic baseline data is a valuable resource for all future
monitoring and ad hoc research on the Lake, providing initial estimates of important
parameters that can assist in improving sampling designs. Of particular value is a clearer
understanding of the demographic profile of households/fishers and their residency
status at landing sites and the types of fishing activities undertaken by fishers during the
year.
Background
Lake Victoria fisheries is regarded as extremely important for the riparian countries and
specifically to Uganda. It has a productive fishery with estimated annual catches of
120,000 metric tonnes, valued at US$ 300m with about US$ 100m in exports annually
from some 481 beaches on the Ugandan side of the lake, from where fishery activities
are planned and carried out. Some 24,148 fishing boats operate from these beaches,
with estimated 54,148 fishers involved as boat owners, chatterers and crew (Frame
survey 2006) while close to 1 million are involved in the tertiary and other fishery related
activities in the country.
The fisheries provide high protein food, employment, income and clean water. The lake
originally had a high fish species diversity of over 500 endemic fish species of
importance, of which now only three are of commercial significance, namely the Nile
perch, Nile tilapia and mukene. The lake is an avenue for transport, recreation, a source
of power and a moderator of regional climate.
In 2002, the European Union (EC) provided €29.9 million to support the
Implementation of the Fisheries Management Plan Project (IFMP), from April 2003 to

Socio-economic Baseline Survey, Uganda
National Fisheries Resources Research Institute, 2006
2
August 2008. The overall development objective of the project is “to contribute to the
sustainable economic growth, resource use and development in the Lake Victoria Basin”.
The project purpose is “to assist the three riparian countries constituting the LVFO to
implement fisheries management measures in line with the approved Fisheries
Management Plan (FMP) and the LVFO Strategic Vision 1999–2015”. Socio-economic
research is an important component of the management plan, contributing to the LVFO
Strategic Vision.
A review of socio-economic research conducted prior to the IFMP is provided by
“Report on the status of socio-economic research and monitoring on Lake Victoria”
(Medard, Odongkara and Abila, 2004). The document briefly reviews the research
conducted under LVEMP and LVFRP, and other project support, building on the 1998
“Technical Report on Lake Victoria Wider Socio-Economic program” (LVEMP, 1998).
Socio-economic research on Lake Victoria has, in the past, been supported by several
projects. In the last ten years, project support has principally come from the World Bank
funded Lake Victoria Environment Management Project (LVEMP, 1997-2005) and the
Lake Victoria Fisheries Research Project (LVFRP, 1997-2002), with funding from the
European Commission (EC). Odongkara (2001) provides highlights of the key socio-
economic status of the fisheries of Lake Victoria, Uganda.
Justification
While much information has already been collected around the Lake, the differences in
study designs and the issues covered, together with the variations in timing, made it
necessary to conduct a new study to provide a consistent starting point for later
evaluations. In particular, there is growing need to provide answers to some of the
principal questions frequently asked, namely what are the socio-economic characteristics
of fisheries dependent communities around the lake, the role of migration, the way
fishing fits within their broader livelihood strategies and how this differs between landing
sites of different types.
Objectives
The overall objective of the survey was to provide a deeper understanding of the broad
socio-economic characteristics and well-being of the different stakeholder groups
immediately dependent on the Lake Victoria fisheries and the facilities available to them.
This would provide a solid basis for further studies and for any interim or final
evaluations of impact.

Socio-economic Baseline Survey, Uganda
National Fisheries Resources Research Institute, 2006
3
The specific objectives were:
1. To generate beach level information that would seek to extend that already gathered
from previous and on-going studies, particularly the Fisheries Frame Survey. These
would include:
(a) Fisheries related activities
(b) Landing, collection and trading of Nile perch, tilapia and Mukene
(c) Numbers of Traders and Processors
(d) Seasonal prices of fish
(e) Boat ownership at the beaches
(f) Social facilities at the beaches
2. To provide household information on the different categories of stakeholders
dependent on the lake fisheries on the following parameters:
(a) Demographic, social and educational status
(b) Residency status
(c) Housing characteristics
(d) Assets owned (land, fishing gears etc.) and their location
(e) Fishing activities undertaken through the year
(f) Distribution of income between boat owners and crew
(g) Level of involvement in fish trading/processing
(h) Non-fishing activities
(i) Health status
(j) Well-being indicators
Study coverage and sampling
The study, which was conducted in all the three partner states simultaneously, covered a
range of beach types, defined by the species principally targeted. The beaches covered by
the survey were sub-sampled from among those already being covered by the Catch
Assessment Survey (CAS). The CAS is collecting a range of information on catches and
catch values on a quarterly basis. This would be used to estimate how the value of fish
landed at the beach varies through the year and the numbers of fishers (crew and boat
owners) who benefit from this. Connecting the two surveys together would allow
considerably value to be added to the information already being gathered under the CAS,
while freeing resources for socio-economic research of complementary issues.
Socio-economic Baseline Survey, Uganda
National Fisheries Resources Research Institute, 2006
4
Definition of beach types was based on the Frame Survey data of 2004. This gave the
principal target species for each craft. Beach types were defined by the species
principally targeted by the craft recorded there. Nile perch beaches were further divided
between those where the use of outboard engines predominated (NP-O) and those
where paddles and sails were the main form of propulsion (NP-M).
An important gap in the list of CAS in Uganda was, however, the lack of beaches where
mukene was the principal target species. To ensure that there was adequate information
on mukene fishers (boat owners and crew) and on those processing and trading in
mukene, other beaches where there were a significant number of crafts targeting mukene
were purposively selected.
At each landing site selected a detailed inventory of features and access to social facilities
was made by the Survey Team Leader, complementing the information available from
the Frame Survey. Estimates of the sizes of different stakeholder groups (apart from
crew and boat owners, on whom information was available from the Frame Survey) was
also made.
Data collection
Beach level data was collected from key informants using a formal, pre-coded beach level
questionnaire. Data on individual stakeholders was collected using a questionnaire. Two
survey teams worked simultaneously to collect the data and a total of 1,235 respondents
were covered, from 34 beaches distributed in 10 districts, namely Mayuge, Busia, Bugiri,
Jinja, Wakiso, Kalangala, Mukono, Mpigi, Rakai and Masaka. The data collection
instruments are provided in the Appendices 2 and 3. In addition, direct observations
were made at the landing sites.
Target groups
At each beach, interviews were conducted over two days with respondents from all four
stakeholder groups: boat owners, crew (barias), fish traders/processors and other. The
target sample for each group was 10, though this was not always achieved, especially at
some smaller beaches. The Team Leaders were responsible for ensuring that targets
were met and that interviews were timed to ensure coverage of different types of fishers
that might land at different times. Respondents were selected at random on arrival.

Socio-economic Baseline Survey, Uganda
National Fisheries Resources Research Institute, 2006
5
Data analysis
Data was entered into an SPSS data file. Analysis was performed using SPSS as well as
MS Excel. Data checking and analysis were carried out. Output summaries were
presented as frequencies and charts and for the numerical data, means, minimums and
maximums were computed.

Socio-economic Baseline Survey, Uganda
National Fisheries Resources Research Institute, 2006
6
2. BEACH LEVEL DATA
In broad terms, the Beach Level Survey sought to provide information that would build
upon that already gathered under the Fisheries Frame Survey. Specifically, it covered:
a) Fisheries related activities
b) Landing, collection and trading of Nile perch, Tilapia and Mukene
c) Numbers of traders and processors
d) Seasonal prices of fish
e) Boat ownership at the beaches
f) Social facilities at the beaches
Table 2.1: Beaches surveyed, by beach type
Beach Type Frequency Percent
NP-O 5 14.7%
NP-M 11 32.4%
Tilapia 10 29.4%
Mukene 3 8.8%
Mixed 5 14.7%
Total 34 100.0%
The composition of beaches was considered to be representative of the beaches in
Uganda, based on Frame Survey data.
Fisheries related activities
Repairing and making fishing boats
The results revealed that there were people employed for most of their time in repairing
or making fishing boats at 30 out of the 34 beaches surveyed (Table 2.2). Most beach
types had these people but Mukene beaches had the lowest proportion (66.7%). On
average there were 2.83 such persons per beach as given in Table 2.3. This shows that
there is demand for maintenance services and making of fishing boats at the beaches,
which is important to increase the lifetime of the boats.
Table 2.2: Beaches with people employed in repairing or making fishing boats, by beach type
Beach Type
Total Frequency
Total Percent
NP-O NP-M Tilapia Mukene Mixed
Yes 100.0% 90.9% 90.0% 66.7% 80.0% 30 88.2%
No 9.1% 10.0% 33.3% 20.0% 4 11.8%
Total 100.0% 100.0% 100.0% 100.0% 100.0% 34 100.0%
Socio-economic Baseline Survey, Uganda
National Fisheries Resources Research Institute, 2006
7
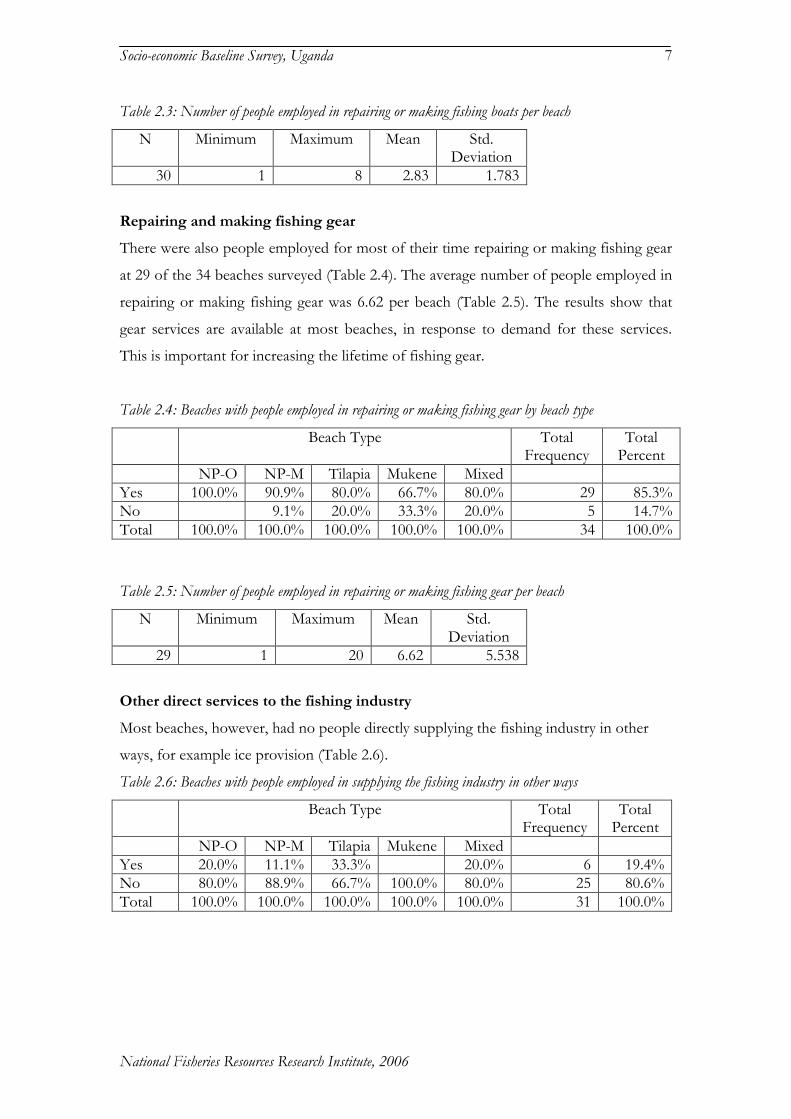
Table 2.3: Number of people employed in repairing or making fishing boats per beach
N Minimum Maximum Mean Std. Deviation
30 1 8 2.83 1.783
Repairing and making fishing gear
There were also people employed for most of their time repairing or making fishing gear
at 29 of the 34 beaches surveyed (Table 2.4). The average number of people employed in
repairing or making fishing gear was 6.62 per beach (Table 2.5). The results show that
gear services are available at most beaches, in response to demand for these services.
This is important for increasing the lifetime of fishing gear.
Table 2.4: Beaches with people employed in repairing or making fishing gear by beach type
Beach Type
Total Frequency
Total Percent
NP-O NP-M Tilapia Mukene Mixed
Yes 100.0% 90.9% 80.0% 66.7% 80.0% 29 85.3%
No 9.1% 20.0% 33.3% 20.0% 5 14.7%
Total 100.0% 100.0% 100.0% 100.0% 100.0% 34 100.0%
Table 2.5: Number of people employed in repairing or making fishing gear per beach
N Minimum Maximum Mean Std. Deviation
29 1 20 6.62 5.538
Other direct services to the fishing industry
Most beaches, however, had no people directly supplying the fishing industry in other
ways, for example ice provision (Table 2.6).
Table 2.6: Beaches with people employed in supplying the fishing industry in other ways
Beach Type
Total Frequency
Total Percent
NP-O NP-M Tilapia Mukene Mixed
Yes 20.0% 11.1% 33.3% 20.0% 6 19.4%
No 80.0% 88.9% 66.7% 100.0% 80.0% 25 80.6%
Total 100.0% 100.0% 100.0% 100.0% 100.0% 31 100.0%
Socio-economic Baseline Survey, Uganda
National Fisheries Resources Research Institute, 2006
8
Landing, collection and trading of Nile perch, Tilapia and Mukene
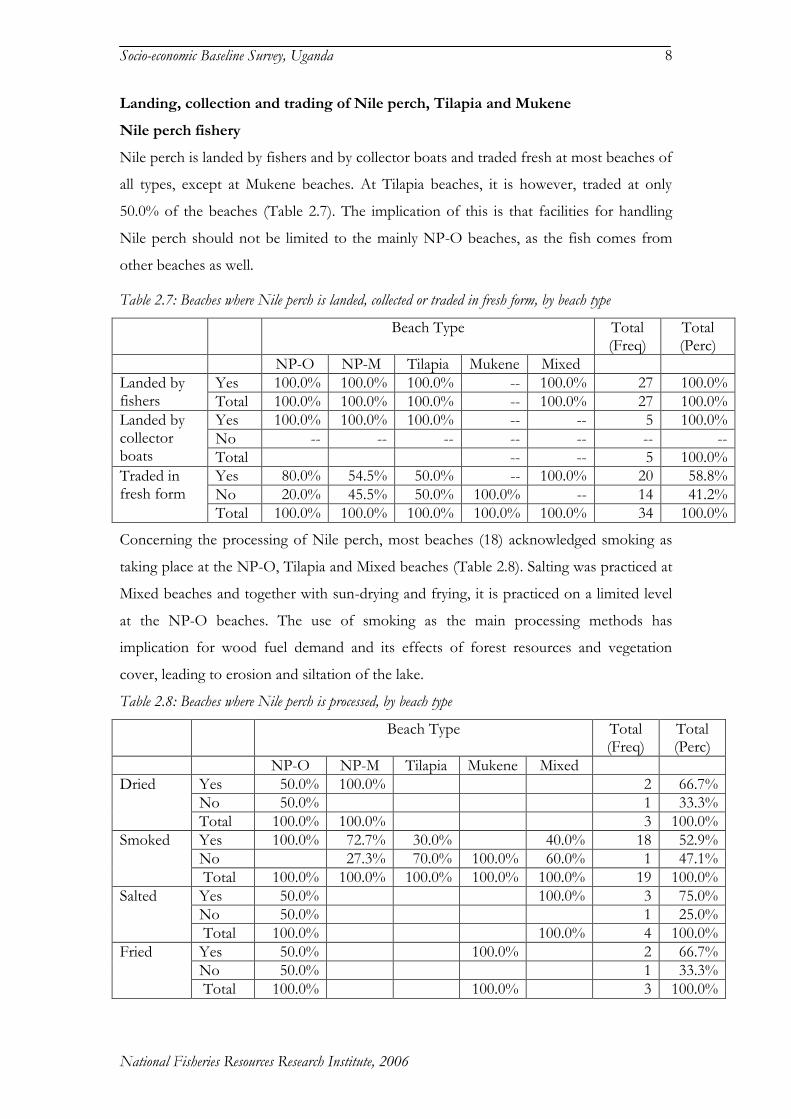
Nile perch fishery
Nile perch is landed by fishers and by collector boats and traded fresh at most beaches of
all types, except at Mukene beaches. At Tilapia beaches, it is however, traded at only
50.0% of the beaches (Table 2.7). The implication of this is that facilities for handling
Nile perch should not be limited to the mainly NP-O beaches, as the fish comes from
other beaches as well.
Table 2.7: Beaches where Nile perch is landed, collected or traded in fresh form, by beach type
Beach Type Total (Freq)
Total (Perc)
NP-O NP-M Tilapia Mukene Mixed
Landed by fishers
Yes 100.0% 100.0% 100.0% -- 100.0% 27 100.0%
Total 100.0% 100.0% 100.0% -- 100.0% 27 100.0%
Landed by collector boats
Yes 100.0% 100.0% 100.0% -- -- 5 100.0%
No -- -- -- -- -- -- --
Total -- -- 5 100.0%
Traded in fresh form
Yes 80.0% 54.5% 50.0% -- 100.0% 20 58.8%
No 20.0% 45.5% 50.0% 100.0% -- 14 41.2%
Total 100.0% 100.0% 100.0% 100.0% 100.0% 34 100.0%
Concerning the processing of Nile perch, most beaches (18) acknowledged smoking as
taking place at the NP-O, Tilapia and Mixed beaches (Table 2.8). Salting was practiced at
Mixed beaches and together with sun-drying and frying, it is practiced on a limited level
at the NP-O beaches. The use of smoking as the main processing methods has
implication for wood fuel demand and its effects of forest resources and vegetation
cover, leading to erosion and siltation of the lake.
Table 2.8: Beaches where Nile perch is processed, by beach type
Beach Type Total (Freq)
Total (Perc)
NP-O NP-M Tilapia Mukene Mixed
Dried
Yes 50.0% 100.0% 2 66.7%
No 50.0% 1 33.3%
Total 100.0% 100.0% 3 100.0%
Smoked Yes 100.0% 72.7% 30.0% 40.0% 18 52.9%
No 27.3% 70.0% 100.0% 60.0% 1 47.1%
Total 100.0% 100.0% 100.0% 100.0% 100.0% 19 100.0%
Salted Yes 50.0% 100.0% 3 75.0%
No 50.0% 1 25.0%
Total 100.0% 100.0% 4 100.0%
Fried Yes 50.0% 100.0% 2 66.7%
No 50.0% 1 33.3%
Total 100.0% 100.0% 3 100.0%

Socio-economic Baseline Survey, Uganda
National Fisheries Resources Research Institute, 2006
9
Tilapia fishery
Landing of Tilapia by fishers was reported at 23 of the 34 beaches surveyed, while at 5
beaches it was landed by collector boats. Trading in fresh Tilapia was reported at 17
beaches (Table 2.9).
Table 2.9: Beaches where Tilapia was landed, collected or traded in fresh form
Frequency Percent
Landed by fishers
Yes 23 100.0%
No -- --
Total 23 100.0%
Landed by collector boats
Yes 5 83.3%
No 1 16.7%
Total 6 100.0%
Traded in fresh form
Yes 17 100.0%
No --
Total 17
The main method of processing Tilapia was smoking, reported at 12 of the beaches
surveyed. Limited numbers of beaches reported drying and frying of the species (Table
2.10).
Table 2.10: Beaches where Tilapia was processed
Frequency Percent
Dried Yes 1 50.0%
No 1 50.0%
Total 2 100.0%
Smoked Yes 12 100.0%
No -- --
Total 12 100.0%
Fried Yes 2 100.0%
No -- --
Total 2 100.0%
Salted
Yes 3 75.0%
No 1 25.0%
Total 4 100.0%
Mukene fishery
Mukene was reported to be landed at 8 beaches but sold fresh at only 2 of the beaches
and landed by collector boats at 1 beach (Table 2.11). This shows the restricted areas
within which mukene was fished and landed.

Socio-economic Baseline Survey, Uganda
National Fisheries Resources Research Institute, 2006
10
Table 2.11: Beaches where mukene was landed, collected and traded fresh
Frequency Percent
Landed by fishers
Yes 8 88.9%
No 1 11.1%
Total 34 100.0%
Landed by collector boats
Yes 16 50.0%
No 16 50.0%
Total 2 100.0%
Traded in fresh form
Yes 2 5.9%
No 32 94.1%
Total 34 100.0%
Only 7 of the beaches reported processing of mukene, through drying (Table 2.12).
Smoking, and frying were not reported as processing methods for mukene at any of the
beaches surveyed. However, at one beach, Buwagajjo, salting and sun-drying of mukene
was practiced and the product sold to supermarkets and urban markets. A women’s
group was responsible for this method of processing.
Table 2.12: Beaches where mukene was processed
No of Beaches
Percent of Beaches
Dried Yes 7 87.5
No 1 12.5
Total 8 100.0
Smoked Yes -- --
No 2 100.0
Total 2 100.0
Fried Yes -- --
No 2 100.0
Total 2 100.0
Salted Yes -- --
No 2 100.0
Total 2 100.0
Numbers of Traders and Processors
The survey examined the numbers of people trading and processing Nile perch at the
beaches. Results show that on average, there were more people trading and processing
Nile perch at the beach (8.58) than those engaged in trading or processing only (Table
2.13). This is a reflection of the difficulties in trading fresh Nile perch due its
perishability. Furthermore, it also shows that processing is just a stage in the trading in
fish.

Socio-economic Baseline Survey, Uganda
National Fisheries Resources Research Institute, 2006
11
Table 2.13: Number of people making a living by: processing and trading Nile perch
N Minimum Maximum Mean Std. Deviation
Trading Nile perch 21 2 20 5.81 4.490
Processing Nile perch 11 1 14 6.09 3.477
Trading and processing Nile perch
19 0 20 8.58 6.058
On average, there were 11.20 people processing Tilapia (Table 2.14), with a similar
average trading and processing the fish. There were fewer people trading Tilapia without
processing it. This again shows the importance of processing in trading fish, due to lack
of facilities for preserving the fish in the fresh form.
Table 2.14: Number of people making a living by processing and trading tilapia:
N Minimum Maximum Mean Std. Deviation
Processing Tilapia 5 2 20 11.20 7.918
Trading Tilapia 14 1 30 8.14 7.794
Trading and processing Tilapia
14 1 40 11.07 10.908
With respect to mukene, processing was the activity with the highest mean of people
involved per beach of 16.63, followed by trading and processing (Table 2.15). This is
because hardly any mukene is sold fresh and processing is a necessary stage in marketing.
Table 2.15: Number of people making a living by processing and trading mukene:
N Minimum Maximum Mean Std. Deviation
Processing mukene 8 2 40 16.63 11.673
Trading mukene 5 1 30 9.00 11.937
Trading and processing mukenea
7 2 50 13.86 17.014
Seasonal prices of fish
Seasonal variations were reported in the prices at which fresh Nile perch was traded at
the beaches, with the mean of the typical price/kg being Ush 1,454.55 (US$ 0.81), the
mean highest prices being Ush 1,900.00 (US$ 1.06 and the mean lowest Ush 1,134.85
(US$ 0.63)(Table 2.16). These variations are attributed to changes in fish catch and in
demand by the overseas buyers.

Socio-economic Baseline Survey, Uganda
National Fisheries Resources Research Institute, 2006
12
Table 2.16: Typical, highest and lowest prices of fresh Nile perch per kg in USh
N Minimum Maximum Mean Std. Deviation
Typical prices traded at the beaches
33 200 2,200 1,454.55 471.759
Highest price traded at the beaches
32 700 2,700 1,900.00 445.769
Lowest prices traded at the beaches
33 300 1,800 1,134.85 411.264
With respect to Tilapia, the mean typical price was Ush 908.70 per kg, the mean highest
price was Ush1,295.65 while the mean lowest price was Ush 728.26 (Table 2.17).
Similarly, these price variations are attributed to changes in catches and demand.
Table 2.17: Typical, highest and lowest prices of fresh whole Tilapia in USh
N Minimum Maximum Mean Std. Deviation
Typical prices traded at the beaches
23 50 2,000 908.70 396.763
Highest prices traded at the beaches
23 500 3,000 1,295.65 578.775
Lowest prices traded at this beach
23 350 1,500 728.26 271.706
Number of kgs per whole fresh tilapia traded at the beaches
18 1 3 1.19 0.572.
The mean typical price of fresh mukene was Ush 4,000 per basin (Ush 114 per kg), the
mean highest price was Ush 4,600 (Ush 131 per kg) while the mean lowest price was Ush
2,308.33 per basin (Ush 66 per kg) (Table 2.18). (Average basin was 35 kgs.)
Table 2.18: Typical, highest and lowest prices of fresh mukene per basin/open-top jerrican in USh
N Minimum Maximum Mean Std. Deviation
Typical prices traded at the beaches
6 500 10,000 4,000.00 3,563.706
Highest prices traded at the beaches
6 500 12,000 4,600.00 5,077.401
Lowest prices traded at the beaches
6 250 7,000 2,308.33 2,682.987
Number of kgs per basin of fresh mukene traded at this beach
3 3.8 30 12.70 14.9.843

Socio-economic Baseline Survey, Uganda
National Fisheries Resources Research Institute, 2006
13
The typical mean price offered for a kg of smoked Nile perch at the beaches was UShs.
2,500, while the mean highest price offered was UShs. 1,750.00, and the mean lowest
price at the beaches was UShs.1650.00. Refer to the Table 2.19 below.
Table 2.19: Typical, highest and lowest prices of smoked Nile perch per kg in USh
N Minimum Maximum Mean Std. Deviation
Typical prices traded at the beaches
7 1,000 8,000 2,500.00 2,449.490
Highest prices traded at the beaches
8 700 6,000 1,750.00 1,739.458
Lowest prices traded at the beaches
8 1,000 2,500 1,650.00 590.399
Table 2.20 below shows typical, highest and lowest prices offered at beaches for smoked
whole Tilapia in UShs. The mean typical price for a whole smoked Tilapia was UShs.
1,285.71. The mean highest and lowest prices were 1,842.86 and 1,083.33 respectively.
Table 2.20: Typical, highest and lowest prices of smoked whole Tilapia in USh
N Minimum Maximum Mean Std. Deviation
Typical prices traded at the beaches
7 700 2500 1,285.71 620.292
Highest prices traded at the beaches
7 1000 3000 1,842.86 745.782
Lowest prices traded at the beaches
6 500 2000 1,083.33 523.132
Number of kgs per whole smoked tilapia traded at this beach
6 .2 1.4 ..4 .
In Table 2.21 below, the mean typical price for salted Nile perch was UShs.700 per kg.
The mean highest and lowest prices for salted/ sun dried Nile perch at beaches were
UShs. 1,000 and 400 respectively.
No comparable data was available on smoked mukene as mukene was not processed
through smoking at the beaches surveyed.

Socio-economic Baseline Survey, Uganda
National Fisheries Resources Research Institute, 2006
14
Table 2.21: Typical, highest and lowest prices of salted and sun dried Nile perch per kg in USh
N Minimum Maximum Mean Std. Deviation
Typical price of salted Nile perch
1 700 700 700.00 .
Highest price of salted Nile perch
1 1000 1000 1000.00 .
Lowest price of salted Nile perch
1 400 400 400.00 .
Typical price of sun dried Nile perch
1 3 3 3.00 .
Highest price of sun dried Nile perch
0 -- -- --
Lowest price of sun dried Nile perch
0 -- -- --
The typical mean price of sun dried whole Tilapia was UShs 1,700 per kg. This price was
relatively the same whether during high or low seasons. This was attributed to the high
demand for salted/sundried Tilapia (Table 2.22).
Table 2.22: Typical, highest and lowest prices of sun dried whole Tilapia in USh
N Minimum Maximum Mean Std. Deviation
Typical price of sun dried whole Tilapia
12 1,700 1,700 1,700
Highest price of sun dried Tilapia in
12 1,700 1,700 1,700
Lowest price of sun dried whole Tilapia
12 1,700 1,700 1,700
Number of kgs per whole sun dried tilapia traded at this beach
12 .2 1.1 1 .707
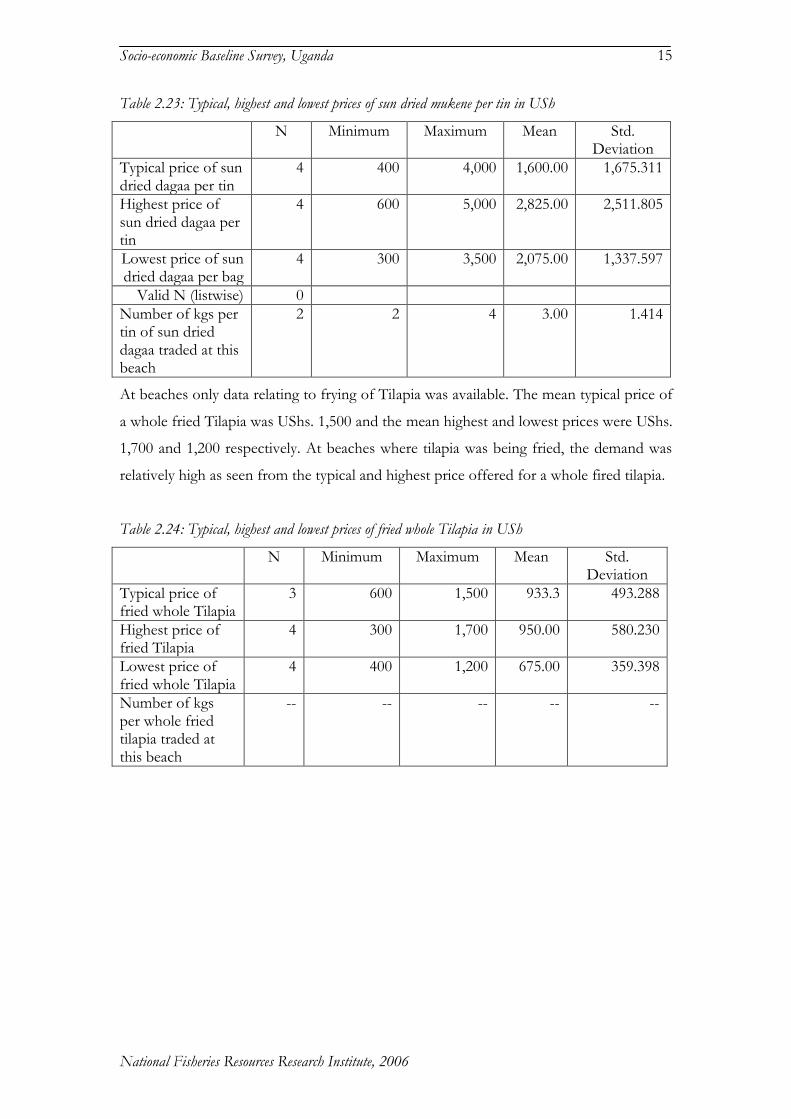
Table 2.23 below shows typical prices, highest and lowest which offered for a tin of
dried mukene at beaches. The mean typical price of a tin of mukene was UShs. 1,600.The
mean highest price was UShs. 5000 and the mean lowest price was UShs. 3,500 per tin.
Socio-economic Baseline Survey, Uganda
National Fisheries Resources Research Institute, 2006
15
Table 2.23: Typical, highest and lowest prices of sun dried mukene per tin in USh
N Minimum Maximum Mean Std. Deviation
Typical price of sun dried dagaa per tin
4 400 4,000 1,600.00 1,675.311
Highest price of sun dried dagaa per tin
4 600 5,000 2,825.00 2,511.805
Lowest price of sun dried dagaa per bag
4 300 3,500 2,075.00 1,337.597
Valid N (listwise) 0
Number of kgs per tin of sun dried dagaa traded at this beach
2 2 4 3.00 1.414
At beaches only data relating to frying of Tilapia was available. The mean typical price of
a whole fried Tilapia was UShs. 1,500 and the mean highest and lowest prices were UShs.
1,700 and 1,200 respectively. At beaches where tilapia was being fried, the demand was
relatively high as seen from the typical and highest price offered for a whole fired tilapia.
Table 2.24: Typical, highest and lowest prices of fried whole Tilapia in USh
N Minimum Maximum Mean Std. Deviation
Typical price of fried whole Tilapia
3 600 1,500 933.3 493.288
Highest price of fried Tilapia
4 300 1,700 950.00 580.230
Lowest price of fried whole Tilapia
4 400 1,200 675.00 359.398
Number of kgs per whole fried tilapia traded at this beach
-- -- -- -- --
Socio-economic Baseline Survey, Uganda
National Fisheries Resources Research Institute, 2006
16
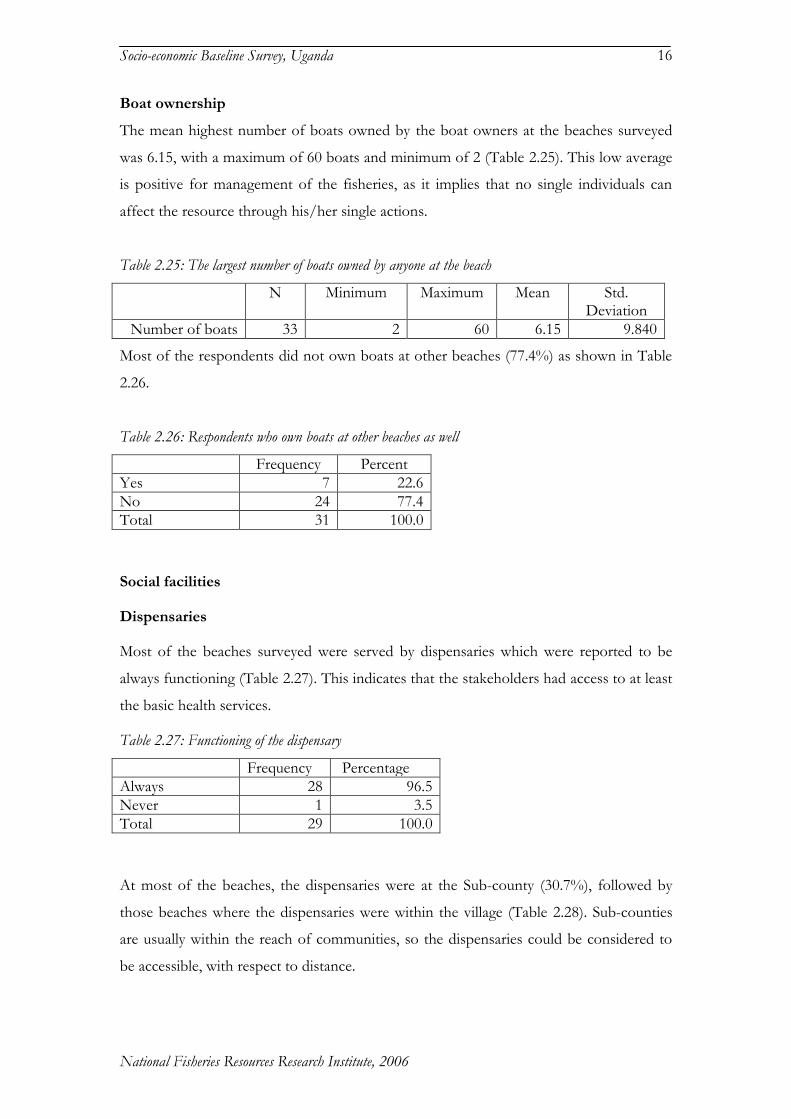
Boat ownership
The mean highest number of boats owned by the boat owners at the beaches surveyed
was 6.15, with a maximum of 60 boats and minimum of 2 (Table 2.25). This low average
is positive for management of the fisheries, as it implies that no single individuals can
affect the resource through his/her single actions.
Table 2.25: The largest number of boats owned by anyone at the beach
N Minimum Maximum Mean Std. Deviation
Number of boats 33 2 60 6.15 9.840
Most of the respondents did not own boats at other beaches (77.4%) as shown in Table
2.26.
Table 2.26: Respondents who own boats at other beaches as well
Frequency Percent
Yes 7 22.6
No 24 77.4
Total 31 100.0
Social facilities
Dispensaries
Most of the beaches surveyed were served by dispensaries which were reported to be
always functioning (Table 2.27). This indicates that the stakeholders had access to at least
the basic health services.
Table 2.27: Functioning of the dispensary
Frequency Percentage
Always 28 96.5
Never 1 3.5
Total 29 100.0
At most of the beaches, the dispensaries were at the Sub-county (30.7%), followed by
those beaches where the dispensaries were within the village (Table 2.28). Sub-counties
are usually within the reach of communities, so the dispensaries could be considered to
be accessible, with respect to distance.

Socio-economic Baseline Survey, Uganda
National Fisheries Resources Research Institute, 2006
17
Table 2.28: Location of the nearest dispensary
Frequency Percentage
Within this village 8 29.7
Another village nearby
6 22.2
This Sub-county 11 40.7
This District 2 7.4
Total 27 100.0
The dispensaries serving most of the beaches were operated by Government (85.2%)
followed by private medical establishments operated for profit (Table 2.29). Since
Government dispensaries are free, it shows that the costs of medical services to the
stakeholders were generally low. However, it is also known that the services from
Government dispensaries are not always effective, so they may not be getting the best
medical services.
Table 2.29: Who operated the dispensary
Frequency Percentage
Government 23 85.2
Voluntary agency 1 3.7
Private for profit 3 11.1
Total 27 100.0
Clinics
Like the dispensaries, the clinics serving most beaches were also always operating
(92.3%) as indicated by Table 2.30. This shows that there was opportunity for
continuous provision of services from these clinics.
Table 2.30: Whether there is a functioning clinic
Frequency Percentage
Always 24 92.3
Never 2 7.7
Total 26 100.0
At most of the beaches, the clinics were within the villages (66.7%), followed by those
where the clinics were within another village (Table 2.31). This shows that they were
within the reach of the stakeholders, with respect to distance.

Socio-economic Baseline Survey, Uganda
National Fisheries Resources Research Institute, 2006
18
Table 2.31: Location of the nearest clinic
Frequency Percentage
Within this village 16 66.7
Another village nearby
5 20.8
This loc/ward/SC 2 8.3
This District 1 4.2
Total 24 100.0
Concerning who the operators of the clinics were, at most beaches they were operated by
private operators for profit (95.8%) (Table 2.32). The implication of this is that the users
would have to meet the full cost of the services provided by the clinics, which may not
always be cheap and thus not affordable by some sections of the communities.
Table 2.32: Who operated the clinic
Frequency Percentage
Voluntary agency 1 4.2
Private for profit 23 95.8
Total 24 100.0
Hospitals
It was reported that the hospitals to which the beaches were linked were always working
(Table 2.33). This indicates the stability with which the stakeholders could get health
services at the hospital level.
Table 2.33: Functioning of the hospital
Frequency Percentage
Always 21 100.0
Never -- --
Total 21 100.0
However, the hospitals serving most beaches were located at the district level (61.9%),
followed by beaches where they were at the same Sub-counties (Table 2.34). This implies
that there was a distance to cover in order to reach the hospitals, and given the poor
transportation systems in the rural areas, especially with respect to sick people, this could
be a constraint to accessing hospital services by the fisheries stakeholders.

Socio-economic Baseline Survey, Uganda
National Fisheries Resources Research Institute, 2006
19
Table 2.34: Location of the nearest hospital
Frequency Percentage
Within this village 2 9.5
Another village nearby
1 4.8
This Sub-county 5 23.8
This District 13 61.9
Total 21 100.0
The hospitals serving most of the beaches were operated by Government (84.2%) (Table
2.35). This implies low cost of medical services. However, services at Government are
often said to be poor, so despite the low cost, the stakeholders could be obtaining only
poor quality services from their hospitals.
Table 2.35: Who operated the hospital
Frequency Percentage
Government 16 84.2
Voluntary agency 3 15.8
Total 19 100.0
Primary schools
All the beaches reported that their primary schools were always functioning (Table 2.36).
That was because of the Government initiative to provide free education under the
Universal Primary Education programme. It means that children of the stakeholders
always had opportunity to attend school.
Table 2.36: Functioning of the primary school
Frequency Percentage
Always 29 100.00
Never -- --
Total 29 100.00
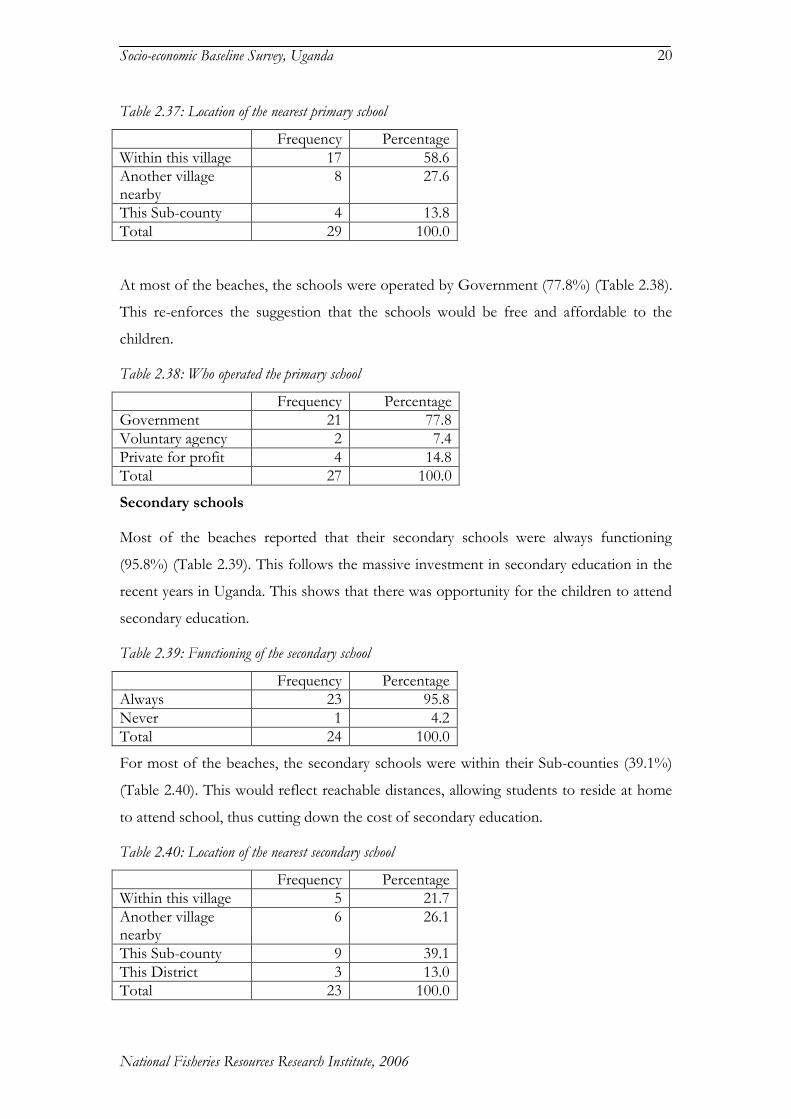
Most of the beaches reported that the schools were within the village (58.6%), while at
other beaches they were in another village (Table 2.37). This shows that for most beaches
the schools were reasonably close for the children to attend.
Socio-economic Baseline Survey, Uganda
National Fisheries Resources Research Institute, 2006
20
Table 2.37: Location of the nearest primary school
Frequency Percentage
Within this village 17 58.6
Another village nearby
8 27.6
This Sub-county 4 13.8
Total 29 100.0
At most of the beaches, the schools were operated by Government (77.8%) (Table 2.38).
This re-enforces the suggestion that the schools would be free and affordable to the
children.
Table 2.38: Who operated the primary school
Frequency Percentage
Government 21 77.8
Voluntary agency 2 7.4
Private for profit 4 14.8
Total 27 100.0
Secondary schools
Most of the beaches reported that their secondary schools were always functioning
(95.8%) (Table 2.39). This follows the massive investment in secondary education in the
recent years in Uganda. This shows that there was opportunity for the children to attend
secondary education.
Table 2.39: Functioning of the secondary school
Frequency Percentage
Always 23 95.8
Never 1 4.2
Total 24 100.0
For most of the beaches, the secondary schools were within their Sub-counties (39.1%)
(Table 2.40). This would reflect reachable distances, allowing students to reside at home
to attend school, thus cutting down the cost of secondary education.
Table 2.40: Location of the nearest secondary school
Frequency Percentage
Within this village 5 21.7
Another village nearby
6 26.1
This Sub-county 9 39.1
This District 3 13.0
Total 23 100.0

Socio-economic Baseline Survey, Uganda
National Fisheries Resources Research Institute, 2006
21
The secondary schools serving most beaches were Government operated (52.2%),
followed closely by those operated by private owners for profit (Table 2.41). This was
because Government secondary schools were neither sufficient nor provided good
quality teaching. Private owners, therefore, moved in to fill the gaps in sufficiency and
quality of education. Furthermore, unlike primary education that was free, secondary
education was paid for and the costs did not vary significantly between Government and
private schools.
Table 2.41: Who operated the secondary school
Frequency Percentage
Government 12 52.2
Voluntary agency 1 4.3
Private for profit 10 43.5
Total 23 100.0
Community halls
Most beaches reported that they had some form of a community hall (94.7%) (Table
2.42). This reflected the high demand for entertainment among the stakeholders at the
beaches. It was also possible to provide such halls because of the large numbers of
people concentrated at the beaches.
Table 2.42: Functioning of the community hall
Frequency Percentage
Always 18 94.7
Sometimes 1 5.3
Total 19 100.0
Most beaches reported that the community halls were located at the Sub-county
headquarters (42.1%) (Table 2.43). This shows that the halls were not only serving the
fisheries stakeholders but the general population of the sub-counties. Such halls were not
only used for entertainment but also training and meetings.

Socio-economic Baseline Survey, Uganda
National Fisheries Resources Research Institute, 2006
22
Table 2.43: Location of the nearest community hall
Frequency Percentage
Within this village 2 10.5
Another village nearby
4 21.1
This Sub-county 8 42.1
This District 5 26.3
Total 19 100.0
The community halls were operated mostly by Government (68.4%), followed by private
owners for profit (Table2.44). The private owners were able to invest in community halls
because they could generate returns from such activities as workshops, discos and video
shows.
Table 2.44: Who operated the community hall
Frequency Percentage
Government 13 68.4
Voluntary agency 1 5.3
Private for profit 5 26.3
Total 19 100.0

Socio-economic Baseline Survey, Uganda
National Fisheries Resources Research Institute, 2006
23
3. CHARACTERISTICS OF STAKEHOLDERS
The Survey of Stakeholders sought to provide household information on the different
categories of stakeholders dependent on the Lake Victoria fisheries, covering the
following parameters:
a) Demographic, social and educational status
b) Residency status
c) Housing characteristics
d) Assets owned and their location
e) Fishing activities undertaken through the year
f) Distribution of income between boat owners and crew
g) Level of involvement in fish trading/processing
h) Non-fishing activities
i) Health status
j) Well-being indicators
Ethnic groups among stakeholders
The ethnic groups of the stakeholders were examined. Of the 1,235 respondents
interviewed at the 34 beaches sampled, respondents of the Baganda tribe appeared most,
constituting 40.2% of the sample, followed by the Basoga and Samia. Other tribes
constituted 20.3% and included the Banyoro, Alur, Jaluo and Bakenye (Table 3.1).
Table 3.1: Distribution of respondents by tribe
Frequency Percent
Baganda 497 40.2
Basoga 187 15.1
Banyankole 45 3.6
Bakiga 4 .3
Banyarwanda 40 3.2
Samia 157 12.7
Japadhola 20 1.6
Bagisu 30 2.4
Acholi 4 .3
Others 251 20.3
Total 1235 100.0

Socio-economic Baseline Survey, Uganda
National Fisheries Resources Research Institute, 2006
24
Place of birth
Examination of the birth places showed that the majority of the stakeholders in the
sample (62.4%).were born in districts other than those where they were found operating
and only 8.6% were born within the same villages (Table 3.2).
Table 3.2: Birth places by category of respondents
Birth Place Boat owner
Crew member
Fish processor or trader
Other Total (Count)
Total (Percentage)
Other district 56.9% 64.6% 66.2% 61.7% 762 62.4%
This district 23.7% 18.3% 19.8% 15.8% 243 19.9%
Within this village
10.6% 8.4% 6.4% 9.3% 105 8.6%
Another village nearby
3.4% 2.9% 1.7% 6.0% 39 3.2%
Other Country
3.1% 2.3% 3.8% 2.7% 37 3.0%
This sub-county
2.3% 3.5% 2.0% 4.4% 35 2.9%
Total 100.0% 100.0% 100.0% 100.0% 1,221 100.0%
The activities the stakeholders were involved in were examined. The respondents were
often involved in more than one activity but the majority were involved as crew members
(33.8%) followed by boat owning or renting-in (Table 3.3).
Table 3.3: Activities respondents were involved in
Frequency Percent
Owns or rents-in a boat 381 30.9
Crew member 417 33.8
Trades or Processes Fish 357 28.9
Other fisheries related activity 180 14.6
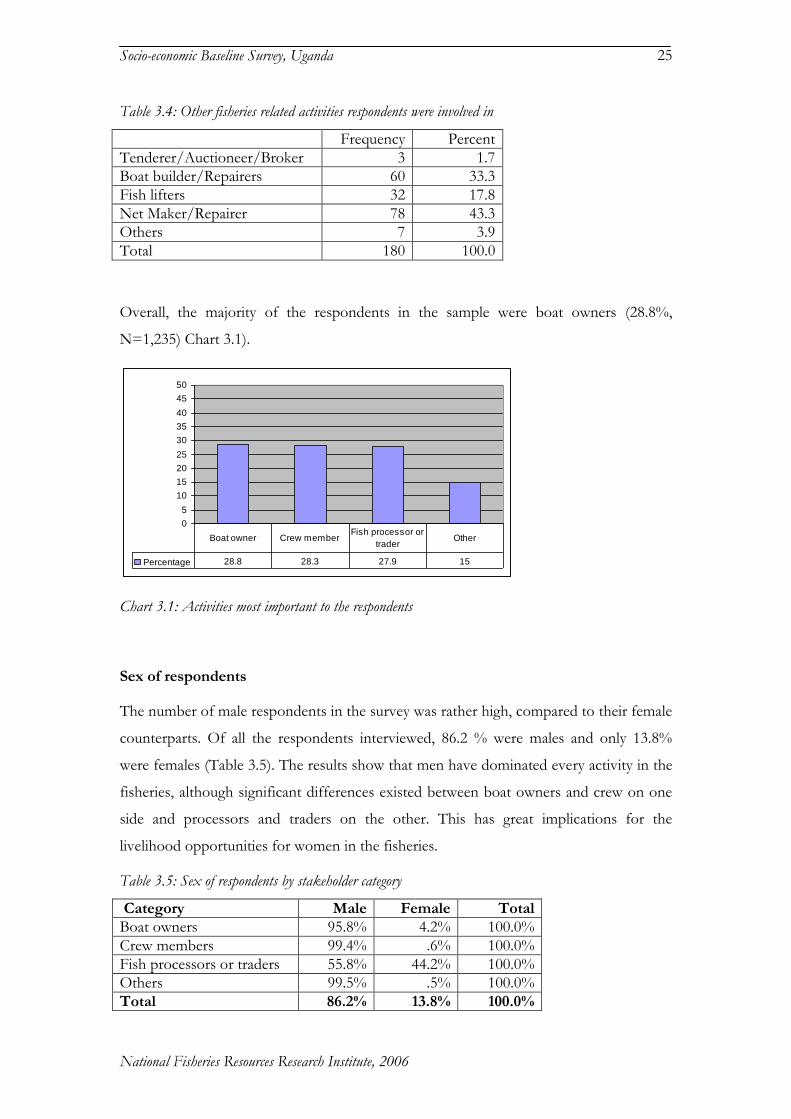
Concerning other fisheries activities they were involved in, the majority (43.3%) were
involved as net makers/repairers (Table 3.4)
Socio-economic Baseline Survey, Uganda
National Fisheries Resources Research Institute, 2006
25
Table 3.4: Other fisheries related activities respondents were involved in
Frequency Percent
Tenderer/Auctioneer/Broker 3 1.7
Boat builder/Repairers 60 33.3
Fish lifters 32 17.8
Net Maker/Repairer 78 43.3
Others 7 3.9
Total 180 100.0
Overall, the majority of the respondents in the sample were boat owners (28.8%,
N=1,235) Chart 3.1).
0
5
10
15
20
25
30
35
40
45
50
Percentage 28.8 28.3 27.9 15
Boat owner Crew memberFish processor or
traderOther
Chart 3.1: Activities most important to the respondents
Sex of respondents
The number of male respondents in the survey was rather high, compared to their female
counterparts. Of all the respondents interviewed, 86.2 % were males and only 13.8%
were females (Table 3.5). The results show that men have dominated every activity in the
fisheries, although significant differences existed between boat owners and crew on one
side and processors and traders on the other. This has great implications for the
livelihood opportunities for women in the fisheries.
Table 3.5: Sex of respondents by stakeholder category
Category Male Female Total
Boat owners 95.8% 4.2% 100.0%
Crew members 99.4% .6% 100.0%
Fish processors or traders 55.8% 44.2% 100.0%
Others 99.5% .5% 100.0%
Total 86.2% 13.8% 100.0%
Socio-economic Baseline Survey, Uganda
National Fisheries Resources Research Institute, 2006
26
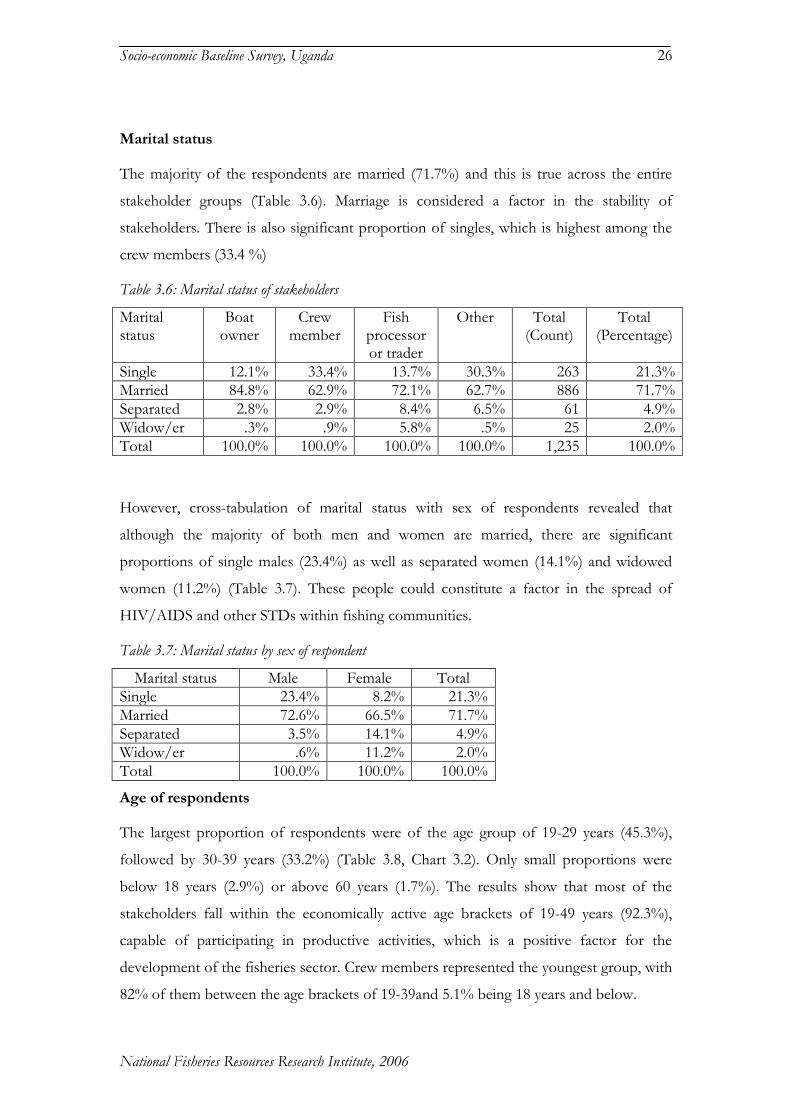
Marital status
The majority of the respondents are married (71.7%) and this is true across the entire
stakeholder groups (Table 3.6). Marriage is considered a factor in the stability of
stakeholders. There is also significant proportion of singles, which is highest among the
crew members (33.4 %)
Table 3.6: Marital status of stakeholders
Marital status
Boat owner
Crew member
Fish processor or trader
Other Total (Count)
Total (Percentage)
Single 12.1% 33.4% 13.7% 30.3% 263 21.3%
Married 84.8% 62.9% 72.1% 62.7% 886 71.7%
Separated 2.8% 2.9% 8.4% 6.5% 61 4.9%
Widow/er .3% .9% 5.8% .5% 25 2.0%
Total 100.0% 100.0% 100.0% 100.0% 1,235 100.0%
However, cross-tabulation of marital status with sex of respondents revealed that
although the majority of both men and women are married, there are significant
proportions of single males (23.4%) as well as separated women (14.1%) and widowed
women (11.2%) (Table 3.7). These people could constitute a factor in the spread of
HIV/AIDS and other STDs within fishing communities.
Table 3.7: Marital status by sex of respondent
Marital status Male Female Total
Single 23.4% 8.2% 21.3%
Married 72.6% 66.5% 71.7%
Separated 3.5% 14.1% 4.9%
Widow/er .6% 11.2% 2.0%
Total 100.0% 100.0% 100.0%
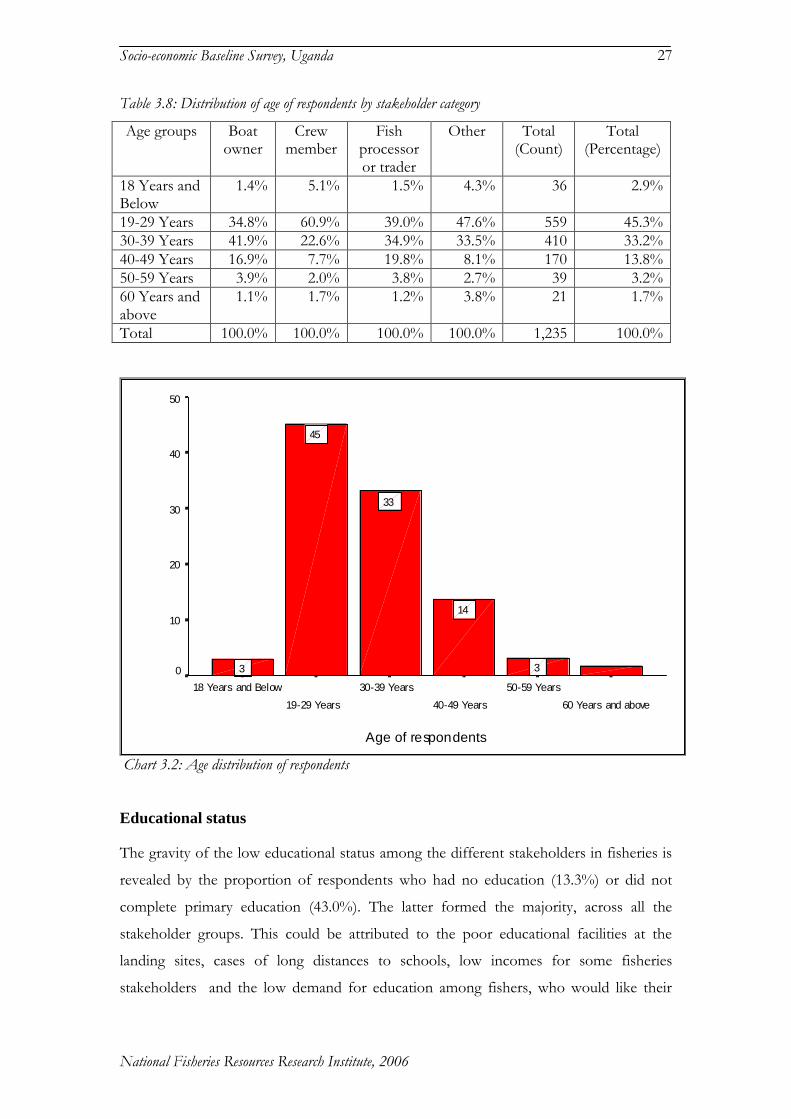
Age of respondents
The largest proportion of respondents were of the age group of 19-29 years (45.3%),
followed by 30-39 years (33.2%) (Table 3.8, Chart 3.2). Only small proportions were
below 18 years (2.9%) or above 60 years (1.7%). The results show that most of the
stakeholders fall within the economically active age brackets of 19-49 years (92.3%),
capable of participating in productive activities, which is a positive factor for the
development of the fisheries sector. Crew members represented the youngest group, with
82% of them between the age brackets of 19-39and 5.1% being 18 years and below.
Socio-economic Baseline Survey, Uganda
National Fisheries Resources Research Institute, 2006
27
Table 3.8: Distribution of age of respondents by stakeholder category
Age groups Boat owner
Crew member
Fish processor or trader
Other Total (Count)
Total (Percentage)
18 Years and Below
1.4% 5.1% 1.5% 4.3% 36 2.9%
19-29 Years 34.8% 60.9% 39.0% 47.6% 559 45.3%
30-39 Years 41.9% 22.6% 34.9% 33.5% 410 33.2%
40-49 Years 16.9% 7.7% 19.8% 8.1% 170 13.8%
50-59 Years 3.9% 2.0% 3.8% 2.7% 39 3.2%
60 Years and above
1.1% 1.7% 1.2% 3.8% 21 1.7%
Total 100.0% 100.0% 100.0% 100.0% 1,235 100.0%
Age of respondents
60 Years and above
50-59 Years
40-49 Years
30-39 Years
19-29 Years
18 Years and Below
Pe
rce
nta
ge
50
40
30
20
10
0 3
14
33
45
3
Chart 3.2: Age distribution of respondents
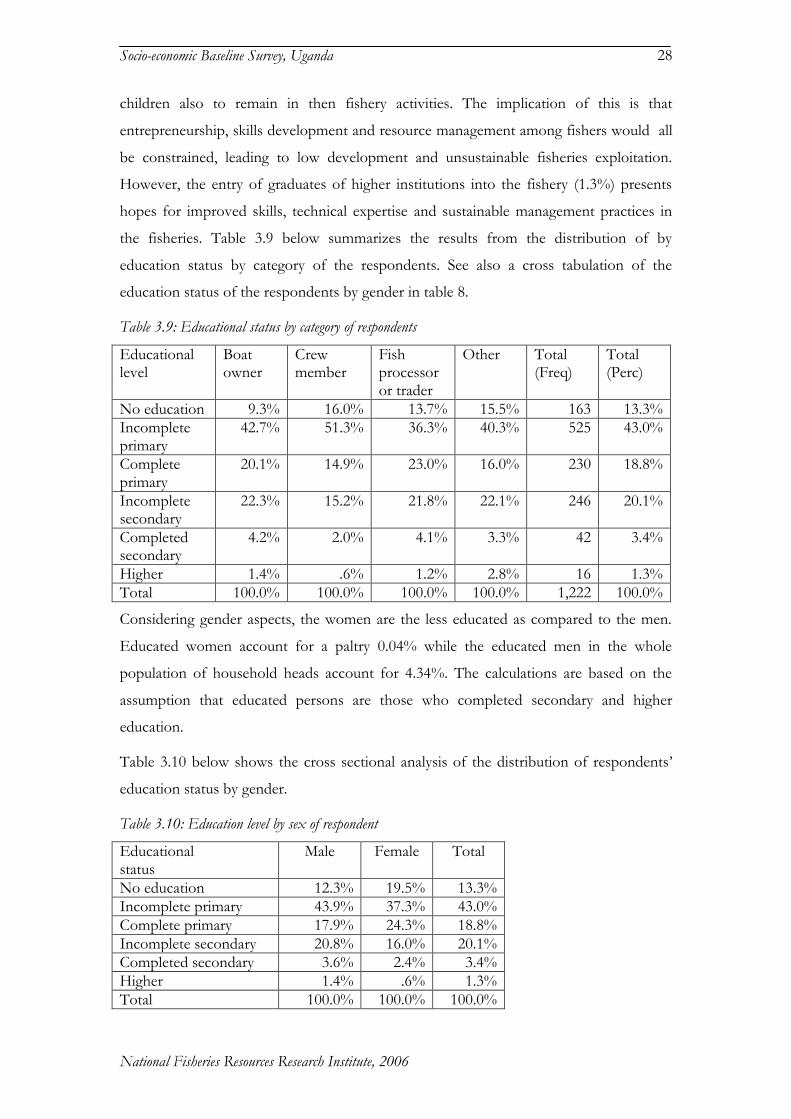
Educational status
The gravity of the low educational status among the different stakeholders in fisheries is
revealed by the proportion of respondents who had no education (13.3%) or did not
complete primary education (43.0%). The latter formed the majority, across all the
stakeholder groups. This could be attributed to the poor educational facilities at the
landing sites, cases of long distances to schools, low incomes for some fisheries
stakeholders and the low demand for education among fishers, who would like their
Socio-economic Baseline Survey, Uganda
National Fisheries Resources Research Institute, 2006
28
children also to remain in then fishery activities. The implication of this is that
entrepreneurship, skills development and resource management among fishers would all
be constrained, leading to low development and unsustainable fisheries exploitation.
However, the entry of graduates of higher institutions into the fishery (1.3%) presents
hopes for improved skills, technical expertise and sustainable management practices in
the fisheries. Table 3.9 below summarizes the results from the distribution of by
education status by category of the respondents. See also a cross tabulation of the
education status of the respondents by gender in table 8.
Table 3.9: Educational status by category of respondents
Educational level
Boat owner
Crew member
Fish processor or trader
Other Total (Freq)
Total (Perc)
No education 9.3% 16.0% 13.7% 15.5% 163 13.3%
Incomplete primary
42.7% 51.3% 36.3% 40.3% 525 43.0%
Complete primary
20.1% 14.9% 23.0% 16.0% 230 18.8%
Incomplete secondary
22.3% 15.2% 21.8% 22.1% 246 20.1%
Completed secondary
4.2% 2.0% 4.1% 3.3% 42 3.4%
Higher 1.4% .6% 1.2% 2.8% 16 1.3%
Total 100.0% 100.0% 100.0% 100.0% 1,222 100.0%
Considering gender aspects, the women are the less educated as compared to the men.
Educated women account for a paltry 0.04% while the educated men in the whole
population of household heads account for 4.34%. The calculations are based on the
assumption that educated persons are those who completed secondary and higher
education.
Table 3.10 below shows the cross sectional analysis of the distribution of respondents’
education status by gender.
Table 3.10: Education level by sex of respondent
Educational status
Male Female Total
No education 12.3% 19.5% 13.3%
Incomplete primary 43.9% 37.3% 43.0%
Complete primary 17.9% 24.3% 18.8%
Incomplete secondary 20.8% 16.0% 20.1%
Completed secondary 3.6% 2.4% 3.4%
Higher 1.4% .6% 1.3%
Total 100.0% 100.0% 100.0%

Socio-economic Baseline Survey, Uganda
National Fisheries Resources Research Institute, 2006
29
Household characteristics
The survey sought to provide information on the households of the fisheries
stakeholders. The data revealed that most of the households in the sample were male
headed (91.4%), as given in Table 3.11.
Table 3.11: Sex of Heads of House Hold
Frequency Percent
Male 128 91.4%
Female 12 8.6%
Total 140 100.0%
The data also reveals that most HHHs(91.2%) were reported to be married (Table 3.12).
However, cases of widow/er were also reported, that might be associated to HIV/AIDS
effects, especially if their spouses died of HIV/AIDS related causes.
Table 3.12: Marital status of Heads of House Hold
Frequency Percent
Married 120 81.6
Single 14 9.5
Widow/er 9 6.1
Separated 4 2.7
Total 147 100.0
Concerning the relationship to the head of their households (HHH), most of the
respondents interviewed were actually the HHHs (83.45%) (Table 3.13). The large
involvement of HHHs shows the importance of the fishery activities to the households.
This point is re-enforced by the large number of spouses involved.
Table 3.13. Relationship of respondent to head of household
Frequency Percent
Respondent is HHH 1,007 83.45
Husband/wife 116 9.65
Son 50 4.15
Daughter 1 .15
Brother 12 1.05
Sister 1 .15
Other relative 9 .75
Not related 12 1.05
Total 1,208 100.05
Dependency Status
Socio-economic Baseline Survey, Uganda
National Fisheries Resources Research Institute, 2006
30
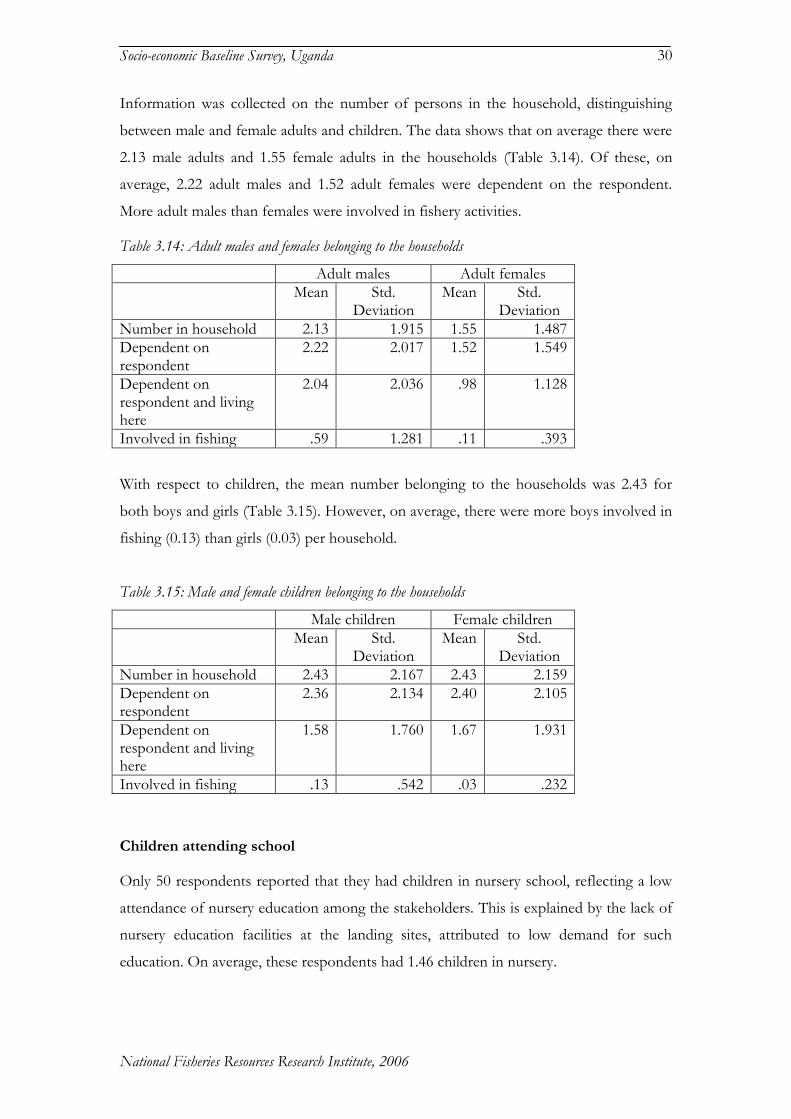
Information was collected on the number of persons in the household, distinguishing
between male and female adults and children. The data shows that on average there were
2.13 male adults and 1.55 female adults in the households (Table 3.14). Of these, on
average, 2.22 adult males and 1.52 adult females were dependent on the respondent.
More adult males than females were involved in fishery activities.
Table 3.14: Adult males and females belonging to the households
Adult males Adult females
Mean Std. Deviation
Mean Std. Deviation
Number in household 2.13 1.915 1.55 1.487
Dependent on respondent
2.22 2.017 1.52 1.549
Dependent on respondent and living here
2.04 2.036 .98 1.128
Involved in fishing .59 1.281 .11 .393
With respect to children, the mean number belonging to the households was 2.43 for
both boys and girls (Table 3.15). However, on average, there were more boys involved in
fishing (0.13) than girls (0.03) per household.
Table 3.15: Male and female children belonging to the households
Male children Female children
Mean Std. Deviation
Mean Std. Deviation
Number in household 2.43 2.167 2.43 2.159
Dependent on respondent
2.36 2.134 2.40 2.105
Dependent on respondent and living here
1.58 1.760 1.67 1.931
Involved in fishing .13 .542 .03 .232
Children attending school
Only 50 respondents reported that they had children in nursery school, reflecting a low
attendance of nursery education among the stakeholders. This is explained by the lack of
nursery education facilities at the landing sites, attributed to low demand for such
education. On average, these respondents had 1.46 children in nursery.

Socio-economic Baseline Survey, Uganda
National Fisheries Resources Research Institute, 2006
31
Most of the respondents reported having children at school, given by the high N values
(Table 3.16). However, the number of respondents declined with higher levels of
education from Primary through Secondary to University and College.
The total number of children reported to be in school was high in lower classes than in
higher classes, Colleges and University (Table 3.16). This could be attributed to the
policy of Universal Primary Education (UPE) that is being implemented by the
Government.
However, relatively fewer respondents, given by the N values, reported still having
children in secondary schools and even fewer in university, college and vocational
colleges (Table 3.16). The highest average number of children per respondent was 1.55,
found in S6, presumably due to the need to repeat S6, having failed to go to university or
college.
Few respondents provided information on their children who left school (Table 3.16).
The number of children dropping out of school was, therefore, small compared to the
number in school for all classes. However, the data revealed that children consistently
left school throughout the Primary, Secondary, College and University levels. Many
children from the fishing communities were, therefore, not completing their education.
Table 3.16: No. of children in the household still in education and those who have left
Class Children in the household still at school
Children in the household who left school
N Sum Mean N Sum Mean
Primary
P1 360 494 1.37 0 -- --
P2 352 419 1.19 10 12 1.20
P3 341 434 1.27 11 14 1.27
P4 303 356 1.17 19 22 1.16
P5 237 295 1.24 23 25 1.09
P6 195 242 1.24 24 37 1.54
P7 187 237 1.27 42 57 1.36
Secondary
S1 92 111 1.21 23 25 1.09
S2 91 118 1.30 20 23 1.15
S3 49 59 1.20 11 14 1.27
S4 64 91 1.42 21 25 1.19
S5 14 16 1.14 4 5 1.25
S6 22 34 1.55 9 9 1.00
University 9 16 1.78 3 5 1.67
College 2 2 1.00 2 3 1.50
Vocational College 5 7 1.40 3 4 1.33
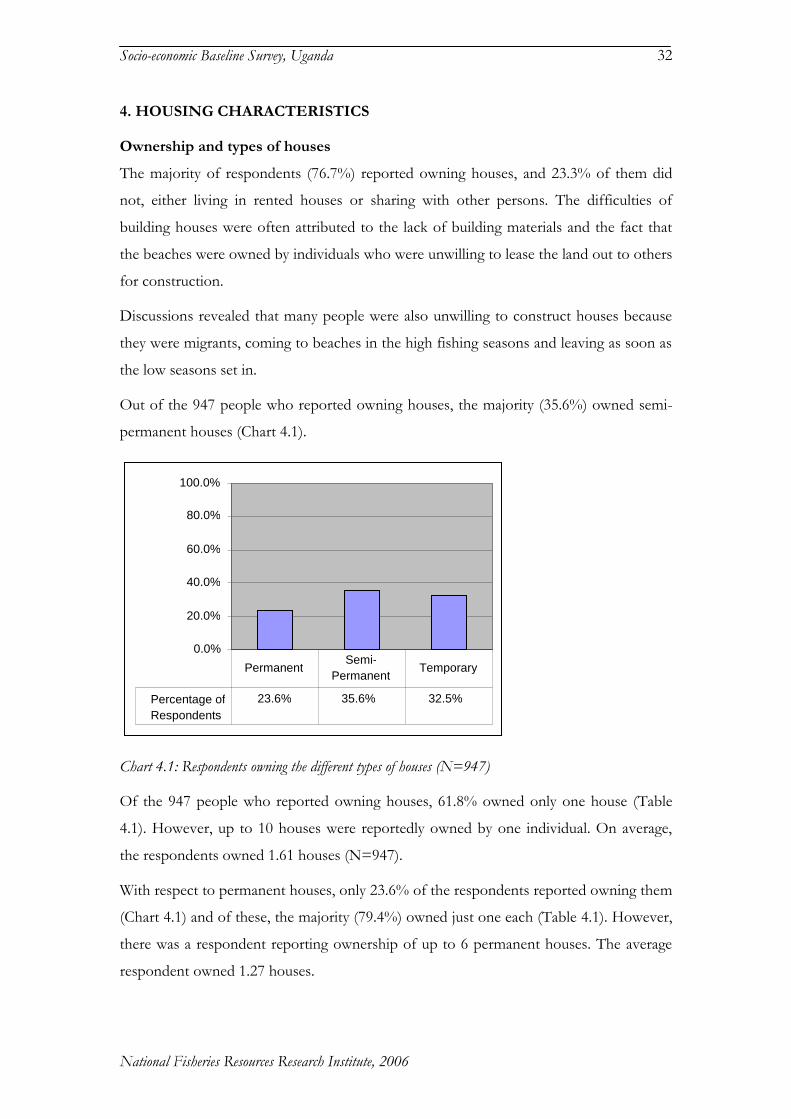
Socio-economic Baseline Survey, Uganda
National Fisheries Resources Research Institute, 2006
32
4. HOUSING CHARACTERISTICS
Ownership and types of houses
The majority of respondents (76.7%) reported owning houses, and 23.3% of them did
not, either living in rented houses or sharing with other persons. The difficulties of
building houses were often attributed to the lack of building materials and the fact that
the beaches were owned by individuals who were unwilling to lease the land out to others
for construction.
Discussions revealed that many people were also unwilling to construct houses because
they were migrants, coming to beaches in the high fishing seasons and leaving as soon as
the low seasons set in.
Out of the 947 people who reported owning houses, the majority (35.6%) owned semi-
permanent houses (Chart 4.1).
Chart 4.1: Respondents owning the different types of houses (N=947)
Of the 947 people who reported owning houses, 61.8% owned only one house (Table
4.1). However, up to 10 houses were reportedly owned by one individual. On average,
the respondents owned 1.61 houses (N=947).
With respect to permanent houses, only 23.6% of the respondents reported owning them
(Chart 4.1) and of these, the majority (79.4%) owned just one each (Table 4.1). However,
there was a respondent reporting ownership of up to 6 permanent houses. The average
respondent owned 1.27 houses.
0.0%
20.0%
40.0%
60.0%
80.0%
100.0%
Percentage of Respondents
23.6% 35.6% 32.5%
Permanent Semi-
Permanent Temporary

Socio-economic Baseline Survey, Uganda
National Fisheries Resources Research Institute, 2006
33
Semi-permanent houses were reported to be owned by only 35.6% of the respondents
(Chart 4.1). Of these the majority (26.0%) owned only one each. The average number of
semi-permanent houses owned by a respondent was 1.42.
With respect to temporary houses, only 32.5% of respondents reportedly owned these
(Table 4.1). Of these, the majority (78.6%) owned only one each. The mean number of
temporary houses owned was 1.29.
Table 4.1: Number of houses owned by respondents
No. of houses owned
Permanent Semi-permanent
Temporary Total
Freq Perc Freq Perc Freq Perc Freq Perc
1 231 79.4 321 73.0 315 78.6 585 61.8
2 47 16.2 81 18.4 64 16.0 243 25.7
3 10 3.4 26 5.9 17 4.2 68 7.2
4 2 .7 3 .7 3 .7 26 2.7
5 6 1.4 9 1.0
6 1 .3 1 .2 1 .2 10 1.1
7 1 .2 1 .2 5 .5
10 1 .2 1 .1
Total 291 100.0 440 100.0 401 100.0 947 100.0
Location of houses
Only 6.0% of respondents reported that they had permanent houses located in the
village. Of these, the majority (77.6%) owned only 1 permanent house in the village
(Table 4.2). The mean number of permanent houses owned and located in the village was
1.27.
Only 17.6% of respondents reported owning semi-permanent houses located in the
village. Of these, 77.4% owned only 1 semi-permanent house in the village. The mean
number of semi-permanent houses owned in the village was 1.38.
Only 17.7% of respondents reported that the temporary houses they owned were located
in the village. Of these, 77.5% owned only 1 temporary house in the village. On average,
the respondents owned 1.30 temporary housed located in the village.
Table 4.2: Respondent’s houses located in the village
Number of houses
Permanent Semi-Permanent Temporary
Freq Perc Freq Perc Freq Perc
1 66 77.6 168 77.4 169 77.5
2 15 17.6 31 14.3 38 17.4
3 4 4.7 14 6.5 8 3.7
4 2 .9

Socio-economic Baseline Survey, Uganda
National Fisheries Resources Research Institute, 2006
34
5 2 .9
6 1 .5
7 1 .5
10 1 .5
Total 85 100.0 217 100.0 218 100.0
Respondents’ houses located in the sub-county were examined. Only 3.0% of
respondents reported that they had permanent houses located in the sub-county where
they operated. Of these 81.1% had only 1 permanent house in the sub-county (Table
4.3). The mean number of permanent houses owned by respondents in the sub-county
was 1.22.
Only 2.7% of the respondents reported that they had semi-permanent houses in the sub-
county where they operated. Of these, the majority (78.8%) had only one semi-
permanent house in the sub-county. The mean number of semi-permanent houses
owned by respondents in the sub-county was 1.36.
Only 2.2% of the respondents reported that they had temporary houses in the sub-
county where they operated (Table xx). Of these, the majority (96.3%) had only one
temporary house in the sub-county. The mean number of temporary houses owned by
respondents in the sub-county was 1.07.
Table 4.3: Respondent’s houses located in the Sub-county
Permanent Semi-Permanent Temporary
Number of houses
Freq Perc Freq Perc Freq Perc
1 30 81.1 26 78.8 26 96.3
2 6 16.2 4 12.1
3 1 2.7 2 6.1 1 3.7
5 1 3.0
Total 37 100.0 33 100.0 27 100.0
Respondents’ houses located in the district
Some 3.6% of the respondents reported that they had permanent houses in the district
where they operated (Table 4.4). Of these, the majority (86.7%) had only one permanent
house in the district. The mean number of permanent houses owned by respondents in
the district was 1.13.

Socio-economic Baseline Survey, Uganda
National Fisheries Resources Research Institute, 2006
35
Some 5.0% of the respondents reported that they had semi-permanent houses in the
district where they operated. Of these, the majority (87.1%) had only one semi-
permanent house in the district. The mean number of semi-permanent houses owned by
respondents in the district was 1.24.
Some 2.3% of the respondents reported that they had temporary houses in the district
where they operated. Of these, the majority (92.9%) had only one temporary house in the
district. The mean number of temporary houses owned by respondents in the district was
1.07.
Table 4.4: Respondent’s houses located in the district
Permanent Semi-Permanent Temporary
Number of houses
Freq Perc Freq Perc Freq Perc
1 39 86.7 54 87.1 26 92.9
2 6 13.3 3 4.8 2 7.1
3 4 6.5
5 1 1.6
Total 45 100.0 62 100.0 28 100.0
Respondents’ houses located in other districts
The data reveals that 10.3% of the respondents had permanent houses located in other
districts. Of these the majority owned only 1 permanent house in other districts (82.7%)
(Table 4.5). The average number of permanent houses owned in other districts was 1.26.
The data also reveals that 10.4% of the respondents had semi-permanent houses located
in other districts. Of these the majority owned only 1 semi-permanent house in other
districts (84.5%). The average number of semi-permanent houses owned in other
districts was 1.25.
The data further shows that 5.7% of the respondents had temporary houses located in
other districts. Of these the majority owned only 1 temporary house in other districts
(81.7%). The average number of temporary houses owned in other districts was 1.23.
Table 4.5: Respondent’s houses located in other districts
Permanent Semi-Permanent Temporary
Number of houses
Freq Perc Freq Perc Freq Perc
1 105 82.7 109 84.5 60 84.5
2 15 11.8 13 10.1 5 7.0
3 5 3.9 3 2.3 5 7.0
4 1 .8 3 2.3 1 1.4
5 1 .8
6 1 .8
Total 127 100.0 129 100.0 71 100.0
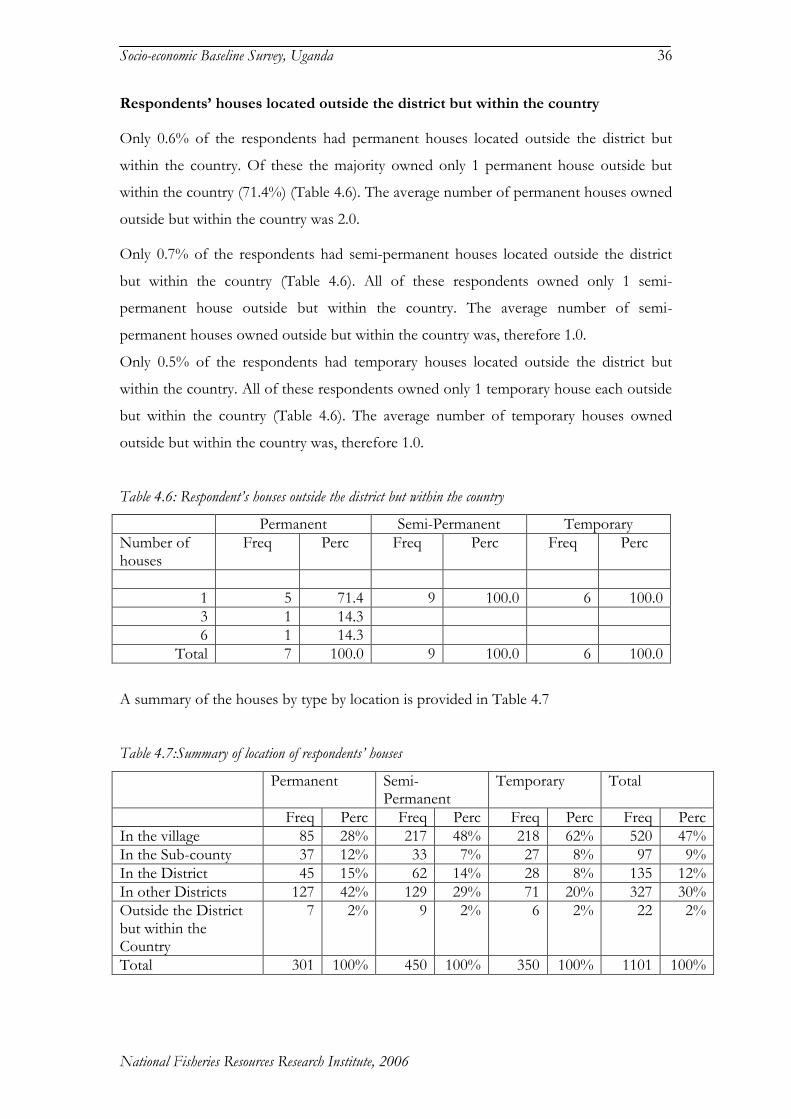
Socio-economic Baseline Survey, Uganda
National Fisheries Resources Research Institute, 2006
36
Respondents’ houses located outside the district but within the country
Only 0.6% of the respondents had permanent houses located outside the district but
within the country. Of these the majority owned only 1 permanent house outside but
within the country (71.4%) (Table 4.6). The average number of permanent houses owned
outside but within the country was 2.0.
Only 0.7% of the respondents had semi-permanent houses located outside the district
but within the country (Table 4.6). All of these respondents owned only 1 semi-
permanent house outside but within the country. The average number of semi-
permanent houses owned outside but within the country was, therefore 1.0.
Only 0.5% of the respondents had temporary houses located outside the district but
within the country. All of these respondents owned only 1 temporary house each outside
but within the country (Table 4.6). The average number of temporary houses owned
outside but within the country was, therefore 1.0.
Table 4.6: Respondent’s houses outside the district but within the country
Permanent Semi-Permanent Temporary
Number of houses
Freq Perc Freq Perc Freq Perc
1 5 71.4 9 100.0 6 100.0
3 1 14.3
6 1 14.3
Total 7 100.0 9 100.0 6 100.0
A summary of the houses by type by location is provided in Table 4.7
Table 4.7:Summary of location of respondents’ houses
Permanent Semi-Permanent
Temporary Total
Freq Perc Freq Perc Freq Perc Freq Perc
In the village 85 28% 217 48% 218 62% 520 47%
In the Sub-county 37 12% 33 7% 27 8% 97 9%
In the District 45 15% 62 14% 28 8% 135 12%
In other Districts 127 42% 129 29% 71 20% 327 30%
Outside the District but within the Country
7 2% 9 2% 6 2% 22 2%
Total 301 100% 450 100% 350 100% 1101 100%

Socio-economic Baseline Survey, Uganda
National Fisheries Resources Research Institute, 2006
37
5. ASSET OWNERSHIP
Land Ownership and Usage
Most of the respondents (60.7%) reported that they owned land (Table 5.1). The mean
size of the land owned was 4.78 acres but most respondents owned such little land that
they could only use it for construction.
Table 5.1: Respondents who owned land
Frequency Percent
Yes 750 60.7
No 485 39.3
Total 1235 100.0
The land owned by the respondents is utilized for different purpose. However, most of
them rank food production as highest in terms of usage of the land by area (39.9%),
followed by cash crops (7.2%) (Table 5.2). Priority given to livestock grazing (1.7%) and
other land uses (1.2%) was very minimal and only 6.9%.of the respondents had any of
their land unused.
Table 5.2: Respondents’ ranking of the different uses of land
Rank Cash crops Food crops Livestock grazing
Other uses Unused land
No % No % No % No % No %
1 89 7.2 493 39.9 21 1.7 15 1.2 85 6.9
2 54 4.4 81 6.6 61 4.9 17 1.4 51 4.1
3 4 .3 14 1.1 24 1.9 10 .8 17 1.4
4 2 .2 10 .8 5 .4 3 7 .6
5 -- -- 3 .2 1 .1 45 .2 2 .2
6 -- -- 1 .1 -- -- -- --
Total 149 12.1 602 48.7 112 9.1 3.6 162 13.1
Missing System
1,086 87.9 633 51.3 1,123 90.9 1,190 96.4 1,073 86.9
Total 1,235 100.0 1,235 100.0 1,235 100.0 1,235 100.0 1,235 100.0
Ownership of fishponds among the fisheries primary stakeholders was minimal (0.6%
N=1235). Furthermore, none of the respondents, including the few who owned the
ponds, reported practicing fish farming. This could be attributed to the lack of skills,
limited access to pond resources and the large capital outlays needed to start up pond
farming. It could also be an indication that fishing was still more paying than fish
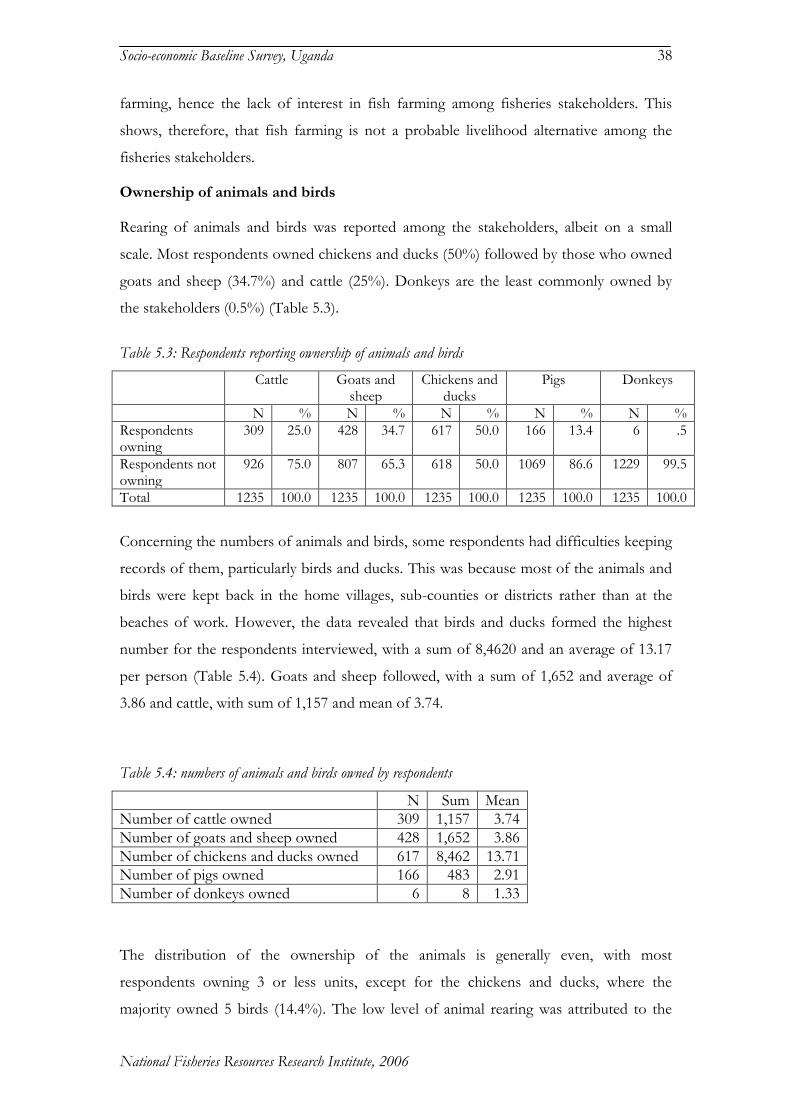
Socio-economic Baseline Survey, Uganda
National Fisheries Resources Research Institute, 2006
38
farming, hence the lack of interest in fish farming among fisheries stakeholders. This
shows, therefore, that fish farming is not a probable livelihood alternative among the
fisheries stakeholders.
Ownership of animals and birds
Rearing of animals and birds was reported among the stakeholders, albeit on a small
scale. Most respondents owned chickens and ducks (50%) followed by those who owned
goats and sheep (34.7%) and cattle (25%). Donkeys are the least commonly owned by
the stakeholders (0.5%) (Table 5.3).
Table 5.3: Respondents reporting ownership of animals and birds
Cattle Goats and sheep
Chickens and ducks
Pigs Donkeys
N % N % N % N % N %
Respondents owning
309 25.0 428 34.7 617 50.0 166 13.4 6 .5
Respondents not owning
926 75.0 807 65.3 618 50.0 1069 86.6 1229 99.5
Total 1235 100.0 1235 100.0 1235 100.0 1235 100.0 1235 100.0
Concerning the numbers of animals and birds, some respondents had difficulties keeping
records of them, particularly birds and ducks. This was because most of the animals and
birds were kept back in the home villages, sub-counties or districts rather than at the
beaches of work. However, the data revealed that birds and ducks formed the highest
number for the respondents interviewed, with a sum of 8,4620 and an average of 13.17
per person (Table 5.4). Goats and sheep followed, with a sum of 1,652 and average of
3.86 and cattle, with sum of 1,157 and mean of 3.74.
Table 5.4: numbers of animals and birds owned by respondents
N Sum Mean
Number of cattle owned 309 1,157 3.74
Number of goats and sheep owned 428 1,652 3.86
Number of chickens and ducks owned 617 8,462 13.71
Number of pigs owned 166 483 2.91
Number of donkeys owned 6 8 1.33
The distribution of the ownership of the animals is generally even, with most
respondents owning 3 or less units, except for the chickens and ducks, where the
majority owned 5 birds (14.4%). The low level of animal rearing was attributed to the

Socio-economic Baseline Survey, Uganda
National Fisheries Resources Research Institute, 2006
39
emphasis on fishery activities among the stakeholders and the lack of grazing land. Of
the total number of respondents, 13.4% owned pigs, who were mainly females with 4.0%
having a pig each and 5.1% having two pigs while the others had more than 2.
Ownership of bicycles and vehicles
Majority of the respondents owned bicycles (42%), followed by those who owned
motorcycles (3.5%) and lastly, vehicles (1.4%) (Table 5.5).
Bicycle seemed to be an important household property with 37.8% of the respondents
owning one bicycle and 3.3% owning two (Table 5.5). However bicycle ownership was
mainly among the traders and the boat owners, while very few crew members owned
them. The distribution of motorcycles was that only 3.2% of respondents owned one and
0.3% had two. These were also mainly the traders who used the motorcycles to transport
fish to the different markets.
Very few respondents owned vehicles (1.4%) with only 1.3% owning a vehicle. This was
attributed to the poor accessibility of the landing sites, poor road network and the low
income levels within and around the landing sites.
Table 5.5: Bicycles, motorcycles and vehicles owned by respondents
Bicycles Motorcycles Vehicles
Number N % N % N %
Valid 1 467 37.8 40 3.2 16 1.3
2 41 3.3 3 .2 -- --
3 8 .6 -- -- 1 .1
4 3 .2 -- -- -- --
Total 519 42.0 43 3.5 17 1.4
Missing System 716 58.0 1,192 96.5 1,218 98.6
Total 1,235 100.0 1235 100.0 1,235 100.0
The sum of bicycles reported by respondents was also highest (585) with a mean of 1.13
bicycles per respondent (Table 5.6), followed by motorcycles. Vehicles were, on the other
hand, counted at only 19, with a mean of 1.12.
Table 5.6: Number of bicycles, motorcycles and vehicles owned
N Sum Mean
Bicycles 519 585 1.13
Motorcycles 43 46 1.07
Vehicles 17 19 1.12

Socio-economic Baseline Survey, Uganda
National Fisheries Resources Research Institute, 2006
40
Bedding and cooking facilities
The survey sought to identify what the respondents slept on. Generally, majority of the
respondents had sleeping facilities. Most of the respondents were sleeping on both bed
and mattress (67.9%) (Table 5.7). However, some of the beds and mattresses were shared
betweens individuals.
A sizable number of them were, however, sleeping on papyrus mats (12.4%) and the
reasons forwarded were that most of them did not have their properties at the beaches
while others had low incomes that did not allow for such expenditures.
Table 5.7: What respondents slept on at home
Frequency Percent Valid Percent
Papyrus mat 153 12.4 12.4
Mattress alone 232 18.8 18.9
Bed plus mattress 839 67.9 68.2
Other 6 .5 .5
Total 1,230 99.6 100.0
Missing System 5 .4
Total 1,235 100.0
With respect to the fuel used for cooking, the majority of the respondents (57.7%) used
firewood as their main fuel, followed by charcoal, while just a few used paraffin, gas or
electricity (Table 5.8). The implication of this is that significant damage could be exerted
by the fisher communities on the country’s forest resources, with consequences for soil
degradation and siltation of Lake Victoria as a result of floods and erosion associated
with it.
Table 5.8: Types of fuel used for cooking
Frequency Percent Valid Percent
Firewood 712 57.7 58.4
Charcoal 416 33.7 34.1
Paraffin 12 1.0 1.0
Gas 1 .1 .1
Electricity 4 .3 .3
Other 74 6.0 6.1
Total 1,219 98.7 100.0
Missing System 16 1.3
Total 1,235 100.0
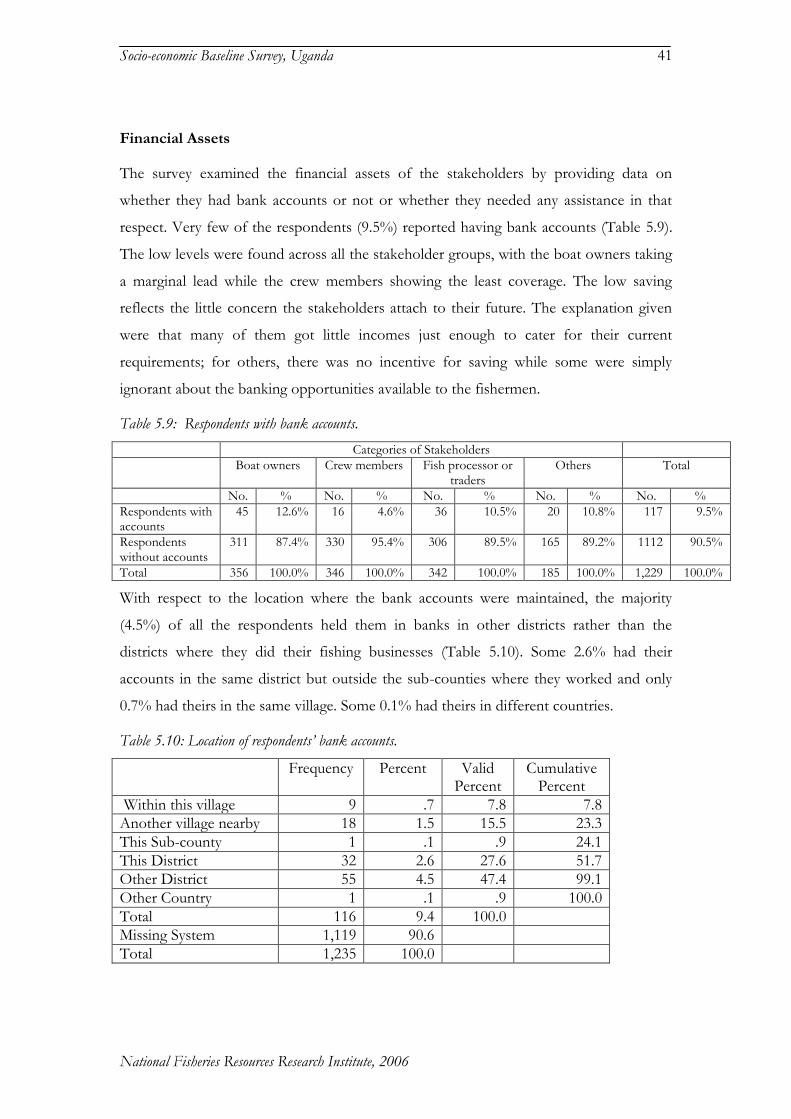
Socio-economic Baseline Survey, Uganda
National Fisheries Resources Research Institute, 2006
41
Financial Assets
The survey examined the financial assets of the stakeholders by providing data on
whether they had bank accounts or not or whether they needed any assistance in that
respect. Very few of the respondents (9.5%) reported having bank accounts (Table 5.9).
The low levels were found across all the stakeholder groups, with the boat owners taking
a marginal lead while the crew members showing the least coverage. The low saving
reflects the little concern the stakeholders attach to their future. The explanation given
were that many of them got little incomes just enough to cater for their current
requirements; for others, there was no incentive for saving while some were simply
ignorant about the banking opportunities available to the fishermen.
Table 5.9: Respondents with bank accounts.
Categories of Stakeholders
Boat owners Crew members Fish processor or traders
Others Total
No. % No. % No. % No. % No. %
Respondents with accounts
45 12.6% 16 4.6% 36 10.5% 20 10.8% 117 9.5%
Respondents without accounts
311 87.4% 330 95.4% 306 89.5% 165 89.2% 1112 90.5%
Total 356 100.0% 346 100.0% 342 100.0% 185 100.0% 1,229 100.0%
With respect to the location where the bank accounts were maintained, the majority
(4.5%) of all the respondents held them in banks in other districts rather than the
districts where they did their fishing businesses (Table 5.10). Some 2.6% had their
accounts in the same district but outside the sub-counties where they worked and only
0.7% had theirs in the same village. Some 0.1% had theirs in different countries.
Table 5.10: Location of respondents’ bank accounts.
Frequency Percent Valid Percent
Cumulative Percent
Within this village 9 .7 7.8 7.8
Another village nearby 18 1.5 15.5 23.3
This Sub-county 1 .1 .9 24.1
This District 32 2.6 27.6 51.7
Other District 55 4.5 47.4 99.1
Other Country 1 .1 .9 100.0
Total 116 9.4 100.0
Missing System 1,119 90.6
Total 1,235 100.0
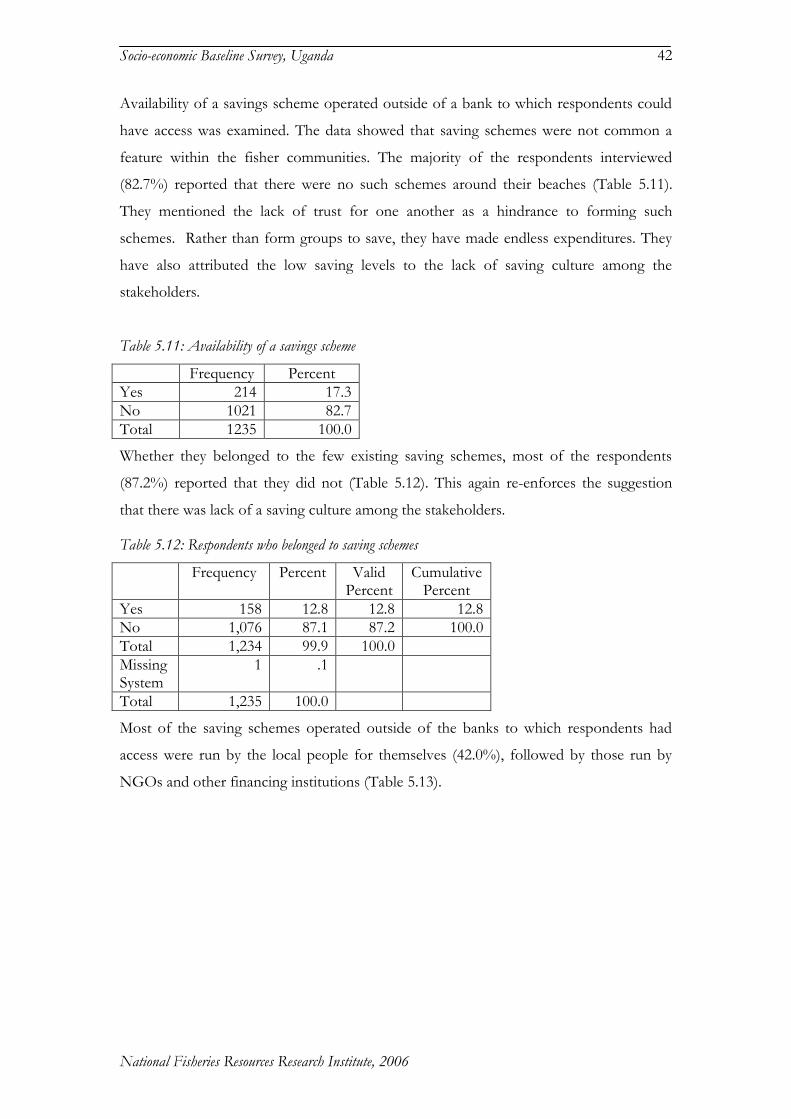
Socio-economic Baseline Survey, Uganda
National Fisheries Resources Research Institute, 2006
42
Availability of a savings scheme operated outside of a bank to which respondents could
have access was examined. The data showed that saving schemes were not common a
feature within the fisher communities. The majority of the respondents interviewed
(82.7%) reported that there were no such schemes around their beaches (Table 5.11).
They mentioned the lack of trust for one another as a hindrance to forming such
schemes. Rather than form groups to save, they have made endless expenditures. They
have also attributed the low saving levels to the lack of saving culture among the
stakeholders.
Table 5.11: Availability of a savings scheme
Frequency Percent
Yes 214 17.3
No 1021 82.7
Total 1235 100.0
Whether they belonged to the few existing saving schemes, most of the respondents
(87.2%) reported that they did not (Table 5.12). This again re-enforces the suggestion
that there was lack of a saving culture among the stakeholders.
Table 5.12: Respondents who belonged to saving schemes
Frequency Percent Valid Percent
Cumulative Percent
Yes 158 12.8 12.8 12.8
No 1,076 87.1 87.2 100.0
Total 1,234 99.9 100.0
Missing System
1 .1
Total 1,235 100.0
Most of the saving schemes operated outside of the banks to which respondents had
access were run by the local people for themselves (42.0%), followed by those run by
NGOs and other financing institutions (Table 5.13).
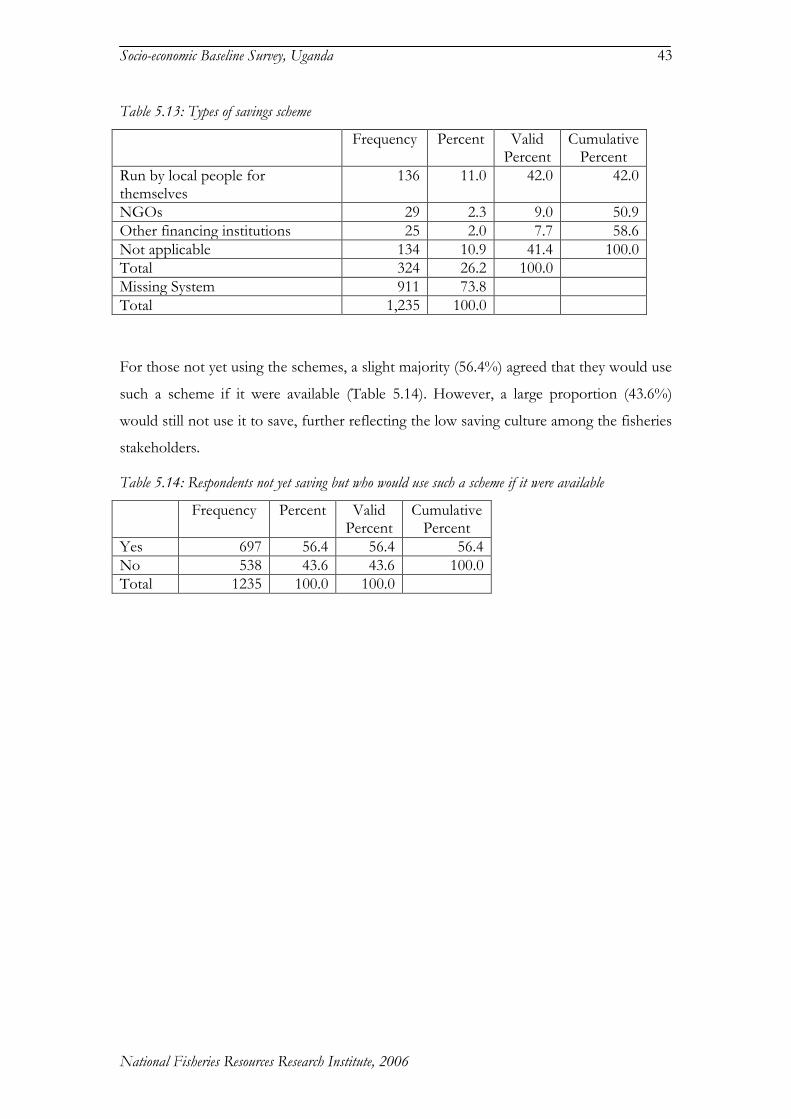
Socio-economic Baseline Survey, Uganda
National Fisheries Resources Research Institute, 2006
43
Table 5.13: Types of savings scheme
Frequency Percent Valid Percent
Cumulative Percent
Run by local people for themselves
136 11.0 42.0 42.0
NGOs 29 2.3 9.0 50.9
Other financing institutions 25 2.0 7.7 58.6
Not applicable 134 10.9 41.4 100.0
Total 324 26.2 100.0
Missing System 911 73.8
Total 1,235 100.0
For those not yet using the schemes, a slight majority (56.4%) agreed that they would use
such a scheme if it were available (Table 5.14). However, a large proportion (43.6%)
would still not use it to save, further reflecting the low saving culture among the fisheries
stakeholders.
Table 5.14: Respondents not yet saving but who would use such a scheme if it were available
Frequency Percent Valid Percent
Cumulative Percent
Yes 697 56.4 56.4 56.4
No 538 43.6 43.6 100.0
Total 1235 100.0 100.0

Socio-economic Baseline Survey, Uganda
National Fisheries Resources Research Institute, 2006
44
6. LIVELIHOOD, HEALTH AND CONSUMPTION STATUS
Overall livelihood activities
The survey examined which income-earning activities the stakeholders were involved, for
how many months in a year and a ranking of their contribution to household incomes.
This would provide an indication of the possible alternative sources of livelihood for the
fisheries stakeholders.
The data revealed that the activities where people were heavily involved, given by the N
values, were fishing employment (N=414), fishing income from boats and gear owned
(N=399), fish trading and processing (N=359) and farming of crops and horticulture
(N=239) (Table 6.11). Respondents were least involved with remittances, non-fishing
employment and rental incomes.
The average number of months an activity contributes to household income was highest
for rental income (11.31), fishing income from boats and gear (9.84), fishing employment
(9.63) and fish trading and processing (9.48). Except for rental income, therefore, the
stakeholders spent more of their time on fishery related activities rather than other
activities.
Table 6.1: Mean number of months the activity contributes to household income in a year
Activities N Mean Months
Fishing income from boats and gear owned 399 9.84
Fishing employment (wages and salaries) 414 9.63
Fish trading and processing 359 9.48
Net making and repairing 76 8.26
Boat building and repairing 58 9.40
Non-fishing employment 13 6.31
Trading in other food commodities 79 7.08
Trading in non-food items 36 7.81
Farming (crops and horticulture) 239 5.99
Livestock farming 55 7.64
Remittances or transfer payments 11 7.73
Rental income 16 11.31
Other incomes 94 9.29
The data also showed that fishing employment (33.6%) and fishing income from boats
and gear (32.1%) emerged closely as the greatest ranked contributors to household
incomes (Table 6.2). Transfer payments, non-fishing employment and rental incomes
were among the least ranked contributors to household incomes.

Socio-economic Baseline Survey, Uganda
National Fisheries Resources Research Institute, 2006
45
The implication of these results is that there is need for policy to encourage fisheries
stakeholders to participate more in activities not directly related to fishing as well as non-
fisheries livelihood activities. This would relieve the pressure on the fish stocks.
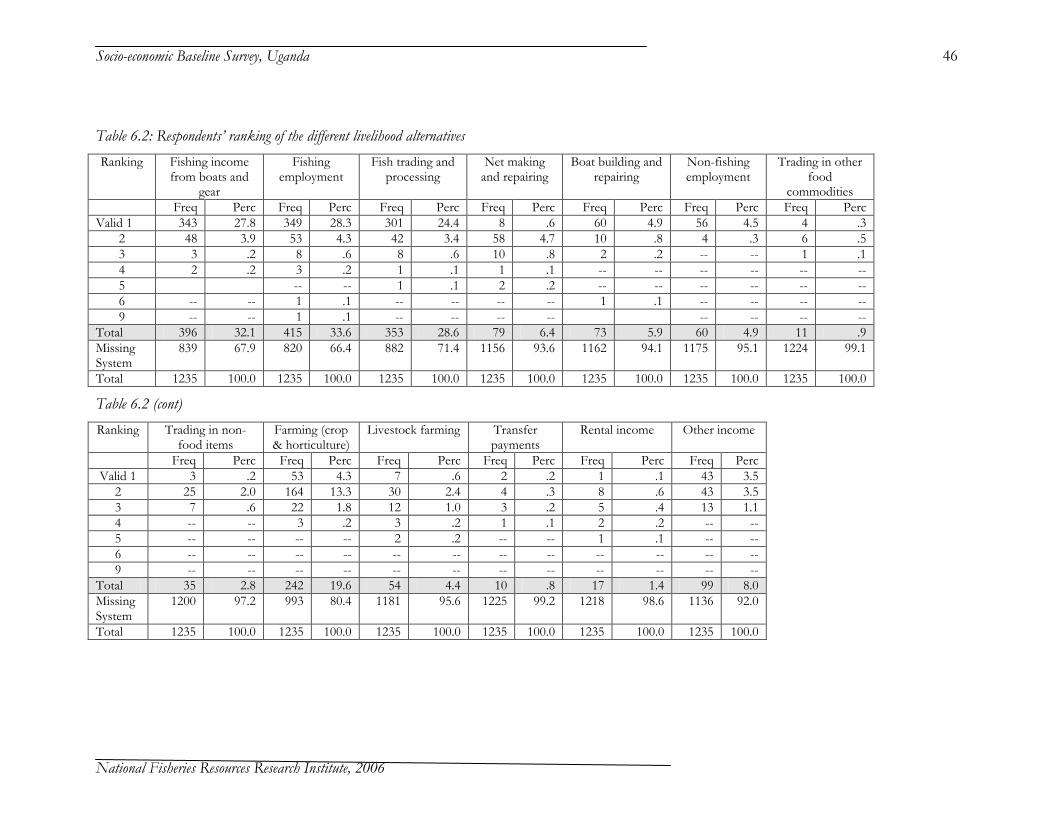
Socio-economic Baseline Survey, Uganda
National Fisheries Resources Research Institute, 2006
46
Table 6.2: Respondents’ ranking of the different livelihood alternatives
Ranking Fishing income from boats and
gear
Fishing employment
Fish trading and processing
Net making and repairing
Boat building and repairing
Non-fishing employment
Trading in other food
commodities
Freq Perc Freq Perc Freq Perc Freq Perc Freq Perc Freq Perc Freq Perc
Valid 1 343 27.8 349 28.3 301 24.4 8 .6 60 4.9 56 4.5 4 .3
2 48 3.9 53 4.3 42 3.4 58 4.7 10 .8 4 .3 6 .5
3 3 .2 8 .6 8 .6 10 .8 2 .2 -- -- 1 .1
4 2 .2 3 .2 1 .1 1 .1 -- -- -- -- -- --
5 -- -- 1 .1 2 .2 -- -- -- -- -- --
6 -- -- 1 .1 -- -- -- -- 1 .1 -- -- -- --
9 -- -- 1 .1 -- -- -- -- -- -- -- --
Total 396 32.1 415 33.6 353 28.6 79 6.4 73 5.9 60 4.9 11 .9
Missing System
839 67.9 820 66.4 882 71.4 1156 93.6 1162 94.1 1175 95.1 1224 99.1
Total 1235 100.0 1235 100.0 1235 100.0 1235 100.0 1235 100.0 1235 100.0 1235 100.0
Table 6.2 (cont)
Ranking Trading in non-food items
Farming (crop & horticulture)
Livestock farming Transfer payments
Rental income Other income
Freq Perc Freq Perc Freq Perc Freq Perc Freq Perc Freq Perc
Valid 1 3 .2 53 4.3 7 .6 2 .2 1 .1 43 3.5
2 25 2.0 164 13.3 30 2.4 4 .3 8 .6 43 3.5
3 7 .6 22 1.8 12 1.0 3 .2 5 .4 13 1.1
4 -- -- 3 .2 3 .2 1 .1 2 .2 -- --
5 -- -- -- -- 2 .2 -- -- 1 .1 -- --
6 -- -- -- -- -- -- -- -- -- -- -- --
9 -- -- -- -- -- -- -- -- -- -- -- --
Total 35 2.8 242 19.6 54 4.4 10 .8 17 1.4 99 8.0
Missing System
1200 97.2 993 80.4 1181 95.6 1225 99.2 1218 98.6 1136 92.0
Total 1235 100.0 1235 100.0 1235 100.0 1235 100.0 1235 100.0 1235 100.0

Socio-economic Baseline Survey, Uganda
National Fisheries Resources Research Institute, 2006
47
Health Status
The survey examined how many members of the households suffered from the different
diseases in the last year. The data revealed that most respondents reported that their
households suffered from malaria (N=918), followed by diarrhoea (N=467) (Table 6.3). Few
respondents reported cases of cholera during the year.
Malaria was suffered by the highest mean number of persons in the households (4.07),
followed by diarrhoea (2.53). Other diseases suffered by many persons per household were
cholera, typhoid and HIV/AIDS.
Table 6.3: Number of persons in the household who suffered infection in the last year
N Mean
Malaria 918 4.07
Bilharzias 236 1.92
Tuberculosis 130 1.81
Convulsions 260 1.83
HIV/AIDS 130 1.95
Diarrhea 467 2.53
Typhoid 213 2.00
Cholera 84 2.30
The average size of households was 6.11.
Drinking water
For most respondents, the main source of drinking water at home was the lake (49.3%) of
respondents (table xx). Piped water, shallow wells and springs or rivers were among the
sources that followed closely. There were also several unclassified sources reported, mostly
mineral water packed in plastic bags or bottles. The reason for use of packed water was that
they did not have time to boil their own drinking water, or they mainly took water while
having their meals at the restaurant which also provided drinking water as well. Others did
not trust other water sources like the piped water and the lake.
The danger of over-relying on the lake as a source of drinking water was that it exposed the
people to all the water borne diseases, as mention in Table 6.4 above.
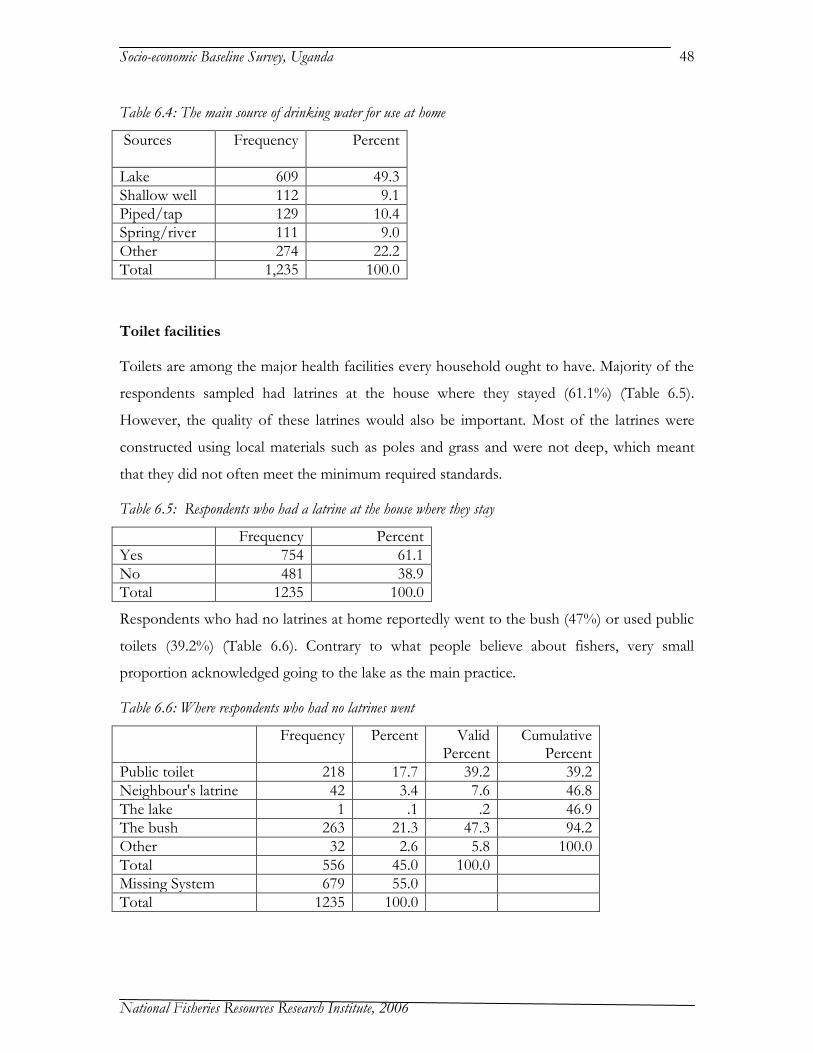
Socio-economic Baseline Survey, Uganda
National Fisheries Resources Research Institute, 2006
48
Table 6.4: The main source of drinking water for use at home
Sources
Frequency Percent
Lake 609 49.3
Shallow well 112 9.1
Piped/tap 129 10.4
Spring/river 111 9.0
Other 274 22.2
Total 1,235 100.0
Toilet facilities
Toilets are among the major health facilities every household ought to have. Majority of the
respondents sampled had latrines at the house where they stayed (61.1%) (Table 6.5).
However, the quality of these latrines would also be important. Most of the latrines were
constructed using local materials such as poles and grass and were not deep, which meant
that they did not often meet the minimum required standards.
Table 6.5: Respondents who had a latrine at the house where they stay
Frequency Percent
Yes 754 61.1
No 481 38.9
Total 1235 100.0
Respondents who had no latrines at home reportedly went to the bush (47%) or used public
toilets (39.2%) (Table 6.6). Contrary to what people believe about fishers, very small
proportion acknowledged going to the lake as the main practice.
Table 6.6: Where respondents who had no latrines went
Frequency Percent Valid Percent
Cumulative Percent
Public toilet 218 17.7 39.2 39.2
Neighbour's latrine 42 3.4 7.6 46.8
The lake 1 .1 .2 46.9
The bush 263 21.3 47.3 94.2
Other 32 2.6 5.8 100.0
Total 556 45.0 100.0
Missing System 679 55.0
Total 1235 100.0
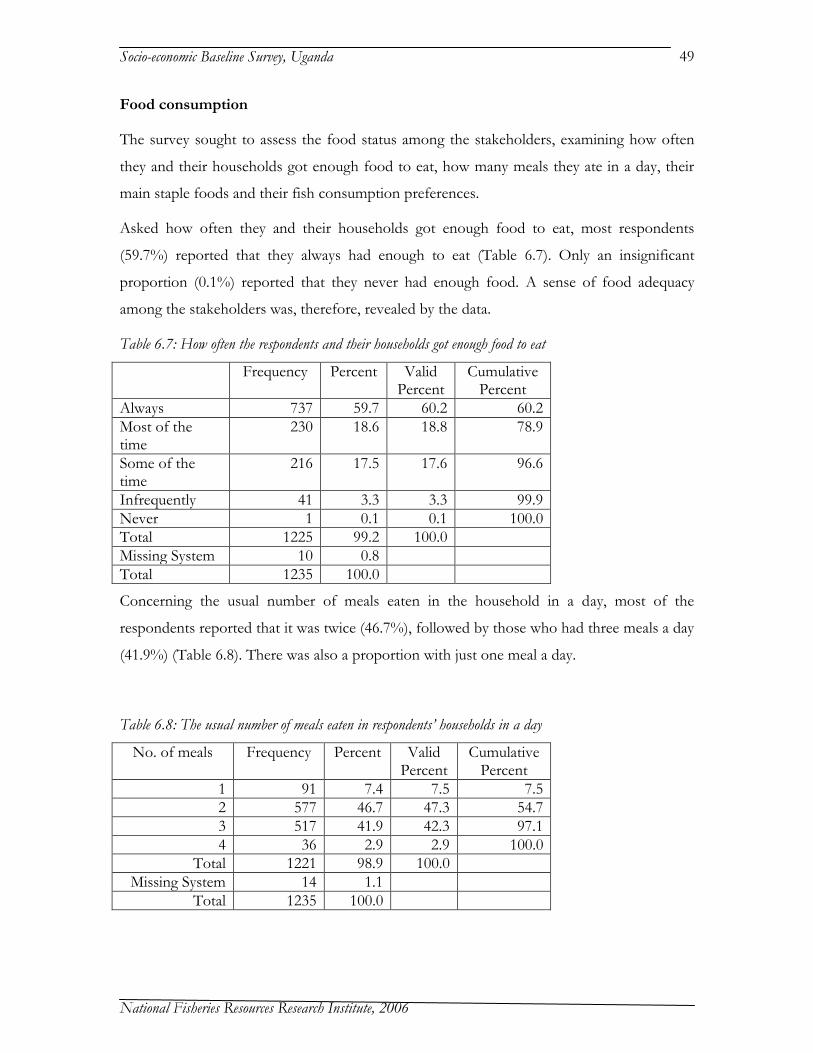
Socio-economic Baseline Survey, Uganda
National Fisheries Resources Research Institute, 2006
49
Food consumption
The survey sought to assess the food status among the stakeholders, examining how often
they and their households got enough food to eat, how many meals they ate in a day, their
main staple foods and their fish consumption preferences.
Asked how often they and their households got enough food to eat, most respondents
(59.7%) reported that they always had enough to eat (Table 6.7). Only an insignificant
proportion (0.1%) reported that they never had enough food. A sense of food adequacy
among the stakeholders was, therefore, revealed by the data.
Table 6.7: How often the respondents and their households got enough food to eat
Frequency Percent Valid Percent
Cumulative Percent
Always 737 59.7 60.2 60.2
Most of the time
230 18.6 18.8 78.9
Some of the time
216 17.5 17.6 96.6
Infrequently 41 3.3 3.3 99.9
Never 1 0.1 0.1 100.0
Total 1225 99.2 100.0
Missing System 10 0.8
Total 1235 100.0
Concerning the usual number of meals eaten in the household in a day, most of the
respondents reported that it was twice (46.7%), followed by those who had three meals a day
(41.9%) (Table 6.8). There was also a proportion with just one meal a day.
Table 6.8: The usual number of meals eaten in respondents’ households in a day
No. of meals Frequency Percent Valid Percent
Cumulative Percent
1 91 7.4 7.5 7.5
2 577 46.7 47.3 54.7
3 517 41.9 42.3 97.1
4 36 2.9 2.9 100.0
Total 1221 98.9 100.0
Missing System 14 1.1
Total 1235 100.0

Socio-economic Baseline Survey, Uganda
National Fisheries Resources Research Institute, 2006
50
The main staple foods of the respondents were also examined. The data showed that maize
was the main staple food (30.9%), followed by cassava (26.6%) and sweet potatoes (20.2%)
(Chart 6.1). Proteinous foods like millet and sorghum were the least consumed by the fishing
communities. The main staple foods consumed by majority of the respondents were,
therefore, starchy and this could explain why the fishing communities were sometimes
malnourished, because they tended to consume unbalanced foods with a lot of carbohydrate
content.
0
5
10
15
20
25
30
35
40
45
50
Pe
rce
nt
Percent 30.9 26.6 2.4 0.2 20.2 3.1 15.6
Maize Cassava Rice SorghumSweet
potatoesMillet
Bananas
/matoke
Chart 6.1: Respondents’ main staple food in their households
The second staple food mentioned was sweet potatoes (33.0%), followed by cassava (24.7%)
and maize (20.3%) (Chart 6.2).
0
5
10
15
20
25
30
35
40
45
50
Pe
rce
nt
Percent 20.3 24.7 9.1 0.5 33 1.9 8.8
Maize Cassava Rice SorghumSweet
potatoesMillet
Bananas
/matoke
Chart 6.2: Respondents’ second staple food in their households

Socio-economic Baseline Survey, Uganda
National Fisheries Resources Research Institute, 2006
51
A variety of sauces consumed by the households were reported but by far the main one was
fish (79.9%) (Table 6.9). Other types of sauces were consumed on limited levels. The ready
availability and affordability of fish at the beaches seems to be a major factor in the high
consumption of fish. In terms of a balanced diet, the consumption of beans/legumes, beef,
chicken and vegetables, all of which were reported on small levels, need to be promoted
among the fisheries stakeholders.
Table 6.9: The main sauces in the households
Frequency Percent Valid Percent
Cumulative Percent
Chicken 17 1.4 1.4 1.4
Beef 45 3.6 3.7 5.1
Fish 987 79.9 80.8 85.8
Vegetables 52 4.2 4.3 90.1
Beans/legumes 114 9.2 9.3 99.4
All of the above 1 .1 .1 99.5
Other 6 .5 .5 100.0
Total 1222 98.9 100.0
Missing System 13 1.1
Total 1235 100.0
The second sauces reported were beans/legumes (43.4%), followed by vegetables (24.9%)
and beef (14.7%) (Table 6.10).
Table 6.10: The second sauces in the households
Frequency Percent Valid Percent
Cumulative Percent
Chicken 14 1.1 1.2 1.2
Beef 182 14.7 15.0 16.2
Fish 140 11.3 11.5 27.7
Vegetables 302 24.5 24.9 52.6
Beans/legumes 536 43.4 44.2 96.8
All of the above 5 .4 .4 97.2
Other 34 2.8 2.8 100.0
Total 1213 98.2 100.0
Missing System 22 1.8
Total 1235 100.0
The survey also set out to assess the consumption patterns of the different types of fish
within the fishing communities sampled. The results revealed tilapia was the fish eaten most
often (73.5%), followed by Nile perch (19.3%) (Table 6.11). The happlochromines were the

Socio-economic Baseline Survey, Uganda
National Fisheries Resources Research Institute, 2006
52
least often consumed at the beaches (0.3%). Many reasons were advanced for frequently
consuming tilapia, including ready availability and low prices as compared to other fish types,
particularly Nile perch.
Table 6.11: Fish species eaten most often
Frequency Percent Valid Percent
Cumulative Percent
Nile perch 238 19.3 19.5 19.5
Tilapia 908 73.5 74.4 93.9
Mukene 57 4.6 4.7 98.6
Happlochromines 4 .3 .3 98.9
Others 13 1.1 1.1 100.0
Total 1220 98.8 100.0
Missing System 15 1.2
Total 1235 100.0
With respect to the preferences of the stakeholders, the majority again preferred tilapia
(69.4%), followed by Nile perch (19.9%). There was little preference for the
happlochromines or mukene (6.12).
Table 6.12: Fish species the respondents liked best
Frequency Percent Valid Percent
Cumulative Percent
Nile perch 246 19.9 20.3 20.3
Tilapia 857 69.4 70.8 91.1
Mukene 25 2.0 2.1 93.1
Happlochromines 9 .7 .7 93.9
Others 74 6.0 6.1 100.0
Total 1211 98.1 100.0
Missing System 24 1.9
Total 1235 100.0
In making their preferences for the different types of fish, the respondents considered
whether the fish was sweet (38.5%), followed by easily available (31.6%) and more nutritious
(15.7%) as compared to other fish species (Table 6.13).

Socio-economic Baseline Survey, Uganda
National Fisheries Resources Research Institute, 2006
53
Table 6.13: Why the fish was liked best
Frequency Percent Valid Percent
Cumulative Percent
Fish is easily available
390 31.6 32.3 32.3
Fish is cheap 96 7.8 7.9 40.2
Fish is sweet 476 38.5 39.4 79.6
More nutritious 194 15.7 16.0 95.6
Other 53 4.3 4.4 100.0
Total 1209 97.9 100.0
Missing System 26 2.1
Total 1235 100.0
The state of fish most liked was also examined. The data revealed that the most liked fish
state was fresh (76.4%), followed by the smoked form (10.5%) (Table 6.14). Generally, the
salted form of fish was not preferred (0.2%)
Table 6.14: In what state respondents most liked to eat fish
Frequency Percent Valid Percent
Cumulative Percent
Fresh 944 76.4 77.6 77.6
Smoked 130 10.5 10.7 88.2
Sun-dried 23 1.9 1.9 90.1
Fried 93 7.5 7.6 97.8
Salted 3 .2 .2 98.0
Other 24 1.9 2.0 100.0
Total 1217 98.5 100.0
Missing System 18 1.5
Total 1235 100.0
The state of fish actually eaten most was also examined. The data revealed that most
respondents actually ate the fresh form of fish (76.2%), followed by the smoked fish (10.0%)
Table 6.15). This shows that the respondents were able to eat fish in the forms they
preferred, i.e. eat what they wanted to eat.

Socio-economic Baseline Survey, Uganda
National Fisheries Resources Research Institute, 2006
54
Table 6.15: What state of fish respondents ate most
Frequency Percent Valid Percent
Cumulative Percent
Fresh 941 76.2 77.8 77.8
Smoked 123 10.0 10.2 88.0
Sun-dried 30 2.4 2.5 90.5
Fried 82 6.6 6.8 97.3
Salted 2 .2 .2 97.4
Other 31 2.5 2.6 100.0
Total 1209 97.9 100.0
Missing System 26 2.1
Total 1235 100.0
Concerning the reasons why they ate the fish in the forms they ate them, the respondents
reported that these were whether the fish was sweet (33.3%), easily available (30.4%) or
more nutritious (20.9%). However, just 0.4% of the respondents reported that they liked the
state of fish most because it could be bought in small units (Table 6.16).
Table 6.16: The best reason why respondents liked fish in this state
Frequency Percent Valid Percent
Cumulative Percent
Fish is easily available
376 30.4 30.9 30.9
Fish is cheap 78 6.3 6.4 37.3
Fish is sweet 411 33.3 33.8 71.1
More nutritious 258 20.9 21.2 92.4
Can be bought in small units
5 .4 .4 92.8
Other 88 7.1 7.2 100.0
Total 1216 98.5 100.0
Missing System 19 1.5
Total 1235 100.0
The frequency with which fish was eaten in a week was examined. The data showed that the
average number of days respondents ate fish in a week was 4.44 days. The majority of the

Socio-economic Baseline Survey, Uganda
National Fisheries Resources Research Institute, 2006
55
respondents ate fish 7 days a week (24.9%), followed by 4 days (22.1%) and 3 days (21.3%)
(Table 6.17).
Table 6.17: Number of days respondents usually ate fish in a week
Days a week Frequency Percent Valid Percent
Cumulative Percent
1 39 3.2 4.0 4.0
2 98 7.9 10.1 14.1
3 207 16.8 21.3 35.4
4 215 17.4 22.1 57.5
5 116 9.4 11.9 69.4
6 55 4.5 5.7 75.1
7 242 19.6 24.9 100.0
Total 972 78.7 100.0
Missing System 263 21.3
Total 1235 100.0
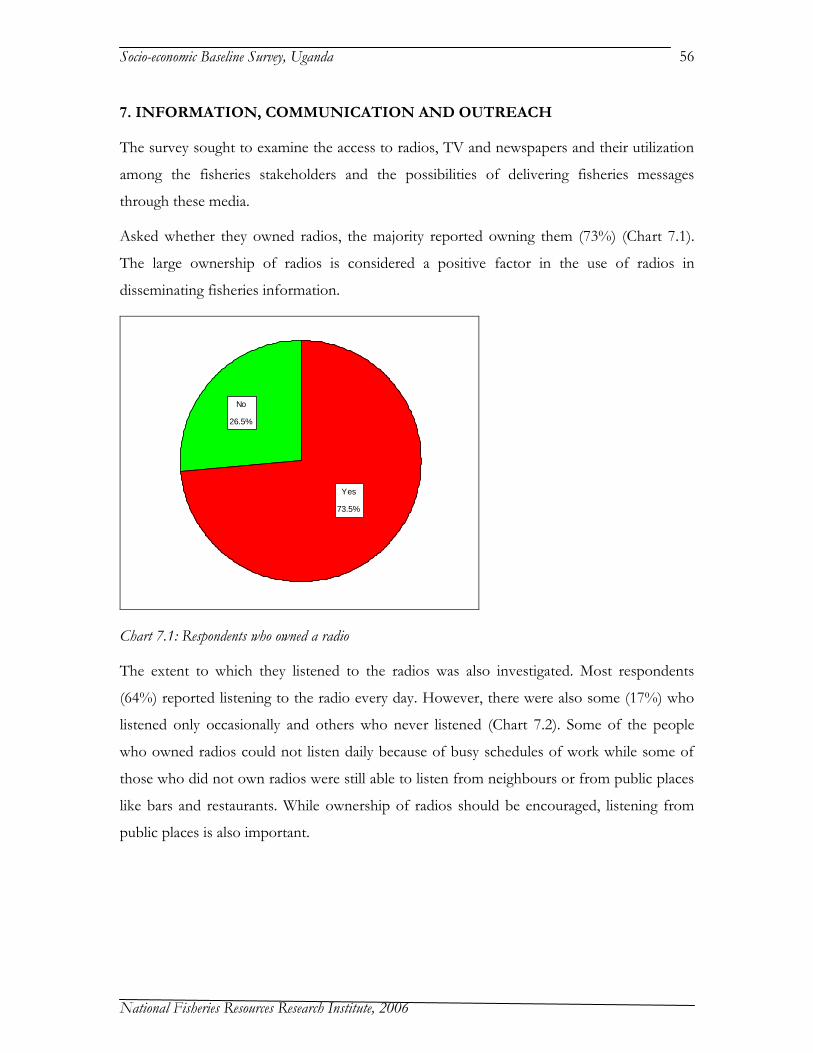
Socio-economic Baseline Survey, Uganda
National Fisheries Resources Research Institute, 2006
56
7. INFORMATION, COMMUNICATION AND OUTREACH
The survey sought to examine the access to radios, TV and newspapers and their utilization
among the fisheries stakeholders and the possibilities of delivering fisheries messages
through these media.
Asked whether they owned radios, the majority reported owning them (73%) (Chart 7.1).
The large ownership of radios is considered a positive factor in the use of radios in
disseminating fisheries information.
26.5%
73.5%
No
Yes
Chart 7.1: Respondents who owned a radio
The extent to which they listened to the radios was also investigated. Most respondents
(64%) reported listening to the radio every day. However, there were also some (17%) who
listened only occasionally and others who never listened (Chart 7.2). Some of the people
who owned radios could not listen daily because of busy schedules of work while some of
those who did not own radios were still able to listen from neighbours or from public places
like bars and restaurants. While ownership of radios should be encouraged, listening from
public places is also important.

Socio-economic Baseline Survey, Uganda
National Fisheries Resources Research Institute, 2006
57
How often they listened to the radio
Never
Occasionally
Most days each w eek
Every day
Pe
rce
nt
70
60
50
40
30
20
10
06
17
13
64
Chart 7.2: Frequency of listening to the radio
With respect to the time of listening, most of those who listened to the radio did so in the
early evening (30.3%), followed by all day (26.6%) (Table 7.1). Few people listened to the
radio late in the night.
Table 7.1: What time of day they usually listened to the radio
Frequency Percent
All day 308 26.6
Morning hours 171 14.7
Lunch time 102 8.8
Afternoon 122 10.5
Early evening 351 30.3
Late at night 106 9.1
Total 1160 100.0
Several radios were available to the stakeholders. However, the majority liked to listen to
Radio CBS (33.4%), followed by Radio Simba (18.9%) and NBS (17.5%) (Table 7.2).
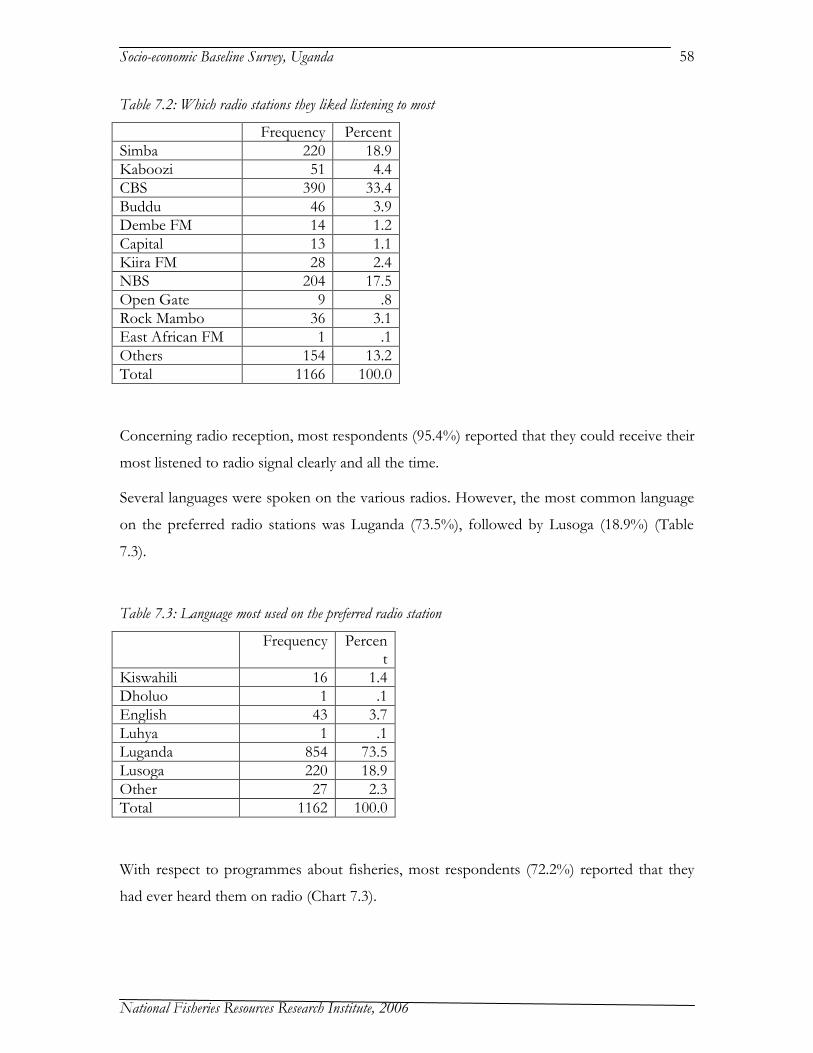
Socio-economic Baseline Survey, Uganda
National Fisheries Resources Research Institute, 2006
58
Table 7.2: Which radio stations they liked listening to most
Frequency Percent
Simba 220 18.9
Kaboozi 51 4.4
CBS 390 33.4
Buddu 46 3.9
Dembe FM 14 1.2
Capital 13 1.1
Kiira FM 28 2.4
NBS 204 17.5
Open Gate 9 .8
Rock Mambo 36 3.1
East African FM 1 .1
Others 154 13.2
Total 1166 100.0
Concerning radio reception, most respondents (95.4%) reported that they could receive their
most listened to radio signal clearly and all the time.
Several languages were spoken on the various radios. However, the most common language
on the preferred radio stations was Luganda (73.5%), followed by Lusoga (18.9%) (Table
7.3).
Table 7.3: Language most used on the preferred radio station
Frequency Percent
Kiswahili 16 1.4
Dholuo 1 .1
English 43 3.7
Luhya 1 .1
Luganda 854 73.5
Lusoga 220 18.9
Other 27 2.3
Total 1162 100.0
With respect to programmes about fisheries, most respondents (72.2%) reported that they
had ever heard them on radio (Chart 7.3).

Socio-economic Baseline Survey, Uganda
National Fisheries Resources Research Institute, 2006
59
27.8%
72.2%
No
Yes
Chart 7.3: Respondents who ever heard fisheries programmes on radio
Different preferences were shown with respect to the appropriate times to receive
information on fisheries on the radio. However, the majority preferred the early evening
(43.9%), followed by morning hours (16.4%) (Table 7.4).
Table 7.4: Time preferred to receive information on fisheries on the radio
Frequency Percent
All day 30 2.6
Morning hours 192 16.4
Lunch time 118 10.1
Afternoon 149 12.7
Early evening 515 43.9
Late at night 170 14.5
Total 1174 100.0
System 61
1235
Ownership of TVs among the stakeholders was examined. However, unlike the radio, most
respondents reported not owning TVs (89.6%) (Chart 7.4). The difficulty of owning a TV in
the rural setting of a beach was understood. Cost of a TV and lack of electricity were some
of the contributing factors.

Socio-economic Baseline Survey, Uganda
National Fisheries Resources Research Institute, 2006
60
89.6%
10.4%
No
Yes
Chart 7.4: Respondents who owned TVs
Similarly, with respect to watching TV, the majority said they never watched (62%), with
30% reporting that they watched occasionally while only 3% watched every day (Chart 7.5).
The implication is that the TV is still not the most effective method of conveying
information to fisheries stakeholders, due to its limited access.
How often they watched TV
Never
Occasionally
Most days each w eek
Every day
Pe
rce
nt
70
60
50
40
30
20
10
0
62
30
43
Chart 7.5: Frequency of TV watching
Concerning newspapers, the majority of the respondents never read them (64%), some read
them occasionally (31%) while only a few reportedly read them every day (2%) (Chart 7.6).

Socio-economic Baseline Survey, Uganda
National Fisheries Resources Research Institute, 2006
61
This is attributed to illiteracy as well as lack of newspapers at the beaches. As a result,
newspapers are also not an effective medium for conveying fisheries information.
How often they read newspapers
Never
Occasionally
Most days each w eek
Every day
Pe
rce
nt
70
60
50
40
30
20
10
0
64
31
Chart 7.6: Frequency of reading newspapers
The best media preferred by respondents for getting fisheries information to them were the
radio (57%), followed by meetings/barazas (36%) (Chart 7.7). The least preferred methods
were the brochure (1.3%), billboards (1.4%) and TV (1.6%).
The best way of getting information on fisheries
Meetings/barazas
TV
Radio
New spapers
Billboards
Brochures
Pe
rce
nt
60
50
40
30
20
10
0
36
57
3
Chart 7.7: Preferred media for fisheries information
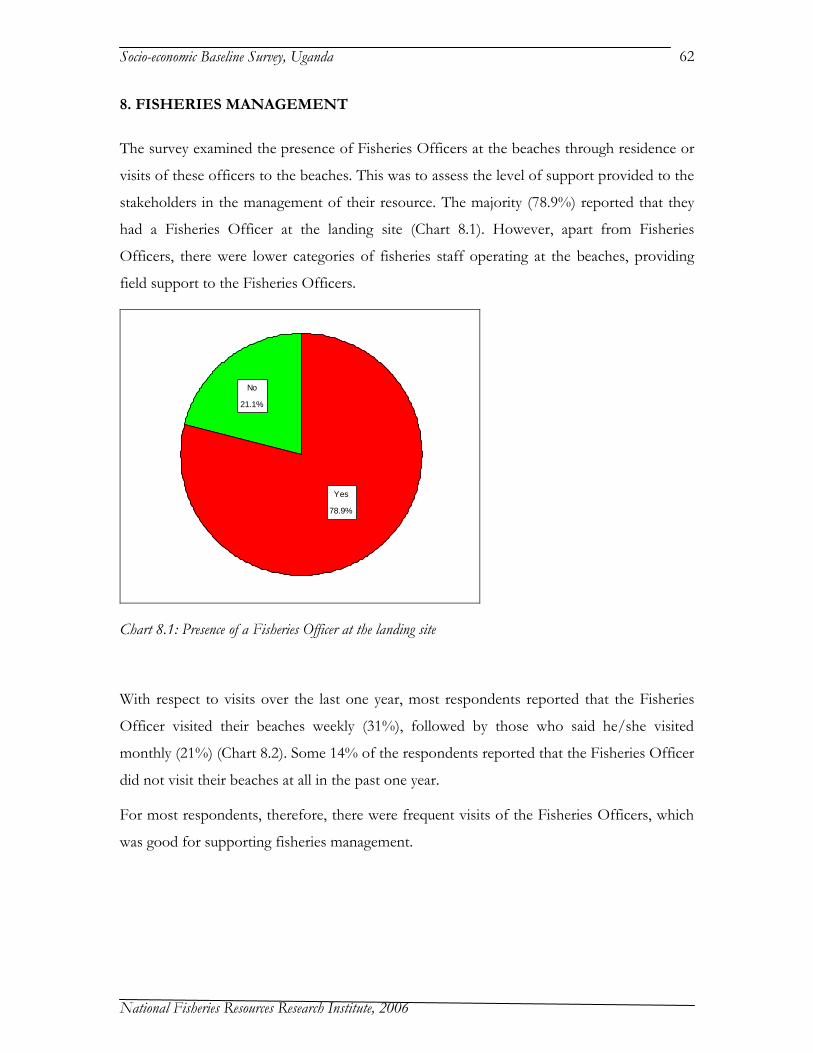
Socio-economic Baseline Survey, Uganda
National Fisheries Resources Research Institute, 2006
62
8. FISHERIES MANAGEMENT
The survey examined the presence of Fisheries Officers at the beaches through residence or
visits of these officers to the beaches. This was to assess the level of support provided to the
stakeholders in the management of their resource. The majority (78.9%) reported that they
had a Fisheries Officer at the landing site (Chart 8.1). However, apart from Fisheries
Officers, there were lower categories of fisheries staff operating at the beaches, providing
field support to the Fisheries Officers.
21.1%
78.9%
No
Yes
Chart 8.1: Presence of a Fisheries Officer at the landing site
With respect to visits over the last one year, most respondents reported that the Fisheries
Officer visited their beaches weekly (31%), followed by those who said he/she visited
monthly (21%) (Chart 8.2). Some 14% of the respondents reported that the Fisheries Officer
did not visit their beaches at all in the past one year.
For most respondents, therefore, there were frequent visits of the Fisheries Officers, which
was good for supporting fisheries management.

Socio-economic Baseline Survey, Uganda
National Fisheries Resources Research Institute, 2006
63
How often beach was visited by Fisheries Officer
Not visitedQuarterlyMonthlyWeeklyDaily
Pe
rce
nt
40
30
20
10
0
1414
21
32
19
Chart 8.2: Frequency of visits by the Fisheries Officer
Concerning whether the stakeholders had ever been provided with any information on
fisheries, the majority of the respondents (78.7%) said they had been provided with some
information (Chart 8.3). This was an indication that Fisheries Officers were providing some
outreach services to the stakeholders.
21.3%
78.7%
No
Yes
Chart 8.3: Respondents who have ever been provided with fisheries information

Socio-economic Baseline Survey, Uganda
National Fisheries Resources Research Institute, 2006
64
Respondents acknowledged receiving information on the different fisheries areas to different
degrees. The information received most was on gears, methods and appropriate sizes of
fish to harvest (81%), while fish business management was least (25%) (Chart 8.4).
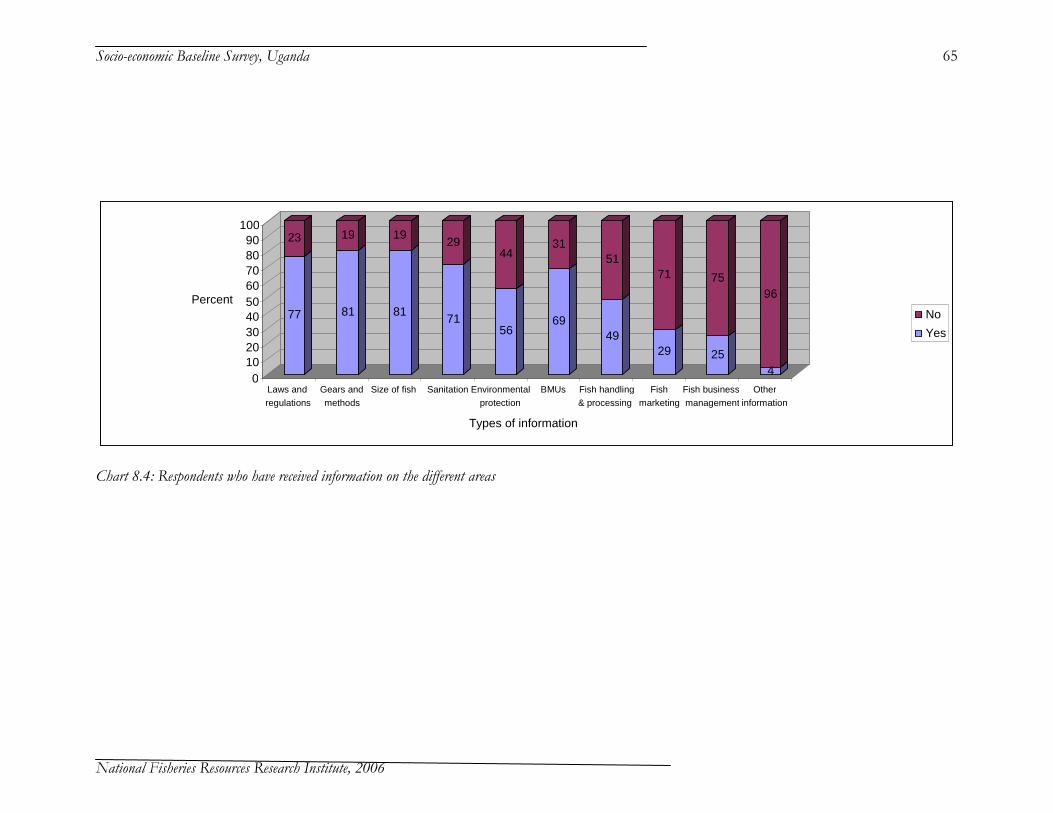
Socio-economic Baseline Survey, Uganda
National Fisheries Resources Research Institute, 2006
65
Chart 8.4: Respondents who have received information on the different areas
77
23
81
19
81
19
71
29
56
44
69
31
49
51
29
71
25
75
4
96
0 10 20 30 40 50 60 70 80 90
100
Percent
Laws and regulations
Gears and methods
Size of fish Sanitation Environmental protection
BMUs Fish handling & processing
Fish marketing
Fish business management
Other information
Types of information
No
Yes

Socio-economic Baseline Survey, Uganda
National Fisheries Resources Research Institute, 2006
66
The survey examined the extent to which the stakeholders were organised for the purpose of
effectively participating in fisheries management. Respondents were asked if they were
members of a fishermen’s or traders’ organizations. The majority said they were not (76.9%
N=1,235) (Chart 8.5). The explanation for this was that there were not many strong
organizations at the beaches and a sense of individualism prevailed among the stakeholders.
This was not a favourable factor for the development of the fisheries.
76.9%
23.1%
No
Yes
Chart 8.5: Respondents who were members of fishermen’s or traders’ organizations
The status of BMUs at the beaches was also examined. Most respondents reported that they
had BMUs at their beaches (62.6% N=1,235) (Chart 8.6). The observation that some
respondents did not report having BMUs was understandable because at the time of the
survey, the process of establishing BMUs on Lake Victoria, Uganda was also still going on.
Some of the beaches may have been covered under the survey before their BMU formation
processes was completed.
Some respondents also did not understand the BMU arrangements well or did not belong to
it. The evolving definition of a BMU, from the earlier forms of beach level organizations like
Landing Management Committees (LMCs), Task Forces (TFs) and Gabunga Committees
(GCs) could have created further complication in the minds of the respondents.

Socio-economic Baseline Survey, Uganda
National Fisheries Resources Research Institute, 2006
67
37.4%
62.6%
No
Yes
Chart 8.6: Respondents with a BMU at their beaches
Concerning the time when the BMUs were formed, most respondents (88.7%) reported that
their BMUs were formed in 2005, followed by those whose BMUs were formed in 2004
(10.0%) (Table 8.1). Some individuals reported having their BMUs from earlier periods but
this could be attributed to their interpretations of the concept of BMUs, where they could
have included other forms of beach organizations as explained above.
Table 8.1: Year when the BMU was formed
Year Frequency Percent
1993 1 .1
1995 1 .1
1996 1 .1
2000 1 .1
2001 1 .1
2002 4 .5
2003 2 .2
2004 80 10.0
2005 711 88.8
Total 802 100.0
Concerning the membership of BMUs, most of the respondents (72.5% N=1,235) said they
were not members (Chart 8.7). This could have been attributed to the lack of understanding
of membership within BMUs. Many stakeholders believed they registered with the BMUs
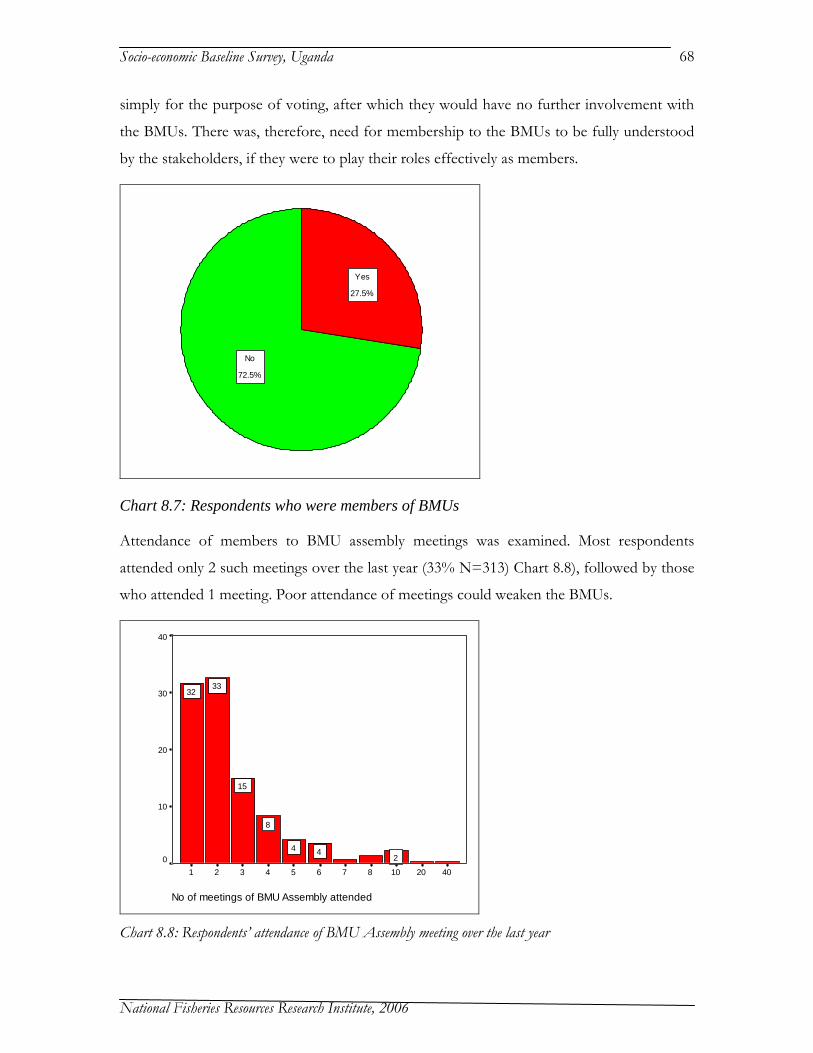
Socio-economic Baseline Survey, Uganda
National Fisheries Resources Research Institute, 2006
68
simply for the purpose of voting, after which they would have no further involvement with
the BMUs. There was, therefore, need for membership to the BMUs to be fully understood
by the stakeholders, if they were to play their roles effectively as members.
72.5%
27.5%
No
Yes
Chart 8.7: Respondents who were members of BMUs
Attendance of members to BMU assembly meetings was examined. Most respondents
attended only 2 such meetings over the last year (33% N=313) Chart 8.8), followed by those
who attended 1 meeting. Poor attendance of meetings could weaken the BMUs.
No of meetings of BMU Assembly attended
40201087654321
Pe
rce
nt
40
30
20
10
0 244
8
15
3332
Chart 8.8: Respondents’ attendance of BMU Assembly meeting over the last year

Socio-economic Baseline Survey, Uganda
National Fisheries Resources Research Institute, 2006
69
When the support of the members to the BMUs was examined, the data revealed that most
members supported by attending meetings (22% N=1,235) (Chart 8.9), and there was little
support through contribution of fish or cash. Generally, members who reported that they
supported their BMUs were few. Support in the different forms is important for the success
and sustainability of the BMUs.
22
78
2
98
7
93
0
10
20
30
40
5060
70
80
90
100
Percent
Attending
meetings
Contributing fishContributing cash
Types of contribution
No
Yes
Chart 8.9: Members support to their BMUs

Socio-economic Baseline Survey, Uganda
National Fisheries Resources Research Institute, 2006
70
9. EXPENDITURES OF STAKEHOLDERS
Respondents were asked to rank how they spent their incomes from the fishery activities.
The majority gave first priority to food (43% N=1,235), followed by those who gave first
priority to education (27%) and health care (12%) (Chart 9.1). Only 6% ranked investment
as their first priority. Clothing was not ranked highly as a first priority but third (29%) and
second priority (21%). Contrary to what people believe, leisure was given first priority by
only 2%. Details of other priorities as ranked by the respondents is given in Table 9.1 Below.
43
27
412
3 16
2 40
5
10
15
20
25
30
35
40
45
Percent
Fo
od
Ed
uca
tio
n
Clo
thin
g
He
alth
Ca
re
Sh
elte
r
Ba
nk
Inve
stm
en
t
Le
isu
re
Oth
er
Expenditure types
Chart 9.1: Respondents’ expenditure areas of first priority
Table 9.1: Respondents’ ranking for the different expenditure areas
Food Education Clothing Health Care
Shelter Bank Investment Leisure Other
Priority
1 43 27 4 12 3 1 6 2 4
2 26 15 21 21 4 0 4 2 4
3 13 10 29 20 7 0 3 3 3
4 6 9 19 17 5 1 3 3 2
5 2 3 6 7 6 2 3 5 2
6 0 1 1 1 3 1 2 3 1
7 -- 0 0 0 0 0 0 1 0
Total 90 64 80 77 29 5 21 19 16
Missing system
10 36 20 23 71 95 79 81 84
Total 100 100 100 100 100 100 100 100 100

Socio-economic Baseline Survey, Uganda
National Fisheries Resources Research Institute, 2006
71
10. BOAT OWNERS AND RENT-INs
Fishing assets owned
The number of boats owned by the different individuals was examined. The data showed
that 360 respondents (29.15%) operated only one boat, 88 (7.13%) operated at most two
boats and 46 (3.72%) operated at most 3 boats (Table 10.1).
Table 10.1: Respondents’ ownership of boats
Boat 1 Boat 2 Boat 3
Ownership of boats Frequency Percent Frequency Percent Frequency Percent
Owned 297 24.05 81 6.56 41 3.32
Rented 63 5.10 7 0.57 5 0.40
Total 360 29.15 88 7.13 46 3.72
Missing System 875 70.85 1147 92.87 1189 96.28
Total 1235 100.00 1235 100.00 1235 100.00
Ownership of the boats also varied. Among respondents who operated at least one boat,
more of them owned the boats (297) than those who rented them in (63) (Chart 10.1). The
proportions of rented boats declined as the number of boats operated increased.
297
63
82
7
415
0
50
100
150
200
250
300
350
400
No. of
Respondents
Boat 1 Boat 2 Boat 3
Rented
Owned
Chart 10.1: Ownership of boats operated by respondents
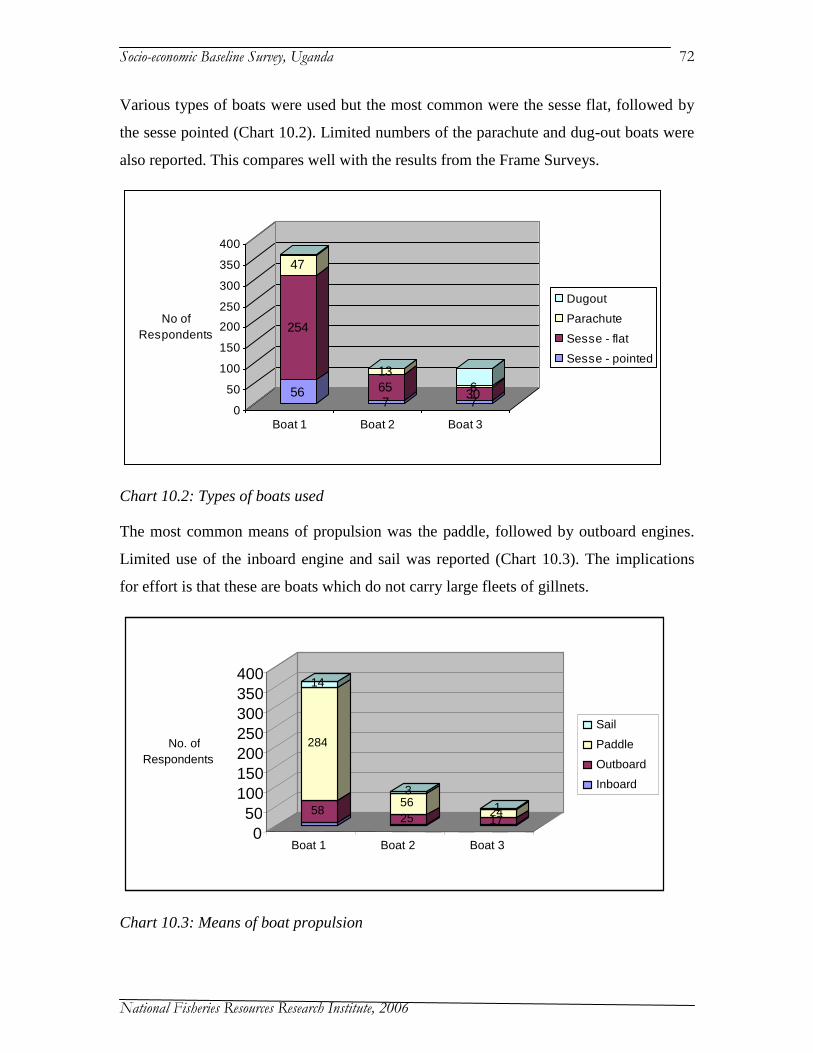
Socio-economic Baseline Survey, Uganda
National Fisheries Resources Research Institute, 2006
72
Various types of boats were used but the most common were the sesse flat, followed by
the sesse pointed (Chart 10.2). Limited numbers of the parachute and dug-out boats were
also reported. This compares well with the results from the Frame Surveys.
56
254
47
765
13
7306
0
50
100
150
200
250
300
350
400
No of
Respondents
Boat 1 Boat 2 Boat 3
Dugout
Parachute
Sesse - flat
Sesse - pointed
Chart 10.2: Types of boats used
The most common means of propulsion was the paddle, followed by outboard engines.
Limited use of the inboard engine and sail was reported (Chart 10.3). The implications
for effort is that these are boats which do not carry large fleets of gillnets.
Chart 10.3: Means of boat propulsion
58
284
14
25 56 3
17 24 1
0
50
100
150
200
250
300
350
400
No. of Respondents
Boat 1 Boat 2 Boat 3
Sail
Paddle
Outboard
Inboard

Socio-economic Baseline Survey, Uganda
National Fisheries Resources Research Institute, 2006
73
The main species targeted by the respondents was Nile perch, followed by tilapia (Chart
10.4). Significant levels of mukene and other species were also fished, particularly by
people who owned or rented just one boat.
168
145
434
54
266
86
2912243
0
50
100
150
200
250
300
350
400
No of
Respondents
Boat 1 Boat 2 Boat 3
Other species
Mukene
Tilapia species
Nile perch
Chart 10.4: Species targeted
As to whether the respondents owned other boats, only 6.32% of them did, with the
majority of these owning only one more (66.67%), followed by those who owned 3 more
(15.38%) (Table 10.2).
Table 10.2: Number of other boats owned by respondents
Frequency Percent Valid Percent
1 52.00 4.21 66.67
2 9.00 0.73 11.54
3 12.00 0.97 15.38
5 2.00 0.16 2.56
6 1.00 0.08 1.28
7 1.00 0.08 1.28
47 1.00 0.08 1.28
Total 78.00 6.32 100.00
Missing System
1157.00 93.68
Total 1235.00 100.00

Socio-economic Baseline Survey, Uganda
National Fisheries Resources Research Institute, 2006
74
Distribution of gear types by number of units is illustrated by Chart 10.5 while the data is
summarized in Table 10.3. The data shows that most respondents operated with gillnets
(213), followed by hook and lines, longlines and cast nets.
Most respondents owned less than 50 units of the gear they operated, except for longlines,
where the majority owned more than 201 units and above (56.76%) (Table 10.3).
0
20
40
60
80
100
120
140
160
180
200
No. of Gear Units
Gill
nets
Longlin
es
Beach/b
oat
sein
es
Castn
ets
Hook a
nd
lines
Tra
ps
Lift
nets
Sm
all
sein
es
Scoop n
ets
Oth
er
gears
151-200
101-150
51-100
Less than 50
Chart 10.5: Number of respondents owning the different gears by numbers
Table 10.3: Number of respondents owning the different types of gear
Less than 50 Gillnets
51-100 Gillnets
101-150 Gillnets
151-200 Gillnets
More than 201 Gillnets
Total
Freq Perc Freq Perc Freq Perc Freq Perc Freq Perc Freq Perc
Gillnets 150 70.42 34 15.96 8 3.76 4 1.88 17 7.98 213 100.00
Longlines 9 24.32 3 8.11 2 5.41 2 5.41 21 56.76 37 100.00
Beach/boat seines
5 71.43 2 28.57 7 100.00
Cast nets 23 67.65 7 20.59 2 5.88 1 2.94 1 2.94 34 100.00
Hook and lines
25 62.50 3 7.50 12 30.00 40 100.00
Traps 20 86.96 1 4.35 1 4.35 1 4.35 23 100.00
Lift nets 3 100.00 3 100.00
Small seines 11 100.00 11 100.00
Scoop nets 4 100.00 4 100.00
Other gears 11 84.62 2 15.38 13 100.00

Socio-economic Baseline Survey, Uganda
National Fisheries Resources Research Institute, 2006
75
Choice of boats and gears
The survey examined the extent to which the respondents’ choice of boats and gears were
based on the different considerations. The responses are presented in Table 10.4.
The majority of the respondents ranked high skills requirements (42%), costs (39.5%) and
risks involved with the boats and gear types (36.4%).
The considerations ranked as medium were income from fishing (53.8%) and risks (34.7%)
The considerations given low ranking were costs (34.6%), income from fishing (29.9%) and
risks (28.9)
Clearly the different considerations are viewed differently by the different stakeholders,
depending on category of stakeholders and types of species targeted. Notable in the data is
the small number of respondents who gave income from fishing high ranking.
Table 10.4: Extent to which respondents’ choices of boats and gears were based on different considerations
Ranking Costs Risks Income from fishing Skills required
Frequency Percent Frequency Percent Frequency Percent Frequency Percent
Low 120 34.6 101 28.9 103 29.9 96 28.8
Medium 90 25.9 121 34.7 185 53.8 97 29.1
High 137 39.5 127 36.4 56 16.3 140 42.0
Total 347 100.0 349 100.0 344 100.0 333 100.0
The proportion of boat owners/renters who used their own boats was examined. The data
reveals that the majority of them (63.2% N=356) usually went fishing with their own boats
(Chart 10.6). However, the data shows that boat rental was also significant, providing
incomes to owners of boats who did not fish themselves.

Socio-economic Baseline Survey, Uganda
National Fisheries Resources Research Institute, 2006
76
36.8%
63.2%
No
Yes
Chart 10.6: Respondents who usually went fishing with their own boats
Concerning whether they used crew, again the majority did (78.7% N=356) (Chart 10.7).
This shows that fishing provided employment to people without the fishing equipment. The
practice also allowed boat owners to do other types of business.
21.3%
78.7%
No
Yes
Chart 10.7: Respondents who used crew
The choice of crew was based on a number of considerations. However, most respondents
considered the crew’s skills at fishing as the main factor (47% N=300), followed by

Socio-economic Baseline Survey, Uganda
National Fisheries Resources Research Institute, 2006
77
reliability/trustworthiness (39%) (Chart 10.8). These were rational business decisions,
leading to higher production and minimization of product losses. However, choice of
relatives was also reported, reflecting the role of social ties in fish production.
Do not choose
Other
Relative
Reliable/trustw orthy
Skilled at f ishing
Pe
rce
nt
50
40
30
20
10
04
8
39
47
Chart 10.8: Considerations in choice of crew
The main buyers of fish for most of the fishers were reported to be the local traders (73%
N=343), followed by the factory agents/industries (20%) (Chart 10.9). As the local traders
supply mainly the domestic consumers, the implication is that much of the fish is destined to
consumers on the domestic market. The sale of fish to factory agents/industries also shows
how significant the proportion of fish destined to the export market is.
The data reveals that local processors constituted a small proportion of buyers of fish,
showing the little role they played in the distribution of Lake Victoria fish. The implication is
that without much processing, fish could not be delivered to distant consumers on the
domestic market, which may be a matter of concern. However, it is noted that sometimes
the traders are also processors.

Socio-economic Baseline Survey, Uganda
National Fisheries Resources Research Institute, 2006
78
Factory agents/indus
Artisanal processor
Local traders
Consumers
Pe
rce
nt
80
60
40
20
0
20
73
5
Chart 10.9: Respondents’ main buyers of fish
The location where the respondent fished during the different months of the year were
investigated. The data shows that most respondents operated at the beach of interview
during all the months (Chart 10.10). This shows that migration among fishers was not as
high as often believed to be. This was a positive factor in the stability of the stakeholders for
their development and for the purpose of fisheries management.
0%
20%
40%
60%
80%
100%
Other beach 7.7 8.3 6.6 7.7 5.7 5.4 5.4 5.4 4 3.8 4.4 5.3
This beach 92.3 91.7 93.4 92.3 94.3 94.6 94.6 94.6 96 96.2 95.6 94.7
Jan Feb Mar Apr May Jun Jul Aug Sep Oct Nov Dec
Chart 10.10: Beaches where respondent fished during the different months (%, N=350)
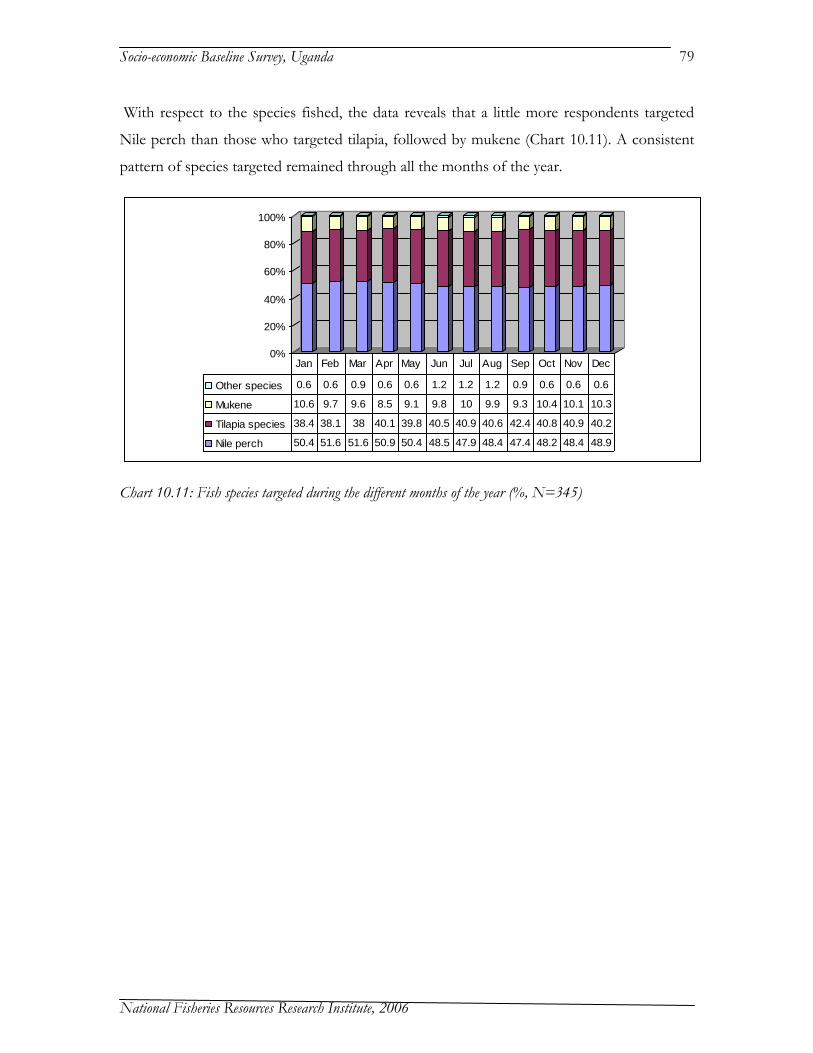
Socio-economic Baseline Survey, Uganda
National Fisheries Resources Research Institute, 2006
79
With respect to the species fished, the data reveals that a little more respondents targeted
Nile perch than those who targeted tilapia, followed by mukene (Chart 10.11). A consistent
pattern of species targeted remained through all the months of the year.
0%
20%
40%
60%
80%
100%
Other species 0.6 0.6 0.9 0.6 0.6 1.2 1.2 1.2 0.9 0.6 0.6 0.6
Mukene 10.6 9.7 9.6 8.5 9.1 9.8 10 9.9 9.3 10.4 10.1 10.3
Tilapia species 38.4 38.1 38 40.1 39.8 40.5 40.9 40.6 42.4 40.8 40.9 40.2
Nile perch 50.4 51.6 51.6 50.9 50.4 48.5 47.9 48.4 47.4 48.2 48.4 48.9
Jan Feb Mar Apr May Jun Jul Aug Sep Oct Nov Dec
Chart 10.11: Fish species targeted during the different months of the year (%, N=345)

Socio-economic Baseline Survey, Uganda
National Fisheries Resources Research Institute, 2006
80
11. FISHING CREW (BARIAS)
The survey sought to provide information on the crew as a major category of stakeholders
involved in the fisheries. To begin with, respondents were asked what type of boats they
were working on. By far, the majority of them (73.9%) worked on Sesse–flat boats, followed
by those working on Sesse–pointed and Parachute boats (Table 11.1). Most of the Dug-out
and Parachute boats would fall outside the categories of boats allowed on Lake Victoria
under the regulations, and that may explain why so few crew members worked on them.
Table 11.1: Types of boat the crew worked on
Frequency Percent
Sesse - pointed 42 12.5
Sesse - flat 249 73.9
Parachute 41 12.2
Dugout 4 1.2
Other 1 .3
Total 337 100.0
However, the majority of the crew worked on boats which did not have outboard engine
(81.4% N=350) (Chart 11.1).
81.4%
18.6%
No
Yes
Chart 11.1: Crew who worked on boats with outboard engines

Socio-economic Baseline Survey, Uganda
National Fisheries Resources Research Institute, 2006
81
With respect to the species targeted by the crew, most of them reported catching Nile perch
(48.7%), followed by tilapia (Table 11.2). This is consistent with the pattern species targeted
by the boats as shown earlier in the report.
Table 11.2: Types of species the crew had mainly been catching
Frequency Valid Percent
Nile perch 164 48.7
Tilapia species 129 38.3
Mukene 39 11.6
Other species 5 1.5
Total 337 100.0
System 898
1235
Concerning the experience of the crew, majority had worked for 1-5 years (70% N=328),
followed by those who worked for 6-10 years (Chart 11.2). This shows that most of the crew
members were relatively new and inexperienced in the fisheries work. This could have
implications for the skills available in fishing.
21 and above years
16-20 years
11-15 years
6-10 years
1-5 years
Pe
rce
nt
80
60
40
20
06
21
70
Chart 11.2: Number of years worked as crew member
The relationship between the boat owners and crew was examined. The data reveals that
most of the crew members reported that the boat owners were not relatives to them (78.8%,

Socio-economic Baseline Survey, Uganda
National Fisheries Resources Research Institute, 2006
82
N=368). This shows that the hiring of crew by boat owners was not primarily driven by
social considerations. This confirms the position given by boat owners earlier, where
relationship was not one of the main considerations in hiring crew members.
With respect to the period spent on a particular boat, most of the crew interviewed had
spent 3 months on the boat they were found working on (46%, N=336) followed by 12
months (45%) and 1 month (42%). The average number of months spent on the particular
boat was 11 months.
Concerning the number of crew members working on the same boat, most respondents
reported that they had 2 other crew members working with them (42.5%) followed by 1
other member (Table 11.3).
Table 11.3: Number of other members there were in the crew
Frequency Percent
1 107 33.6
2 135 42.5
3 54 17.0
4 20 6.3
5 2 .6
Total 318 100.0
Remuneration of crew varied under the different systems. The data shows that the majority
of them were under the share percentage system (92.8%), and only a few under the fixed
wage system (Table 11.4).
Table 11.4: How the crew were paid for work on the boat
Frequency Percent
Wage (fixed) 24 7.2
Share (%) 310 92.8
Total 334 100.0
The crew who were paid wages got on average Ush 35,055 per week (Std Deviation=
67,004). This is much higher than the unskilled labour wages paid in other sectors of the
economy, observed to be within the range of Ush 30,000 - 80,000 per month.

Socio-economic Baseline Survey, Uganda
National Fisheries Resources Research Institute, 2006
83
For the crew members who were paid as percentage share, 68.3% had their fishing costs
deducted before receiving their shares, while only 31.7% did not have them deducted first.
Where costs were deducted, the majority of the crew members had 50% share (40.6%),
followed by those with 30% and 40% shares (Chart 11.3). The average percentage share for
the crew was 40.2%
Where costs were not deducted, the majority of the crew members had 50% share (50.6%),
followed by 40% (21.2%). The average share was 42% (Chart 11.5).
Chart 11.3: Crew members’ share with and without deduction of fishing costs
Table 11.5: Crew members’ share of the catch
With fishing cost deductions
Without fishing cost deductions
Share (%) Frequency Percent Frequency Percent
10 1 0.4 1 1.2
20 25 10.0 9 10.6
30 44 17.5 7 8.2
40 43 17.1 18 21.2
50 102 40.6 43 50.6
60 6 2.4 2 2.4
70 1 0.4
80 3 1.2
90 1 0.4
100 1 1.2
On the question of how the crews’ share is divided between the members, the majority said
it was divided equally (70.3% N=350). However, there were also cases where they were not
equally divided as the head crew received more than the others.
0
20
40
60
80
100
120
10 20 30 40 50 60 70 80 90 100
Share of catch (%)
Fre
quency With deductions
Without deductions

Socio-economic Baseline Survey, Uganda
National Fisheries Resources Research Institute, 2006
84
The largest proportion of the crew always got fish to eat in addition as payment (44.9%).
There were also cases where they never did. This is illustrated by Table 11.6.
Table 11.6: How often the crew got fish to eat in addition as payment
Frequency Percent
Always 146 44.9
Sometimes 107 32.9
Never 72 22.2
Total 325 100.0
Some 48.6% (N=350) of the crew had worked on other boats during the last one year,
marginally less than those who had not (51.4%). Mobility by crew between boats was,
therefore, a common practice.
Although the majority of the crew had worked on only one boat, there were others who
worked on 2, 3, 4 and more boats during the last one year (Table 11.7). Those who changed
boats reported that the need to maximize earnings from one boat to another and the
existence of lean fishing seasons were among the factors considered.
Table 11.7: Number of other boats crew worked on
Boats Frequency Percent
1 84 45.7
2 49 26.6
3 24 13.0
4 and above 26 14.4
Total 184 100.0
Concerning the mobility of crew between beaches, the majority had worked at only one
beach (61.3%). However, there were others who worked at 2, 3 and more beaches in the last
year (Table 11.8).
Table 11.8: Number of beaches crew had worked on in the last year
Beaches Frequency Percent
1 168 61.3
2 61 22.3
3 19 6.9
4 13 4.7
5 6 2.2
6 3 1.1
7 2 .7
9 2 .7
Total 274 100.0
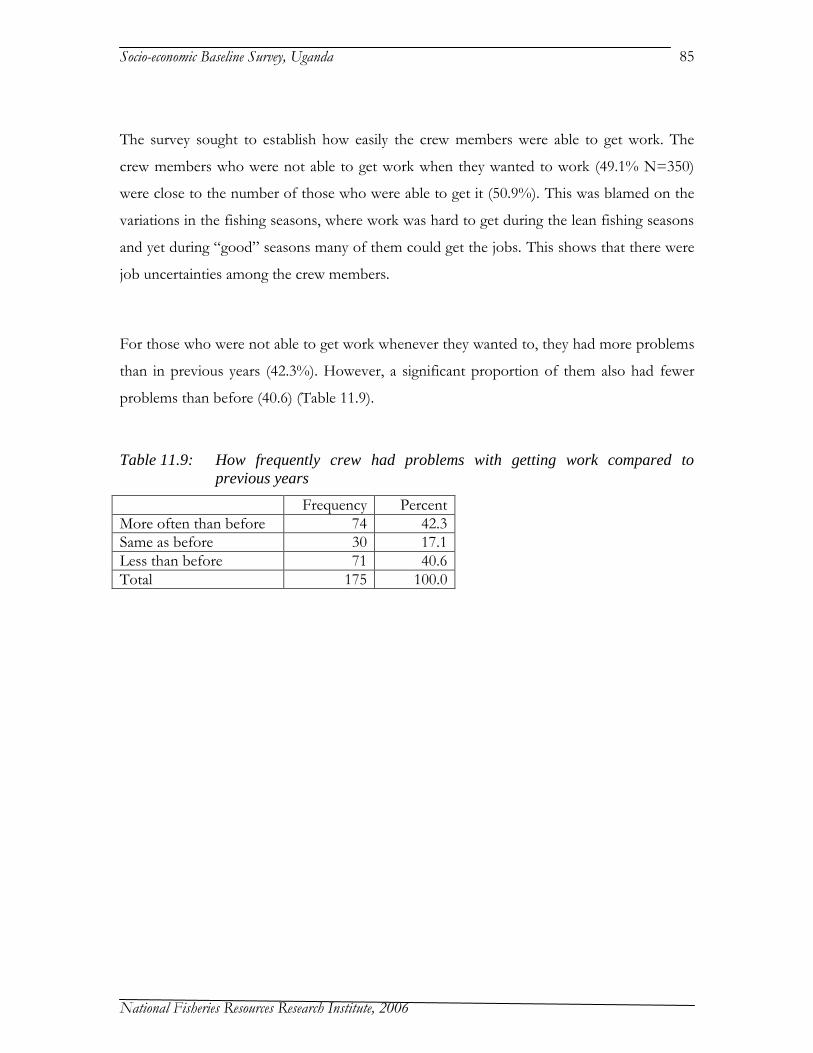
Socio-economic Baseline Survey, Uganda
National Fisheries Resources Research Institute, 2006
85
The survey sought to establish how easily the crew members were able to get work. The
crew members who were not able to get work when they wanted to work (49.1% N=350)
were close to the number of those who were able to get it (50.9%). This was blamed on the
variations in the fishing seasons, where work was hard to get during the lean fishing seasons
and yet during “good” seasons many of them could get the jobs. This shows that there were
job uncertainties among the crew members.
For those who were not able to get work whenever they wanted to, they had more problems
than in previous years (42.3%). However, a significant proportion of them also had fewer
problems than before (40.6) (Table 11.9).
Table 11.9: How frequently crew had problems with getting work compared to
previous years
Frequency Percent
More often than before 74 42.3
Same as before 30 17.1
Less than before 71 40.6
Total 175 100.0

Socio-economic Baseline Survey, Uganda
National Fisheries Resources Research Institute, 2006
86
12. FISH PROCESSORS AND TRADERS
Fish processors
The survey examined the stakeholders involved in fish processing and trading, their
activities, main buyers and means of transportation used.
The majority of the fish processors were involved in trading only (46.5% N=318), followed
by those involved in processing and trading (Chart 12.1). The data reveals the variety of
activities stakeholders in this category were involved in.
35.0%
46.9%
18.1%
Processing & Trading
Trading only
Processing only
Chart 12.1: Activities of processors/traders
The fish species processed by most of the respondents in the category was Nile perch
(34.9%), followed closely by tilapia and mukene (Table 12.1)
Table 12.1: Fish species respondents processed most
Frequency Percent
Nile perch 60 34.9
Tilapia 52 30.2
Mukene 52 30.2
Other 8 4.7
Total 172 100.0
However, with respect to the product form, majority of respondents processed the smoked
fish mostly (52.0%), followed by the sun-dried form (Table 12.2).

Socio-economic Baseline Survey, Uganda
National Fisheries Resources Research Institute, 2006
87
Table 12.2: The fish product forms respondents processed mostly
Frequency Percent
Fresh 10 5.8
Smoked 89 52.0
Sun-dried 60 35.1
Fried 7 4.1
Salted 5 2.9
Total 171 100.0
In order to carry out these processing activities, the assets owned by the stakeholders were
examined. Most respondents owned the smoking kiln of some sort (48.7%). Other assets
were owned by smaller proportions of the processors/traders (Table 12.3).
Table 12.3: Processing assets owned
Frequency Percent
Smoking kiln 73 48.7
Drying racks 13 8.7
Stove (jiko) 10 6.7
Other 54 36.0
Total 150 100.0
For the mukene processors, most of them dried their products on rocks (38.5%), followed
by those who dried it on nets and sand (Table 12.4). This shows that the mukene was not
being dried in the most hygienic ways.
Table 12.4: Where respondents dried mukene.
Frequency Percent
Sand 12 18.5
Soil 7 10.8
Rocks 25 38.5
Nets 19 29.2
Drying rack 1 1.5
Other 1 1.5
Total 65 100.0
Storage of processed fish was an issue of concern. Most of the processors/traders stored
their fish in the house (63.8%), followed by those who used a separate store in the home

Socio-economic Baseline Survey, Uganda
National Fisheries Resources Research Institute, 2006
88
(Table 12.5). Storage of the product in the house where people live is not a hygienic practice
and should not be recommended.
Table 12.5: Where respondents stored their fish
Frequency Percent
In the house 95 63.8
Separate store at your home
32 21.5
At the beach 13 8.7
Other 9 6.0
Total 149 100.0
Among the respondents who processed Nile perch, the majority (3 out of 22) sold 3 kg per
day, followed by 2 persons who sold 2 and 4 kgs per day. There were also respondents who
sold large quantities per day, notably the factory agents and factories (Table 12.6). Therefore,
the mean number of kgs of Nile perch sold per day was 222.2kg (Std Deviation=491.815).
Table 12.6: No. of kgs of Nile perch respondents sold each day most of the time
Kgs Frequency Percent
1 1 4.5
1 2 9.1
2 3 13.6
3 1 4.5
4 2 9.1
5 1 4.5
10 1 4.5
14 1 4.5
20 1 4.5
30 1 4.5
40 1 4.5
100 1 4.5
150 1 4.5
200 1 4.5
300 1 4.5
1000 2 9.1
2000 1 4.5
Total 22 100.0
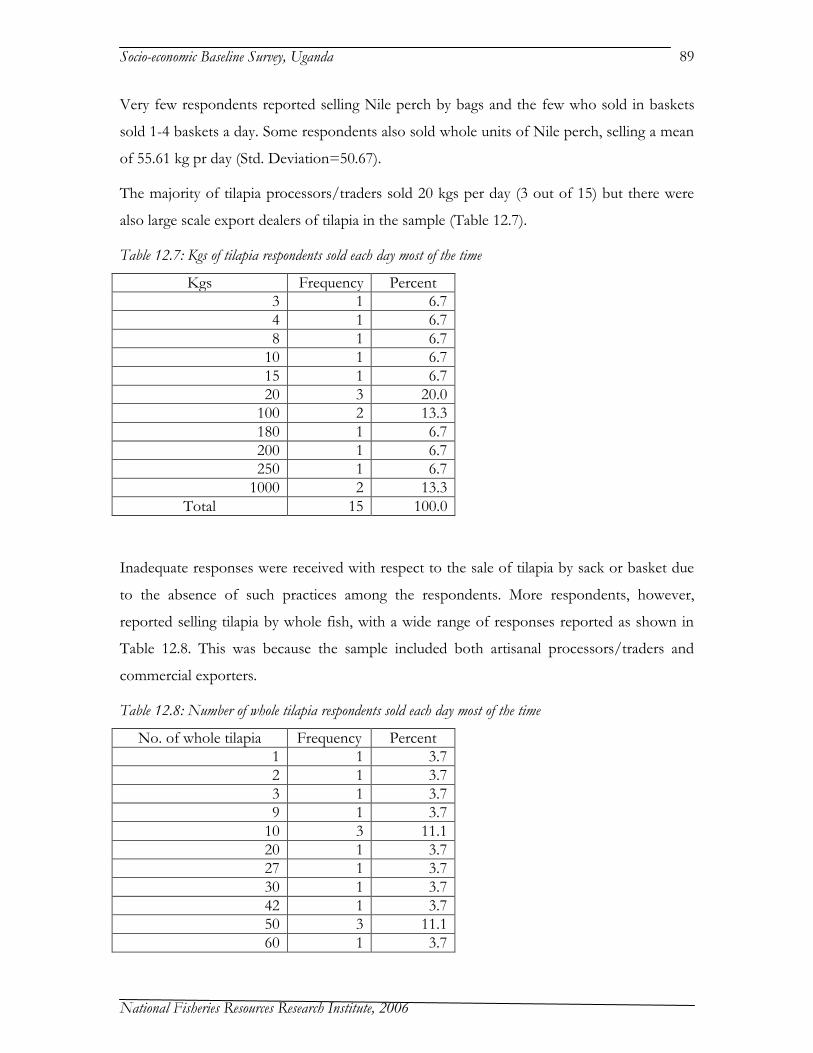
Socio-economic Baseline Survey, Uganda
National Fisheries Resources Research Institute, 2006
89
Very few respondents reported selling Nile perch by bags and the few who sold in baskets
sold 1-4 baskets a day. Some respondents also sold whole units of Nile perch, selling a mean
of 55.61 kg pr day (Std. Deviation=50.67).
The majority of tilapia processors/traders sold 20 kgs per day (3 out of 15) but there were
also large scale export dealers of tilapia in the sample (Table 12.7).
Table 12.7: Kgs of tilapia respondents sold each day most of the time
Kgs Frequency Percent
3 1 6.7
4 1 6.7
8 1 6.7
10 1 6.7
15 1 6.7
20 3 20.0
100 2 13.3
180 1 6.7
200 1 6.7
250 1 6.7
1000 2 13.3
Total 15 100.0
Inadequate responses were received with respect to the sale of tilapia by sack or basket due
to the absence of such practices among the respondents. More respondents, however,
reported selling tilapia by whole fish, with a wide range of responses reported as shown in
Table 12.8. This was because the sample included both artisanal processors/traders and
commercial exporters.
Table 12.8: Number of whole tilapia respondents sold each day most of the time
No. of whole tilapia Frequency Percent
1 1 3.7
2 1 3.7
3 1 3.7
9 1 3.7
10 3 11.1
20 1 3.7
27 1 3.7
30 1 3.7
42 1 3.7
50 3 11.1
60 1 3.7

Socio-economic Baseline Survey, Uganda
National Fisheries Resources Research Institute, 2006
90
90 2 7.4
100 4 14.8
120 1 3.7
250 1 3.7
300 1 3.7
400 1 3.7
500 1 3.7
1000 1 3.7
Total 27 100.0
The majority of the respondents sold small quantities of mukene, 2-4 kgs per day but there
were also large scale dealers selling up to 300 kgs per day (Table 12.9). The mean weight sold
was 28.2 kgs per day. It should be noted that processors/traders sold dried mukene. Sale of
mukene by bag and basket also varied. The mean sales of mukene by bag was 7.67 bags per
day and by basket was 2.92 baskets per day.
Table 12.9: Kgs of mukene respondents sold each day most of the time
Kgs Frequency Percent
1 1 4.2
1 2 8.3
3 2 8.3
4 1 4.2
4 2 8.3
5 1 4.2
5 1 4.2
6 1 4.2
8 1 4.2
10 2 8.3
14 1 4.2
15 2 8.3
20 1 4.2
30 1 4.2
35 2 8.3
50 1 4.2
100 1 4.2
300 1 4.2
Total 24 100.0
Very few of the respondents (N=4) dealt in other fish species, selling 1-2 kgs of fish per day.

Socio-economic Baseline Survey, Uganda
National Fisheries Resources Research Institute, 2006
91
The materials used for processing were examined. Most respondents used wood in fish
processing, followed by other materials and salt (Chart 12.2).
Chart 12.2: No. of respondents using the different processing materials
Concerning availability of the materials used in fish processing, wood was the most readily
available while salt was the least available (Chart 12.3).
0
20
40
60
No
. o
f R
esp
on
de
nts
Always
Most of the time
Some of the time
Infrequently
Always 53 9 3 19
Most of the time 39 4 19 26
Some of the time 10 1 1 2
Infrequently 3 1
Wood Salt OilOther
materials
Chart 12.3: Availability of materials to respondents for fish processing
Fish traders
The species respondents dealt in most was Nile Perch (42.6%), followed by tilapia (Table
12.10). A few others traded in mukene and other species.
82
14
16
23
5
40
27
16
0 10 20 30 40 50 60 70 80 90
100
No. of Respondents
Wood Salt Oil Other materials
Processing Materials
No
Yes
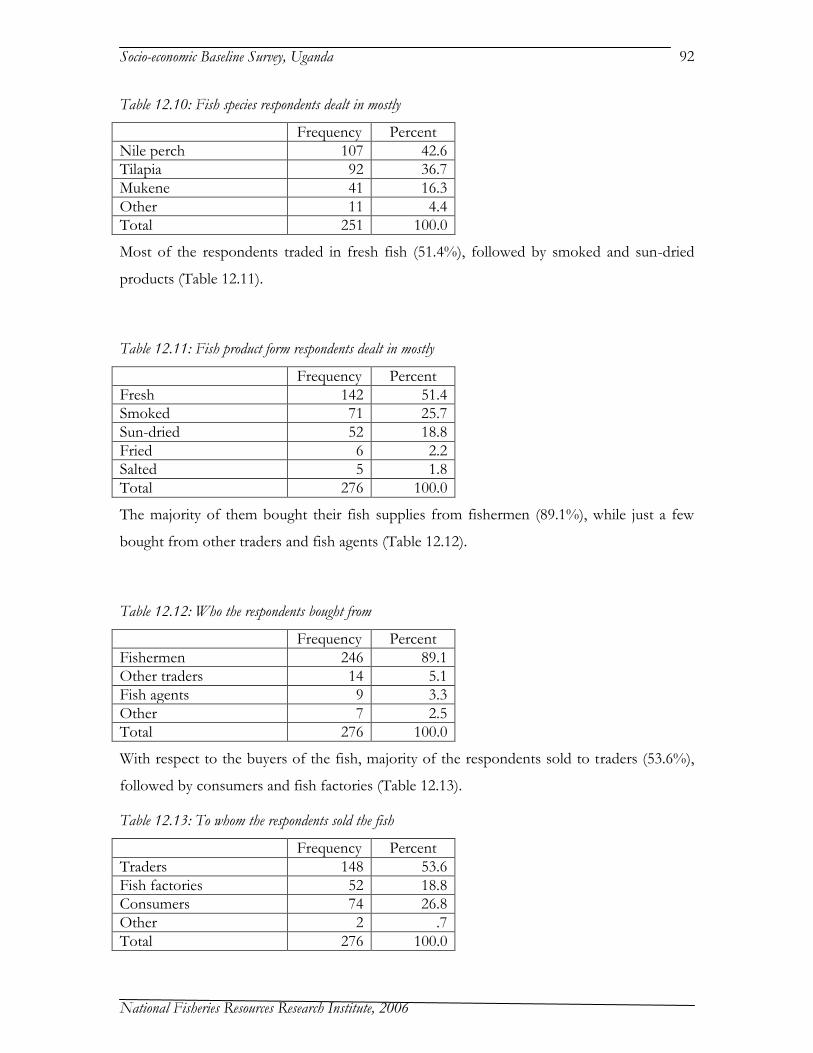
Socio-economic Baseline Survey, Uganda
National Fisheries Resources Research Institute, 2006
92
Table 12.10: Fish species respondents dealt in mostly
Frequency Percent
Nile perch 107 42.6
Tilapia 92 36.7
Mukene 41 16.3
Other 11 4.4
Total 251 100.0
Most of the respondents traded in fresh fish (51.4%), followed by smoked and sun-dried
products (Table 12.11).
Table 12.11: Fish product form respondents dealt in mostly
Frequency Percent
Fresh 142 51.4
Smoked 71 25.7
Sun-dried 52 18.8
Fried 6 2.2
Salted 5 1.8
Total 276 100.0
The majority of them bought their fish supplies from fishermen (89.1%), while just a few
bought from other traders and fish agents (Table 12.12).
Table 12.12: Who the respondents bought from
Frequency Percent
Fishermen 246 89.1
Other traders 14 5.1
Fish agents 9 3.3
Other 7 2.5
Total 276 100.0
With respect to the buyers of the fish, majority of the respondents sold to traders (53.6%),
followed by consumers and fish factories (Table 12.13).
Table 12.13: To whom the respondents sold the fish
Frequency Percent
Traders 148 53.6
Fish factories 52 18.8
Consumers 74 26.8
Other 2 .7
Total 276 100.0

Socio-economic Baseline Survey, Uganda
National Fisheries Resources Research Institute, 2006
93
The majority sold their fish to buyers within the village (35.6%), followed by respondents
who sold in another village nearby and in another district (Table 12.14).
Table 12.14: Where respondents sold fish
Frequency Percent
Within this village 99 35.6
Another village nearby 55 19.8
This Sub-county 24 8.6
This District 39 14.0
Other District 56 20.1
Other Country 5 1.8
Total 278 100.0
In most cases, the respondents went to markets less than 5 km (40.4%), followed by distant
markets of over 50 km away (Table 12.15). Markets within were also visited.
Table 12.15: How far the market where respondents sold was
Frequency Percent
<5km 111 40.4
6-20km 53 19.3
21-50km 47 17.1
>50km 64 23.3
Total 275 100.0
The majority of the respondents transported the fish to market on foot (30.2%), followed by
those who transported by boat, own bicycles and public vehicles (Table 12.16).
Table 12.16: Means mostly used to transport fish to market
Frequency Percent
On foot 86 30.2
Own bicycle 44 15.4
Hired bicycle 11 3.9
Public vehicle 42 14.7
Own vehicle 3 1.1
Hired truck/vehicle 23 8.1
Boat 62 21.8
Other 14 4.9
Total 285 100.0
The operations of the traders were examined using a set of statements (Table 12.17). The
data reveals that for most respondents, there weren’t enough fish to buy only some of the

Socio-economic Baseline Survey, Uganda
National Fisheries Resources Research Institute, 2006
94
time (45.36%). Most respondents never couldn’t sell all their fish that they had bought
(38.46%). The majority couldn’t afford to buy the fish available some of the time (33.79%).
For most of them that they couldn’t get enough ice was not a relevant concern (62.45%).
Table 12.17: Selected statements and when they are true (%)
Always Most of the time
Some of the time
Infrequently Never Not relevant
Total
There aren't enough fish to buy
11.34 23.71 45.36 9.62 5.15 4.81 100.00
I can't sell all the fish that I have bought
5.52 7.59 26.21 18.62 38.62 3.45 100.00
I can't afford to buy the fish available
2.76 7.24 33.79 20.69 32.41 3.10 100.00
I can't get enough ice 3.07 4.21 13.79 4.98 11.49 62.45 100.00
The survey sought to establish what the stakeholders considered the high and low trading
seasons, identifying their starting and ending months. The months of June to August
appeared to mark the beginning of the high season while December was considered by the
majority of the respondents as the end of the high season (Chart 12.4)
0
5
10
15
20
25
30
35
40
45
No
. o
f R
esp
on
de
nts
Start
End
Start 35 20 20 34 11 39 15 42 22 23 12 7
End 18 17 11 27 33 30 18 22 29 25 15 37
Jan Feb Mar Apr May Jun Jul Aug Sep Oct Nov Dec
Chart 12.4: Respondents’ views on the start and end of high fish trading months
With respect to the low trading season, the majority considered January as the beginning
of the low season and September was definitely the end of the low trading season (Chart
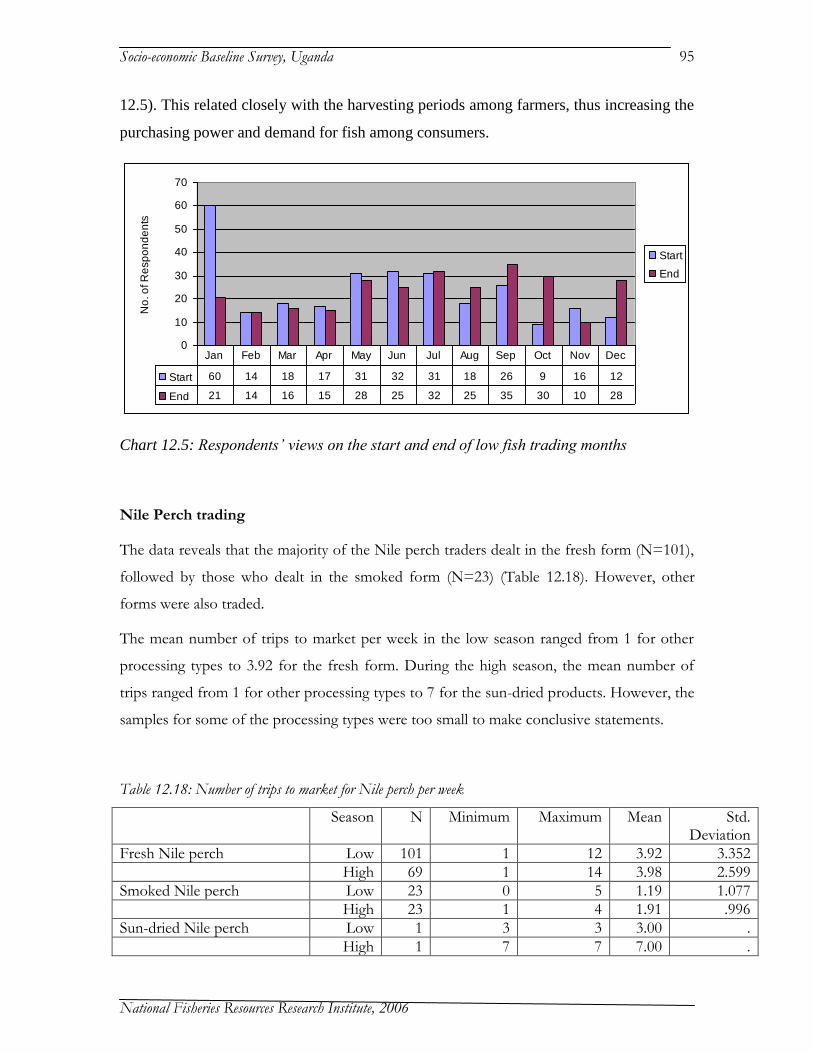
Socio-economic Baseline Survey, Uganda
National Fisheries Resources Research Institute, 2006
95
12.5). This related closely with the harvesting periods among farmers, thus increasing the
purchasing power and demand for fish among consumers.
0
10
20
30
40
50
60
70
No
. o
f R
esp
on
de
nts
Start
End
Start 60 14 18 17 31 32 31 18 26 9 16 12
End 21 14 16 15 28 25 32 25 35 30 10 28
Jan Feb Mar Apr May Jun Jul Aug Sep Oct Nov Dec
Chart 12.5: Respondents’ views on the start and end of low fish trading months
Nile Perch trading
The data reveals that the majority of the Nile perch traders dealt in the fresh form (N=101),
followed by those who dealt in the smoked form (N=23) (Table 12.18). However, other
forms were also traded.
The mean number of trips to market per week in the low season ranged from 1 for other
processing types to 3.92 for the fresh form. During the high season, the mean number of
trips ranged from 1 for other processing types to 7 for the sun-dried products. However, the
samples for some of the processing types were too small to make conclusive statements.
Table 12.18: Number of trips to market for Nile perch per week
Season N Minimum Maximum Mean Std. Deviation
Fresh Nile perch Low 101 1 12 3.92 3.352
High 69 1 14 3.98 2.599
Smoked Nile perch Low 23 0 5 1.19 1.077
High 23 1 4 1.91 .996
Sun-dried Nile perch Low 1 3 3 3.00 .
High 1 7 7 7.00 .

Socio-economic Baseline Survey, Uganda
National Fisheries Resources Research Institute, 2006
96
Fried Nile perch Low 1 3 3 3.00 .
High 1 5 5 5.00 .
Salted Nile perch Low 0
High 0
Other processed Nile perch Low 1 1 1 1.00 .
High 1 1 1 1.00 .
The quantities of Nile perch traded varied significantly between the low and high seasons
and between traders dealing in the different forms of Nile perch
During the low season, the mean quantities of fish traded per trip ranged from 50 kgs for
fried and sun-dried products to 534.51 for the fresh form (Table 12.19).
During the high season, the quantities delivered ranged from 70 kgs for the fried product to
2,575.40 for the fresh form
Table 12.19: Quantities of Nile perch traded per trip (Kgs)
Season N Minimum Maximum Mean Std. Deviation
Fresh Nile perch Low 59 1 4500 534.51 926.238
High 55 1 15000 2575.40 3654.690
Smoked Nile perch Low 10 15 300 75.50 85.779
High 10 12 500 139.20 147.865
Sun-dried Nile perch Low 1 40 40 40.00 .
High 1 100 100 100.00 .
Fried Nile perch Low 1 40 40 40.00 .
High 1 70 70 70.00 .
Salted Nile perch Low 1 1000 1000 1000.00 .
High 1 1000 1000 1000.00 .
Other processed Nile perch Low 0
High 0
Tilapia trading
Data was collected on tilapia traders dealing on the different types of product except fried
fish and there was more activity on fresh tilapia than other forms of the fish. The mean
number of trips to market during the low season ranged from 1 for the sun-dried tilapia
traders to 3.49 kgs for the fresh fish traders (Table 12.20).
During the high season, the trips ranged from 1 for the sun-dried fish traders to 6.83 per
week for the fresh tilapia traders.

Socio-economic Baseline Survey, Uganda
National Fisheries Resources Research Institute, 2006
97
Table 12.20: Number of trips to market for Tilapia per week
Season N Minimum Maximum Mean Std. Deviation
Fresh tilapia Low 44 1 14 3.49 2.569
High 46 1 80 6.83 11.455
Smoked tilapia Low 17 1 10 1.82 2.208
High 15 1 7 2.83 2.032
Sun-dried tilapia Low 1 1 1 1.00 .
High 1 1 1 1.00 .
Fried tilapia Low 0
High 0
Salted tilapia Low 3 1 2 1.33 .577
High 3 1 4 2.00 1.732
Other processed tilapia Low 1 3 3 3.00 .
High 1 5 5 5.00 .
The quantities of tilapia traded varied significantly between the low and high seasons and
between traders dealing in the different forms of the fish.
During the low season, the mean quantities of fish traded per trip ranged from 75 kgs for the
sun-dried products to 450 for the salted form (Table 12.21).
During the high season, the quantities delivered ranged from 100 kgs for the fried product to
1,350 kgs for the salted form.
Although there were few traders dealing in the salted tilapia, their operations were large
scale, compared to those of the other traders.
Table 12.21: Quantities of tilapia traded per trip (Kgs)
Season N Minimum Maximum Mean Std. Deviation
Fresh tilapia Low 20 1 1000 141.35 230.855
High 19 2 3000 431.16 759.402
Smoked tilapia Low 9 20 1000 262.22 302.191
High 9 7 2000 524.67 607.813
Sun-dried tilapia Low 1 75 75 75.00 .
High 1 150 150 150.00 .
Fried tilapia Low 0
High 2 100 100 100.00 .000
Salted tilapia Low 2 300 600 450.00 212.132
High 2 700 2000 1350.00 919.239
Other processed tilapia Low 0
High 0

Socio-economic Baseline Survey, Uganda
National Fisheries Resources Research Institute, 2006
98
Mukene trading
The majority of mukene traders dealt in the sun-dried products. The average number of trips
to market during the low season ranged from 1.96 for the sun-dried fish to 2.00 for the fresh
product (Table 12.22).
During the high season the average number of trips ranged from 2.67 for the fresh form to
7.00 for the sun-dried form.
Table 12.22: Number of trips to market for Mukene per week
Season N Minimum Maximum Mean Std. Deviation
Fresh mukene Low 2 1 3 2.00 1.414
High 3 2 3 2.67 .577
Sun-dried mukene Low 20 0 5 1.96 1.338
High 20 1 50 7.00 10.608
Other processed mukene High 0
There were no defined measures for trading mukene and the units used on the different
beaches varied. However some standard measures were adopted and used to convert
measures of volumes into weights.
During the low seasons the average quantities traded per trip ranged from 9.00 kg for fresh
mukene to 13.00 for the sun-dried fish (Table 12.23).
During the high season, the average quantities ranged from 29.30 kgs for the sun-dried fish
to 51.50 kgs for the fresh product.
Table 12.23: Quantities of mukene traded per trip (Kgs)
Season N Minimum Maximum Mean Std. Deviation
Fresh mukene Low 2 3 15 9.00 8.485
High 2 3 100 51.50 68.589
Sun-dried mukene Low 12 1 90 13.38 24.485
High 10 1 100 29.30 38.102
Other processed mukene High 0
Other fish species trading
Generally, there was limited trade in other species. These species included Clarias, Bagrus and
the haplochromines. During the low season the average number of trips per week ranged

Socio-economic Baseline Survey, Uganda
National Fisheries Resources Research Institute, 2006
99
from 1 to 7 (Table 12.24). During the high season, also, the average number of trips ranged
from 1-7. Generally, however, there were not sufficient traders to draw hard conclusions
about their practices.
Table 12.24: Number of trips for other fish per week
Season N Minimum Maximum Mean Std. Deviation
Other fresh fish Low 1 1 1 1.00 .
High 1 6 6 6.00 .
Other smoked fish Low 0
High 1 7 7 7.00 .
Other sun-dried fish Low 0
High 1 1 1 1.00 .
Other fried fish Low 1 7 7 7.00 .
High 0
Other salted fish Low 0
High 0
Other processed other fish Low 2 2 2 2.00 .000
High 2 7 7 7.00 .000
Limited data was available on the quantities of only the smoked fish, indicating that on
average, the quantities traded during the low season was 15 kgs while during the hgh season
it was 107 kgs (Table 12.25).
Table 12.25: Quantities of other traded fish traded per trip
Season N Minimum Maximum Mean Std. Deviation
Other fresh fish Low 0
High 0
Other smoked fish Low 1 15 15 15.00 .
High 1 107 107 107.00 .
Other sun-dried fish Low 0
High 0
Other fried fish Low 0
High 0
Other salted fish Low 0
High 0
Other processed other fish Low 0
High 0

Socio-economic Baseline Survey, Uganda
National Fisheries Resources Research Institute, 2006
100
13. TRAINING RECEIVED
The status of training among the stakeholders was examined. The data reveals that only
2.8% of the respondents ever received any training relating to their business. This shows that
either there were no effective training programmes for them or the training was not
effective.
With respect to the areas of training, the majority of them received training on quality
control (41.7%), followed by those who received training on fish processing (30.6%) (Table
13.1).
Table 13.1: The most relevant training received by respondents.
Frequency Percent
Book keeping and accounting 6 16.7
Fish processing 11 30.6
Quality control 15 41.7
Other 4 11.1
Total 36 100.0

Socio-economic Baseline Survey, Uganda
National Fisheries Resources Research Institute, 2006
101
14. CONCLUSIONS AND RECOMMENDATIONS
Conclusions
The socio-economic baseline survey was conducted to provide information on the fish
landing beaches, facilities available, the stakeholders involved in fisheries, assets owned and
their livelihood activities.
Beach data
Activities were carried out from beaches which could be categorized on the basis of the main
species targeted, namely Nile perch, tilapia, mukene and mixed beaches.
Apart from fishing, there were people involved in fish processing and trading, net making,
boat building, farming and trading in food commodities as alternative sources of livelihoods.
Smoking was the main method of processing for Nile perch and tilapia while sun-drying was
for mukene.
Average fish prices at the beaches were: Nile perch Sh 1,500 per kg, Tilapia Sh 1,100 per kg
and Mukene (sun-dried) Sh 1,200 per kg.
Mukene was fished and landed within restricted beaches and mostly sun-dried before sale.
Most stakeholders had access to social facilities, namely medical, educational and recreational
facilities, but these were located either in the same village, at the Sub-county or elsewhere in
the District.
Characteristics of stakeholders
The stakeholders on Lake Victoria came from different tribes but the majority were the
Baganda, followed by the Basoga and the Samia. Most of them were born in districts other
than where they operated.
The majority did not complete primary education and quite a few had no education
completely. High rates of school drop-outs were exhibited among the stakeholders.
Housing conditions
Very few of them had assets, including permanent houses, land, vehicles and bank accounts.
The health of fishers was affected by malaria, bilharzhia, HIV/AIDS and diarrhea, among
other diseases. Most people used the lake as their main source of drinking water.

Socio-economic Baseline Survey, Uganda
National Fisheries Resources Research Institute, 2006
102
Asset ownership
Many fishers reported owning land, which they used to construct houses and grow food
crops. Only a few of the people owned a cow. The low level of animal rearing was attributed
to the concentration on fishing and absence of grazing land. Very few of them owned fish
ponds, which were not even put to use. None of the fishers practiced fish farming.
Bicycles were the main means of transport owned by many people, particularly boat owners
and traders. Generally, fishers did not own vehicles because of the poor access roads and
poverty.
Fishers saved only small proportions of their daily earnings. Very few had bank accounts,
which they maintained outside the districts.
Livelihood, health and consumption status
Some of the fishers earned incomes from boats, gears, fish trading and processing, net
making boat building.
Most of the stakeholders reported getting enough food for their households, having two
meals a day with tilapia as their favourite sauce.
Information, communication and outreach
The majority listened to the radio for information, particularly tuning to CBS but very few
read newspapers. The most common information received from fisheries staff was on
fishing gear types and sizes but less on business management.
Fisheries management
Most of the beaches had resident or visiting fisheries staff. However, some fishers reported
that their beaches were never visited by the staff. The most common information received
from staff was on fishing gears, methods and minimum size of fish to be harvested. The
least information received was on fish business management.
Majority of the people were not members of any fishermen or traders organization. Some of
the stakeholders did not understand the roles of the BMUs. Many of them did not report to
be members of the BMUs.

Socio-economic Baseline Survey, Uganda
National Fisheries Resources Research Institute, 2006
103
Expenditures of stakeholders
The highest expenditure priorities among the fisheries stakeholders were food, education
and health. Contrary to the general belief, the data revealed that leisure and clothing were
not considered high priorities among them. Investments were also not a priority, due to
insufficiency of the earnings to meet existing needs.
Boat owners and rent-ins
The majority of the boat owners owned one boat each, mostly hand paddled sesse targeting
tilapia. Nets and hooks were the most commonly owned fishing gears. The choice of boats
and gears was based mainly on skills requirements, costs and risks involved with them.
Fishing crew (barias)
Most of the fishing crew worked on ssesse hand propelled boats targeting Nile perch and
were paid under a share system. They often changed boats, in search for better earnings,
particularly during lean fishing seasons.
Fish processors and traders
Most processors were involved in smoking, for which they owned smoking kilns and
targeted Nile perch. Most traders dealt in fresh Nile perch and tilapia, followed by smoked
fish. The quantities of fish traded varied significantly between categories of traders and
between low and high seasons.
Training received
Very few respondents had ever received training in relation to their business. Those who
received did so in the areas of quality control and fish processing.
Recommendations
It is recommended that periodic monitoring of these socio-economic aspects of the fisheries
should be undertaken to evaluate the impacts of fisheries management on Lake Victoria.

Socio-economic Baseline Survey, Uganda
National Fisheries Resources Research Institute, 2006
104
15. References
Abila, R.O., M. Medard and K.O. Odongkara (2004). Implementation Plan for Socio-economic
Research and Monitoring. Lake Victoria Fisheries Organization, Jinja, Uganda.
Applied Statistics Centre, University of Hull, 2000: Analysis of categorical and survey data
using SPSS (version 9.0).
Brenner M., J. Brown and D. Canter (1985). The research Interview: Uses and Approaches.
Academic Press. London.
LVEMP (Lake Victoria Environmental Management Project), 1998: Technical Report on
Lake Victoria Wider Socio-Economic program
Medard, M., K.O. Odongkara and R.O. Abila (2004). Report on the status of socio-economic research
and monitoring on Lake Victoria. Lake Victoria Fisheries Organization, Jinja, Uganda.
Morgan, L. D. (1988). Focus Groups as Qualitative Research. Sage Publications. London.
Odongkara, K.O. (2001). Poverty in the fisheries: indicators, causes and interventions for Lake Victoria,
Uganda. LVEMP Research Report, Jinja, Uganda.

Socio-economic Baseline Survey, Uganda
National Fisheries Resources Research Institute, 2006
105
Appendix 1: List of Beaches Surveyed
No. Beach District Category No. of questionnaires
1 Kigungu Kalangala 1. NP-O 36
2 Kachanga Kalangala 1. NP-O 37
3 Kinagaba Mukono 1. NP-O 42
4 Golofa Bugiri 1. NP-O 40
5 Kasensero Rakai 1. NP-O 41
6 Butanira-Lolwe Island Bugiri 1. NP-O 37
7 Khaza Mayuge 2. NP-M 41
8 Maduwa Busia 2. NP-M 34
9 Kalega Mukono 2. NP-M 39
10 Buwagajjo Mukono 2. NP-M 41
11 Maala Mukono 2. NP-M 36
12 Nambula Mukono 2. NP-M 36
13 Maganda-Sagiti Island Mayuge 2. NP-M 32
14 Kyagalanyi Kalangala 2. NP-M 40
15 Kagulube Wakiso 3. Tilapia 40
16 Nabisukiro Kalangala 3. Tilapia 41
17 Gunda Mukono 3. Tilapia 41
18 Katebo-Lwazi Mpigi 3. Tilapia 36
19 Makonzi Masaka 3. Tilapia 44
20 Nakiga Masaka 3. Tilapia 45
21 Nakaziba Mpigi 3. Tilapia 42
22 Nakiwogo Wakiso 3. Tilapia 35
23 Wanyange Jinja 3. Tilapia 24
24 Ntinkalu Mayuge 4. Dagga 39
25 Ziru-Kibulwe Mukono 4. Dagga 36
26 Banda Kalangala 4. Dagga 25
27 Bumeru A Bugiri 5. Mixed 44
28 Maruba Bugiri 5. Mixed 40
29 Owen Falls Jinja 5. Mixed 14
30 Mwena Kalangala 5. Mixed 39
31 Kiruguma Mukono 5. Mixed 40
32 Nakirimira Mayuge 5. Mixed 40
33 Malindi Mayuge 5. Mixed 38
Total 1,235

Socio-economic Baseline Survey, Uganda
National Fisheries Resources Research Institute, 2006
106
Appendix 2: Beach Level Questionnaire
This Questionnaire is critical to both an understanding of the beach and to the calculations of the number of stakeholders represented by the main survey of individuals. It is to be completed by the Team Leaders for every beach covered. Information will be gathered through interviews with key respondents (those best placed to answer the Questions) and their responses should be cross-checked through direct observation and additional interviews. This does not have to filled in with a single respondent: go to whoever is reported to know best. Name of Beach
Beach Type Code
District
Date Started / /2005
Date Ended / /2005
Beach Type Code: [1] NP-O [2] NP-M [3] Tilapia [4] Dagaa [5] Mixed
Fisheries related activities
Is there anyone at this beach who is employed for most of their time in repairing or making fishing boats?
Y/N
If Y, how many people are employed in this way? No.
Is there anyone at this beach who is employed for most of their time in repairing or making fishing gear?
Y/N
If Y, how many people are employed in this way? No.
Are there any other people directly employed in supplying the fishing industry (e.g. ice makers etc….)
Y/N
If Y, please list:
No.
No.
What post-harvest activities take place at this beach or are associated with it nearby?.
Landed by fishers
Landed by collector
boats
Trade in Fresh form
Processing
Drying Smoking Frying Salting
Nile perch
Tilapia
Dagaa
Other species
Numbers of Traders and Processors How many people make a living at this beach by:
Processing only
Trading only
Trading and Processing
Nile perch
Tilapia
Dagaa

Socio-economic Baseline Survey, Uganda
National Fisheries Resources Research Institute, 2006
107
Seasonal Prices of fish Only complete for those items regularly traded at this beach. Give price paid by traders (not local consumers).
Form Unit Code or Other
Typical Prices
Highest Prices
Lowest Prices
Kgs per Unit
Shs/Unit Shs/Unit Shs/Unit
NP Fresh
Tilapia Fresh
Dagaa Fresh
NP Smoked
Tilapia Smoked
Dagaa Smoked
NP Salted
NP Sun dried
Tilapia Sun dried
Dagaa Sun dried
Tilapia Fried
Unit code: [1] Kg [2] Bags [3] Baskets [4] Whole fish
Boat ownership What is the largest number of boats owned by anyone at this beach? No.
Do they own boats at other beaches as well? Y/N
Social facilities It is important that these questions are answered in relation to the “beach community”, i.e. the closest community to the beach. Location of closest social facilities Type of social facility Functioning
Code Location
Code Operator
Code
Dispensary
Clinic
Hospital
Primary school
Secondary school
Community Hall
Functioning Code [1] Always [2] Sometimes [3] Never Location Code [1] Within this village [2] Another village nearby [3] This Location/Ward/Sub-County [4] This District Operator Code [1] Govt, [2] Voluntary Agency (e.g. mission, NGO) [3] Private for profit
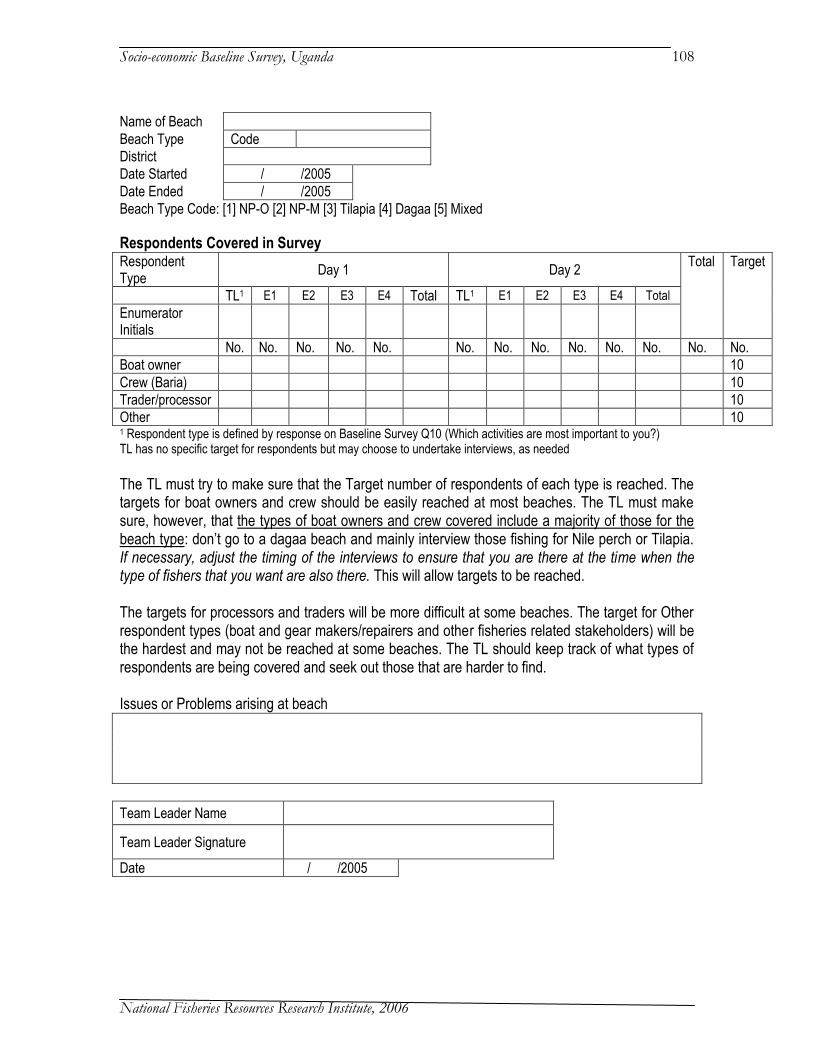
Socio-economic Baseline Survey, Uganda
National Fisheries Resources Research Institute, 2006
108
Name of Beach
Beach Type Code
District
Date Started / /2005
Date Ended / /2005
Beach Type Code: [1] NP-O [2] NP-M [3] Tilapia [4] Dagaa [5] Mixed
Respondents Covered in Survey Respondent Type
Day 1 Day 2 Total Target
TL1 E1 E2 E3 E4 Total TL1 E1 E2 E3 E4 Total
Enumerator Initials
No. No. No. No. No. No. No. No. No. No. No. No. No.
Boat owner 10
Crew (Baria) 10
Trader/processor 10
Other 10 1 Respondent type is defined by response on Baseline Survey Q10 (Which activities are most important to you?) TL has no specific target for respondents but may choose to undertake interviews, as needed
The TL must try to make sure that the Target number of respondents of each type is reached. The targets for boat owners and crew should be easily reached at most beaches. The TL must make sure, however, that the types of boat owners and crew covered include a majority of those for the beach type: don’t go to a dagaa beach and mainly interview those fishing for Nile perch or Tilapia. If necessary, adjust the timing of the interviews to ensure that you are there at the time when the type of fishers that you want are also there. This will allow targets to be reached. The targets for processors and traders will be more difficult at some beaches. The target for Other respondent types (boat and gear makers/repairers and other fisheries related stakeholders) will be the hardest and may not be reached at some beaches. The TL should keep track of what types of respondents are being covered and seek out those that are harder to find. Issues or Problems arising at beach
Team Leader Name
Team Leader Signature Date / /2005

Socio-economic Baseline Survey, Uganda
National Fisheries Resources Research Institute, 2006
109
Appendix 3: Socio-economic Baseline Survey Questionnaire
SECTION I - ALL RESPONDENTS
Demographic, occupational, educational and residential status
Q1 Respondent Name
Q2 Ethnic group (Text)
Q3 Where were you born? Code
Code: [1] Within this village [2] Another village nearby [3] This Location/Ward/Sub-County [4] This District [5] Other District [6] Other Country
Activities Is respondent involved?(Y/N)
Q4 Owns or Rents-in a Boat Y/N
Q5 Crew member Y/N
Q6 Trades or Processes fish Y/N
Q7 Other fisheries related activity [specify] Text
Q10. Which of these activities is most important to you? Code
[1] Boat owner [2] Crew member [3] Fish processor or trader [5] Other
Sex (M/F) Marital Status (Code)
Age (Years)
Education Level
(Code)
Q11 Respondent (R)
Q12 If R not Household head, give details of Household Head (HHH)
Marital code: [1] Single [2] Married [3] Separated [4] Widow/er Education code : [1] No education [2] Incomplete primary [3] Complete primary [4] Incomplete secondary
[5] Completed Secondary [6] Higher
Q13 Relationship of R to HHH
[1] R is HHH [2] Husband/wife HHH [3] Son [4] Daughter [5] Brother [6] Sister [7] Other relative [8] Not related
How many people in
your household
How many dependents do you have?
How many are involved
in fishing
Dependent on R (No.)
How many are here (No.)
Q14 Adult males (18+)
Q15 Adult females (18+)
Q16 Male Children
Q17 Female Children
Note: “here” means at the place you stay when you are working at the beach
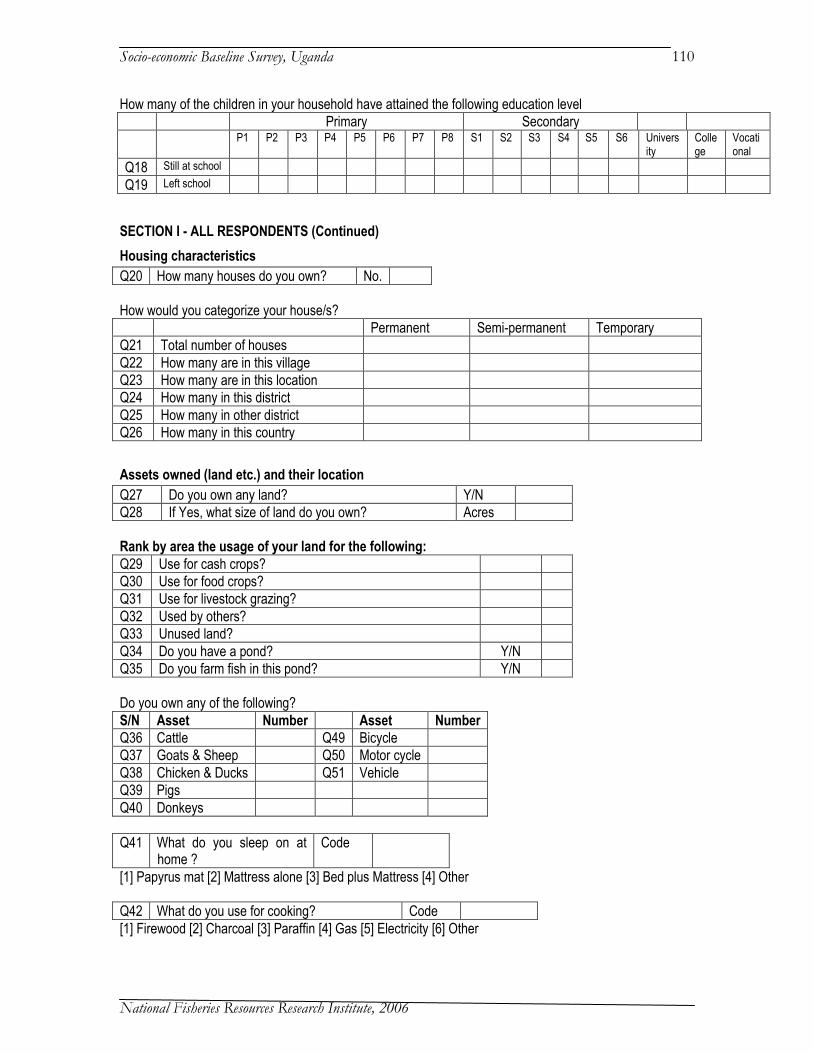
Socio-economic Baseline Survey, Uganda
National Fisheries Resources Research Institute, 2006
110
How many of the children in your household have attained the following education level
Primary Secondary
P1 P2 P3 P4 P5 P6 P7 P8 S1 S2 S3 S4 S5 S6 University
College
Vocational
Q18 Still at school
Q19 Left school
SECTION I - ALL RESPONDENTS (Continued)
Housing characteristics
Q20 How many houses do you own? No.
How would you categorize your house/s?
Permanent Semi-permanent Temporary
Q21 Total number of houses
Q22 How many are in this village
Q23 How many are in this location
Q24 How many in this district
Q25 How many in other district
Q26 How many in this country
Assets owned (land etc.) and their location
Q27 Do you own any land? Y/N
Q28 If Yes, what size of land do you own? Acres
Rank by area the usage of your land for the following:
Q29 Use for cash crops?
Q30 Use for food crops?
Q31 Use for livestock grazing?
Q32 Used by others?
Q33 Unused land?
Q34 Do you have a pond? Y/N
Q35 Do you farm fish in this pond? Y/N
Do you own any of the following?
S/N Asset Number Asset Number
Q36 Cattle Q49 Bicycle
Q37 Goats & Sheep Q50 Motor cycle
Q38 Chicken & Ducks Q51 Vehicle
Q39 Pigs
Q40 Donkeys
Q41 What do you sleep on at home ?
Code
[1] Papyrus mat [2] Mattress alone [3] Bed plus Mattress [4] Other
Q42 What do you use for cooking? Code
[1] Firewood [2] Charcoal [3] Paraffin [4] Gas [5] Electricity [6] Other

Socio-economic Baseline Survey, Uganda
National Fisheries Resources Research Institute, 2006
111
Financial assets
Q43 Do you have a bank account? Y/N
Q44 Where is the bank? Code
Code: [1] Within this village [2] Another village nearby [3] This L/W/SC [4] This District [5] Other District [6] Other Country
Q45a Is there a savings scheme operated outside of a bank to which you could have access
Y/N
Q45b If Yes, do you belong to it? Y/N
Q45c If Yes, what type of savings scheme is this? Code
Q46 If No, would you use such a scheme if it were available
Y/N
Saving Scheme Code: [1] Run by local people for themselves [2] NGOs [3] Other financing institutions (4) Not applicable
SECTION I - ALL RESPONDENTS (Continued)
Overall livelihood activities
Which income-earning activities in which you are involved makes a contribution to your household?
Activity Number of Months in the yr.
Rank of Income
Q47 Fishing income from boats and gear owned
Q48 Fishing employment (wages and salaries)
Q49 Fish trading & processing
Q50 Net making or repairing
Q51 Boat building and repairing
Q52 Non-fishing employment (wages and salaries)
Q53 Trading in other food commodities
Q54 Trading in non-food items
Q55 Farming (Crops and Horticulture)
Q56 Livestock Farming
Q57 Remittances or Transfer payments
Q58 Rental income
Q59 Other
Note: Only rank those activities which are undertaken by the household
Health status
How many members of your household suffered from the following diseases in the last year:
Q60 Malaria No.
Q61 Bilharzia No.
Q62 Tuberculosis No.
Q63 Convulsions No.
Q64 HIV/AIDS No.
Q65 Diarrhoea No.
Q66 Typhoid No.
Q67 Cholera No.
Q68 What is the main source of your drinking water for use at home?
Code
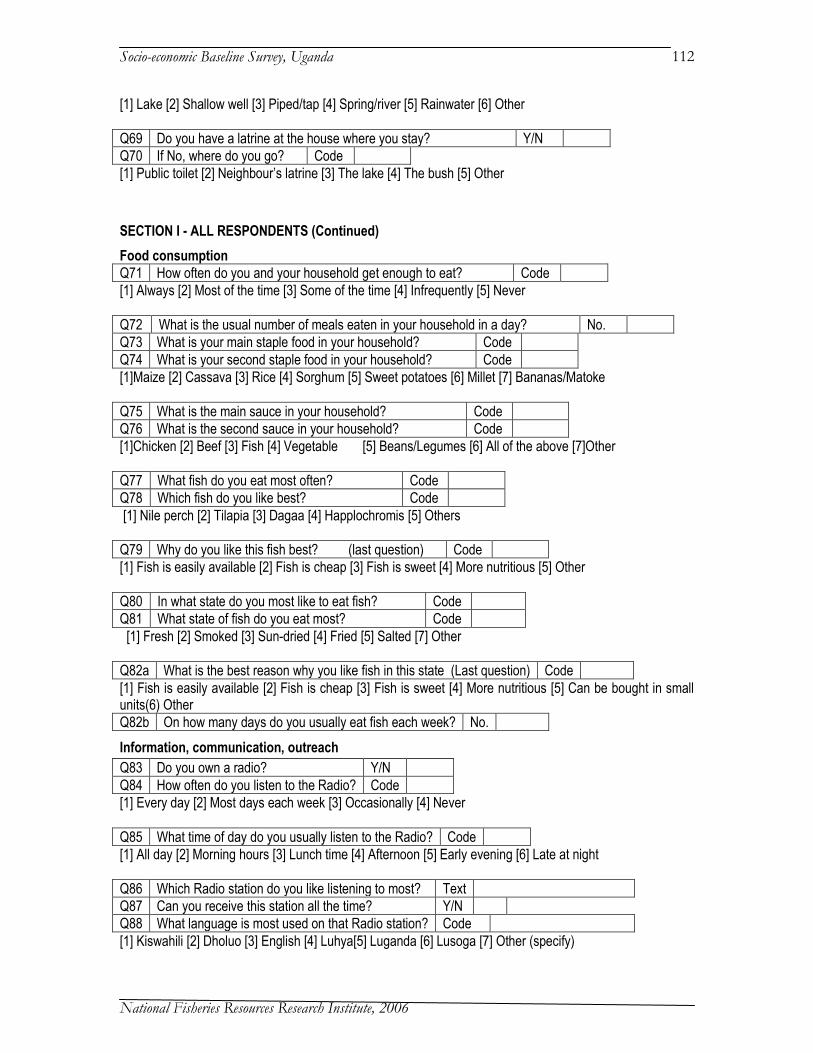
Socio-economic Baseline Survey, Uganda
National Fisheries Resources Research Institute, 2006
112
[1] Lake [2] Shallow well [3] Piped/tap [4] Spring/river [5] Rainwater [6] Other
Q69 Do you have a latrine at the house where you stay? Y/N
Q70 If No, where do you go? Code
[1] Public toilet [2] Neighbour’s latrine [3] The lake [4] The bush [5] Other
SECTION I - ALL RESPONDENTS (Continued)
Food consumption
Q71 How often do you and your household get enough to eat? Code
[1] Always [2] Most of the time [3] Some of the time [4] Infrequently [5] Never
Q72 What is the usual number of meals eaten in your household in a day? No.
Q73 What is your main staple food in your household? Code
Q74 What is your second staple food in your household? Code
[1]Maize [2] Cassava [3] Rice [4] Sorghum [5] Sweet potatoes [6] Millet [7] Bananas/Matoke
Q75 What is the main sauce in your household? Code
Q76 What is the second sauce in your household? Code
[1]Chicken [2] Beef [3] Fish [4] Vegetable [5] Beans/Legumes [6] All of the above [7]Other
Q77 What fish do you eat most often? Code
Q78 Which fish do you like best? Code
[1] Nile perch [2] Tilapia [3] Dagaa [4] Happlochromis [5] Others
Q79 Why do you like this fish best? (last question) Code
[1] Fish is easily available [2] Fish is cheap [3] Fish is sweet [4] More nutritious [5] Other
Q80 In what state do you most like to eat fish? Code
Q81 What state of fish do you eat most? Code
[1] Fresh [2] Smoked [3] Sun-dried [4] Fried [5] Salted [7] Other
Q82a What is the best reason why you like fish in this state (Last question) Code
[1] Fish is easily available [2] Fish is cheap [3] Fish is sweet [4] More nutritious [5] Can be bought in small units(6) Other
Q82b On how many days do you usually eat fish each week? No.
Information, communication, outreach
Q83 Do you own a radio? Y/N house
Q84 How often do you listen to the Radio? Code
[1] Every day [2] Most days each week [3] Occasionally [4] Never
Q85 What time of day do you usually listen to the Radio? Code house
[1] All day [2] Morning hours [3] Lunch time [4] Afternoon [5] Early evening [6] Late at night
Q86 Which Radio station do you like listening to most? Text
Q87 Can you receive this station all the time? Y/N
Q88 What language is most used on that Radio station? Code
[1] Kiswahili [2] Dholuo [3] English [4] Luhya[5] Luganda [6] Lusoga [7] Other (specify)

Socio-economic Baseline Survey, Uganda
National Fisheries Resources Research Institute, 2006
113
Q89 Have you ever heard a programme about fisheries on the radio? Y/N
What time do you prefer to receive information on fisheries on the radio
[1] All day [2] Morning hours [3] Lunch time [4] Afternoon [5] Early evening [6] Late at night
Q90 Do you own a TV? Y/N
Q91 How often do you watch TV? Code
[1] Every day [2] Most days each week [3] Occasionally [4] Never
Q92 How often do you read newspapers? Code house
[1] Every day [2] Most days each week [3] Occasionally [4] Never
Q93 What is the best way of getting information about fisheries to you? Code
[1] Brochures [2] Billboards [3] Newspapers [4] Radio [5] TV [6] Meetings/Barazas
SECTION I – ALL RESPONDENTS
Fisheries management
Q94 Do you have a Fisheries Officer at your landing? Y/N
Q95 How often is your beach visited by Fisheries Officers in a year ? code
[1] [2] Weekly [3] Monthly [4] Quartely [5] Not visited
Q96 Have you ever been provided with information on fisheries? Y/N
If Yes, what areas have you received information on:
Q97 Fisheries laws and regulations Y/N
Q98 Fishing gears and methods Y/N
Q99 Size of fish to be harvested Y/N
Q100 Sanitation Y/N
Q101 Environmental protection Y/N
Q102 BMUs Y/N
Q103 Fish handling and processing Y/N
Q104 Fish marketing Y/N
Q105 Fish business management Y/N
Q106 Other (specify) Y/N
Q107a Are you a member of a fishermen’s or traders’ organization?
Y/N
Q107b Is there a BMU at your beach Y/N
Q107c When was it formed? Year
Q107d Are you a member? Y/N
Q107e How many meetings of the BMU Assembly have you attended over the last year?
No.
How do you support the organization?
Q107f Attend meetings Y/N
Q108 Contribute fish Y/N
Q109 Contribute cash Y/N

Socio-economic Baseline Survey, Uganda
National Fisheries Resources Research Institute, 2006
114
Expenditure Rank how you use your income from the fishery activities
Items Rank
Q110 Food
Q112 Education
Q113 Clothing
Q114 Health care
Q115 Shelter
Q116 Bank
Q117 Investment [specify] _______________
Q118 Leisure
Q119 Other [specify]____________________
SECTION II - BOAT OWNERS (and Rent-in) ONLY
Fishing assets owned
Boats
Ownership Code
Boat Type Code
Propulsion Type Code
Main Target Species
Q120 Boat 1
Q121 Boat 2
Q122 Boat 3
Ownership Code [1] Owned [2] Rented-in Boat code: [1] Sesse – Pointed [2] Sesse – Flat [3] Parachute [4] Dugout [5] Raft [6] Other Propulsion code: [1] Inboard [2] Outboard [3] Paddle [4] Sail Target Species code: [1] Nile perch [2] Tilapia species [3] Dagaa [4] Other species
Q123 How many other boats do you own? No.
Gears owned (Code)
Total No.
Gear Code [1] Gillnets
Q124 [2] Long Line
Q125 [3] Beach/Boat seine
Q126 [4] Cast net
Q127 [5] Hook and line
Q128 [6] Traps
[7] Lift nets [8] Small seines [9] Scoop nets
[10] Others To what extent is your choice of boats and gears based on the following?
Code
Q129 Costs
Q130 Risks
Q131 Income from fishing

Socio-economic Baseline Survey, Uganda
National Fisheries Resources Research Institute, 2006
115
Q132 Skills required
[1] Low [2] Medium [3] High
Q133 Do you usually go fishing with your boat? Y/N
Q134 Do you use crew (barias)? Y/N
Q135 What do you consider as the most important factor in choosing your crews/barias? code
Crew choice: [1] Skilled at fishing [2] Reliable/trustworthy [3] Relative [4] Other (5) Do not choose
Q136 Who are the main buyers of your fish? Code
[1] Consumers [2] Local traders [3] Artisanal processor [4] Factory agents/Industrial processors Where does R’s boat fish throughout the year and what species do they catch?.
Jan Feb Mar Apr May Jun Jul Aug Sep Oct Nov Dec
Q136 Location
Q137 Target Species
Location: [1] This beach [2] Other beach Target Species code: [1] Nile perch [2] Tilapia species [3] Dagaa [4] Other species
SECTION III - CREW (BARIAS) ONLY
Barias/Crews only
Q138 What type of boat are you working on at the moment? Code Code
Boat code: [1] Sesse – Pointed [2] Sesse – Flat [3] Parchute [4] Dugout [5] Raft [6] Other
Q139 Does this boat have an outboard engine? Y/N
Q140 What type of species have you mainly been catching? Code
Target Species code: [1] Nile perch [2] Tilapia species [3] Dagaa [4] Other species
Q141 How long have you been working as a crew member? Years
Q142 Is the owner of the boat a relative of yours? Y/N
Q143 How long have you been working on this boat? Months
Q144 How many other members are there in the crew? No.
Q145 How are you paid for your work on this boat? Code
[1] Wage (Fixed) [2] Share %
Q146 If wage, how much do you get each week? Shs
Q147 If Share %, are fishing costs deducted before the crew gets a share? Y/N
Q148 If costs are deducted, what is the % share going to the crew of the money that remains? %
Q149 If costs are not deducted, what is the % share going to the crew? %
Q150 Is the crew % divided equally between all crew members? Y/N
Q151 How often do you get fish to eat in addition as this payment? No.
[1] Always [2] Sometimes [3] Never
Q152 Have you worked on any other boat in the last year? Y/N
Q153 If Y, how many other boats? No.
Q154 How many beaches have you worked on in the last year? No.

Socio-economic Baseline Survey, Uganda
National Fisheries Resources Research Institute, 2006
116
Q155 Were there any times in the last year you wanted to work but could not get it? Y/N
Q156 If Y, how frequently do you have problems with getting work compared to previous years? Code
[1] More often than before [2] Same as before [3] Less than before
SECTION IV - FISH TRADERS AND PROCESSORS ONLY
Fish trading/processing
Q157 What do you do? Code
[1] Processing only [2] Trading only [3] Processing and trading
Fish processing Sub-section
Q158 Which fish species do you process mostly? Code
[1] Nile perch [2] Tilapia [3] Dagaa [4] Other
Q159 What fish product form do you process mostly? Code
[1] Fresh [2] Smoked [3] Sun-dried [4] Fried [5] Salted [6] Other
Q160a Which processing assets do you own? Code
[1] Smoking kiln [2] Drying racks [3] Stove (Jiko) [4] Other (specify)
Q160b If you dry dagaa, where do you dry it? Code
[1] Sand [2] Soil [3] Rocks [4] Nets [5] Concrete slab [6] Drying rack [7] Other
Q161 Where do you store your fish? Code
[1] In the house [2] Separate store at your home [3] At the beach (4) Other
What amount of fish you sell each day most of the time?
Units No. of units
Q162 Nile perch
Q163 Tilapia
Q164 Dagaa
Q165 Others
Unit code: [1] Kg [2] Bags [3] Baskets [4] Whole fish
Do you use these materials for processing fish Y/N Availability of material
Q166 Wood
Q167 Salt
Q168 Oil
Q169 Other [specify]
Availability code: [1] Always [2] Most of the time [3] Some of the time [4] Infrequently [5] Never
Fish trading Sub-section
Q170 Which fish species do you deal in mostly? Code
Code:[1] Nile perch [2] Tilapia [3] Dagaa [4] Other
Q171 What fish product form do you deal in mostly? Code

Socio-economic Baseline Survey, Uganda
National Fisheries Resources Research Institute, 2006
117
Code: [1] Fresh [2] Smoked [3] Sun-dried [4] Fried [5] Salted [6] Other
Q172 Who do you buy from? Code
Code: [1] Fishermen [2] Other traders [3] Fish agents [4] Other
Q173 To whom do you sell fish? Code
Code: [1] Traders [2] Fish Factories [3] Consumers [3] Other
Q174 Where do you sell fish? Code
Code: [1] Within this village [2] Another village nearby [3] This L/W/SC [4] This District [5] Other District [6] Other Country
Q175 How far is the market where you sell? Code
Code: [1] < 5 Km [2] 6-20 Km [3] 21-50 Km [4] >50 Km
SECTION IV - FISH TRADERS AND PROCESSORS ONLY (Continued)
Q176 With what means do you mostly transport fish to market? Code
[1] On foot [2] Own bicycle [3] Hired bicycle [4] Public vehicle [5] Own vehicle [6] Hired truck/ vehicle [7] Donkey [8] Boat [9] Rail [10] Other How often are the following statements true?
Q177 There aren’t enough fish to buy Code
Q178 I can’t sell all the fish that I have bought Code
Q179 I can’t afford to buy the fish available Code
Q180 I can’t get enough ice Code
[1] Always [2] Most of the time [3] Some of the time [4] Infrequently [5] Never [6] Not relevant Indicate the low and high fish trading months
Start
Month End Month
Q181 High season Code
Q182 Low season Code
Month Codes: [1] Jan [2] Feb [3] Mar [4] Apr [5] May [6] Jun [7] Jul [8] Aug [9] Sep [10] Oct [11] Nov [12] Dec
Give information on the average quantity of fish you deal on in low (L) and high (H) seasons?
Fish species Code
Product form Code
Low Season High Season
Trips to market per
week
Quantity of fish per trip
Trips to market per
week
Quantity of fish per trip
No. of trips Unit Code
No. of units
No. of trips Unit Code
No. units
Q182
Q183
Q184
Fish species code: [1] Nile perch [2] Tilapia [3] Dagaa [4] Other
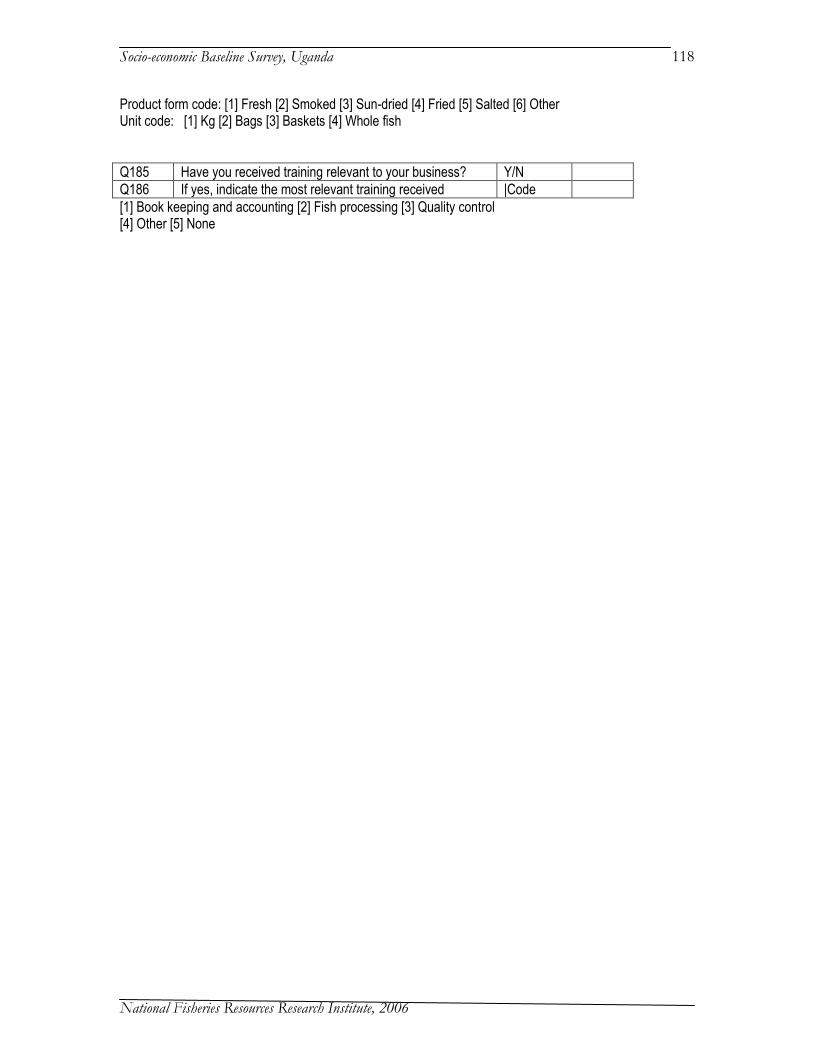
Socio-economic Baseline Survey, Uganda
National Fisheries Resources Research Institute, 2006
118
Product form code: [1] Fresh [2] Smoked [3] Sun-dried [4] Fried [5] Salted [6] Other Unit code: [1] Kg [2] Bags [3] Baskets [4] Whole fish
Q185 Have you received training relevant to your business? Y/N
Q186 If yes, indicate the most relevant training received |Code
[1] Book keeping and accounting [2] Fish processing [3] Quality control [4] Other [5] None