socio-economic benefits of space utilization final … · across the major application domains of...
TRANSCRIPT

SOCIO-ECONOMIC BENEFITS OF SPACE UTILIZATION
FINAL REPORT
PREPARED BY EUROCONSULT FOR
THE CANADIAN SPACE AGENCY
CSA FILE No. 9F001-20170676
September 7th, 2018

EUROCONSULT FOR THE CSA
SOCIO-ECONOMIC BENEFITS OF SPACE UTILIZATION | FINAL REPORT 1 |
CONTACT DETAILS
PROJECT MANAGER Adam Keith, Principal Advisor
ADDRESS 465 Rue McGill, suite 1103, Montréal, QC.
PHONE 514 377 7709
EMAIL [email protected]
Socio-Economic Benefits of Space Utilization - Final Report.
Cat no : ST99-66/2019E-PDF
ISBN : 978-0-660-32351-0
© Her Majesty the Queen in Right of Canada, as represented by the Minister of Innovation, Science and Economic Development Canada, 2019.

EUROCONSULT FOR THE CSA
SOCIO-ECONOMIC BENEFITS OF SPACE UTILIZATION | FINAL REPORT 2 |
EUROCONSULT FOR THE CSA
CONTENTS
EXECUTIVE SUMMARY ................................................................................................................................ 7
1. INTRODUCTION ................................................................................................................................ 12
PROJECT BACKGROUND ..................................................................................................................................... 12
STUDY TASKS ........................................................................................................................................................... 12
CONSULTATION PROCESS (TASK 3)............................................................................................................... 13
SELECTION OF TOPICS ......................................................................................................................................... 14
2. CANADA BENEFITS AND UTILIZATION BENCHMARKING ......................................................... 16
BENEFITS DISCUSSED DURING STUDY ANALYSIS .................................................................................... 16
SELECTIVE QUANTITATIVE BENEFITS ............................................................................ 16
SELECTIVE QUALITATIVE BENEFITS ............................................................................... 18
KEY AREAS FOR FUTURE GROWTH ................................................................................................................ 19
SOLUTIONS UTILIZED ........................................................................................................................................... 21
IMAGERY (EARTH OBSERVATION) ................................................................................. 21
2.3.1.1 Current solutions........................................................................................................... 21
2.3.1.2 Future solutions ............................................................................................................ 22
2.3.1.3 Alternatives ................................................................................................................... 22
SATELLITE COMMUNICATIONS ..................................................................................... 23
2.3.2.1 Current solutions........................................................................................................... 23
2.3.2.2 Future solutions ............................................................................................................ 23
2.3.2.3 Alternatives ................................................................................................................... 24
SATELLITE NAVIGATION ................................................................................................ 24
2.3.3.1 Current solutions........................................................................................................... 24
2.3.3.2 Future solutions ............................................................................................................ 25
2.3.3.3 Alternatives ................................................................................................................... 25
POTENTIAL BLOCKAGES TO FUTURE GROWTH ........................................................................................ 25
IMAGERY (EARTH OBSERVATION) ................................................................................. 25
SATELLITE COMMUNICATIONS ..................................................................................... 26
SATELLITE NAVIGATION ................................................................................................ 26
3. UTILIZATION AND BENEFITS BY TOPIC ........................................................................................ 27
DISASTER MANAGEMENT UTILIZATION AND BENEFITS REVIEW....................................................... 27
LITERATURE REVIEW OF APPLICATON UTILIZATION ..................................................... 28
3.1.1.1 Satellite Communications ............................................................................................. 28
3.1.1.2 Imagery (Earth Observation) ......................................................................................... 30

EUROCONSULT FOR THE CSA
SOCIO-ECONOMIC BENEFITS OF SPACE UTILIZATION | FINAL REPORT 4 |
3.1.1.3 Satellite navigation ........................................................................................................ 31
SELECTIVE BENEFITS TO DISASTER MANAGEMENT IN CANADA ................................... 32
3.1.2.1 Effective flood management ......................................................................................... 33
3.1.2.2 Benefiting from the International Charter, Space and Major Disasters ....................... 33
3.1.2.3 Supporting international relief efforts .......................................................................... 34
3.1.2.4 Taking the “Search” out of Search and Rescue ............................................................. 35
SOLUTIONS UTILIZED IN CANADA ................................................................................. 36
3.1.3.1 Satellite Solutions .......................................................................................................... 36
3.1.3.2 Alternatives ................................................................................................................... 37
3.1.3.3 Potential blockages to future growth ........................................................................... 37
AGRICULTURE UTILIZATION AND BENEFITS REVIEW ............................................................................. 38
LITERATURE REVIEW OF APPLICATON UTILIZATION ..................................................... 39
3.2.1.1 Satellite Communications ............................................................................................. 39
3.2.1.2 Imagery (Earth Observation) ......................................................................................... 40
3.2.1.3 Satellite Navigation ....................................................................................................... 41
SELECTIVE BENEFITS TO AGRICULTURE IN CANADA ..................................................... 42
3.2.2.1 Improved land management ........................................................................................ 43
3.2.2.2 Enabling precision farming through Satnav .................................................................. 43
3.2.2.3 New imagery solution supporting precision agriculture ............................................... 45
3.2.2.4 Supporting farming practises ........................................................................................ 46
3.2.2.5 Supporting national policy and farming regulations ..................................................... 48
SOLUTIONS UTILIZED IN CANADA ................................................................................. 49
3.2.3.1 Satellite Solutions .......................................................................................................... 49
3.2.3.2 Alternatives ................................................................................................................... 49
3.2.3.3 Potential blockages to future growth ........................................................................... 50
AIR TRAFFIC MANAGEMENT UTILIZATION AND BENEFITS REVIEW ................................................. 51
LITERATURE REVIEW OF APPLICATON UTILIZATION ..................................................... 51
3.3.1.1 Satellite Communications ............................................................................................. 51
3.3.1.2 Imagery (Earth Observation) ......................................................................................... 52
3.3.1.3 Satellite navigation ........................................................................................................ 53
SELECTIVE BENEFITS TO AIR TRAFFIC MANAGEMENT IN CANADA .............................. 54
3.3.2.1 Reduction of CO2 emission per flight ........................................................................... 54
3.3.2.2 Air traffic augmentation over Canada........................................................................... 55
3.3.2.3 Enabling more efficient airline routes. ......................................................................... 56
EUROCONSULT FOR THE CSA
SOCIO-ECONOMIC BENEFITS OF SPACE UTILIZATION | FINAL REPORT 5 |
3.3.2.4 Passenger safety enhancement .................................................................................... 56
3.3.2.5 Airlines improved cost-efficiency .................................................................................. 56
3.3.2.6 Remembering the role of GNSS .................................................................................... 57
SOLUTIONS UTILIZED IN CANADA ................................................................................. 58
3.3.3.1 Satellite Solutions .......................................................................................................... 58
3.3.3.2 Alternatives ................................................................................................................... 58
3.3.3.3 Potential blockages to future growth ........................................................................... 58
ENVIRONMENTAL MONITORING UTILIZATION AND BENEFITS REVIEW ........................................ 59
LITERATURE REVIEW OF APPLICATION UTILIZATION .................................................... 59
3.4.1.1 Satellite Communications ............................................................................................. 59
3.4.1.2 Imagery (Earth Observation) ......................................................................................... 60
3.4.1.3 Satellite Navigation ....................................................................................................... 61
SELECTIVE BENEFITS TO ENVIRONMENT MONITORING IN CANADA ........................... 61
3.4.2.1 Environment monitoring to support best land-use practices ....................................... 63
3.4.2.2 Recognising illegal shipping .......................................................................................... 64
3.4.2.3 Bringing efficiencies to the shipping industry ............................................................... 64
3.4.2.4 Improving weather forecasts through ARGO ................................................................ 65
3.4.2.5 Mine site rehabilitation ................................................................................................. 66
3.4.2.6 Oil shale monitoring ...................................................................................................... 67
SOLUTIONS UTILIZED IN CANADA ................................................................................. 67
3.4.3.1 Satellite Solutions .......................................................................................................... 67
3.4.3.2 Alternatives ................................................................................................................... 67
3.4.3.3 Potential blockages to future growth ........................................................................... 68
REMOTE/RURAL COMMUNITIES UTILIZATION AND BENEFITS REVIEW .......................................... 69
LITERATURE REVIEW OF APPLICATON UTILIZATION ..................................................... 70
3.5.1.1 Satellite Communications ............................................................................................. 70
3.5.1.2 Imagery (Earth Observation) ......................................................................................... 73
3.5.1.3 Satellite Navigation ....................................................................................................... 73
SELECTIVE BENEFITS TO REMOTE/RURAL COMMUNITIES IN CANADA ........................ 73
3.5.2.1 Bridging the digital divide between rural and urban Canadians .................................. 74
3.5.2.2 Support Canadian economy .......................................................................................... 76
3.5.2.3 Support Canadian Job growth ....................................................................................... 77
3.5.2.4 Improving education in northern communities ............................................................ 78
3.5.2.5 Better health through tele-medicine ............................................................................ 79
EUROCONSULT FOR THE CSA
SOCIO-ECONOMIC BENEFITS OF SPACE UTILIZATION | FINAL REPORT 6 |
SOLUTIONS UTILIZED IN CANADA ................................................................................. 79
3.5.3.1 Satellite Solutions .......................................................................................................... 80
3.5.3.2 Alternatives ................................................................................................................... 80
3.5.3.3 Potential blockages to future growth ........................................................................... 81
TRANSPORTS/LOGISTICS UTILIZATION AND BENEFITS REVIEW ....................................................... 82
LITERATURE REVIEW OF APPLICATON UTILIZATION ..................................................... 83
3.6.1.1 Maritime Logistics ......................................................................................................... 84
3.6.1.2 Land Transport .............................................................................................................. 85
3.6.1.3 Consumer Land Utilization ............................................................................................ 86
SELECTIVE BENEFITS TO TRANSPORT AND LOGISTICS IN CANADA ............................... 87
3.6.2.1 Improving maritime container utilisation ..................................................................... 88
3.6.2.2 Reducing trucks fuel consumption ................................................................................ 89
3.6.2.3 Optimization of daily routing activities for Canadians .................................................. 89
3.6.2.4 Improving vessel monitoring in Canadian waters ......................................................... 90
3.6.2.5 Support Canadian jobs creation .................................................................................... 91
3.6.2.6 Health/Fitness improvement of Canadians .................................................................. 91
SOLUTIONS UTILIZED IN CANADA ................................................................................. 92
3.6.3.1 Satellite Solutions .......................................................................................................... 92
3.6.3.2 Alternatives ................................................................................................................... 92
3.6.3.3 Potential blockages to future growth ........................................................................... 93
EUROCONSULT FOR THE CSA
SOCIO-ECONOMIC BENEFITS OF SPACE UTILIZATION | FINAL REPORT 7 |
EXECUTIVE SUMMARY
PROJECT BACKGROUND: The primary objective of the study “Socioeconomic Benefits of Space Utilization” is to quantify and qualify the socio-economic value of space and related terrestrial activities to Canadians across the major application domains of imagery (EO), satellite communications (satcom) and satellite navigation (satnav). It takes specific examples based on topic areas relevant to Canadian stakeholder needs and quantifies/qualifies as to how space utilization has provided benefits, and how these may evolve.
STUDY TASKS: The study is divided into five tasks, outlined below:
> Task 1: SELECTION OF INDICATORS AND TOPICS: To select the list of categories, topics andassociated indicators that will provide a frame for subsequent benefits analysis.
> Task 2: LITERATURE REVIEW: Provides a summary of space-asset utilization by topic. Supplies asummary of the utilization context in Canada, which is explored in detail in subsequent sections.
> Task 3: DATA COLLECTION ON CAPACITIES: Collection of information related to indicators in theselected topic areas, built primarily through interviews with third-party stakeholders andaugmented by further desk research. The task identifies benefit areas, the needs of the stakeholder,and how space-based assets have been and will be utilized to support related activities andapplications.
> Task 4: ANALYSIS OF BENEFITS AND ALTERNATIVES: Explores benefits cases for each of thetopics identified. The specific indicators identified in the first task will have been researched in task3 and economic metrics are developed and presented in the report. It will build quantitative andqualitative benefits of the indicators as to the utilization of space-based assets.
> Task 5: GROWTH: Identifies the growth potential for the reliance of the Canadian government,private sector and populations on the relevant space technologies and applications.
Much activity for the analysis performed in tasks 4 and 5 is rooted in the information collection within task 3, notably through the interview process. Once significant information is collected on an individual topic, the write-up in task 4 commenced. In addition, another level of desk research is produced to build macro-economic cases around the benefit indicator cases and the interview process. For instance, if a benefit to agriculture in Ontario is identified in the data collection phase, then further information is required to build the benefit case for the whole of Canada. In the original SoW, tasks 4 and 5, were outlined as separate items. However, from a practical and logical standpoint, it made more sense to bring these elements into the same report section in order to discuss both benefits and future growth potential together. A summary section is added, preceding the benefits assessments which brings together all benefits assessed in the study (essentially the key outputs of the study).
CONSULTATION PROCESS: The study requires a selection of at least six topics. These are chosen as they are closely linked to priority areas of the Federal Government, notably with respect to jobs and innovation, sustainable infrastructure, environment and climate change, safety and security, diversity and inclusion, and indigenous peoples. Interviews were then conducted with stakeholders, end-users and service providers related to these areas of interest. A total of 47 individuals were contacted for interviews, resulting in 23 consultations.
EUROCONSULT FOR THE CSA
SOCIO-ECONOMIC BENEFITS OF SPACE UTILIZATION | FINAL REPORT 8 |
TOPICS REVIEWED: Each of the topics are outlined in turn. Including a summary review as to how space-based assets are utilized:
> Disaster Management: In a 2015 study completed by Euroconsult for the CSA on “EnvironmentStudy for Space Utilization Strategic Plan”, Disaster Management was the first area of interestglobally, for assessed governments, in terms of utilizing space technology. Factors for this is thetopic’s applicability across satcom, satnav and Earth observation [EO]; more capable satellitesystems are able to address disaster management; and the topic is at the forefront of governmentpolicy interests
> Agriculture encompasses both government monitoring for national/regional reporting, andcommercial monitoring to support agribusiness. The sector is adapting to new farming techniquesto report on issues such as crop health, potential yield, and how to increase productivity. The“precision agriculture” sector is fast emerging, allowing farmers to use new technologies for site-specific management. These new technologies cover factors such as irrigation, use of fertilizers,identifying problematic/high performing areas. Satellites technologies are playing their role inactivities, such as GPS-enabled vehicle tracking and in the utilization of imagery.
> Air Traffic Management: As of 2016, the International Civil Aviation Organization (ICAO)estimated the total number of passengers carried over the year at 3.7 billion, projected to increaseto 7.8 billion in 2036. Space utilization closely serves air traffic control’s [ATC] three fundamentalprinciples: communication, navigation and surveillance. Its primary usage is providing satellitenavigation data through GNSS systems, feeding aircraft with precise geolocation, allowing pilotsto determine safe and efficient travel routes. Satellite-based communication links ensureconnections for data transmission between the multiple parties involved. They are also utilized toestablish contact with aircraft flying over difficult-to-cover regions of the globe, such as the oceans.
> Environments Monitoring is first considered an application for EO, however, there is also usageof low-data rate communications in collecting in-situ information on various environment variables,such as through the ARGO program, collecting data on ocean-state conditions. Climate changeremains at the top of government policy agendas, and R&D-focused space agencies globally havealigned certain activities towards the collection of data to support environments monitoring. Themain benefits are being able to support government policy on mitigating the short, medium andlong-term impacts of climate change. More localized monitoring is needed to assess activities ofpopulations and industry to measure impact they may be causing to the environment.
> Rural/Remote Communities: Broadband internet connectivity is increasingly considered as abasic universal right with governments, international institutions and the private sector havingwidely acknowledged the importance of bridging the digital divide to help foster economic growthand social inclusion. From a purely economic perspective, growth in broadband internetpenetration has been positively linked to higher economic (GDP) growth in both developed anddeveloping countries. Communications satellites have been relied upon to deliver voice and highdata rate connectivity services to communities in remote and/or low population densitygeographical locations where the costs of deploying terrestrial communications is prohibitive.
> Transport/Logistics: The Internet of Things (IoT) enables connections between everyday objects,industrial machines, and vehicles etc., changing the way people, companies or other institutionsinteract with their environment. M2M refers to low-data-rate (LDR) equipment/sensor used for assettracking, telemetry or Supervisory Control and Data Acquisition (SCADA) that are attached tocontainers, vehicles, pipelines and other fixed or mobile assets. The rise of IoT on the ground isexpected to further drive growth of satellite-based M2M/IoT terminals, enabling reliable remote
EUROCONSULT FOR THE CSA
SOCIO-ECONOMIC BENEFITS OF SPACE UTILIZATION | FINAL REPORT 9 |
connectivity for a wide range of applications, such as connected cars, fleet tracking, industrial applications, etc. A related market, leveraging geolocation data from GPS chipsets in consumer electronics, serves as a platform for the growing number of applications seeking to improve transportation, health and well-being of individuals.
CANADIAN BENEFITS
Benefits are mainly generated by primary inputs from end-users and stakeholders involved who deliver solutions leveraging space-based assets. Where there are quantitative benefits, the primary inputs may be one or more data points which can be used to estimate overall impacts across Canada. For instance, by knowing data points on a few northern communities’ broadband connectivity in Canada and then collecting wider macro-economic data and supportive information, scenarios can be built to present a Canada-wide impact estimation. Similarly, by knowing how satellite navigation is benefiting farmers in Ontario and Alberta, estimation can be made for the rest of Canada by inputting further data on cropland per province, cost-savings by crop type and so on. The description of these quantitative benefits is explained in detail in the “Benefits by Topic” section of this report. Qualitative assessments are considered of equal importance – whilst not all benefit areas may result in a numerical value, their support to wider government policy anddecision making within government departments, the well-being of Canadians, and in supporting Canadianoutreach in the international context should not be underestimated.
Quantitative benefits: are considered in terms of a direct economic value (measured in dollars) brought about by the use of satellite assets in order to bring cost-efficiencies to wider business practices, and other measurable metrics. Selected examples of quantitative benefits found for this study are commented on below:
> Disaster Management: Since its inception, the satellite communications-based COSPAS-SARSATsystem has helped save the lives of over 1,500 Canadians, and over 32,000 lives globally.
> Agriculture: Using satellite navigation (GPS) enabled farming equipment to support precisionagriculture has saved farmers $500-550 million/year in terms of improving yield, and more efficientuse of seeds, fertilizer and irrigation.
> Environment Monitoring: Over 200 oil anomalies detected by the CIS I-STOP services over 2013-2017, 39 of which were validated as discharge from ocean-going vessels.
> Rural/Remote Communities: Satellite-enabled broadband services added an estimated $2.2billion to Canada’s GDP between 2008 to 2017.
> Air Traffic Management: Reduced flight separation constraints enabled by satellite-based ADS-Bover Canadian airspace (Gander-Shanwick) allows for up to 450 liters of fuel saved per flight,representing tens of millions of dollars in cost savings annually.
> Transport/Logistics: More than 100,000 health and fitness related applications linked to GlobalNavigation Satellite Systems (GNSS) were downloaded by Canadian smartphone users in May 2018.
Qualitative benefits: Considering the range of topics addressed for this study, qualitative benefits are diverse. The benefits for environment monitoring, which are more research oriented, are very different to benefits for rural/remote communities, which are focused on populations living in such areas. Selected examples of quantitative benefits found for this study are commented on below:
> Disaster Management: SAR data was utilized to monitor and support relief efforts of the Quebec2017 flooding, supporting the Department of National Defence (DND) in their ground operations

EUROCONSULT FOR THE CSA
SOCIO-ECONOMIC BENEFITS OF SPACE UTILIZATION | FINAL REPORT 10 |
> Agriculture: Satellite-based agriculture maps are amongst the most downloaded on the Canadiangovernment open data portal. These maps go to supporting policy decision makers andagribusiness across Canada.
> Agriculture: Support to land management policies across Canada. For instance, benefits includeimproved monitoring of areas prone to flooding, better management of urban development withregards to water management and risk aversion in changing local ecosystem etc.
> Environment Monitoring: Help build realistic regulations which mining industries can follow tomitigate noise and dust levels and impacts this may have on local wildlife populations.
> Rural/Remote Communities: New satellite systems and services are significantly improving thequality, pricing and availability of broadband services, helping enable the government to meet itsnew universal broadband objectives.
> Transport/Logistics: More than 23 million Canadians are benefiting from satellite GPS applicationsto optimize routing/travel.
Areas for future growth: The future growth of benefit impacts of the indicators assessed is largely a result of the introduction of new satellite solutions which can bring greater benefits to existing or growing application areas; Growing penetration rates of existing technologies. For instance, the role of satellite navigation in precision agriculture continues to grow alongside increasing adoption within agribusiness; and, external factors to the satellite technology, such as a changing macro-economic environment. Selected examples of quantifiable growth are noted below:
> Agriculture: With respect to the use of satellite imagery in precision agriculture, <10% of Canadianfarms currently use satellite imagery to support activities. Increasing penetration rates to 25% by2027 would imply a benefit in terms of cost savings to farmers in the range of $650 million to $1.3billion depending on crop type. In addition, increased penetration of satellite navigation inprecision agriculture could lead to cost-savings of $800 million/year by 2027.
> Rural/Remote Communities: Potential to add another $2.7 billion to the Canadian economy overthe next decade through increasing broadband penetration in rural and remote regions.
> Remote/Rural Communities: The growth in broadband penetration is also expected to havefurther positive impacts on health and education. Government schemes, such as the NorthernDistance Learning Program, now incorporate 35 students from seven communities.
> Air Traffic Management: Potential cumulative reduction of 27.6 million tons of CO2 equivalentemission across Canadian controlled airspace by 2027 through the implementation of ADS-Bresulting in more efficient flight routes.
> Air Traffic Management: The anticipated growth in air traffic enabled by ADS-B translates intoaugmented revenue from fees established by NavCanada, resulting in tax payments estimated at$19 million per year by 2027.
> Transport/Logistics: An improved container utilization enabled by space-based IoT translates intoa $170 million positive impact on the Canadian maritime industry by 2025.

EUROCONSULT FOR THE CSA
SOCIO-ECONOMIC BENEFITS OF SPACE UTILIZATION | FINAL REPORT 11 |
SOLUTIONS UTILIZED
Satellite solutions detailed below reflect the primary data inputs collected through the consultation process. It would be expected that further data sets are being utilized depending on the specific needs of further end-users.
Imagery (Earth observation): There is a variety of satellite imagery being utilized depending on the specific application areas. There is some bias towards the use of RADARSAT series as it is free for the government. It is a key tool in certain applications more specific to Canada such as sea ice monitoring. There is a diversity in other 3rd party satellite solutions utilized, however budgets remain an issue. Thus, there is a tendency to use freely available datasets, such as the Landsat and Sentinel series. The main factor noted for future usage is the anticipation of a greater amount of satellite-based EO imagery becoming available. It is not necessarily a question of replacing one imagery source with another, but to augment solutions with a growing, more capable supply. Two areas are noted: the launch of RCM and the greater data collection this will bring, and how to benefit from the launch of low-cost commercial imagery constellations. High revisit constellations such as Planet are expected to help develop further application areas by offering increased access to cloud free data, and data acquisition at much higher frequency. There is also the question as to how all of this data will be managed in the future. Automation is expected to play a greater role, as is the role of artificial intelligence in being able to provide predictive analytics.
Satellite communications: Focuses on three different areas: satellite broadband is the main supporting satellite tool to connect rural and remote communities; low-data rate technology to support the transmission of data from ARGO floats, and from COSPAS-SARSAT beacons as well as enabling transmission to support IoT; and data relay of ADS-B signals which utilize GPS to transmit the position of an aircraft. Broadband is mostly based on fixed satellite solutions, with LEO constellations expected to add to capacity in the near future. Low data rate transmission utilizes payloads on satellites operating in various orbits. The next generation of HTS systems is expected to further decrease cost of broadband and increase available throughput over Canada which will be able to support rural and remote communities. Quality of service is also expected to improve: new projects from Telesat, Oneweb and SpaceX plan to offer uniform high-speed, low latency broadband services to consumers in rural and remote areas. The connectivity of objects, alternately known as IoT, is considered a fast-emerging area with Canadian companies involved in solutions and space infrastructure development. Several new satellite constellations are expected to potentially emerge including Canadian start-ups Helios Wire and Kepler Communications.
Satellite navigation: Satellite navigation depends on the use of global networks of satellites to triangulate positions: a global navigation satellite system (GNSS). The U.S. Air Force operated Global Positioning System, or GPS, being the most utilized network for civil and commercial purposes. The Russian, GLONASS; and Chinese BeiDou systems are more locally used (and also by respective governments), and the European, Galileo system is expected to be fully operational by 2020. ADS-B technology relies on GNSS to collect positioning data of aircraft which is then transmitted to Earth via data relay. In Canada, the U.S. GPS is almost exclusively the GNSS network utilized to support ranging applications, from personal navigation devices to defense, to enabling aircraft ATC and supporting precision agriculture in the context of this study. ADS-B transponder technology consists of transmitters and receivers equipped on aircraft. It relays real-time information via satellite communications of the transmitting airplanes. The ADS-B data distribution system relies on GNSS satellites as its core input. Such systems are now entering the market, for example, Aireon, with payloads being carried on the Iridium NEXT constellation. It will be fully operational once the remaining Iridium NEXT satellites are launched in 2018.

EUROCONSULT FOR THE CSA
SOCIO-ECONOMIC BENEFITS OF SPACE UTILIZATION | FINAL REPORT 12 |
1. INTRODUCTION
PROJECT BACKGROUND
The primary objective of the study “Socioeconomic Benefits of Space Utilization” is to quantify and qualify the socio-economic value of space and related terrestrial activities to Canadians in the major application domains of Earth Observation (EO), satellite communications (satcom) and satellite navigation (satnav). It takes specific examples based on topic areas relevant to Canadian stakeholder needs and quantifies/qualifies as to how space utilization has provided benefits, and how this may evolve in the future. In this regard, the study will help provide support to decision-making on the future orientations of Canada’s national space program and sector, notably from the perspective of the Canadian Space Agency’s (CSA) mandate to help ensure that space science and technology provides social and economic benefits for Canadians.
Space is being increasingly recognized for its role as an enabler of socio-economic benefits for populations, industries/companies, governments and other stakeholders. As more solutions become available, from both government and the commercial sector, greater benefits and efficiencies are being brought to industry which support government policies, mitigate against perceived risks, as well as support aspects such as safety, security, environmental monitoring, and so on. These space asset solutions, and how they are utilized, can also bring advantages compared to current terrestrial solutions being used (cost savings, area coverage, responsiveness, redundancy etc.), representing elements that are also to be explored.
This report takes into consideration consultation with industry and subsequent recommendations for space industry and policy development in Canada, as well as produced by the Space Advisory Board [SAB], the report on the Evaluation of the Earth Observation Business Line [EOBL] from the CSA Audit and Evaluation Directorate and the changing environment of the space industry, brought about by the so-called New Space phenomena (and the vast increase in the amount of data availability which is expected to go along with it.) The study also builds on previous works conducted by Euroconsult for the CSA, in particular, “Comprehensive Socio-Economic Impact Assessment of the Canadian Space Sector”, which built scenarios on the “value” of space activities in Canada; and, the “Environmental Study for Space Utilization Strategic Plan”, which assessed space-asset utilization globally.
STUDY TASKS
The study is divided into five tasks, outlined below. The interim report was provided to the CSA following the completion of the first two tasks. The mid-term review of the study was conducted during the consultation process in Task 3. This final report follows after the completion of all tasks.
> Task 1: SELECTION OF INDICATORS AND TOPICSThe objective is to select the list of categories, topics and associated indicators that will provide aframe for subsequent benefits analysis and tasks in the study. In order to better guide the study,the supply of the proposed topics selection to the CSA is the first step as it guides the literaturereview in the next task, and the indicators that are to be based on these topics.
> Task 2: LITERATURE REVIEWThe literature review provides a summary of space-asset utilization by topic. Analysis includesgovernment and private sector utilization with a focus on space assets and data. It is divided intoseparate sections on EO, satcom and satnav, however noting that certain topics are more relevant

EUROCONSULT FOR THE CSA
SOCIO-ECONOMIC BENEFITS OF SPACE UTILIZATION | FINAL REPORT 13 |
or focused to each space application than others; thus, certain topics are more satcom-centric, others EO-centric etc. It also provides a brief summary of the utilization context in Canada, which will be explored in much greater detail in subsequent sections. Resources used to complete the literature review include external public information, disclosures from the CSA and internal Euroconsult information based on previous studies and space sector research.
> Task 3: DATA COLLECTION ON CAPACITIESThe main objective of Task 3 is the collection and organization of information related to indicatorsin the selected topic areas. It will be built primarily through interviews with third-party stakeholderswith experience in each of the respective topics and built-up by further desk research. It will identifybenefit areas, the needs of the stakeholder, and how space-based assets have been utilized tosupport related activities and applications. It will also assess how future needs may change andwhich upcoming supply is expected to be utilized (and how), in order to support later tasks. Finally,the task will explore which non-space solutions are being utilized, and the relative advantages thatspace-based assets offer.
> Task 4: ANALYSIS OF BENEFITS AND ALTERNATIVESThe main objective of Task 4 is to build benefits cases for each of the topics identified. The specificindicators identified in the first task will have been researched in task 3 and economic metrics aredeveloped in excel and presented in the report. It will build quantitative and qualitative benefits ofthe indicators as to the utilization of space-based assets. It will aim to provide clear information asto how space-assets have benefited in specific cases. In particular, how space-assets have addedfurther benefits to other adopted terrestrial solutions to provide data and perform desired tasks.Case studies as to how space utilization has benefitted topics are also envisaged.
> Task 5: GROWTHThe objective of task 5 is to identify the growth potential for the reliance of the Canadiangovernment, private sector and populations on the relevant space technologies and applications(EO, Satcom, and Satnav). Prospective growth of the topics/indicators is to be provided on a 10-year time horizon and assessed from the perspective of both social and economic benefitsconsidering quantitative and qualitative indicators assessed in prior tasks.
CONSULTATION PROCESS (TASK 3)
A key part of the information gathering, and indeed an important factor in the study success, is in gaining access to interviews with key end user stakeholders. The stakeholders are required to build out the benefits cases identified in Tasks 1 and 2, the idea being that benefits indicators explored in the initial two tasks are assessed in the second half of the study. This then forms the bulk of and analysis in tasks 3 and 4.
For the study 47 individuals were contacted for interviews. Of these 22 confirmed leading to separate consultations with results integrated into the final report delivery. This represents a 47% success rate. This is somewhat low for a government study. There was some difficulty in certain cases in being able to identify the correct individual within an organization, and also in reaching out to different groups, in some cases unknown to Euroconsult. Overall, based on Euroconsult’s prior experiences in conducting consultation campaigns on behalf of the CSA, the process has taken longer than expected. After the initial emailing there were only a handful of confirmed calls set up, necessitating some follow-up to bring further confirmations. Note also that several interviewees were helpful enough to recommend further contacts for interview.
Certain sectors were also more straightforward (such as Agriculture and Environmental Monitoring) whereas others (Transport, ATC) were more of a challenge. In these cases, the difficulties lie in being able to identify
EUROCONSULT FOR THE CSA
SOCIO-ECONOMIC BENEFITS OF SPACE UTILIZATION | FINAL REPORT 14 |
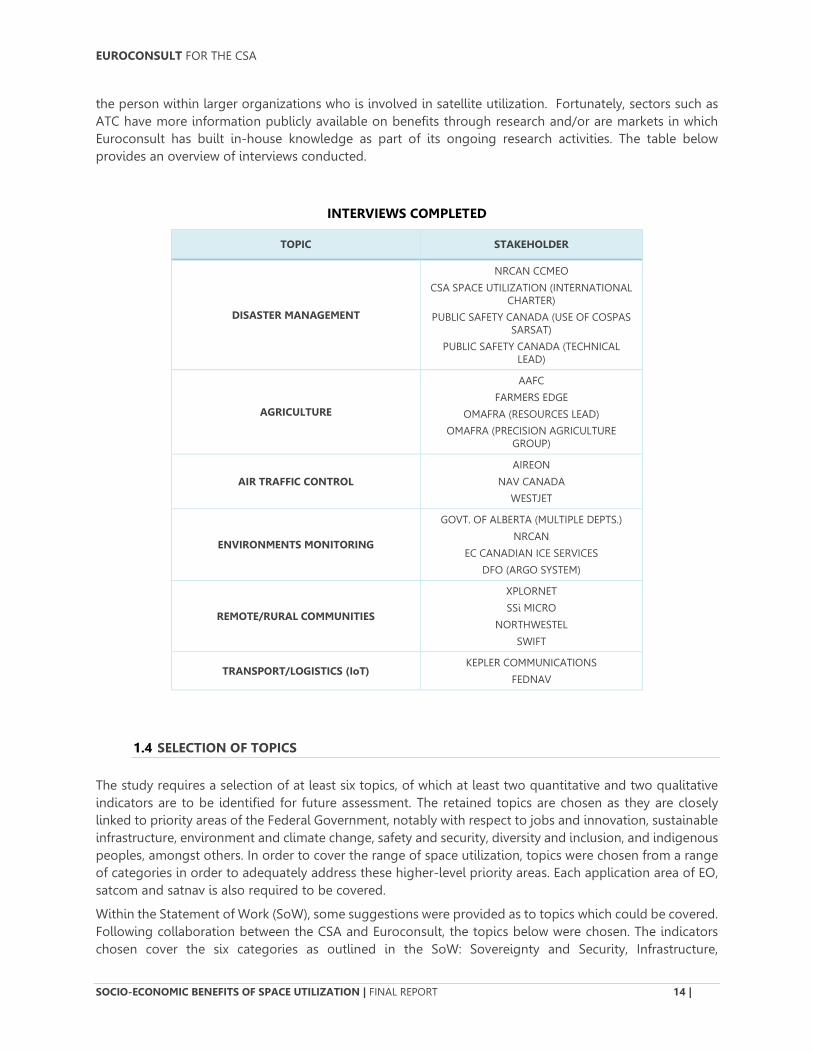
the person within larger organizations who is involved in satellite utilization. Fortunately, sectors such as ATC have more information publicly available on benefits through research and/or are markets in which Euroconsult has built in-house knowledge as part of its ongoing research activities. The table below provides an overview of interviews conducted.
INTERVIEWS COMPLETED
TOPIC STAKEHOLDER
DISASTER MANAGEMENT
NRCAN CCMEO
CSA SPACE UTILIZATION (INTERNATIONAL CHARTER)
PUBLIC SAFETY CANADA (USE OF COSPAS SARSAT)
PUBLIC SAFETY CANADA (TECHNICAL LEAD)
AGRICULTURE
AAFC
FARMERS EDGE
OMAFRA (RESOURCES LEAD)
OMAFRA (PRECISION AGRICULTURE GROUP)
AIR TRAFFIC CONTROL
AIREON
NAV CANADA
WESTJET
ENVIRONMENTS MONITORING
GOVT. OF ALBERTA (MULTIPLE DEPTS.)
NRCAN
EC CANADIAN ICE SERVICES
DFO (ARGO SYSTEM)
REMOTE/RURAL COMMUNITIES
XPLORNET
SSi MICRO
NORTHWESTEL
SWIFT
TRANSPORT/LOGISTICS (IoT) KEPLER COMMUNICATIONS
FEDNAV
SELECTION OF TOPICS
The study requires a selection of at least six topics, of which at least two quantitative and two qualitative indicators are to be identified for future assessment. The retained topics are chosen as they are closely linked to priority areas of the Federal Government, notably with respect to jobs and innovation, sustainable infrastructure, environment and climate change, safety and security, diversity and inclusion, and indigenous peoples, amongst others. In order to cover the range of space utilization, topics were chosen from a range of categories in order to adequately address these higher-level priority areas. Each application area of EO, satcom and satnav is also required to be covered.
Within the Statement of Work (SoW), some suggestions were provided as to topics which could be covered. Following collaboration between the CSA and Euroconsult, the topics below were chosen. The indicators chosen cover the six categories as outlined in the SoW: Sovereignty and Security, Infrastructure,

EUROCONSULT FOR THE CSA
SOCIO-ECONOMIC BENEFITS OF SPACE UTILIZATION | FINAL REPORT 15 |
Environment Management, Internet of Things [IoT], and remote communities. The topics chosen are sometimes groupings of multiple topics as outlined in the SoW to form more inclusive subject matter. The topics also consider the adaption of imagery (EO), satnav and satcom. Topics also consider where current and future Canadian space missions can be utilized. The table below identifies and briefly outlines the topics taken forward in this study.
SELECTED TOPIC AREAS
TOPIC SUMMARY
DISASTER MANAGEMENT
• Relating primarily to sovereignty/security category, thistopic features overlapping applications for EO, satcomand satnav. The topic covers aspects of disastermitigation, relief and search & rescue activities.
AGRICULTURE
• Within the resources category, this topic focusesprimarily on EO and satnav applications, with a particular focus on precision agriculture, although broaderutilization and benefits to general agricultural activitiesare also assessed.
AIR TRAFFIC CONTROL
• This topic, linked to the infrastructure (transportation)category, focuses more narrowly on upcoming hybridsatcom/satnav solutions, with some consideration lent to EO data utilization.
ENVIRONMENTS MONITORING
• A broader topic within the category of environmentalmanagement, environments monitoring addressesutilization of EO, satcom and satnav activities, with aparticular focus on ecosystems monitoring, icemonitoring and aspects of corporate social responsibility for industries such as oil & gas and mining.
REMOTE/RURAL COMMUNITIES
• Addressing infrastructure (internet backbone) andremote communities, this topic focuses squarely on theutilization of satellites for the provision of broadbandinternet services to remote and rural communities.
TRANSPORT/LOGISTICS (IoT)
• This catch-all topic addresses utilization of internet-of-things (IoT) connectivity through the lens oftransportation/logistics, whether at sea (maritime) orland (whether trucking or personal use). The topic isfocused on applications primarily related to satcom andsatnav, often from the perspective of hybrid solutions.
These aforementioned topics become the focus of the following study. Thus, in the first task, the literature review is focused on space utilization within these topic areas, with a specific section on utilization within Canada.
EUROCONSULT FOR THE CSA
SOCIO-ECONOMIC BENEFITS OF SPACE UTILIZATION | FINAL REPORT 16 |
2. CANADA BENEFITS AND UTILIZATION BENCHMARKING
BENEFITS DISCUSSED DURING STUDY ANALYSIS
The benefit examples summarized on the following pages are mainly based on primary inputs from end-users and stakeholders involved in the utilization of solutions based on space-based assets to support their respective activities. Where there are quantitative benefits, the primary inputs may be one or more data point which can be used to estimate overall impacts across Canada. For instance, by knowing data points on a few northern communities’ broadband connectivity in Canada and then collecting wider macro-economic data and supportive information, scenarios can be built to present a Canada-wide impact estimation. Similarly, by knowing how satellite navigation is benefiting farmers in Ontario and Alberta, estimation can be made for the rest of Canada by inputting further data on cropland per province, cost-savings by crop type and so on. The working of these quantitative benefits is explained in detail in the “Benefits by Topic” section of this report.
Qualitative assessments are considered of equal importance – whilst not all benefit areas may result in a numerical value, their support to wider government policy and decision making within government departments, the well-being of Canadians and in supporting Canadian outreach in the international context should not be underestimated. In some cases, it would be possible to turn qualitative benefits in to measured, by first instance, dollars saved/cost avoidance, however further data points which were not able to be collected through interview would be required. These benefits are certainly not exhaustive to each Topic assessed, and they are somewhat guided by the information that was able to be collected within the consultation process.
There is some bias on the maturity of certain topics and the adaption of space asset utilization within them. Topics such as agriculture and disaster management are for instance areas in which space technology is long-used. Thus, there are several current quantitative and qualitative benefit areas. Topics such as Transport and Logistics which lean to more nascent IoT technology have less developed applications and so benefits today are more limited; here there is more a focus on the potential for future benefits.
SELECTIVE QUANTITATIVE BENEFITS
Quantitative benefits are considered in terms of a direct economic value (measured in dollars) brought about by the use of satellite assets in order to bring cost-efficiencies to wider business practices, supporting and enabling wider industry creating cost-benefits through measurable cost avoidance and so on. Measurable benefits not related to dollars are related to the number of impact-situations i.e. the number of lives counted by the COSPAS-SARSAT system, or the validated number of oil spill cases brought by the I-STOP initiative.
Where there are business interests closely associated to the Topics being assessed there is also a bias towards having more quantifiable data. For instance, in being able to measure cost savings to the agriculture sector, shipping industry, enabling businesses through connectivity and so on. This is reflected in the consultation processes. Interviews with those involved in or with the private sector tend to lead to more dollar measurable quantitative indicators.

EUROCONSULT FOR THE CSA
SOCIO-ECONOMIC BENEFITS OF SPACE UTILIZATION | FINAL REPORT 17 |
SUMMARY OF SELECTIVE QUANTITATIVE BENEFITS
TYPE TOPIC BENEFIT M
EASU
RED
IN $
DM SUPPORT TO SEARCH
AND RESCUE
• The Canadian government saved $10 million/annually in search and rescueoperations due to faster searches brought about by the COSPAS-SARSATsystem
Ag IMPROVING
AGRICULTURAL PRACTICES
• Over the last five years $75 million has been saved by provincial governmentsby improving agricultural practices to prevent soil erosion using satelliteimagery.
Ag ENABLING PRECISION
AGRICULTURE
• Using satellite navigation (GPS) enabled farming equipment to supportprecision agriculture has saved farmers $500-550 million/year in terms ofimproving yield, and more efficient use of seeds, fertilizer and irrigation. A cost savings of $10-25/acre is identified in using satellite navigation to supportprecision agriculture
• A cost saving of $25-50/acre using combined satellite imagery and in-situweather data to support farming practices.
Ag OPENING NEW MARKETS • Using satellite imagery to support canola industry growing regulations opened up a $100-$200 million/year export market for Canadian farmers to the E.U.
EM INCREASED SHIPPING
EFFICIENCY
• The CIS provides ice charts in order for vessels to select the optical routes,resulting in fuel cost savings, less impact on the environment and greatershipping operations efficiencies. Even marginal gains anticipated, would implya cost saving for the shipping industry of $5-10 million during the Arcticshipping season.
RC PROVISION OF TELEMEDICINE
• Through remote telemedicine/E-health solutions, it is estimated that 9Northern communities saved $600,000 in 2017 due to solutions being solvedfrom distance, without the need to travel to a doctor or vice-versa.
RC SUPPORT CANADIAN
ECONOMY • Satellite enabled broadband households added $2.2 billion to Canada’s GDP
between 2008 to 2017.
ATC ENABLING AIR TRAVEL • Satellite-based ADS-B (and GPS) generates cost savings of tens of millions of
dollars through fuel savings enabled by reduced flight separation constraintsover key air traffic corridors.
Oth
er #
EM REPORTING ON ILLEGAL
SHIPPING • Over 200 oil anomalies detected by the CIS I-STOP services between 2013-
2017, 39 of which were validated as discharge from ocean-going vessels.
RC CONNECTING
HOUSEHOLDS & COMMUNITIES
• Over 200,000 households located in rural and remote areas of Canada areconnected to the internet by satellite. 77 indigenous communities in NorthernCanada rely solely on satellite links, which is critical for connecting households, schools, medical centers and banks to the internet and other parts of Canada.
DM BENEFITING FROM
INTERNATIONAL EFFORTS
• The Canadian government has activated the International Charter, Space andMajor Disasters 13 times, in order to receive imagery to support monitoring ofdisasters on Canadian territory
DM SUPPORTING
INTERNATIONAL RELIEF EFFORTS
• As of June 2018, the Charter has been activated 576 times. Of these activations, RADARSAT 1 and 2 data has supported approximately two-thirds of the disaster response efforts helping to mitigate the effects disasters globally
DM CANADIAN LIVES SAVED • Since its inception, the COSPAS-SARSAT system has helped save the lives ofover 1,500 Canadians, and over 32,000 lives globally
TL HEALTH/FITNESS
DOWNLOADS
• Recent surveys show more than 300,000 health and fitness relatedapplications of which a third are based/rely on GPS technology linked toGNSS were downloaded by Canadian smartphone users in May 2018
*DM, Disaster Management; Ag, Agriculture; ATC, Air Traffic Control; RC, Rural/Remote Connectivity; TL, Transport & Logistics; EM, Environment Monitoring

EUROCONSULT FOR THE CSA
SOCIO-ECONOMIC BENEFITS OF SPACE UTILIZATION | FINAL REPORT 18 |
SELECTIVE QUALITATIVE BENEFITS
Considering the differences in the Topics addressed for this study qualitative benefits are diverse. The benefit to environment monitoring, which is more research orientated, is very different to benefits for rural/remote communities in which are focused on populations living in such areas. These benefit areas can however be loosely grouped into the four areas noted in the table below. Somewhat unsurprisingly the main benefit areas are considered in supporting wider policy and other government departments. As several consultations took place with government at the federal level this would be a fair reflection of respective mandates. In speaking with government at the provincial level, there is more of a focus in supporting provincial businesses and populations. For instance, whilst AAFC produce widely utilized national-scale agriculture maps to support policy makers; Ontario Ministry for Agriculture, Forestry and Rural Affairs [OMAFRA] produces more regional land use mapping to again support policy decision making at a more localized level, as well as agribusiness within Ontario. Similarly, the Government of Alberta is looking at ways to monitor the shale oil business within the province.
SUMMARY OF SELECTIVE QUALITATIVE BENEFITS
TYPE TOPIC BENEFIT
SUP
PO
RTI
NG
PO
LIC
Y
Ag
SUPPORTING WIDER POLICY
• Satellite-based agriculture maps are amongst the most downloaded on theCanadian government open data portal. These maps go to supporting policydecision makers and agribusiness across Canada
SUPPORT LAND-USE POLICIES
• Support to land management policies across Canada. For instance, in beingable to monitor areas prone to flooding, better manage urban developmentwith regards to water management and risk aversion in changing localecosystem etc.
EM MONITORING LAND-USE
PRACTICES
• Providing policy guidelines to support wetlands production and protect itssensitive ecosystem. Monitor the impacts of man-made intrusions into thewetland ecosystem, and identify at-risk areas
EM SUPPORT REGULATIONS
FOR MINING
• Help build realistic regulation in which mining industries can follow to mitigate noise and dust levels and impacts this may have on local wildlife population. In the future, imagery is expected to be further used to support mine-siterehabilitation; pilot studies already proving effective.
EM PROTECTING WILDLIFE • Monitor environment impacts on Sable Island to support local seal and horsepopulations.
RC REACHING BROADBAND
POLICY OBJECTIVES
• New satellite systems and services are significantly improving the quality ofservice, enabling the government to reach its new universal broadbandobjective. New satellite investments should double broadband downloadspeeds for 200,000 households over the next five years.
SUP
PO
RTI
NG
O
GD
s
DM FLOOD MANAGEMENT • SAR data was utilized to monitor and support relief efforts of the Quebec 2017flooding, supporting DND in their ground operations
EM SUPPORTING GLOBAL
DATA COLLECTION
• Canada is part of the ARGO program, supporting ocean in-situ data collectionfor climate modelling. Canada operates ~85 ARGO floats, with access to datafrom over 4,000. Allowing Canada to provide better forecast models, andsupport research across the country
PO
PU
LATI
ON
&
BU
SIN
ESSE
S
DM PUBLIC ENGAGEMENT IN
DISASTER RESPONSE
• The use of the “NRCAN Observer” uses crowdsourced information to allow the public to upload data during a disaster event which can be used to validatesituations on the ground.
Ag COST-EFFECTIVE AGRIBUSINESS
• Practical support to agribusiness. Evaluating land cover areas/value, field sizes,delineating boundaries etc.
RC SUPPORTING JOBS IN
RURAL AREAS
• Improved broadband allows for remote working, potential for home offices.Reduces individual work stress/greater flexibility. Allows for better connectivity between individuals/remote location offices etc.

EUROCONSULT FOR THE CSA
SOCIO-ECONOMIC BENEFITS OF SPACE UTILIZATION | FINAL REPORT 19 |
RC SUPPORTING EDUCATION • E-learning by satellite has resulted in 3 students graduating from High Schoolin Ulukhaktok (Northwest Territories) for the first time.
TL OPTIMIZATION OF DAILY ROUTING ACTIVITIES FOR
CANADIANS
• More than 23 million Canadians are benefiting from satellite GPS applicationsto optimize routing.
OU
TREA
CH
DM BENEFITING FROM
INTERNATIONAL EFFORTS
• The Canadian government has activated the International Charter, Space andMajor Disasters 13 times, in order to receive imagery to support monitoring ofdisasters on Canadian territory
RC SUPPORTING GLOBAL
RELIEF • Satellite link enables Canadian doctors to provide telemedicine support to
colleagues active in conflict areas such as Syria
KEY AREAS FOR FUTURE GROWTH
The future growth of benefit impacts of the indicators assessed is largely a result of three factors, sometimes in combination:
> The introduction of new satellite solutions which can bring greater benefits to existing or growingapplication areas. For instance, the emergence of satellite communications constellation will enableimproved connectivity to rural communities; or the use of lower-cost imaging constellations toimprove revisit for agriculture applications etc.
> Growing penetration rates of existing technologies. For instance, the role of satellite navigation inprecision agriculture continues to grow with increasing adaption within agribusiness. This growingpenetration may also be brought about by improved satellite supply solutions as noted above.
> External factors to the satellite technology, such as a changing macro-economic environment. Forinstance, growing northern populations would have a net effect on the adoption of satellitebroadband; increased mining in the same regions would lead to increased shipping and thus thebenefits brought by sea-ice monitoring using satellite imagery grows along with this.
The first two of these factors are more straightforward to forecast as they fall within commercially driven markets in which market sizing is available (such as value of cropland to Canada), and assumptions (such as for growing penetration rates) can be taken in to account. The scenarios below are built from assumptions around these factors. The later point depends more on extenuating circumstances, and thus is harder to forecast. For instance:
> Population growth in the north was anticipated to increase over the last decade, however this hasfailed to materialize. There is movement around northern communities, but this is largely based onfollowing employment with little net gains/losses
> It is not anticipated that there will be significant increased cargo shipping across northern searoutes according to Fed Nav – however mining activity increasing/decreasing does have impactson the number of vessels transiting.
> A growing number of disasters would imply an increased usage of satellite assets, though this isnear impossible to focus. It is noted that Charter activations within Canada have been largely equalover the years.
Most of these growth scenarios are based on quantitative scenarios which can be measured. However, the study also noted several new service areas which may bring benefits in the future. These areas are today considered to be not possible (such as due to technical limitations) or are a result of shifting policy which call for greater monitoring of a wider evolving situation. For instance, today, the Government of Alberta does not systematically use satellite imagery to monitor and regulate the oil sand region, however it intends

EUROCONSULT FOR THE CSA
SOCIO-ECONOMIC BENEFITS OF SPACE UTILIZATION | FINAL REPORT 20 |
to start this process in the coming months in order to be able guard against potential environmental impacts and support policy and regulatory decisions around the provincial oil industry.
SUMMARY OF AREAS FOR FUTURE GROWTH
TOPIC FUTURE GROWTH POTENTIAL
QUANTITATIVE
Ag
FURTHER USE OF IMAGERY IN PRECISION
AGRICULTIRE
• Through the combined savings of man-hours, and improved farming efficiencies (targetingwhere to irrigate, save fertilizers etc.), savings are brought to agribusiness. <10% of Canadian farms use satellite imagery to support activities. Increasing penetration rates to 25% by 2027 would imply a benefit in terms of cost savings to farmers of $650 million to $1.3 billiondepending on crop type.
Ag
FURTHER USE OF SATNAV IN PRECISION
AGRICULTIRE
• Approximately 45,000 crop farms in Canada use precision agriculture solutions, representing a little over 50% of total farmed crop acres. This 50% uptake implies benefit of approximately $575 million/year through cost savings brought by better farming practices. However, if theadoption rate is taken at 75% in 2027 for farming areas in which average size is 1,000 acresplus, and an assumed 10% increase in other areas, then total penetration comes to abouttwo-thirds of farmed crop acres. This would imply a cost-saving of over $800 million/yearacross Canada.
RC SUPPORT
CANADIAN ECONOMY
• Potential to add another $2.7 billion over the next decade to the Canadian economy through increasing broadband penetration allowing for greater productivity, business efficiency etc.in rural and remote regions.
RC MORE TAKE-UP IN
IMPROVED BROADBAND
• New HTS systems coming into service are expected to address further capacity shortages.These new satellite network deployments are expected to boost satellite broadbandpenetration within its addressable market. As such, the total number of rural householdsconnected through satellite is projected to grow >400,000 households in the next decade, or 80% penetration of the addressable market
ATC REDUCTION OF CO2
EMISSION PER FLIGHT
• Cumulated reduction of 27.6 million tons of CO2 equivalent emission across the whole ofCanadian controlled airspace by 2027 through the implementation of ADS-B resulting inmore efficient flight routes.
ATC AIR TRAFFIC
AUGMENTATION OVER CANADA
• The anticipated growth in air traffic enabled by ADS-B translates into augmented revenuefrom fees established by NavCanada, resulting in tax payments estimated at $19 million in2027.
ATC PASSENGER SAFETY
ENHANCEMENT
• A complete space-based ADS-B implementation in the airline industry by 2020 could provide a 76% improvement towards complying to official Target Level of Safety standards of fatalcollision per flight hour.
TL IMPROVING MARITIME
CONTAINER USE
• An improved container utilization enabled by space-based IoT translates into a $170 millionpositive impact on the Canadian maritime industry by 2025.
TL SUPPORT
CANADIAN JOB CREATION
• Euroconsult estimates that GPS-supported Uber will generate up to 24,500 part-timeequivalent jobs in Canada in 2027.
TL GREATER LOGISTICS
FUEL EFFICIENCY
• Identified annual fuel savings of approximately $50 million per year attributable to satelliteIoT technology through improved speed monitoring of the >1 million medium/heavy trucksin operation in Canada.
QUALITATIVE
EM REGENERATING
LAND
• Satellite imagery has proved effective in being able to monitor mine site rehabilitation. Using satellite and aerial imagery to monitor returning chlorophyll levels, an area of land 200km x200km has been rehabilitated outside of Sudbury, Ontario. The land previously had highlevels of sulphur dioxide, caused by smelting processes. Approximately 100 more sites canbe supported in a similar way in order to reclaim back land to make it safe and usable.
EM MONITORING THE
OIL SANDS
• The Government of Alberta, is expected to start to use more imagery over the next six totwelve months to systematically monitor the oil sands for any impacts on the environment.Process is underway to define what parameters are to be tested, and which data sets to use.

EUROCONSULT FOR THE CSA
SOCIO-ECONOMIC BENEFITS OF SPACE UTILIZATION | FINAL REPORT 21 |
RC SUPPORTING
TELEMEDICNINE AND E-LEARNING
• The growth in broadband penetration is also expected to have further positive impacts onhealth and education. Government education schemes, such as the Northern DistanceLearning Program, now incorporate 35 students from seven communities. More successes are expected in the future, as are other such initiatives emerging.
ATC REDUCED TRAVEL
TIME FOR AIRLINES • Flying more efficient routes enabled by ADS-B technology would result in an estimated 3
minutes of time saved per travel on average.
SOLUTIONS UTILIZED
Satellite solutions detailed below reflect the primary data inputs collected through the consultation process. It would be expected that further data sets are being utilized depending on the specific needs of further end-users.
IMAGERY (EARTH OBSERVATION)
There is a variety of satellite imagery utilized depending on the specific application areas. There is some bias towards the use of RADARSAT series as it is free for the government. It is a key tool in certain applications more specific to Canada; such as sea ice monitoring. There is a diversity in other 3rd party satellite solutions utilized, however budgets remain an issue. Thus, there is a tendency to use freely available datasets, such as the Landsat and Sentinel series, and MODIS (onboard NASA’s Terra and Aqua satellites.)
2.3.1.1 Current solutions
Currently, it would be fair to say the data from Landsat and RADARSAT series, and a growing input of data from Sentinel-series are the main stalwarts for applications building. Other government data sets are being used on an ad-hoc basis, or in building operational nation-wide environmental monitoring applications (such as MODIS for monitoring land use and land use change detection.) The use of commercial data sets is more limited. Cost being a primary factor, although a small amount of data is being procured on a project by project basis.
> Disaster management is perhaps the area assessed in which multiple sourced data sets are beingused. This is a factor of Canada’s participation to the International Charter, Space and MajorDisasters. When the Charter is activated within Canada, Public Safety Canada (PSC) receives datathrough the CSA from multiple global space agencies and commercial operators (such asROSCOSMOS, JAXA, KARI etc.). As flooding is the major Charter-invoked activation by PSC (and themost prevalent disaster risk in Canada along with forest fires), SAR data plays a greater role inutilization: RADARSAT-2, Sentinel-1, ALOS, etc. were all utilized following the Quebec flooding of2017.
> For agriculture the use of satellite solutions largely depends on the scale of the agriculturalmapping required. AAFC, having the mandate to provide national mapping, rely on larger swathoptical imaging sensors such as MODIS and Landsat series. Moving to the more localised level,where monitoring of individuals fields, and field sizes is required, higher resolution systems areneeded.
> Environment monitoring has perhaps the most diverse data needs depending on the specificclimate variables being monitored. However, it mostly relies on freely available solutions. Inmonitoring of habitats, such as wetlands monitoring, mainly optical data is utilized: Landsat, MODIS,

EUROCONSULT FOR THE CSA
SOCIO-ECONOMIC BENEFITS OF SPACE UTILIZATION | FINAL REPORT 22 |
Sentinel-2. Whereas the Canadian ice services rely on SAR, the CIS being one of the largest users of RADARSAT-2, along with meteorological data and wide area optical scanners such as MODIS and AVHRR. On occasions, where higher resolution is required, Enfotec will purchase commercial SAR data to augment ice maps in small quantities.
2.3.1.2 Future solutions
The main factor noted for future usage is the anticipation of a greater amount of satellite-based EO imagery becoming available. It is not necessarily a question of replacing one imagery source with another, but to augment solutions with a growing, more capable supply. Two areas are noted: the launch of RCM and the greater data collection this will bring, and how to benefit from the launch of low-cost commercial imagery constellations. There is also expected to be an increase in the amount of Sentinel data being used as the satellite series continues its roll-out.
High revisit constellations such as Planet are expected to help develop further application areas by offering increased access to cloud free data, and data acquisition at much higher frequency. For instance, data from Planet will be able to monitor precise periods of time such as the start and end of the growing seasons. The role this can play in precision agriculture is anticipated: Planet can offer imagery multiple times a day, whereas Landsat only passes a few times during growing season.
There is also the question as to how all of this data will be managed in the future: RCM will bring an increased load of data, as will the expansion of the Sentinel-1 series, therefore questions remain around what will be the best way to integrate this new SAR data supply and extract information in the most efficient manner. Automation is expected to play a greater role, as is the role of artificial intelligence in being able to provide predictive analytics.
2.3.1.3 Alternatives
The main alternative to satellite-based imagery is data collected for airborne sources. This has historically meant the use of sensors on manned airplanes; however, the growing adaptation of UAV/drone technology adds a further dimension. Depending on the specific usage one solution would be preferred to the other: drone technology can offer much higher ground resolutions but can only cover narrow areas; satellites may have a courser ground resolution but can continually monitor the whole country at regular intervals. UAVs are less expensive to build, but more expensive to operate – for satellites the reverse is true. Further advantages of aerial solutions are brought in localised mapping to support height changes, measured with LiDAR, or when requiring a higher spectral capacity, such as to measure biophysical crop changes. At this stage high resolution/accuracy satellite data collection in LiDAR and hyperspectral does not exist – and this is not expected to change in short to mid-term. Therefore, in such cases, aerial is the only solution.
Within disaster management, flood monitoring may be easier from satellites, but for forest fires, airborne solutions are preferred. Optical data is better suited to forest fire management over SAR but is impacted by smoke. Secondly, a fire can change direction quickly, thus a satellite image may be tasked and received, but by this time the area may already be burnt, or the fire has changed direction. The only real practical system for collecting data today is airplanes with full imaging capabilities which can downlink data in real-time. Drones, while being useful, require permits to fly which can take time to process.
In other application areas, drone technology is being tested with some successes albeit if overall usage is more limited. OMAFRA and the Government of Alberta similarly acquire aerial ortho-imagery every few years to monitor land use. However, widespread use of drones is not the case. A key factor is the regulatory requirements to be able to fly drones, while operational expenditures can also ramp-up. It is a similar story

EUROCONSULT FOR THE CSA
SOCIO-ECONOMIC BENEFITS OF SPACE UTILIZATION | FINAL REPORT 23 |
in the use of drones for sea ice monitoring. Both the CIS and Enfotec use drones, but in very limited cases: the CIS receives about 200-300 flying hours a year through Transport Canada to monitor the route of special-interest vessels for reconnaissance purposes. Enfotec have also used drones from a ship to provide beyond-line-of-sight data on sea ice conditions, but the cost-benefit is not obvious.
SATELLITE COMMUNICATIONS
Satellite communications within this study focuses on three very different areas: satellite broadband is the main supporting satellite tool to connect rural and remote communities; low-data rate technology to support the transmission of data from ARGO floats, and from COSPAS-SARSAT beacons as well as enabling transmission to support IoT (including AIS technology); and data relay of ADS-B signals which utilize GPS to transmit the position of an aircraft. The use of ADS-B is viewed as a new area of satellite utilization with the potential to bring greater efficiencies to the airline business. While the other technologies are long proven, the connectivity of objects, the notion by IoT, is considered a fast-emerging area with Canadian companies involved in solutions development.
2.3.2.1 Current solutions
Satellite communications solutions utilized depend on the specific application areas. Broadband is mostly based on fixed satellite solutions, with LEO constellations expected to add to capacity in the near future. Low data rate transmission utilizes payloads on satellites operating in various orbits.
> Satellite broadband services are centred around a few key players. Xplornet is the largest ruralinternet service provider utilizing satellite and fixed wireless networks. Satellite capacity is leasedover Canada from several satellites including Echostar-17, Echostar-19, Viasat-1, and Viasat-2; andKa-band capacity on Anik-F2 from Telesat. Northern communities are still heavily reliant on C-bandpredominantly provided by satellites from SES and Telesat.
> For low data rate communications, data collected from the ARGO floats is transmitted through theIridium constellation. For search and rescue operations, COSPAS-SARSAT is made up of five LEOand five GEO satellites with dedicated payloads on-board NOAA and EUMETSAT meteorologysatellites operating in both LEO and GEO. In the future the system will incorporate satellitesoperating in MEO, with payloads to be carried on Galileo and Glonass navigation satellites.
> The global nature of the IoT technology and the vast amount of data to gather in real-time acrossthe globe requires the use of a network of satellites in LEO. Applications are nascent at this stagewith supply gradually rolling out. AIS technology is provided by exactEarth, with next generationpayloads on-board the Iridium NEXT constellation (60 AIS systems in total).
2.3.2.2 Future solutions
The next generation of HTS systems is expected to further decrease cost of broadband and increase available throughput over Canada which will be able to support rural and remote communities. Telesat has announced plans for a new satellite, Telstar-20V, potentially adding 40 Gbps more capacity over Canada’s North. There is also interest in new satellite constellations. Telesat’s LEO high-throughput broadband constellation of nearly 120 satellites aims to offer low latency coverage of all Canada. OneWeb’s proposed constellation of over 700 satellites will similarly provide blanket coverage of Canada, which is targeted as one of the operator’s first markets upon its expected limited service entry in 2020. Quality of service is also

EUROCONSULT FOR THE CSA
SOCIO-ECONOMIC BENEFITS OF SPACE UTILIZATION | FINAL REPORT 24 |
expected to improve. These new projects from Telesat, Oneweb and SpaceX will offer uniform high-speed, low latency broadband services to consumers in rural and remote areas.
In the realm of IoT, several new satellite constellations are expected to potentially emerge including Canadian start-ups Helios Wire and Kepler Communications. The primary benefit of the new constellations is to lower capital cost by using small satellite technology and therefore enlarging the addressable market for space-based IOT services.
2.3.2.3 Alternatives
The main alternative to satellite communications are ground based solutions, such as fiber, DSL, cable and wireless connectivity. Cable and DSL are still the dominant terrestrial networks in Canada, connecting over 7 million subscribers for cable and 4.5 million for DSL. Fiber allows the highest data rates (≥1 Gbps) to the end-user, with little or no degradation over long distances. However, whilst satellite cannot compete on price, other solutions become less available when moving away from urban centres.
Fiber's downsides are construction costs, which can limit roll-out to areas with low household or business density. While mobile (cellular) broadband networks have extended their coverage, the cost of mobile data plans cannot compete with fixed terrestrial network solutions. Fixed-wireless towers are now deployed and considered as the most economical solution for areas with 5-30 households per square kilometre. Satellite is expected to remain the most cost-effective option for low density areas, where household’s density <5 households per square kilometre.
The pros and cons of satellite-based IoT is also somewhat dependant on population densities. Terrestrial infrastructures such as the 4G and the upcoming 5G communication networks are well developed and utilized in urban areas. The more remote the area, including open oceans, the greater potential for satellites due to the costs to build up a terrestrial infrastructure.
SATELLITE NAVIGATION
Satellite navigation depends on the use of global networks of satellites to triangulate positions: a global navigation satellite system (GNSS). The U.S. Air Force operated Global Positioning System, or GPS, being the most utilized network for civil and commercial purposes. The Russian, GLONASS; and Chinese BeiDou systems are more locally used (and also by respective governments), and the European, Galileo system is expected to be fully operational by 2020. ADS-B technology relies on GNSS to collect positioning data of aircraft which is then transmitted to Earth via data relay.
2.3.3.1 Current solutions
In Canada, the U.S. GPS is almost exclusively the GNSS network utilized to support ranging applications, from personal navigation devices to defense, to enabling aircraft ATC and supporting precision agriculture in the context of this study.
ADS-B transponder technology consists of transmitters and receivers equipped on aircraft. It relays real-time information about position, direction of flight, altitude, airborne velocity etc. of the transmitting airplanes. The ADS-B data distribution system relies on GNSS satellites as its core input, the geolocation information being processed by the carrier internal instruments before being disseminated. Satellite communication relays to convey flight information to the ground. Such systems are now entering the market, for example, Aireon, with payloads being carried on the Iridium NEXT constellation.
EUROCONSULT FOR THE CSA
SOCIO-ECONOMIC BENEFITS OF SPACE UTILIZATION | FINAL REPORT 25 |
2.3.3.2 Future solutions
ADS-B remains in the development phase, with solutions being implemented from 2018. The Aerion solution will be fully operational once the last remaining Iridium NEXT satellite will have been launched to orbit, in mid-2018. As of June 2018, no official announcement has been made on another satellite constellation being equipped with ADS-B payloads. Further GNSS systems being available in Canada will offer greater robustness to the solutions, reducing risk if there was to be any issues with regards to GPS. The European Galileo system would be expected to be utilized in the future, albeit a full cross-over from GPS would seem unlikely. In addition, companies which are heavily involved in the equipment side of the agriculture business which integrate GPS, such as John Deere, are U.S.-based companies.
2.3.3.3 Alternatives
GNSS is well established, and satellite systems are unique in being able to offer global positioning coverage. Services based on GNSS however can have alternatives. Terrestrial ADS-B has been implemented on land, a successor to the costlier radar-based ground technologies. At present, both systems are used concurrently and provide a complementary solution to the emerging space-based ADS-B. There is no real alternative to the space-based solution where ground infrastructure doesn’t exist, such as over oceans.
POTENTIAL BLOCKAGES TO FUTURE GROWTH
Blockages to further growth fall in to a few general areas. Budgets are a key concern, especially where the procurement of commercial solutions is required. Further factors include supporting infrastructure being in place to be able to maximise usage of future solutions and potential policy and regulatory shifts required to support further satellite asset usage.
IMAGERY (EARTH OBSERVATION)
In most cases budgets to procure imagery is an issue. Most data utilized is either proprietary (RADARSAT series) or free. Commercial imagery is utilized, but only in small quantities – PSC may procure commercial data if project budgets commit, as will Enfotec. Part of the issue is also being able to demonstrate cost-benefit and bring in a culture of change in which it is recognised that even in cases of RADARSAT-2, the data is not “free”. In this area, adaptation to more commercial solutions are likely to occur within private sector users and provincial governments first. The Government of Alberta for instance expected to test commercial solutions in order to see what is available to better monitor the oil sands.
At the federal government level, supporting infrastructure can also be an issue. Current computing architecture is not considered to be adequate in supporting large amounts of data, AAFC notes that at this stage it does not have the capacity to integrate further Sentinel data. RCM will also vastly increase the data volume. Ideally a centralized high-performance computer could fulfil the roles of data storage and dissemination however this does not exist today.
Staffing can also be an issue. RADARSAT-2 imagery is essential for the provincial partners of PSC; however, they do not have dedicated personnel to receive imagery requests and deliver data. From the side of provincial governments, they may not have dedicated geospatial teams capable of handling imagery. Following the Fort McMurray wildfire, Alberta government departments were inundated with data without the resources to be able to process all the imagery provided. Ideally, it would have required data to be
EUROCONSULT FOR THE CSA
SOCIO-ECONOMIC BENEFITS OF SPACE UTILIZATION | FINAL REPORT 26 |
processed and ready for G.I.S. integration but there is no process in place as yet for this to happen. This issue is being addressed by the CSA.
Tasking conflicts can also be an issue surrounding RADARSAT-2. This is anticipated to continue with RCM despite the increase in data acquisition levels. It is felt that data demands of the DND and Canadian Ice Services may inhibit usage elsewhere if the same data is required to be tasked.
SATELLITE COMMUNICATIONS
Scalability and cost are two key areas identified as inhibitors of future satellite growth. In the case of scalability, fixed wireless and fiber network are better suited to reach a greater number of users. Northern communities are pushing for fiber solutions through different projects to obtain high speed internet access. The increasing availability of HTS capacity has substantially improved the availability, cost and quality of satellite broadband across Canada. Nonetheless, a shortage of affordable satellite capacity is still often highlighted by communities in the north.
The main inhibitor for IoT in support of transport and logistics could well be to achieve what is being promised. There are multiple companies seeking to develop satellite constellations in order to build solutions, however their emergence is not all guaranteed. Issues also remain on how to regulate IoT. There are no international agreed norms at this stage. The International Telecommunication Union (ITU) and the IEEE Standards Association, are working towards standardizing communications or hardware and governments are now starting to implement national regulatory frameworks such as the US Internet of Things Cybersecurity Improvement Act in 2017. Hacking is also a concern, the IoT devices are relatively simple constructs coupled to global connectivity whilst they can carry important information. The lack of clear regulatory framework may inhibit the development of technological systems, due to the uncertainty regarding which technology and network architecture that might be legally constrained in the future.
SATELLITE NAVIGATION
An issue for the further advances of GNSS enabled precision agriculture services is, who owns the data? Data collected from GPS-enabled farm equipment, which is supplied by the equipment provider, is then integrated in to a solution by the service provider. Then information is delivered to the farmer. However, ownership of the data can be claimed by all three parties, and the data can be aggregated and used further – such as in being able to monitor yield across multiple farms and extensive areas. Such data collectioncould for instance be used to better forecast commodity prices. Certain licensing or regulation can be putin place to allay concerns and/or govern how data can be used, though this remains under-developed.
Major flight regulation institutions such as the FAA and EUROCONTROL, aircraft are expected to comply by carrying ADS-B Out devices by 2020. NavCanada has adopted the same strategy and will require all aircraft traveling from or through Canada’s airspaces to follow these regulations. The main concern around ADS-B technology is the ability to globally deploy the solutions. Building the satellite infrastructure is relatively straightforward, however some countries and regions are more difficult to access to build the adequate ground equipment to support communications.
EUROCONSULT FOR THE CSA
SOCIO-ECONOMIC BENEFITS OF SPACE UTILIZATION | FINAL REPORT 27 |
3. UTILIZATION AND BENEFITS BY TOPIC
In this section, each of the topics are outlined in turn. In the first part of each section is a summary literature review as to how space-based assets are utilized within each topic. Following is the specific cases of benefits to Canada for each topic. Note that these benefits are collated through primarily the consultation process with third party stakeholders conducted for this supported, and supported by further desk research.
DISASTER MANAGEMENT
DISASTER MANAGEMENT UTILIZATION AND BENEFITS REVIEW
In the 2015 study completed by Euroconsult for the CSA on “Environment Study for Space Utilization Strategic Plan”, Disaster Management was the first area of interest globally, for assessed governments, in terms of utilizing space technology.1 One factor for this is the topic’s applicability across satcom, satnav and EO applications; a second, is that more capable and coordinated satellite systems are becoming able to address disaster management issues; and finally, each country having policy needs to fulfill around disaster management, whether the focus is on flooding, fires, or other natural/human-induced disasters from the perspective of mitigation, management and/or support to relief efforts.
Space utilization appears at several layers of governance. At the top, international disaster relief operations for major events are often coordinated with international government collaboration. Such activities may be coordinated through the U.N. with on-the-ground support provided by first responders (NGOs, national government civil and military operations etc.). From a space utilization perspective, information is coordinated through organizations such as COSPAS-Sarsat (for search and rescue)2, and the International Charter for Space and Major disasters (for EO support).3 Canada was a founding member of both of these supporting organizations. The U.N. Office for Outer Space Affairs also supports the collection of space-based information in support of disaster management through the U.N.-SPIDER Knowledge Portal.4 This focuses mainly on the utilization of imagery, but also incorporates the role of communications during times of a disaster event.
At a more localized level – towards national, provincial and local governance – utilization activities again span relief operations (if the disaster event is within the governing area jurisdiction), however there is also more emphasis on disaster mitigation and planning in case of a disaster event. For instance, if the governing authority covers areas prone to flooding, forest fires etc. For instance, in being able to monitor weather patterns and hot-spot detection on the ground (i.e. areas in which could be prone to a wildfire due to vegetation type, dryness) in order to better plan logistics in response to a wildfire event. In the cases of
1 “Environment Study for Space Utilization Strategic Plan”. Euroconsult study for the CSA, (2015).
2 “International COSPAS-Sarsat Programme“. Cospas-Sarsat, (2014). Retrieved from: https://cospas-sarsat.int/en/about-us/about-the-programme
3“The International Charter”. International Charter Space & Major Disasters, (2018). Retrieved from: https://disasterscharter.org/web/guest/home
4 “Knowledge Portal”. United Nations Office for Outer Space Affairs, (2018). Retrieved from: http://www.un-spider.org/

EUROCONSULT FOR THE CSA
SOCIO-ECONOMIC BENEFITS OF SPACE UTILIZATION | FINAL REPORT 28 |
flooding, again logistics can be supported by first identifying areas within in a flood plain prone to flooding, and then using weather input to build likelihood of a flood event scenarios.
Private sector involvement in disaster management is more limited, with activities in support of international treaties typically performed more on a contractual basis through the treaty. Commercial imagery solutions are also, for instance, provided pro bono in order to support data collection through a disaster event. As such, the commercial market for EO solutions represents only 3% of the combined $5.3 billion market for data and services in 2016.5 There is a growing interest, however, from the private sector in better monitoring industrial sites for potential environmental and disaster impact – such as in support of corporate social responsibility – and equally from the responsible governments in monitoring these same sites for potential impacts. In Canada for instance, there is particular interest in monitoring activities concerned with the oil sands and mining sites – a growing environmental/public concern and how best to regulate activities. For instance, as to how activities may impact on water resources, or the noise from construction/industry have an affect on wildlife. Noting for instance that the Environment and Parks within the Government of Alberta is expecting to explore ways to use EO to better monitor the oil sands.
LITERATURE REVIEW OF APPLICATON UTILIZATION
3.1.1.1 Satellite Communications
Satcom is used along all phases of the disaster cycle: Mitigation – Preparedness – Response – Recovery. Nonetheless, activities are primarily conducted in response to the disaster event and in the subsequent recovery efforts. Satellites are critical for providing/re-establishing communications in the aftermath of disasters when terrestrial networks (fixed and/or wireless) have been affected, destroyed or overloaded. Satcom enables access to vital information and coordination between government agencies, civil and defense government departments, humanitarian organizations and other entities that are involved in rescue and recovery operations. Satcom is also critical to other required services areas including hospitals, news broadcasters, and corporate networks (e.g.: ATM, supermarkets, gas stations, etc) which have suffered from disrupted terrestrial services. Terrestrial cellular operators also employ satellites to provide backhaul support for restoration of cellular and text services.6
Government agencies and inter-governmental organizations (IGOs) assist in the deployment of satcom technologies and services for disaster management at a national, regional and/or international level in collaboration with private industry. Utilization examples include:
> The Emergency Telecommunications Cluster (ETC) – led by the World Food Programme (WFP) – isa global network of humanitarian, private and governmental organizations that work together toprovide shared communications services in disaster events.7 It provides communications services
5 “Satellite-based Earth Observation, Market Prospects, 10th edition”. Euroconsult, (2017).
6 “When Hurricanes Strike- Satellites Play a Critical Role in Saving Lives Before and After a Hurricane”. Satellite Industry Association, (2017). Retrieved from: https://www.sia.org/wp-content/uploads/2017/10/Mktg17-Hurricane-Document-FINAL.pdf
7 “About ETC“. Emergency Telecommunications Cluster, (2018). Retrieved from: https://www.etcluster.org/about-etc

EUROCONSULT FOR THE CSA
SOCIO-ECONOMIC BENEFITS OF SPACE UTILIZATION | FINAL REPORT 29 |
within 48 hours of activation. Through its ETC2020 strategy, it is evolving from being primarily a service provider, to broker and facilitator of technology in emergency response.8.
> In 2011, the government of Luxembourg launched its Emergency.lu program as a public-privatepartnership with SES, HITECH Luxembourg, and Luxembourg Air Ambulance. The program providessatellite capacity, terminals and logistics for rapid deployment in response to disasters.9
> In the U.S., the Federal Emergency Management Agency (FEMA) has partnered with satelliteoperators such as Intelsat, Hughes, Viasat for the provision of satellite communication services tosupport rescue and recovery operations.
There is also coordination in the private sector to provide support following disaster events. In 2015, satellite operators Eutelsat, Hispasat, Inmarsat, Intelsat, SES, Thuraya and Yahsat signed the Crisis Connectivity Charter, managed under the umbrella of the EMEA Satellite Operators Association (ESOA), the Global VSAT Forum (GVF) and in coordination with the UN and ETC. The Charter aims to establish an industry-led mechanism that can be triggered by the ETC to provide a coherent, predictable and scalable implementation of an end-to-end satcom based response in times of crises.10
Satcom services utilized in disaster management include satellite phones and portable terminals, as well as transportable and fixed Very-Small Aperture Terminals (VSATs). All of these solutions are used to provide critical links for safety and security communications, voice and internet connections. Satellite phones for instance, are vital in the first 72 hours after a disaster/emergency situation to establish voice communications when fixed networks and base stations have been affected. In this context, mobile satellite services (MSS) companies such as Iridium, Inmarsat and Globalstar provide a crucial service to first responders. Broadband Global Area Networks (BGAN) and VSAT terminals are employed to provide connectivity of up to several Mbps for applications including voice, data, video and Internet emergency response.11
There are multiple utilization examples in which satcom services have played a critical role for disaster management. For example, in 2017, the hurricanes Irma and Maria caused serious damage to telecommunications infrastructure, which severely affected voice and internet services in Puerto Rico and other islands in the Caribbean. Over 5,000 Iridium phones were used in Puerto Rico alone.12 Hughes installed about 50 sites in Puerto Rico for FEMA and transmitted about 30,000 calls.13 Kymeta (with partners Intelsat and Liberty Puerto Rico) provided communications to 33 communities across the country.14
8 “ETC 2020“. Emergency Telecommunications Cluster, (2018). Retrieved from: https://www.etcluster.org/about-etc/etc-2020
9 “About Emergency.lu”, Emergency.lu, (2018). Retrieved from: http://www.emergency.lu/about/
10 “Crisis Connectivity Charter Satellite Training “. Emergency Telecommunications Cluster, (2018). Retrieved from: https://www.etcluster.org/event/crisis-connectivity-charter-satellite-training 11 “Guidelines for Implementation of Satellite Telecommunications for Disaster Management in Developing Countries”. ITU, (2009). 12 “Satellite communications industry prepares response to future disasters”. Werner D., (2018). Retrieved from: http://spacenews.com/satellite-communications-industry-prepares-response-to-future-disasters/ 13 “2017 Hurricane Season: Lessons Learned for the Satellite Industry”. Torrieri M., (2018). Retrieved from: http://interactive.satellitetoday.com/via/satellite-2018-show-daily-day-4/2017-hurricane-season-lessons-learned-for-the-satellite-industry/ 14 “Kymeta Provided High-Speed Mobile Internet Access to Puerto Rico During Recovery Efforts”. Business Wire (2018). Retrieved from: https://www.businesswire.com/news/home/20180313005612/en/Kymeta-High-Speed-Mobile-Internet-Access-Puerto-Rico

EUROCONSULT FOR THE CSA
SOCIO-ECONOMIC BENEFITS OF SPACE UTILIZATION | FINAL REPORT 30 |
Emergency.lu also deployed three portable terminals employing SES satellite capacity to re-establish the communication for humanitarian responders in Dominica and Saint Martin.15 The 2016 Hurricane Matthew in Haiti had a similar response16, as did the Great East Japan Earthquake and Tsunami in 2011 that caused damage to approximately 1.9 million communication fixed-lines and 29,00 base stations in Japan. The ETC has been activated in Syria since 2013 to provide shared secure voice and internet connectivity services to the humanitarian organizations.17
In addition the COSPAS-SARSAT is the international programme that provides both the Search and Rescue Satellite Aided Tracking (SARSAT) distress beacon detection system and coordinates Search and Rescue (SAR) organizations. The system is used by search and rescue authorities to assist persons in distress. Since its creation in 1982, COSPAS-SARSAT has helped to save over 32,000 lives globally. The SARSAT system uses both GEO and LEO satellites. COSPAS-SARSAT is augmenting its programme with MEO satellites, which consists on search and rescue repeaters hosted on GPS, GLONASS and Galileo. The system, called Medium Earth Orbit Search and Rescue (MEOSAR), will enable the detection of beacon signals within 10 minutes with more accuracy (5 km), compared to the current system which could take up to over an hour.18
3.1.1.2 Imagery (Earth Observation)
EO imagery is again used along all phases of the disaster cycle. According to a review in “Science”, the use of imagery in support of disaster management grew from seven cases in 2000, to 123 cases in 2014.19 The growth in utilization is further supported by activations of the International Charter, with 11 cases in 2001 compared to 44 in 2017.
The main data requirements include timely delivery (nominally from multiple satellite sources), especially in response to disaster events. Drawn-out humanitarian crises require constant monitoring over a longer period of time. Civil and defense government departments, including civil protection departments, are the primary users of EO data for disaster management. IGOs such as the World Food Program (WFP), World Bank, regional development banks and UNESCO also assist with disaster and humanitarian relief efforts. In parallel, the UN-SPIDER acts as a gateway to space information for disaster management support by serving as a bridge between first responders and space communities. Non-government organizations (NGOs) (Doctors without Borders, etc.) are also often first responders and require the use of geospatial data.
The International Charter on Space and Major Disasters coordinates relief efforts using EO data. The charter aims to provide a unified system of space data acquisition and delivery to those affected by natural or man-made disasters through authorized users. Member countries of the International Charter provide imagery from national assets to provide support in response to a disaster, such as COSMO-Skymed (Italy), the KOMPSAT-series (South Korea), SPOT-series/Pleaides (France), and RADARSAT-series from Canada. The U.S.
15 “Hurricane Irma and Maria”. Emergency.lu (2017). Retrieved from: http://www.emergency.lu/missions/caribbean-hurricane-irma-2017/
16 “Haiti Hurricane Matthew 2016”. Emergency.lu (2016). Retrieved from: http://www.emergency.lu/missions/hurricane-matthew-2016/
17 “Syria Operation Overview”. Emergency Telecommunications Cluster (2013). Retrieved from: https://www.etcluster.org/sites/default/files/documents/20170727%20ETC%20factsheet%20-%20Syria_0.pdf
18 Idem
19 “Global trends in satellite-based emergency mapping”. Voigt S., et all (2016). Science.
EUROCONSULT FOR THE CSA
SOCIO-ECONOMIC BENEFITS OF SPACE UTILIZATION | FINAL REPORT 31 |
also provides solutions from the Landsat series, and high-resolution imagery under agreement with DigitalGlobe.
To date, most activity is conducted in the final two steps: in response to the disaster event, and in the subsequent recovery efforts. Indeed, this is true for all disaster management activity, not just restricted to space-based assets utilization. Most resources also flow into these elements. The main issue being the unpredictable nature of a disaster event, and the need to respond. However, for certain disaster types, more work is being performed in the mitigation area in which EO is playing a greater role. For instance;
> In mapping flood plains, land-use practices, urbanization etc. in order to provide indicators forflood risk and rainfall distribution, such as the U.K. and Australian collaboration on the “Short-termEnsemble Prediction System” (STEPS) to better monitor rainfall and highlight areas for potentialflooding.20 Also, within the Copernicus Emergency Management Services is the European FloodAwareness System (EFAS), built using mainly meteorology data combined with synthetic apertureradar (SAR).21
> In monitoring forested areas to identify healthy versus compromised vegetation (fuel) and utilizingweather data to build precipitation/solar irradiance models in support of forest fire mitigation. TheAustralian government, through the Bureau of Meteorology (BoM) utilizes a combination ofmoderate resolution imaging spectroradiometer (MODIS) and advanced very-high-resolutionradiometer (AVHRR) data to monitor areas prone to fires.22 Previously, AVHRR was also utilized tobuild the European Space Agency hosted, World Fire Atlas, monitoring activity globally.
> And in monitoring land topography, elevation and usage, and deformation over time to provideinputs to highlight areas prone to landslides. Pilot studies are being conducted, for instancethrough Copernicus Emergency Mapping Services, using interferometric SAR (InSAR) data tomonitor land shifts, combined with other surface and meteorological data.
Following a disaster event, or when the disaster is in and around urban areas, the focus is toward high-resolution datasets, both optical and SAR in order to guide the relief effort in as much detail as possible. Also, SAR plays a greater role in disaster events associated with heavy cloud cover, such as flooding. The emergence of lower cost solutions derived from the constellation approach is also of interest – higher frequency data collection would be able to support services related to change detection analytics. Being able to capture “before and after” images closer to real-time will also be able to better support relief efforts, as well as supporting insurance claims at a later date.
3.1.1.3 Satellite navigation
Global Navigation Satellite Systems (GNSS) play a vital role in disaster management to provide timely and accurate location of landmarks, buildings, emergency services resources, camps, etc. Combined with EO imagery and other GIS information, it enables the mapping of the disaster areas for rescue operations and to monitor long-term recovery operations. GNSS also assist meteorologists and scientists to characterize
20 “Nowcasting”. Met Office (2011). Retrieved from: https://www.metoffice.gov.uk/learning/making-a-forecast/hours-ahead/nowcasting
21 “European Flood Awareness System (EFAS)“. European Commission (2017). Retrieved from: https://www.efas.eu/
22 “Fire Weather Warnings”. Autralia Government Bureau of Meteorology (2018). Retrieved from: http://www.bom.gov.au/weather-services/bushfire/
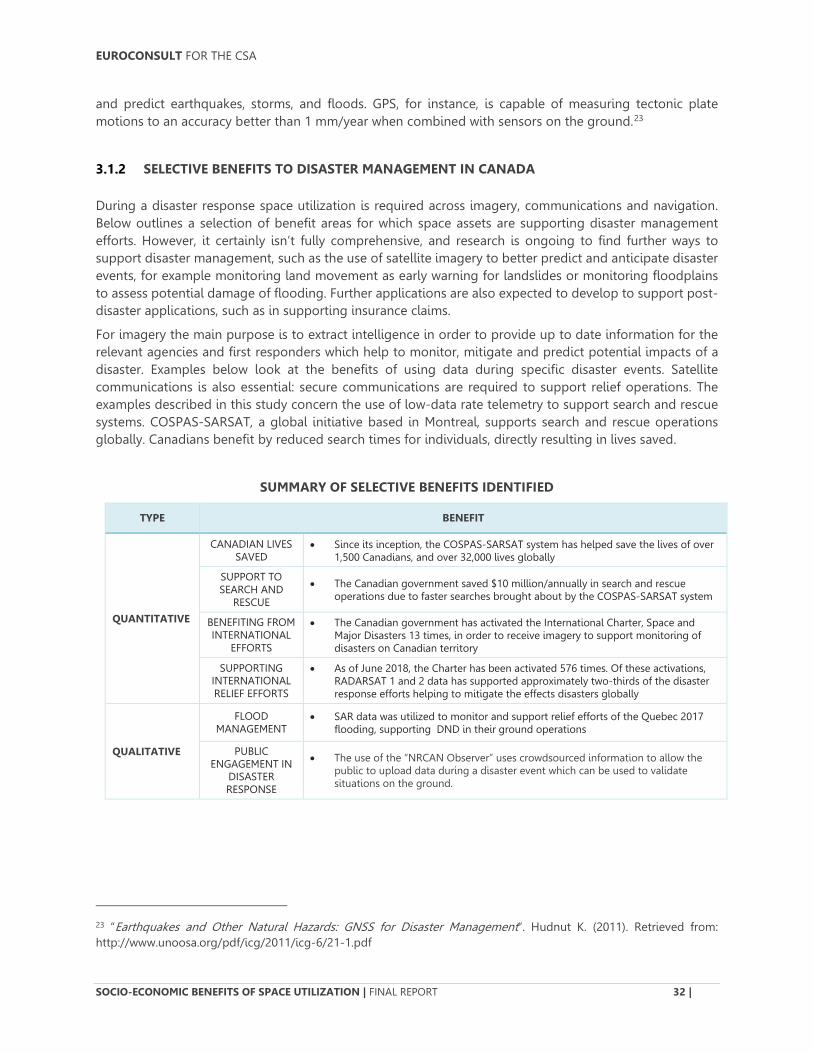
EUROCONSULT FOR THE CSA
SOCIO-ECONOMIC BENEFITS OF SPACE UTILIZATION | FINAL REPORT 32 |
and predict earthquakes, storms, and floods. GPS, for instance, is capable of measuring tectonic plate motions to an accuracy better than 1 mm/year when combined with sensors on the ground.23
SELECTIVE BENEFITS TO DISASTER MANAGEMENT IN CANADA
During a disaster response space utilization is required across imagery, communications and navigation. Below outlines a selection of benefit areas for which space assets are supporting disaster management efforts. However, it certainly isn’t fully comprehensive, and research is ongoing to find further ways to support disaster management, such as the use of satellite imagery to better predict and anticipate disaster events, for example monitoring land movement as early warning for landslides or monitoring floodplains to assess potential damage of flooding. Further applications are also expected to develop to support post-disaster applications, such as in supporting insurance claims.
For imagery the main purpose is to extract intelligence in order to provide up to date information for the relevant agencies and first responders which help to monitor, mitigate and predict potential impacts of a disaster. Examples below look at the benefits of using data during specific disaster events. Satellite communications is also essential: secure communications are required to support relief operations. The examples described in this study concern the use of low-data rate telemetry to support search and rescue systems. COSPAS-SARSAT, a global initiative based in Montreal, supports search and rescue operations globally. Canadians benefit by reduced search times for individuals, directly resulting in lives saved.
SUMMARY OF SELECTIVE BENEFITS IDENTIFIED
TYPE BENEFIT
QUANTITATIVE
CANADIAN LIVES SAVED
• Since its inception, the COSPAS-SARSAT system has helped save the lives of over1,500 Canadians, and over 32,000 lives globally
SUPPORT TO SEARCH AND
RESCUE
• The Canadian government saved $10 million/annually in search and rescueoperations due to faster searches brought about by the COSPAS-SARSAT system
BENEFITING FROM INTERNATIONAL
EFFORTS
• The Canadian government has activated the International Charter, Space andMajor Disasters 13 times, in order to receive imagery to support monitoring ofdisasters on Canadian territory
SUPPORTING INTERNATIONAL RELIEF EFFORTS
• As of June 2018, the Charter has been activated 576 times. Of these activations,RADARSAT 1 and 2 data has supported approximately two-thirds of the disasterresponse efforts helping to mitigate the effects disasters globally
QUALITATIVE
FLOOD MANAGEMENT
• SAR data was utilized to monitor and support relief efforts of the Quebec 2017flooding, supporting DND in their ground operations
PUBLIC ENGAGEMENT IN
DISASTER RESPONSE
• The use of the “NRCAN Observer” uses crowdsourced information to allow thepublic to upload data during a disaster event which can be used to validatesituations on the ground.
23 “Earthquakes and Other Natural Hazards: GNSS for Disaster Management”. Hudnut K. (2011). Retrieved from: http://www.unoosa.org/pdf/icg/2011/icg-6/21-1.pdf
EUROCONSULT FOR THE CSA
SOCIO-ECONOMIC BENEFITS OF SPACE UTILIZATION | FINAL REPORT 33 |
3.1.2.1 Effective flood management
During a disaster response Canadian Centre for Mapping and Earth Observation [CCMEO] collects data in which information is derived and then sent to PSC. PSC then coordinates all operations on the ground so as to not cause confusion in the chain of command. It may supply imagery directly to provincial governments that have the capacity to analyze imagery; if they do not have this capacity, this step can be undertaken by National Resources Canada (NRCAN)-Emergency Geomatics Services [EGS] to provide support.
The majority of imagery services (>95%) used goes towards monitoring flooding and ice-jam analysis. This is a reflection of the practicalities of which disasters can be best met with satellite imagery, and Canadian needs – flooding and forest fires being the most pre-eminent types of natural disaster. Information derived from satellite imagery – mainly SAR from RADARSAT-2 and Sentinel-1 – was for instance used to monitor and support relief efforts of the Quebec 2017 flooding. This information was sent to DND to support logistics, for example where personnel were needed on the ground such as areas at flood risk in which sand-bagging was required. This had the effect of creating greater efficiencies in logistical support and preventing further damage to properties which would have resulted in greater insurance claims and impacts on homeowners. Satellite imagery was also able to provide a full view of the assessment, noting flooded areas not as yet been detected by authorities.
The use of the “NRCAN Observer”24 also came into effect, particularly in flooded urban areas which require image validation; areas covered with water can be confused with concrete areas. Crowdsourced information from the App allowed the public to upload pictures of flooded areas, which was then used to validate imagery. For instance, this came into effect by better delineating areas of flooding in the Pierrefonds area of Montreal, thus information provided by CCMEO to PSC is improved and it is better able to support ground-based logistics. In itself this represents an interesting trend. Crowdsourced information is replacing previously relied on static in-situ measurements, such as from weather stations with mass sourced in-situ data i.e. the population is leveraged to collect data in real-time.
3.1.2.2 Benefiting from the International Charter, Space and Major Disasters
The International Charter, Space and Major Disasters [the Charter] aims to coordinate data tasking, acquisition and dissemination during times of a disaster event. On occasions, PSC has enacted the Charter to request support. Satellite imagery is then provided by the Charter partners and coordinated by a central body. Nominally one of the Charter members in rotation acts as the project manager, or, when the disaster event is in one of the Charter member countries, it is likely that the country’s space agency takes the coordinating role. Therefore, in the case of Canadian activations the CSA takes responsibility for coordinating the response.
Canada, through the CSA, was an early member of the Charter, joining in 2002. Since the Charter’s inception, PSC has activated it 13 times, mainly for flooding. In such cases SAR data is used to provide mapping of flooding extent. The above example of the Quebec flooding utilized data sets from Charter members after it was activated by PSC. Other events in which Charter partners have support include several cases of wildfires, in which monitoring of the situation and supporting logistics on the ground are the main applications, and the Lac-Mégantic train accident in which imagery was used to assess damage on the ground. All the Charter activations are mapped on the diagram below.
24 The NRCAN Observer App is available for download on mobile devices, it allows the public to upload pictures and relay information with high accuracy, using the positioning systems and azimuth data embedded in the devices.

EUROCONSULT FOR THE CSA
SOCIO-ECONOMIC BENEFITS OF SPACE UTILIZATION | FINAL REPORT 34 |
3.1.2.3 Supporting international relief efforts
In terms of natural disaster occurrences and its impact on human life, Canada is relatively fortunate. The Charter activation for instance monitors the fall-out from earthquakes, volcanic eruptions and tsunamis. However, as a Charter member and through further peace-keeping and humanitarian relief deployments, Canada supports global disaster relief efforts through the provision of satellite imagery.
With regards to the Charter as of June 2018, it has been activated 576 times since its inception. Of these activations, RADARSAT 1 and 2 data has supported approximately two-thirds of the disaster response efforts helping to mitigate the effects of the disaster.25 There are several benefits outlined as to Canadian involvement within the Charter:
> Export of Canadian expertise: in bringing operational procedures and standards in datamanagement and reporting
> Disaster Coverage in Canada: responding to disaster events in Canada, as noted above
> Exploitation of RADARSAT data and archives: approximately 1,700 RADARSAT 1/2 images havebeen delivered to the Charter following activation to date. Adding visibility to the RADARSATprogram globally as to its capabilities, and Canadian capabilities in SAR technology
> RADARSAT development and promotion of use: building new application areas, such asradargrammetric mapping, water column depths, data fusion techniques etc. which can beshowcased
> Bringing visibility to the RADARSAT program: news/press releases following disaster events anddemonstrating the use of satellite data. For instance, the usage of RADARSAT-2 imagery
25 In 2017 the CSA was requested to provide satellite imagery in response to 31 of the 45 events which triggered an activation of the International Charter on Space and Major Disasters during fiscal year 2017–18. The CSA delivered 140 RADARSAT-2 acquisitions (54 archived and 86 new) to affected countries.
2017: Monitoring flooding around Montreal and western Ontario
2003: Wildfire monitoring, and supporting relief efforts in MB
2003: Monitoring of heavy rainfall and flooding around Vancouver
2007: Monitoring ice situations of Newfoundland & Labrador following about 100 ships being trapped in sea ice
2010: Monitoring floods and assessing damage
around Maple Creek
2010: Assessing damage and support relief efforts following heavy rains and strong winds, NL
2012: Monitoring flooding in B.C.’s Shuswap region
2016: Supporting the relief effort, and monitoring the wildfires at Fort McMurray
2013: Monitoring the Lac-Mégantic train accident disaster
2011: Monitoring wildfires in the Lesser Slave Lake
Provincial Park
2008: Monitoring heavy flooding along the St. John River
2003: Monitoring floods around the towns of Smithers,
Terrace and Mission B.C.
2003: Flood and heavy rainfall monitoring in Southern Manitoba
CANADIAN INTERNATIONAL CHARTER, SPACE AND MAJOR DISASTERS ACTIVATIONS

EUROCONSULT FOR THE CSA
SOCIO-ECONOMIC BENEFITS OF SPACE UTILIZATION | FINAL REPORT 35 |
demonstrating lava flow extents in the recent Kilauea Volcanic event (products for the USGS provided by MDA).
Statistics show that the majority of radar images (including RADARSAT) supplied to the Charter go towards supporting flood events (66% of all SAR data supplied in 2016); flooding represents about half of all Charter activations. A further 26% of SAR usage relates to ocean/wind events, with other disaster types (fire, volcano, earthquake) more limited.26 This reflects the benefits of SAR data for cloud penetration/all-weather wide area imaging; optical imagery by comparison is better suited to monitoring impacts on urban landscapes.
Outside of the Charter, Canada assists in wider global relief efforts. In the cases below CCMEO provides information to DND to support operations on the ground:
> In Afghanistan, CCMEO monitors snow melt in mountainous regions using RADARSAT-2 andMODIS data. The melt may result in flash floods which could impact refugee camps in the region.Work was also done to monitor the potential volume of snow by measuring snow thickness withthe gravity mapping GRACE sensor.
> In response to the Haiti earthquake, CCMEO provided the DND Disaster Assistance Response Team(DART) with information as to where water sources were and which airfields were damaged,supporting logistics on the ground etc. with RADARSAT-2 data, and imagery obtained through theCharter.
3.1.2.4 Taking the “Search” out of Search and Rescue
The primary benefit of utilizing satellite systems for search and rescue, is to reduce the search time. This has obvious benefits to the individuals being supported, as well as resulting in cost savings by minimizing the resources expended over a protracted search time. In using the COSPAS-SARSAT satellite system, individuals can activate their personal beacons in times of distress. The population of beacons in circulation within the Canadian population has expanded significantly: from under 10,000 in 2006 to over 50,000 in 2017 (in addition the government has over 3,000 military beacons.) Users span workers in harsh/remote regions of the country as well as numerous adventurists pursuing outdoor activities: for instance, when hiking in remote regions.
Further commercial companies operate similar distress beacons. The commercial SPOT Personal Tracker offers a similar service utilizing the Globalstar satellite network. The SPOT service contacts the relevant jurisdiction (so again will go through PSC) once its signal is activated. The system claims to have helped save the lives of nearly 6,000 people globally.27
26 International Charter, Space and Major Disasters 2016, Annual Report 27 Retrieved from: https://www.findmespot.ca/en/index.php?cid=101

EUROCONSULT FOR THE CSA
SOCIO-ECONOMIC BENEFITS OF SPACE UTILIZATION | FINAL REPORT 36 |
SOLUTIONS UTILIZED IN CANADA
3.1.3.1 Satellite Solutions
In the event of a disaster relevant information delivered in a timely fashion is paramount. Thus, whether it is supporting imagery or communications, having the correct channels to receive data with low latency, is key. CCMEO note that during a disaster event, they can receive data 15 minutes after it is acquired, and the product delivered to a handheld device within a total of 30 minutes after acquisition. This near real-time information gives first responders as much time as needed to react to an evolving situation.
For flood mapping, CCMEO utilizes data from RADARSAT-2, Sentinel-1 and Sentinel-2. Sentinel-1 data receives directly through its own proprietary antenna. For flooding there is mainly a focus on SAR solutions – the main reason being that flooding is associated with cloud cover, limiting the possibilities of opticalsolutions. Further data is provided on a good will basis, often with the CSA mediating: ALOS (JAXA) andResurs-series (ROSCOSMOS) data was sent to support the Quebec flooding of 2017; and KOMPSAT series(Korea) and Airbus data (through the DLR) was sent to support the monitoring of the Fort McMurraywildfires. It is noted that bilateral data exchanges at times of a disaster event can work better than the
THE COSPAS-SARSAT SYSTEM
Savings Canadian lives since 1982
In total the federal government alone responds to approximately 2,000 COSPAS-SARSAT alerts each year – not all ending in a search and rescue operation. Some of the alerts become resolved prior to COSPAS-SARSAT utilization or are false alarms. However- this has still led to an average of 50 to 80 validated distress alerts a year since 2010. Some of these directly lead to saving lives: Since the inception of COSPAS-SARSAT, it is estimated that over 1,500 Canadian lives have been saved by the COSPAS-SARSAT system. Globally five people are saved each day, and it is credited with helping to save over 32,000 lives since 1982.
Following a beacon being activated, the signal is received by the Canadian Mission Control Centre at the Canadian Forces Base Trenton, this data is passed on to the most appropriate PSC Joint Rescue Centres to investigate and coordinate the response. It may still take some time to reach the individual in distress. Where the individual is located in terms of remoteness, and proximity to a search and rescue team (of which there are 300 across Canada comprising 10,000 trained individuals) is a key factor as is weather conditions. This means the rescue can be anything from a couple of hours to a few days. However, in total it is estimated that $10 million/year is saved in search and rescue costs using the COSPAS-SARSAT system. The search and rescue teams are then further supported by satellite technology: GPS, satellite phones (such as Iridium) and mapping data which can utilize satellite imagery.
PSC coordinates the support effort with first responders including the provincial governments, civil security, the RCMP, DND, coastguard etc. Altogether there are around 10 federal government departments which may support search and rescue operations, plus provincial government departments. In part this depends on the type of operations. A ground-based search and rescue, i.e. a hiker activating their distress beacon, falls under provincial jurisdiction, whereas a maritime or aeronautical activation falls into the domain of the federal government.
EUROCONSULT FOR THE CSA
SOCIO-ECONOMIC BENEFITS OF SPACE UTILIZATION | FINAL REPORT 37 |
Charter due to data being able to be received faster. Overall, imagery usage is expected to grow in support of disaster management at the provincial level. PSC notes that the seven provinces it has provided solutions for, have realized the benefits in supporting emergency management, and in better preparing for the next event.
For search and rescue operations, COSPAS-SARSAT is made up of five LEO and five GEO satellites (with further availability if needed). The system payloads are on-board NOAA and EUMETSAT meteorology satellites operating in both LEO and GEO. One relatively recent advance was the switch to a 406 Mhz frequency which allows for contacting the individual who activated the distress beacon. This adds a further safety element, and also allows for cancelling accidental activations: false alerts still take away time and resources. In the future the system will incorporate satellites operating in MEO, with payloads to be carried on future Galileo and Glonass navigation satellites.
3.1.3.2 Alternatives
Depending on the disaster type the alternatives to satellite imagery can offer a better solution. For instance, there is limited value in managing forest fires using satellite imagery. Whilst work can be done in assessing fire risk, such as “hot-spot” detection, i.e. areas which are drying and prone to fire spread due to wind direction (systems such as AVHRR and MODIS are used). The management of the fire situation itself is a challenge due to a couple of factors. Firstly, optical data is better suited to forest fire management, but is impacted by the smoke which fires produce; and secondly, the ability to task and receive data in real-time is limited. A fire can change direction quickly, thus a satellite image may be tasked and received, but by this time the area may already be burnt, or the fire has changed direction. This means that tasking the satellite to collect the desired data can be problematic.
CCMEO noted that despite plenty of good will from data providers globally, most optical data supplied during the Fort McMurray fire event was not able to be used. Latency was also an issue in the case of the Charter activation with regards to the wildfires. There remain delays in receiving data to support efforts, noting that imagery can take 24 hours to four days to receive. In the case of the Fort McMurray fires this meant the data has limited practical use as the wildfire areas change rapidly. Radar data also has more limited value given the parameters of information which can be collected from such systems.
The Alberta Emergency Management Agency notes that the best data to support Fort McMurray came from DigitalGlobe quick look imagery, as it is updated when collected. Otherwise, the only real practical system for collecting data today is airplanes with full imaging capabilities which can downlink data in real-time. Fixed wing aircraft can also fly below the cloud ceiling. Drones, while being useful, require permits to fly which can take time to process.
Airplanes and drones are however less practical for monitoring flooding. This is a factor of the required coverage on the ground. These solutions become less cost-effective, whereas satellite can provide regular wide-area monitoring.
3.1.3.3 Potential blockages to future growth
Budgets are a key issue. Imagery utilized is either Canada proprietary (RADARSAT series), free (Sentinel series) or provided on a good will basis – as is often the case from both government and commercial providers during a disaster event. PSC notes that it occasionally procures commercial imagery through “National Master Standing Offers for Commercial Satellite Imagery” and delivered through NRCAN’s "National Earth Observation Data Framework Catalogue” if projects budgets are permitting. PSC did not
EUROCONSULT FOR THE CSA
SOCIO-ECONOMIC BENEFITS OF SPACE UTILIZATION | FINAL REPORT 38 |
order any very high resolution commercial optical images in 2017, however in 2018 so far it has procured four images for issues related to border security.
Tasking conflicts can also be an issue surrounding RADARSAT-2 and/or if other end-users have requested the same imagery. The issue of data ordering is not expected to be resolved with the increased capacity brought through RCM, noting the policy for sharing data may go through some growing pains. It is anticipated that demands of DND and the CIS may cause data access issues to other government departments. Staffing can also be a factor. RADARSAT-2 imagery has become essential for PSC provincial partners, so time is spent ordering imagery and it is becoming a burden. PSC does not have dedicated personnel for receiving imagery requests from provincial partners or communicating with the CSA order-desk with regards to deliveries and ordering conflicts.
Supporting infrastructure can also be an issue. Current computing architecture is not considered to be adequate in supporting large amounts of data. RCM will also vastly increase the data volume. Ideally a centralized high-performance computer could fulfil the roles of data storage and dissemination. The question of supporting infrastructure was also apparent during the Fort McMurray fire. The Alberta Emergency Management Agency and the Wildfire Management Branch were inundated with data without the resources to be able to assess all imagery provided by the Charter and analyse it. They received 1.7 petabytes of data, but at different levels of processing. Ideally, the data needed to be all G.I.S. ready to integrate on delivery and scanned for cloud cover.28
It is noted by the CSA that Canada currently does not offer value-added services as part of its offering from the Charter, as some other countries do (either supplied through the space agency or contracted out to a third-party services provider for fast-turnaround analytics and services It is acknowledged that services to the Government of Alberta would have been more helpful to them as opposed to receiving only data. This is something which is currently being addressed. The CSA is looking at ways of developing supporting services through both the Copernicus Emergency Mapping Service initiative, and through the NRCAN emergency mapping program. The Charter is also supporting the development of a processing platform which will offer a centralized scanning for all data to support validation of data usability.
AGRICULTURE
AGRICULTURE UTILIZATION AND BENEFITS REVIEW
Agriculture encompasses both government monitoring for national/regional reporting and assessments, and commercial monitoring to support business practises and bring efficiencies to the agriculture industry. End-users, therefore, span multiple levels of government and the private sector. There is further interest at a wider level, such as to ensure food security (through organizations such as through the World Food Programme), and regional monitoring for farming subsidizes (such as the European Union Common Agriculture Policy).
28 It is perhaps important to note that while global agencies producing EO imagery are very familiar with the Charter, end-users such as provincial government departments are often not. It was the first time in which the Emergency Management Agency had asked PSC to activate the Charter. Whilst not the focus of the study, this does provide an interesting perspective as to the practicalities of the Charter for the end user, nominally those guiding first responders or the first responders themselves. These groups need adequate quality information delivered in a timely fashion. Inundating with data can render operational use less efficient.

EUROCONSULT FOR THE CSA
SOCIO-ECONOMIC BENEFITS OF SPACE UTILIZATION | FINAL REPORT 39 |
The (mainly) commercial sector is also adapting to new farming techniques to report on issues such as crop health, potential yield, and how to increase productivity. The “precision agriculture” sector is fast emerging, allowing farmers to use new technologies (machine guidance system, GPS, drones etc.) for site-specific management of factors which impact crop production. These new technologies cover factors such as precision irrigation, wider data management, logistics support – but also cover areas in which satellite technologies are playing a greater role, such as in the use of drone, automated farm-vehicles and in the utilization of remote sensing (aerial and satellite).29
To support these activities, space-asset utilization appears in several areas, albeit, at this stage there is more limited cross-over of applications: EO imagery’s main role is in the utilization of multispectral optical and SAR data to support information on state of vegetation, crop health, yield etc.; satnav’s main role is in supporting UAV/drone technology in precision agriculture; whereas satcom is mainly in the transmission of information from remote sources (mainly drones) to receivers on the ground and transmission of data from in-situ collection.
Precision agriculture is expected to continue to develop as an industry. Deregulation in the use of commercial drones is a driver for the industry in being able to use the solution to collect very high resolution (<5cm) imagery, including hyperspectral solutions, to support measurements into crop chemical/biophysical properties. The increased usage will leverage more on satnav in order to be able to guide and accurately collect data. Satellite solutions are also becoming more capable, new constellations will collect data more frequently at higher resolutions, and at expected lower data and services costs.
Utilization of precision agriculture is yielding results. The majority of (85%+) of farmers using precision agriculture techniques indicates more profitable applications, with cost savings of $19-39 per acre depending on the crop type.30 Furthermore, the total addressable market is estimated at $240 billion, or approximately 20% of the value of the $1.2 trillion global crop production value in 2015.31 The main benefits to precision agriculture can be broadly categorized as the reduction in over fertilization of fields, and the potential yield loss/productivity from inadequate fertilizer application.
LITERATURE REVIEW OF APPLICATON UTILIZATION
3.2.1.1 Satellite Communications
While satellite communications are employed to help backhaul information generated from in-situ farm assets, this utilization area is considered peripheral, with broader communications issues for the agricultural community being addressed, in part, in the forthcoming remote/rural communities’ section.
29 “Precision Farming Cheating Malthus with Digital Agriculture”. Goldman Sachs (2016). Retrieved from: https://docdrop.org/static/drop-pdf/GSR_agriculture-N1sH6.pdf 30 “Precision Ag works, Special Report”. PrecisionAg Institute (2008). Retrieved from: http://www.dickey-john.com/_media/PrecisionAgWorks-LessonsfromtheFrontLine.pdf 31 “Precision Farming Cheating Malthus with Digital Agriculture”. Goldman Sachs (2016). Retrieved from: https://docdrop.org/static/drop-pdf/GSR_agriculture-N1sH6.pdf

EUROCONSULT FOR THE CSA
SOCIO-ECONOMIC BENEFITS OF SPACE UTILIZATION | FINAL REPORT 40 |
3.2.1.2 Imagery (Earth Observation)
The use of satellite imagery, what data source is used, who uses it, and for what purpose is often a question of scale. At a global level, there is a need to monitor for food security, while at a national level, the purpose is more towards monitoring land-use, whereas the industrial level comes down to monitoring individual farmed areas to better support productivity and gauge crop health:
> According to the U.N. Food and Agriculture Organization [FAO], food production must increase by70% by 2050 in order to manage the forecast rise in global population.32 At the global level,initiatives such as NASA’s “Earth Observations for Food Security and Agriculture Consortium(EOFSAC) utilize a range of largely NASA environment monitoring focused missions’ data. Imageryfrom satellites such as Terra and Aqua, for instance, provides very wide area multispectral imagingat low resolutions, this is supported by other targeted missions (such as Soil Moisture Active Passive[SMAP]) and meteorology data sets.33
> At a national level, countries report (mostly commonly) seasonally on land-use for agriculturepurpose in order to monitor any significant changes as well as provide, support and monitor forfarming subsidies. Satellite systems commonly used include Landsat-data (as it is freely available)as well as commercial solutions such as the SPOT-series and the Rapideye constellation. Landsatfor instance is used to estimate crop production, provide agricultural statistics etc. for reported tothe U.S. Department of Agriculture (USDA)34; in the U.K. reporting on the EU CAP through the RuralPayments Agency reduces costs significantly: scanning a farm with a satellite costs one third assending an inspector into the field ($180 as opposed to $490 per farm). 35
> Precision agriculture is a developing area for satellite-based EO and is becoming more establishedas an application from aerial solutions, such as drones. Support to agriculture applications is thefirst market for imagery data and services from drones, Euroconsult estimates the market to be inthe range of $500 million in 2016, with the potential to rise to $4.5 billion by 2025.36 By contrast,the satellite imaging market for precision agriculture is currently estimated at only $30-40 million(the total data and services market for agriculture is estimated at $500-550 million in 2016.37 Thereare few current dedicated satellite services offerings, such as the “Farmstar” service offered byAirbus.
A key factor in the future for the use of satellite-based imagery is in the emergence of new low-cost constellations, able to provide multispectral data at high resolution (at least 1m), with very high revisit, and at a lower cost. It is not expected that satellites will cannibalize the entirety of the drone imaging market – drones will always be able to offer even higher ground resolutions, and hyperspectral imaging at high
32 “2050: A Third More Mouths to Feed”. FAO (2009). Retrieved from: http://www.fao.org/news/story/en/item/35571/icode/ 33 “Satellite Instruments for Food Security”. EOFSAC (2018). Retrieved from: http://eofsac.org/satellite-instruments-food-security 34 “Landsat and Agriculture—Case Studies on the Uses and Benefits of Landsat Imagery in Agricultural Monitoring and Production”. USGS (2017). Retrieved from: https://pubs.usgs.gov/of/2017/1034/ofr20171034.pdf 35 “Spying on Europe’s farms with satellites and drones”. Peter L. (2012). Retrieved from:
http://www.bbc.com/news/world-europe-16545333
36 “Remotely Piloted Aircraft Systems Market”. Euroconsult (2017).
37 “Satellite-based Earth Observation, Market Prospects, 10th edition”. Euroconsult (2017).

EUROCONSULT FOR THE CSA
SOCIO-ECONOMIC BENEFITS OF SPACE UTILIZATION | FINAL REPORT 41 |
resolution, rather data can be used complementarily: Satellite has the advantage of wide area coverage imaging, and frequent revisit, whereas operational costs can run high for continued data collection from drones, and over a narrower area.
3.2.1.3 Satellite Navigation
Satellite navigation systems such as the Medium Earth Orbit GNSS or GPS constellations are a core component of the rise of precision agriculture technologies. It enables users to merge real-time data gathering with accurate positioning information in order to obtain accurate and effective geospatial analysis. North America is the region leading the transition towards precision agriculture. End-users in the region procured 400,000 GPS devices integrated for agricultural activities in 2017, with forecasts of the market reaching 1.3 million units by 2025.38
Historically, constraints primarily due to lack of technical and financial means would impede farmers from applying specific strategies in regards to soil/plant treatments, crop yields, chemicals applications etc., in order to maximize their production. In most cases, a uniform production approach was taken when it came to land operations. The development of new GPS or GNSS systems integrated for agricultural activities brought to light the benefits of micro-managing fields [precision agriculture], and at the same time, hardware and service prices became more accurate, affordable and convenient for workers to handle.39 Many benefits may be identified by integrating the use of satellite navigation in agricultural activities; such as fuel consumption reduction, associated reductions in atmospheric carbon dioxide emissions, as well as farmer time savings, reduced use of fertilizers and improved field/crop health. Key application areas include: tractor guidance and automatic steering, variable rate technologies, soil condition monitoring and livestock tracking as well as supporting the emerging UAV market in support of agriculture.
> Tractor guidance and automatic steering using GPS devices represent the most used applicationacross precision agriculture – equating to 66% (or 250,000 units) of total GPS/GNSS equipmentdemand in 2016.40 Companies such as Trimble are now developing a complete range of automatedsteering systems, from autopilot to assisted steering equipment, giving way to minimizing errorsand overlaps made by manually orienting tractors and therefore achieving fuel and time savings,translating into a reduction in operations costs. 41
> Technology coupling ground sensors and GPS data, allowing users to adjust chemical spreading ina field according to crops need, is growing in utilization; 67,000 units were procured in 2016. Suchas, field sensors measuring crops’ light reflectance in order to assess fertilizer or other productneeds via specific agronomic algorithms and couple the information with GPS systems for efficientprocessing.42 Other practical uses of satellite navigation coupled with ground sensors may berelated to identifying the levels of salinity.
38 “GNSS Market Report Issue 5”. GSA (2017). Retrieved from: https://www.gsa.europa.eu/market/market-report
39 “Agriculture”. GPS.gov (2018). Retrieved from: https://www.gps.gov/applications/agriculture/ 40 “GNSS Market Report Issue 5”. GSA (2017). Retrieved from: https://www.gsa.europa.eu/market/market-report 41 “Tractor, Implement and Row Guidance Steering System”. Trimble (2018). Retrieved from: https://agriculture.trimble.com/precision-ag/products/steering-systems/ 42 “N-Sensor – variable rate nitrogen”. Yara (2018). Retrieved from: http://www.yara.co.uk/crop-nutrition/Tools-and-Services/n-sensor/
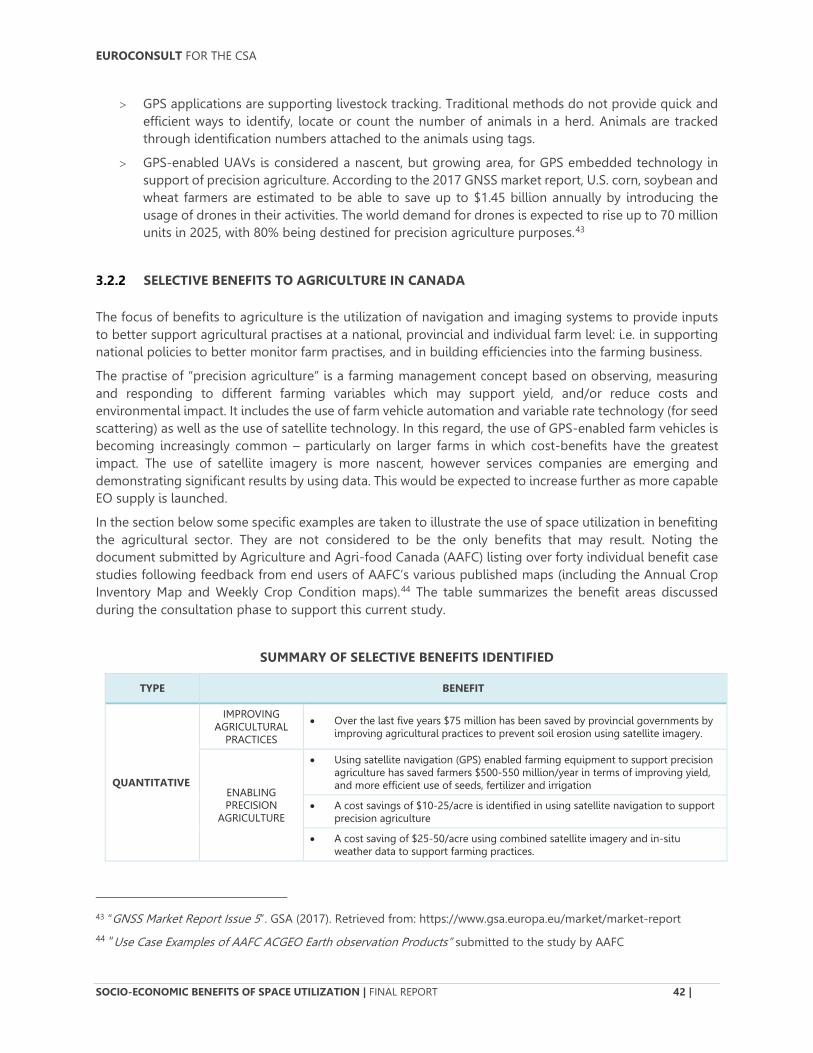
EUROCONSULT FOR THE CSA
SOCIO-ECONOMIC BENEFITS OF SPACE UTILIZATION | FINAL REPORT 42 |
> GPS applications are supporting livestock tracking. Traditional methods do not provide quick andefficient ways to identify, locate or count the number of animals in a herd. Animals are trackedthrough identification numbers attached to the animals using tags.
> GPS-enabled UAVs is considered a nascent, but growing area, for GPS embedded technology insupport of precision agriculture. According to the 2017 GNSS market report, U.S. corn, soybean andwheat farmers are estimated to be able to save up to $1.45 billion annually by introducing theusage of drones in their activities. The world demand for drones is expected to rise up to 70 millionunits in 2025, with 80% being destined for precision agriculture purposes.43
SELECTIVE BENEFITS TO AGRICULTURE IN CANADA
The focus of benefits to agriculture is the utilization of navigation and imaging systems to provide inputs to better support agricultural practises at a national, provincial and individual farm level: i.e. in supporting national policies to better monitor farm practises, and in building efficiencies into the farming business.
The practise of “precision agriculture” is a farming management concept based on observing, measuring and responding to different farming variables which may support yield, and/or reduce costs and environmental impact. It includes the use of farm vehicle automation and variable rate technology (for seed scattering) as well as the use of satellite technology. In this regard, the use of GPS-enabled farm vehicles is becoming increasingly common – particularly on larger farms in which cost-benefits have the greatest impact. The use of satellite imagery is more nascent, however services companies are emerging and demonstrating significant results by using data. This would be expected to increase further as more capable EO supply is launched.
In the section below some specific examples are taken to illustrate the use of space utilization in benefiting the agricultural sector. They are not considered to be the only benefits that may result. Noting the document submitted by Agriculture and Agri-food Canada (AAFC) listing over forty individual benefit case studies following feedback from end users of AAFC’s various published maps (including the Annual Crop Inventory Map and Weekly Crop Condition maps).44 The table summarizes the benefit areas discussed during the consultation phase to support this current study.
SUMMARY OF SELECTIVE BENEFITS IDENTIFIED
TYPE BENEFIT
QUANTITATIVE
IMPROVING AGRICULTURAL
PRACTICES
• Over the last five years $75 million has been saved by provincial governments byimproving agricultural practices to prevent soil erosion using satellite imagery.
ENABLING PRECISION
AGRICULTURE
• Using satellite navigation (GPS) enabled farming equipment to support precisionagriculture has saved farmers $500-550 million/year in terms of improving yield,and more efficient use of seeds, fertilizer and irrigation
• A cost savings of $10-25/acre is identified in using satellite navigation to supportprecision agriculture
• A cost saving of $25-50/acre using combined satellite imagery and in-situweather data to support farming practices.
43 “GNSS Market Report Issue 5”. GSA (2017). Retrieved from: https://www.gsa.europa.eu/market/market-report 44 “Use Case Examples of AAFC ACGEO Earth observation Products” submitted to the study by AAFC

EUROCONSULT FOR THE CSA
SOCIO-ECONOMIC BENEFITS OF SPACE UTILIZATION | FINAL REPORT 43 |
OPENING NEW MARKETS
• Using satellite imagery to support canola industry growing regulations opened upa $100-$200 million/year export market for Canadian farmers to the E.U.
QUALITATIVE
SUPPORTING WIDER POLICY
• Satellite-based agriculture maps are amongst the most downloaded on theCanadian government open data portal. These maps go to supporting policydecision makers and agribusiness best practices across Canada
COST-EFFECTIVE AGRIBUSINESS
• Practical support to agribusiness. Evaluating land cover areas/value, field sizes,delineating boundaries etc.
SUPPORT LAND-USE POLICIES
• Support to land management policies across Canada. For instance, in being ableto monitor areas prone to flooding, better manage urban development withregards to water management and risk aversion in changing local ecosystem,promoting mechanisms to support wild flower growth (to promote beepopulations) and in monitoring agricultural impacts on local water sources.
3.2.2.1 Improved land management
The use of satellite imagery enables farmers to build improved nutrient land management plans; such as how/when to spread manure, minimizing the impact of surface run-off (hydrology/elevation mapping) and helping plan the correct amount of fertilizer to use based on crop health. Satellite data is commonly used in combination with other sources, such as topographic maps, in-situ measurements (such as temperature, chemistry) in order to provide information on when and how to treat crops.
Research within OMAFRA demonstrated that the cost benefit of utilizing satellite imagery provided a ratio of 1:11-13 in terms of a dollar spent versus the return. This was based on a basic cost/benefit assessment utilizing data acquired by the U.S. Department of Agriculture (USDA) and U.N. Food and Agriculture Organization (FAO) along with data specific data collected in Ontario on a number of soil variables to calculate impacts of soil issues in Ontario. Considering the budget for data procurement to support agriculture land management is $100-150k per year, this would imply a cost-savings benefit of $1.1 to $2 million/year in Ontario alone. Extrapolating these figures further would bring a total Canada cost-benefit to $14-17 million/year, or an average five-yearly saving of over $75 million to Canadian farmers. This benefit is taken as an average current minimum value, it would be expected to increase as further information is gathered, including from upcoming satellite systems.
Further benefit areas noted are far ranging, and often only need a simple analysis or map creation. Such as in being able to measure field/farm sizes and crops planted for insurance purposes. A similar mapping process helps a farmer plan and price-out costs for new fencing or identify any issues with regards to drainage. Further environmental initiatives can also be monitored, for instance, a farm may gain credits to support the planting (or leaving) of wild flowers for the development of bee populations. AAFC is involved in similar initiatives, such as with the universities of Calgary and Ottawa to support bee populations; the prairie landscape pollinator experiment assesses how proximity to a number of landscape features, including crop type, has influenced populations.
3.2.2.2 Enabling precision farming through Satnav
Crop yield data collected on-board combine harvesters, when combined with satellite navigation, can pin-point areas within a field which display lower/normal/higher yield. This information feeds land management plans in order to identify areas in which are under/over irrigated, or where too much/little fertilizer is being used. Companies such as Trimble offer prescriptive planning based on data collected highlighting high yield, soil conditions and problematic areas. A farmer is then instructed what areas to seed/treat and what to do about underperforming zones.

EUROCONSULT FOR THE CSA
SOCIO-ECONOMIC BENEFITS OF SPACE UTILIZATION | FINAL REPORT 44 |
The Environment Management Branch within OMAFRA estimate that $10-25/acre is saved by adapting such technology through improved usage of seeds, fertilizer and irrigation depending on the crop type. The estimation is difficult to assess given the need to validate the impacts of changing seeding, fertilizer amounts etc. however it is based on the input of ~25 case studies. Note this is also comparable with the work produced Haak D.E.45 cited in the opening section of this report with savings in the $8 to $22 range (in this study soybeans were at the low end of the scale, corn at the high end, again similar to the studies at OMAFRA.) To build a total savings the estimated number of farms/acres using the technology is to be collected. OMAFRA estimate that in Ontario approximately 25% of farms are using GPS-enabled combines to produce either simple base mapping or a more prescriptive approaches as provided by companies such as Trimble. However, in the Prairie Provinces this is anticipated to be much higher – Farmers Edge estimate that 50%-65% of farmers are using some kind of precision agriculture solution. One key reason for this difference is expected to be the sizes of the farms. Precision Agriculture impacts are increased by the size of the farm, remote techniques and systematic data gathering taking much less time to gather information compared to in-situ measurements. Farmers Edge estimated that precision agriculture solutions become most beneficial with farm sizes 1,500-2,000 acres plus. Therefore, where farms are larger the uptake of such solutions is expected to be a higher percentage. The average farms size over Saskatchewan (~1,800 areas), Alberta and Manitoba (~1,200 acres) is significantly higher than the other provinces46 (Ontario is ~250 acres.)
Using this data as a weighting, it can be estimated that approximately 45,000 crop farms in Canada use precision agriculture solutions (40% of the total), representing a little over 50% of total farmed crop acres; around 50 million acres. This 50% uptake implies a benefit of approximately $575 million/year through cost savings brought by better farming practises.
If all farms adopted such practises this figure would be over $1 billion/year. This cost savings would be expected to expand as more farms and agribusiness adopt these solutions. Precision agriculture is considered an equipment driven market, solutions are gaining in accuracy but cost-benefit remains an issue to convince all agronomists, especially at smaller scale farms. If adoption rate however is taken at 75% for farming areas in which average size is 1,000 acres plus, and a 10% increase in other provinces – an achievable target, then total penetration comes to about two-thirds of farmed crop acres. If this can be achieved by 2027, this would imply a cost-saving of over $800 million/year across Canada.
45 “Precision Agriculture Development in Canada”. Haak D.E. (2011). 46 Source: Statistics Canada, 2016 Census of Agriculture
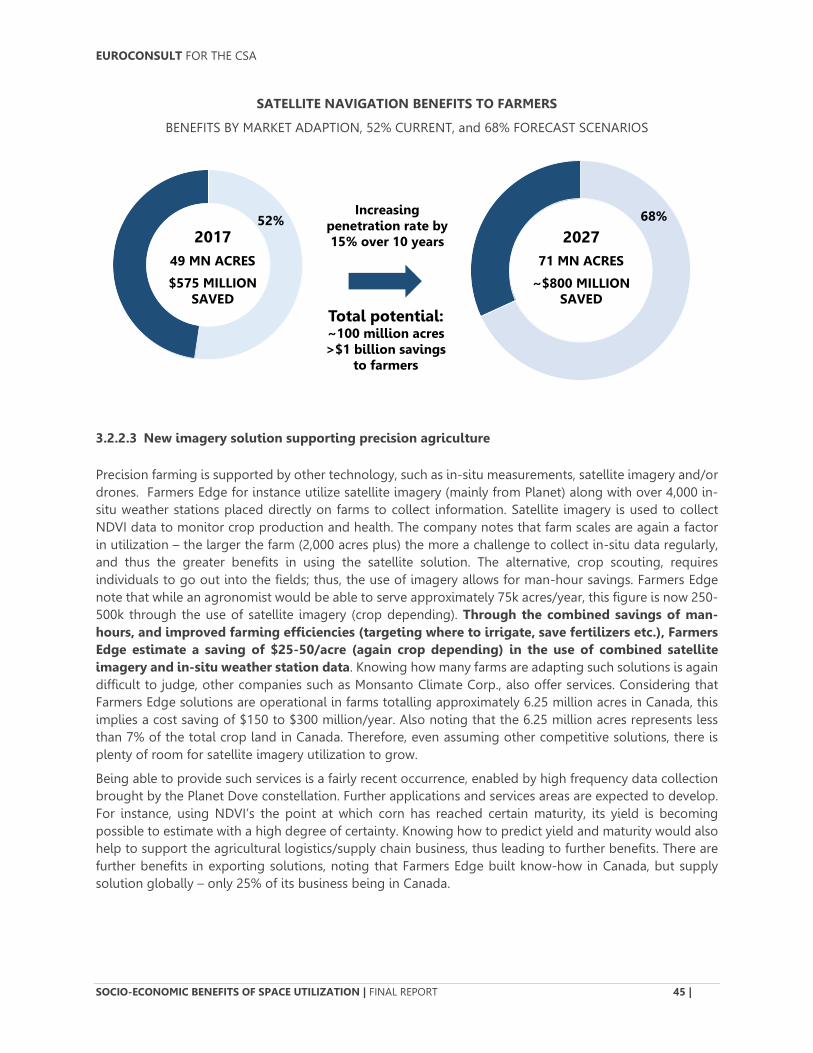
EUROCONSULT FOR THE CSA
SOCIO-ECONOMIC BENEFITS OF SPACE UTILIZATION | FINAL REPORT 45 |
SATELLITE NAVIGATION BENEFITS TO FARMERS
BENEFITS BY MARKET ADAPTION, 52% CURRENT, and 68% FORECAST SCENARIOS
3.2.2.3 New imagery solution supporting precision agriculture
Precision farming is supported by other technology, such as in-situ measurements, satellite imagery and/or drones. Farmers Edge for instance utilize satellite imagery (mainly from Planet) along with over 4,000 in-situ weather stations placed directly on farms to collect information. Satellite imagery is used to collect NDVI data to monitor crop production and health. The company notes that farm scales are again a factor in utilization – the larger the farm (2,000 acres plus) the more a challenge to collect in-situ data regularly, and thus the greater benefits in using the satellite solution. The alternative, crop scouting, requires individuals to go out into the fields; thus, the use of imagery allows for man-hour savings. Farmers Edge note that while an agronomist would be able to serve approximately 75k acres/year, this figure is now 250-500k through the use of satellite imagery (crop depending). Through the combined savings of man-hours, and improved farming efficiencies (targeting where to irrigate, save fertilizers etc.), Farmers Edge estimate a saving of $25-50/acre (again crop depending) in the use of combined satellite imagery and in-situ weather station data. Knowing how many farms are adapting such solutions is again difficult to judge, other companies such as Monsanto Climate Corp., also offer services. Considering that Farmers Edge solutions are operational in farms totalling approximately 6.25 million acres in Canada, this implies a cost saving of $150 to $300 million/year. Also noting that the 6.25 million acres represents less than 7% of the total crop land in Canada. Therefore, even assuming other competitive solutions, there is plenty of room for satellite imagery utilization to grow.
Being able to provide such services is a fairly recent occurrence, enabled by high frequency data collection brought by the Planet Dove constellation. Further applications and services areas are expected to develop. For instance, using NDVI’s the point at which corn has reached certain maturity, its yield is becoming possible to estimate with a high degree of certainty. Knowing how to predict yield and maturity would also help to support the agricultural logistics/supply chain business, thus leading to further benefits. There are further benefits in exporting solutions, noting that Farmers Edge built know-how in Canada, but supply solution globally – only 25% of its business being in Canada.
2017 49 MN ACRES
$575 MILLION SAVED
52% 68% 2027
71 MN ACRES
~$800 MILLION SAVED
Total potential: ~100 million acres >$1 billion savings
to farmers
Increasing penetration rate by 15% over 10 years

EUROCONSULT FOR THE CSA
SOCIO-ECONOMIC BENEFITS OF SPACE UTILIZATION | FINAL REPORT 46 |
A further tool being piloted is the SCAN (soil, crop, atmosphere and nitrogen) tool provided by Agriculture and Agri-Food Canada (AAFC) recalled in the opening section of this report.47 It aims to optimize nitrogen management, deficient nitrogen leads to compromised performance, whereas overuse leads to increases in costs with further potential for environmental impacts. SCAN is based on artificial intelligence techniques that are best adapted to manage imprecise and complex relationships of crops and nitrogen based on mathematical approaches. The satellite imagery acquired at a specific growth stage provides one of the information types required for the operation of SCAN, i.e., crop status. Test results have shown over three years (2013-2015) the SCAN produced average gains of $25 to $49 per hectare, depending on the year – comparable with the results reported by Farmers Edge. SCAN remains in the testing phase (mainly inQuebec, and coordinated through EO geospatial services company, Effigis) however, operations areexpected to commence shortly. The applications are however based on commercial imagery (given theground resolutions required of multispectral datasets, and therefore there is likely to be a charge (either tothe government or the farmer)).
Forecasting the benefits can be a challenge for services which are just emerging. However, considering the Farmers Edge market penetration of around 7%, their anticipated growth using Planet data, and further services such as SCAN becoming operational, an estimate of 25% of crop acreage using imagery integrated solutions by 2027 is not unreasonable. This would result in a potential benefit in terms of cost savings to farmers of $650 million to $1.3 billion depending on crop type.
3.2.2.4 Supporting farming practises
AAFC produces several maps using Earth observation imagery to support farming practises nationally, however, as this data is open source finding statistics as to how it benefits Canadians can be challenging. Information collected results from users reaching back to AAFC for discussion. Some indicators to usage can be gained; the AAFC Annual Crop Inventory is amongst the top 25 downloads on the government of Canada portal, and within the top two geospatial product downloads. Further solutions provided open source by AAFC include crop condition maps (using NDVI data obtained from MODIS), and surface moisture maps (using SMAP.)
Of the cases brought to AAFC, end-users of the agricultural mapping products span federal and provincial government, commodity groups, agribusiness, research institutes and NGOs. Usage falls broadly into a few camps including: improving policy development, program delivery and reporting with benefits in improving decision making, enhancing accountability and defining new areas of research. The table below summarizes several of the end-user benefit cases, the users and the typology of benefits brought.
47 “SCAN, a precision agriculture tool to optimize nitrogen management in the fields”. AAFC (2017). Retrieved from: http://www.agr.gc.ca/eng/news/scientific-achievements-in-agriculture/agro-ecosystem-productivity-and-health/scan-a-precision-agriculture-tool-to-optimize-nitrogen-management-in-the-fields/?id=1496858857623
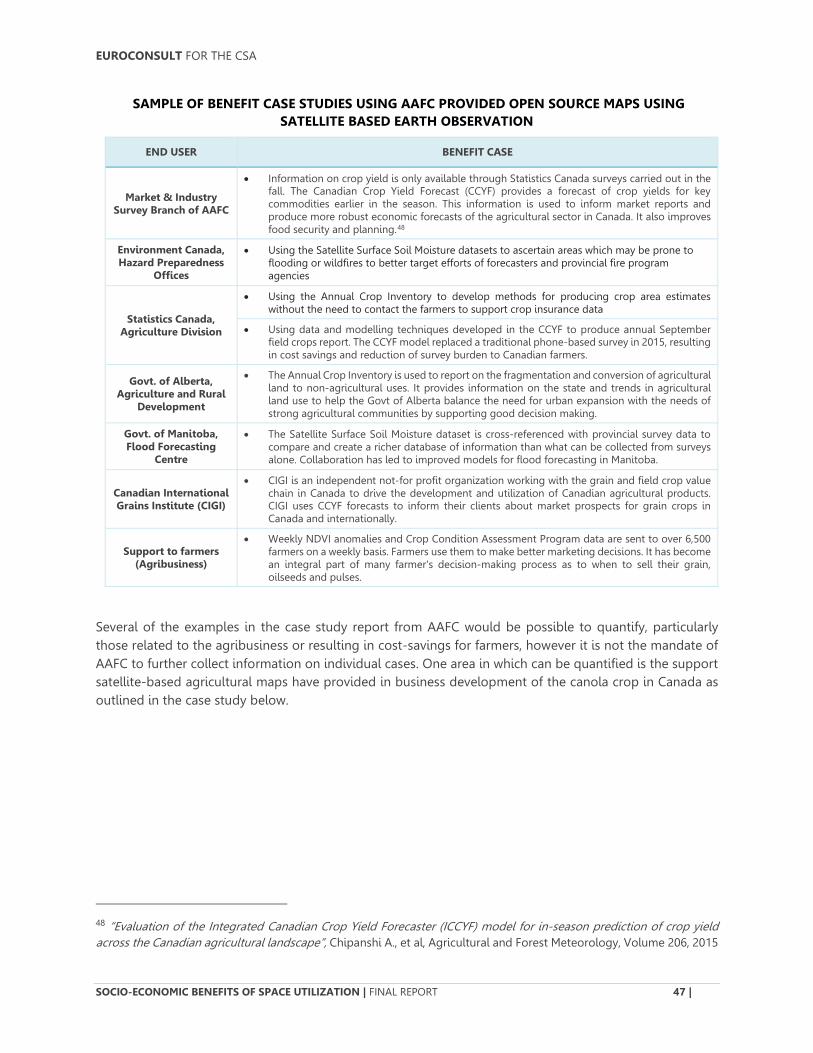
EUROCONSULT FOR THE CSA
SOCIO-ECONOMIC BENEFITS OF SPACE UTILIZATION | FINAL REPORT 47 |
SAMPLE OF BENEFIT CASE STUDIES USING AAFC PROVIDED OPEN SOURCE MAPS USING SATELLITE BASED EARTH OBSERVATION
END USER BENEFIT CASE
Market & Industry Survey Branch of AAFC
• Information on crop yield is only available through Statistics Canada surveys carried out in thefall. The Canadian Crop Yield Forecast (CCYF) provides a forecast of crop yields for keycommodities earlier in the season. This information is used to inform market reports andproduce more robust economic forecasts of the agricultural sector in Canada. It also improvesfood security and planning.48
Environment Canada, Hazard Preparedness
Offices
• Using the Satellite Surface Soil Moisture datasets to ascertain areas which may be prone toflooding or wildfires to better target efforts of forecasters and provincial fire programagencies
Statistics Canada, Agriculture Division
• Using the Annual Crop Inventory to develop methods for producing crop area estimateswithout the need to contact the farmers to support crop insurance data
• Using data and modelling techniques developed in the CCYF to produce annual Septemberfield crops report. The CCYF model replaced a traditional phone-based survey in 2015, resulting in cost savings and reduction of survey burden to Canadian farmers.
Govt. of Alberta, Agriculture and Rural
Development
• The Annual Crop Inventory is used to report on the fragmentation and conversion of agricultural land to non-agricultural uses. It provides information on the state and trends in agriculturalland use to help the Govt of Alberta balance the need for urban expansion with the needs ofstrong agricultural communities by supporting good decision making.
Govt. of Manitoba, Flood Forecasting
Centre
• The Satellite Surface Soil Moisture dataset is cross-referenced with provincial survey data tocompare and create a richer database of information than what can be collected from surveysalone. Collaboration has led to improved models for flood forecasting in Manitoba.
Canadian International Grains Institute (CIGI)
• CIGI is an independent not-for profit organization working with the grain and field crop valuechain in Canada to drive the development and utilization of Canadian agricultural products.CIGI uses CCYF forecasts to inform their clients about market prospects for grain crops inCanada and internationally.
Support to farmers (Agribusiness)
• Weekly NDVI anomalies and Crop Condition Assessment Program data are sent to over 6,500farmers on a weekly basis. Farmers use them to make better marketing decisions. It has become an integral part of many farmer's decision-making process as to when to sell their grain,oilseeds and pulses.
Several of the examples in the case study report from AAFC would be possible to quantify, particularly those related to the agribusiness or resulting in cost-savings for farmers, however it is not the mandate of AAFC to further collect information on individual cases. One area in which can be quantified is the support satellite-based agricultural maps have provided in business development of the canola crop in Canada as outlined in the case study below.
48 “Evaluation of the Integrated Canadian Crop Yield Forecaster (ICCYF) model for in-season prediction of crop yield across the Canadian agricultural landscape”, Chipanshi A., et al, Agricultural and Forest Meteorology, Volume 206, 2015
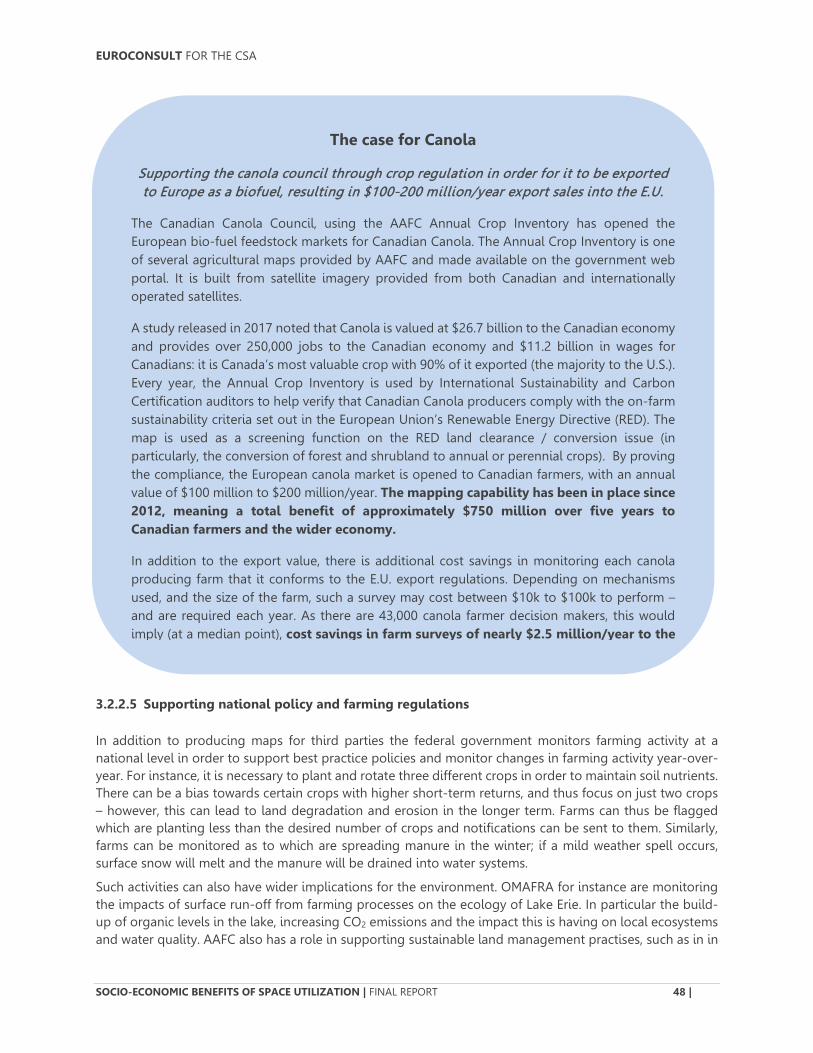
EUROCONSULT FOR THE CSA
SOCIO-ECONOMIC BENEFITS OF SPACE UTILIZATION | FINAL REPORT 48 |
The case for Canola
Supporting the canola council through crop regulation in order for it to be exported to Europe as a biofuel, resulting in $100-200 million/year export sales into the E.U.
The Canadian Canola Council, using the AAFC Annual Crop Inventory has opened the European bio-fuel feedstock markets for Canadian Canola. The Annual Crop Inventory is one of several agricultural maps provided by AAFC and made available on the government web portal. It is built from satellite imagery provided from both Canadian and internationally operated satellites.
A study released in 2017 noted that Canola is valued at $26.7 billion to the Canadian economy and provides over 250,000 jobs to the Canadian economy and $11.2 billion in wages for Canadians: it is Canada’s most valuable crop with 90% of it exported (the majority to the U.S.). Every year, the Annual Crop Inventory is used by International Sustainability and Carbon Certification auditors to help verify that Canadian Canola producers comply with the on-farm sustainability criteria set out in the European Union’s Renewable Energy Directive (RED). The map is used as a screening function on the RED land clearance / conversion issue (in particularly, the conversion of forest and shrubland to annual or perennial crops). By proving the compliance, the European canola market is opened to Canadian farmers, with an annual value of $100 million to $200 million/year. The mapping capability has been in place since 2012, meaning a total benefit of approximately $750 million over five years to Canadian farmers and the wider economy.
In addition to the export value, there is additional cost savings in monitoring each canola producing farm that it conforms to the E.U. export regulations. Depending on mechanisms used, and the size of the farm, such a survey may cost between $10k to $100k to perform – and are required each year. As there are 43,000 canola farmer decision makers, this would imply (at a median point), cost savings in farm surveys of nearly $2.5 million/year to the
3.2.2.5 Supporting national policy and farming regulations
In addition to producing maps for third parties the federal government monitors farming activity at a national level in order to support best practice policies and monitor changes in farming activity year-over-year. For instance, it is necessary to plant and rotate three different crops in order to maintain soil nutrients. There can be a bias towards certain crops with higher short-term returns, and thus focus on just two crops – however, this can lead to land degradation and erosion in the longer term. Farms can thus be flaggedwhich are planting less than the desired number of crops and notifications can be sent to them. Similarly,farms can be monitored as to which are spreading manure in the winter; if a mild weather spell occurs,surface snow will melt and the manure will be drained into water systems.
Such activities can also have wider implications for the environment. OMAFRA for instance are monitoring the impacts of surface run-off from farming processes on the ecology of Lake Erie. In particular the build-up of organic levels in the lake, increasing CO2 emissions and the impact this is having on local ecosystems and water quality. AAFC also has a role in supporting sustainable land management practises, such as in in

EUROCONSULT FOR THE CSA
SOCIO-ECONOMIC BENEFITS OF SPACE UTILIZATION | FINAL REPORT 49 |
supporting the maintenance of forest and wetland areas as well as identifying where they may have been turned into agricultural lands. This is achieved by monitoring land use through updated satellite imagery, and flagging areas considered at risk.
SOLUTIONS UTILIZED IN CANADA
3.2.3.1 Satellite Solutions
The use of satellite solutions largely depends on the scale of the agricultural mapping required. AAFC, having the mandate to provide national mapping, rely on larger swath optical imaging sensors such as the MODIS and Landsat series. Moving to the more localised level, where monitoring of individual fields and field sizes is required, higher resolution systems are needed – though the use of commercial satellite systems offering higher resolution data sets is limited by budget constraints. At the provincial level, the main go-to satellite solutions at OMAFRA are Landsat and Sentinel-series data, both of which are freely available. Data is used to monitor areas of crop coverage at broad level classifications. For example, monitor on a seasonal basis which fields are crop covered, and thus may be susceptible to erosion.
A key area of improvement would be to better support data collection at key times and at regular intervals. For instance, to be able to monitor at the start of the growing season, in the End-March to Mid-April time frame, and directly after post-harvest. At the moment, cloud cover in Canada, and the 16-day repeat pass of Landsat make this unfeasible, and thus it is achieved through the collection of aerial data, or in-situ reporting. In this regard there is some discussion with companies such as Planet as to how its system can be developed, albeit if this is considered in the early phase.
At the federal level, AAFC is open to using further data sources but face infrastructure challenges. There is more data available but does not have the capacity to store vast volumes of it. For instance, to date it does not integrate Sentinel data into its models as it does not have the storage/processing capacity, mainly relying on Landsat and RADARSAT-2. It is more of a hardware and software issue, noting that Shared Services Canada does have software updates, though this is more generic and not tailored to the specific needs of handling geospatial imagery.
The use of satellite imagery in precision farming is more limited. However, this could change as private companies, such as Planet, are targeting the sector. Note that Planet works directly with the agriculture service providers in order to build solutions. Farmers Edge note that prior to Planet, for which it has an exclusive license in Canada, it would use freely available sources such as Landsat and Sentinel-2. However, Planet can offer the high frequency revisit (up to 2-3 times a day) that it needs to power its models and provide data to the farmers regularly. Across a growing season of 90 days for instance, Landsat will only pass a few times, and due to cloud cover perhaps only 3-4 images are useful. Planet’s sub-daily collection allows for regular updates, and much improved chances of cloud free data.
3.2.3.2 Alternatives
Where more localized monitoring is required, aerial/UAV solutions offer a viable alternative. OMAFRA for instance aims to update its field ortho-imagery mapping every five years utilizes aerial data. Alberta Agriculture and Forestry similarly uses aerial ortho images; being able to create stereo imaging to better map hydrology being one important aspect (satellite stereo being expensive). Further advantages of aerial solutions are brought in localised mapping to support height changes, measured with LiDAR, or when requiring a higher spectral capacity, such as to measure biophysical crop changes; in which case aerial
EUROCONSULT FOR THE CSA
SOCIO-ECONOMIC BENEFITS OF SPACE UTILIZATION | FINAL REPORT 50 |
hyperspectral data is utilized. LiDAR is also used to map likely drainage patterns and is used in combination with satellite data to better map potential areas for soil erosion.
However, widespread use of drones is not the case. A key factor is the regulatory requirements to be able to fly drones, while operational expenditures can also ramp-up. Usage is more expected in higher return crops such as canola, peas etc. It is also not expected that farmers will directly procure drones in huge numbers, it is more likely that they would work with a services company.
Considering that satellite LiDAR is somewhat limited to a few scientific driven missions (such as NASA’s ICESat) and is some way off from being operational from space it is unlikely that satellite will offer an alternative in the short-medium term. Hyperspectral sensing similarly is some way from full operations from satellite, however the German-led EnMap mission is sited as a potential future mission of note (expected to be launched in 2020) albeit if the satellite does not have a collection capacity in the shortwave-infrared to support collection on biophysical properties. Hyperspectral capabilities across the near-infrared however would offer improved insights into crop classification.
3.2.3.3 Potential blockages to future growth
Budgets and data ownership are two key areas identified as inhibitors to further usage. In the case of imagery, budgets are small for data purchases relying mainly on free datasets. Noting above, the OMAFRA budget for satellite imagery is in the range of $100-150k/year. Taking that as a starting point, this would mean a total budget range of $1 million to $1.5 million at the provincial government level to acquire commercial Earth observation solutions. This assumes a weighting of budget based on croplands across the provinces. Building the case as to what satellite imagery can do in demonstrating cost-benefit is an important issue.
A further factor is who owns the data collected through precision agriculture. When collecting data from GPS-enabled combines the yield sensor is supplied by equipment provider (such as John Deere) and integrated into a services company for data generation (such as Trimble or Monsanto) and then certain information is delivered to the end-user (the farmer or agribusiness). However, ownership of the data can be claimed by all three parties, and the data can be aggregated and used further – such as in being able to monitor yield across multiple farms and extensive areas. Such data collection could for instance be used to better forecast commodity prices and there are obvious sensitivities around this.

EUROCONSULT FOR THE CSA
SOCIO-ECONOMIC BENEFITS OF SPACE UTILIZATION | FINAL REPORT 51 |
AIR TRAFFIC MANAGEMENT
AIR TRAFFIC MANAGEMENT UTILIZATION AND BENEFITS REVIEW
As of 2016, the International Civil Aviation Organization (ICAO) estimated the total number of passengers carried over the year at 3.7 billion49, this will increase to 7.8 billion in 2036.50
Two main international institutions oversee the aviation sector, providing a framework in which strict regulations are established in order to maintain optimal Air Traffic Management. It goes without saying that such increases in activity may generate many risks, notably for passengers’ safety, if not rigorously managed. The aforementioned ICAO, the United Nations’ specialized agency codifying the regulating principles of air transport and international air navigation, and the IATA, the world’s airlines conglomerate organization, are the two main governing bodies that regulate Air Traffic Management.
Space utilization closely serves air traffic control’s three fundamental principles: communication, navigation and surveillance. Its primary usage is inclined towards providing satellite navigation data through the Medium Earth Orbit GPS and/or GNSS systems, feeding aircraft with precise geolocation, allowing pilots to determine safe and efficient travel routes. Additionally, the use of ADS-B (Automatic Dependent Surveillance-Broadcast) system communication transponders, relays information to the ground, enabling Air Route Traffic Control Centers (ARTCC) and airports around the world to conduct effective surveillance for traffic planning, facilitating airlines monitoring of assets both in-flight and on the ground. Satellite-based communication links ensure the connections for data transmission between the multiple parties involved. They are also utilized to establish contact with aircraft flying over difficult-to-cover regions of the globe, such as the oceans.
LITERATURE REVIEW OF APPLICATON UTILIZATION
3.3.1.1 Satellite Communications
ADS-B technology is by nature strongly linked to satellite navigation, and thus these benefits are discussed in the navigation section. The current passage will focus on the additional benefits brought by satellite communication systems to the Air Traffic Management, related or not to the ADS-B system. ADS-B transponder technology consists of transmitters and receivers equipped on aircraft. It relays real-time information about location and velocity of the transmitting airplanes. Transmissions are conveyed using the ITU-regulated 1090 MHz frequency band. Provided both parties have compatible ADS-B installations, communications may be enabled between: two aircraft in operation, an airplane and airport, or ARTCC station, or a remote ADS-B ground receiver. The ADS-B data distribution system relies on GPS/GNSS satellites as its core input, the geolocation information being processed by the carrier internal instruments before being spread by the just-introduced cutting-edge communication process.51
49 “Air transport, passengers carried”. International Civil Aviation Organization (2018). Retrieved from: https://data.worldbank.org/indicator/IS.AIR.PSGR 50 “2036 Forecast Reveals Air Passengers Will Nearly Double to 7.8 Billion”. IATA (2017). Retrieved from: http://www.iata.org/pressroom/pr/Pages/2017-10-24-01.aspx 51 “New Air Traffic Surveillance Technology”. Richards W.R. (2010). Retrieved from: http://www.boeing.com/commercial/aeromagazine/articles/qtr_02_10/2/

EUROCONSULT FOR THE CSA
SOCIO-ECONOMIC BENEFITS OF SPACE UTILIZATION | FINAL REPORT 52 |
Despite the ease of deployment of the ADS-B technology, some regions around the globe are believed to be too difficult to access or do not allow the installation of adequate ground equipment to support communication means that were just depicted. This is the case for maritime regions, as well as remote terrestrial land. Using satellite communication assets as relays to convey flight information to the ground stands out as a logical strategy to mitigate the complications imposed by remote locations. Satellite systems equipped with ADS-B transponders are now entering the market. As an example, Aireon is implementing such technology into the payloads of the Iridium NEXT constellation, therefore providing a global coverage and similar performances to terrestrial ADS-B in terms of latency and information refresh rates. This solution will be fully operational once the remaining Iridium NEXT satellites have been launched to orbit, in mid-2018.52 Given the increasing amount of aircraft that will fly around the globe in the next two decades, new large LEO constellations such as the one developed by Telesat, thanks to their worldwide coverage, have the potential to become new entrants in the Air Traffic Management industry.
On the other hand, governmental programs such as the Single European Skies ATM Research (SESAR) are currently looking for innovative approaches to enhance their aviation management system. In this European case, satellite-based communication was chosen, through a partnership with Inmarsat, Thales Alenia Space and the European Space Agency, as a way to distribute secure and high capacity cockpit transmissions, and to fulfill SESAR’s long-term objectives of optimizing the European airspace by reducing emissions due to air traffic, improving flight trajectories, and minimizing in-flight time and delays.53
3.3.1.2 Imagery (Earth Observation)
Although mainly a satellite application for satnav, the role of meteorology cannot be ignored. Meteorology data is used to predict best flight routes and to highlight areas expected to encounter more severe weather, or increased turbulence. Data utilized is firstly meteorology specific data from GEO and LEO, from operators such as NOAA and EUMETSAT. These agencies also provide services free of charge to support the airlines. Private weather companies can also augment this data supply to provide more tailored, continuous, services to airlines. Not all meteorology data however is homogenous. Whereas a continual supply of data can be supplied from GEO positions, there is degradation off nadir which becomes problematic above 50o latitude. At this point the utilization of LEO satellites come into effect, however they pass multiple times a day rather than provide a continuous data stream. Improved weather measurements at higher latitudes would assist in being able to open up polar air routes further.
A further application is in ash cloud monitoring. Again, meteorology data is the first solution utilized. The impact of ash clouds on air travel came into the public spotlight following the Iceland volcanic incident of 2010. In total it was reported that an average of 25 days a year are affected by ash clouds over Canadian territory and controlled air space.54 The grounding of airplanes due to this comes at a cost to the airlines and business dependant on air freight. Meteorology data allows for better routing to avoid these incurred costs. Canada also hosts one of the nine global Volcanic Ash Advisory Centres for monitoring over its jurisdiction, covering the Canadian territory, western Atlantic and polar regions.
52 “Iridium Next”. Aireon (2018). Retrieved from: https://aireon.com/resources/iridium-next/
53 “Inmarsat to Help Alleviate Airspace Congestion in Europe”. Russell K. (2018). http://www.satellitetoday.com/mobility/2018/03/08/inmarsat-to-help-alleviate-airspace-congestion-in-europe/ 54 As first mentioned in “Study of The Socio-Economic Benefits Related to Improved Communications and Weather Services in the Arctic/North Delivered by The Polar Communications And Weather (PCW) Mission”, Euroconsult for the CSA, 2012

EUROCONSULT FOR THE CSA
SOCIO-ECONOMIC BENEFITS OF SPACE UTILIZATION | FINAL REPORT 53 |
3.3.1.3 Satellite navigation
GPS or GNSS constellations provide the core data that is used by airplanes to calculate their position and other flight relevant information. Once processed, this information has to be transmitted to ground stations and subsequent air control centers for them to perform efficient tracking of each vehicle. These exchanges of data are of prime importance since the flight safety regulations standards are stringent, as illustrated by ICAO’s “Manual on Airspace Planning Methodology for the Determination of Separation Minima” which provides the mathematical guidelines to establish aircraft paths and traffic safety regulations. Risk factors, i.e. fatal accidents per flight hour, are traditionally set at a maximum of 10-8 to 10-9 by the ICAO for allaircraft separation distance and safety equations.55
The ADS-B system is now implemented and aims to replace the traditional radar-based surveillance system for identification and tracking of aircraft. Aerospace manufacturers Boeing and Airbus are implementing “ADS-B IN” and “ADS-B OUT” transponders in order to allow the spreading and transmission of essential flight tracking data, i.e. position, direction of flight, altitude, airborne velocity, climb and descent information and so on. By coupling a 1090 MHz Mode S “ES” transponder and GPS systems onboard aircraft this technology will transmit crucial flight tracking data once per second to ground installation or airplanes in the vicinity, enabling them to identify and track each aircraft trajectory with greatly improved precision and accuracy compared to conventional radar systems.56 The US and European Air Navigation Control institutions, the FAA and EUROCONTROL, are requesting all commercial aircraft to comply with the ADS-B Out regulations set by these agencies by 2020.57 Australia has also decided to move forward with the ADS-B system to avoid the costs associated with deployment and maintenance of conventional radar infrastructures to establish coverage of its Western airspace.58
Up to now, one of the main constraints for airplane navigation has been the minimum separation between aircraft, which is very closely linked to the technical performances of the tracking/surveillance system monitoring the airborne vehicles. As an example, the North Atlantic region, one of the busiest air traffic zone on the planet, with 43% of the global oceanic air traffic, has a minimum of 30 to 50 nautical miles of separation (longitude) between two aircraft due to the unavailability of conventional tracking means over the ocean, and radar transmission having high latency reaching the continents. As a consequence, flying paths have to be adapted accordingly and such high aircraft density zones may become bottlenecks for aerial transportation. 59
The advantages brought by the ADS-B system are that aircraft separation standards may be reduced, therefore allowing more airplanes to share the same airspace simultaneously. This may result in a potential increase of number of flights, since the air traffic control centers will be able to track more precisely each airplane. The result being airplanes being able to fly closer together, and optimization of flight paths. This increases the benefits in flights over oceans and remote areas, which are more restrictive today. Flying more
55 “Manual on Airspace Planning Methodology for the Determination of Separation Minima”. ICAO (2002). Retrieved from: https://www.icao.int/Meetings/anconf12/Document%20Archive/9689_cons_en.pdf 56 “What do you get by extending your squit?”. Garmin (2018). Retrieved from: https://www.garmin.com/us/intheair/ads-b/squit/ 57 “As ADS-B Out Deadline Looms, Will Airlines Be Ready?”. MRO Network (2014). Retrieved from: http://www.mro-network.com/maintenance-repair-overhaul/ads-b-out-deadline-looms-will-airlines-be-ready
58 “New Air Traffic Surveillance Technology”. Richards W.R. (2010). Retrieved from: http://www.boeing.com/commercial/aeromagazine/articles/qtr_02_10/2/
59 “Eyes on the Skies”. NAVCanada (2013). Retrieved from: https://www.navcanada.ca/EN/media/Publications/Annual%20Report%202013-EN.pdf

EUROCONSULT FOR THE CSA
SOCIO-ECONOMIC BENEFITS OF SPACE UTILIZATION | FINAL REPORT 54 |
direct routes and having uninterrupted climbs and descents may result in less engine emissions, fuel savings, noise reduction, and could allow airlines to reduce their cost per passenger, which may lower price tickets for the end-user.
SELECTIVE BENEFITS TO AIR TRAFFIC MANAGEMENT IN CANADA
In the section below, specific examples are developed to illustrate the use of space utilization in benefiting Air Traffic Management. The indicators were chosen following a series of data collection from different stakeholders in the ATC industry, alongside information retrieved in case studies by NavCanada and the International Civil Aviation Organization [ICAO]. The benefits considered were measured through studies of airspaces administered by Canada in order to better understand domestic returns from the use of space-based assets, such as the Gander Oceanic and the Northern Territories Zones. Quantitative benefits provide a rough estimate of the added-value of space assets for Canada.
SUMMARY OF SELECTIVE BENEFITS IDENTIFIED
TYPE BENEFIT
QUANTITATIVE
ENABLING AIR TRAVEL
• Satellite-based GPS generates a positive GDP impact of at least $25 million,acting as a key enabler of the $80 billion commercial aviation industry in Canadaconsisting of more than 91 million passengers carried and 1.15 billion tonnes offreight delivered in 2017.
REDUCTION OF CO2 EMISSION PER
FLIGHT
• Cumulated reduction of 27.6 million tons of CO2 equivalent emission across thewhole of Canadian controlled airspace by 2027 through the implementation ofADS-B and resulting more efficient flight routes.
AIR TRAFFIC AUGMENTATION OVER CANADA
• The anticipated growth in air traffic enabled by ADS-B translates into augmentedrevenue from fees established by NavCanada, resulting in tax payments estimatedat $19 million in 2027.
PASSENGER SAFETY
ENHANCEMENT
• A complete space-based ADS-B implementation in the airline industry by 2020could provide a 76% improvement towards complying to official Target Level ofSafety standards of fatal collision per flight hour.
AIRLINES IMPROVED COST-
EFFICENCY
• Over the Gander airspace, space-based ADS-B would allow 450 liters of fuel savedper flight, leading to an estimated cumulated $900 million of fuel savings byairlines traveling through this oceanic airspace by 2027.
QUALITATIVE REDUCED TRAVEL
TIME FOR AIRLINES
• Flying more efficient routes enabled by ADS-B technology would result in anestimated 3 minutes of time saved per travel or a total of 5,000 flying hours inCanada every day.
3.3.2.1 Reduction of CO2 emission per flight
Air transportation is responsible for 2% human-made global CO2 emissions per year. This translates into an IATA estimation of 859 million tons of CO2 discharged by aircraft around the world, an airplane consuming an average 4 liters of kerosene per second. Given the forecast of air traffic evolution up to 2036, these emission figures will continue to increase and might surpass other transportation means. Historically, the airline industry has not faced any sanctions nor an offsetting scheme to make amend for contributing to global pollution. This is now changing, the ICAO having adopted in 2017 the Carbon Offsetting and Reduction Scheme for International Aviation (CORSIA) and other CO2 emissions reduction incentive or mandatory schemes, encouraging long-term efforts up to 2050.

EUROCONSULT FOR THE CSA
SOCIO-ECONOMIC BENEFITS OF SPACE UTILIZATION | FINAL REPORT 55 |
3.3.2.2 Air traffic augmentation over Canada
The world’s total number of air passengers is set to double by the end of 2036. Canadian air routes are forecast to follow that trend. Private aircraft manufacturers like Airbus or public institutions such as the ICAO forecast that revenues per passenger kilometer (RPK) in North America will follow the world’s growth average of 4.5%. Canada, which administrates the third largest airspace in the world, has a lot to gain from augmented air traffic permitted by reduced aircraft separation enabled by space-based ADS-B. More routes shall be created, resulting in a higher number of airplanes flying in the same airspace and increased fees which can be charged. Separation reduction between aircraft results in a higher number of airplanes flying through or over Canada, translating into more airport, en-route and in-flight service fees collected by NavCanada. NavCanada sets three specific type of fees regarding air traffic flying over Canada: airport/terminal fees, en-route fees and service fees. The first concerns the payment of navigation services provided to an aircraft whilst on the ground; the second is applied every time an airplane goes through a specific airspace and is calculations may vary according to the nature of the zone considered (oceanic vs over-ground); and, thirdly specific fees apply to transit in the Gander oceanic zone.
These fees impact the financial results of NavCanada. It unveiled financials results close to $1.3 billion in revenues at year-end August 2017. Being a non-profit organization, NavCanada reinvests its profits into either infrastructure renewal, redistribution to its clients or a decrease of fares for subsequent year. Revenues also translate in tax payment to Canada, with $14 million due in 2017, and $55 million deferred tax liability owed to the government. Applying the anticipated growth in the industry, this would mean tax payments estimated at $19 million in 2027.
Revenues generated by NavCanada allow constant improvements in tracking systems/ground equipment to offer optimal service to airlines, whilst benefiting the country via tax payments.
Reducing airplane pollution
Also resulting in airline cost-savings for less fuel burned
Improved aircraft surveillance from ground control institutions permitted by ADS-B technology offers greater freedom to select more efficient altitude levels resulting in more fuel-efficient flights. Studies conducted by Aireon and NavCanada forecast an approximate 320,000 tons of CO2 equivalent emission reduction to be observed over the oceanic Gander-Shanwick airspace alone in 2018. This leads to an estimated cumulated reduction of 27.6 million tons of CO2 equivalent emission across the whole of Canadian controlled airspace by 2027.
The Gander oceanic airspace case may be extended to similar Canadian areas, in terms of size and difficulties in monitoring, such as the Northern territories, where classical terrestrial surveillance means do not allow precise aircraft surveillance.
On a global level, this trend also supports airlines, which can save up to $225 for each carbon dioxide ton they are able to reduce from normal activity and allows them to comply to new international air transportation reduction standards set by the ICAO. This $225 economy per CO2 ton translates to an estimated cumulated economy of $930 million across the three major Canadian airlines, i.e. Air Canada, Westjet and Porter, by 2027, from their daily operations.

EUROCONSULT FOR THE CSA
SOCIO-ECONOMIC BENEFITS OF SPACE UTILIZATION | FINAL REPORT 56 |
3.3.2.3 Enabling more efficient airline routes.
New air routes opened over Northern territories result in direct profit augmentation for Canada through air traffic fees. Flights numbers published by NavCanada show increases in the number of flights through Canada’s polar routes, from 1,000 in 2003 to 16,000 in 2016. This trend applies to domestic flights as well as international flights transiting over the country. All flights transiting pays mandatory en-route fees as outlined in the previous section. Altogether, the enabling of new polar routes, supported by satellite-based ADS-B technology providing continuous position updates between aircraft and ground control, will result in approximate cumulated taxes, paid by NavCanada to the government, of $400,000 by 2027.
This is corroborated by ICAO predictions, depicting South East and West Asia destinations, originating or going to North America, among the fastest growing in terms of passenger numbers. Space-based ADS-B technology will be a major enabler to open new routes over Canada’s polar region, its success demonstrated by the Hudson Bay airspace opening case, where the first Canadian usage of ADS-B was made in 2010, an approximate 850,000 km2 of previous coverage gap being eradicated. Aircraft separation requirements in this zone were reduced from 80 to 5 nautical miles.
3.3.2.4 Passenger safety enhancement
Passenger safety is obviously paramount on all airline flights. The Manual on Airspace Planning Methodology for the Determination of Separation Minima specifically defines separation as the action from ATC institutions to maintain airplanes in operations at distances large enough to secure the risk of collision below a predetermined level. The methodology utilized to determine these vertical and longitudinal time or distance-based separation standards considers a collision factor labeled Target Level of Safety (TLS). This parameter, central in the separation minima calculation equations, is established proportionally to the quality of information accessible to ATC institutions and the flight pilots, given the minimum technology requirements accounted by international standards.
Following a data collection session performed with Aireon, the company states that long limited communication times occurring in remote areas such as oceanic airspaces are problematic, aircraft can fly at the wrong altitude or too close to another airplane, with corrective instructions from ATC ground stations taking too much time to reach pilots to change course.
Actual official TLS figures range between 0.02 to 0.005 fatal collisions per every million flight hours. However, information collected during the data collection process indicate current achieved TLS figures of 0.035 to 0.008. A complete space-based ADS-B implementation in the airline industry by 2020 could provide a 76% improvement towards complying to official Target Level of Safety standards. This is thanks to reduced latency in ATC transmissions, helping airlines comply to international safety laws at all times during flights.
The technology can also help better flight tracking in case of an incident and to be able to help mitigate against future accidents. For instance, Malaysia Airlines Flight 370 which disappeared over the Indian Ocean would have been able to be tracked; communications with ATC centres ceased not long after take-off, however the plane could still be tracked if fitted with an ADS-B transponder.
3.3.2.5 Airlines improved cost-efficiency
Aircraft are designed and manufactured for optimal performance and fuel efficiency. To put it into perspective, during cruise, a Boeing 747 consumes around 4 liters of kerosene per second for an average
EUROCONSULT FOR THE CSA
SOCIO-ECONOMIC BENEFITS OF SPACE UTILIZATION | FINAL REPORT 57 |
engine power use of 25% engine power. The same aircraft during a climb, will consume approximately 26 liters of kerosene per second for an engine power use of 80%. Therefore, airlines business strategies aim to minimize as much as possible the time spent climbing, favoring the most direct and vertical climb trajectories to reach cruise altitude.
However, international safety regulations and constraints often force pilots to extend climb phases following take-off, breaking down climbing sequences into multiple segments, adding extra cost to each flight due to increased fuel consumption and flying at non-optimal altitude. Studies performed by NavCanada over the Gander-Shanwick airspace concluded that reduced flight separation constraints enabled by ADS-B would allow 450 liters of fuel saved per flight, translating to a $100 million/year in cost savings once ADS-B is fully implemented in 2020. There is the possibility for this to translate into lower cost airfares for the passenger.
Better managed flights can also result in reduced flight times and further savings on fuel. Aireon stated that flying more efficient routes enabled by ADS-B technology would result in an estimated 3 minutes of time saved per travel. Considering there are over 100,000 flights a day, this translates to 5,000 flying hours/day. To the Canadian Gander airspace case, this translates to 75 flying hours/day saved by flights traveling over the region. Given the predicted air travel market expansion, this could also benefit reducing airline delays, improving airport logistics and enable improved flight scheduling. Reducing airline travel times and delays also have further benefits. Studies performed on US economic impacts related to flight delays indicate unfavorable consequences on labour productivity during business travels, negative impacts on tourism etc. Results available show that net welfare in the US could potentially increase by more than $15 billion with a 10% flight delay reduction.
3.3.2.6 Remembering the role of GNSS
The aforementioned benefits largely focus on new technology areas, however, the role of GNSS and GPS in particular should not be ignored. More than 100,000 flights take off on a daily-basis, with on average more than 9000 aircraft in the air at any moment, a trend forecast to consistently increase in the next decades. Satellite GPS technology is the key enabler of such an expansion in air travel and ATC capabilities, by supplying geolocation coordinates to every airborne passenger or freight carrier, allowing them to compute their instantaneous location around the globe, and relaying the information to ground operators orienting the traffic. Using a benchmark developed for the U.S. aviation market, efficiency benefits of GPS on Canada’s commercial aviation sector translate into a GDP impact of at least $25 million annually; with the technology acting as a key enabler to the critical $81 billion national industry which carried more than 91 million passengers and delivers 1.15 billion tonnes of freight in 2017. 60 While other technologies are also essential to aviation, switching to space-derived navigation allowed a global standardization of ATC and lowered operational costs for guidance-providing institutions and airlines.
A receiver is required on board aircraft to acquire and perform calculations on GPS-supplied data, rather than the traditional approach of having multiple communication technologies embarked to accommodate a number of ground-based navigation services that varied depending on regional regulations and modes of operation. The current reliance on GNSS systems, and GPS in particular, for air navigation is linked to the existence and geolocation correction services provided by a space-based complementary system to GPS; the Space-Based Augmentation System (SBAS). Demanded by ATC institutions, the main objective of SBAS is to provide support to the civil aviation industry in tracking aircraft around the globe and adding
60 “The economic value of GPS: preliminary assessment”. Leveson. I (2015). Retrieved from: https://www.gps.gov/governance/advisory/meetings/2015-06/leveson.pdf

EUROCONSULT FOR THE CSA
SOCIO-ECONOMIC BENEFITS OF SPACE UTILIZATION | FINAL REPORT 58 |
precision to GPS geolocation methods by correcting diverse errors intrinsically tied to the space-based nature of GPS.
SOLUTIONS UTILIZED IN CANADA
3.3.3.1 Satellite Solutions
ADS-B transponder technology consists of transmitters and receivers equipped on aircraft. It relays real-time information about position, direction of flight, altitude, airborne velocity, climb and descent information etc., of the transmitting airplanes. Transmissions are conveyed using the ITU-regulated 1090 MHz frequency band. Provided both parties have compatible ADS-B installations, communications may be enabled between: two aircraft in operation, an airplane and airport, or ARTCC station, or a remote ADS-B ground receiver. The ADS-B data distribution system relies on GPS/GNSS satellites as its core input, the geolocation information being processed by the carrier internal instruments before being disseminated.
A satellite communication relay is then used to transmit information. In remote regions this is often the only possibility. Satellite systems carrying ADS-B transponders are now entering the market: Aireon is implementing such technology into the payloads of the Iridium NEXT constellation, therefore providing a global coverage and similar performances to terrestrial ADS-B in terms of latency and information refresh rates. This solution will be fully operational once the last remaining Iridium NEXT satellite is launched into orbit, in mid-2018. As of June 2018, no official announcement has been made on another satellite constellation being equipped with ADS-B secondary payloads.
Governmental programs such as the Single European Skies ATM Research (SESAR) are currently looking for other innovative approaches to enhance their aviation management system. In this case, satellite-based communication was chosen, through a partnership with Inmarsat, Thales Alenia Space and the European Space Agency, as a way to distribute secure and high capacity cockpit transmissions, and to fulfill SESAR’s long-term objectives of optimizing the European airspace, reducing emissions due to air traffic, improve flight trajectories and minimize in-flight time and delays.
3.3.3.2 Alternatives
Terrestrial ADS-B has been implemented on land, a successor to the costlier radar-based ground technologies. At present, both systems are used concurrently and provide a complementary solution to the emerging space-based ADS-B. There is no real alternative to the space-based solution where ground infrastructure doesn’t exist, such as over oceans. Therefore, the satellite solutions offer the only service offering anywhere at any time.
3.3.3.3 Potential blockages to future growth
Despite the ease of deployment of the ADS-B technology, some regions around the globe are too difficult to access or do not allow the installation of the adequate ground equipment to support the communication means. However, for most regions there are less constraints. Major flight regulation institutions have adopted the implementation of the system in their future policy. US and European Air Navigation Control institutions, the FAA and EUROCONTROL, are requesting all commercial aircraft to comply with the ADS-B Out regulations set by these agencies by 2020. NavCanada has adopted the same strategy and will require all aircraft traveling from or through Canada’s airspaces to follow these regulations.

EUROCONSULT FOR THE CSA
SOCIO-ECONOMIC BENEFITS OF SPACE UTILIZATION | FINAL REPORT 59 |
ENVIRONMENT MONITORING
ENVIRONMENTAL MONITORING UTILIZATION AND BENEFITS REVIEW
In terms of utilization of space-based assets, environmental monitoring is first considered an application for EO – Earth observation from monitoring of various environments can be considered the first application of imagery for civil purposes. However, there is also usage of low-data rate communications in collecting in-situ information on various environment variables.
For the purpose of this study, environmental monitoring is considered in three ways: global monitoring for climate change research in support of government policy; the impacts of better monitoring local environments and ecosystems; and the impacts of the population/industry on the local environment and ecosystems, with potential implications for wider global environmental monitoring.
Climate change remains at the top of government policy agendas, and R&D focused space agencies globally have aligned certain activities to the collection of data to support environmental monitoring. The main benefits are being able to support government policy on mitigating the short, medium and long-term impacts of climate change, as well as other tangible areas in support of sustainable development (urbanization, resources management etc.), and populations at the forefront of climate change impacts (food security, air quality, severe weather, increasing natural disasters etc.). On the other side of the equation, the need is there to understand better how the Earth works, and how the terrestrial, oceanic and atmospheric environments interact, for instance, in building longer-term numerical meteorological forecast models, understanding of global carbon stores, trends in greenhouse gas emissions etc.
These variables generally consider more global data collection. More localized collection is required, also to collect data to support research, but further elements are brought, such as in how to support individual populations or businesses. For instance, forests can be monitored as to their environmental significance as carbon sinks, but also to better manage forests by monitoring aspects such as deforestation and illegal logging. Activities such as the U.N.-REDD Programme (Reducing Emissions from Deforestation and Forest Degradation) support such roles. 61 Benefits here lie in better land/forest management and in support of forest regeneration. Further aspects lie in the implications of a changing environment. Shifting sea ice, sea ice melt etc. has implications for local populations and passing vessels; weather changes equally can have impacts on populations and local governments.
More localized monitoring is also needed to monitor activities of populations and industry in order to measure impact they may be causing to the environment. Of growing interest are the impacts industrial activities have had or are having on local environments. For instance, in monitoring the clean-up and regeneration of mine sites/tailings ponds or in monitoring industry for emissions and the impacts on the local environment. Businesses themselves are also playing larger roles to support Corporate Social Responsibility (CSR).
LITERATURE REVIEW OF APPLICATION UTILIZATION
3.4.1.1 Satellite Communications
61 “UN-REDD Programme“. United Nations (2018). Retrieved from: http://www.un-redd.org/

EUROCONSULT FOR THE CSA
SOCIO-ECONOMIC BENEFITS OF SPACE UTILIZATION | FINAL REPORT 60 |
Satcom is used in environment monitoring for the transmission of measurements taken by in-situ sensors (e.g.: chemical composition of oceans, salinity, ice levels, temperature, pollution, oil wellhead pressure, etc.) to receiving stations. This typically involves narrowband communication links using low data rates (such as IoT/M2M). As in-situ sensors are often located in remote areas and/or in harsh environments, satellite represent a suitable solution for relaying the information from the sensor to the ground station for the subsequent dissemination to the end-users (scientists, corporations, government departments/agencies, etc.). If the object being monitored is mobile, the information collected is combined with GPS to provide the location of the sensor. Multiple initiatives worldwide utilize satellite-based solutions for environment monitoring. Argo for instance, is an international satellite-based ocean climate monitoring system composed of approximately 4,000 drifting floats equipped with autonomous beacons. The floats measure the temperature and salinity of the oceans.
The use of satcom can result in cost savings and increased operational efficiencies compared to manual data collection. For instance, a study conducted by Pacific Data System in Australia, has shown that the integration of satcom into Queensland mines’ bore water monitoring system could reduce cost from $2000/month (for data collected manually once a month) to $1250/month (for the transmission of daily measurements via satellite). The use of satellites reduces staff travelling to remote areas where the mine is located which in turn, also results in higher productivity and increased safety operations.62
Satcom and GPS technologies are also key for the monitoring of wildlife and to collect information on their migration patterns and behaviours. This information is used to protect species at risk and address environmental challenges such as climate change and biodiversity loss. CLS-Argos for instance, has tracked over 900 polar bears since 1981. This data has helped the Sea Ice Downstream Services for Arctic and Antarctic Users (SIDARUS) to demonstrate a strong correlation between the bear’s location and ice patterns. Similarly, more than 100,000 sea animals have been tracked since 1978 and about 200 land mammals and 4,500 birds are tracked each month.63
3.4.1.2 Imagery (Earth Observation)
The U.N.’s Global Climate Observing System (GCOS) set out 54 Essential Climate Variables (ECV) that are key for sustainable climate observations.64 These 54 ECVs (as set out here 65) are divided into atmosphere, ocean and land, including application variables such as measurements/monitoring of precipitation, sea ice, temperature, leaf area, air quality, soil moisture, fires etc. Leading space agencies such as NASA, ESA/EU, JAXA etc. have launched dedicated EO satellite capacity in order to collect information related to these variables in regular and continuous manner. Solutions are often then derived from non-space agencies with a close association between the agency collected data and the researching body. For instance, measurements of air temperature are provided monthly global by the Copernicus (E.U.) Climate Change Services, and implemented through the European Centre for Medium-Range Weather Forecasts (ECMWF);
62 “Remote Monitoring and Satellite Communications”. Pacific Data Systems (2018). Retrieved from: http://pacdatasys.com.au/media/21595b34-896c-46d9-90d8-3d864d91e424 63 “Wildlife Monitoring”. Argos (2018). Retrieved from: http://www.argos-system.org/applications-argos/wildlife-monitoring/
64 “The Global System for Climate: Implementation Needs”, U.N. GCOS (2016). Retrieved from: https://unfccc.int/files/science/workstreams/systematic_observation/application/pdf/gcos_ip_10oct2016.pdf 65 “The GCOS Essential Climate Variable (ECV) Data Access Matrix”. NOAA (2018). Retrieved from: https://www.ncdc.noaa.gov/gosic/gcos-essential-climate-variable-ecv-data-access-matrix

EUROCONSULT FOR THE CSA
SOCIO-ECONOMIC BENEFITS OF SPACE UTILIZATION | FINAL REPORT 61 |
NASA’s Soil Moisture Active Passive (SMAP) provides data on soil moisture and freeze-thaw state etc.66 Satellite utilization is quite varied depending on the information required to be collected. To provide an idea of the extent of the systems used, leading government programs launched 120 satellites over the last decade, the majority in support of research into environmental monitoring, for a combined satellite value of $17.5 billion.67
Further areas are growing in importance, responding to varying policy interests, such as building resilience to extreme weather and environmental events. Applications focus on predictions as to which areas may be susceptible (e.g., to flooding, strong winds, etc.), whereas the Arctic Council’s Monitoring and Assessment Program (AMAP) aims to provide objective scientific advice to support government efforts to manage impacts on the Arctic. Public health is a further area of concern, monitoring air pollution, for instance, and the link between atmospheric constituents and respiratory disease. The EC JRC in Europe ENSEMBLE platform models atmospheric chemistry and dispersion with data utilized combining meteorology systems with wide-area scanners (such as MODIS) and limb-sounding instruments, for the purpose of assessing air quality and mitigating the impacts of pollution.68
More localized studies have also been completed under the framework of the EU-led Copernicus initiative. A study of sea ice in Finland using SAR data (RADARSAT series, Sentinel-1, and archived ERS-1) combined with in-situ ice charts, demonstrated the importance of measuring sea ice to support navigation at sea. SAR data replaces the use of helicopters to help find the best routes through the ice: saving fuel and reducing the uncertainty in the ship arrival times at ports. The study concluded that between €24m and €116m per annum of economic value is being generated in Finland and Sweden thanks to the usage of satellite data.69
While the focus of environment monitoring is foremost government-orientated, the private sector is becoming more involved to comply with environmental regulations, such as in the oil and gas industry (exploration, exploitation and clean-up) and agricultural sectors (soil erosion, water pollution) and potential impacts on ecosystems. EO solutions, combined with in-situ measurements for instance, can be used to provide audits for compliance and environmental impact analysis.
3.4.1.3 Satellite Navigation
Due to the high degree of integration between GPS and satellite communications solutions, these applications are assessed together under the satellite communications section.
SELECTIVE BENEFITS TO ENVIRONMENT MONITORING IN CANADA
66 “Average surface air temperature monthly maps”. Copernicus (2018). Retrieved from: https://climate.copernicus.eu/resources/data-analysis/average-surface-air-temperature-analysis 67 “Satellite-based Earth Observation, Market Prospects, 10 edition”. Euroconsult (2017). *Noting that not all satellites are specifically for environment monitoring, the majority however have this as a focus – including all satellite from institutions such as NASA, ESA/EU, EUMETSAT, NOAA, and the majority from JAXA, CNES, DLR etc. 68 “ENSEMBLE model evaluation platform”. European Commission (2016). Retrieved from: https://ec.europa.eu/jrc/en/scientific-tool/model-evaluation-platform-ensemble 69 “Copernicus Sentinels’ Products Economic Value: A Case Study of Winter Navigation in the Baltic”. EARSC (2015). Retrieved from: https://earsc-portal.eu/pages/viewpage.action?pageId=35620366

EUROCONSULT FOR THE CSA
SOCIO-ECONOMIC BENEFITS OF SPACE UTILIZATION | FINAL REPORT 62 |
Environmental monitoring is a broad topic to cover, thus the benefits mentioned below are only considered to be a small sample of the wider benefits associated to the utilization of space-based assets. For instance, research and operational support to environmental monitoring is the largest civil government application for Earth observation imagery, and Canada, with its diverse, extensive land mass and coastal zone areas is no different. Indeed, research focused on Canada, such as the impacts of Carbon sinks in Canada’s boreal forest, measuring the extent of permafrost in monitoring climate change, and ice melt are just a few topics which are based in and around Canada, but with a global interest. Also, operational activities, such as the importance of weather services – although significant in enabling businesses, supporting transportation, public safety etc., and which satellite-based Earth observation plays an essential role – is not covered specifically. Instead, the study concentrates on a few specific benefit cases which were discussed during the consultation process.
The benefits from the use of satellite-based assets to support environment monitoring are perhaps the most diverse of the six segments studied. Benefits to end-users span supporting government policy and regulations, enabling research into climate change and impacts on more localized ecosystems, and operational support for public health, and in support of business. Organizations developing these services can also fit into multiple camps: Environment Canada, and Canadian Ice Services for instance, conduct research into changes in ice melt, whilst also providing operational sea ices maps in support of the shipping industry. The selective benefits outlined below were those discussed during consultation.
SUMMARY OF SELECTIVE BENEFITS IDENTIFIED
TYPE BENEFIT
QUANTITATIVE
REPORTING ON ILLEGAL SHIPPING
• Over 200 oil anomalies detected by the CIS I-STOP services over 2013-2017, 39 ofwhich validated as discharge from ocean-going vessels.
INCREASED SHIPPING
EFFICIENCY
• Depending on ice conditions, vessels can take 7 to 21 days to navigate fromMontreal to Baffin Island. Using CIS ice charts, even marginal gains anticipated, inthe 10-20% range would imply a cost saving for the shipping industry of $5-10million during the Arctic shipping season.
SUPPORTING GLOBAL DATA COLLECTION
• Canada is part of the ARGO program, supporting ocean in-situ data collection forclimate modelling. Canada operates ~85 ARGO floats, with access to data fromover 4,000. Allowing Canada to provide better forecast models, and supportresearch across the country with studies having both national and globalsignificance
QUALITATIVE
GAINING ACCESS TO CLIMATE DATA
MONITORING LAND-USE PRACTICES
• Providing policy guidelines to support wetlands production and protect itssensitive ecosystem. Monitor the impacts of man-made intrusions into thewetland ecosystem, and identify at-risk areas
SUPPORT REGULATIONS FOR MINING
• Help build realistic regulation in which mining industries can follow to mitigatenoise and dust levels and impacts this may have on local wildlife population. Inthe future, imagery is expected to be further used to support mine-siterehabilitation; pilot studies already proving effective.
PROTECTING WILDLIFE
• Monitor environment impacts on Sable Island to support local seal and horsepopulations.

EUROCONSULT FOR THE CSA
SOCIO-ECONOMIC BENEFITS OF SPACE UTILIZATION | FINAL REPORT 63 |
3.4.2.1 Environment monitoring to support best land-use practices
Part of the role of NRCAN is to monitor natural habitats and ecosystems for change. Either through climate change, or through the more localized impacts of human activities. In this regard imagery is used to support policy decision making, and to identify areas at risk, or mitigate against areas which could become at risk.
A focus area of NRCAN is for wetlands monitoring. Wetlands act as a natural filter for what makes its way into the water system, thus the ecosystem is sensitive to surrounding changes. Changes in wetlands can be monitored by satellite imagery and areas at risk highlighted in order to provide supportive actions. What is causing the impacts can also be identified, for instance if there has been changes in surrounding infrastructure which may have altered the watershed – e.g. by causing areas to dry-up by disrupting natural irrigation channels. The objective being to be able to provide the right guidelines for wetlands production. This is monitored by measuring the ratio between moss and broadleaf vegetation using optical satellite imagery.
There is also a push from the industry-side to better manage local environments. For instance, the wetlands north of Yellowknife are mapped as to where there are peatlands, and where it is fenlands: peat burns, therefore it is important to know where these sources are in case of forest fires. The area is also a site of oil sand production, with interest here from the private sector to demonstrate how they are showing integrity by monitoring any changes in the local environment.
There are also concerns on human activities affecting the natural behaviour of wildlife. For instance, there are diminishing caribou herds in Canada – reasons which are not yet fully understood: human activity being one obvious area of suspicion. Digital Elevation Models from optical satellite data have helped build models to be able to do noise and dust modelling from industrial sites. If Caribou populations are in the area, it can halt production. In using satellite imagery to demonstrate fall-out of noise and dust, 1km “zone of implications” can be identified around mining sites for better management and wildlife protection. If caribou enter the zone, production is ceased until they exit the zone. Satellite imagery therefore supports more realistic, better regulation in which the mining industry follows to mitigate against impacts on local wildlife.
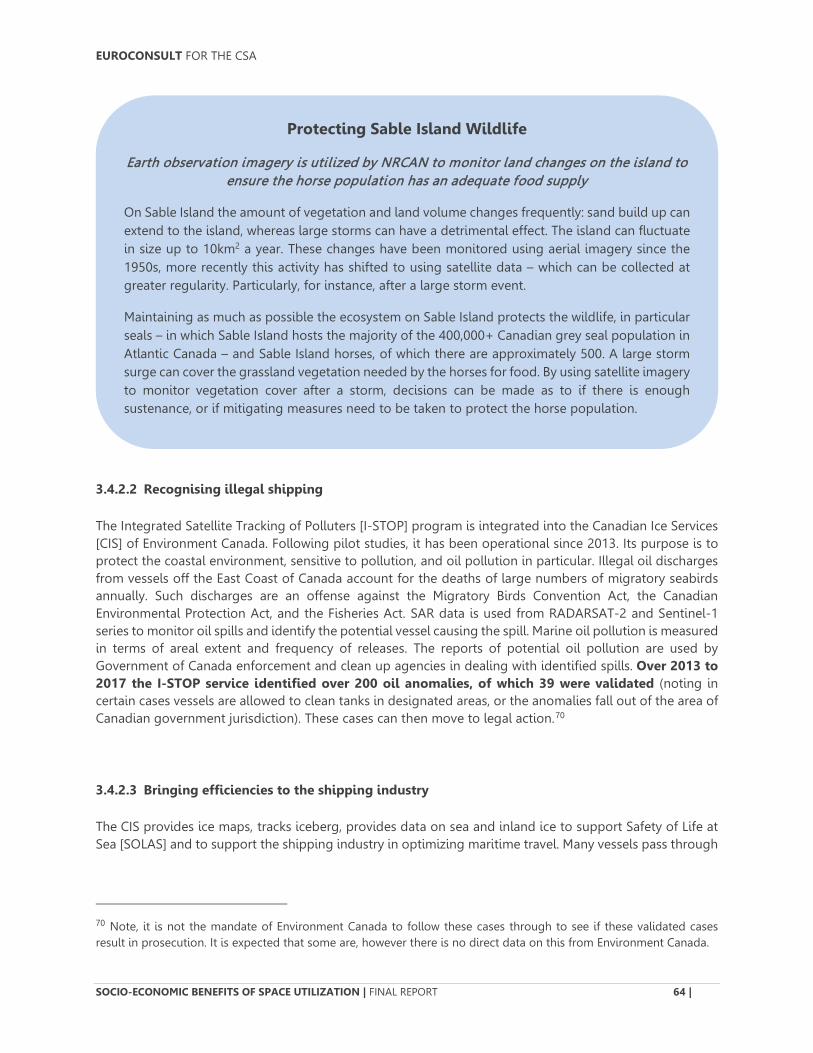
EUROCONSULT FOR THE CSA
SOCIO-ECONOMIC BENEFITS OF SPACE UTILIZATION | FINAL REPORT 64 |
3.4.2.2 Recognising illegal shipping
The Integrated Satellite Tracking of Polluters [I-STOP] program is integrated into the Canadian Ice Services [CIS] of Environment Canada. Following pilot studies, it has been operational since 2013. Its purpose is to protect the coastal environment, sensitive to pollution, and oil pollution in particular. Illegal oil discharges from vessels off the East Coast of Canada account for the deaths of large numbers of migratory seabirds annually. Such discharges are an offense against the Migratory Birds Convention Act, the Canadian Environmental Protection Act, and the Fisheries Act. SAR data is used from RADARSAT-2 and Sentinel-1 series to monitor oil spills and identify the potential vessel causing the spill. Marine oil pollution is measured in terms of areal extent and frequency of releases. The reports of potential oil pollution are used by Government of Canada enforcement and clean up agencies in dealing with identified spills. Over 2013 to 2017 the I-STOP service identified over 200 oil anomalies, of which 39 were validated (noting in certain cases vessels are allowed to clean tanks in designated areas, or the anomalies fall out of the area of Canadian government jurisdiction). These cases can then move to legal action.70
3.4.2.3 Bringing efficiencies to the shipping industry
The CIS provides ice maps, tracks iceberg, provides data on sea and inland ice to support Safety of Life at Sea [SOLAS] and to support the shipping industry in optimizing maritime travel. Many vessels pass through
70 Note, it is not the mandate of Environment Canada to follow these cases through to see if these validated cases result in prosecution. It is expected that some are, however there is no direct data on this from Environment Canada.
Protecting Sable Island Wildlife
Earth observation imagery is utilized by NRCAN to monitor land changes on the island to ensure the horse population has an adequate food supply
On Sable Island the amount of vegetation and land volume changes frequently: sand build up can extend to the island, whereas large storms can have a detrimental effect. The island can fluctuate in size up to 10km2 a year. These changes have been monitored using aerial imagery since the 1950s, more recently this activity has shifted to using satellite data – which can be collected at greater regularity. Particularly, for instance, after a large storm event.
Maintaining as much as possible the ecosystem on Sable Island protects the wildlife, in particular seals – in which Sable Island hosts the majority of the 400,000+ Canadian grey seal population in Atlantic Canada – and Sable Island horses, of which there are approximately 500. A large storm surge can cover the grassland vegetation needed by the horses for food. By using satellite imagery to monitor vegetation cover after a storm, decisions can be made as to if there is enough sustenance, or if mitigating measures need to be taken to protect the horse population.

EUROCONSULT FOR THE CSA
SOCIO-ECONOMIC BENEFITS OF SPACE UTILIZATION | FINAL REPORT 65 |
Canadian waters, and as a signatory to the SOLAS convention, Canada has a responsibility to ensure safety of navigation.
In support of safe shipping, and the shipping industry the CIS provides open source ice maps in which optimal routes through sea ice can be planned. These maps, based on RADARSAT-2 and Sentinel-1 data directly lead to cost savings to the shipping industry in terms of reducing the time spent at sea, and resulting cost-savings in fuel. Depending on ice conditions vessels can take 7 to 21 days to navigate from Montreal to Baffin Island. The CIS provides ice charts in order for vessels to select the optimal route, resulting is fuel cost savings, less impact on the environment and greater shipping operations efficiencies. This topic is further discussed in the “Transport” section of this report
Utilizing ice charts provided by the CIS, and augmented by further data sources, shipping is able to be performed safer, and with greater efficiencies in Arctic and sea ice prone waters. Approximately 100-200 large vessels pass through Canadian Arctic waters each year. Whilst the number is not vast, this movement is required to support local population and industries operating in the area, particularly mining. The variation in number is mainly a result of mining activities. For instance, up to 60 vessels may be in the water to support iron ore operations.
The Enfotec group and Fednav is responsible for Ice Monitoring and Analysis on behalf of its customers, it also operates three ice-breaker vessels of its own. It supplies ice navigation charts to its customers (mainly mine operations and their supply chain). The data supplied to the vessels is used to make the best routing decision whilst on-board. It provides solutions to approximately 25 vessels a year (mainly transporting cargo), of which around seven are winter voyages.
There has not been significant shift in the number of vessels passing through Canadian Arctic waters, and demand is not expected to shift too much due to sea ice. Enfotec sees this more along with fluctuations in the mining business. Thus, growth is likely to be more stable, with highs and lows dictated by outside forces: especially commodity prices. There will however remain a role for Fednav and government for supporting northern communities outside of the mining industry, thus increased traffic would also equate to population shifts. However, population of the north has been fairly stable, and even declined in places.
The data using satellite imagery provided by Enfotec is used to fine tune navigation. It is noted that the vessels need to pass regardless of the situation, thus while data is considered highly important, it is mostly used to bring marginal gains and comfort/early warning related to tougher ice conditions ahead.71 Nevertheless, costs of running vessels are high: there is a cost of $50,000/day to run an ice-breaker and fuel costs (based on current estimates run to $24,000/day. A cargo vessel’s cost is $14,000/day and $15,000/day in fuel. A 15-day voyage from Quebec City to Deception bay would cost a cargo vessel close to $500,000. These numbers can quickly add up. To run three ice-breakers for the 60-70-day season (i.e. when shipping routes are navigable during the summer) would cost over $14 million. In addition, 100 vessels on similar voyages as the example stated above would cost a total $50 million. Even marginal gains anticipated, in the 10-20% range would imply a cost saving for the shipping industry of $5-10 million during a quieter shipping season. There are also knock-on impacts to consider, such as bringing cargo faster to market, or being delivered to local population in a more efficient manner.
3.4.2.4 Improving weather forecasts through ARGO
71 Enfotec note the before satellite imagery, going back to the 1960/70s and before, vessels still needed to pass, so made do with on-deck observations transmitted by radio, and aerial surveys where available (though not overly common due to high costs)

EUROCONSULT FOR THE CSA
SOCIO-ECONOMIC BENEFITS OF SPACE UTILIZATION | FINAL REPORT 66 |
ARGO is an operational forecast system collecting information on sea ice and ocean state from numerous ocean-faring buoys or “floats.” Data is used to provide inputs into improved weather forecasting and numerical weather prediction. In particular, it provides better forecast for storm build up. Studies have demonstrated the need for a continuous operational data feed in order to assess coupling, linking the physical processes of the atmosphere and ocean in climate modelling. Research has shown that without ARGO data, ocean forecast models are degraded, and that it is an essential tool for ocean modelling.72
Data collected from the ARGO floats is transmitted through the Iridium constellation. Of the 4,000 ARGO floats in operation, 85 are operated by Canada through the Department of Fisheries and Oceans (DFO). The operations budget to manage data collection is $30-50k/year, of which most (80%) related to commercial contracts in accessing the Iridium constellation. Considering a 4-5-year life span for each float, and a replacement cost of $20-25k per float, the total annual budget is on the range of $400k/year to support Canada’s involvement in the program.
Each float provides an ocean profile up to 2km below the surface every 10 days (once descending the float drifts for approximately nine days before reaching the surface to transmit data to the satellite), providing information on ocean salinity (by measuring conductivity) and sea surface temperature. There is a push to expand the ARGO system to include data collection on other parameters, such as measuring chlorophyll and pH. This addition of sensor and data transmission could increase costs; however, it is hoped that costs can be kept stable by reducing costs of satellite data transmission.
All data is made public from the program within 24hrs of collection. Although Canada operates only 2% of the total number of floats, as a partner in the program it has access to data across the system. The Canadian (Canadian Operation Network of Coupled Environmental PredicTion Systems) (CONCEPTS) Global Ice Ocean Prediction System (GIOPS) assimilates Argo data on a weekly basis. In addition to providing inputs to weather forecast models, data is used for further research, for instance, Argo floats deployed in the Labrador Sea are an important element of an NSERC Climate Change and Atmospheric Research project entitled VITALS (Ventilation, Interactions and Transports Across the Labrador Sea). Research is attempting to answer fundamental questions about how the deep ocean exchanges carbon dioxide, oxygen, and heat with the atmosphere through the Labrador Sea. New observations and modelling will determine what controls these exchanges and how they interact with varying climate, in order to resolve the role of deep convection regions in the Carbon Cycle and Earth System. Further, scientists from the Canadian Meteorological Centre assimilated real-time Argo temperature and salinity data in experimental mode in 2013. Results indicated better prediction skill than in the operational model that is currently being run by Environment Canada for issuing weather forecasts. Increased skill levels re mainly seen at forecast times of 48 hours and longer.
3.4.2.5 Mine site rehabilitation
It is expected that satellite imagery will play a greater role in operational site management on varying scales. For instance, satellite imagery has proved effective in being able to monitor mine sites rehabilitation. Using satellite and aerial imagery to monitor returning chlorophyll levels, an area of land 200km x 200km has been rehabilitated outside of Sudbury, Ontario. The land previously had high levels of sulphur dioxide, caused by smelting processes, and thus was too poisonous for use. Lime is added to the land in order to rebalance the pH. Satellite imagery can detect where this is working and where the land is becoming safe,
72 Source: “Assessing the impact of observations on ocean forecasts and reanalyses: Part 1, Global studies”, Oke P.R. et al, 2015

EUROCONSULT FOR THE CSA
SOCIO-ECONOMIC BENEFITS OF SPACE UTILIZATION | FINAL REPORT 67 |
or where further treatment is required. Approximately 100 more sites can be supported in a similar way in order to reclaim back land to make it safe and usable.
3.4.2.6 Oil shale monitoring
Although not as yet operational, the Government of Alberta, Environment and Parks is expected to start to use more Earth observation data over the next six to twelve months to systematically monitor the oil sands for any impacts on the environment. A process is underway to define what parameters are to be tested, and which data sets are to be used; government or commercial, depending on cost/cost-benefit.
SOLUTIONS UTILIZED IN CANADA
3.4.3.1 Satellite Solutions
In the case of satellite imagery, most data used is that which can be obtained freely. Either through government department data buy-in on RADARSAT-2, or through the wider use of freely available third-party data – in particular, the LANDSAT and Sentinel series’. The LANDSAT series also provides important time series data given the longevity of the system. MODIS provides further inputs for air quality monitoring.
In monitoring of habitats, such as wetlands monitoring, optical data is utilized (Landsat, MODIS, Sentinel-2). Whereas the Canadian ice services rely more in radar in order to be able to monitor ice. The CIS is one of the largest users of RADARSAT-2 scenes, nearly 14,500 were used in 2017. In addition, it used over 30,000 Sentinel-1 scenes. Having the addition of a further third-party SAR data source significantly increased the acquisition capacity and utility. Furthermore, over 80,000 image scenes were utilized from multiple sensors, including the weather satellite GOES and, MODIS, AVHRR and AMSR.
For sea ice charts, RADARSAT-2 is a major resource, and is the main tool of the CIS in building ice-charts. Enfotec however uses other datasets to build its own tailored services. This includes freely available Sentinel-1 data, and on occasions commercial data purchases. The commercial purchase is to obtain higher resolution data sets, approximately 10 images/year are acquired with the cost nominally passed on to the customer. In these cases, COSMO-Skymed and TerraSAR-X are the main sources. Enfotec note the responsiveness of TerraSAR-X ordering when they need a quick acquisition. Generally higher resolution imagery is needed when a vessel needs to totally avoid ice, rather than planning the best route through ice in which wider area coverage is a greater requirement. Given the higher resolution of RCM, the utilization of the system is anticipated – though again, for most usage, coverage is the key parameter.
The role of big data is expected to advance in the future. With increasing amounts of data being collected, ways to store and efficiently use the data will come in to question. The CIS note that RCM will bring an increased load of data, as will the expansion of the Sentinel-1 series, therefore what will be the best ways to integrate this new data supply and extract information. Automation is expected to play a greater role, as is the role of artificial intelligence in being able to provide predictive analytics.
3.4.3.2 Alternatives
The focus of organization interviews is research and development of operational services using only satellite-based assets. However, in a few specific cases there is some interest in terrestrial technologies. The CIS for instance has interest in what the U.S. government is researching on the use of Global Hawk drones to monitor ice conditions. The drones have a flight time of 8-12 hours and can return data in real-time.
EUROCONSULT FOR THE CSA
SOCIO-ECONOMIC BENEFITS OF SPACE UTILIZATION | FINAL REPORT 68 |
Drones are also used for reconnaissance purposes, such as to monitor the passing of a specific vessel or cargo, or through a particular route. However, this activity (supported through Transport Canada) is considered marginal, culminating in approximately 200-300 flying hours a year.
Also, to note, for satellite-based Earth observation, the ARGO system, despite using satellite technology for data transmission, is an in-situ alternative to using imagery. Satellite imagery is also being used to collect frequent data on environmental variables. The advantage of the ARGO system being that it can transmit in real-time. The advantage of satellite being that it has global coverage. In this regard, when it comes to research into aspects of environmental monitoring and climate change, it is not a case of using one data type or another but using information from multiple sources.
Alternatives to ARGO exist but are considered too costly or complementary. Data for instance can be collected by ships. However, the price point for data collection from a single point from a vessel is $10k, whereas float can be used repeatedly. Noting that there are over 4,000 ARGO floats in operation, to collect data from vessels would be 100 times costlier. Satellite-based imagery is a further alternative – however the systems are considered more complimentary. Whereas ARGO provides a profile, it cannot collect surface temperature; whereas a satellite can collect data at the surface, in particular sea surface temperature but cannot profile. There is also the matter of coverage: whereas ARGO can offer very accurate point data, satellite imagery may be coarse resolution, but they have a wider area coverage.
Enfotec have tried using drone technology to support sea ice data collection, though costs are high. Drones operated from the ship can provide the beyond-line-of-sight vantage point but the cost-benefit is not obvious. The cost of the drone, plus staff on-board the vessel operating the solution does equate to significant gains compared to what can be achieved from satellites.
3.4.3.3 Potential blockages to future growth
Again, government budgets remain an issue for further data use beyond free datasets, and there is limited commercial imagery procurement. The sector somewhat relies on free data outside of very specific cases.
REMOTE/RURAL COMMUNITIES

EUROCONSULT FOR THE CSA
SOCIO-ECONOMIC BENEFITS OF SPACE UTILIZATION | FINAL REPORT 69 |
REMOTE/RURAL COMMUNITIES UTILIZATION AND BENEFITS REVIEW
The following topic is primarily focused on the utilization of space assets for the provision of broadband internet access in rural and/or remote communities which are either unserved or underserved by terrestrial broadband access technologies such as fixed-line (cable, DSL, fiber) and wireless (3G/LTE, WiMAX) solutions.
In terms of global context, broadband internet connectivity is increasingly considered as a basic universal right with governments, international institutions and the private sector having widely acknowledged the importance of bridging the digital divide to help foster economic growth and social inclusion while also meeting rapidly growing consumer demand. 73 From a purely economic perspective, growth in broadband internet penetration has been positively linked to higher economic (GDP) growth by the World Bank and OECD in both developed and developing countries, helping improve the ability to compete and sustain economic growth in the world’s increasingly digital economy. 74 Further, past studies on the U.S. market have linked investment (capex) in satellite broadband infrastructure to job creation at a ratio of roughly one job per $70,000 in spending, including multiplier effects.75
Despite marked improvement in the global base of individuals using the internet, which reached nearly 3.6 billion people as of 2017 according to recent ITU estimates, roughly 4 billion people (or 54% of the world’s population) are still offline.76 While several critical issues including illiteracy, lack of local content and affordability act as major inhibitors to further internet adoption, the lack of adequate broadband infrastructure remains an important challenge. To illustrate, it is estimated that over 1 billion people still lived outside the range of a 3G network, or higher, as of mid-2017. 77
While the vast majority of these “offline” and “uncovered” populations are located in developing regions such as Sub-Saharan Africa and Asia, it is important to note that non-negligible populations in developed countries are either unserved or underserved by adequate broadband infrastructure, notably in rural communities. For example, only 42% of households in the rural U.S. had access to fixed broadband services of 25/3 Mbps (down/up), the Federal Communications Commission’s (FCC) new standard definition for broadband, while just 6% of these rural households had a choice of competitors. 78
73 “The State of Broadband 2017: Broadband Catalyzing Sustainable Development”. UNESCO/ITU Broadband Commission (2017). Retrieved from: https://www.itu.int/dms_pub/itu-s/opb/pol/S-POL-BROADBAND.18-2017-PDF-E.pdf
74 “Impact of Broadband on the Economy”. ITU (2012). Retrieved from: https://www.itu.int/ITU-D/treg/broadband/ITU-BB-Reports_Impact-of-Broadband-on-the-Economy.pdf. Note: The International Telecommunication Union (ITU) has found that a 10% increase in national broadband penetration could raise economic growth between 0.25% and 1.4%.
75 “The Economic Impact of Broadband Investment”. Crandall R.W., Singer H.J. (2010). Retrieved from: http://internetinnovation.org/files/special-reports/Economic_Impact_of_Broadband_Investment_Broadband_for_America_.pdf
76 “The State of Broadband 2017: Broadband Catalyzing Sustainable Development”. ITU Broadband Commission (2017). Retrieved from: https://www.itu.int/dms_pub/itu-s/opb/pol/S-POL-BROADBAND.18-2017-PDF-E.pdf
77 “Global Mobile Trends 2017”. GSMA Intelligence (2017). Retrieved from: https://www.gsmaintelligence.com/research/?file=3df1b7d57b1e63a0cbc3d585feb82dc2&download
78 “Better together: Broadband deployment and broadband competition” Sallet, J. (2017). Retrieved from: https://www.brookings.edu/blog/techtank/2017/03/15/better-together-broadband-deployment-and-broadband-competition/

EUROCONSULT FOR THE CSA
SOCIO-ECONOMIC BENEFITS OF SPACE UTILIZATION | FINAL REPORT 70 |
Rapidly growing data consumption habits, notably driven by bandwidth-intensive applications such as streaming video, have led dozens of countries globally to revise their definition of broadband data rates sharply higher over recent years. For example, while no universal definition of broadband exists, speeds more than 256 kbps are considered as a threshold by the ITU. That said, the broadband downlink speed thresholds/targets now stand at 25 Mbps in the U.S (up from 4 Mbps in 2015), 25 Mbps in Australia and at least 30 Mbps in Europe (to 100% of households by 2020).79 While these data rates are relatively easily achievable in urban settings, economic challenges in upgrading/provisioning affordable broadband infrastructure in rural communities are leading to heightened risks of a widening digital gap.
Communications satellites have been relied upon over the past decades to deliver voice and high data rate connectivity services to communities in remote, harsh and/or low population density geographical locations where the costs of deploying terrestrial communications infrastructure is prohibitive. However, the traditionally high costs of satellite capacity and equipment have limited wider adoption of the technology for broadband services. While the rapid spread of mobile broadband networks has acted as the clear engine of recent growth of internet penetration globally, supported by wider adoption of low-cost smartphone devices, satellite’s role in helping bridge the digital divide is poised to expand. Rapid technological innovation occurring across the satellite value chain, paired with the inherent advantages of satellites, promises dramatic improvement in the competitiveness and cost of satellite broadband, lending further support to its role as a key enabler of a number of essential services such as education, citizen safety, banking, e-government and health in rural areas cost efficiency. 80
LITERATURE REVIEW OF APPLICATON UTILIZATION
3.5.1.1 Satellite Communications
Satellites serve as an important option to deliver broadband services to a wide variety of locations/users in rural and remote regions throughout the world such as residences, businesses, telecom operators, schools, hospitals and government offices. 81 Satellite broadband capabilities are typically delivered through two architectures; fixed direct-to-home/premise (also referred to as “last mile”) connections and the aggregation (“middle mile”) model, wherein satellites provide backhaul and/or backbone connections to the terrestrial internet backbone for fixed (internet service providers) and mobile network operators. 82
The consumer segment is the largest user of “last-mile” satellite broadband connectivity. As of 2016, an estimated 2.3 million households subscribed to satellite broadband internet services, including 1.9 million in North America. While consumer households are the final users, leading satellite broadband service providers include vertically integrated U.S. players Viasat and Hughes, Xplornet in Canada, Satellite Solutions Worldwide in Europe and NBN in Australia. These service providers, and others globally, combined to utilize an estimated 300 Gbps of satellite capacity in 2016, notably driven by the ever-
79 “Broadband Situations in Rural and Remote Areas”. ITU (2015). Retrieved from: https://www.itu.int/en/ITU-D/Technology/Documents/RuralCommunications/Broadband_Situations_in_Rural_and_Remote_Areas_Full.pdf
80 “Working Group on Technologies in Space and the Upper-Atmosphere Identifying the potential of new communications technologies for sustainable development”. UNESCO/ITU Broadband Commission (2017). Retrieved from: http://www.broadbandcommission.org/workinggroups/Pages/spacetechnology.aspx
81 “The evolving role of satellite networks in rural and remote broadband access”. OECD (2017). Retrieved from: http://www.oecd-ilibrary.org/science-and-technology/the-evolving-role-of-satellite-networks-in-rural-and-remote-broadband-access_7610090d-en
82 Idem
EUROCONSULT FOR THE CSA
SOCIO-ECONOMIC BENEFITS OF SPACE UTILIZATION | FINAL REPORT 71 |
expanding growth of video streaming associated with the rise of non-linear video services and consumption habits.
As of 2016, nearly 300,000 corporate (including SMEs) and government sites utilized high throughput satellites for direct-to-premise broadband access through very-small aperture terminal (VSAT) equipment, generating estimated capacity requirements (utilization) of roughly 50 Gbps globally. For the enterprise (corporate) segment, typical applications include cloud networking, enterprise-resource planning (ERP) systems, teleconferencing and more generalized internet use. In the government segment, applications include education (connectivity to schools, libraries, etc.), tele-medicine, tele-justice and a wide variety of e-government services delivered over the internet. Well over 1 million additional sites within the segmentare connected by satellite, but for non-broadband applications such as ATM and retail point-of-saleconnectivity, only low-data rate connectivity is required.
In terms of enabling “middle-mile” broadband infrastructure, cellular and other telecommunications network operators utilize satellite to extend the range of existing networks (cellular backhaul), to provide backbone links to the global internet, or to provide redundancy for terrestrial infrastructure. These satellite solutions are used at over 20,000, largely rural and/or remote, sites across the world, utilizing an estimated 175 Gbps of satellite capacity in 2016.
While the aforementioned use cases of satellites in connecting rural and/or remote communities typically involve commercial players, governments often play a direct or indirect role in funding/enabling satellite broadband solutions. For example, government funding may take the form of subsidies to end users (consumers) to help offset costs of customer equipment or to defray monthly service costs, as affordability of satellite broadband solutions remains a key “pain point” and inhibitor of adoption. Since costs to provide telecommunications services are higher in rural and remote areas due to sparse population and wider regions for the services to cover, some forms of government intervention are necessary to share the costs with commercial entities under public framework.83
To help concretely illustrate the breadth of the satellite broadband ecosystem globally, the following section provides country-level and regional examples of current/prospective satellite utilization activities for the provision of broadband services;
> The U.S. market counts over 1.7 million satellite broadband subscribers. While the market can beconsidered commercially sustainable, satellite broadband has benefitted from a variety ofgovernment funding mechanisms over the past years, including the Recovery and ReinvestmentAct (2009) and most recently from the “Connect America Fund”, to promote the availability ofadvanced telecommunications services at reasonable rates to the United States public.
> Australia’s government has invested upwards of $1.4 billion in two high throughput satellites, SkyMuster-1 and -2, and associated ground infrastructure (terminals, gateways) as part of its nationalbroadband network (NBN). The satellites, designed to offer universal minimum data rates of 25Mbps, offer a combined 135 Gbps of capacity and are expected to serve 220,000 rural householdsby 2020. Satellite broadband was retained as an optimal technology for connecting part of the 7%of people living in areas too remote/rural to justify investment in terrestrial technologies.
> In Brazil, satellites have seen rapidly growing utilization for broadband access. Embratel, is utilizinga 25 Gbps Ka-band HTS payload on its Star One D1 satellite to extend the 3G rural network coverageof its subsidiary, Claro. Hughes invested substantial capital in long-term Ka-band HTS capacity
83 “Broadband Situations in Rural and Remote Areas”. ITU (2015). Retrieved from: https://www.itu.int/en/ITU-D/Technology/Documents/RuralCommunications/Broadband_Situations_in_Rural_and_Remote_Areas_Full.pdf

EUROCONSULT FOR THE CSA
SOCIO-ECONOMIC BENEFITS OF SPACE UTILIZATION | FINAL REPORT 72 |
leases aboard Telesat’s Telstar-19V (31 Gbps) and Eutelsat 65WA (24 Gbps) to offer consumer services in areas of the country un-/underserved by terrestrial broadband, already reaching 60,000 subscribers since 2016.84 Concurrently, the Brazilian government invested nearly $1 billion in a 57 Gbps Ka-band HTS system called SGDC, in support of the country’s Broadband Plan (PNBL).
> In Thailand, over 26,000 schools are supported by Thaicom’s Ku-band HTS system, IPSTAR, allowingmore than 2,000,000 students access to online learning materials and IP-based applications suchas interactive distance learning through broadband internet connections (5/4 Mbps).85
> Argentina’s government recently approved construction of the Arsat-3 Ka-band HTS system as partof a public-private partnership. Offering 40 Gbps of capacity, the $250 million satellite will supportthe country’s broadband plan with its capability to serve up to 300,000 households across thecountry at speeds of 25 Mbps.86
> Mexico’s national connectivity initiative “Mexico Conectado” offers free satellite broadband in~30,000 sites (of more than 100,000) such as schools, health centers, libraries, community centers,parks and government buildings. 87 Due to the program’s high utilization, the government recentlyinvested in new Ka-band capacity, increasing the download speed to 6 Mbps at 12,500 sites.88
The adoption of high-throughput satellites (HTS) has enabled the delivery of significantly more capacity and higher data rates to end users at a reduced cost per bit as compared to regular satellites. Advances in transmission and reception technology at both ends of the communication path - including RF components, digital communication techniques, spectral efficiency, and terminal improvements - have developed to enable system operators to do even more with their input resources. 89 For example, while regular satellites have historically been capable of providing roughly 2 to 3 Gbps of aggregate capacity, the newest generation of active HTS systems now provide well over 200 Gbps of capacity, while HTS systems slated to launch in upcoming years are boasting capacity in the range of 500 to 1,000 Gbps. This massive upswing in capacity, a key to enabling broadband-centric applications, has been accompanied by asymmetrically lower increases in the overall costs of successive generations of satellites. This confluence of factors combines to drastically improve both the value proposition, through higher data rates and larger download caps, and affordability of satellite solutions.
While these high-throughput satellites have yet to offer global, redundant coverage, due in part to their relatively early-stage of adoption, coverage from geostationary HTS systems is expected to be ubiquitous within the next five years. Further, several high-throughput non-geostationary constellations featuring hundreds of satellites each are in planning, including those of OneWeb, Telesat and SpaceX. These
84 “Brazil’s Satellite Operators Protest Telebras-Viasat Deal, Demand Contract Transparency”. de Selding, P.B., SpaceIntel Report (2018). Retrieved from: https://www.spaceintelreport.com/brazils-satellite-operators-protest-telebras-viasat-deal-demand-contract-transparency/ 85 “IPSTAR Government: Education and Distance Learning”. Thaicom (2014). Retrieved from: http://www.ipstar.com/en/sol_gov_edu.html 86 “El Gobierno busca socio para construir el Arsat 3 pero pone condiciones”. Garabetyan, E., Perfil (2017). Retrieved from: http://www.perfil.com/ciencia/el-gobierno-busca-socio-para-construir-el-arsat-3-pero-pone-condiciones.phtml 87 “Mexico Conectado Infografias” Government of Mexico (2018). Retrieved from: http://www.mexicoconectado.gob.mx/?page_id=11201 88 “Mexico Conectado Project reaches 20 million Users a Month”. Telecompaper (2018). Retrieved from: https://www.telecompaper.com/news/mexico-conectado-project-reaches-20-mln-users-a-month--1236866 89 Working Group on Technologies in Space and the Upper-Atmosphere Identifying the potential of new communications technologies for sustainable development”. UNESCO/ITU Broadband Commission (2017). Retrieved from: http://www.broadbandcommission.org/workinggroups/Pages/spacetechnology.aspx
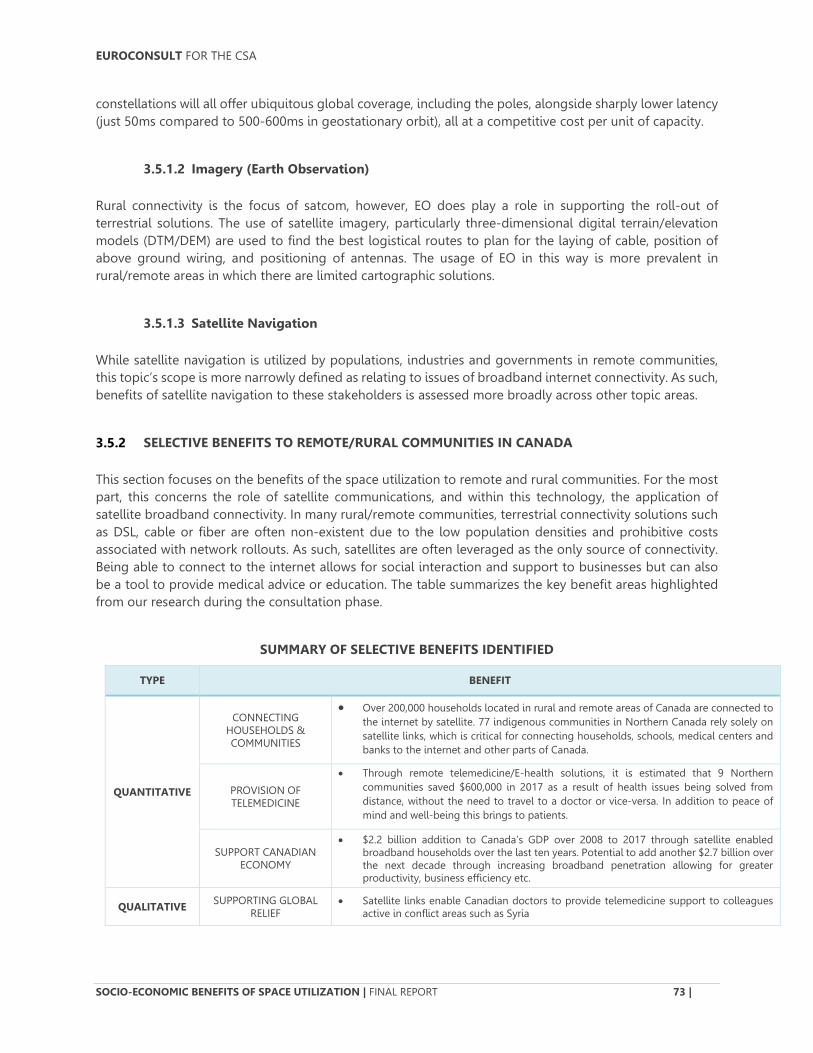
EUROCONSULT FOR THE CSA
SOCIO-ECONOMIC BENEFITS OF SPACE UTILIZATION | FINAL REPORT 73 |
constellations will all offer ubiquitous global coverage, including the poles, alongside sharply lower latency (just 50ms compared to 500-600ms in geostationary orbit), all at a competitive cost per unit of capacity.
3.5.1.2 Imagery (Earth Observation)
Rural connectivity is the focus of satcom, however, EO does play a role in supporting the roll-out of terrestrial solutions. The use of satellite imagery, particularly three-dimensional digital terrain/elevation models (DTM/DEM) are used to find the best logistical routes to plan for the laying of cable, position of above ground wiring, and positioning of antennas. The usage of EO in this way is more prevalent in rural/remote areas in which there are limited cartographic solutions.
3.5.1.3 Satellite Navigation
While satellite navigation is utilized by populations, industries and governments in remote communities, this topic’s scope is more narrowly defined as relating to issues of broadband internet connectivity. As such, benefits of satellite navigation to these stakeholders is assessed more broadly across other topic areas.
SELECTIVE BENEFITS TO REMOTE/RURAL COMMUNITIES IN CANADA
This section focuses on the benefits of the space utilization to remote and rural communities. For the most part, this concerns the role of satellite communications, and within this technology, the application of satellite broadband connectivity. In many rural/remote communities, terrestrial connectivity solutions such as DSL, cable or fiber are often non-existent due to the low population densities and prohibitive costs associated with network rollouts. As such, satellites are often leveraged as the only source of connectivity. Being able to connect to the internet allows for social interaction and support to businesses but can also be a tool to provide medical advice or education. The table summarizes the key benefit areas highlighted from our research during the consultation phase.
SUMMARY OF SELECTIVE BENEFITS IDENTIFIED
TYPE BENEFIT
QUANTITATIVE
CONNECTING HOUSEHOLDS & COMMUNITIES
• Over 200,000 households located in rural and remote areas of Canada are connected tothe internet by satellite. 77 indigenous communities in Northern Canada rely solely onsatellite links, which is critical for connecting households, schools, medical centers andbanks to the internet and other parts of Canada.
PROVISION OF TELEMEDICINE
• Through remote telemedicine/E-health solutions, it is estimated that 9 Northerncommunities saved $600,000 in 2017 as a result of health issues being solved fromdistance, without the need to travel to a doctor or vice-versa. In addition to peace ofmind and well-being this brings to patients.
SUPPORT CANADIAN ECONOMY
• $2.2 billion addition to Canada’s GDP over 2008 to 2017 through satellite enabledbroadband households over the last ten years. Potential to add another $2.7 billion over the next decade through increasing broadband penetration allowing for greaterproductivity, business efficiency etc.
QUALITATIVE SUPPORTING GLOBAL RELIEF
• Satellite links enable Canadian doctors to provide telemedicine support to colleaguesactive in conflict areas such as Syria

EUROCONSULT FOR THE CSA
SOCIO-ECONOMIC BENEFITS OF SPACE UTILIZATION | FINAL REPORT 74 |
REACHING BROADBAND POLICY OBJECTIVES
• New satellite systems and services are significantly improving the quality of service,enabling the government to reach its new universal broadband objective. New satelliteinvestments should double broadband download speeds for 200,000 households overthe next five years.
SUPPORTING JOBS IN RURAL AREAS
• Improved broadband allows for remote working, potential for home offices. Reducesindividual work stress/greater flexibility. Allows for better connectivity betweenindividuals/remote location offices etc.
SUPPORTING EDUCATION
• E-learning by satellite has resulted in 3 students graduating from High School inUlukhaktok (Northwest Territories) and accepted at university for the first time.
3.5.2.1 Bridging the digital divide between rural and urban Canadians
The term digital divide is used to describe the gap between people who have access to information technology through service availability and affordability and those that do not. Canadian government policy has encouraged broadband network deployments to rural and regional areas, with the result that a basic service of at least 5Mbps is almost universally available. The 2017 CRTC Communications Monitoring Report highlights that satellite networks are critical to provide nation-wide coverage and fill in the gaps left by terrestrial networks.
The critical importance of satellite for internet connectivity is most apparent in Northern communities. There are currently 77 indigenous communities in Northern Canada that rely solely on satellite links for their communication needs.90 In these areas there is no alternatives to communications infrastructure. Therefore, satellite is the only means for these communities to access news and information, and a lack of access would result in critical detriments for social inclusion. Moreover, it provides a critical communication link with other communities and the rest of Canada (whether urban or rural).
Multiple government funds have been established at federal and provincial level to meet the new universal broadband objective of 50 Mbps download speed. Through the Connect to Innovate fund, Northwestel received $50 million to build new satellite earth stations and network hubs to improve broadband delivery in 25 communities in Nunavut (Tarmarmik Nunaliit project). Following the successful launch of Telesat’s Telstar 19 Vantage satellite, planned for launched in the second half of 2018, Northwestel indicated that the infrastructure upgrade would increase speeds to 15 Mbps to every community, which is 3 times more than the current C-band network. In addition, it should provide better access for schools and health centres. Finally, the satellite project will foster financial inclusion, as 22 of 25 communities in Nunavut are unserved by physical banks, making on-line financial services an underappreciated vehicle for financial inclusion and its associated benefits (poverty reduction, higher savings, access to credit, etc.).
The economic benefits of this improved satellite-enabled connectivity for Northern Canada cannot be understated, particularly given the fact that employment growth in the rest of Canada has been increasingly related to knowledge and technology-intensive industries. 91
90 “Indu committee meeting” House of Commons (2017) Retrieved from: http://www.ourcommons.ca/DocumentViewer/en/42-1/INDU/meeting-85/evidence 91 https://www.ic.gc.ca/eic/site/eas-aes.nsf/vwapj/wp14e.pdf/$file/wp14e.pdf
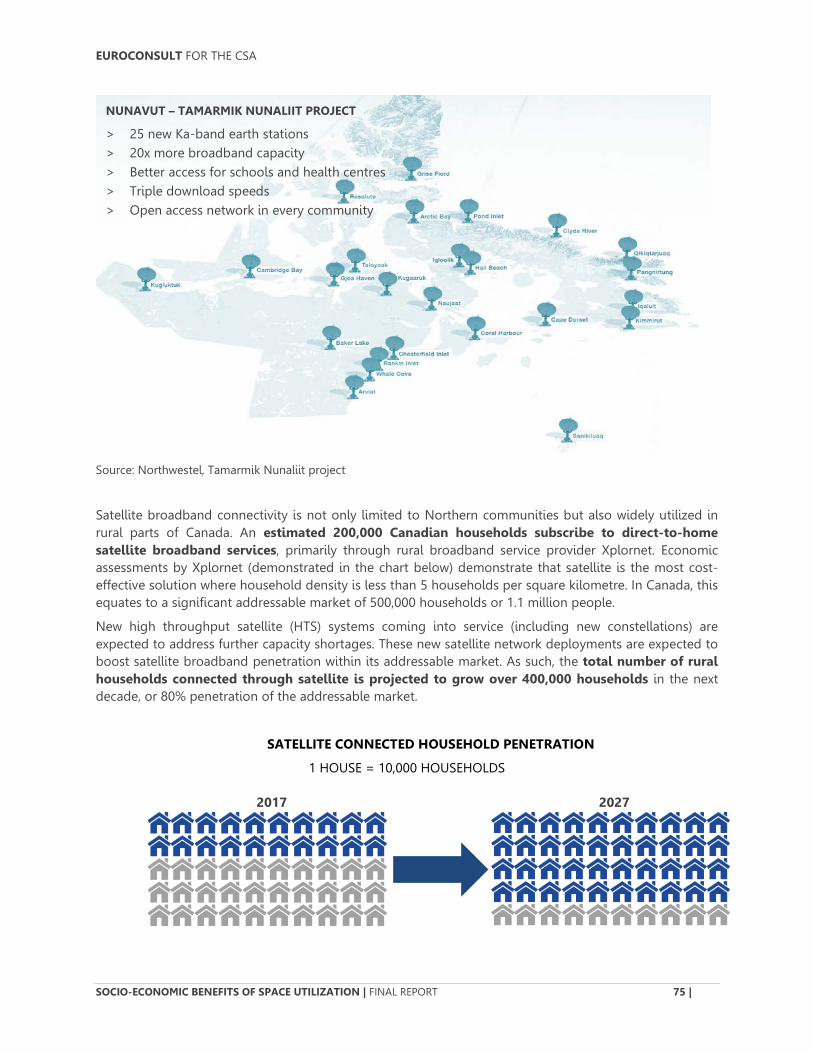
EUROCONSULT FOR THE CSA
SOCIO-ECONOMIC BENEFITS OF SPACE UTILIZATION | FINAL REPORT 75 |
Source: Northwestel, Tamarmik Nunaliit project
Satellite broadband connectivity is not only limited to Northern communities but also widely utilized in rural parts of Canada. An estimated 200,000 Canadian households subscribe to direct-to-home satellite broadband services, primarily through rural broadband service provider Xplornet. Economic assessments by Xplornet (demonstrated in the chart below) demonstrate that satellite is the most cost-effective solution where household density is less than 5 households per square kilometre. In Canada, this equates to a significant addressable market of 500,000 households or 1.1 million people.
New high throughput satellite (HTS) systems coming into service (including new constellations) are expected to address further capacity shortages. These new satellite network deployments are expected to boost satellite broadband penetration within its addressable market. As such, the total number of rural households connected through satellite is projected to grow over 400,000 households in the next decade, or 80% penetration of the addressable market.
SATELLITE CONNECTED HOUSEHOLD PENETRATION
1 HOUSE = 10,000 HOUSEHOLDS
2017 2027
NUNAVUT – TAMARMIK NUNALIIT PROJECT
> 25 new Ka-band earth stations> 20x more broadband capacity> Better access for schools and health centres> Triple download speeds> Open access network in every community
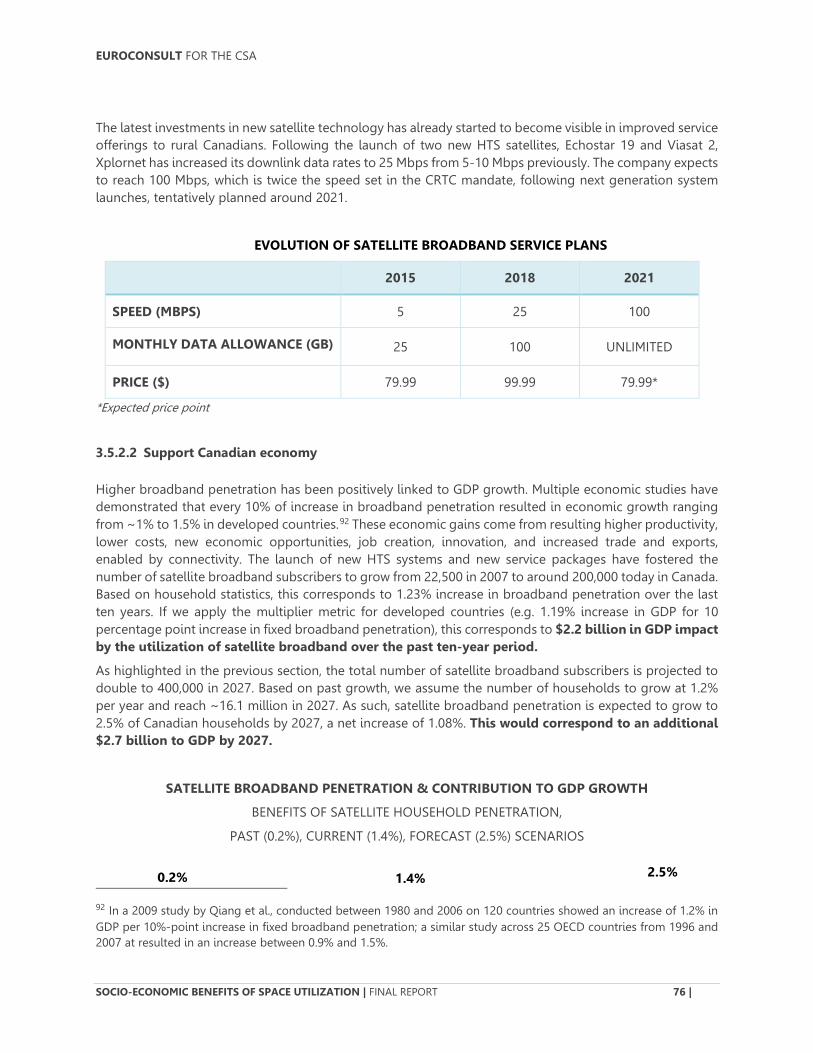
EUROCONSULT FOR THE CSA
SOCIO-ECONOMIC BENEFITS OF SPACE UTILIZATION | FINAL REPORT 76 |
The latest investments in new satellite technology has already started to become visible in improved service offerings to rural Canadians. Following the launch of two new HTS satellites, Echostar 19 and Viasat 2, Xplornet has increased its downlink data rates to 25 Mbps from 5-10 Mbps previously. The company expects to reach 100 Mbps, which is twice the speed set in the CRTC mandate, following next generation system launches, tentatively planned around 2021.
EVOLUTION OF SATELLITE BROADBAND SERVICE PLANS
2015 2018 2021
SPEED (MBPS) 5 25 100
MONTHLY DATA ALLOWANCE (GB) 25 100 UNLIMITED
PRICE ($) 79.99 99.99 79.99*
*Expected price point
3.5.2.2 Support Canadian economy
Higher broadband penetration has been positively linked to GDP growth. Multiple economic studies have demonstrated that every 10% of increase in broadband penetration resulted in economic growth ranging from ~1% to 1.5% in developed countries.92 These economic gains come from resulting higher productivity, lower costs, new economic opportunities, job creation, innovation, and increased trade and exports, enabled by connectivity. The launch of new HTS systems and new service packages have fostered the number of satellite broadband subscribers to grow from 22,500 in 2007 to around 200,000 today in Canada. Based on household statistics, this corresponds to 1.23% increase in broadband penetration over the last ten years. If we apply the multiplier metric for developed countries (e.g. 1.19% increase in GDP for 10 percentage point increase in fixed broadband penetration), this corresponds to $2.2 billion in GDP impact by the utilization of satellite broadband over the past ten-year period.
As highlighted in the previous section, the total number of satellite broadband subscribers is projected to double to 400,000 in 2027. Based on past growth, we assume the number of households to grow at 1.2% per year and reach ~16.1 million in 2027. As such, satellite broadband penetration is expected to grow to 2.5% of Canadian households by 2027, a net increase of 1.08%. This would correspond to an additional $2.7 billion to GDP by 2027.
SATELLITE BROADBAND PENETRATION & CONTRIBUTION TO GDP GROWTH
BENEFITS OF SATELLITE HOUSEHOLD PENETRATION,
PAST (0.2%), CURRENT (1.4%), FORECAST (2.5%) SCENARIOS
92 In a 2009 study by Qiang et al., conducted between 1980 and 2006 on 120 countries showed an increase of 1.2% in GDP per 10%-point increase in fixed broadband penetration; a similar study across 25 OECD countries from 1996 and 2007 at resulted in an increase between 0.9% and 1.5%.
1.4% 2.5% 0.2%

EUROCONSULT FOR THE CSA
SOCIO-ECONOMIC BENEFITS OF SPACE UTILIZATION | FINAL REPORT 77 |
Satellite broadband is not only expected to connect more households but also significantly improve the quality of service over the next decade. Economic studies (e.g. Ericsson 2013) have highlighted that doubling broadband speeds adds 0.3% to GDP growth. 93 As highlighted in the previous section, new satellite investments should increase satellite broadband download speeds in the future with 100 Mbps being achievable according to Xplornet. Higher speeds primarily improve productivity as more information can be transferred and stored online, which saves time for workers. Moreover, larger amounts of better quality information can be distributed than was previously possible, which can open up new creative and commercial opportunities. Finally, higher internet speeds can also create new jobs, either directly related to infrastructure upgrades (manufacturing of new satellite) or facilitate new indirect jobs (see next section).
3.5.2.3 Support Canadian Job growth
Job creation can be induced in direct or indirect forms from the creation of new satellite broadband networks. Firstly, it can create jobs directly related to the design, construction, and installation of satellite networks. Moreover, it has created hundreds of long-term jobs for customer services and support technicians, often located outside urban areas. For example, rural internet service provider Xplornet opened in 2017 a new contact centre in Cornwall, Ontario, employing over 120 people. The company currently employs over 800 people across Canada. Xplornet is headquartered in small town Woodstock, New Brunswick (population: 5,300) and has been repeatedly voted as Top Employer in Atlantic Canada.94 Unfortunately, the total number of jobs directly related to providing satellite broadband services could not be derived from available public sources. Past studies on the U.S. market have linked investment in satellite broadband infrastructure to job creation at a ratio of roughly one job per $70,000 in spending, including multiplier effects. As Xplornet has invested over C$1 billion in satellite capacity over the past decade, this would tentatively correspond to 14,000 cumulative jobs (direct, indirect, induced) created over that span.
Canada’s positioning within the space satellite industry provides the opportunity for the government and businesses invest in “homegrown” satellite technologies that create jobs while augmenting connectivity all
93 “New study quantifies the impact of broadband speed on GDP” Ericsson (2011) Retrieved from : https://www.ericsson.com/en/press-releases/2011/9/new-study-quantifies-the-impact-of-broadband-speed-on-gdp 94 “Xplornet celebrates official opening of its new regional office in Cornwall, Ontario” Cision, (2017) Retrieved from: https://www.newswire.ca/news-releases/xplornet-celebrates-official-opening-of-its-new-regional-office-in-cornwall-ontario-650618293.html
2017
14.2 million
Households
2027
16.1 million Households
Increasing penetration rate by 1.08% over
10 years
FORECAST: ~$2.7 billion added to
Canadian GDP
2007
12.6 million
Households
Increasing penetration rate
by 1.23% over 10 years
REALIZED: ~$2.2 billion added to
Canadian GDP

EUROCONSULT FOR THE CSA
SOCIO-ECONOMIC BENEFITS OF SPACE UTILIZATION | FINAL REPORT 78 |
across Canada. With multiple government investments of nearly $11.5 million, Advantech Satellite Networks will be able to develop new ground terminals and hubs that will enable high speed broadband access in rural and remote areas as part of a $30 million project. This repayable investment will help create more than 95 jobs in Quebec.95
Broadband can also provide equal job opportunities for people located in rural areas as job applications are increasingly processed online. Northwestel highlighted that many people in Northern Communities have not been able to upload their resumes to apply for jobs, either due to insufficient or a lack of broadband infrastructure.
Lastly, broadband can support innovation in the workplace with flexible work practices such as working from home possibilities (telecommuting). An unidentified number of employees working from home are dependent on satellite to communicate with the office. Telecommuting can not only reduce costs (e.g. office space, transportation) but also offer alternatives to urban migration.
3.5.2.4 Improving education in northern communities
Broadband allows for connected education, or tele-education to rural/remote communities. A student in rural regions can now have access to literature and teachers through satellite connectivity that they would not have otherwise. It also means that individuals, especially pupils, can learn without needing to migrate to urban centres.
95 “Government investing in space and satellite communications technologies to improve access to broadband in rural and remote areas” Cision (2018) Retrieved from: https://www.newswire.ca/news-releases/government-investing-in-space-and-satellite-communications-technologies-to-improve-access-to-broadband-in-rural-and-remote-areas-679403403.html
Supporting Tele-education and E-Learning
Providing education solutions to remote northern communities
Providing quality education is a challenge in the northern regions of Canada given their remoteness. Multiple research investigations show the gap between the Territories school standards and the rest of Canada. In 2016, two-thirds of Grade 12 students in Nunavut who took the Alberta standardized diploma exams failed to pass it. Many students want to have the opportunity to learn more but local areas lack the required facilities, some children travelling 500km+ to attend school.
E-learning offers a solution around this. In 2010, the Beaufort Delta Education Council started a pilotproject that allowed one student in the hamlet of Fort McPherson to take classes at Inuvik's East ThreeSecondary School via teleconference. This program, now called the Northern Distance Learning Program,connects a teacher in Inuvik with students in the territory, through satellite. The E-learning programhas now expanded to seven other communities — Tuktoyaktuk, Aklavik, Fort McPherson, FortLiard, Fort Resolution, Fort Good Hope Ulukhaktok, with a total of 35 students: satellite-broadband connectivity resulted in three students being accepted to University after graduatingfrom High School in Ulukhaktok, Northwest Territories; a first in the community’s history.
EUROCONSULT FOR THE CSA
SOCIO-ECONOMIC BENEFITS OF SPACE UTILIZATION | FINAL REPORT 79 |
3.5.2.5 Better health through tele-medicine
Digital health helps Canadians have access to better quality healthcare more efficiently, through digital solutions and services. This domain is expected to grow at a fast pace in the next few years fuelled by the widespread adoption of broadband access paired with a rapidly ageing population.
For residents in rural and remote areas of Canada, such as the Northern regions, telemedicine increases access to medical care, and ultimately improves health in these communities, which would otherwise be not available. Health Canada has a specific program called eHealth Infostructure Program or eHIP that focusses on the modernization and improvement of health care services in First Nations communities.96 The program provides connectivity funding to First Nations communities who use telehealth. Nine First Nations communities dependent on satellite have received funding under the eHIP program.
Ultimately, telemedicine, and underlying broadband connectivity, is able to increase access to services, leading to healthier Canadians, while at the same time decreasing wait times and health system costs for the government. Satellite plays a key role in the provision of telemedicine and positive health outcomes, notably in rural areas. For example, Quebec’s Northern region (including Nunavik), which is highly dependent on satellite technology for internet connectivity, boasts telemedicine adoption rates (per 10,000 inhabitants) that are at least 15 times higher than the urban Montreal region according to a 2015 study by McGill University’s Réseau Universitaire Intégré de Santé (RUIS).97
Telehealth sessions can save significant travel cost that would have been incurred if a patient had actually travelled instead of attending a telehealth session. Cost avoidance analysis across four provinces highlights that 10,300 telehealth sessions have saved $11.7 million in travel expenses (enabled by all access technologies). Based on these indicators, the cost savings in the nine First Nations communities dependent on satellite is estimated to be at least $600,000 per year.
Looking forward, identified aggregate cost savings measures can be expected to compound over the coming decades fuelled by a confluence of factors including growing adoption of telemedicine services in rural areas, as evidenced by the McGill telemedicine study, a rapidly ageing population and improved quality/availability of satellite broadband services.
Telehealth does not only improve Canadian lives but also makes an important impact in international humanitarian relief efforts. For instance, doctors based in Canada have been able to support relief efforts in Syria. Through satellite video connection, doctors are able to consult with other doctors and help during surgical procedure events. Dr. Ahmad Chaker, based in Ontario is one of a number of doctors who has helped on cases involving head injuries, and other trauma-related injuries on a voluntary basis.98
SOLUTIONS UTILIZED IN CANADA
96 “Evaluation of eHealth infostructure Program 2011-2013 to 2015-2016” Government of Canada (2017) Retrieved from: https://www.canada.ca/en/health-canada/corporate/transparency/corporate-management-reporting/evaluation/first-nations-inuit-e-health-infostructure-program-2011-2012-2016-2016.html
97 “Indicateurs de performance en télésanté”. Le Centre Virtuel de Sante et de Services Sociaux du RUIS McGill (2015). Retrieved from: http://telesantemcgill.ca/tswp/wp-content/uploads/2015/05/IndPerf_Q3_2014_2015.pdf 98 “Telemedicine connects Canadian docs to Syrians in bombed hospitals” CBC (2016) Retrieved from: http://www.cbc.ca/news/canada/windsor/telemedicine-canadian-syrian-doctors-1.3455895
EUROCONSULT FOR THE CSA
SOCIO-ECONOMIC BENEFITS OF SPACE UTILIZATION | FINAL REPORT 80 |
3.5.3.1 Satellite Solutions
Satellite broadband service delivery is mainly centred around a few key players. Xplornet is the largest rural internet service provider utilizing satellite and fixed wireless networks. For its satellite business, they lease full capacity over Canada on Echostar-17, Echostar-19, Viasat-1, and Viasat-2. It also leases some Ka-band capacity on Anik-F2 from Telesat. The company bundles capacity, connectivity and equipment into a single service and offers satellite broadband connectivity directly to rural households. SSi Micro also delivers internet services to northern communities (Nunavut and surrounding areas). As a satellite backbone provider using fiber and microwave for last mile access, lease C-band capacity from Anik-F2 and Anik-F3 (Telesat satellites). According to SSI, the benefit of C-band is that it covers all of the Northern regions with one beam which allows for phone calls without hops and reduces latency.
The increasing availability of high throughput satellite (HTS) capacity has substantially improved the availability, cost and quality of satellite broadband across Canada. Nonetheless, a shortage of affordable satellite capacity is still often highlighted by communities located above the 60th parallel north.
A next generation of HTS systems is expected to further decrease cost and increase available throughput over Canada including the North. Telesat has announced plans for a new satellite, Telstar-20V, potentially adding 40 Gbps more capacity over Canada’s North. Further, Telesat’s LEO high-throughput broadband constellation of nearly 120 satellites, prospectively slated to launch in 2021, will offer low latency coverage of all Canada, with strong coverage of Northern latitudes through a polar orbit. OneWeb’s proposed constellation of over 700 satellites will similarly provide blanket coverage of Canada, which is targeted as one of the operator’s first markets upon its expected limited service entry in 2020.
Satellite broadband is not only expected to connect more households but also significantly improve the quality of service over the next decade. New HTS systems coming into service are expected to address further capacity shortages. New constellation projects (OneWeb, Telesat and SpaceX) to be launched, on top of additional satellite from SES (SES-17), Telesat (Telstar 19V), Hughes (Echostar-24) and Viasat (Viasat-3) will offer uniform high-speed broadband services to consumers in rural and remote areas.
3.5.3.2 Alternatives
Available alternatives to satellite solutions currently being used in the market to provide broadband connectivity are fiber, DSL, cable and wireless connectivity. These solutions are widely deployed in urban and suburban areas, and partially available in rural areas. ITU World Telecommunication indicators for 2017 show that Cable and DSL are still the dominant terrestrial networks in Canada, connecting over 7 million subscribers for cable and 4.5 million for DSL. Fiber allows the highest data rates (≥1 Gbps) to the end-user, with little or no degradation over long distances. Fiber's downsides have been construction costs, which can limit roll-outs to areas with low household or business density, and its vulnerability to cuts if not properly installed. Nevertheless, fiber penetration has grown rapidly in recent years, largely at the expense of cable and DSL, having doubled from 2015 levels to reach over 1.3 million subscribers across Canada.
While mobile (cellular) broadband networks have extended their coverage across the country, the cost (and value) of mobile data plans cannot compete with fixed terrestrial network solutions. Fixed-wireless towers are now deployed and considered by Xplornet as the most economical solution for areas with 5-30 households per square kilometre. Wireless networks benefit from a low deployment cost however a relative limited reach (up to 15 km) compared to satellite. As mentioned in the section. Satellite is expected to remain the best cost-effective option for low density areas. Xplornet showcases satellite as the most effective solution for residential locations with household’s density <5 households per square kilometre. Basically, satellite is the only option and solution available for remote and rural households where fiber
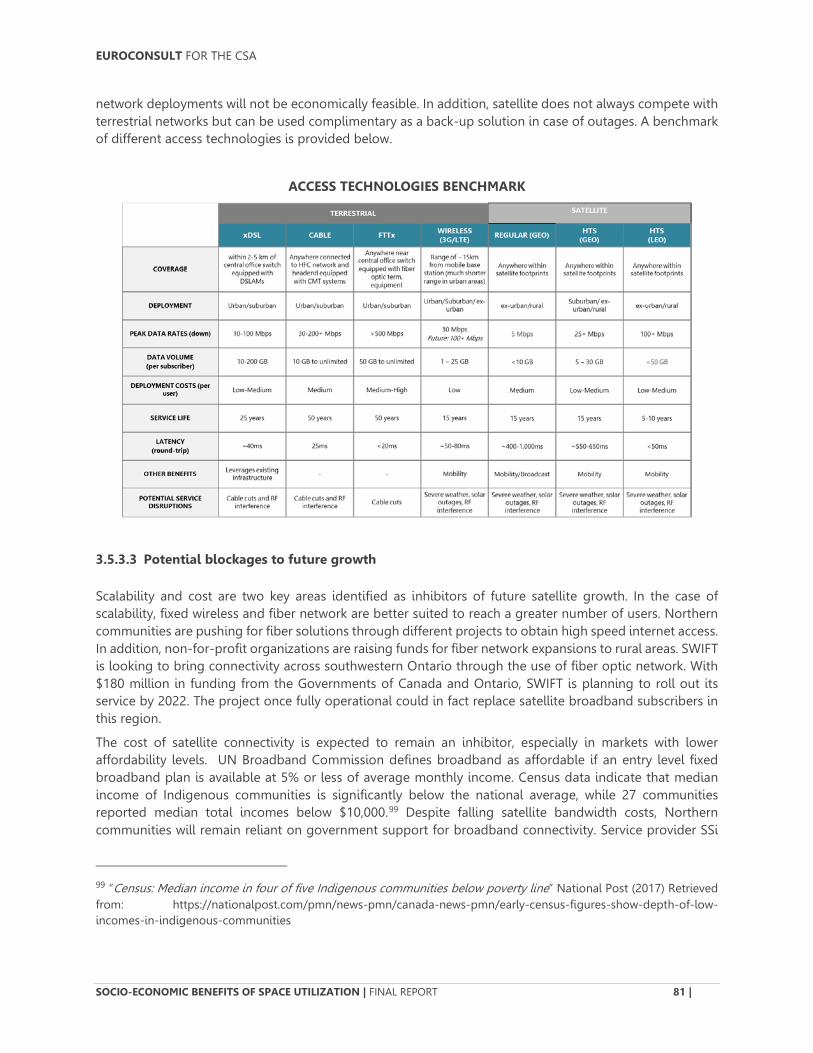
EUROCONSULT FOR THE CSA
SOCIO-ECONOMIC BENEFITS OF SPACE UTILIZATION | FINAL REPORT 81 |
network deployments will not be economically feasible. In addition, satellite does not always compete with terrestrial networks but can be used complimentary as a back-up solution in case of outages. A benchmark of different access technologies is provided below.
ACCESS TECHNOLOGIES BENCHMARK
3.5.3.3 Potential blockages to future growth
Scalability and cost are two key areas identified as inhibitors of future satellite growth. In the case of scalability, fixed wireless and fiber network are better suited to reach a greater number of users. Northern communities are pushing for fiber solutions through different projects to obtain high speed internet access. In addition, non-for-profit organizations are raising funds for fiber network expansions to rural areas. SWIFT is looking to bring connectivity across southwestern Ontario through the use of fiber optic network. With $180 million in funding from the Governments of Canada and Ontario, SWIFT is planning to roll out its service by 2022. The project once fully operational could in fact replace satellite broadband subscribers in this region.
The cost of satellite connectivity is expected to remain an inhibitor, especially in markets with lower affordability levels. UN Broadband Commission defines broadband as affordable if an entry level fixed broadband plan is available at 5% or less of average monthly income. Census data indicate that median income of Indigenous communities is significantly below the national average, while 27 communities reported median total incomes below $10,000.99 Despite falling satellite bandwidth costs, Northern communities will remain reliant on government support for broadband connectivity. Service provider SSi
99 “Census: Median income in four of five Indigenous communities below poverty line” National Post (2017) Retrieved from: https://nationalpost.com/pmn/news-pmn/canada-news-pmn/early-census-figures-show-depth-of-low-incomes-in-indigenous-communities

EUROCONSULT FOR THE CSA
SOCIO-ECONOMIC BENEFITS OF SPACE UTILIZATION | FINAL REPORT 82 |
Micro highlights the need for sustained government funding support for an open access backbone. Current commitment cycles create inefficiencies as a satellite provider only has a few years to recoup the investment.100
Finally, the availability of low-cost, low latency satellite capacity across Canada is dependent on the successful launch of future LEO constellations. These multi-billion satellite projects (Telesat LEO, SpaceX Starlink, etc.) are in the early development phase and still need to secure funding before they will materialize.
TRANSPORT/LOGISTICS
TRANSPORTS/LOGISTICS UTILIZATION AND BENEFITS REVIEW
Technological advances are progressively changing the global transport and logistics landscape, from the traditional human input initiating each task and activity to hardware interconnection and machine decision-making via data processing collected by multiple types of embedded sensors. This new trend is better known as the Internet of Things (IoT), which includes the concepts of “smart object” and Machine-to-Machine (M2M) communication.
Going into more specifics, the Internet of Things (IoT) enables connections between everyday objects, industrial machines, and vehicles, amongst others, and changes the way people, companies or other institutions interact with their environment. M2M refers to low-data-rate (LDR) equipment/sensor used for asset tracking, telemetry or Supervisory Control and Data Acquisition (SCADA) that are attached to containers, vehicles, pipelines and other fixed or mobile assets. M2M/IoT terminals are generally less expensive than other types of mobile terminals and require only limited bandwidth because of the small message sizes they are transmitting. The rise of IoT on the ground is expected to further drive growth of satellite-based M2M/IoT terminals, enabling reliable remote connectivity for a wide range of applications, such as connected cars, fleet tracking, industrial applications, etc.101 A related market, leveraging geolocation data from GPS chipsets in consumer electronics (smartphones, fitness trackers, etc.), serves as a platform for the growing number of applications seeking to improve transportation, health and well-being of individuals.
Predictions regarding the size and potential of the IoT market vastly differ. Based on a variety of sources, between 20 and 30 billion devices are forecasted to be connected by 2020. Discrepancies can be partially explained by the subjective nature of the definition of “connection”, caused by a lack of international standards, and subsequently the inclusion, or not, of handheld devices such as smartphones, tablets and computers into the calculations.102 Organizations such as the International Telecommunication Union (ITU) and the IEEE Standards Association, are working towards standardizing communications or hardware. Governments are now starting to implement national regulations, like the US Internet of Things (IoT) Cybersecurity Improvement Act that was introduced to Congress in August 2017.
100 “Broadband as the new basic service: local talent needs a shared backbone and open gateways”, SSi Micro Brief (2018). Retrieved from: https://www.qiniq.com/wp-content/uploads/sites/2/2018/05/SSi-2018-02-06.pdf 101 “Prospects for L-Band, IoT & M2M Markets”. Euroconsult Executive Report (2017).
102 “Popular Internet of Things Forecast of 50 Billion Devices by 2020 Is Outdated”. Nordrum A. (2016).

EUROCONSULT FOR THE CSA
SOCIO-ECONOMIC BENEFITS OF SPACE UTILIZATION | FINAL REPORT 83 |
Financial estimates regarding the total IoT market size are rising, McKinsey is forecasting a global market value of $227 billion to $581 billion for the IoT industry by 2020103, whilst Bain is predicting that global revenues would attain $470 billion for all hardware, software and other related solutions suppliers by 2020.104
INDUSTRIAL IOT PRINCIPLE
LITERATURE REVIEW OF APPLICATON UTILIZATION
Before introducing the section breakdown, the methodology used to segment the work and illustrate the usage of different space applications for the IoT is described below.
Firstly, at a local level, the IoT/M2M systems are defined by the interconnection of hardware and equipment that can measure, sense, analyze and then act in their environment. To achieve such feats, embedded sensors, actuators, processors and transceivers have to be installed in the target equipment/industrial machines/end-user devices. Based on this, the general functioning and principles of the IoT may be divided into three different categories:
> Sensor information: Stage where all embedded sensors gather data about the hardware/devicewhere they are installed and about the conditions or environment in which they operate.
103 “The IoT opportunity – Are you ready to capture a once-in-a lifetime value pool?”. Ip C. (2016). Retrieved from: https://www.mckinsey.com/global-themes/internet-of-things/our-insights 104 “How Providers Can Succeed in the Internet of Things”. Bosche A. (2016).

EUROCONSULT FOR THE CSA
SOCIO-ECONOMIC BENEFITS OF SPACE UTILIZATION | FINAL REPORT 84 |
> Storage and processing: The level at which individual devices store and process the sensor-gathered data. Depending of the usage and context of operation, actuators (small engines used tocreate motion) may be activated to apply a physical action according to the information processed.
> Communication and transmission: Is the stage where the data collected at machine-level istransmitted towards end-users or the according relevant parties (owners, clients, producers), givingway to analyses, physical applications and other services.105
The global IoT market is expected to grow exponentially in the coming years, driven by new applications and dedicated networks, with the majority of the connectivity provided by terrestrial means. The satellite industry is expected to capture part of this growth, even though it should remain a fraction of the total market and find its niche for remote applications and transmission in difficult-to-reach terrestrial locations. Satellite navigation and communication are the space applications utilized for IoT purposes.106 It is worth noting that communication satellite assets that are used within the IoT/M2M market are primarily utilizing the L-band to secure transmissions. As such, Mobile Satellite Service providers such as Iridium, Orbcomm and Inmarsat are among the early established operators to address this emerging industry.107
Practical applications integrating IoT solutions are numerous. Land transport, maritime, aeronautical, military, automobile, oil and gas, end-user/consumer, backhaul, smart cities, connected cars, infrastructure, are all key sectors for potential IoT inclusion. However, the scope of the topic with respect to this study is oriented towards space utilization, i.e. primarily satellite assets; therefore, only the fields where relevant usage of satellite communication and navigation technology can be made will be discussed in this study.
This section will place the emphasis on:
> Land transport. In particular fleet/asset tracking and multimodal applications
> Maritime logistics. Focusing on fleet/asset tracking by way of AIS (Automatic Identification System)and logistics management.
> Consumer land utilization. Through the use of GPS/GNSS applications for smartphones, wearabledevices (i.e. health, fitness), or creation of industries by connecting users (i.e. Uber)
Subsequently, Canada’s position and activities in this emerging technology sector shall be reviewed.
3.6.1.1 Maritime Logistics
Maritime transport occupies a crucial role in the global exchange and transport of goods. The United Nations International Maritime Organization (IMO) estimates that over 90% of the world’s trade is achieved by maritime transportation and that it represents the lowest cost and most efficient option to ship massive cargos around the planet.108 With over 10.5 billion tons of cargo having been conveyed by sea in 2017, and an estimated 3.2% annual growth rate in the sector until 2022, this industry has much to gain from
105 “Nanosatellite Telecommunications: A market study for IoT/M2M applications”. London Economics (2017). Retrieved from: https://londoneconomics.co.uk/wp-content/uploads/2017/10/LE-CSL-IoT-M2M-Market-Sizing-Requirements-Report-FINAL_PUBLIC-S2C310817_FOR-WEBSITE_v2.pdf 106 “What’s the role of satellite connectivity in an IoT world?”. Telefonica IoT Team (2017). Retrieved from: https://iot.telefonica.com/blog/whats-the-role-of-satellite-connectivity-in-an-iot-world 107 “Inmarsat develops a comprehensive global IoT network with JT Group”. Inmarsat (2017). https://www.inmarsat.com/press-release/inmarsat-develops-a-comprehensive-global-iot-network-with-jt-group/ 108 “IMO profile”. International Maritime Organization (2018). Retrieved from: https://business.un.org/en/entities/13
EUROCONSULT FOR THE CSA
SOCIO-ECONOMIC BENEFITS OF SPACE UTILIZATION | FINAL REPORT 85 |
modernization and implementation of embedded technology in its equipment. Satellite data relays over oceans, geographical locations where terrestrial networks cannot ensure proper data transmission and relay, as well as precise positioning information carried out by space navigation systems represent highly valuable assets to the industry.109
Fleet and asset tracking is one of the major concerns of operators around the globe. The Automatic Identification System (AIS), the maritime equivalent of air traffic control, is being implemented in the industry to complement the use of terrestrial naval radars in order to enhance vessel monitoring capabilities. This ship-embedded system relies on satellites to detect each ship position, trajectory, velocity and AIS signature (differentiating a vessel from others surrounding it), the data being relayed to coast line authorities and terrestrial networks to support controlling, monitoring and tracking activities. By IMO regulations, ships carrying more than 300 tons in international travel and vessels carrying more than 500 tons of cargo in local waters must carry AIS devices onboard. Space utilization to ensure data transmissions is essential because, due to the Earth’s curvature, even if equipped with AIS systems a ship’s information cannot be transmitted by terrestrial means at a range of more than 74 km from shore, implying that AIS traffic data would only be receivable by close-by ships or local coastal zones. This problem is solved by the global coverage offered by space assets, ultimately enabling constant communication links between sea and relevant ground stations. Institutions such as the European Space Agency (ESA) are currently supporting the development of satellite AIS systems; in this case through its Advanced Research in Telecommunications Systems (ARTES) program.110
In terms of benefits, the monitoring and tracking activities enabled by IoT systems implementation in ships, supported by space assets, may enhance and assist in solving matters related to: mitigation of logistic issues, monitoring containers and overseeing material performance. As a result, the integration of such technology could lead to substantial cost-savings for fleet owners. McKinsey projects that the installation of IoT devices on each maritime container to relay positioning and other relevant data could lead to an improved rate of utilization of cargo equipment by 10 to 25%, resulting in a $13 billion cost-cut on spending made on containers.111 Another example of practical use of the IoT could be the integration of temperature, humidity and air composition sensors to monitor refrigerated or organic shipments stored in containers in order to diminish the costs related to in-transit damage. Here again, satellite assets would be utilized to establish communication links between cargo ships and the receiving or inspecting parties related to the exchange of goods, enabling sound management and efficient decision making. Furthermore, there is a global accelerating trend in investments towards maritime domain awareness systems, through timely information sharing and coordination of responses between the participants, to support defense and security matters, resulting in improved public safety.
3.6.1.2 Land Transport
The trucking industry occupies a pivotal role in the distribution of goods over land. Goods which often arrive on land through ships in multi- or intermodal transportation networks. The trucking industry serves the economy by conveying substantial quantities of raw materials, products in the making and ready-to-
109 Review of maritime transport, 2017, UN 110 “Review of Maritime Transport 2017”. UNCTAD (2017). Retrieved from: https://www.esa.int/Our_Activities/Telecommunications_Integrated_Applications/Satellite_-_Automatic_Identification_System_SAT-AIS 111 “The Internet of things Mapping the value beyond the hype”. McKinsey Global Institute (2015).

EUROCONSULT FOR THE CSA
SOCIO-ECONOMIC BENEFITS OF SPACE UTILIZATION | FINAL REPORT 86 |
deliver goods. The global trucking market is forecasted to expand at a moderate compound annual growth rate of 3.1% until 2024. This represents an augmentation towards a global market of 3.7 million vehicles sales (medium and heavy capacity) by 2024, the majority consisting of heavy commercial vehicles (HCV). 112 However, recent studies tend to be slightly pessimistic towards the long-term future of the industry and invoke truck technological improvements to compensate for the predicted reduction of sales in the near future.113
Truck modernisation is now the leading path undertaken by original equipment manufacturers (OEMs). As seen in the agriculture section, digitalization has been growing and implemented significantly into tractors. The same trend is now taking place in the truck transportation industry, with manufacturers now implementing telematics, sensors and computerization solutions in their products which, in other terms, implementing brand new IoT technology into the vehicles. Such systems will be designed to track location and mileage, alert in case of door opening, monitor temperature and humidity inside the cabin, optimise routes, ensure an optimal capacity utilization, to name a few. Simply, the implementation of telematics and IT software, with interconnected devices, is set to enable an optimization of truck traffic, improve drivers working conditions, save fuel and increase trucks useful life by monitoring the wear on the mechanical components.114
The utilization of space assets comes into play for the transmissions of this emerging quantity of data between different actors of the land transportation value chain. GPS/GNSS systems feed drivers with precise geolocation information to support and optimize their routes and driving conditions whilst satellite communication applications enables fleet owners to monitor and track their assets, stay in constant contact with their employees even if they are situated in remote locations outside of the reach of terrestrial communications network infrastructure. Australia is a model example of the adoption of such practices, the country facing many geographical challenges and relying on trucking as a pivotal part of their economy.115
The land transport industry ensures a constant need for satellite geolocation information and data transmission due to its mobile nature and the necessity to deliver goods in geographically challenging areas impeding the installation of terrestrial networks for the new and growing telematics needs of the different players in the trucking business.
3.6.1.3 Consumer Land Utilization
GPS, not only for truck transportation purposes, but also for individual consumer purposes, is rising in importance and utilization year-after-year. Today, most consumer land IoT utilizations are interlinked and made through mobile devices such as smart phones, via the use of specifically designed applications with geolocation being the most used space-derived data for this market.
112 “Truck market 2024 – Sustainable Growth in Global Markets”. Deloitte (2014). Retrieved from: https://www2.deloitte.com/content/dam/Deloitte/tr/Documents/process-and-operations/truck-studie-2014-s.pdf 113 “Global Truck Study 2016 – The truck industry in transition”. Deloitte (2016). Retrieved from: https://www2.deloitte.com/content/dam/Deloitte/us/Documents/manufacturing/us-manufacturing-global-truck-study-the-truck-industry-in-transition.pdf 114 “No Longer Afterthoughts, Trailers Are Getting Smart”. Hurt E. (2018). Retrieved from: https://www.trucks.com/2018/03/14/trailers-getting-smart/ 115 “Fleets Working Remotely – The Benefits of Satellite Technology”. Optus (2015). Retrieved from: https://blog.optus.com.au/business/fleets-working-remotely-benefits-satellite-technology/

EUROCONSULT FOR THE CSA
SOCIO-ECONOMIC BENEFITS OF SPACE UTILIZATION | FINAL REPORT 87 |
The Global Positioning System (GPS) is used daily by millions of smartphones owners in order to identify their geolocation or to identify their target destination, translating into optimized routes and time savings for consumers. Dozens of sports/fitness applications like Strava and Runtastic or wearable products such as Fitbit, Apple Watch or other equipment offered by Garmin to enhance sport data collection, use GPS information as core input to offer consumers a whole range of information (i.e. distance, moving time, calories consumed, average speed, elevation, heart rate) about their daily activities. In addition, still relying on geolocation data, new applications such as Uber were born through the interconnection between drivers’ and clients’ phones by using a space-supplied geolocation to identify the most efficient routes and vehicles for each specific consumer needs.
Such new ventures have brought a new flow of revenues in countries allowing their use, illustrated by Uber declaring having created 160 000 jobs in the US as of 2017.116 As demonstrated, benefits associated to the bonding of space utilization and IoT derived applications for individuals are numerous: jobs creation, improved productivity via time savings, better travelling efficiency, enhance social benefits such as health and individual well-being etc. Expanded access to GPS information is having high global economic impacts with regards to transportation, that add up to more than $10 billion annually, according to recent studies.117
SELECTIVE BENEFITS TO TRANSPORT AND LOGISTICS IN CANADA
In the section below, specific examples are developed to illustrate the use of space utilization in benefiting the Transport and Logistics sector, most of them focusing on IoT-based technologies. Practical applications integrating IoT solutions are numerous, land transport, maritime, aeronautical, automobile etc. are all key sectors for potential IoT inclusion. This section will focus on those areas in which satellite applications – in particular satellite communications and navigation – is embedded. This includes:
> Maritime logistics. Focusing on fleet/asset tracking by way of Automatic Identification Systems [AIS]and logistics management.
> Land transport. In particular fleet/asset tracking and multimodal applications
> Consumer land utilization. Through the use of GPS/GNSS applications for smartphones, wearabledevices (i.e. health, fitness), or creation of industries by connecting users (i.e. Uber)
Space-based IoT is still emerging. Therefore, data on certain fields of utilization is more limited. Due to the US market being one of the major drivers of IoT development and the most analysed because of its size and economic-return potential, most IoT-derived public information is available on this market. For this report assumptions are then taken to build benefit cases for Canada. Benefits scenarios which were able to be built, or collected during consultation, are outlined in the table below.
SUMMARY OF SELECTIVE BENEFITS IDENTIFIED
TYPE BENEFIT
116 “Uber Revenue and Usage Statistics 2017”. Dogtiev A. (2018). Retrieved from: http://www.businessofapps.com/data/uber-statistics/
However, it should also be noted that this may not only be “new jobs” there is some controversy still on the support of such a “gig” economy, and the impacts this has on existing full-time jobs. In this case the impact that this may have on existing taxi drivers.
117 “Space as a Global Utility”. Hertzfeld H.R. (2011). On behalf of NASA Grant #NNX09AG48G

EUROCONSULT FOR THE CSA
SOCIO-ECONOMIC BENEFITS OF SPACE UTILIZATION | FINAL REPORT 88 |
Quantitative
IMPROVING MARITIME CONTAINER UTILISATION
• An improved container utilization enabled by space-based IoT translates intoa $170 million cost savings to the Canadian maritime industry by 2025.
GREATER LOGISTICS FUEL EFFICIENCY
• Identified annual fuel savings of approximately $50 million per yearattributable to satellite IoT technology through improved speed monitoringof the >1 million medium/heavy trucks in operation in Canada.
SUPPORT CANADIAN JOB CREATION
• Euroconsult estimates that GPS-supported Uber will generate up to 24,500part-time equivalent jobs in Canada in 2027.
HEALTH/FITNESS DOWNLOADS
• Recent surveys show more than 300,000 health and fitness relatedapplications, of which a third are based/rely on GPS technology, weredownloaded by Canadian smartphone users in May 2018
REDUCING DAMAGED GOODS
• Up to 50% of travel-related damage to goods may be avoided with the use ofIoT sensors monitoring freight status and transmitting information to controlstations via satellites. This can lead to an estimated $130 million in costsavings due to damaged goods from 2025.
Qualitative OPTIMIZATION OF DAILY ROUTING ACTIVITIES FOR
CANADIANS
• More than 23 million Canadians are benefiting from satellite GPS applicationsto optimize routing.
IMPROVING VESSEL MONITORING IN
CANADIAN WATERS
• The Canadian government is able to monitor all vessels passing throughCanadian controlled waters using AIS technology; for security, safety at seapurposes, as well as supporting commercial interests, such as fishing.
3.6.2.1 Improving maritime container utilisation
Comprising 90% of the world goods transit, the maritime industry is a key market for IoT by bringing greater efficiencies to maritime transportation logistics. The constant moving nature of asset tracking makes it ideal for machine communication solutions. On average, a shipping container is at sea only 20% of its lifetime, the remainder in storage or land-based transportation. However, ports are becoming busier with increased maritime trade, and logistics companies are looking at how to build greater efficiencies into the supply chain whilst maintaining distribution deadlines.
According to McKinsey118, by inserting IoT into the process; implementing tracking devices in each container and relaying travel, utilization and location data via satellites to shipping companies control centers shall improve container utilization up to 25% by 2025 - this shift has an economic impact of $17 billion in cost savings brought in to the logistics business (i.e. greater utilization of containers resulting in more materials moved globally). This translates into a $170 million positive impact on the Canadian maritime industry by 2025. With 18 major ports and 310 million tons of cargo handled annually, resulting in a total GDP of $25 billion, Canada’s maritime installations generate high economic benefits to the country and would potentially accelerate its annual growth rate of 2.1% if such technology was embedded within the infrastructure.
In addition, monitoring cargo may reveal other benefits in terms of safeguarding the quality of the maritime delivery service provided. Humidity, temperature, pressure sensors may be placed inside containers, and alert crews when fragile cargo such as fresh food or electronics have reached critical states in order for workers to mitigate damage during transport. Research estimates show that up to 50% of travel-related damage to goods may be avoided with the use of IoT sensors monitoring freight status, and
118 The Internet of Things: mapping the value beyond the hype, McKinsey Global Institute, June 2015

EUROCONSULT FOR THE CSA
SOCIO-ECONOMIC BENEFITS OF SPACE UTILIZATION | FINAL REPORT 89 |
transmitting information to control stations via satellites. This can lead to an estimated $130 million in cost savings due to damaged goods from 2025. Opportunities enabled by such a technology involve for example the change of a ship’s trajectory in order to make a stop or reach a nearby shore to keep perishable goods fresh; accelerate a vessel’s speed to get to a destination earlier than planned after noting significant damage or risk of losing part of the goods and/or send orders to the crew for them to modify cargo conditions, i.e. room temperature, pressure and humidity, or even rearrange the way goods are placed in the containers. Losses in the package-delivery business is also a concern, with 0.5% to 3% of total goods in transit lost depending on the region. Implementing IoT chips to monitor packages could prevent a good deal of this loss.
3.6.2.2 Reducing trucks fuel consumption
At year-end 2016, Transport Canada reported that over 66,000 Canadian businesses had for primary activity trucking transportation. An activity to which space-based IoT involving GPS and telecom applications have the potential to greatly reduce fuel consumption, a major cost driver and environmental impact issue that the industry faces. The use of “telematics”, by which the trucking industry labels all embedded sensors in trucks sending data to control centers, may apply in a variety of ways to help companies reduce operating costs.
Sensors may be installed in trucks’ engines to measure the speed at which the driver chooses to operate. Above 88 kph, a truck starts to lose kilometer per liter (kpl) fuel efficiency at a rate of 0.04 kpl per kph. Therefore, a truck traveling at 98 kph will lose 0.4 km per liter of fuel consumed which, over the lifetime of the truck, can accumulate significant costs. Sensors that transmit the speed at which the truck is being driven may send alarms to the control center for it to notify the driver. In 2016, over 1 million medium and heavy trucks were in operation in Canada, with an average distance travelled per year of 52,000km. By assuming that drivers are over speeding 10% of the time in operation, by an average 10 kph, this would lead to a cost of $2 billion per year of misused fuel. According to the Euroconsult estimated “space” share of the global IoT market, equivalent to 2%, the value of fuel savings attributable to satellite technology through improved monitoring capabilities is approximately $50 million per year. Following the same approach, embedded chips measuring tyre pressure may also help better fuel efficiency. In the same way, alerts may be sent to drivers and company’s responsible personnel to enable the application of corrective actions.
On the other hand, GPS trackers implemented in trucks may enable fleet owners to possess a real-time knowledge of the exact location of their assets. Therefore, by getting updates on traffic congestions and potential weather blockages on roads, responsible personnel may provide accurate guidance to their drivers to send them on optimal routes in order to reduce driving time and accelerate deliveries. Besides, efficient routing may reduce the engine idling time of trucks during operations, with certain companies indicating an idling time of up to 50% during their fleet operations, translating into large fuel consumption figures without return on investment. The American Trucking Association estimates that 4 billion gallons of fuel were consumed by idling engines in 2016, translating into a staggering $14 billion total cost for trucking companies and, in addition to fuel costs, the association states that an engine idling one hour per day during a full year results in 64 000 miles in engine wear, adding maintenance costs to fleet owners.
3.6.2.3 Optimization of daily routing activities for Canadians
EUROCONSULT FOR THE CSA
SOCIO-ECONOMIC BENEFITS OF SPACE UTILIZATION | FINAL REPORT 90 |
GPS-based applications for individuals continues to witness strong growth, enabled by even more capable GPS-embedded handheld devices. It is estimated that there are over 40 million “location-based service” GPS devices in Canada alone. Confirming these claims is the augmenting rate of Canadian smartphone users, peaking at 76% in 2017 as per StatsCan estimations (statistics made on Canadian population aged over 15 years old). Canadian smartphone users now total 23.4 million using space-based geolocation data as a core input in multiple “apps”, such as car routing, map functions, geo-marketing, geo-tagging etc. As such, more than 23 million Canadians are benefiting from satellite GPS applications to optimize routing. This can also have further benefits, such as more optimised car travel, added securities brought by prevention of getting lost, or being able to signal locations to third parties and so on.
3.6.2.4 Improving vessel monitoring in Canadian waters
Space-based assets play a major role in monitoring maritime activity through Automatic Identification System [AIS] technology. Embedded devices relay to satellites a ship’s AIS signature, which provides data on a vessel’s identity, direction and velocity. The AIS system is used by authorities to reduce collision between vessels at-sea, especially in dense traffic areas, it aids search and rescue, helps monitor fishing
Protecting “North Atlantic Right Whales”
Satellite AIS technology could help mitigate collisions between vessels and North Atlantic right whales
The endangered North Atlantic Right Whale is a migratory species that is often seen along Canadian coastlines, attracted by prey-rich waters. Current populations are estimated at only 500 individuals. With an increased number of ships at sea every year, collision with vessels and entanglement into fishing nets represent a serious threat to the population: 10 whales were found dead in the Gulf of St. Lawrence during the summer of 2017, with at least 2 of them believed to have collided with vessels.
Whilst Marine Protected Areas exist, the migrating nature of the species will often result in them travelling in high ship-traffic zones. Strict regulations were put in place by the government, such as a mandatory 10 knots velocity reduction for ships going through the Western Gulf of St. Lawrence as well as high fines for vessels not respecting sea traffic speed or trespassing MPAs. Satellite AIS technology can reveal to be a crucial asset in the enforcement of such regulations, by providing accurate tracking of individual vessel speed as well as trajectories taken. These solutions help identify ships traveling through forbidden areas and support the analysis of speed courses to enable a retroactive enforcement of governmental fines to responsible companies. The constant traffic-monitoring enabled by AIS solutions may also help in deviating vessels from their initial courses if a group of right whales is located in the vicinity. Environmental institutions are also starting to use satellite imagery to increase awareness of whales’ movements through the oceans.
Sources: https://www.ctvnews.ca/canada/tenth-dead-right-whale-found-in-the-gulf-of-st-lawrence-1.3528735; interviews with industry and government officials.
EUROCONSULT FOR THE CSA
SOCIO-ECONOMIC BENEFITS OF SPACE UTILIZATION | FINAL REPORT 91 |
fleets etc. and when combined with SAR imagery to identify alien vessels (i.e. those not carrying an AIS transponder) or illegal activity (such as bilge discharge tanks in protected areas.)
Solutions such as those provided by exactEarth enable maritime companies to receive information to track their vessels, give support to crews in cases of emergency and allow managers to better visualize the environmental conditions in which their vessels are operating. The company’s satellite constellation, exactView, enables it to provide consistent tracking of 165,000 ships in any location worldwide and to compile more than 7 million of AIS transmissions in a daily basis.
The Canadian government is able to monitor all vessels passing through Canadian controlled waters using AIS technology; for security, safety at sea purposes, as well as supporting commercial interests, such as fishing.
The fishing industry is an important part of Canada’s activities, generating $6 billion to the country’s economy as well as occupying the second place in Canadian food exports, reaching more than 140 countries around the world, as per 2015 figures published by the government. According to UN reports elaborated by the FAO, illegal fishing represents more than 15% of global catches. Therefore, economics benefits to Canada’s fishing industry may be endangered by illegal practices taking place in other regions of the globe. Space-based assets have a great role to play in mitigating effects of IUU, by leveraging their utilization for AIS technology in order to detect, track and monitor fishing vessel activities and operations. Satellite-supported process to fight against these trends include the utilization of EO imagery made on specific maritime location and subtracting/superposing the result obtained with an AIS map of the same area, in order to identify unregistered vessels.
3.6.2.5 Support Canadian jobs creation
Peer-to-peer ridesharing companies, such as Uber, Lyft etc. are essentially a taxi services enabled by GPS-embedded smart devices. In the Uber case, satellite navigation is leveraged to detect the closest drivers from a user location, enabling the creation of a connection between driver and user in order for the service to be delivered. The latest figures published by the company (2016) indicated that 22 000 Canadians drivers were officially operating under Uber’s name, whilst the company claimed to have created 160,000 new jobs in the US in 2017. Euroconsult estimates that GPS-supported Uber will generate up to 24,500 part-time equivalent jobs in Canada in 2027. Drivers are considered independent and self-employed workers, they are therefore entitled to pay taxes to the Canadian Revenue Agency (CRA) as well as Harmonized Sales Tax (HST) to the government.
According to Uber’s estimates and public sources, a driver makes on average slightly more than $20 per hour, after subtracting the company’s cut and other related corporate fees (“Safe Ride”). By combining the company’s available data of total number of rides divided by the total amount generated by drivers, the average fare per trip is a little $11. By building assumptions around total hours worked, this leads to an estimated total revenue of Uber drivers in Canada of $360 million in 2018, of which an estimated $54 million is collected in tax revenues.
3.6.2.6 Health/Fitness improvement of Canadians

EUROCONSULT FOR THE CSA
SOCIO-ECONOMIC BENEFITS OF SPACE UTILIZATION | FINAL REPORT 92 |
Health and fitness applications for general users are in full expansion, a 330% growth rate having been recorded over the last three years: 29% of the population between 18 to 29 years use such apps. The majority platforms used to access these applications are smartphones. By being GPS-embedded, users are able to track how far they have run, cycled etc. and what average speeds, at what inclines and so on.
In a recent May 2018 survey, where more than 300,000 health and fitness related applications, of which a third are based/rely on GPS technology, were downloaded by Canadian smartphone users during that month.119 Strava, Runastic, Nike+ Run Club are examples of trending mobile apps used on a daily basis by Canadians. Not only do these new platforms allow consumers to measure physical performance and give a progress overview over time, but they are also launching a social aspect that brings up motivation and encourages people to exercise in groups. Fitbit, the US most popular health and fitness application, has recorded more than 85 trillion steps for 167 billion minutes of exercise since its creation. Results from the third quarter of 2017 indicated the company selling 3.6 million portable devices, which utilize satellite navigation to aid fitness and overall health.
SOLUTIONS UTILIZED IN CANADA
3.6.3.1 Satellite Solutions
The global nature of the IoT technology and the vast amount of data to gather in real-time across the globe demands the support of satellite constellations located LEO, such as for AIS or new IoT focused constellations. In addition, GNSS acts as an enabler for a multitude of applications, in which GPS is the main solution utilized in Canada.
Canadian commercial space companies have also started to launch precursor space-based systems supporting IoT demand. exactEarth has established a partnership with Iridium to host more than 60 AIS systems providing real-time ship tracking solutions on the Iridium Next constellation payloads. The company selected the VHF frequency band to perform its transmissions and claims to provide very accurate positioning by offering global average revisit times of less than a minute. Helioswire and Kepler communications are working on launching satellite constellations supporting the IoT industry, aiming to lower the associated cost structure by using small satellite technology and democratize its access worldwide. International competition is picking up, the US company Orbcomm is now offering IoT and M2M remote coverage across the globe to enable tracking and monitoring of assets.
On the other hand, less expensive IoT-derived technology using satellite solutions are being developed and tested by leading space agencies. An example is the Maritime Piracy Prevention (MAPP), a European-led initiative aiming at launching new low-cost space-derived methods to reduce worldwide piracy by improving maritime domain awareness and ship tracking. Economic viability is at the heart of this new system that leverages EO imagery and tiny trackers installed on ships to identify any potential out-of-the-ordinary behaviour of civil vessels.
3.6.3.2 Alternatives
119 “Leading health and fitness apps in the Google Play Store in Canada in May 2018, by number of downloads”. Statistica.com (2018). Retrieved from: https://www.statista.com/statistics/699096/leadinghealth-and-fitness-google-play-canada-downloads/

EUROCONSULT FOR THE CSA
SOCIO-ECONOMIC BENEFITS OF SPACE UTILIZATION | FINAL REPORT 93 |
Terrestrial infrastructures such as the 4G and the upcoming 5G communication networks are already well developed and the preferred solution in urban areas. The more remote the area, including open oceans, the greater potential for satellites due to the costs to build up a terrestrial infrastructure. Some key exceptions here however exist. If the IoT solution is tied to GPS then this is difficult to replicate through terrestrial means. Uber for instance requires geolocation data enabled by GPS for it to function – albeit if communication between devices is largely based on terrestrial technology.
3.6.3.3 Potential blockages to future growth
Space-based IoT technology has been emerging in recent years but remains far from being a mature business. At large, there is no real international norm regarding IoT utilization. The International Telecommunication Union [ITU] and the IEEE Standards Association, are working towards standardizing communications and hardware. Governments are now starting to implement national regulations, like the US Internet of Things Cybersecurity Improvement Act that was introduced to Congress in August 2017. The lack of clear policy framework may inhibit the development of technological systems, due to the uncertainty regarding which technology and network architecture that might be legally constrained in a near future by international bodies.
Hacking is also a concern, the IoT devices are relatively simple constructs coupled to global connectivity whilst they can carry important information. The lack of clear regulatory framework may inhibit the development of technological systems, due to the uncertainty regarding which technology and network architecture that might be legally constrained in the future.

EUROCONSULT FOR THE CSA
SOCIO-ECONOMIC BENEFITS OF SPACE UTILIZATION | FINAL REPORT 94 |
- END OF DOCUMENT -