socio-economic integration of immigrants in the us and...
TRANSCRIPT

Tertiary education and labour market position of second generation minority ethnic groups in Britain and the US
(1990/1 – 2000/1)
Yaojun Li Professor of Sociology
Institute for Social Change Manchester University
Manchester M13 9PL, UK [email protected]
(This is a draft for the presentation at the Nuremberg International Conference on
Education in Adulthood and the Labour Market on 7th Nov. 2009. Suggestions and
criticisms are most welcome and will be gratefully acknowledged. Please do not cite
or quote without the permission from the author.)
1

Abstract Both Britain and the USA have seen large influxes of non-white immigrants in the large fifty years and an increasing proportion of the populations in both countries are second-generation. How do the second-generation fare in their educational and occupational attainment will have an enormous impact on the social integration and the democratic processes of the two countries. Using micro-data from the two most recent Censuses of the Population, this paper examines tertiary education and labour market profiles of the second generation in the two countries against the expectations from the straight-line and the segmented assimilation theories on the one hand and the long-standing thesis of American Exceptionalism on the other. The analysis shows that the second generation in both countries were making progress but some groups were still facing heavy ethnic penalties. The findings do not contradict predictions from the segmented assimilation theory but lend greater support to the straight-line assimilation theory. We also show that the second generation were doing better in the US but the gaps are being closed. As some groups were persistently disadvantaged in both countries, governments, employers and the wider society must do more to help the must vulnerable in achieving upward mobility rather leave the matters to parental discipline alone. Key words: tertiary education, labour market position, second-generation, ethnic penalty, social fluidity, Britain, USA
2
Introduction Both Britain and the USA have seen large influxes of non-white immigrants in the large fifty years and an increasing proportion of the populations in both countries are second-generation. Over 30 percent of the US population and over 11 percent of the British population are now composed of non-White minority ethnic groups, with the second-generation being 18 and 5 percent respectively. For reasons well known to social scientists and policy makers such as globalisation and the ageing population of the whites, the number of minority ethnic groups in the two countries, just as in other developed nations, is set to grow in the years to come. The socio-economic integration of the minority ethnics, second-generation in particular, into the social structure of the receiving countries is therefore not only of academic interest but has a crucial importance for social equality and the future prosperity of all members in the society. How do the second-generation fare in education and the labour market in the two countries in the patterns and trends? Are they making progress or experiencing deterioration in their socio-economic fortunes? Are there groups who experience marked and persistent disadvantages? If yes, who are they and how big are the gross and the net disadvantages? Are the two countries converging or diverging in terms of ethnic integration?
This paper seeks to address these questions by examining the educational attainment at the tertiary level and the labour market position of the second-generation minority ethnic groups in the two countries. Using micro-data from the two most recent Censuses of the Population, the analysis will compare the findings against the expectations from the two competing theoretical perspectives -- the straight-line and the segmented assimilation theories. We also wish to find evidence for the longer-standing sociological debate on the relative openness of the two countries. The paper is structured as follows. In the next section, we give a brief review of the two theories and look at the similarities and differences in their expectations. We also give a brief review of the broader concern with social fluidity. After that, we introduce the data and methods. Then we analyse patterns and trends of second-generation educational and occupational attainment in the two countries. Finally, we summarise the findings with some discussions of the policy implications. Theoretical context Since the 1960s, waves of immigrants, largely from developing countries, have come to Britain and the US in the wake of the post-war reconstruction in the former and the 1965 Immigration and Nationality Amendments (Hart-Cellar Act) in the latter country. The children of the visible (non-White) immigrants obtained their education in the two countries and now constitute an increasingly important force in the labour market in each country. Correspondingly, academic interest in the ethnic relations and the immigrant integration has, in the last two decades, gradually shifted from first- to second- generation immigrants, especially in the US. While the earlier research tends to focus on ethnic disadvantages and racial discrimination faced by first-generation immigrants (Gordon, 1964; Daniel, 1968; Jowell and Prescott-Clarke, 1970; Stewart, 1983; Telles and Murguia, 1990; Quillian, 1995), the current research attaches great importance to understanding the structural and socio-cultural processes underlying second-generation educational and occupational attainment (Portes and Rumbaut, 2001; Portes, Kelly and Haller, 2005; Kasinits et al., 2008).
There are two major theories on the long-term socio-economic fortunes of second-generation immigrants: the straight-line and the segmented assimilation theories. The first is a revised version by Alba and his colleagues (Alba et al., 2001; Farley and
3

Alba, 2002; Alba and Nee, 2003; Alba, 2005) of the long-tradition of race studies conducted by the founders of the Chicago School of Sociology, who tracked the integration profiles of the European immigrants in American society. The classic assimilation theory predicts a ‘process of interpenetration and fusion’ of immigrants (Park and Burgess, 1921: 735) as characterised by successive generational upward mobility, greater integration into the mainstream, and reduced ethnic distinctiveness in terms of language use, residential concentration and marriage patterns (Warner and Srole, 1945). Later, Gordon (1964) developed a more systematic paradigm that includes seven dimensions of assimilation: cultural, structural, marital, identificational, attitude-receptional, behaviour-receptional and civic. Among these, structural assimilation, defined as large-scale entry into institutions of the host society, is held as the ‘keystone of the arch of assimilation’.
Following the classic assimilation model, Alba and his colleagues provide a reformulated straight-line theory for the post-1965 immigrants. The revised theory predicts the same trajectory of upward mobility and gradual social integration for the contemporary immigrants, the second generation in particular, just as the classic theory did for the European immigrants. The revised theory is grounded in structural changes in the educational sector and the labour market, the ageing population of the White majority group, and the more favourable socio-political milieu of the contemporary American society. During the last few decades, the occupational structure of the US economy continues to upgrade, with more professional and managerial positions than were available in the previous decades. There is greater educational provision at the tertiary level which, together with the affirmative action programmes, has benefited the minority groups, albeit undoubtedly with inter-group differences. At the same time, the baby-boom generation are coming to the retirement age, leaving many top positions open to competition by immigrants. The civic rights movement and government laws and regulations have also fundamentally changed the mainstream attitudes towards minority ethnic groups so that they can now compete more on an equal footing than before in the labour market. These and other factors create a favourable environment in which the incorporation of the new immigrants, second-generation in particular, can well proceed just as that for the immigrants from Southern and Eastern Europe in the earlier decades of the twentieth century (see also Perlmann and Waldinger, 1997).
The revised straight-line assimilation theory does not deny that there are still prejudices in society and discriminatory practices by employers which lead to ethnic disadvantages in education and the labour market, nor does it deny that there are marked differences in the disadvantages faced by different minority ethnic groups. What it posits is that, overall, the new immigrants, second-generation in particular, will make greater educational and occupational advances as time progresses, and that they will be increasingly, and eventually fully, integrated into American social fabric. In this sense, it is a ‘prospective’ theory.
Challenging this is the segmented assimilation theory proposed by Portes and his colleagues (Portes, 1997; Portes and Rumbaut, 2001; Portes amd Zhou, 2003; Portes, Kelly and Haller, 2005, 2009). This theory is also based on the structural changes of the economy, namely, the increasingly bifurcated class structure. Unlike in the earlier decades of the 20th century, the new, knowledge-based, economy is now increasingly becoming a binary structure, with well-paid professional and managerial jobs at the top requiring high human capital versus poorly-paid jobs at the bottom requiring little more than physical strengths on the farms, in the services and in the factories. The skilled manual and clerical jobs that earlier immigrants could obtain for work-life
4

upward mobility are increasingly squeezed out as globalisation intensifies whereby such jobs, especially in the manufacturing and service sectors, are being out-sourced into developing countries. As professional knowledge rather than working experience is playing an increasingly important role for career advancement, whether or not one has higher education will determine success or failure in people’s life chances. With regard particularly to second-generation educational and subsequent occupational attainment, the theory posits that parental socio-economic condition, family structure and intra-ethnic community resources will determine the acculturation processes that impact subsequent pathways in education and the labour market.
The segmented assimilation theory identifies three acculturation processes for the new second generation: consonant, selective and dissonant – the second having the greatest theoretical and practical importance. Children from professional families with high levels of human capital will undergo a process of consonant acculturation where parents and children jointly learn and accommodate to the language and culture of the host society, which fosters upward mobility. Others from similar backgrounds or with lower levels of human capital but strong parental control and co-ethnic ties will experience selective acculturation, where the learning of English and the culture of the host society proceed simultaneously with the maintenance of parental socio-cultural tradition and intra-ethnic solidarity, which also fosters upward mobility. Still others from working-class families with poor socio-economic resources, little parental control and weak community support will have dissonant acculturation, ending up in intergenerational stagnation with low-paid and dead-end jobs or, worse still, being vulnerably exposed to the pervasive and harmful influences of inner-city subcultures of gangs, drugs, and teen pregnancy, facing arrest, incarceration or early death, and descending into the underclass of permanent poverty and social exclusion. Summing up the segmented assimilation model, the authors predict the following trajectories: ‘One of them replicates the time-honoured portrayal of growing acculturation and parallel integration into the white middle class; a second leads straight in the opposite direction to permanent poverty and assimilation into the underclass; still a third associates rapid economic advancement with deliberate preservation of the immigrant community’s values and tight solidarity’ (Portes and Zhou, 1993: 82).
A comparison between the revised straight-line and the segmented assimilation theories shows that whilst the former is prospective, the latter is more cross-sectionally stratificational in the sense that it is mainly concerned with the group differences in education and the labour market at a given point of time. As such differences are not denied in the straight-line theory, it is essential that we conduct analysis not only in the patterns, but also in the trends, of second-generation educational and occupational attainment to see evidence for the competing theories.
Before we proceed to empirical analysis, it is necessary to have a brief review of existing research on the second-generation. Quite a few studies have been conducted, mostly in the US, with mixed results. Some researchers (Waldinger and Perlmann, 1998; Perlmann and Waldinger, 1997) criticise the segmented assimilation theory for its characterisation of the mobility experience by second-generation Europeans in the early years of the 20th century. Using data from the 1970 Census of the Population, Waldinger shows that manufacturing jobs did not play the important role for upward mobility for Italians, as they ‘made a living in other ways, showing no propensity for industrial work whatsoever’ (Waldinger, 2007: 32). Many studies find evidence of second-generation progress as compared with first-generation immigrants (Waters and Jiménez, 2005; Waters, Ueda and Marrow, 2007). On the other hand, there are many studies, ranging from case studies for specific groups to those arising from the
5

Children of Immigrants Longitudinal Study (CILS), that provide supportive evidence to the segmented assimilation theory, such as Zhou and Bankston (2001) on Vietnamese, Vickerman (1999) on West Indians, and Menjívar (2000) on Salvadorans. As the US society is so diversified, the ethnic experience cannot but bear this print. Thus findings of some groups fitting into the specific segments of the US society will present little surprise. Yet the diversity of immigrant experience does not in itself challenge the optimistic view of the straight-line theory as it is the overall picture and the overtime progress that is the cornerstone of the theory.
The most comprehensive recent studies are found in Waters et al. (2009) and Portes, Kelly and Haller (2009). Drawing on data from the Immigrant Second Generation in Metropolitan New York, Waters and her colleagues constructed proxies for the three acculturation processes based on matrices of parental knowledge of English and children’s knowledge of parental language, the same framework as used by Portes and Rumbaut (2001). The analysis, which shows that ‘neither the type of acculturation nor the level of ethnic embeddedness can account for the variation in mobility patterns both across and within second generation groups’, provides no support for the segmented assimilation theory whatsoever. By contrast, Portes and his colleagues, using their CILS data, find ‘strong support’ for the theory as the parental SES and family structure showed significant impacts on 2nd generation downward assimilation. Yet, a close look reveals that the support, based as it is on the significant association between family SES and family type variables on the one hand and the downward mobility indicator on the other, does not provide direct evidence of the different acculturation processes – there are no acculturation variables in the models. As all stratification students would expect, parental SES is significantly associated with children’s education and class trajectory (Halsey, Heath and Ridge, 1980; Goldthorpe, 1987, 2007). And this association is also shown in Waters and her colleagues’ results as reflected in the relationship between mother’s education and the respondent’s high school drop out and college education. Comparing the two studies, we may suspect that the different findings were, to a large extent, due to the different data sources, measurements and methods used. Yet it is also fair to say that neither study offers a direct test of the segmented assimilation theory. As noted earlier, the theory predicts that the outcomes depend on the interplay between parental socio-economic resources and control which would vary between ethnic groups. In other words, it is the interaction rather than main effects models that would be needed to elicit evidence on the workings of the acculturation processes. Yet neither study looks at the interaction effects.
At this conjuncture, one may wonder whether the straight-line and the segmented assimilation theories, designed for second-generation immigrants in the US, would apply to the immigrant experience in other countries such as Britain. Britain and the US share many similarities, but they also have many differences as well, such as those rooted in the immigration histories, the diversity and composition of immigrants, the education systems, the generousness of welfare regimes, and anti-discrimination laws and regulations and strictness of law enforcement (Waters, 2008; Model, 2005). Such differences will no doubt impact on immigrant integration in the receiving societies. Yet, apart from these, there are also structural, endogenous, differences between the two countries that affect immigrant integration. From popular myths to sociological representation, the US is frequently seen as a land of opportunity with relatively little socio-economic constraint whereas Britain is often viewed as hopelessly hampered by entrenched class disparity and social sclerosis (Olsen, 1982). The thesis of American exceptionalism is found in the social science discourses dating from Tocqueville
6

(1835), Marx (1965), Bell (1972) to Lipset (1991). Even researchers who lament on racial discrimination as a deep scar on American conscience1 find ‘a grain of truth in the Horatio Alger myth’ as evidenced in the exceptional rates of long-range mobility by sons of manual workers into the professional elite in American society (Blau and Duncan, 1967: 435).
Cross-national studies between Britain and the US are a rarity. Earlier research by Erikson and Goldthorpe (1985) and by Kerckhoff, Campbell and Wingfield-Laird (1985) both focused on class mobility, offering little insight into the ethnic relations in the two countries. Cheng (1994) conducts a comparative study of Chinese in the two countries but most other ethnic groups were not standardised. Model (2005) is the most comprehensive study of all major groups in the two countries but is limited to the earlier 1990s, giving no evidence of trends in the ethnic fortunes. In sum, comparative research of ethnic relations is, as Heath, Rothon and Kilpi (2008) note, ‘in its infancy’. Yet the growing proportions of the new immigrants in the national populations make the ethnic integration, particularly by the second generation, the true litmus test of social equality and social fluidity in the two countries which are commonly held as the genotypical examples of liberal capitalism. This is the bigger question that we wish to address in this paper. Data and methods In order to address the questions outlined above, the present study focuses on the tertiary education and labour market position by the second generation in Britain and the US in the last decade. For this purpose, we use the most authoritative data available, namely, the Samples of Anonymised Records (SARs) from the 1991 and the 2001 Censuses of the Population in Great Britain and the Integrated Public Use Microdata Series (IPUMs) (Ruggles et al., 2008) from the 1990 and the 2000 US Censuses of the Population. With regard to the SARs, we use the pooled 1% Household and 2% Individual SARs for 1991 and the 3% Individual SAR for 2001 (http://www.ccsr.ac.uk/sars/). With respect to the IPUMs, we use the pooled 1% and 5% samples for 1990 and 2000 (http://usa.ipums.org/usa/sampdesc.shtml). All the datasets are publicly available. The use of such datasets is necessitated by the need to ensure large sample sizes for the subgroups in the ethnicity by gender combinations in each country and at each time point. All the respondents selected for use in the paper are native born. As the British data contain no information on the year of arrival for those born abroad, we cannot include 1.5th generation in the study. All analysis in the study is confined to men aged 16 to 64 and women aged 16 to 59. Full-time students are omitted as their decision to stay in school or enter the labour market involves different processes between the majority and the minority ethnic groups (Clark and Drinkwater, 1998).
As our research centres on adult education and labour market position of the second generation, the most important first task is to code the variables on ethnicity, tertiary education and labour market position (employment status and social class) in a standardised way. With regard to ethnicity, we code the same categories for the two countries whilst also taking into account some country-specific groups. For ethnicity in Britain, we follow the standard practice in using the 1991 SARs and code six
1 ‘Until we summon up the courage to distinguish between the problems of poverty and the problems of race, we shall have to reckon with the consequences of our lack of candor’ (Duncan 1968, 109). It is noted here that all non-Black respondents are included in the White category in Duncan’s analysis.
7

categories: White, Black Caribbean, Black African, Indian, Pakistani/Bangladeshi, and Chinese. The White group includes White Irish (people from the Republic of Ireland rather than Northern Ireland) and White Other (from the Old Commonwealth countries and from Europe). Existing research (Li and Heath, 2008) shows that White Other and White Irish fared equally well as White British at the two time points being examined in this paper in terms of employment rates and access to advantaged professional and managerial positions. It is thus reasonable to group all Whites into the same category in the present analysis. People of Pakistani/Bangladeshi heritage are grouped together due to the need for consistency with the US data where the sample sizes for the two groups, especially in 1990, are too small to yield reliable results for separate analysis. In the 2001 SAR, ethnic categories are separately coded for England and Wales, and for Scotland. Great care was taken to ensure that the categories are coded in a way that is consistent across the three countries within Britain (Northern Ireland data are not used in this analysis as the minority ethnic groups are not differentiated there) and with those used for the 1991 SAR. A fairly large number of people of mixed origins in the 2001 SAR identify themselves as ‘White and Black Caribbean’ and ‘White and Black African’ (0.45% and 0.15% respectively in England and Wales). Prior analysis shows them to bear greater resemblance to their Black than their White peers in the labour market position. In light of this, people of mixed origins are coded to their respective minority rather than to White groups (see also Simpson, 2004).
In the US data, we code ethnicity with eight categories, that is, six categories as are in the SARs (with African Americans in the US notionally corresponding to Black Africans in Britain whose educational and occupational differences are an empirical matter to be investigated in the paper), plus two US-specific groups that have received much attention in academic and policy research communities in recent years (Massey, 1995). A range of source variables in the IPUMs, each with differing numbers of categories, were used in coding the ethnic variable: single race identifier (racesingd), Hispanic origin (hispand), birth place (bpld), and first and second ancestry identifiers (ancest1d and ancest2d). The resulting categories are: (i) Whites; (ii) African Americans who are actually third or higher generation and have been in the US longer than most of the Whites; (iii) Black Caribbeans who self-identify as being Black and have first or second ancestry with Jamaica, Anguilla, Antigua, Bahamas, Barbados, British Virgin Islands, Dominica, Grenada, Montserrat, St Kitts, St Vincent, Trinidad, British West Indies, West Indians ns, and Guyana; (iv) Indians are those who self-identify as being of Indian heritage; (v) Pakistanis/Bangladeshis are similarly coded and are combined due to their small size;2 (vi) Chinese; (vii) non-Mexican Hispanics (hereafter called ‘Hispanics’); and (viii) Mexicans.3
2 In both the SARs and the IPUMs, we also created two other ethnic categories: Black Others (those from places other than the West Indies and Africa in Britain, or from Cape Verde and Haiti in the US) and Other (‘Other Asia’ and ‘Other Other’ in Britain, and South Korea, Japan, the Philippines, Vietnam, Laos, Cambodia in the US). The Black Other and Other categories in the two countries are not included in the analysis as their compositions are too diverse and their context of reception too dissimilar to yield meaningful interpretation. The Bangladeshis (only 15 in 1990 and 84 in 2000 being second-generation) were combined with the Pakistanis in the US data. 3 Painstaking efforts were made to code the ethnicity variable. It is reassuring to report that our results combining first and second generations (available on request) match the official figures (http://www.census.gov/prod/cen2000/dp1/2khus.pdf) almost
8

With regard to our outcomes of interest, we coded tertiary education as sub-degree or above as this is only differentiable in the 1991 SARs (professional qualifications in teaching, nursing and law; first degree, master and PhD) which is also available in the 2001 SARs and in the IPUMs (associate degree or above coded from educ99). For labour market position, we combined employment status with class position following Goldthorpe (1987). Thus, we first differentiated employed, unemployed, and inactive and then, among the employed, we further differentiated three broad classes: (i) the professional and managerial ‘salariat’ class; (ii) the intermediate class of routine non-manual, own account, manual supervisors and lower technicians; and (iii) the working class of skilled, semi-skilled and unskilled manual workers including agricultural labourers. It is noted here that the official class schema changed between the 1991 and the 2001 Censuses in Britain, with the Social-Economic Groups (SEGs) used in 1991 and the National Statistics Social-economic Classification (NS-SEC) in 2001. We followed the standard practice of converting the SEGs (Heath and McDonald, 1987) and the NS-SEC (Rose and O’Reilly, 1998) into the Goldthorpe class (Goldthorpe, 1987). For the US data, we coded the same three classes as in Britain using the standard occupational classification variable (occ1990). As lower managers and higher supervisors were coded as part of the salariat in the SARs following Heath and McDonald (1987) and Rose and O’Reilly (1998), the same was done for the IPUMs. Combining employment status and class yields five categories: (i) the salariat, (ii) the intermediate, (iii) the working class, (iv) the unemployed, and (v) the inactive. Whilst the inactive may contain ‘discouraged workers’ comprising disproportionate visible immigrants especially at the times of high unemployment rates, there is little doubt about the inherent social advantage and disadvantage pertaining to the first four categories. This embedded hierarchy has important implications on the methods we use for analysing ethnic stratification.
As for methods, analysing educational profile is straightforward. We use cross-tabulation and logit regression. Because the white majority are older than the second generation groups and because different ethnic groups have different morbidity rates, we also control for age and limiting long-term illness in estimating tertiary education. In modelling labour market position, we use a version of Heckman’s selection model adopted for ordinal outcome variables, namely, conditional mixture-process models (Roodman, 2009). This model first differentiates labour market participation versus non-participation (active=1 and inactive=0) in the selection model and then, in the regression part, models a series of ordered categories from unemployed to the salariat class. We also control for education, marital status and presence of dependent children in the household as these are usually found to have considerable impact on people’s labour market position. For instance, there is research to show that, at least for men, being married is seen by employers as a symbol of commitment and drive, leading to favourable outcomes (Chun and Lee, 2001). As age in the 2001 SAR is band-coded, we adopted the same bands for all data sources used.4
perfectly, to the second decimal of the percentages. It is further noted here that there are concerns over the quality of data on ethnicity in the 2001 IPUMs. But since the groupings were mainly concerned with Hispanics and since over 98% of them identified with one or another of the source countries or communities, they are all captured in our non-Mexican Hispanic category (see Citro, Cork and Narwood, 2004, ch. 8). 4 The age bands are: 1=16/19, 2=20/24, 3=25/29, 4=30/44, 5=45/59 and 6=60/64. Age squared is coded in a similar way. Following standard practice, we exclude visitors in
9

The analysis is conducted for men and women, and for Britain and the US, separately. We analyse education first, followed by labour market position. In each aspect, we first present descriptive analysis, followed by multivariate modelling.5 Various Wald tests6 are conducted both for within-country (overtime) changes and for between-country differences. Finally, loglinear and log-multiplicative layer effect (also called ‘uniform difference’ or UNIDIFF) models are conducted to see the overall patterns and trends for social/ethnic fluidity in labour market position between the two countries (Xie, 1992; Erikson and Goldthorpe, 1992). It is also noted here that as the huge sample size (around 20 million records in total excluding first-generation immigrants) makes the analysis very time-consuming, we sub-sampled some big groups but kept the smaller intact. This resulted in a reduced sample (N=410,093) within the confines of our data selection which still contains large sizes for all subgroups by ethnicity, generation, sex, year and country.7
Analysis In this section, we present analysis of second-generation socio-economic integration on two themes: educational attainment focusing on tertiary level qualifications, and labour market position on employment status and class position. With regard to the second theme, we also assess the relative social fluidity between the two countries. The themes centre round the current debate between the straight-line and the segmented assimilation theories on second-generation integration and have a direct bearing on the longer-standing debate on relative openness of the social structure in the two countries. Educational attainment We first look at the proportion of second-generation immigrants having tertiary education as compared with the Whites in the two countries. Table 1 shows that, overall, Britons were much behind Americans in tertiary education and that British women were behind their male counterparts in 1991. Yet in 2001, the gaps were much reduced, both between countries and between the gender groups. This reflects both the much greater provision of higher education in Britain in the wave of the 1992 restructuring of higher educational institutions and the trend for women to outperform men in the participation rates in higher education. (Table 1 about here)
analysing the 1991 SARs (http://www.ccsr.ac.uk/sars/1991/indiv/variables/residsta/). Information on residential status is not available in the 2001 SARs or the IPUMs. 5 Weighted data are used in all analyses with unweighted Ns reported. All data sources used in this study contain weight variables except the 2001 SAR in which case we created a weight of 1. 6 The Wald test is written as t = (b1 - b2)/(s1
2 + s22)1/2.
7 Following Model (2005), we took a random sample of the bigger groups and kept the smaller groups intact. For the SARs, we sampled 2% Whites and kept all other groups intact. For the IPUMs, we sampled 1% Whites, 5% African Americans, and 10% Hispanics and Mexicans whilst keeping the remaining groups intact. The smallest group was Pakistani/Bangladeshi in 1990 in the US (N=70 and 72 for men and women respectively). All other groups have well over 100 respondents. Given this, we are not going to report Ns for all subgroups in the tables (sample sizes for all groups available on request).
10

Our main interest is, of course, in the inter-group differences in tertiary education.
To facilitate analysis, we also present results of significance tests for each sub-group with the Whites who are used as the reference group. Here we find that Black Caribbean, Indian and Pakistani/Bangladeshi men and women were significantly less likely to have tertiary education than Whites in Britain in 1991 but Black Caribbean women, Indian men and women became more qualified than Whites in 2001. In the US, African American, Black Caribbean, Hispanic and Mexican men and women were less qualified than White Americans at both time points. Overall, the Chinese were the best qualified group in both countries, followed closely by Black Africans and Indians in Britain and Indians and Pakistanis/Bangladeshis in the US in 2001. On the other hand, Black Caribbean men, Pakistani/Bangladeshi women in Britain, and Mexican men and women in the US were the least qualified groups. The last group were even less qualified than African Americans.
(Table 2 about here)
As noted earlier, the second-generation immigrants in both countries were on the whole younger than Whites (and African Americans who are a long-standing group in the US). As younger people were more likely to benefit from the expansion of higher education, it is necessary to look at the net effects of ethnicity by controlling for age. We also need to control for health status as the more disadvantaged groups such as Blacks, Hispanics and Mexicans were more likely to have long-term illness which had a negative effect on access to higher education. This we do in Table 2. Briefly, in all models, we find a strong curvilinear pattern with age, with the younger and the older people being less likely to have tertiary education. This is expected as young people had not reached the age for tertiary education yet (our youngest respondents were aged 16) whist the older respondents had not been able to enjoy the fruits of the educational expansion. Also shown in the table were the strong negative effects for long-term illness, suggesting that such illness had prevented large numbers of people from participating in higher education.
Looking at the net effects of ethnicity, we find that, holding age and health status constant, Indian men and women, and Pakistani/Bangladeshi men were no less likely to have tertiary education than their White peers in 1991, as shown when no such controls were used. Yet, Black Caribbean men and women, and Pakistani/Bangladeshi women were still significantly behind their White peers in having higher qualifications in 1991 but the two women groups were no different from their White peers in 2001. The patterns here give some support to the segmented assimilation theory in that some Black Caribbean men may have assimilated into the oppositional culture of poorer sections of the White working class. As for Black Africans, even thought their first generation suffered severe disadvantages in unemployment (see Heath and Li, 2008), their second-generation managed to make amazing educational achievements. The findings here indicate the importance of parental cultural capital as Black African first generation were very highly educated, many being ‘students who stayed’ (Daley, 1996). Similar positive influences are found in the case of Chinese, Indians and Pakistani/Bangladeshi groups. In the US, Black Caribbean men and women were significantly behind their White peers in 1990 but showed no difference in 2000, lending support to the observation that the civic rights movement and affirmative action programmes originally designed to redress the racial discrimination
11

suffered by African Americans actually benefited Black Caribbeans more than the intended beneficiaries (Waters, 2008).
It is also evident that Hispanics and Mexicans were as much disadvantaged as African Americans. It is a pity that the Census data do not provide information on parental socio-economic conditions and we cannot make further explorations here. Yet the very large amount of research in the US on Black and Latino disadvantages (Darity and Mason, 1998) and on hostile reception to these groups (Massey, 1995; Portes, Kelly and Haller, 2009) would suggest that these groups not only suffered heavy ‘lag effects’ (or what sociologists would call origin effects due to deficiencies in parental socio-economic resources) but also grew up in rather unfavourable environments which prevented them from attaining higher educational qualifications.
On the whole the data presented above show much variation among the second generation with some groups having markedly higher, and others markedly lower, probabilities in obtaining tertiary education. The large amount of data also makes it difficult to see the wood from the trees, which does not well serve the purpose of comparing the competing claims of the theories. To recap, the segmented assimilation theory would predict markedly different educational trajectories amongst the new second generation, a claim not disputed by the straight-line assimilation theory which focuses on overtime progress for the disadvantaged groups and reduced differences with the majority groups. To facilitate this, we present, in Table 3, results of Wald test based on the coefficients in Table 2, namely, the net differences in education after controlling for age and health status. The test is conducted both for the overtime changes for each group within each country, and for between-country differences for similar groups. As noted above, second-generation Black Africans in Britain and African Americans in the US are not strictly comparable as the former are children of (mostly) voluntary immigrants (although a fairly large number of first-generation Black Africans such as those from Somalia were refugees and asylum seekers, see Cheung and Heath, 2007) whilst the latter are descendants of involuntary migrants who, for generations, suffered the worst kind of discrimination in American history. It is also noted here that the latter kind of comparison is not directed at the debate between the straight-line and the segmented assimilation theories but at the longer-standing debate on American exceptionalism.
(Table 3 about here)
Table 3 shows the results of the Wald test on the patterns and trends of second-generation educational attainment in the two countries. With regard to within-country changes on the same ethnic group’s educational attainment from 1990/1 to 2000/1, 24 tests were conducted: 15 groups showed significant progress, 9 showed no significant changes, and none became significantly worse. Some of the ‘no change’ cases, such as Chinese men and women in Britain, and Indian and Chinese women in the US, did not constitute any equality issues as they were so much ahead of the other groups in educational attainment to start with, with little room for further progress. The real stagnant groups were African American and Hispanic men and women. The heavily disadvantaged Mexican men and women were nevertheless found to have made significant progress over the period covered. Therefore, while the profile of ethnic stratification lends support to the segmented assimilation theory and is not denied by the straight-line assimilation theory, the overall patterns in most of the cases tested would renders more support to the straight-line theory.
12

With regard to the data in the last two columns of Table 3 pertaining to the between-country differences, 20 comparisons were made (Hispanics and Mexicans had no comparators in the British case). We find that in 10 of the tests, similar ethnic groups were doing better in the US than in Britain. Second-generation Black Africans in Britain were found better qualified than African Americans in the US. The Chinese were doing equally well in both countries, showing no significant between-country differences. Overall, the weight of evidence tilts towards the US. Labour market position Having looked at the educational profile in some detail, we now turn to labour market position. Again, we look at the raw patterns first. The data are shown in Table 4 for men and Table 5 for women. As so much data are presented, we pick up some most salient features for comment.
Looking firstly at the overall patterns, we find that nearly one in four men in both countries were in professional and managerial salariat class in the earlier period but whereas the proportion stayed at a roughly similar level for the US men in 2000, the proportion increased by 9.5 percentage points (from 23.3% to 32.8%) for the British men. This might raise doubts over the comparability of the two data sources or, more precisely, our coding used. Yet, looking at women’s data, it is reassuring to find that there is little difference in their proportions of salariat positions in the two countries: 28.6% of British women as compared with 28.0% of US women were found in such positions in 2001. Given this, we have reasons to believe, as other researchers have also found (Devine, 1997), that American women are more likely than their male counterparts to be in salariat positions (with the latter being more likely to be in self-employment which is included in the intermediate class).
(Table 4 about here)
Looking at the ethnic differences among men as shown in Table 4, we find both marked variations between groups and pronounced disadvantages for some groups. In the British case, with the exception of Chinese, all minority groups were less, and Pakistanis/Bangladeshis less than half as, likely to be in the salariat and all were two to three times as likely to be unemployed as compared with Whites in 1991. In 2001, Black African, Indian and Chinese men surpassed White men in access to the salariat but the unemployment rates for all minority groups were still two to three times as high (over four times in the case of Pakistani/Bangladeshi men). Getting a job was much more difficult for the second-generation minority men than for Whites.
The British situation was largely mirrored in the US case. Thus, apart from Chinese, Indians and Pakistanis/Bangladeshis, we find all other groups less likely to be in salariat positions and all groups two to three times more likely to be unemployed than Whites. African American, Hispanic and Mexican men were less than half as likely to be in salariat positions as White men. It is also noticeable that African American, Hispanic and Mexican men were not only much more likely to be unemployed, but also around twice as likely to be inactive. Given that our samples pertain to working-age non-student populations, the high rates of inactivity are a good indication of hidden unemployment (‘discouraged workers’) among these groups rather than a genuine lack of need for labour market participation.
Comparing the male profile of labour market positions in the two countries, one notable feature emerges with regard to Pakistani/Bangladeshi men. In Britain, they were very much disadvantaged both in access to the salariat and in avoidance of
13
unemployment in the two years while in the US, their access to the salariat was no different from that of the Whites but their unemployment rates were still three times as high as those for the Whites (12.4% versus 4.4% in 1990, and 10.9% versus 3.6% in 2000). This suggests that the superior education of the Pakistani/Bangladeshi men in the US failed to protect them from higher rates of unemployment. (Table 5 about here)
Women’s profile bears some resemblance to that of men (Table 5). With regard to
British second generation, we find that they made much progress in the period covered. Whereas in 1991 all groups except Chinese were less likely than Whites to be in the salariat, the reverse was the case in 2001, with the sole exception of Pakistani/Bangladeshi women. On the other hand, while greater access to the salariat might be seen as positive social change, the heavy concentration of all minority ethnic women in the ranks of unemployment, particularly in 1991, indicates serious social disadvantage. It is remarkable that even though the overall level of unemployment was much reduced in 2001, the relative rates stayed at much the same level, with those for the minority ethnic women being two to four times as high as that for White women. Another striking feature that emerges from the data is that nearly half of the Pakistani/Bangladeshi women were economically inactive in both years (43.4% and 44.5% respectively), mostly due to the caring responsibilities for children and for the elderly as they tend to have large families and live in extended households.
The American women’s profile mirrors that of American men more closely than shown in the British case. Chinese and Indian women were most likely to find themselves in the salariat in chief contrast with African American, Hispanic and Mexican women. Although the unemployment rates in the US were lower than in Britain, African American, Hispanic and Mexican women were still more than twice to be unemployed as compared with White women.8
While the discussion above is revealing, it was unavoidably selective, focusing as we did on access to the salariat and avoidance of unemployment. There are other facets left unexplored such as the relative position of the second generation in the intermediate and the working classes. Equally important is the extent of ‘ethnic penalty’, namely, the net disadvantages faced by minority ethnic groups when human capital (educational qualifications and labour market experience as indicated by age and age squared) and personal attributes (such as health, marital status and dependent children) are controlled for. (There are, of course, many other factors that can impact on the labour market position but they are not available in the datasets.) In the following, we present findings from the conditional mixture-process (CMP) models as earlier discussed. As at least one ‘identifying variable’ must be used in the selection but not the outcome part of the models, we use long-term limiting illness for this on the grounds that it would have a primary effect on labour market participation. The results of the CMP models, shown in Tables 6 and 7 for men and women respectively, can be interpreted in a fairly straightforward manner. The lower part (selection model)
8 One exceptional case here pertains to Indian women in the US in 2000 with the highest unemployment rate (10.4%). Further analysis shows this to be significantly higher than that for White women with or without controlling for other socio-demographic factors. Yet they also had markedly lower inactivity rate (16.6% as compared with 24.2% for all). Combining unemployment and inactivity, we find that their worklessness rate (27%) was similar to that of White women (26%).
14

estimates the likelihood of being economically active (‘participation rates’) and the upper part estimates, for the economically active, the relative desirability of labour market positions. We rank the positional change from unemployment to working class to intermediate class to the salariat as indicating increasing social desirability. Thus the coefficients in the selection model are logit, and those in the regression part ordinal logit, parameters. For men and women in each country and in each year, we construct two models: one without, and one with, socio-demographic controls. (Tables 6 and 7 about here)
Table 6 shows men’s likelihood of labour market participation (selection model)
and, among the economically active (regression model), their relative status of labour market position. Looking firstly at the selection model, we find that health, education, age and dependent children all had the effects in the expected direction. Thus, men with long-term limiting illness, no higher education and no partners were, in most cases, less likely to be in the labour market whereas those in the middle ages and having dependent children were, other things being equal, more likely to be economically active. These variables also have basically the same direction in their effects on labour market position in the regression model, with the exception that having dependent children has a negative effect on labour market position. Combining the two aspects, the data suggest that having dependent children gives men a greater sense of responsibility in terms of labour market participation, but has an adverse impact on their career advancement. The impact of marital status echoes findings by Chun and Lee (2001) although they focus on earnings.9
Our main interest is in the ethnic differences as shown in the regression part. Looking firstly at the data on men in Britain, we find grave instances of ethnic penalty. At both time points, second generation men were, with the sole exception of Chinese, found as holding significantly less desirable positions than White men. Even though controlling for socio-demographic factors reduced the impact of ethnic penalty in most cases, the penalty actually increased for Black Africans and Indians in 2001, from -.195 to -.401 in the former, and from -.027 to -.091 in the latter, cases. The penalty for the two groups was brought into greater relief due to the fact that they were so much better qualified than White men. Similar penalty was found in the case of Chinese men in 2001, with the coefficients changing from .082 to -.108 from Model 1 to Model 2, albeit failing to reach the conventional significance level.
With respect to the US men, we find much weaker effects of ethnic penalty as compared with the British case. After controlling for socio-demographic factors, some groups were found to hold more desirable positions than Whites, especially in 2000. African American, Hispanic and Mexican men were still markedly disadvantaged in 1990 even controlling for human capital and demographic attributes but their penalty was much reduced a decade later.
Turning now to women’s labour market position (Table 7), we find one notable and yet much expected difference to the men’s profile, namely, having dependent children prevented women from participation in the labour market (in the selection part). The other features are essentially the same as for men with the exception that, controlling for socio-demographic attributes, Black African women’s labour market position got worse in both years in Britain while the deterioration only occurred in
9 As class may be regarded as permanent incomes (Goldthorpe and McKnight, 2006), there is no disagreement between our findings and those by Chun and Lee (2001).
15

2001 for Black African men. The ethnic penalty also applied to Chinese women in Britain. As noted earlier, these two groups had much higher rates of tertiary education than their White peers. The net disadvantages faced by American second generation women were much weaker in comparison with those in Britain.
Having looked at the gross and the net ethnic differences, we now have an overall view of the changes over time and the differences between countries. The data are shown in Table 8 based on regression coefficients on ethnic groups from model 2 in Tables 6 and 7. What emerges in Table 8 is more in line with the straight-line than with the segmented assimilation theory, at least for women. Thus, in the British case, Black Caribbean men and all women groups except for Chinese made significant advances in gaining more desirable positions in 2001 as compared with 1991. British second generation women were doing remarkably better than their male counterparts but none of the male groups fared worse over time. With regard to the US data, six groups were shown to have made significant improvements with five groups staying in similar positions. Three groups showed significant deterioration but the results here hardly challenged the straight-line theory, for the groups concerned – Indian men and women, and Chinese women – were doing much better than their White peers in 1990/1 but were getting closer to their White peers in 2000/1. The most disadvantaged groups, men and women of African American, Hispanic, and Mexican heritages, were all shown to have gained more desirable positions in the labour market in 2000 as compared with a decade before. These groups were, to be sure, still facing severe disadvantages in 2000, but the progress they were making was equally unmistakable.
(Table 8 about here)
Turning to between-country comparisons, we find that in 14 out of the 20 cases,
the US second generation were doing better than their British counterparts, with the remainder showing no significant differences. It is remarkable that, as compared with Black African men in Britain, African American men in the US were doing better in both years, and the same occurred in the comparison between Black African and African American women in the earlier period. Similarly, Black Caribbean men were found less disadvantaged in the US than in Britain in both years and Black Caribbean women were also doing better in the US in 1990.
Overall social fluidity in ethnic stratification Finally in this section, we assess the overall pattern of ethnic stratification in the labour market in the two countries. For this purpose, we use the standard loglinear and the UNIDIFF models as earlier noted. Such models are frequently found in mobility studies but can be easily extended in ethnicity research. We apply three models: (1) the base-line (also called conditional independence) model, (2) the loglinear (also called constant social fluidity, CSF, which could in this context be called constant socio-ethnic fluidity) model, and (3) the UNIDIFF model.10 Very briefly, the baseline
10 The models can be written as: 1 The baseline (or conditional independence) model:
logFijk = µ + λiE + λj
D + λkC + λik
EC + λjkDC
2: The constant social fluidity (CSF) model: logFijk = µ + λi
E + λjD + λk
C + λikEC + λjk
DC + λijED
3: The log-multiplicative or UNIDIFF model: logFijk = µ + λi
E + λjD + λk
C + λikEC + λjk
DC + λijED + βkXij
16

model assumes that the distributions of ethnicity (E) and labour market position (or destination, D) vary by country (C) but there is no association between them. In other words, all the odds ratios or relative chances defining ethnicity and labour market position are equal at a value of one (or a log odds of 0). The CSF model allows for the latter, but not the three-way association of EDC, which would be a saturated model. The UNIDIFF model further allows for a uniform movement for the coefficient of one country to move above or below that of the other. As Britain is used as the reference country in assessing the UNIDIFF effects and as log odds rather than odds ratios are shown in Table 9, positive coefficients for the US would indicate greater socio-ethnic inequality in the US as compared with Britain, and negative coefficients would mean the opposite.
The results (Table 9) show11 that, overall, the CSF and the UNIDIFF models fit the data poorly as none of them reach the conventional 0.05% level although the UNIDIFF models provide significant improvement in fit over the CSF models in three out of four cases, the exception being the model for women in 200/1. Yet it is also the case that only a small proportion of cases were misclassified in the CSF, as in the UNIDIFF, models, as indicated by the sign. Our main interest is in the coefficients (in terms of log odds) of the US relative to Britain, which are -.11, -.09, -.04 and .00 for men and women in 1990/1 and 2000/1 respectively. The first three β coefficients are highly significant at the 0.001 levels. Substantively, what this means is that, as compared with Britain, there is greater social (ethnic) fluidity for the US men at both time points and for the US women in 1990. British women were doing as well as their US counterparts in 2000. This marks the US as being more open. Yet it is also the case that the β coefficients were getting closer to 0 (or the anti-log of 1), from -.11 to -.04 for men, and from -.09 to .00 for women. The overall conclusion is, therefore, that apart from women in 2001, there is greater social inequality in Britain than in the US in terms of second-generation labour market position, and that Britain is catching up, slowly but steadily. Discussion and conclusion Both Britain and the US hold, in principle and enshrined in the laws, the ideal of social justice and equal opportunity. To the extent that this justice is manifested in ethnic (along with gender and class) terms, the second-generation educational and occupational attainment in the two countries provides the best test of the thesis of American Exceptionalism. The availability of data a decade apart on their changing fortunes also uniquely allows us to test the competing claims of the straight-line and the segmented assimilation theories. As the new second generation on both sides of the Atlantic now constitutes an increasingly important force in the labour market and the democratic process, their integration profile is an issue not only of great academic interest but also of important policy implications.
where E stands for ethnicity, D for labour market position, C for country. With regard to βkXij, Xij indicates the general pattern of the ethnicity-destination association and βk the direction and the relative strength of this association specific to a country. In fitting the UNIDIFF model, we set Britain as the reference category. 11 The models are based on the economically active. Including economically inactive respondents would have similar results, with the β coefficient being -.039, .007, -.036 and -.007 for men in 1990/1, 2000/1, and women in 1990/1, 2000/1 respectively (the first and the third being significant at the 0.001 levels).
17

To recapitulate on the debates, academic interest in the social integration of the new second generation has a longer and a more current standing. The longer-standing debate is on the greater social fluidity of the US society. Many celebrated political scientists and sociologists from Tocqueville, Marx, Blau and Duncan, Lipset to Model have argued for the thesis of American Exceptionalism although rigorous comparative research on social mobility in the two countries have failed to provide the evidence (Erikson and Goldthorpe, 1985; Kerckhoff, Campbell and Winfield-Laird, 1985). The current debate on the fortunes of immigrants born and bred in the receiving countries is being waged between the straight-line and the segmented assimilation theories, with the former predicting overall social progress for the new second generation with the passage of time, and the latter claiming a trifurcated model – upward social mobility, occupational stagnation and downward assimilation into the underclass. Elegant in formulation and forceful in policy implications, the segmented assimilation theory is enjoying great popularity in the US and is being ‘exported’ into the European context in spite of the challenges posed by numerous researchers. Yet, there has been, to our knowledge, no systematic research either in the US or elsewhere using national representative data for the new second generation, let alone in a cross-country manner. It is also noted here that insomuch as the two theories have different focuses they do not really engage in a direct dialogue. The straight-line assimilation theory is prospective in nature accommodating the possibility of ethnic differences both among different minority groups and between them and the majority group whereas the segmented assimilation theory is stratificational in character focusing as it does on the inter-group differences in their pathways. Only by extending its comparative lenses can we conduct meaningful tests of its central claims against those of the straight-line assimilation theory.
This study uses the most authoritative data sources from the micro data from the two most recent Censuses in the two countries with all key variables standardised. We focus on tertiary education and the labour market status of the second generation immigrants in the two countries as these two aspects constitute the most important cornerstones of immigrant integration. From a cross-sectional perspective, our results do show considerable variations amongst the second generation groups, with some groups such as Chinese and Indians doing better than Whites whilst others, particularly Black Africans, Black Caribbeans and Pakistanis/Bangladeshis in Britain, and African Americans, Black Caribbeans, Hispanics and Mexicans in the US doing worse than Whites. Such variations may be taken as support for the segmented assimilation theory but their overtime progress must be viewed as lending support for the straight-line assimilation theory.
The between-country analysis generally shows the US as providing more favourable educational and occupational opportunities for the second generation as compared with Britain. Yet, we also found evidence of Britain catching up with the US, for both men and women. Second-generation women in Britain were in fact doing equally well as their American counterparts in 2001. In both countries, there is clear evidence ethnic penalty as shown by several ethnic groups doing better educationally but faring worse in the labour market. In short, social progress is visible but much more must be done, especially in Britain, to ensure that ‘everyone has a fair chance in life’ (Queen’s Speech, 3 Dec. 2008).
Finally, limitations of the present study must also be recognised. Even though this study uses the best data sources currently available with all the key variables carefully standardised, it is also the case that some other sociologically important variables such as parental class as used by Erikson and Goldthorpe (1985), parental discipline
18

and control as used by Portes and Rumbaut (2001) and Waters et al. (2009), or intra-community ‘cultural creativity’ as argued by Kasinits et al. (2008), are not available in the Census data. Future research should explore these aspects. However, it must be said that whatever the presumed processes – and no dataset could fully capture all these processes – it is still the outcomes that bear the crucial and direct importance to testing the competing theories. In this case we believe that the present study makes a unique contribution to understanding the patterns and trends of second-generation integration in the two countries.
Overall, our analysis shows that second-generation immigrants are indeed making progress and that Britain is catching up with the US. Yet in spite of the progress being made, many second-generation groups in both countries still face varying degrees of ethnic penalty. There are still numerous obstacles confronting the second generation in achieving equity in education and in translating education into occupation in the labour market. Government institutions, employers and the wider society have a responsibility to help them achieving upward mobility. Leaving the matters to the parents to instil cultural norms and to practise discipline and control may help, but it is the government policies in education and employment that will play the crucial role for lifting the most vulnerable out of the poverty trap. This applies to the poorer sections of the minority as well as to the majority groups alike. Acknowledgement I am grateful to Professor Mary Waters for advice on ethnic coding in the US data and to Professors Fiona Devine, Robert Putnam, Ceri Peach, attendants at the 2009 Harvard-Manchester Summer School, and attendants at the 2009 Nuremberg International Conference on Adult Education and the Labour Market for helpful suggestions. I am also grateful to David Yao for help with some technical matters. All errors in the paper remain mine.
19

References
Alba, R., Lutz, A. and Vesselinov, E. (2001). ‘How enduring were the inequalities
among European immigrant groups in the U.S.?’, Demography, 38: 349-56. Alba, R. and Nee, V. (2003) Remaking the American Mainstream: Assimilation and
Contemporary Immigration. Cambridge, MA: Harvard University Press. Alba, R. (2005) ‘Bright versus blurred boundaries: second-generation assimilation
and exclusion in France, Germany and the United States’, Ethnic and Racial Studies, 28, 20-49.
Bell, D. (1972) ‘On meritocracy and equality’, The Public Interest, 29: 29-68. Blau, P. and Duncan, O. (1967) The American Occupational Structure. New York:
Wiley & Sons. Cheng, Y. (1994) Education and Class: Chinese in Britain and the United States,
Aldershot: Avebury.Cheung, S. and Heath, A. (2007) ‘Nice work if you can get it: Ethnic penalties in
Great Britain’, in A. Heath and S. Cheung (2007) (eds) Unequal Chances: Ethnic Minorities in Western Labour Markets, Oxford University Press, pp: 505-48.
Chiswick, B. (1978) ‘The Effect of Americanization on the Earnings of Foreign-born Men’, The Journal of Political Economy, 86(5), 897-921.
Chiswick, B. and Miller, P. (1995) ‘The Endogeneity between Language and Earning: International Analysis’, Journal of Labour Economics 13: 246-288.
Chiswick, B. and Miller, P. (2002) ‘Immigrant earnings: language skills, linguistic concentrations and the business cycle’, Journal of Population Economics 15: 31-57.
Chun, H. and Lee, I. (2001) ‘Why do married men earn more: productivity or marriage selection?’, Economic Inquiry 39(2): 307-19.
Citro, C. F., Cork, D. L., and Narwood, J. L. (2004) (eds) The 2000 Census: Counting Under Adversity, Washington D.C.: The National Academic Press.
Clark, K. and Drinkwater, S. (1998) ‘Ethnicity and self-employment in Britain’, Oxford Bulletin of Economics and Statistics, 60: 383-407.
Daley, P. (1996) ‘Black-African: students who stayed’, in C. Peach (ed.) Ethnicity in the 1991 Census, Vol. 2. London: HMSO, pp. 44-65.
Daniel, W. (1968) Racial Discrimination in England, London: Penguin. Darity, W. Jr and Mason, P. (1998) ‘Evidence on discrimination in employment:
codes of color, codes of gender’, Journal of Economic Perspectives 12: 63-90. Devine, F. (1997) Social Class in America and Britain, Edinburgh: Edinburgh
University Press. Duncan, O. D. (1968) ‘Inheritance of poverty or inheritance of race’, in D. Moynihan
(ed.) On Understanding Poverty: perspectives from the social sciences, New York: Basic Books, pp: 85-110.
Erikson, R. and Goldthorpe, J. (1985) ‘Are American rates of social mobility exceptionally high? New evidence on an old issue’ European Sociological Review, 1(1): 1-22.
Erikson, R. and Goldthorpe, J. (1992) The Constant Flux, Oxford: Clarendon Press. Farley, R. and Alba, R. (2002) ‘The new second generation in the United States’,
International Migration Review, 36: 669-701. Gans, H. J. (2007) ‘Acculturation, Assimilation and Mobility’, Ethnic and Racial
Studies 30 (1):152-164. Goldthorpe, J. and McKnight, A. (2006) ‘The Economic Basis of Social Class’, in
Morgan, S., Grusky, D. and Fields, G. (2006) (eds) Mobility and Inequality:
20

Frontiers of Research in Sociology and Economics, California: Stanford University Press, pp: 109-36.
Goldthorpe, J. (with Llewellyn, C. and Payne, C.) (1987) Social Mobility and Class Structure in Modern Britain, Oxford: Clarendon Press.
Goldthorpe, J. (2007) On Sociology, Vols. 1 and II, Stanford: Stanford University Press.
Gordon, M. (1964) Assimilation in American Life: The role of race, religion and national origins, New York: OUP.
Halsey, A. H., Heath, A. F., and Ridge, J. M. (1980) Origins and Destinations: Family, Class and Education in Modern Britain, Oxford: Clarendon Press.
Heath, A. and Cheung, S. (2007) ‘The Comparative Study of Ethnic Minority Disadvantage’, in A. Heath and S. Cheung (2007) (eds) Unequal Chances: Ethnic Minorities in Western Labour Markets, Oxford University Press, pp: 1-44.
Heath, A. and Li, Y. (2007) ‘Measuring the size of the employer contribution to the ethnic minority employment gap’, research report for the National Employment Panel, http://www.ccsr.ac.uk/staff/yaojun/nep.pdf
Heath, A. and Li, Y. (2008) ‘Period, life-cycle and generational effects on ethnic minority success in the labour market’, Kölner Zeitschrift für Soziologie und Sozialpsychologie, 48: 277-306.
Heath, A. and McDonald, S. (1987) 'Social change and the future of the Left', The Political Quarterly, 58: 364-377.
Heath, A., Rothon, C. and Kilpi, E. (2008) ‘The Second Generation in Western Europe: Education, Unemployment and Occupational Attainment’, Annual Review of Sociology 34: 211-35.
Kasinits, P., Mollenkopf, J, Waters, M. and Holdaway J. (2008) Inheriting the City: The Children of Immigrants Come of Age, New York: Russell Sage Foundation.
Kerckhoff, A., Campbell, R. and Wingfield-Laird, I. (1985) ‘Social Mobility in Great Britain and the United States’, American Journal of Sociology, 90(2): 281-308.
Li, Y. and Heath, A. (2008) ‘Ethnic minority men in British labour market (1972-2005)’, International Journal of Sociology and Social Policy, 28(5/6): 231-244.
Li, Y. and Heath, A. (2009) ‘Struggling onto the ladder, climbing up the rungs: employment status and class position by minority ethnic groups in Britain (1972-2005)’, forthcoming, in J. Stillwell, P. Norman, C. Thomas and P. Surridge. (eds), Population, Employment, Health and Well-being, Springer.
Lieberson, S. (1980) A Piece of the Pie: Blacks and White Immigrants since 1880. Berkeley: University of California Press.
Lipset, S. (1991) ‘American Exceptionalim Reaffirmed’, in B. E. Shafer (ed.) Is America Different? Oxford: Clarendon Press), pp. 1-45.
Marx, K. (1865/1958) Selected Works, Moscow: Foreign Languages Publishing House.
Massey, D. (1995) ‘The new immigration and ethnicity in the United States’, Population and Development Review, 21(3): 631–52.
Menjívar, C. (2000) Fragmented Ties: Salvadoran Immigrant Networks in America. Berkeley, CA: University of California Press
Model, S. and Fisher, G. (2002) ‘Unions between blacks and whites: England and the US compared’. Ethnic and Racial Studies 25: 728-754.
Model, S. (2005) ‘Non-white Origins, Anglo Destinations: Immigrants in the US and Britain’, in G. Loury, T. Modood and S.M. Teles (eds.) Ethnicity, Social Mobility and Public Policy in the US and UK. Cambridge University Press, pp. 363-92.
21

Morawska, E. 2008. "Research on Immigration/Ethnicity in Europe and the United States: A Comparison." The Sociological Quarterly 49(3):465-482.
Olson, M. (1982) The Rise and Decline of Nations, New Haven: Yale University Press.
Park, R. and Burgess E. (1921) Introduction to the Science of Sociology, Chicago: University of Chicago Press.
Perlmann, J. and Waldinger, R. (1997) ‘Second-generation decline? Immigrant children past and present: a reconsideration’, International Migration Review, 31(4): 893-922.
Portes, A. (1997) ‘Immigration Theory for a New Century: Some Problems and Opportunities’, International Migration Research, 31(4): 0799-0825.
Portes, A. and Rumbaut, R. (2001) Legacies: The Story of the Immigrant Second Generation. Berkeley: University of California Press.
Portes, A. and Zhou, M. (1993) ‘The New Second Generation: Segmented Assimilation and Its Variants Among Post-1965 Immigrant Youth’, Annals of the American Academy of Political and Social Science, 530: 74-96.
Portes, A., Fernandez-Kelly, P. and Haller, W. (2005) ‘Segmented Assimilation on the Ground: The New Second Generation in Early Adulthood’, Ethnic and Racial Studies 28 (6):1000-1040.
Portes, A., Fernandez-Kelly, P. and Haller, W. (2009) ‘The Adaptation of the Immigrant Second Generation: Theoretical Overview and Recent Evidence,’ Journal of Ethnic and Migration Studies 35 (7):1077-1104.
Roodman, D. 2009. Estimating fully observed recursive mixed-process models with cmp. Working Paper 168. Center for Global Development. Washington, DC
Rose, D. and O’Reilly, K. (1998) Final Report of the ESRC Review of Government Social Classifications, Swindon: ESRC/ONS.
Ruggles, S., Sobek, M., Alexander, T., Fitch, C., Goeken, R. Hall, P., King, M. and Ronnander, C. (2008) Integrated Public Use Microdata Series: Version 4.0 [Machine-readable database]. Minneapolis, MN: Minnesota Population Center [producer and distributor].
Simpson, L. (2004) ‘Statistics of Racial Segregation: Measures, Evidence and Policy’, Urban Stuidies 41(3): 661-81.
Stewart, M. (1983) ‘Racial discrimination and occupational attainment in Britain’, The Economic Journal, 93: 521-41.
Telles, E. and Murguia, E. (1990) ‘Phenotypic discrimination and income differences among Mexican Americans’, Social Science Quarterly, 71: 682-696.
Thomson, M. and Crul, M. (2007) ‘The Second Generation in Europe and the United States: How is the Transatlantic Debate Relevant for Further Research on the European Second Generation?’ Journal of Ethnic and Migration Studies, 33(7): 1025-1047.
Tocqueville, A. (1835, 1968) De la démocratie en Amérique, J-P Mayer (ed.) Paris: Gallimard.
Perlmann, J. and Waldinger, R. (1997) ‘Second generation decline? Children of immigrants, past and present – a reconsideration’ International Migration Review 30 (4).
Waldinger, Roger, and Joel Perlmann. 1998. ‘Second Generations: Past, Present, Future’, Journal of Ethnic and Migration Studies 24 (1):5-24.
Waldinger, R. (2005) ‘Networks and niches: the continuing significance of ethnic connections’, Pp 342-362 in Glenn C Loury, Tariq Modood and Steven M Teles (eds) Ethnicity, Social Mobility and Public Policy. Cambridge: CUP.
22
Waldinger, R.. (2007) “Did Manufacturing Matter? The Experience of Yesterday's Second Generation: A Reassessment.” International Migration Review 41 (1):3-39.
Waldinger, R, and Feliciano, C. (2004) “Will the New Second Generation Experience 'Downward Assimilation'? Segmented Assimilation Re-Assessed.” Ethnic and Racial Studies 27 (3):376-402.
Waldinger, R., Lim, N. and Cort, D. (2007) “Bad jobs, good jobs, no jobs? The employment experience of the ‘new’ second generation’, Journal of Ethnic and Migration Studes, 33(1): 1-35.
Warner, W. and Srole, L. (1945) The Social Systems of American Ethnic Groups. New Haven: Yale University Press.
Waters, M. and Jiménez, T. (2005) ‘Assessing Immigrant Assimilation: New Empirical and Theoretical Challenges’, Annual Review of Sociology, 31: 16.1-16.21.
Waters, M. (2008) ‘Counting and Classifying by Race: The American Debate’, The Tocqueville Review/La Revue Tocqueville, 24(1): 1-21.
Waters, M. and Ueda, R. with Marrow, H. (2007) The New Americans: A Guide to Immigration Since 1965, Cambridge, Massachusetts: Harvard University Press.
Xie, Y. (1992) ‘The Log-multiplicative Layer Effect Models for Comparing Mobility Tables’, American Sociological Review, 57: 380-395.
Zhou, M. and Bankson, C.L. (2001) ‘Family pressure and the educational experience of the daughters of Vietnames refugees,’ International Migration Review, 39(4): 133-51.
23

Table 1 Tertiary education (%) by ethnicity in Britain and the US in 1990/1-2000/1 1990/1 2000/1 GB US GB US Men
White 17.0 30.9 21.1 33.8 B Caribbean 6.7*** 19.4*** 15.8*** 29.4* B African/Afr American 22.9*** 13.3*** 44.5*** 15.8*** Indian 14.3* 42.4*** 40.3*** 49.5*** Pakistani/Bangladeshi 9.5*** 46.5 25.2*** 40.2 Chinese 34.5*** 59.8*** 53.2*** 62.5*** Hispanic -- a 16.1*** -- a 16.9*** Mexican -- a 13.6*** -- a 14.4*** All: % b 15.1 24.2 24.9 26.5 All: N c 12,899 77,096 19,233 95,181
Women White 14.3 28.1 21.1 34.7 B Caribbean 9.0*** 21.0*** 23.6** 31.1 B African/Afr American 22.6** 17.1*** 46.5*** 20.4*** Indian 11.0** 41.9*** 39.7*** 54.1*** Pakistani/Bangladeshi 4.5*** 27.6 19.7 47.8** Chinese 24.9** 58.8*** 49.7*** 62.9*** Hispanic -- a 16.7*** -- a 21.4*** Mexican -- a 12.3*** -- a 16.6*** All: % b 12.9 23.5 25.8 28.7 All: N c 12,589 78,330 19,451 95,314
Notes:
1. a Categories not available in the British data; b sample percentages with tertiary education; and c total sample size including respondents without tertiary education.
2. Significance tests with each minority ethnic group compared with the White group, * p<0.05, ** p<0.01 and *** p<0.001 (the same below for the p values).
3. Weighted analysis and unweighted Ns (the same in the following tables). Source: The Samples of Anonymised Records (SARs) from the 1991 and 2001 British
Censuses of the Population (1% + 2% SARs in 1991, 3% SARs in 2001) and the Integrated Public Use Microdata (IPUMs) from the 1990 and 2000 US Censuses of the Population (1% +5% samples in 1990 and 2000).
24

Table 2 Logit regression on tertiary education by ethnicity controlling for age and health condition in Britain and the US in 1990/1-2000/1
1990/1 2000/1 GB US GB US Men
White 0 0 0 0 B Caribbean -0.865*** -0.560*** -0.491*** -0.107 B African/Afr American 0.589*** -1.042*** 1.062*** -0.962*** Indian 0.221* 0.943*** 0.898*** 1.307*** Pakistani/Bangladeshi -0.126 1.199*** 0.377*** 1.170*** Chinese 1.333*** 1.321*** 1.438*** 1.476*** Hispanic - -0.779*** - -0.822*** Mexican - -0.978*** - -0.945*** Age 1.919*** 2.371*** 1.951*** 2.403*** Age squared -0.234*** -0.281*** -0.257*** -0.278*** Having long-term illness -0.907*** -0.972*** -0.927*** -0.785*** Constant -5.150*** -5.374*** -4.577*** -5.446*** Pseudo R2 0.057 0.129 0.082 0.144 N 12,899 77,096 19,233 95,181
Women White 0 0 0 0 B Caribbean -0.498*** -0.414*** -0.004 -0.092 B African/Afr American 0.601*** -0.653*** 1.056*** -0.698*** Indian 0.004 1.096*** 0.815*** 1.344*** Pakistani/Bangladeshi -0.832*** 0.300 -0.039 1.388*** Chinese 0.882*** 1.367*** 1.200*** 1.419*** Hispanic - -0.631*** - -0.595*** Mexican - -1.021*** - -0.867*** Age 2.488*** 2.862*** 2.045*** 2.688*** Age squared -0.341*** -0.393*** -0.293*** -0.343*** Having long-term illness -0.803*** -0.833*** -0.777*** -0.615*** Constant -5.918*** -5.677*** -4.452*** -5.485*** Pseudo R2 0.048 0.104 0.060 0.116 N 12,589 78,330 19,451 95,314
25
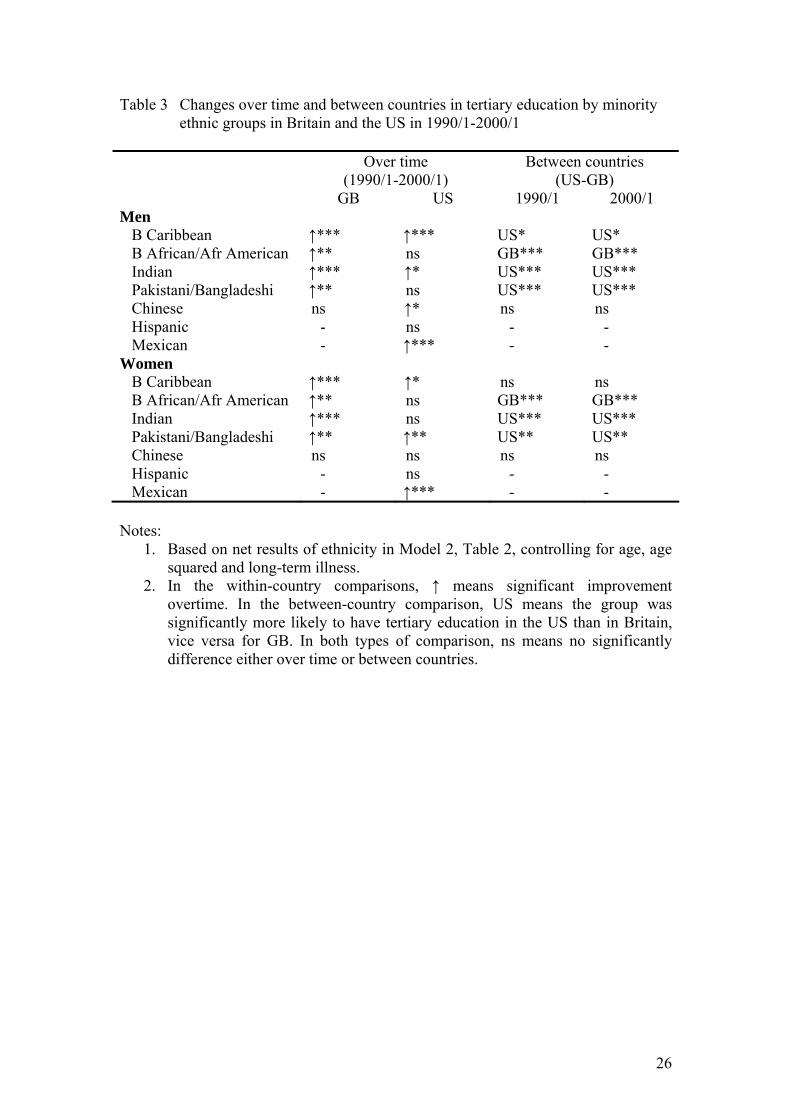
26
Table 3 Changes over time and between countries in tertiary education by minority ethnic groups in Britain and the US in 1990/1-2000/1
Over time
(1990/1-2000/1) Between countries
(US-GB) GB US 1990/1 2000/1 Men
B Caribbean ↑*** ↑*** US* US* B African/Afr American ↑** ns GB*** GB*** Indian ↑*** ↑* US*** US*** Pakistani/Bangladeshi ↑** ns US*** US*** Chinese ns ↑* ns ns Hispanic - ns - - Mexican - ↑*** - -
Women B Caribbean ↑*** ↑* ns ns B African/Afr American ↑** ns GB*** GB*** Indian ↑*** ns US*** US*** Pakistani/Bangladeshi ↑** ↑** US** US** Chinese ns ns ns ns Hispanic - ns - - Mexican - ↑*** - -
Notes:
1. Based on net results of ethnicity in Model 2, Table 2, controlling for age, age squared and long-term illness.
2. In the within-country comparisons, ↑ means significant improvement overtime. In the between-country comparison, US means the group was significantly more likely to have tertiary education in the US than in Britain, vice versa for GB. In both types of comparison, ns means no significantly difference either over time or between countries.

Table 4 Labour market position of White and 2nd minority men in Britain and the USA in 1990/1 – 2000/1 (percentage by row) Britain USA 1990/1 SC INT WC UN IN SC INT WC UN IN White 26.7 22.5 30.6 11.4 8.8 31.4 22.3 31.9 4.4 9.9 Black Caribbean 14.5 18.3 28.9 33.7 4.6 24.8 23.2 34.4 7.1 10.5 Black African/A American 17.1 22.6 17.8 37.5 5.1 12.8 23.4 30.8 10.8 22.2 Indian 18.6 27.4 24.7 27.0 2.3 39.1 29.4 14.1 5.8 11.5 Pakistani/Bangladeshi 12.7 25.2 18.5 38.1 5.5 31.8 29.3 18.5 12.4 8.0 Chinese 35.0 25.9 8.8 23.4 6.9 54.0 22.6 13.5 3.7 6.2 Hispanic - - - - - 18.3 26.5 28.5 8.8 17.8 Mexican - - - - - 16.2 26.0 36.8 8.5 12.4 (All) 23.3 22.4 28.8 18.2 7.3 24.6 23.6 30.7 7.1 14.0 2000/1 White 33.5 27.4 19.0 5.2 14.9 32.4 22.0 29.0 3.6 13.0 Black Caribbean 27.9 22.3 19.8 16.8 13.2 28.7 25.2 28.1 3.8 14.1 Black African/A American 36.7 18.8 13.4 18.3 12.8 13.7 22.7 25.0 9.1 29.4 Indian 41.7 24.1 15.1 11.6 7.5 45.5 17.8 9.3 14.7 12.8 Pakistani/Bangladeshi 22.7 21.2 18.4 22.7 15.0 40.8 32.4 8.7 10.9 7.2 Chinese 44.1 24.3 14.0 9.1 8.5 54.8 22.6 9.4 4.7 8.6 Hispanic - - - - - 18.4 25.2 25.0 7.4 23.9 Mexican - - - - - 16.4 26.8 29.8 7.2 19.7 (All) 32.8 24.8 18.2 10.9 13.4 25.4 23.3 25.6 6.4 19.3 Notes:
1. SC: Professional and managerial salariat class; INT: the intermediate class of routine non-manual, own-account, lower supervisorial and lower technical workers; WC: the working class of skilled, semi-skilled and unskilled manual workers, including agricultural labourers; UN: the unemployed; and IN: the inactive.
27

Table 5 Labour market position of White and 2nd minority women in Britain and the USA in 1990/1 – 2000/1 (percentage by row) Britain USA 1990/1 SC INT WC UN IN SC INT WC UN IN White 19.3 34.8 12.4 5.6 27.9 27.7 27.6 17.4 3.6 23.7 Black Caribbean 16.2 37.5 7.3 17.4 21.5 24.7 27.5 17.7 5.7 24.5 Black African/A American 15.5 26.6 6.1 26.5 25.4 17.7 22.6 24.9 9.3 25.5 Indian 13.5 36.4 11.0 18.0 21.0 32.4 29.4 11.8 5.5 20.9 Pakistani/Bangladeshi 7.5 19.0 7.6 22.6 43.4 19.2 26.9 20.1 5.3 28.5 Chinese 23.9 34.2 4.0 15.3 22.6 47.1 28.4 9.8 2.4 12.2 Hispanic - - - - - 17.8 24.6 16.8 7.7 33.1 Mexican - - - - - 16.9 27.7 19.2 6.9 29.4 (All) 17.6 34.3 11.0 10.2 27.0 23.5 26.0 19.3 6.1 25.2 2000/1 White 28.2 22.9 21.2 3.3 24.4 33.1 23.8 17.2 3.5 22.5 Black Caribbean 30.1 23.6 14.4 9.1 22.9 30.4 24.3 17.8 5.1 22.5 Black African/A American 34.6 20.6 13.5 10.7 20.5 21.6 21.3 22.6 8.7 25.8 Indian 35.5 24.7 12.0 8.8 19.1 40.0 23.2 9.8 10.4 16.6 Pakistani/Bangladeshi 15.2 15.4 12.2 12.7 44.5 35.8 29.0 8.9 7.6 18.8 Chinese 37.2 28.7 13.9 8.8 11.5 48.7 23.0 8.8 5.3 14.2 Hispanic - - - - - 21.9 23.9 16.7 7.5 29.9 Mexican - - - - - 21.9 26.8 19.0 6.3 26.0 (All) 28.6 22.4 16.9 6.9 25.3 28.0 23.5 18.1 6.2 24.2
28

Table 6 Conditional mixture-process models on male labour market position in Britain and the US (1990/1) 1990/1 2000/1 Britain US Britain US Model 1 Model 2 Model 1 Model 2 Model 1 Model 2 Model 1 Model 2 Regression (LM position) White (ref) 0 0 0 0 0 0 0 0 B Caribbean -0.608*** -0.335*** -0.186*** -0.054 -0.342*** -0.214*** -0.030 0.045 B African/African American -0.555*** -0.528*** -0.408*** -0.250*** -0.195*** -0.401*** -0.141*** -0.044** Indian -0.373*** -0.158*** 0.292*** 0.310*** -0.027 -0.091** 0.120* 0.124* Pakistani/Bangladeshi -0.639*** -0.360*** -0.054 -0.140 -0.521*** -0.422*** 0.071 0.239* Chinese 0.040 0.046 0.547*** 0.344*** 0.082 -0.108 0.446*** 0.316*** Hispanic - - -0.241*** -0.082** - - -0.095*** 0.058** Mexican - - -0.359*** -0.164*** - - -0.208*** -0.016 No tertiary education -1.363*** -1.100*** -1.072*** -0.885*** Age 0.428*** 0.030 0.672*** 0.090*** Age squared -0.050*** 0.008* -0.076*** 0.003 Having dependent children -0.048* -0.115*** -0.046* -0.110*** Unpartnered -0.282*** -0.150*** -0.245*** -0.059***
29

Selection (LM participation) White (ref) 0 0 0 0 0 0 0 0 B Caribbean 0.282*** -0.207** 0.087 0.051 -0.026 -0.192*** -0.051 -0.056 B African/African American 0.314 -0.146 -0.529*** -0.492*** 0.052 -0.181** -0.541*** -0.490*** Indian 0.550*** -0.010 -0.209 -0.297* 0.289*** -0.058 0.108 -0.130* Pakistani/Bangladeshi 0.289** -0.254* 0.018 -0.035 -0.150*** -0.466*** 0.330* 0.084 Chinese 0.138 -0.314 0.127* -0.004 0.173 -0.095 0.224*** -0.004 Hispanic - - -0.370*** -0.395*** - - -0.401*** -0.423*** Mexican - - -0.176*** -0.203*** - - -0.284*** -0.295*** Having long-term limiting illness -2.138*** -2.036*** -1.574*** -1.441*** -1.686*** -1.560*** -0.398*** -0.294*** No tertiary education 0.048 -0.504*** -0.340*** -0.602*** Age 0.592*** 0.505*** 0.536*** 0.064* Age squared -0.133*** -0.098*** -0.102*** -0.037*** Having dependent children -0.031 0.453*** 0.149*** 0.447*** Unpartnered -0.319*** -0.223*** -0.225*** 0.029 Constant 1.859*** 2.131*** 1.576*** 1.639*** 1.481*** 1.532*** 1.181*** 1.852*** Rho -0.379*** -0.380*** -0.374*** -0.366*** -0.447*** -0.455*** -1.502*** -1.304*** Intercept 1 -1.081*** -1.647*** -1.623*** -2.381*** -1.361*** -1.146*** -1.580*** -1.952*** Intercept 2 -0.182*** -0.674*** -0.366*** -1.043*** -0.629*** -0.320*** -0.517*** -0.829*** Intercept 3 0.478*** 0.100 0.369*** -0.193*** 0.104*** 0.543*** 0.117*** -0.082* N 12,899 12,899 77,089 77,089 19,233 19,233 95,151 95,151 Note:
1. In the section model, active=1, inactive=0; in the regression model, 1=unemployed, 2=working class; 3=intermediate class and 4=salariat.
30

Table 7 Conditional mixture-process models on female labour market position in Britain and the US (1990/1) 1990/1 2000/1 Britain US Britain US Model 1 Model 2 Model 1 Model 2 Model 1 Model 2 Model 1 Model 2 Regression (LM position) White (ref) 0 0 0 0 0 0 0 0 B Caribbean -0.315*** -0.187*** -0.116** -0.053 -0.044 -0.035 -0.090* -0.018 B African/African American -0.532*** -0.628*** -0.430*** -0.296*** -0.020 -0.260*** -0.310*** -0.173*** Indian -0.425*** -0.258*** 0.078 0.198** 0.054 -0.022 -0.057 0.038 Pakistani/Bangladeshi -0.676*** -0.279*** -0.203 0.011 -0.320*** -0.063 -0.018 0.189 Chinese -0.074 -0.103 0.362*** 0.162*** 0.005 -0.188** 0.176*** 0.086** Hispanic - - -0.246*** -0.087** - - -0.170*** -0.024 Mexican - - -0.278*** -0.090*** - - -0.207*** -0.004 No tertiary education -1.198*** -0.851*** -0.890*** -0.716*** Age 0.727*** 0.256*** 0.894*** 0.316*** Age squared -0.097*** -0.022*** -0.111*** -0.027*** Having dependent children 0.093*** -0.077*** -0.092*** -0.006 Unpartnered -0.150*** -0.207*** -0.105*** -0.155***
31

32
Selection (LM participation) White (ref) 0 0 0 0 0 0 0 0 B Caribbean 0.190*** 0.081* 0.009 0.022 0.020 0.004 0.013 0.016 B African/African American 0.148 0.021 -0.011 -0.027 0.121* 0.012 -0.073*** -0.057** Indian 0.201*** 0.161** 0.054 -0.181 0.114*** 0.014 0.253*** -0.065 Pakistani/Bangladeshi -0.419*** -0.373*** -0.225 -0.408 -0.637*** -0.641*** 0.140 -0.204 Chinese 0.188 -0.080 0.413*** 0.159*** 0.412*** 0.099 0.322*** 0.081** Hispanic - - -0.251*** -0.246*** - - -0.207*** -0.193*** Mexican - - -0.193*** -0.121*** - - -0.114*** -0.109*** Having long-term limiting illness -1.040*** -1.093*** -1.179*** -1.117*** -1.150*** -1.137*** -0.238*** -0.144*** No tertiary education -0.686*** -0.590*** -0.560*** -0.571*** Age -0.096 0.200*** 0.058 -0.090** Age squared -0.006 -0.038 *** -0.023** -0.006 Having dependent children -0.803*** -0.339*** -0.531*** -0.085*** Unpartnered 0.271*** 0.255*** 0.108*** 0.184*** Constant 0.667*** 2.074*** 0.816*** 1.204*** 0.876*** 1.692*** 0.772*** 1.576*** Rho -0.438*** -0.893*** -0.397*** -0.749*** -0.372*** -0.660*** -1.102*** -1.527*** Intercept 1 -1.381*** -1.334*** -1.708*** -1.955*** -1.474*** -0.773*** -1.687*** -1.550*** Intercept 2 -0.851*** -0.804*** -0.722*** -0.954*** -0.629*** 0.134 -0.827*** -0.647*** Intercept 3 0.377*** 0.491*** 0.177*** 0.004 0.129*** 0.982*** -0.134*** 0.086 N 12,589 12,589 78,317 78,317 19,451 19,451 95,278 95,278 Note:
1. In the section model, active=1, inactive=0; in the regression model, 1=unemployed, 2=working class; 3=intermediate class and 4=salariat.

Table 8 Changes over time and between countries in labour market positions by second-generation minority ethnic groups in Britain and the US in 1990/1-2000/1
Over time
(1990/1 - 2000/1) Between countries
(US - GB) GB US 1990/1 2000/1 Men
B Caribbean ↑*** ns US*** US*** B African/Afr American ns ↑*** US*** US*** Indian ns ↓* US*** US*** Pakistani/Bangladeshi ns ns ns US*** Chinese ns ns ns US*** Hispanic - ↑*** - - Mexican - ↑*** - -
Women B Caribbean ↑*** ns US* ns B African/Afr American ↑*** ↑*** US*** ns Indian ↑*** ↓* US*** ns Pakistani/Bangladeshi ↑** ns ns US* Chinese ns ↓* US* US*** Hispanic - ↑* - - Mexican - ↑*** - -
Notes:
1. Based on the regression coefficients for ethnicity in Model 2, Tables 6 and 7, controlling for age, age squared and long-term illness.
2. In the within-country comparisons, ↑ means significant improvement and ↓ significant deterioration overtime. In the between-country comparison, US means the group was significantly more likely to have better labour market position in the US than in Britain, vice versa for GB. In both types of comparison, ns means no significantly difference either over time or between countries.
33

Table 9 Results of fitting the conditional independence, constant social fluidity and UNIDIFF models to labour market position among the economically active
Model G2 df p rG2 BIC 1990/1 Men (N=78,899) 1. Cond. ind. 6089.0 34 0.00 -- 9.7 5,705.6 2. CSF 202.5 15 0.00 96.7 0.8 33.3 3. UNIDIFF 117.7 14 0.00 98.1 0.5 -40.2 2. – 3. (β = -0.11) 84.8 1 0.00 Women (N=67,674) 4. Cond. ind. 4018.6 34 0.00 -- 8.9 3,640.4 5. CSF 189.5 15 0.00 95.3 0.8 22.7 6. UNIDIFF 148.8 14 0.00 96.3 0.8 -6.9 5. – 6. (β = -0.09) 40.7 1 0.00 2000/1 Men (N=93,625) 1. Cond. ind. 7,736.2 34 0.00 -- 10.2 7,347.0 2. CSF 623.0 15 0.00 91.9 1.5 451.3 3. UNIDIFF 601.0 14 0.00 92.2 1.4 440.7 2. – 3. (β = -0.04) 22.0 1 0.00 Women (N=86,607) 4. Cond. ind. 7,241.1 34 0.00 -- 8.0 3,884.5 5. CSF 273.4 15 0.00 93.6 1.1 102.8 6. UNIDIFF 273.3 14 0.00 93.6 1.1 114.1 5. – 6. (β = 0.00) 0.1 1 0.81 Notes:
1. rG2 = Percentage reduction in G2; = Percentage of cases misclassified. 2. For the β coefficients, Britain is the reference category.
34