socio-economic performance · socio-economic performance & integration into the global economy...
TRANSCRIPT


Socio-Economic Performance & Integration into the Global Economy
2

Resilience in the Face of Slow Global Recovery
Africa’s recent economic performance is unmatched in the history of the continent
West Africa
Central Africa
Southern Africa
North Africa
East Africa
* Southeast Asia, China and India
5,5%
2,9%
5,1%
3,3%
6,4%
3,9%
-6%
-4%
-2%
0%
2%
4%
6%
8%
10%
12%
2008 2009 2010 2011 2012 2013
Emerging Asia* Lat Am & Caribbean
United States Euro Area
GDP growth
3
A result of growing domestic demand
Natural resources fueling growth, however, good
performance from countries not richly
endowed with natural resources
Africa
Better macroeconomic management
Higher inflows of financial resources
Higher commodity prices
Good policies to attract domestic &
foreign investments

Africa North Africa
West Africa
East Africa
Central Africa
Southern Africa
Total external debt (% of GDP)
23.2% 16.4% 13.9% 38.0% 16.3% 34.2%
Debt service (% of exports)
10.7% 5.9% 3.6% 6.2% 3.8% 22.3%
Manageable External Debt on the Continent
4

2013 GDP growth
Countries in transition: Countries that can access the Bank’s Fragile States Facility (although not all choose to do so) to consolidate peace, stabilize economies and lay the foundation for sustainable poverty-reduction and long-term economic growth of the eligible countries Factor-driven economies: Low income countries and exporters of raw commodities Investment-driven economies: Countries in transition from the primary sector towards manufacturing and services
A Diverse Economic Landscape Countries in
transition Factor-driven
economies Major oil exporters
Investment-driven economies
DRC, Côte d’Ivoire, Liberia,
Sierra-Leone, South Sudan
Djibouti, Togo
Burundi, Chad, Comoros, Congo,
São Tomé & P., Sudan, Zimbabwe
Eritrea, Guinea
CAR, Guinea-Bissau
Ethiopia
Benin, Burkina Faso, Gambia, Malawi, Mali,
Mauritania, Mozambique, Tanzania,
Uganda, Zambia
Cameroon, Ghana, Lesotho, Niger,
Senegal, Rwanda
Madagascar
–
Angola, Gabon
–
Equatorial Guinea, Libya
Botswana
Kenya, Mauritius, Morocco, Namibia,
Seychelles, Swaziland
Cape Verde, Egypt, South Africa, Tunisia
Nigeria –
–
Algeria
Somalia not included for lack of data
5
>7%
5%–7%
3%–4.9%
1%–2.9%
<1%

6
Stable Macroeconomic Environment Drawing Investors’ Interest
0
20
40
60
Remittances FDI (net inflows)ODA (net inflows)
Remarkable shift in external financing
1,6% 1,4%
-4,1% -2,6% -3,0% -2,9% -3,9%
7.3% 7%
0.4% 0.1% -0.7% -1.6%
-2.7%
-6%
-2%
2%
6%
10%
2007 2008 2009 2010 2011 2012 2013
Fiscal Balance as % of GDP
Current Account Balance (% of GDP)
6,8%
11,3%
9,1%
7,3%
9,1% 8,9%
6,7%
5,0%
7,0%
9,0%
11,0%
13,0%
2007 2008 2009 2010 2011 2012 2013
Inflation
…lowest level in more than 5 years ...countries experiencing social
disruptions under more pressure
…however financing gap still
substantial
Expansionary monetary & fiscal policies support Africa’s growth
Contained inflation
In USD billion

Bright Outlook with Challenges Ahead
GDP expected to grow from 4.8% in 2014 to 5.7% in 2015
Volatility in emerging markets could weaken exports Weakening OECD economies could slow down FDI flows to Africa Home-grown risks: political instability that could undermine a decade of robust growth Deterioration of fiscal balances
Threatened by…
Natural resources and strong domestic demand Investments in infrastructure and expansion of export capacity Africa’s ability to attract FDI and better position itself on the global value chain Africa’s capacity to embark on sustainable industrialization and trade in manufactured products Increasing remittances
Driven by…
7

Scoring Top Marks on Three MDGs
*Best performers represent countries with the greatest improvement from initial conditions
Goal 6: Combat HIV/AIDS, TB, malaria and other diseases
•Target 6A: To have halted by 2015 and begun to reverse the spread of HIV/AIDS
Best performers: *Côte d’Ivoire, Namibia, South Africa, Zimbabwe
•Target 6B: Achieve by 2015 universal access to treatment to HIV/AIDS for all those who need it
Best performers: *Botswana, Comoros, Namibia, Rwanda
Goal 3: Promote gender equality and empower women
•Indicator 3.1: Ratios of girls to boys in primary, secondary and tertiary education
About half of the countries in Africa achieved gender parity in primary school while secondary and tertiary still a challenge
Best performers: *The Gambia, Ghana, Mauritius, Rwanda, São Tome and Príncipe
•Indicator 3.3: Proportion of seats held by women in national parliaments
The proportion of seats held by women in national parliaments in Africa is surpassed only in Latin America and the Caribbean
Best performers: *Angola, Mozambique, Rwanda, Seychelles, South Africa
Goal 2: Achieve universal primary education
•Indicator 2.1: Net enrollment in primary education
Most countries have almost achieved universal primary enrolment, with rates above 90%
Best performers: *Algeria, Egypt, Rwanda, São Tomé and Príncipe
8

Though success stories are emerging
MDGs, an Unfinished Agenda
Goal 7: Ensure environmental sustainability
Mozambique has prioritized water-related infrastructure development with the financing of large-scale rainwater harvesting programs to minimize droughts
Goal 8: Global partnership for development
Increased regionalization and trade with other emerging economies has been a hallmark of growth in Africa over the past decade
Goal 5: Improve maternal health
Universal healthcare in the Seychelles is behind the substantial drop in maternal and child mortality rates
Goal 4: Reduce child mortality
Despite significant challenges, a sustained push by Liberia has resulted in vastly improved child survival rates even exceeding MDG targets
Goal 1: Eradicate extreme poverty and hunger
Extreme poverty almost halted in Tunisia and hunger reduced by over 50% in Ghana and Mauritius in the last decade
9

Overarching goal Eradicate poverty and reduce inequality within the
framework of inclusive and sustainable development underpinned by decent jobs
Africa’s common position on its post-2015
MDG agenda
Africa United on its Post-2015 Development Agenda
Agreed pillars, built on lessons learnt from the implementation of the MDGs
10
UNECA African Union

Unlocking Africa’s Potential Global Value Chains
Infrastructure
development
Regional
integration
Private
sector
development
Governance
&
accountability
Skills
&
technology
Bank’s 10-Year Strategy will help position the continent higher on the Global Value Chain
Reduce the cost
of doing business
Private sector development, a
powerful instrument for the
promotion of industrialization
Knowledge generation and
capacity building important to
industrialize Africa
Sustain a large and
competitive regional industry
Improvements in institutional quality
key for competitiveness
and economic stability
Reduce the cost of doing business
Capable states, visionary leadership and strong institutions
Government and private sector collaboration
Supportive environment for competitiveness
Leverage and develop a knowledge base and investing in people
Increase global and intra-Africa trade
Special economic zones drive entry into global value chains
Fragile states Gender Agriculture
& Food Security
11

Realizing the Value Chain Potential
The pathway to job creation and industrialization
Morocco’s Auto-Parts Industry
• Two free-trade zones: the Tangier Automotive City and
the Atlantic Free Zone both dedicated to the automotive
industry
• Capacity to produce 490,000 vehicles a year
• Delivery of spare parts to Renault’s global network
• 42% of parts in Morocco-made Renault cars provided by
local suppliers
• 60,000 employees in the auto sector and supports many
more jobs indirectly
• Africa’s most important auto producer after South Africa
Kenya’s Flower Industry
• One of the largest in the world with a 38% market share of cut
flowers exported to the EU, key foreign exchange earner
• About 65% of its exported flowers are sold through Dutch
auctions
• Bulk of cut flower processing done in Kenya
• Industry employs close to 500,000 people
• Smallholder farmers in the flower industry profit more than
those in the tea or coffee sectors
• Heavy investment in greenhouses, machinery, irrigation
systems and cold storage facilities. This vertically-integrated
value chain allows for quick adjustment to market conditions
• Flower associations are important agencies of self-regulation,
introducing international best practices
12

The Next 50 Years
13
Contributing to Agenda 2063 through the implementation of its 10-year strategy and the
creation of Africa50 for the delivery of transformational infrastructure.
AU, NEPAD & UNECA endorsed the creation of Africa50 as the major instrument that will realize
Africa’s Agenda 2063
The role of the AfDB Reducing fragmented and spatial exclusion will help Africa
realize its potential for sustainable and inclusion
growth
Regional integration
Innovation, entrepreneurship, developing human capital are
essential
Generating productive employment for Africa's large and youthful
populations to ensure social and political stability
Should be supported by strong, well-functioning institutions and
an enabling business environment
Strategic policy leadership is crucial A prosperous continent based on inclusive and
environmentally sustainable growth An integrated continent based on political unity and
pan-Africanism A continent characterized by good governance,
democracy, respect of human rights and the rule of law A peaceful and secure continent with strong cultural
identity, values and ethics A strong and influential global partner
Our aspirations
Spearhead Africa’s transformation. A continent that ends the cycle of
violence, chronic poverty, inequality and exclusion.
State building, overcoming fragility, restore connections on cross
border natural resources management and monitoring
Containing conflict and fragility
Africa’s Agenda 2063

Facilitating Structural Transformation & Inclusive Growth
14

A 50-year Journey into Africa’s Development
Strong level of approvals
0
5 000
10 000
15 000 ADB Approvals ADF Approvals
15
2009: a year of exceptional demand for Bank Group resources due to the global financial crisis
50-years of progress at the AfDB with over 4,501 projects approved amounting to USD 118.7 billion
Projects approved for the period 1967–2013
910 Agriculture & rural development
projects
USD 13,001 million
22 Environment projects
USD 365 million
285 Finance projects
USD 13,013 million
1,404 Infrastructure
projects
USD 45,455 million
550 Multisector projects
USD 17,212 million
681 Social projects
USD 10,251 million
148 Industry, mining, and
quarrying projects
USD 4,875 million
498 Other approvals*
USD 14,512 million
USD 4.4 million
3 Urban development
projects
* Includes HIPC Debt Relief, Equity Participation, Guarantee, Loan Reallocations, Post Conflict Country Facility and Special Fund for Water
In USD million

Tackling the Infrastructure Deficit
USD 1.8 billion in transport
USD 3.2 billion approved in infrastructure
in 2013
USD 882 million in energy
USD 462 million in water
USD 54 million in communications
Africa’s rail network density ranges from 30–50 km/million people vs
Europe’s 200–1000 km/million people
Under 20% of African roads are paved
Only 43% of Africans have access to
electricity compared to 82% globally
Only 28% of Sub-Saharan Africans have access
to improved sanitation facilities
More than 50% of Africa’s improved growth performance in recent years due to investments in infrastructure
AfDB is the largest external financier for infrastructure in Africa
AfDB established the Africa50 Fund to deliver infrastructure through a new global partnership
platform
16
Championing projects that tackle Africa’s
infrastructure deficit
Namibia – Walvis Bay Container Terminal Project (USD 338 million approved in 2013)
Gateway to international markets for Botswana, South Africa, Zambia, Zimbabwe and the DRC
Increase capacity from 355,000 TEUs* to 1,005,000 TEUs
More efficient at handling a higher volume of cargo Better regional trade integration Private sector development in Namibia 900 nationals employed
* Twenty-foot equivalent unit

Refurbishment and expansion of an integrated rail system across Kenya and Uganda has reduced transit times
Modernization of railways with train delays falling from 91% in 2004 to 25% in 2012
50 km Nairobi–Thika superhighway, reduces travel time from 2–3 hours to 30–45 minutes
32 km, 4 to 6-lane Dakar Diamniadio Toll Road, which drastically reduced travel time to and from Dakar
Connecting the Continent
17
Senegal
Tunisia Uganda–Kenya
Kenya

Powering a Greener Africa
24 million inhabitants will benefit from reliable electric power at a competitive cost
Increase energy access to 33% Connect 125 locations to electricity including
70 schools, 30 health centers & 1,500 SMEs Reduce CO2 emissions by 5.6 million tons
per year 1,400 km of new transmission lines
Côte d’Ivoire, Liberia, Sierra Leone, Guinea – Electricity Interconnection (USD 198.6 million approved in 2013) Securing power supply for four Mano River Union countries
DRC – Inga Site Development & Electricity Access Support Project (USD 68.8 million approved in 2013) Key support of the AfDB for the development of mega-hydro Inga 3 project
Game-changing project infrastructure Fostering sustainable energy access for millions Foundation of 44,800 MW Grand Inga hydropower
project – half of the continent’s installed capacity Finalize the preparation of the 4,800 MW Inga 3
(phase 1 of the Grand Inga) ADB financed groundbreaking feasibility studies Connect 25,000 households in Kinshasa
Provide 300 MW additional power Increase access to energy in rural Kenya by 10% by 2020 Reduce CO2 emissions by 1.5 million tons per year 428 km of new transmission lines
Kenya – Lake Turkana Wind Power Project (USD 179.5 million approved in 2013) Financing Africa’s largest wind project
378 km of transmission lines distributing power to the 3 countries
1.5 million inhabitants will benefit from reliable electric power at a competitive cost
Burundi, Rwanda, Tanzania – Regional Rusomo Falls Hydro Power Project (USD 99.9 million approved in 2013) Managing joint renewable energy resources to power three countries
18
The Bank Group has invested USD 4.5 billion in the electricity sector
over the past 2 decades
African countries combined generate as much power as
Germany…
Over the past 3 years, the AfDB financed more than 978 MW of new power, of which 324 MW
from renewable resources

Environmental Sustainability for Future Generations
Cannot afford to ‘grow today and clean up tomorrow’
The Congo Basin forests are estimated to contain between 25–30 billion tons of carbon (4 years of current GHG emissions)
Source: AfDB 2010
Africa is a low emitter but will be among the most impacted by the effects of climate change
The cost of climate change is huge… …but Africa has more than half of the world’s clean energy potential
19
Renewable energy is expected to account for 40% of Africa’s total energy production in 20 years (from 17% in 2010)
6
5
4
3
2
1
0
Temperature increase (degrees Celsius) on pre-industrial temperatures
2 2.5 3 3.5 4 4.5 5 5.5 6
US
Eurasia
Africa
EU
China
Japan
India
OHI
Russia
Middle East
Other Asia
Da
mag
es
as a
mu
ltip
l
e of
Af
rica
nd
am
ages
wit
h 2
de
gre
es
incr
eas
es
Small difference
between Africa and other regions
Large difference
between Africa and other regions
Latin
America

Climate-Smart Development
• USD 60 million trust fund unlocking private sector investments in small and medium sized clean energy and energy efficiency projects
• Commitment rate of 78% (USD 43.4 million) and an anchor investor in the “African Renewable Energy Fund”
• Greening Bank projects and programs through co-financing
• USD 200 million of GEF resources approved in addition to USD 1.2 billion of co-financing
• Piloting low emissions and climate resilient development solutions while scaling up renewable energy
• AfDB is an implementing agency of the CIF Trust Funds
• Over half of CIF portfolio approved, with USD 1.1 billion from AfDB and USD 500 million from CIF
By the end of the century, temperatures will rise by 3.6°C in the Sahara and an average of 3.2°C in the coolest part (East Africa) – 1.5x greater than the global mean increase
In both West and East Africa, the chances of extremely wet seasons will increase to over 20%, due to greater atmospheric water vapor
USD 128.5 million approved across 6 projects in the area of green growth and Climate Investment Funds
REDD: Reducing Emissions from Deforestation and forest Degradation
Burkina Faso – Gazetted Forests Participatory Management
Project for REDD+
DRC – Integrated REDD+ project in the Mbuji-Mayi/Kananga and
Kisangani Basins
Ghana – Engaging Local Communities in
REDD+/Enhancement of Carbon Stocks
Scaling-up blended finance for climate solutions
20

An Integrated Safeguards System
Cornerstone of the Bank’s strategy to promote growth that is socially inclusive
and environmentally sustainable
Safeguards as a tool for identifying risks, reducing development costs, and
improving project sustainability
Encourages greater transparency and accountability through project-level grievance and redress mechanisms
21
Structure of the Integrated Safeguards System
(OS)
OS 1
OS 2
OS 3
OS 4
OS 5
Environmentaland Social Assessment
Involuntary Resettlement: Land Acquisition, Population Displacement and Compensation
Biodiversity and Ecosystem Services
Pollution Prevention and Control, Greenhouse Gases, Hazardous Materials and Resource Efficiency
Labour Conditions, Health and Safety
Integrated safeguards policy statement
Operational safeguards (OS)
Environmental and Social Assessment Procedures
revised
Integrated Environmental and Social Impact
Assessment guidance notes revised
Declaration of commitment to environmental and social sustainability
and reducing risk of noncompliances
Short and focused policy statements that follow Bank commitments and establish
operational parameters
Procedural and process guidance (documentation, analysis, review and reporting)
at each stage of project cycle
Detailed (methodological, sectoral and thematic) guidance on integrated environmental and social
impact assessment

Sustainable Land Management and Agriculture
Africa’s rate of deforestation is twice the world rate, losing 4 million hectares of forest annually
Africa imports USD 30 billion in foodstuff annually while
chronic hunger persists
Nearly 70% of Africa’s labor force works on family farms
Deforestation and poor agricultural practices account
for 65% of Africa’s carbon emissions
Environmental degradation is both a cause and a result of poverty
Transforming African agriculture
USD 822.1 million approved for agriculture and food security in 2013 Rehabilitation of infrastructure
for crop, fisheries and livestock production
Construction of access and feeder roads
Biodiversity conservation Strengthening climate resilience
Sustainable forest management and conservation
Nigeria – Agricultural Transformation Agenda Support Program (USD 153.6 million approved in 2013)
Increase the income of 45,430 farmers and rural entrepreneurs Create 120,000 jobs Additional 20 million metric tonnes domestic food supply each
year
Maintaining global ecological balance
Mano River Forest Ecosystems Conservation Program (USD 17.8 million approved in 2013)
Sustainable management of the Upper Guinea forest ecosystems
Carbon sequestration and climate change mitigation Improved livelihoods of local communities and gender
mainstreaming Nearly 2 million ha of transboundary forest sites targeted
in 4 beneficiary countries (Côte d'Ivoire, Guinea, Liberia and Sierra Leone)
Water catchments, habitat for wildlife, and improved amenities provided
AfDB Group rural livelihoods programs are demonstrating the potential of agriculture to create jobs and increase food security
22
Most of agriculture portfolio devoted to rural infrastructure, including irrigation, water storage, energy connections and feeder roads

Water Security Vital for Sustainable Development
AfDB Group has a USD 3.3 billion active portfolio of 72 operations in 35 countries
Per capita water storage capacity is less than 200 m3
Cultivated land under irrigation is about 6%
Utilized hydropower potential is less than 10%
Africa is 50 years away from achieving universal access
to modern sanitation services
Population with improved sanitation facilities is about 40%
Rural Water Supply and Sanitation Initiative
African Water Facility Multi-Donor Water
Partnership Program
AfDB’s flagship water initiative
Since 2003, USD 1.9 billion invested across 32 countries
Leveraged over USD 5.1 billion from other donors
80 million people with access to water supply
55 million people with access to improved sanitation
Catalytic instrument focused on leveraging investments to help achieve the objectives of the Africa Water Vision 2025
Since 2006, 90 projects approved, for USD 150 million
164,000 people (provided access to water supply; 437,000) gained access to sanitation; and 2,040,650 people to water for multiple uses
Core facility for developing the Bank’s and continent’s capacity in Integrated Water Resources Management as well as in promoting learning and innovation across a range of water sector issues
In 2013, MDWPP supported the support the Bank’s regional integration agenda on transboundary water resources and drought control in the Sahel
Africa has 22% of the world’s land, 14% of its population, but only 9% of its renewable water resources
23
USD 552.9 million approved in 2013 for water supply and sanitation in urban and rural areas
Scaling up access to safe water and sanitation
Promoting innovative technologies
Water-related knowledge management activities and investment channeled through the Three Water Initiatives

Private Sector, a Development Catalyst
The private sector generates 70% of Africa’s output, 70% of its investment, and 90% of its employment
AfDB Private Sector Development Strategy 2013–2017
• Only 22% of African companies hold a loan or a line of credit, vs Asia (31%), America (47%) and Europe (48%)
• Poor infrastructure adds 30–40% to the costs of goods traded among African countries and cuts business productivity by as much as 30%
• Further goals include supporting fragile states, emphasis on gender, as well as on agriculture and rural development
i. Improve Africa’s investment and business climate by helping strengthen the legal and regulatory environment
ii. Expansion of business access to social and economic infrastructure
iii. Promotion of enterprise development through improved access to finance, skills enhancement and value addition
Working with governments to simplify bureaucratic processes in establishing new businesses and obtaining licenses and other approvals
24
Growing footprint in private sector financing
In USD million
Mobilizing private investment in infrastructure development through public–private partnerships
0
500
1 000
1 500
2 000
2 500
2000 2001 2002 2003 2004 2005 2006 2007 2008 2009 2010 2011 2012 2013
Over USD 1.06 billion government revenue generated
Over 480 thousand jobs created
Over 4.5 million people benefitting from investee projects and microfinance
Performance Scorecard – Private Sector Development (2011–2013)

Private Sector, a Catalyst for Inclusive Growth
USD 1.6 billion approved to finance 37 new private sector operations in 2013
25
A four-year, USD 125-million funding program to support micro, small and medium enterprises
USD 3.98-million technical assistance package by the Fund for African Private Sector Assistance for building capacities in 25 participating financial institutions, improve their operational efficiencies (credit assessment risk management)
Provide standardized lines of credit, mostly in local currency, and technical assistance to targeted financial institutions, predominantly in low-income countries
Longer-term resources to thousands of SMEs particularly those employing women and youth, thus contributing to job creation, poverty reduction and inclusive growth on the continent
Africa SME Program
Small and micro businesses important for promoting inclusive growth
Microfinance is combined with training an mentoring to enable micro businesses to use the funds to best effect
Trade Finance Lines of Credit
Soft Commodity Finance Facilities
Risk Participation Agreements (Guarantee)
Trade Finance Program and Business Plan seeks to reduce the trade finance gap in Africa by providing guarantees and liquidity support for on lending to SMEs with 7 operations approved for a
total value of USD 590 million in 2013
Ecobank Transnational (USD 100mn)
Shelter Afrique Habitat & Housing (USD 20mn)
UT Bank, Ghana (USD 20.6mn)
Finance
Mauritius Commercial Bank (USD 150mn)
Lake Turkana Wind Power, Kenya (USD 152mn)
African Renewable Energy Fund (USD 25mn)
CIPREL Power expansion plant (USD 69mn)
Energy
Maamba Power plant, Zambia (USD 150mn)
Indorama Fertilizer Plant, Nigeria (USD 100.9mn)
Olam Group Africa Program (USD 82.9mn)
Agriculture
Skills training program in Morocco
Reform of medical insurance coverage in Morocco
Other

Capable, Accountable and Responsible Governments a Precondition to Achieve Inclusive Growth
USD 722 million approved for 54 projects and programs in
2013 in support of good governance across 30 countries
USD 301 million to improve governance in
Nigeria’s transport
sector
USD 16.9 million to modernize revenue
administration in the
DRC and strengthen
statistical capabilities
A public international organization created and hosted by the AfDB
Assistance primarily initiated by governments ALSF has 56 members, including 50 states and
six international organizations Overall portfolio: 35 diverse projects, targeting
23 countries Work of the ALSF was acknowledged by
leaders at the G8 meeting Negotiation of complex commercial
transactions Capacity building Commercial creditor litigation
African Legal Support Facility
Balancing the playing field for Africa
26
AfDB Group areas of intervention Rapid social, economic and environmental change placing African societies under considerable strain and can be an impediment to development
AfDB improving governance on infrastructure, natural resources and social sectors
Macroeconomic policies, efficient revenue mobilization, sound public financial management,
economic governance, governance of natural resources

95 000 people benefitting from vocational training with a strong focus on women and vulnerable groups
Around 2.8 million people benefitting from better access to education
Skills Crucial for Job Creation USD 524 million approved for social sector and human
development operations
RWANDA – Skills, Employability and Entrepreneurship Project (USD 37.5 million)
Focus on skills and employability as well as on entrepreneurship development
Reforms to address critical skills gaps Increased private sector participation in education reform Incentives for the acquisition of skills on demand Mechanisms to monitor the relevance of training for the labour market Create an environment that supports entrepreneurship
27
Performance Scorecard – Skills & Technology (2011–2013)
AfDB promoting a New Education Model for Africa, which will be ICT based and linked to the needs of the labor market. This will equip the youth with skills in science, technology and critical thinking, so that they can be agents of change in their societies
Africa’s 200 million youth are making the transition from education to the labor market in high numbers: 122 million will enter the market within the next 10 years

Transforming Africa through Gender Equality
Created an innovative referral and counter-referral system through which the country could begin paying more attention to Gender Based Violence (GBV)
US Treasury award for the Multisector Gender Support Project in Côte d’Ivoire (USD 31 million approved in 2013)
Gender Strategy 2014–2018 Mainstreaming Gender in operations
• Women’s legal status and property rights
• Women’s economic empowerment
• Knowledge management and capacity building for gender equality
• Leadership and Commitment
• Capacity and Finances
• Operational Procedures
• Institutional Authority
• Accountability
28
Helped the lives of victims of GBV through a USD 31 million grant
3,500 women benefitted directly thousands more indirectly

Building Resilience
29
First phase of the broader Drought Resilience and Sustainable Livelihoods Program covering Djibouti, Eritrea, Ethiopia, Kenya, Somalia, South Sudan, Sudan and Uganda
Developing regional systems to deal with the impact of deteriorating environmental conditions
Improvements in managing natural resources, enhancing livestock market infrastructure and animal health systems, bettering livelihoods for agro-pastoralists, and boosting management of trans-boundary natural resources
AfDB promoting regional cooperation on drivers of fragility and building resilience at the national level
Recurrent drought has led to conflict over diminishing water resources and pasturage
Report of the High Level Panel on Fragile States
Promote youth employment
Support private investment
Support women’s empowerment
Contribute to the provision of security and justice services
Build capacity to address fragility in water resources and extractive industries
Enable swift & flexible response to countries emerging from conflict
Build partnerships with other institutions on issues of conflict
Opportunities for building peace and resilience
Fragility holds back development prospects of entire regions
Countries in transition present some of the most intractable problems in development
USD 2.5 billion ADB support provided since 2008

Growing Franchise Value
30
Expanding the scope of the Bank’s intervention
Innovative solutions crowding-in transformative infrastructure projects
New avenues for financing and partnerships

0
2 500
5 000
7 500
10 000
Amount subscribed Internally generated resources Total
Marking 40 Years of the Fund
Two African countries joined as donors in 2013
Angola Libya
Reaffirmed commitment to Africa’s transformation
ADF resources multiplied 10x between 1976–1996
Tripling of resources between 1999–2013
31
Cumulative resources of the ADF around USD 50 billion
Over the past 40 years, an amount of USD 49 billion directed to Africa’s
poorest countries
Internally generated resources boosted significantly since ADF-10
Strong support for Africa’s
transformation agenda
Total Resources level over USD 7 billion*,
a significant achievement in light of tough fiscal situation
faced by donors
In line with the Bank’s Ten-Year Strategy and operational priorities
of the Fund
Successful 13th Replenishment of ADF
* Excluding the technical gap
In USD million
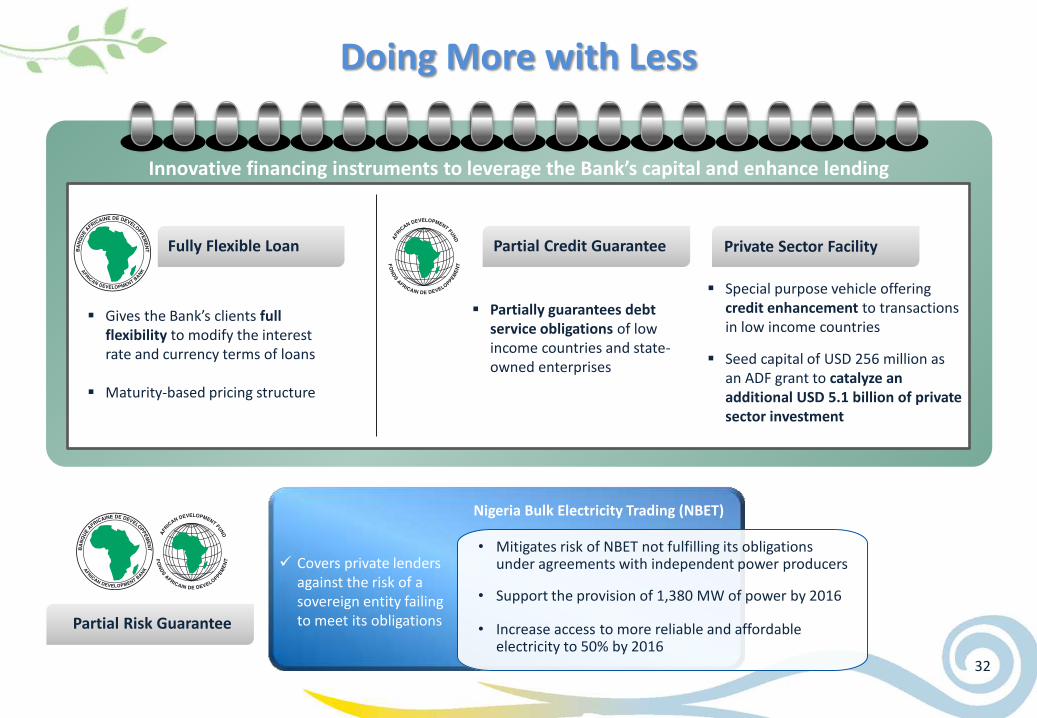
Doing More with Less
32
Innovative financing instruments to leverage the Bank’s capital and enhance lending
Gives the Bank’s clients full flexibility to modify the interest rate and currency terms of loans
Maturity-based pricing structure
Partially guarantees debt service obligations of low income countries and state-owned enterprises
Special purpose vehicle offering credit enhancement to transactions in low income countries
Seed capital of USD 256 million as an ADF grant to catalyze an additional USD 5.1 billion of private sector investment
Partial Credit Guarantee Private Sector Facility Fully Flexible Loan
Partial Risk Guarantee
Nigeria Bulk Electricity Trading (NBET)
• Mitigates risk of NBET not fulfilling its obligations under agreements with independent power producers
• Support the provision of 1,380 MW of power by 2016
• Increase access to more reliable and affordable electricity to 50% by 2016
Covers private lenders against the risk of a sovereign entity failing to meet its obligations

Propelling the Continent Forward
Lack of well prepared projects
Lack of public resources
Lack of early risk takers
Lack of “smart capital”
Lack of transaction advisors
A comprehensive set of solutions to
address Africa’s infrastructure deficit
Mobilizing private financing, bringing projects to bankability, accelerating the development of transformative infrastructure projects
Project development business line: To allow successful raising of long-term capital, reduce risk of delays, and ensure operational, financial and economical sustainability of investments
33
Africa Transport
ICT
Energy
Water
Project finance business line: To channel long-term funding in an efficient and timely manner
Aims to cut the period between project conception and financial close from 7 to 3 years
Target equity investment of USD 10 billion will leverage USD 100 billion worth of resources
Development-oriented and commercially operated entity
AfDB to invest up to USD 500 million
Medium-term target equity of USD 3 billion, to grow over time to USD 10 billion

Closer, on the Ground
Decentralization with delegations and safeguards
34
= Field office
= Regional Resource Center
Tunisia (TRA)
Egypt
Uganda
Malawi
Ghana
South Africa
Madagascar
Gabon
Mali
Nigeria
Tanzania
Zambia
Algeria
Ethiopia
Sudan
Kenya
Chad
Angola
Zimbabwe
Burundi
Togo CAR
Ivory Coast (HQ)
South Sudan
Mauritius Mozambique
Liberia Cameroon
Burkina Faso Senegal
Sierra Leone
Rwanda DRC
Morocco
Increased field presence from 4 in 2002 to 37 countries in 2013
About 50% of projects managed from the field
About 40% of operations staff work from the field
Reinforced presence in Benin, Guinea (Conakry), Guinea Bissau, Mauritania, Mauritius and São Tomé and Príncipe
42% of projects supervision led by field offices
v
• Enhanced partnership with clients
• Better integration and oversight
• Proactivity and increased responsiveness
• Reduced procurement turn-around time
• Better use of resources
• Opportunity to reduce delays in loan disbursements
São Tomé and
Príncipe

Financial Profile
35

An Extremely Strong Financial Profile with Shareholders’ Support
36
AAA/Stable "The (Bank’s AAA) ratings mainly reflect the strong support the Bank enjoys from African and non-African member countries; its solid financial base; its prudent financial and risk management policies; and its status as a “preferred creditor."
10 July 2013
AAA/Stable/A-1+ "The Bank benefits from a solid liquidity and capital position, along with wide support from its member countries, including “AAA” sovereigns."
19 December 2013
Aaa/Stable/P-1 "Because of the high risk environment under which it operates, the AfDB, perhaps more than any other MDB, constantly tries to improve its risk management as well as operational efficiency."
30 September 2013
Solid liquidity Extremely strong capitalization Very strong support from shareholders Preferred creditor status
Strict internal prudential framework on capitalization, borrowing and liquidity
Intrinsic financial strength Franchise value
"Capitalization is extremely strong, and is one of the key factors supporting its (AAA) ratings. The ratio of usable capital to required capital ratio, at 16.2x at end-2012, is also higher than for most of its peers."
16 August 2013
AAA/Stable/F1+

Strengthening the Foundations of the Bank
4 002 4 046 3 894
4 100 4 400
3 431 3 377 3 601
4 108
4 581
-
2 000
4 000
6 000
8 000
10 000
2009 2010 2011 2012 2013
Reserves Paid-in capital
GCI-VI payments and transfers to reserves provide capital boost
In USD million
7,433 7,424 7,494 8,208
8,980
Risk-Bearing Capacity increased by more than 20% since 2009
Additional Paid-in capital
of USD 2.85 billion
expected from 2014 to 2023
37

Risk-Bearing Capacity
Risk capital consumption
In USD million Sovereign 36%
Non-Sovereign 11%
Equity 9%
Treasury 5%
Operational 1%
Benefits Plan 3%
Diversification -3%
Total Risk Capital Consumption 62%
38% of risk capital available to support business growth
38
5 433
8 980
3 159
949
788 420 80
276 239
Available risk capital

Risk Class AfDB
Rating International
Rating Assessment
Very Low Risk
1+ A+ and above Excellent 1 A
1- A- 2+ BBB+
Strong 2 BBB 2- BBB-
Low Risk 3+ BB+
Good 3 BB 3- BB-
Moderate Risk
4+ B+ Satisfactory 4
B 4- 5+
B- Acceptable 5
High Risk
5- CCC+ Marginal
6+ 6 CCC
Special
Attention 6-
Very high Risk
7 CCC- Substandard
8 9 CC Doubtful
10 C Loss
Systematic Credit Risk Assessment Sovereign credit ratings are derived from a risk assessment that includes macroeconomic performance, debt sustainability, socio-political factors, business environment and the Bank’s portfolio performance
Non-sovereign credit ratings derived on the basis of several pre-determined critical factors including overall financial strength, industry outlook, competitive position, management strength and host country risk rating
Portfolio risk profile measured by the Weighted Average Risk Rating (WARR) under the Bank’s 22-grade master rating scale
0%
20%
40%
60%
80%
100%
2009 2010 2011 2012 2013
very low risk low risk moderate risk high risk very high risk
Non-Sovereign Portfolio risk profile
Sovereign Portfolio risk profile
0%
20%
40%
60%
80%
100%
2009 2010 2011 2012 2013
very low risk low risk moderate risk high risk very high risk
39

Growing Development-Related Exposure
Portfolio credit quality remains strong, and at the lower range of our defined risk appetite of "good" to "satisfactory" risk
More than 50% increase in the business portfolio since 2009
9 666 10 309 11 605 13 243
13 917 2 470 2 829 3 203
4 279 4 638
2,60 2,30 2,73 2,74 3,00
2009 2010 2011 2012 2013
Sovereign Portfolio Non-Sovereign Portfolio Weighted Average Risk Rating (WARR) *
12,136 13,138
14,808 17,522
18,555 In USD million
A broad suite of products supporting the clients financial needs
Equity and quasi- equity investments
Foreign and local currency loans
Partial Risk Guarantees
Partial credit Guarantees
Syndicated Loans
Trade Finance Risk management
products
Agency lines to fund SMEs via financial
intermediaries
* Portfolio risk profile measured by the Weighted Average Risk Rating (WARR) under the Bank’s 22-grade master rating scale
40

Capital preservation, liquidity and reasonable returns drive our investment strategy
14% 3% 5%
45%
3% 14% 16%
Strong liquidity risk management framework
Investment strategy regularly adapted to rapidly changing global financial markets, aims to strengthen credit quality and the liquidity profile of the portfolios while limiting the volatility of their returns
Controlled Market Risks
Targeting top quality investments
51% 44%
5%
AAA AA+ to AA- A and below
as of 31 December 2013
4 000
6 000
8 000
10 000
12 000
1Q10 3Q10 1Q11 3Q11 1Q12 3Q12 1Q13 3Q13 1Q14
Prudential Minimum Level of Liquidity Liquidity Level
Liquidity policy ensures that the Bank can, at all times, meet its loan disbursements, operational cash flow requirements, service debt and honor its guarantees for at least 1 year without resorting to additional funding from the capital markets
USD 10.84 billion of liquid assets 41
In USD million

Currency and Counterparty Credit Risk Management
451
1 679 1 830
1 609
838
132 148 224 168 206
-
400
800
1 200
1 600
2 000
2009 2010 2011 2012 2013
Fair Value Net Exposure AA+ to AA- A+ and Lower
Counterparty Risk Currency Exchange Risk
In USD million
as of 31 December 2013
Derivatives Portfolio Credit Risk Profile of Net Exposure
Prohibited from taking direct currency risk, matches liabilities in any one currency with assets in the same currency
Potential fluctuation of the value of the Bank’s net worth minimized by matching the currency composition of net assets with the UA
Administrative expenses hedged to protect the Bank from adverse exchange rate movements
Mitigates counterparty credit risk through minimum credit ratings, exposure limits and collateral exchange
agreements for derivatives
Strict minimum short-term credit rating for trading counterparties
Minimum rating of A-/A3 for derivatives counterparties, requiring one-way collateral
agreements. Daily collateral exchanges to maintain net exposures at acceptable levels
42

60% 58% 60% 58% 62%
2009 2010 2011 2012 2013
Insulating Stakeholders
Capital utilization Conservative leverage
Limit (100%) Limit (100%)
Robust level of capitalization and low leverage ratio allow for the smooth implementation of the Bank’s business plan
Risk Capital Utilization Rate = Σ ((Exposure) x (Risk capital allocation)) / Total risk capital
Usable Capital = Σ (Paid-in capital, Reserves, Callable capital of non-borrowing countries rated A- and above)
Debt to Usable Capital Risk Capital Utilization Rate
86% 84%
55% 50% 48%
2009 2010 2011 2012 2013
43

Income before distributions
Solid Internal Capital Generation
167
362
329
253
301 278
2004 2009 2010 2011 2012 2013. . .
Strong financial performance, despite the prevailing low interest rate environment of recent years
44
In USD million

Financial Capacity to Support Development Initiatives
Commitments under the Special Relief Fund to respond to emergency relief requests
Assistance to drought affected populations
Somalia
Relief to victims of locust invasion
Madagascar
Support to victims of terrorism
Kenya
Aid to 2013 food disaster
Mozambique
Fight against cholera epidemic
Guinea-Bissau
45
* Allocable income: income adjusted for unrealized gains (losses) on derivatives and borrowings, translation and fair valuation of macro hedge swaps
Increasing risk bearing capacity: USD 88 million transfer to reserves
Supporting more development activities in economically challenged countries: USD 65 million transfer to ADF
Participating in multilateral and bilateral reconstruction efforts: USD 82 million allocated to DRC mechanism
Extending humanitarian relief: USD 7.75 million allocation to the Special Relief Fund
Delivering transformational projects in Africa: USD 31 million to the Africa50 Fund
From the Bank’s allocable Income* From the Bank’s surplus account
Note: Allocation of income subject to approval by the Board of Governors Exchange rate as at 30 April 2014

Solid Showing in Capital Markets
46

47
USD 100 million 10.50% due October 1995
Kidder Peabody October 1985
USD 500 million 3.25% due July 2005
BNP Paribas, Daiwa SMBC July 2002
AUD 450 million 4.40% due February 2008
Daiwa January 2003
USD 1 billion 3.25% due August 2008 Goldman Sachs, HSBC,
Lehman Brothers August 2003
AUD 300 million 5.50% due February 2011
TD Securities February 2006
JPY 15 billion 7.40% due April 1997 Nomura, Bank of Tokyo
April 1985
JPY 30 billion 5.125% due May 2000
Yamaichi Securities April 1988
Long-term loans from non-regional governments
Commercial Banking Market
Syndicated Loans
USD 300 million 7.875% due April 2002 Swiss Bank Corporation
April 1992
USD 500 million 7.375% due April 2023 Goldman Sachs, Lehman
Brothers, SBC March 1993
ZAR 100 million 15% due March 1999
Hambros Bank March 1997
JPY 10 billion 3.19% in USD due July 2007
Yamaichi Securities July 1997
First Global Benchmark First Uridashi First Billion Global First Kangaroo
First Yankee Bond First Samurai First Daimyo The Early years
First Eurodollar First 30 Year Eurodollar First EuroRand First Private Placement
A Trip Down Memory Lane
47

649
2 770 3 772 3 844
5 578 4 739
2004 2010 2011 2012 2013 2014
Cost-Effective Resources Spurring Development
. . .
Borrowing program size in line with lending activities
48
Use of derivative instruments for asset and
liability management purposes
Meet lending and liquidity requirements
Develop access to markets across the world
In USD million

Raising Funds Around the World
49
A Global Issuer
Outstanding borrowings before swap As of 30 April 2014
USD 13mn
USD 1,566mn
USD 208mn
USD 315mn
USD 694mn
USD 12,543mn
USD 426mn
USD 196mn
USD 99mn
USD 132mn
USD 3,255mn
USD 31mn
USD 395mn
USD 349mn
USD 20mn
USD 24mn
USD 585mn
USD 1,131mn

Billion Dollar Benchmark Transactions Spark Interest
Distribution by investor type
Asset Managers
7%
Banks 23%
Central Bank / OIs* 67%
Corporates 3%
Africa Americas Asia Europe MiddleEast
11%
29%
41%
14% 5%
*Official Institutions
Distribution by region
Distribution by investor type
Asset Managers
19%
Banks 14%
Central Bank / OIs* 67%
Africa Americas Asia Europe MiddleEast
4%
32% 23%
37%
4%
Distribution by region
USD 2.175 billion 0.875% due March 2018 USD 1 billion 0.875% due May 2017
Highly oversubscribed (USD 2 billion of orders) and priced at mid-swaps plus 1bp (US Treasuries + 22.85 bps)
Over 50 investors, highlighting strong penetration across different geographical regions
First time participation of two African Central Banks, and repeated support from another two
Largest AfDB bond outstanding Increased four times from the initial USD 1 Billion, each time at a
tighter spread to US Treasuries Latest reopening at UST + 12.1 bps
50

Green Unleashed, Debut Green Bond Opens Doors
51
Going Green Worldwide
USD 500 million 0.75% due October
2016 JP Morgan, Morgan
Stanley, SEB October 2013
Support AfDB’s strategic objective of supporting Africa’s gradual transition to green growth
… and in Sweden
SEK 1 billion 1.75% due March
2019 Nordea
March 2014
SEK 1 billion Floating Rate Note due February 2019
Nordea February 2014

What Can Be Financed with AfDB Green Bonds
Greenfield Renewable Energy Generation (e.g. solar, wind, geothermal, and ocean power)
Biosphere conservation projects (reduce emissions from deforestation and degradation of ecosystems)
Solid Waste Management (e.g. incineration of waste, landfill gas capture and landfill gas combustion)
Demand-side Brownfield and Greenfield Energy Efficiency (e.g. energy efficiency improvements in lighting and equipment; retrofit of transmission lines, substations or distribution systems to reduce technical losses)
Vehicle energy efficiency fleet retrofit or urban transport modal change
Water Supply and Access (e.g. water-saving measures such as introduction of less water intensive crops or preservation of soil moisture and fertility)
Urban Development (e.g. rehabilitation and upgrade of urban water drainage systems in areas vulnerable to frequency and/or severity of flash floods and storm surges brought by climate change)
Industrial Processes (reduce GHG emissions from industrial processes improvements and cleaner production)
Fugitive emissions and carbon capture (e.g. carbon capture and storage, reduction of gas flaring or methane fugitive emissions in the oil and gas industry, coal mine methane capture)
52

Going Strong in Australia
Distribution by region
Distribution by investor type
AUD 1 billion 5.25% due March 2022
Delivering stable secondary market performance
(ASW mid levels)
Australian dollar, the second currency of funding of the Bank in 2012 and 2013
0,00
0,50
1,00
1,50
2011 2012 2013 2014*
Kangaroo Issuance Volume In AUD billion
* Year to date Fund Manager
60% Bank 22%
Insurance 15%
Central Bank 1%
Commercial Bank 2%
0%
20%
40%
60%
80%
Asia Australia Europe NorthAmerica
70%
24%
2% 5%
-
10,0
20,0
30,0
40,0
50,0
60,0
Aug-13 Sep-13 Oct-13 Nov-13 Dec-13 Jan-14 Feb-14 Mar-14
AfDB Jan-16 AfDB Jan-18 AfDB Feb-19
AfDB March-22 AfDB March-24
53

First Sterling Bond in Over 20 Years
54
Central Bank / OIs*
30%
Asset Managers
9% Banks 56%
Institutions/Private
Fund 4%
Corporate 1%
Distribution by investor type
Africa Americas Asia Europe UK/Ireland
4%
12%
27%
5%
52%
Distribution by region
December 2016 GBP 350 million 1.125% launched in 2014
GBP 250 million 3-year benchmark launched in January 2014
Priced at UK Treasury 4% Sep 2016 + 35 basis points
*Official Institutions
GBP 100 million increase executed in April 2014
Priced at UK Treasury 4% Sep 2016 + 34 basis points

Championing African Capital Markets
55
Strategy in support of Regional Financial Integration
Harmonization of financial governance and standards
Regional payment systems
AFMI website provides accurate data on African debt markets since May 2013
AFMI is also developing an African Bond Index
Knowledge management The African Financial Market Initiative (AFMI)
Advisory
ZAR, ZMK
ZAR
NGN, UGX, ZAR
GHS, UGX
NGN
2011
2012
2013
2014
2010
hjjjj
GHC, KES, NGN, TZS, ZAR
GHC, ZAR
UGX, ZAR
GHS, ZAR, ZMK
2006
2007
2008
2009
2005 BWP, ZAR
AfDB AAA issuer in the Ugandan Shilling market with UGX 12.5 Billion Floating Rate Notes under established UGX 125 Billion MTN program
Approval to issue ZMW bonds in Zambia
Established a Medium Term Note (MTN) program
in Zambia, for ZMW 160,000,000 Working with government authorities and
regulators to secure approvals to issue in their local currencies designated as lending currencies
Issued USD 4 billion worth of bonds in both off-shore (currency-linked) and domestic markets since 2005
Market intervention

387 620 1240 3,696
25,105 33,892
104,894
1964 1974 1976 1981 1987 1998 2010
Evolution of the capital of the Bank In USD million
Luxembourg
Adhesion signed in May 2014
Turkey became the 78th member of the Bank in October 2013
50 Years of Partnership for the Development of Africa
606 1 307 6 634
12 673 18 598
33 217
49 588
1976 1982 1988 1996 2002 2008 2013
ADF Cumulative resources In USD million
56 (exchange rate as at 30 April 2014)

A 50-year Journey
Creation of AfDB 10 staff, 33 member countries, USD 387 million initial capital
Landmark 200% capital increase, bringing capital to nearly USD 100 billion
Temporary relocation to Tunis
1964
2014 2010 2003
Propelling forward Africa’s recent development agenda
Firmly focused on achieving mandate and supporting Africa’s transformation
Ambitious goals underpinned by robust portfolio management ensuring better results and value for money
57
Creation of ADF
1972
Creation of NTF
1976
AfDB rated AAA
1984
AfDB responds to the economic and financial crisis
2009
Capital of AfDB opened to non-Africans
1982
2,000 staff and USD 33 billion in active operations. 78 member countries
2013
Return of the Bank to Abidjan

For More Information
www.afdb.org
[email protected] Investor Contact: [email protected]
(216) 71 10 39 00 (216) 71 35 19 33
Financial and Operational Analysis
Documentation for Debt Programs
Rating Agency Reports
Financial Products for Borrowers
Annual Report
afdb_acc AfDB_Group African
Development Bank Group
58

AfDB Income Statement (UA millions)
59 1 UA = 1 SDR = 1.56769 USD (2009) = 1.54003 USD (2010) = 1.53527 USD (2011) = 1.53692 USD (2012) = 1.54000(2013)
Year Ended 31 December 2013 2012 2011 2010 2009
Operational Income and Expenses
Income from Loans 335.01 351.16 314.92 293.36 288.24
Income from Investments and related derivatives 131.24 199.35 168.85 219.22 222.96
Income from Other Securities 3.95 4.83 5.41 6.74 7.68
Total income from Loans and Investments 470.20 555.34 489.18 519.32 518.88
Interest and amortized issuance costs (302.99) (356.41) (316.82) (303.04) (306.32)
Net interest on borrowing-related derivatives 111.85 139.16 112.16 126.27 73.28
Unrealized losses on borrowings, related derivatives and others
34.11 (10.17) (3.04) (40.94) (2.92)
Provision for Impairment on Loan Principal and Charges Receivable
(41.14) (29.69) (17.68) (26.76) (11.29)
Provision for Impairment on Equity Investments 0.76 (0.05) (0.15) (0.90) (2.32)
Provision for Impairment on Investments 9.19 0.29 6.39 18.58 3.39
Translation Gains/(Losses) 13.33 (2.27) (27.95) 4.87 19.63
Other Income 12.46 15.29 4.46 (1.72) 7.34
Net Operational Income 302.98 309.79 246.55 295.66 299.67
Administrative Expenses (110.97) (107.55) (79.50) (75.00) (63.06)
Depreciation – Property, Equipment and Intangible Assets (6.70) (4.59) (4.47) (4.59) (4.68)
Sundry (Expenses)/Income (4.98) (1.94) 1.93 (2.41) (0.77)
Total Other Expenses (122.65) (114.07) (82.04) (82.00) (68.51)
Income before Distributions Approved by the Board of Governors 180.33 195.71 164.51 213.66 231.16
Distributions of Income Approved by the Board of Governors (107.50) (110.00) (113.00) (146.37) (162.68)
Net Income for the Year 72.83 85.71 51.51 67.29 68.48

As at 31 December 2013 2012 2011 2010 2009
Assets
Due from Banks 954.13 881.45 344.16 395.72 318.83
Demand Obligations 3.80 3.80 3.80 3.80 3.80
Treasury Investments 6,058.45 6,487.51 7,590.47 7,433.53 7,412.25
Derivative Assets 985.96 1,558.33 1,696.68 1,421.48 764.00
Non-Negotiable Instruments on Account of Capital 1.20 1.97 3.04 4.62 8.19
Accounts Recievable 843.86 762.67 914.85 1,341.66 924.16
Outstanding Loans 11,440.70 10,885.80 9,373.52 8,293.01 7,538.00
Hedged Loans – Fair Value Adjustment 32.49 86.85 49.87 – –
Equity Participations 525.01 438.56 309.76 272.24 234.48
Other Securities 82.90 76.54 79.99 79.75 70.81
Other Assets 41.22 31.06 13.34 12.69 11.89
Total Assets 20,996.72 21,214.55 20,261.45 19,144.29 17,184.69
Liabilities, Capital and Reserves
Accounts Payable 1,246.11 2,083.07 1,974.68 2,015.04 1,385.68
Derivative Liabilities 971.85 512.60 502.29 328.30 477.12
Borrowings 12,947.44 13,278.80 12,902.96 11,980.56 10,580.64
Capital Subscriptions Paid 3,147.08 2,839.48 2,505.97 2,355.68 2,350.26
Reserves 2,856.88 2,667.44 2,536.18 2,627.28 2,552.96
Total Liabilities, Capital and Reserves 20,996.72 21,214.55 20,261.45 19,144.29 17,184.69
AfDB Balance Sheet Highlights (UA millions)
60
1 UA = 1 SDR = 1.56769 USD (2009) = 1.54003 USD (2010) = 1.53527 USD (2011) = 1.53692 USD (2012) = 1.54000(2013)