socio-economic status and the atar
TRANSCRIPT

SOCIO-ECONOMIC STATUS AND THE ATAR
FEBRUARY 2020
Anthony Manny General Manager – Business Analytics

Socio-Economic Status and the ATAR Page 1
1 INTRODUCTION Previous research by UAC1 and others2 has established that the Australian Tertiary Admissions Rank (ATAR) is a very good indicator of first year university success, both in terms of Grade Point Average (GPA) and completion rates. The correlation between a student’s ATAR and their first year GPA was found to be significantly stronger than the correlation with individual Year 12 subjects studied across all fields of study.
Given that UAC works with universities to provide equity programs to widen participation in higher education to applicants with an educational and financial disadvantage,3 we have now also investigated the relationship between the ATAR and first year success at university with respect to socio-economic status (SES).
Students completing the Higher School Certificate (HSC) in 2017 were categorised into quartiles based on the 2016 Census SA1 Index of Education and Occupation (IEO) ranking within Australia, compiled by the Australian Bureau of Statistics, and their subsequent application, enrolment and first year results for courses offered via UAC in 2018 were analysed, as the most recent complete data available.
All data quoted is UAC data unless otherwise indicated.
2 ANALYSIS
2.1 Some points about the ATAR It is worth noting a few points about the ATAR. In New South Wales, UAC calculates the ATAR on behalf of its member universities using HSC results for all eligible HSC students (more detail on the ATAR calculation can be found on the UAC website4).
The ATAR is a RANK. The ATAR was designed to be used for university admissions ONLY. Generally, it is very good at predicting how prepared a student is at the end of year 12 for university study5, however, it is not the only preparation pathway to university. While everyone should be given equal opportunity to access, it is not equally suitable for everyone. A Year 12 student who has no desire to proceed to university should not be concerned with their ATAR, and neither should society.
UACs advice on HSC subject choice is clear6 – choose what you like and are good at, at the highest level you can comfortably do, and which will set you up for your future studies. You cannot game the ATAR or make a 70 ATAR student into a 90 ATAR student simply by changing the HSC subjects that they study. The ATAR calculation is designed to be as fair as possible and only uses HSC subject marks. Other factors like the student’s school or SES are not included in the calculation itself, however, some effects from these factors may have already been an influence on their HSC marks. The ATAR scaling process ensures that students are neither advantaged nor disadvantaged by choosing one subject over another – it is designed to be subject blind; all subjects are valued equally. The scaling process removes the differences in the strength of academic ability between subject cohorts effectively putting marks from different
1 https://www.uac.edu.au/assets/documents/atar/usefulness-of-the-atar-report.pdf 2 Norton, A., Cherastidtham, I., & Mackey, W. (2018). Dropping out: The benefits and costs of
trying university. Grattan Institute. 3 https://www.uac.edu.au/future-applicants/scholarships-and-schemes 4 https://www.uac.edu.au/future-applicants/atar 5 https://www.uac.edu.au/assets/documents/atar/UAC-Effectiveness-limitations-ATAR-report-10-
Dec-2019.pdf 6 https://www.uac.edu.au/future-applicants/year-10-students
Socio-Economic Status and the ATAR Page 2
subjects on the same scale. Subject results are scaled every year which results in the subject’s scaled mean being a result of the cohort that studied that subject that year (in other words: cause and effect. The subject’s scaled mean is a result of the ATARs of the cohort studying it, NOT the ATARs of the cohort that study the subject are a result of studying that subject).
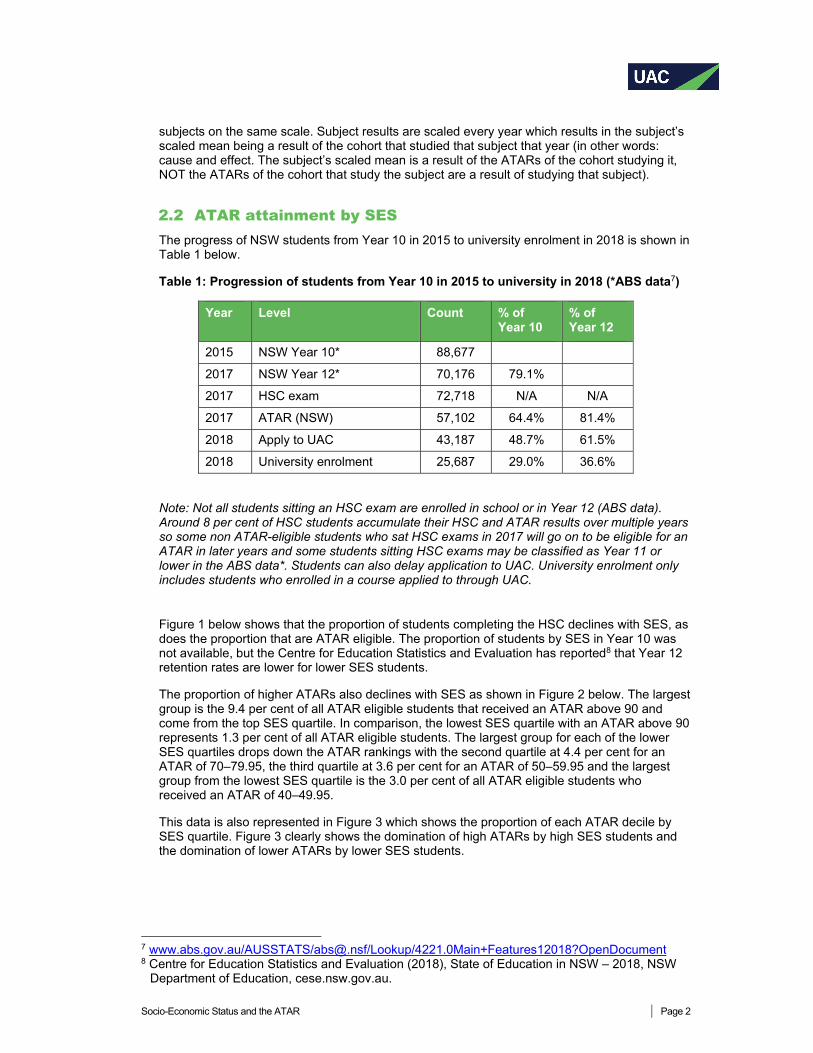
2.2 ATAR attainment by SES The progress of NSW students from Year 10 in 2015 to university enrolment in 2018 is shown in Table 1 below.
Table 1: Progression of students from Year 10 in 2015 to university in 2018 (*ABS data7)
Year Level Count % of Year 10
% of Year 12
2015 NSW Year 10* 88,677
2017 NSW Year 12* 70,176 79.1%
2017 HSC exam 72,718 N/A N/A
2017 ATAR (NSW) 57,102 64.4% 81.4%
2018 Apply to UAC 43,187 48.7% 61.5%
2018 University enrolment 25,687 29.0% 36.6%
Note: Not all students sitting an HSC exam are enrolled in school or in Year 12 (ABS data). Around 8 per cent of HSC students accumulate their HSC and ATAR results over multiple years so some non ATAR-eligible students who sat HSC exams in 2017 will go on to be eligible for an ATAR in later years and some students sitting HSC exams may be classified as Year 11 or lower in the ABS data*. Students can also delay application to UAC. University enrolment only includes students who enrolled in a course applied to through UAC.
Figure 1 below shows that the proportion of students completing the HSC declines with SES, as does the proportion that are ATAR eligible. The proportion of students by SES in Year 10 was not available, but the Centre for Education Statistics and Evaluation has reported8 that Year 12 retention rates are lower for lower SES students.
The proportion of higher ATARs also declines with SES as shown in Figure 2 below. The largest group is the 9.4 per cent of all ATAR eligible students that received an ATAR above 90 and come from the top SES quartile. In comparison, the lowest SES quartile with an ATAR above 90 represents 1.3 per cent of all ATAR eligible students. The largest group for each of the lower SES quartiles drops down the ATAR rankings with the second quartile at 4.4 per cent for an ATAR of 70–79.95, the third quartile at 3.6 per cent for an ATAR of 50–59.95 and the largest group from the lowest SES quartile is the 3.0 per cent of all ATAR eligible students who received an ATAR of 40–49.95.
This data is also represented in Figure 3 which shows the proportion of each ATAR decile by SES quartile. Figure 3 clearly shows the domination of high ATARs by high SES students and the domination of lower ATARs by lower SES students.
7 www.abs.gov.au/AUSSTATS/[email protected]/Lookup/4221.0Main+Features12018?OpenDocument 8 Centre for Education Statistics and Evaluation (2018), State of Education in NSW – 2018, NSW
Department of Education, cese.nsw.gov.au.

Socio-Economic Status and the ATAR Page 3
Figure 1: Proportion of 2017 HSC students by SES and ATAR eligibility.
Index of Education and Occupation Quartile
Figure 2: Proportion of 2017 ATAR eligible students by SES and ATAR.
Index of Education and Occupation Quartile

Socio-Economic Status and the ATAR Page 4
Figure 3: Proportion of ATAR deciles by SES.
2.3 Application and enrolment rates by SES and ATAR The application rate to UAC of ATAR-eligible students is closely related to ATAR, with higher ATAR students applying at a higher rate than lower ATAR students (Figure 4).
For ATARs above 70 there is little difference in the application rate between the SES quartiles, however, at lower ATARs there is an increased application rate for lower SES quartiles, particularly below an ATAR of 60. This may be reflective of work that UAC and its member institutions have done around inclusion in the years prior to the 2018 intake year.

Socio-Economic Status and the ATAR Page 5
Figure 4: UAC Application rate of 2017 ATAR-eligible students by SES and ATAR.
The rate of enrolment by SES and ATAR (Figure 5) shows a similar pattern to the rate of application (Figure 4). As expected, the rate of enrolment drops by ATAR, however, lower SES applicants tend to enrol at a greater rate than higher SES applicants across all ATAR bands.

Socio-Economic Status and the ATAR Page 6
Figure 5: Enrolment rate of 2017 ATAR-eligible students by SES and ATAR through UAC.
Note: Figure 5 shows enrolment rate to offers made through UAC. While UAC represents the single biggest market for university applications in NSW it is not the only application method to NSW universities. It is possible for students in the ATAR eligible pool to enrol at a NSW university and not apply through UAC. It is also possible for a student to enrol interstate or overseas.
2.4 First year success by SES and ATAR As mentioned earlier, the ATAR is very good at predicting how prepared a student is for university study9. Figure 6 shows that this holds true for first year outcomes for the different SES quartiles with lower SES students performing to their ATAR at very similar rates to higher SES students.
Students also largely perform to their ATAR when measured by first year GPA (figure 7). Students in the lowest SES quartile with a 90+ ATAR have a slightly higher average first year GPA than the highest SES quartile. In contrast, students in the lowest SES quartile with an ATAR below 60 tend to have slightly lower GPAs. This difference in performance may be due to the additional support that high performing low SES students are given, suggesting that this cohort of students with lower ATARs may need additional support at university.
9 https://www.uac.edu.au/assets/documents/atar/UAC-Effectiveness-limitations-ATAR-report-10-
Dec-2019.pdf

Socio-Economic Status and the ATAR Page 7
Figure 6: First year outcomes of 2017 ATAR eligible students by SES and ATAR who enrolled at university in 2018 through UAC.
Figure 7: First year GPA of 2017 ATAR-eligible students by SES and ATAR who enrolled at university in 2018 through UAC (excludes zero GPAs).
Socio-Economic Status and the ATAR Page 8
3 CONCLUSION The ATAR’s ability to indicate preparedness for university study holds true across all SES quartiles as we have found that for each SES quartile there is an alignment between ATARs and first year university results.
The proportion of students completing the HSC declines with socio-economic status, as does the proportion that are ATAR eligible.
For those that do complete their HSC and receive an ATAR, the application rate to UAC of ATAR-eligible students is closely related to ATAR, with higher ATAR students applying at a higher rate than lower ATAR students.
For ATARs above 70 there is little difference in the application rate between the SES quartiles, however, at lower ATARs there is an increased application rate for lower SES quartiles, particularly below an ATAR of 60. This may be reflective of policies around widening participation from low SES.
The rate of enrolment by SES and ATAR shows a similar pattern to the rate of application.
The ATAR does not itself systematically discriminate against any SES group as subsequent performance is at the level predicted by the ATAR. However, there may be other factors that affect the academic performance (in terms of both ATAR and first year university results) of low SES students. While the ATAR provides a level playing field, the equity in educational access and attainment for all in Australia is part of a much wider debate.
SOCIO-ECONOMIC STATUS AND THE ATAR
© 2020 Universities Admissions Centre (NSW & ACT) Pty Ltd UAC is the owner of the copyright in this document.
Apart from any fair dealing for the purpose of private study, criticism or review, or otherwise as permitted under the Copyright Act, no part may be reproduced by any process without UAC’s written permission. Enquiries should be addressed to the Managing Director, UAC.