socioeconomic overview of ohio - pages · 2015-01-14 · socioeconomic overview of ohio 2014 ohio...
TRANSCRIPT

OHIO AIRPORTS ECONOMIC IMPACT STUDY 2-1
2 Socioeconomic Overview of Ohio
Introduction The magnitude of the economic impact of Ohio’s airports is linked to the demand that is generated within the state for aviation goods and services. As population, employment, and personal income levels rise in the state, so too does demand for air travel, air cargo shipments, recreational flying, and other aviation-related activities by Ohio residents, businesses, and visitors. This chapter reviews Ohio’s general socioeconomic characteristics of population, employment, and personal income and analyzes trends between 1990 and 2012 and forecasts through 2040.
Population In the 1990 Census, Ohio’s population was more than 10.8 million. By the 2010 Census, the population had grown to more than 11.5 million, making Ohio the seventh most populous state in the country. Ohio’s growth during this period occurred at a compounded annual growth rate (CAGR) of 0.3 percent. In comparison, the population of the U.S. grew at a CAGR of 1.1 percent during the same time period. Ohio’s growth occurred at a significantly slower pace than that of the U.S.
As shown in Exhibit 2-1, most of Ohio's counties increased in population between the 2000 Census and the 2010 Census. Of the 88 Ohio counties, 53, or 60 percent, experienced positive growth in population. The counties experiencing the most significant growth were suburban counties adjacent to the state’s largest cities, such as Delaware County (58.4 percent increase) near Columbus, Medina County (14.1 percent increase) near Cleveland, and Warren County (34.3 percent increase) near Cincinnati. Aside from Franklin County, the state’s urban counties (Cuyahoga, Montgomery, Hamilton, Lucas, Summit, and Mahoning) all lost population.

SOCIOECONOMIC OVERVIEW OF OHIO 2014
OHIO AIRPORTS ECONOMIC IMPACT STUDY 2-2
Exhibit 2-1
Historic Population by County
SOCIOECONOMIC OVERVIEW OF OHIO 2014
OHIO AIRPORTS ECONOMIC IMPACT STUDY 2-3
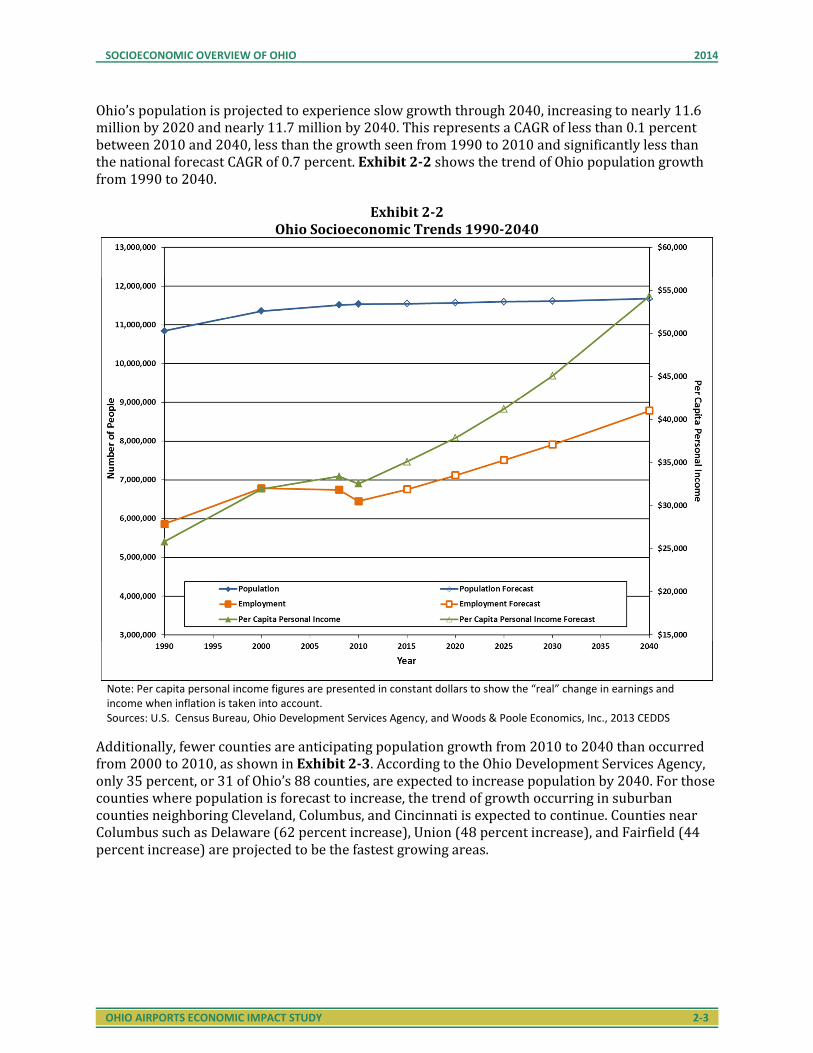
Ohio’s population is projected to experience slow growth through 2040, increasing to nearly 11.6 million by 2020 and nearly 11.7 million by 2040. This represents a CAGR of less than 0.1 percent between 2010 and 2040, less than the growth seen from 1990 to 2010 and significantly less than the national forecast CAGR of 0.7 percent. Exhibit 2-2 shows the trend of Ohio population growth from 1990 to 2040.
Exhibit 2-2
Ohio Socioeconomic Trends 1990-2040
Note: Per capita personal income figures are presented in constant dollars to show the “real” change in earnings and
income when inflation is taken into account.
Sources: U.S. Census Bureau, Ohio Development Services Agency, and Woods & Poole Economics, Inc., 2013 CEDDS
Additionally, fewer counties are anticipating population growth from 2010 to 2040 than occurred from 2000 to 2010, as shown in Exhibit 2-3. According to the Ohio Development Services Agency, only 35 percent, or 31 of Ohio’s 88 counties, are expected to increase population by 2040. For those counties where population is forecast to increase, the trend of growth occurring in suburban counties neighboring Cleveland, Columbus, and Cincinnati is expected to continue. Counties near Columbus such as Delaware (62 percent increase), Union (48 percent increase), and Fairfield (44 percent increase) are projected to be the fastest growing areas.

SOCIOECONOMIC OVERVIEW OF OHIO 2014
OHIO AIRPORTS ECONOMIC IMPACT STUDY 2-4
Exhibit 2-3
Ohio Population Growth Forecast 2010-2040
SOCIOECONOMIC OVERVIEW OF OHIO 2014
OHIO AIRPORTS ECONOMIC IMPACT STUDY 2-5
Employment In 1990, the Ohio workforce totaled nearly 5.9 million workers and grew to more than 6.5 million workers by 2011.1 This growth represents a CAGR of 0.5 percent. From 2000 to 2011, however, the number of employees in the state decreased at a CAGR of 0.4 percent. This negative employment growth rate, as compared to the growth seen in population during the same period, was largely due to conditions brought on by the economic recession beginning in December 2007. Ohio suffered its greatest loss of employment in 2009. Losses continued into 2010 with growth returning in 2011. Nationally, job losses were significant between 2008 and 2010 due to the recession, but job growth was positive overall during the 2000 to 2011 period, increasing at a CAGR of 0.6 percent.
The forecasts of Ohio employment through 2040 show employment exceeding the pre-recession level by 2020 and reaching nearly 8.8 million jobs by 2040 (see Exhibit 2-2). This growth during the 2011 to 2040 period represents a CAGR of 1.0 percent, which is less than the national forecasts CAGR of 1.3 percent.
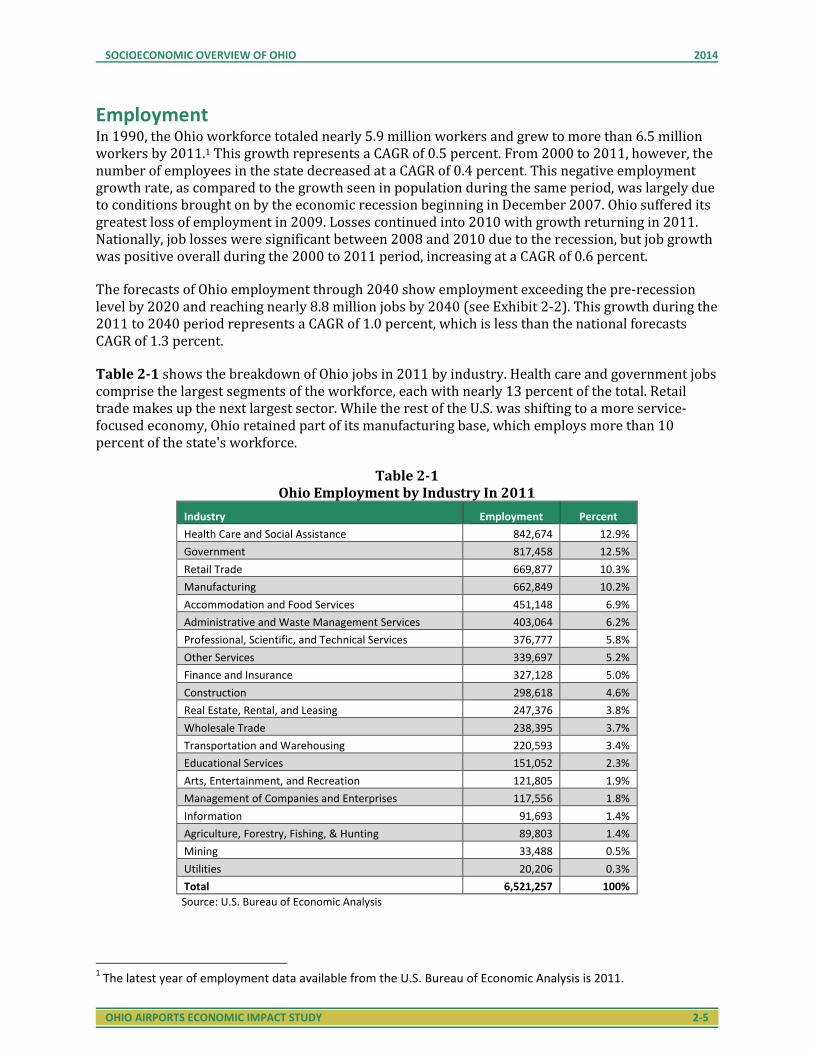
Table 2-1 shows the breakdown of Ohio jobs in 2011 by industry. Health care and government jobs comprise the largest segments of the workforce, each with nearly 13 percent of the total. Retail trade makes up the next largest sector. While the rest of the U.S. was shifting to a more service-focused economy, Ohio retained part of its manufacturing base, which employs more than 10 percent of the state's workforce.
Table 2-1
Ohio Employment by Industry In 2011
Industry Employment Percent
Health Care and Social Assistance 842,674 12.9%
Government 817,458 12.5%
Retail Trade 669,877 10.3%
Manufacturing 662,849 10.2%
Accommodation and Food Services 451,148 6.9%
Administrative and Waste Management Services 403,064 6.2%
Professional, Scientific, and Technical Services 376,777 5.8%
Other Services 339,697 5.2%
Finance and Insurance 327,128 5.0%
Construction 298,618 4.6%
Real Estate, Rental, and Leasing 247,376 3.8%
Wholesale Trade 238,395 3.7%
Transportation and Warehousing 220,593 3.4%
Educational Services 151,052 2.3%
Arts, Entertainment, and Recreation 121,805 1.9%
Management of Companies and Enterprises 117,556 1.8%
Information 91,693 1.4%
Agriculture, Forestry, Fishing, & Hunting 89,803 1.4%
Mining 33,488 0.5%
Utilities 20,206 0.3%
Total 6,521,257 100%
Source: U.S. Bureau of Economic Analysis
1 The latest year of employment data available from the U.S. Bureau of Economic Analysis is 2011.

SOCIOECONOMIC OVERVIEW OF OHIO 2014
OHIO AIRPORTS ECONOMIC IMPACT STUDY 2-6
Per Capita Personal Income Personal income can be used as an indication of how much money people will spend on the consumption of goods and services, including aviation, since the greater the income, the greater the purchasing power one has. Per capita personal income for the state of Ohio was $25,800 in 1990 and grew to $33,500 by 2011.2 The change in this figure represents a CAGR of 1.2 percent. By comparison, per capita personal income for the U.S. grew from $26,800 to $36,700 during the same period, for a 1.5 percent CAGR.
The effects of the most recent economic recession were reflected in Ohio's per capita income, with it dropping 2.4 percent from 2008 ($33,400) to 2010 ($32,600). Per capita income increased in 2011, by 2.8 percent to $33,500, indicating a recovery from the recession.
Projections of future per capita income show positive growth continuing through 2040, with an average annual increase in per capita income of 1.7 percent expected, rising from $33,500 per capita in 2011 to $54,300 per capita in 2040 (see Exhibit 2-2). This is slightly above the forecast national CAGR of 1.5 percent for the same period.
Summary The socioeconomic statistics reported in this chapter show Ohio was affected by the economic recession. However, there are indications the state is poised for economic growth. Although population growth has been slow since 1990 and is forecast to remain slow through 2040, employment opportunities in Ohio are rising as the state recovers from the national recession. With 27 Fortune 500 companies headquartered in Ohio, including Cardinal Health, Kroger, and Procter & Gamble,3 employment prospects look promising and are projected to grow at a CAGR of 1.0 percent during the 2011 to 2040 period. Per capita personal income is also projected to grow at a CAGR of 1.7 percent during the same period, which is higher than the forecasted national CAGR.
2 The latest year of per capita personal income data available from the U.S. Bureau of Economic Analysis is 2011.
All figures in this section are presented in constant dollars to show the “real” change in earnings and income when
inflation is taken into account. 3 “Fortune 500 List Features 27 Ohio Companies,” Dayton Business Journal, May 7, 2013.