socorro independent school district targeted improvement
TRANSCRIPT

Socorro Independent School District
Targeted Improvement
Plan for PBMAS November 19, 2015

Needs Assessment Summary and Improvement Plan
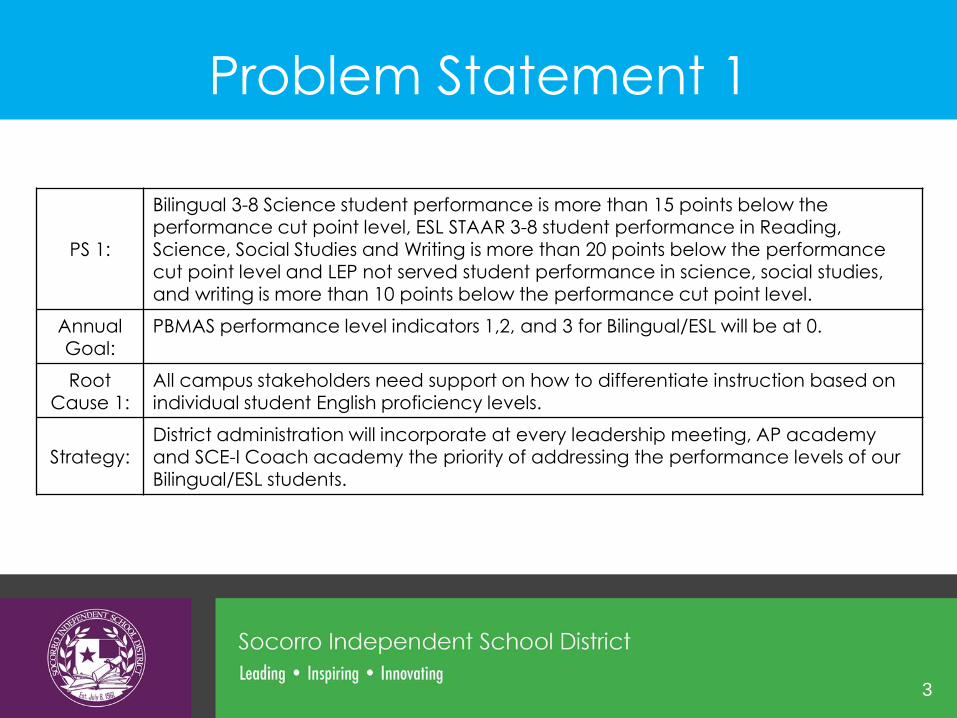
PS 1:
Bilingual 3-8 Science student performance is more than 15 points below the performance cut point level, ESL STAAR 3-8 student performance in Reading, Science, Social Studies and Writing is more than 20 points below the performance cut point level and LEP not served student performance in science, social studies, and writing is more than 10 points below the performance cut point level.
PS 2: LEP graduation rate performance is 6 points below the performance cut point level.
PS 3: TELPAS composite rating levels for students in U.S. school for multiple years is 4 points above the performance cut point level.
PS 4: Special education STAAR 3-8 student performance in mathematics, reading, science, social studies and writing is more than 25 points below the performance cut point level.
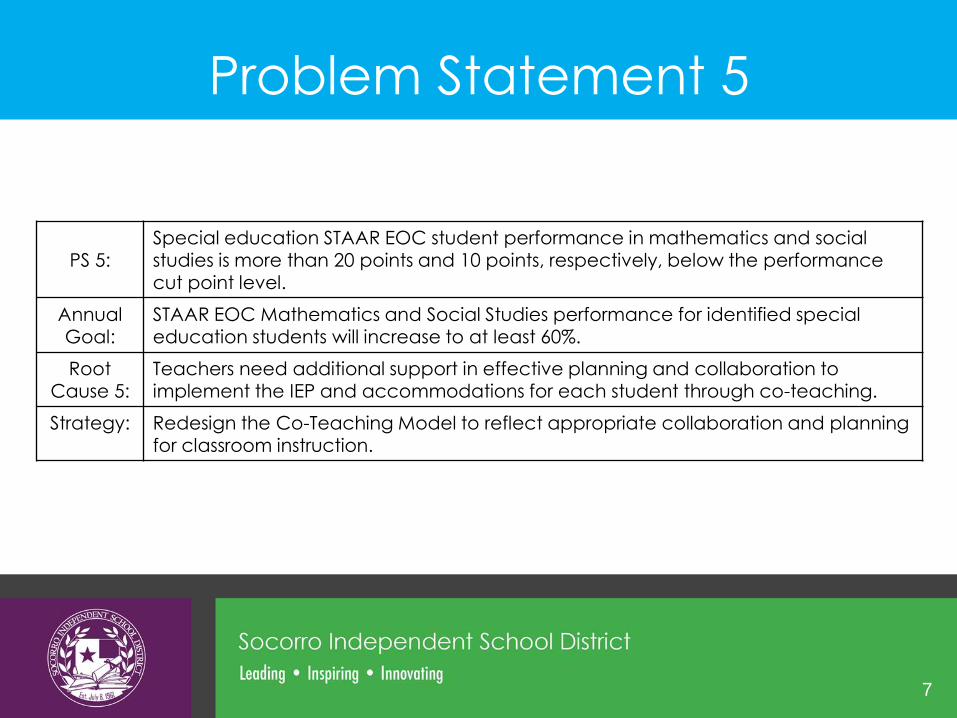
PS 5: Special education STAAR EOC student performance in mathematics and social studies is more than 20 points and 10 points, respectively, below the performance cut point level.
Problem Statements
2
Problem Statement 1
PS 1:
Bilingual 3-8 Science student performance is more than 15 points below the performance cut point level, ESL STAAR 3-8 student performance in Reading, Science, Social Studies and Writing is more than 20 points below the performance cut point level and LEP not served student performance in science, social studies, and writing is more than 10 points below the performance cut point level.
Annual
Goal: PBMAS performance level indicators 1,2, and 3 for Bilingual/ESL will be at 0.
Root Cause 1:
All campus stakeholders need support on how to differentiate instruction based on individual student English proficiency levels.
Strategy:
District administration will incorporate at every leadership meeting, AP academy and SCE-I Coach academy the priority of addressing the performance levels of our Bilingual/ESL students.
3

Problem Statement 2
PS 2: LEP graduation rate performance is 6 points below the performance cut point level.
Annual Goal:
LEP graduation rate performance will increase to at least 75% to reflect a performance level of 0.
Root Cause 2:
Teachers need additional support and skills to support academic language development across the curriculum.
Strategy: Teachers will incorporate academic language skills development activities in all
core areas to increase the number of students that are on track to graduate with their cohort.
4

Problem Statement 3
PS 3: TELPAS composite rating levels for students in U.S. school for multiple years is 4 points above the performance cut point level.
Annual Goal:
PBMAS performance level indicator 10 for Bilingual/ESL will be at 0.
Root Cause 3:
Teachers need additional support on how to understand and implement the TELPAS Proficiency Level Descriptors in the delivery of their instruction for all ELL students.
Strategy: Teachers will incorporate the use of ELPS and PLDs in all of their classroom instructional planning and delivery.
5

Problem Statement 4
PS 4:
Special education STAAR 3-8 student performance in mathematics, reading,
science, social studies and writing is more than 25 points below the performance cut point level.
Annual Goal:
Special education STAAR 3-8 student performance in mathematics, reading, science, social studies and writing will be at the state rate for PBMAS cut points at level 0.
Root
Cause 4:
Teachers need additional support in effective planning and collaboration to
implement the IEP and accommodations for each student through co-teaching.
Strategy: Redesign the Co-Teaching Model to reflect appropriate collaboration and planning for classroom instruction.
6
Problem Statement 5
PS 5: Special education STAAR EOC student performance in mathematics and social
studies is more than 20 points and 10 points, respectively, below the performance cut point level.
Annual Goal:
STAAR EOC Mathematics and Social Studies performance for identified special education students will increase to at least 60%.
Root
Cause 5: Teachers need additional support in effective planning and collaboration to
implement the IEP and accommodations for each student through co-teaching.
Strategy: Redesign the Co-Teaching Model to reflect appropriate collaboration and planning for classroom instruction.
7

Interventions by Quarter
Q1 Goal:
100% of campus leadership teams will be provided with district and campus PBMAS
data reports for analysis and identification of root causes.
Q1 Interventions:
1) PBMAS training for principals will be provided to look at specific campus data.
2) SMART goals and campus improvement plans will be addressed based on
PBMAS data reports.
3) Data analysis tool (OnDataSuite) will be used to identify students who
impacted student performance at each campus by core content.
4) SIOP and ELPS trainings will be provided to support the needs of ELL students.
What data will be
collected to monitor
interventions in Q1?:
1) Agenda, sign-in sheets and survey from PBMAS session on Oct. 22, 2015.
2) Specific campus SMART Goals and improvement plans.
3) Data analysis reports (OnDataSuite).
4) Agendas and sign-in sheets from SIOP and ELPS sessions.
Quarter 1: August, September, October
Districts and 1st Year IR campuses are required to
provide, at a minimum, the interventions
accomplished for quarter 1 (Q1).
8

Interventions by Quarter
Q2 Goal:
Campuses will submit completed intervention plans by November 16, 2015 that
address the specific campus PBMAS indicators in need of improvement.
Q2 Interventions:
1) Campuses will attend a PBMAS intervention planning support sessions to
develop intervention plans for their specific campus needs.
2) Provide guidance to campus leadership to understand the difference
between a strategy and intervention.
3) District and campus leadership will monitor and verify the implementation of
the campus intervention plans.
4) Implement Math, Science and Social Studies Academies to target specific
instructional strategies that best support ELL's.
What data will be
collected to monitor
interventions in Q2?:
1) Agendas and sign-in sheets from PBMAS intervention planning sessions.
2) Agendas and sign-in sheets from PBMAS intervention planning sessions.
3) Instructional rounds data and campus support visitation forms.
4) Agendas and sign-in sheets from Math, Science and Social Studies Academies.
Quarter 2: November, December, January
9

Interventions by Quarter
Q3 Goal:
Based on district and campus verification, campuses will adjust intervention plans
by March 4, 2016 to address the specific needs of students.
Q3 Interventions:
1) Campuses will identify targeted and explicit interventions for students based on
student individual needs through the support of an instructional aide.
2) Provide evidence of targeted instructional practices that support ELL's through
Instructional Rounds.
3) Provide ELL Intervention Academies during the Intersession to target specific
instructional needs.
4) Monitor the implementation of strategies introduced during Math, Science and
Social Studies Academies that best support ELL's.
What data will be
collected to monitor
interventions in Q3?:
1) Copies of intervention plans submitted to Assistant Superintendents.
2) Classroom visitation forms and feedback to included charted data from
Instructional Rounds.
3) Lesson plans, agendas and attendance logs.
4) Improved feedback on walkthrough data.
Quarter 3: February, March
10

Interventions by Quarter
Q4 Goal:
The English language proficiency levels of each ELL student will improve by one
proficiency level.
Q4 Interventions:
1) Ensure that all ELL students are provided with appropriate linguistic
accommodations for classroom.
2) Ensure that the PLD’s are utilized in the delivery of instruction by teachers.
3) Identifying professional development needs for ELL students for the 2016- 2017
school year.
4) Develop master schedules to prioritize the needs of ELL students for the 2016-
2017 school year.
What data will be
collected to monitor
interventions in Q4?:
1) LPAC documentation
2) STAAR testing documentation
3) Results from teacher/administrator PD surveys on needs for next school year.
4) Final master schedules
Quarter 4: April, May, June
11
