sodar validation test - aqs€¦ · sodar validation test aqsystem aq510-005 at fimmerstad...
TRANSCRIPT

SODAR Validation Test AQSystem AQ510-005 at Fimmerstad
05/10/2014 – 18/10/2014

ECOFYS WTTS B.V.
Kanaalweg 15G | 3526 KL Utrecht| T +31 (0)30 662-3827 | E [email protected] | I www.ecofyswtts.com
Chamber of Commerce 24468357
SODAR Validation Test AQSystem AQ510-005 at Fimmerstad
05/10/2014 – 18/10/2014
Project number: WIEWT15422
Filename 20150115_REP_AQS_Validation_AQ510-005_v1_FINAL public.docx
Pages 23
Status Final
Version Date
Author
Checked
by
Approved
by
Remarks/Change
1.0 12/01/2015 ACr SoB EHo Final, public
© Ecofys WTTS 2014 by order of: AQSystem

ECOFYS WTTS B.V.
Kanaalweg 15G | 3526 KL Utrecht| T +31 (0)30 662-3827 | E [email protected] | I www.ecofyswtts.com
Chamber of Commerce 24468357
Summary
On request of AQSystem, Ecofys Wind Turbine Testing Services (WTTS) carried out the validation
analysis of an AQ510 SODAR (AQ510-005) against the reference Fimmerstad met mast. The
measurement campaign was performed by AQSystem.
The 103 m guyed mast is IEC-compliant and equipped with high-quality cup anemometers at 60, 80
and 100.9 m, with wind vanes at 55, 75 and 97 m. The SODAR was collecting wind data at 33
altitudes including six common heights with the met mast (55, 60, 75, 80, 95 and 100 m).
The validation measurement campaign was performed by the client. Raw data was provided, without
any processing, along with documentation of the test setup and campaign. The SODAR validation
campaign lasted from 05/10/2014 to 18/10/2014. Ecofys WTTS considers that the provided data and
documents are sufficient as a basis for this validation analysis.
All measured data was filtered to ensure entirely valid datasets. A sufficient amount of data was
collected for the SODAR: a minimum number of 600 concurrent data points from the valid sectors
and at least 200 data points in each of the two wind speed ranges: 4-8 m/s and 8-12 m/s.
Linear regression between the overall SODAR and met mast recordings showed consistent, highly-
correlated measurements with slopes near unity for all common measured heights both for wind
speed and wind direction.
The SODAR measurements were validated against NORSEWInD criteria [3] which stipulate thresholds
for the quality of the correlation. The AQ510-005 meets most of the NORSEWInD criteria for the
overall valid data. However, for the limited wind speed sub-ranges, namely 4-8 m/s and 8-12 m/s,
the correlation of the SoDAR and the met mast is lower than the NORSEWInD criterion threshold,
which may be due to the short duration of the test. The overall high correlations and excellent linear
regression fit indicate that the SODAR is functioning properly with high accuracy.
As a result of this test, Ecofys WTTS judges that the SODAR AQ510-005 is suitable for field
measurements as a replacement of cup anemometers in flat terrain. It is recommended to quantify
the uncertainty of the wind speed measurements in a longer verification campaign against a
reference met mast.
ECOFYS WTTS B.V.
Kanaalweg 15G | 3526 KL Utrecht| T +31 (0)30 662-3827 | E [email protected] | I www.ecofyswtts.com
Chamber of Commerce 24468357
Table of contents
1 Introduction 1
1.1 Validation criteria 1
2 Validation Campaign 2
2.1 Site description 2
2.2 Met mast 3
2.3 SODAR 4
2.4 Time synchronization 5
2.5 Data format 5
2.6 Valid wind direction sectors 5
3 SODAR Validation Procedure 8
3.1 Met Mast Data Filtering 8
3.1.1 System non-availability 8
3.1.2 Wind direction recordings 8
3.1.3 Wind speed intercomparison 8
3.1.4 Icing of instruments 8
3.1.5 Excluded wind sectors 8
3.2 SODAR Data Filtering 8
3.2.1 System non-availability 9
3.2.2 Excluded wind sectors 9
3.2.3 Conditions outside operational envelope 9
3.2.1 Low signal to noise conditions 9
3.3 Statistical tests 9
3.3.1 Scatter plot 9
3.3.2 Linear regression analysis 9
3.3.3 Wind direction 10
4 Results & Discussion 11
4.1 Data coverage 11
4.2 Absolute Error 12
4.3 Linear Regression of Wind Speed 12
4.4 Linear Regression of Wind Direction 14
4.5 NORSEWInD criteria validation 15
5 Conclusion 16
References 17
Appendix A. Calibration certificates of met mast 18
WIEWT15422 – AQ510-005 Validation 1
1 Introduction
Ecofys WTTS has performed a validation analysis of SODAR wind measurements against IEC-
compliant [1] [2] met mast measurements at Fimmerstad, a test site in southern Sweden. This
report presents the SODAR validation process and results, with special attention to the instrument’s
intended use for wind resource assessments.
1.1 Validation criteria
The validation procedure evaluates the absolute error and the quality of the linear regression
between SODAR and anemometry. These comparisons are based on the criteria proposed for the EU’s
NORSEWInD project [3]:
“Absolute error – difference in reported wind speed between the reference and test
instrument based on 10-minute averages”;
“Linear regression gradient – this is based on a single variant regression, with the regression
analysis constrained to pass through origin (y=mx+b; b==0)”;
“Linear regression R-squared values – is the quality of fit value returned from the analysis
performed to assess the linear regression gradient value.”
The NORSEWInD criteria recommends at least 600 valid data points. This criterion has been applied
to the current validation test in order to maintain an accurate comparison. The validation criteria are
shown in Table 1. The primary comparison will be between measurements at the top measurement
height of the met mast, with additional comparisons at lower heights.
Table 1: Applied SODAR Validation Criteria [3]
Parameter Criteria
Absolute error <0.5m/s; Not more than 10% of data to exceed this value
Linear regression slope Between 0.98 and 1.01
Linear regression R² >0.98
If sufficient valid data is collected within the measurement period, the data will also be compared in
two wind speed ranges (with a deviation of less than 0.015 in slopes). This can help to identify non-
linearity.
In addition, wind directions are also compared at the top measurement height of the mast.
WIEWT15422 – AQ510-005 Validation 2
2 Validation Campaign
The measurement campaign was carried out by the client, at a test site that they operate. The
description of the campaign setup is based on information provided by the client, including a detailed
account of the mast and surroundings [4] and an independent assessment of the mast and site
designs [5] with reference to the IEC 61400-12-1 standard. Ecofys WTTS did not visit the site, but
considers that the provided documentation is sufficient as a basis for this validation analysis.
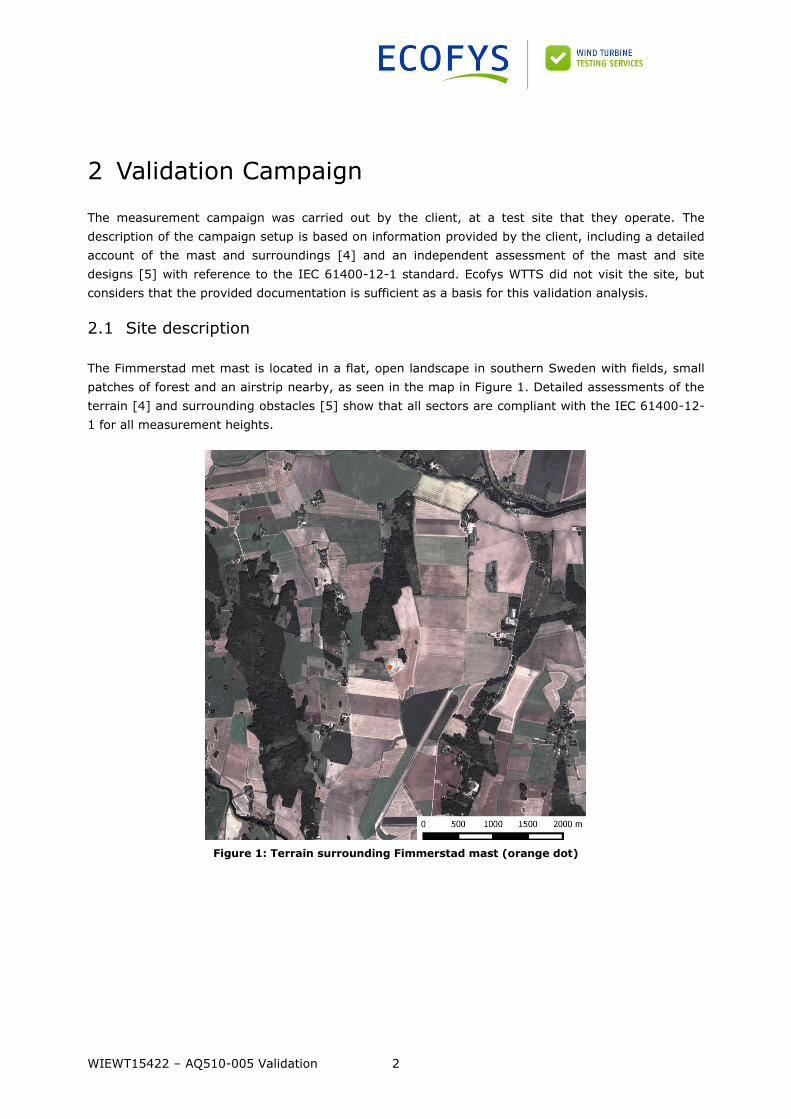
2.1 Site description
The Fimmerstad met mast is located in a flat, open landscape in southern Sweden with fields, small
patches of forest and an airstrip nearby, as seen in the map in Figure 1. Detailed assessments of the
terrain [4] and surrounding obstacles [5] show that all sectors are compliant with the IEC 61400-12-
1 for all measurement heights.
Figure 1: Terrain surrounding Fimmerstad mast (orange dot)
WIEWT15422 – AQ510-005 Validation 3
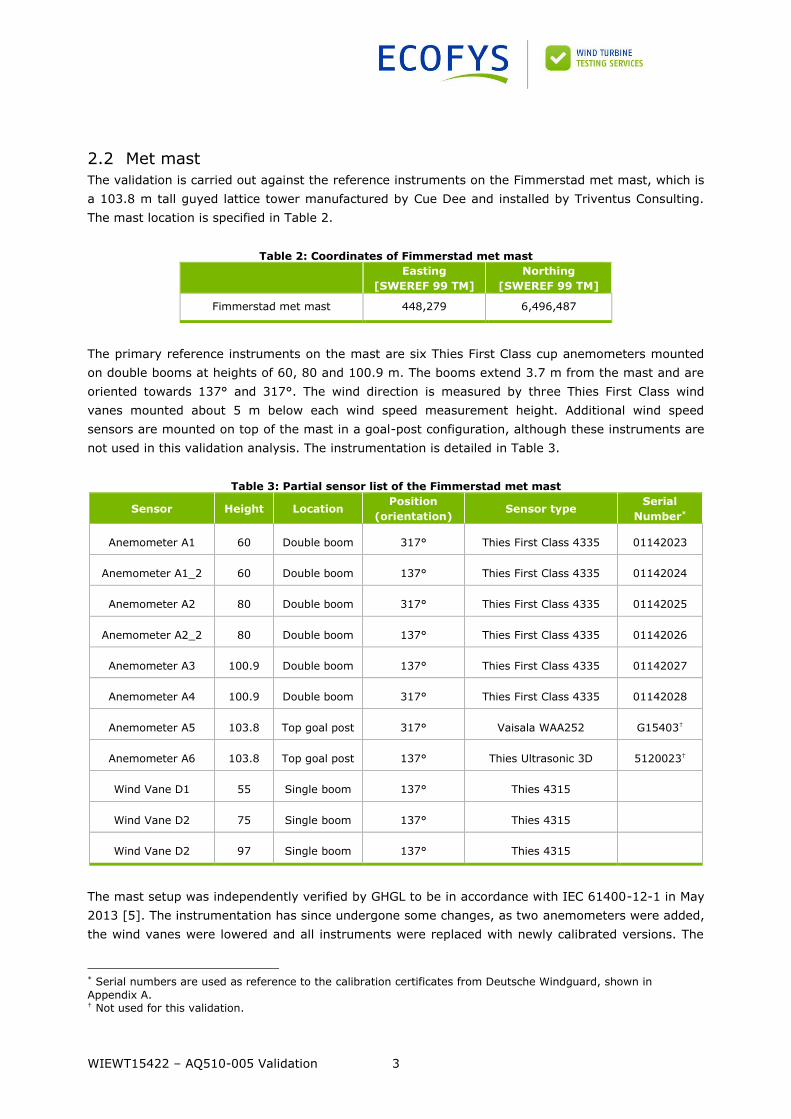
2.2 Met mast
The validation is carried out against the reference instruments on the Fimmerstad met mast, which is
a 103.8 m tall guyed lattice tower manufactured by Cue Dee and installed by Triventus Consulting.
The mast location is specified in Table 2.
Table 2: Coordinates of Fimmerstad met mast
Easting
[SWEREF 99 TM]
Northing
[SWEREF 99 TM]
Fimmerstad met mast 448,279 6,496,487
The primary reference instruments on the mast are six Thies First Class cup anemometers mounted
on double booms at heights of 60, 80 and 100.9 m. The booms extend 3.7 m from the mast and are
oriented towards 137° and 317°. The wind direction is measured by three Thies First Class wind
vanes mounted about 5 m below each wind speed measurement height. Additional wind speed
sensors are mounted on top of the mast in a goal-post configuration, although these instruments are
not used in this validation analysis. The instrumentation is detailed in Table 3.
Table 3: Partial sensor list of the Fimmerstad met mast
Sensor Height Location Position
(orientation) Sensor type
Serial
Number*
Anemometer A1 60 Double boom 317° Thies First Class 4335 01142023
Anemometer A1_2 60 Double boom 137° Thies First Class 4335 01142024
Anemometer A2 80 Double boom 317° Thies First Class 4335 01142025
Anemometer A2_2 80 Double boom 137° Thies First Class 4335 01142026
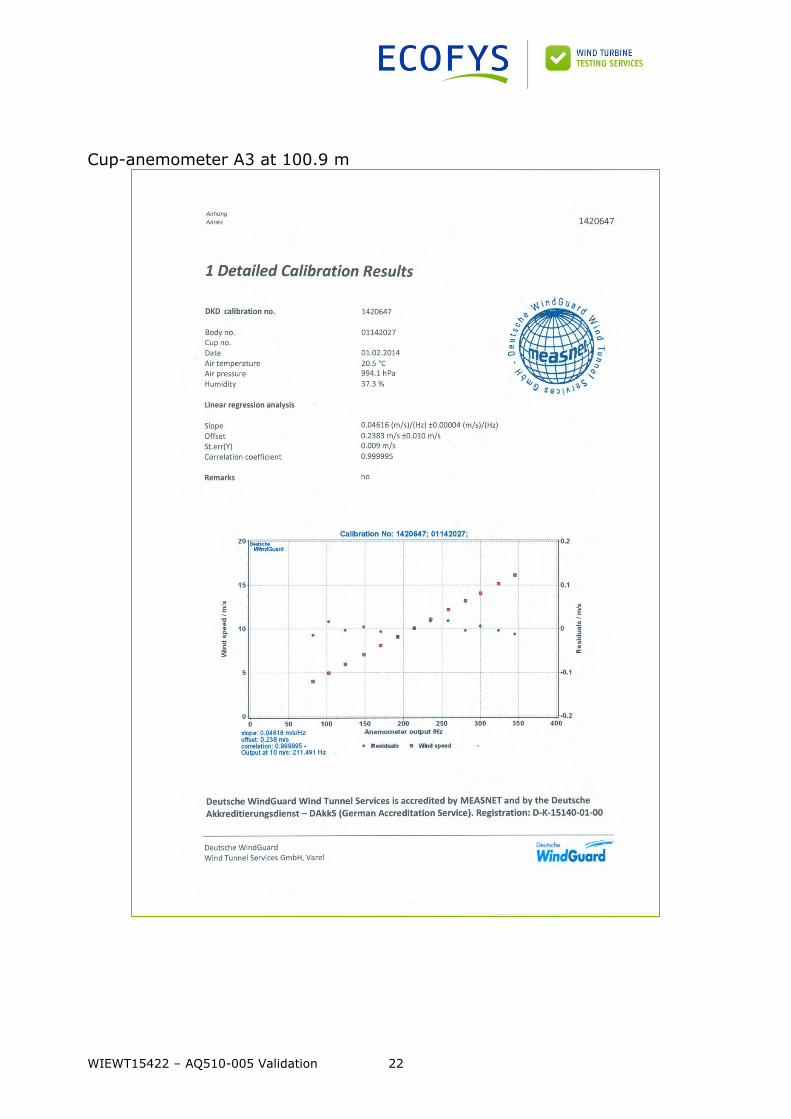
Anemometer A3 100.9 Double boom 137° Thies First Class 4335 01142027
Anemometer A4 100.9 Double boom 317° Thies First Class 4335 01142028
Anemometer A5 103.8 Top goal post 317° Vaisala WAA252 G15403†
Anemometer A6 103.8 Top goal post 137° Thies Ultrasonic 3D 5120023†
Wind Vane D1 55 Single boom 137° Thies 4315
Wind Vane D2 75 Single boom 137° Thies 4315
Wind Vane D2 97 Single boom 137° Thies 4315
The mast setup was independently verified by GHGL to be in accordance with IEC 61400-12-1 in May
2013 [5]. The instrumentation has since undergone some changes, as two anemometers were added,
the wind vanes were lowered and all instruments were replaced with newly calibrated versions. The
* Serial numbers are used as reference to the calibration certificates from Deutsche Windguard, shown in
Appendix A. † Not used for this validation.
WIEWT15422 – AQ510-005 Validation 4
client provided a logbook showing these changes and an updated mast description that fully
documents the current layout. Ecofys considers that these changes to the mast layout will not have
affected the integrity of the mast measurements.
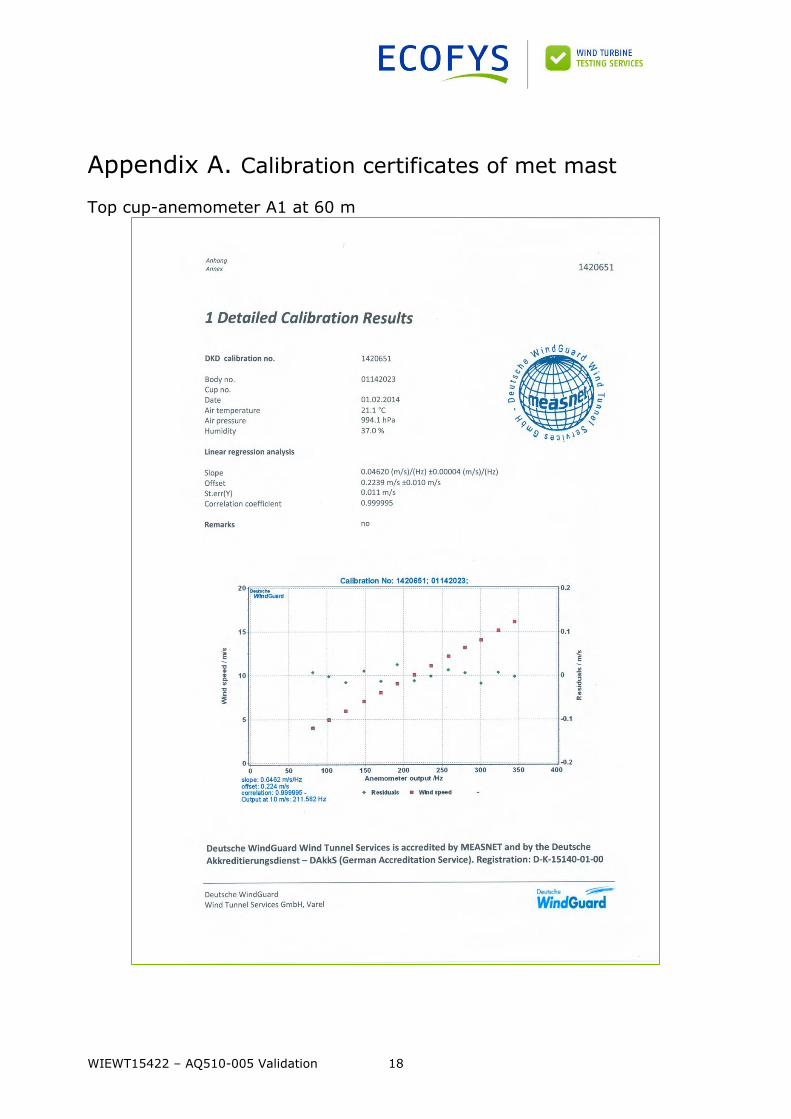
All Thies First Class anemometers were calibrated at the wind tunnel facility of Deutsche Windguard,
Germany in February 2014. All calibration certificates can be found in Appendix A. The mast and
instruments were installed on 19/03/2014. The uncertainty in wind measurements is minimised
through the selection of high-quality, calibrated instruments. Ecofys recommends that the
anemometers are re-calibrated after a period of one year, in order to verify the stability of the
calibration coefficients.
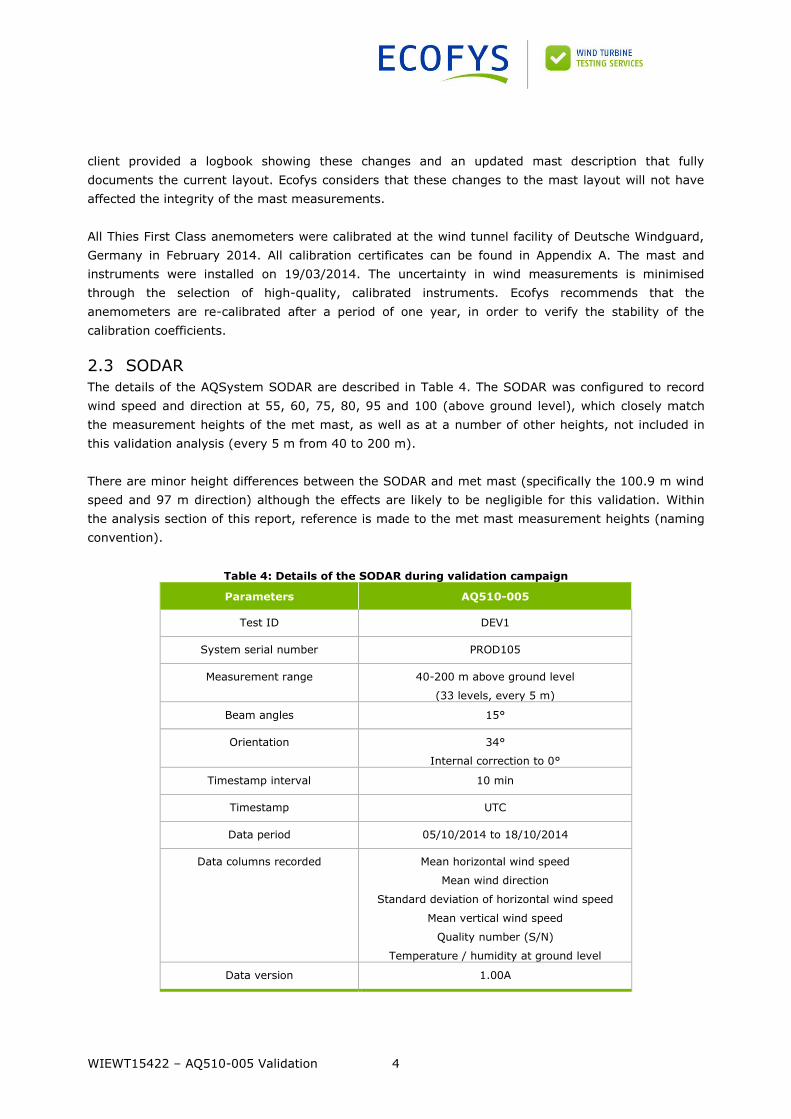
2.3 SODAR
The details of the AQSystem SODAR are described in Table 4. The SODAR was configured to record
wind speed and direction at 55, 60, 75, 80, 95 and 100 (above ground level), which closely match
the measurement heights of the met mast, as well as at a number of other heights, not included in
this validation analysis (every 5 m from 40 to 200 m).
There are minor height differences between the SODAR and met mast (specifically the 100.9 m wind
speed and 97 m direction) although the effects are likely to be negligible for this validation. Within
the analysis section of this report, reference is made to the met mast measurement heights (naming
convention).
Table 4: Details of the SODAR during validation campaign
Parameters AQ510-005
Test ID DEV1
System serial number PROD105
Measurement range 40-200 m above ground level
(33 levels, every 5 m)
Beam angles 15°
Orientation 34°
Internal correction to 0°
Timestamp interval 10 min
Timestamp UTC
Data period 05/10/2014 to 18/10/2014
Data columns recorded Mean horizontal wind speed
Mean wind direction
Standard deviation of horizontal wind speed
Mean vertical wind speed
Quality number (S/N)
Temperature / humidity at ground level
Data version 1.00A
WIEWT15422 – AQ510-005 Validation 5
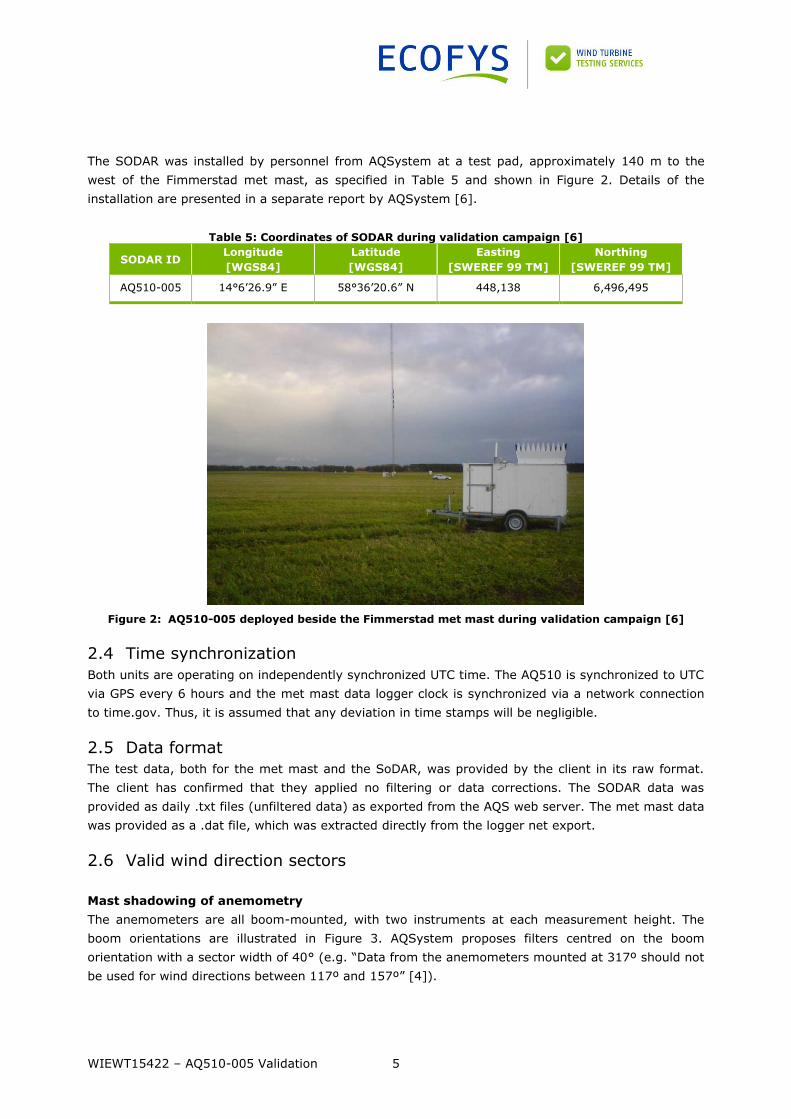
The SODAR was installed by personnel from AQSystem at a test pad, approximately 140 m to the
west of the Fimmerstad met mast, as specified in Table 5 and shown in Figure 2. Details of the
installation are presented in a separate report by AQSystem [6].
Table 5: Coordinates of SODAR during validation campaign [6]
SODAR ID Longitude
[WGS84]
Latitude
[WGS84]
Easting
[SWEREF 99 TM]
Northing
[SWEREF 99 TM]
AQ510-005 14°6’26.9” E 58°36’20.6” N 448,138 6,496,495
Figure 2: AQ510-005 deployed beside the Fimmerstad met mast during validation campaign [6]
2.4 Time synchronization
Both units are operating on independently synchronized UTC time. The AQ510 is synchronized to UTC
via GPS every 6 hours and the met mast data logger clock is synchronized via a network connection
to time.gov. Thus, it is assumed that any deviation in time stamps will be negligible.
2.5 Data format
The test data, both for the met mast and the SoDAR, was provided by the client in its raw format.
The client has confirmed that they applied no filtering or data corrections. The SODAR data was
provided as daily .txt files (unfiltered data) as exported from the AQS web server. The met mast data
was provided as a .dat file, which was extracted directly from the logger net export.
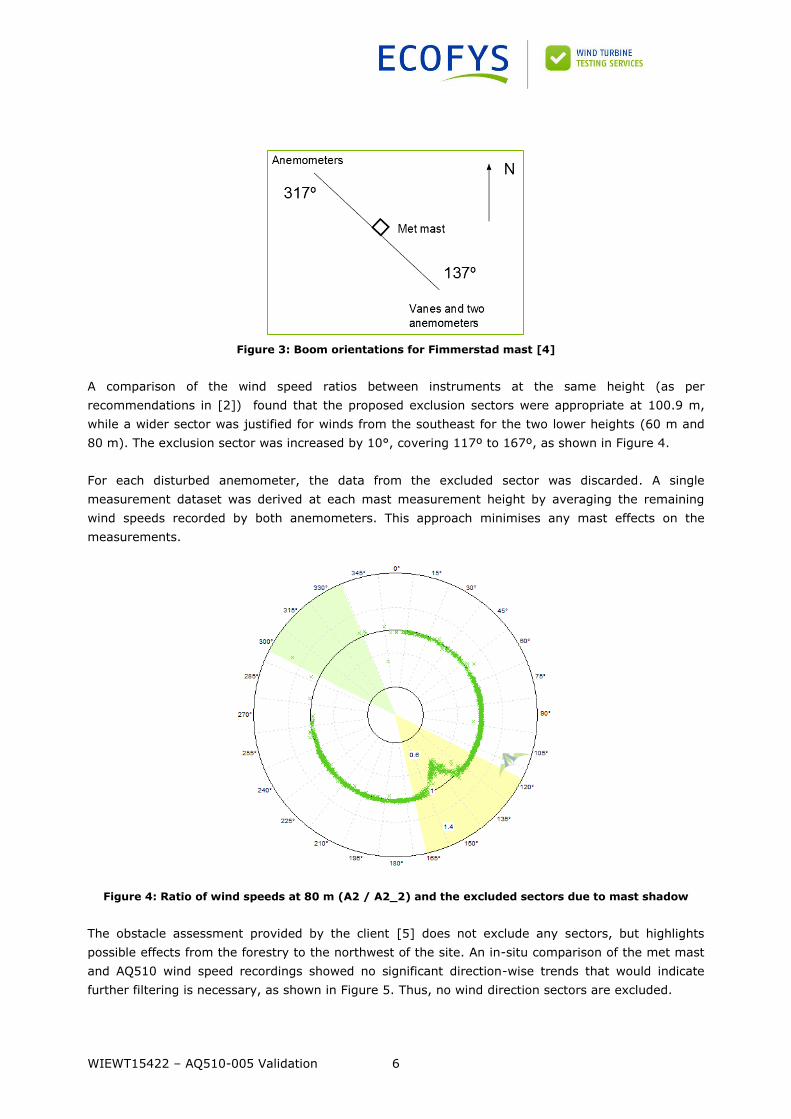
2.6 Valid wind direction sectors
Mast shadowing of anemometry
The anemometers are all boom-mounted, with two instruments at each measurement height. The
boom orientations are illustrated in Figure 3. AQSystem proposes filters centred on the boom
orientation with a sector width of 40° (e.g. “Data from the anemometers mounted at 317º should not
be used for wind directions between 117º and 157º” [4]).
WIEWT15422 – AQ510-005 Validation 6
Figure 3: Boom orientations for Fimmerstad mast [4]
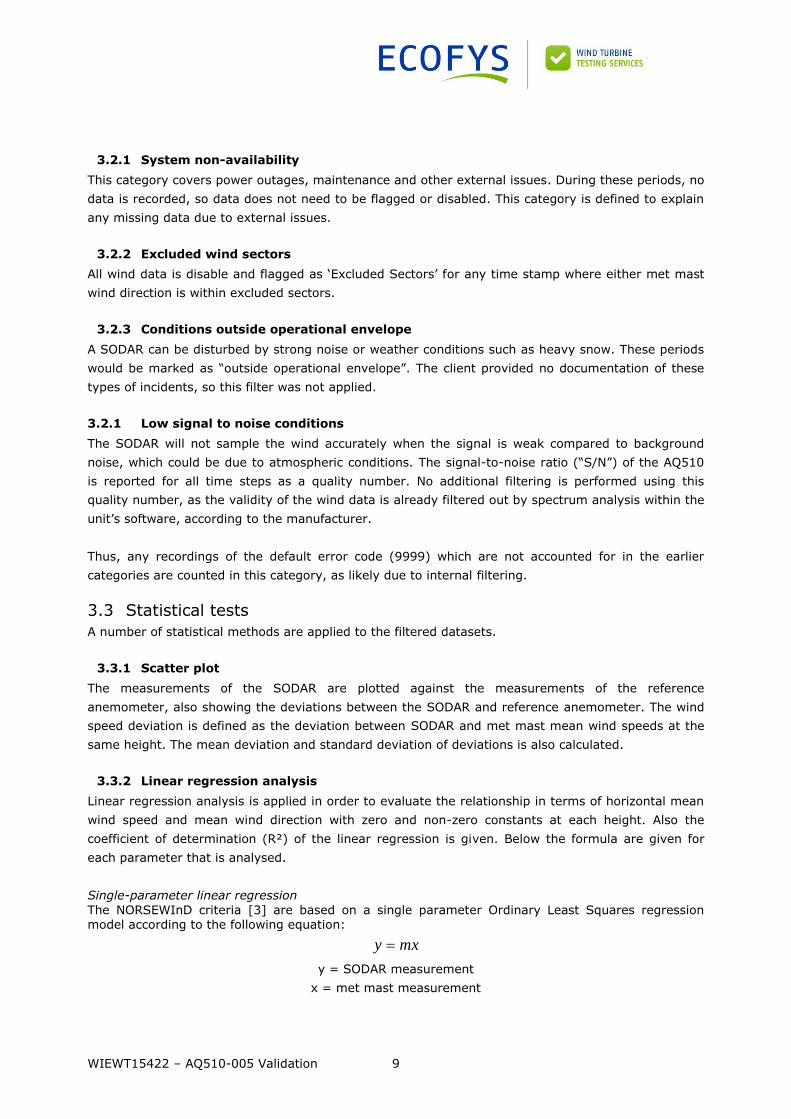
A comparison of the wind speed ratios between instruments at the same height (as per
recommendations in [2]) found that the proposed exclusion sectors were appropriate at 100.9 m,
while a wider sector was justified for winds from the southeast for the two lower heights (60 m and
80 m). The exclusion sector was increased by 10°, covering 117º to 167º, as shown in Figure 4.
For each disturbed anemometer, the data from the excluded sector was discarded. A single
measurement dataset was derived at each mast measurement height by averaging the remaining
wind speeds recorded by both anemometers. This approach minimises any mast effects on the
measurements.
Figure 4: Ratio of wind speeds at 80 m (A2 / A2_2) and the excluded sectors due to mast shadow
The obstacle assessment provided by the client [5] does not exclude any sectors, but highlights
possible effects from the forestry to the northwest of the site. An in-situ comparison of the met mast
and AQ510 wind speed recordings showed no significant direction-wise trends that would indicate
further filtering is necessary, as shown in Figure 5. Thus, no wind direction sectors are excluded.

WIEWT15422 – AQ510-005 Validation 7
Figure 5: Ratio of wind speeds at 100.9 m (met mast / AQ510) shows no direction-wise trends

WIEWT15422 – AQ510-005 Validation 8
3 SODAR Validation Procedure
The SODAR data will be compared to the met mast data on the basis of 10 minute averages.
To increase the accuracy and repeatability of the validation test, the datasets are filtered according to
filtering criteria described below. The filtering is carried out in Windographer using flag rules to
disable data.
The filtered data forms the basis for the data analysis, based on the NORSEWInD SODAR validation
criteria [3]. All data analysis techniques are described in Section 3.3, and are performed in Excel.
3.1 Met Mast Data Filtering
The met mast dataset is filtered according to the following protocols:
3.1.1 System non-availability
This category covers power outages, maintenance and other external issues. During these periods, no
data is recorded, so data does not need to be flagged or disabled. This category is defined to explain
any missing data due to external issues.
3.1.2 Wind direction recordings
Wind direction measurements are linked to the nearest wind speed measurement height. Therefore,
wind vane D1 (at 55 m) is linked to anemometers A1 & A1_2 (60 m), wind vane D2 (75 m) is linked
to A2 & A2_2 (80 m) and wind vane D3 (97 m) is liked to A3 & A4 (100.9 m).
3.1.3 Wind speed intercomparison
Wind speed recordings of the co-located anemometers at each height are compared against one
another. Time periods in which the two anemometers deviate more than 0.5 m/s are disabled and
flagged as ‘Outside operational envelope’. The accompanying wind direction is also disabled.
3.1.4 Icing of instruments
During sub-zero temperatures, all met mast instruments including cup-anemometer data will be
checked for icing by inter-comparison with other heights and checks for constant output during frost.
In case suspicion of icing exists, all data will be disabled and flagged as ‘Outside operational
envelope’.
3.1.5 Excluded wind sectors
The wind speeds are filtered and averaged, based on the measured wind direction, as described in
Section 2.6.
3.2 SODAR Data Filtering
The SODAR dataset is filtered according to the following protocols:
WIEWT15422 – AQ510-005 Validation 9
3.2.1 System non-availability
This category covers power outages, maintenance and other external issues. During these periods, no
data is recorded, so data does not need to be flagged or disabled. This category is defined to explain
any missing data due to external issues.
3.2.2 Excluded wind sectors
All wind data is disable and flagged as ‘Excluded Sectors’ for any time stamp where either met mast
wind direction is within excluded sectors.
3.2.3 Conditions outside operational envelope
A SODAR can be disturbed by strong noise or weather conditions such as heavy snow. These periods
would be marked as “outside operational envelope”. The client provided no documentation of these
types of incidents, so this filter was not applied.
3.2.1 Low signal to noise conditions
The SODAR will not sample the wind accurately when the signal is weak compared to background
noise, which could be due to atmospheric conditions. The signal-to-noise ratio (“S/N”) of the AQ510
is reported for all time steps as a quality number. No additional filtering is performed using this
quality number, as the validity of the wind data is already filtered out by spectrum analysis within the
unit’s software, according to the manufacturer.
Thus, any recordings of the default error code (9999) which are not accounted for in the earlier
categories are counted in this category, as likely due to internal filtering.
3.3 Statistical tests
A number of statistical methods are applied to the filtered datasets.
3.3.1 Scatter plot
The measurements of the SODAR are plotted against the measurements of the reference
anemometer, also showing the deviations between the SODAR and reference anemometer. The wind
speed deviation is defined as the deviation between SODAR and met mast mean wind speeds at the
same height. The mean deviation and standard deviation of deviations is also calculated.
3.3.2 Linear regression analysis
Linear regression analysis is applied in order to evaluate the relationship in terms of horizontal mean
wind speed and mean wind direction with zero and non-zero constants at each height. Also the
coefficient of determination (R²) of the linear regression is given. Below the formula are given for
each parameter that is analysed.
Single-parameter linear regression
The NORSEWInD criteria [3] are based on a single parameter Ordinary Least Squares regression model according to the following equation:
mxy
y = SODAR measurement
x = met mast measurement
WIEWT15422 – AQ510-005 Validation 10
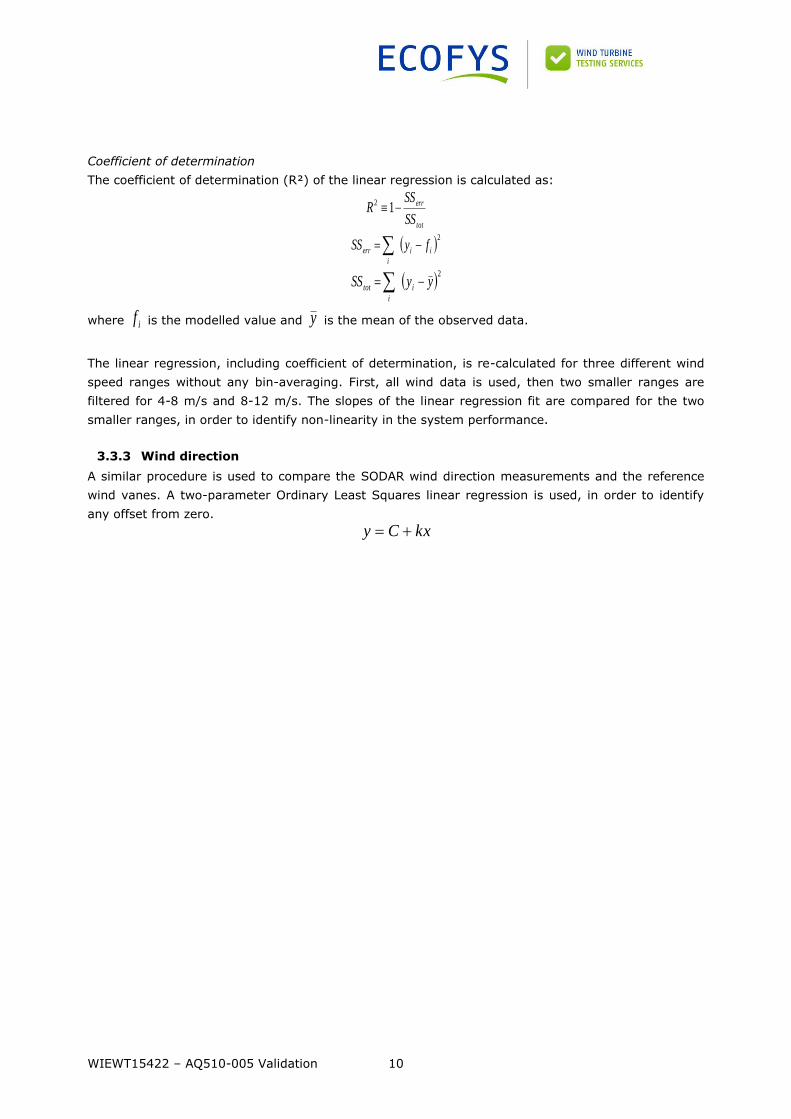
Coefficient of determination
The coefficient of determination (R²) of the linear regression is calculated as:
tot
err
SS
SSR 12
2
i
iierr fySS
2
i
itot yySS
where if is the modelled value and y is the mean of the observed data.
The linear regression, including coefficient of determination, is re-calculated for three different wind
speed ranges without any bin-averaging. First, all wind data is used, then two smaller ranges are
filtered for 4-8 m/s and 8-12 m/s. The slopes of the linear regression fit are compared for the two
smaller ranges, in order to identify non-linearity in the system performance.
3.3.3 Wind direction
A similar procedure is used to compare the SODAR wind direction measurements and the reference
wind vanes. A two-parameter Ordinary Least Squares linear regression is used, in order to identify
any offset from zero.
kxCy

WIEWT15422 – AQ510-005 Validation 11
4 Results & Discussion
The results for the AQ510-005 validation are presented below. The data coverage is shown, followed
by linear regression of the wind speed and direction measurements.
4.1 Data coverage
The data filtering (described in the previous chapter) reduced only about 1% of the measured data,
as seen in Table 6. The disabled data was due to internal filtering of the SODAR (error codes of
9999), likely indicating low signal-to-noise conditions.
Table 6: Number of valid data points before and after filtering
Height [m]
Number of data points
Before filtering After filtering
SODAR Met
mast SODAR
Met mast
60 2,016 2,016 2,001 2,016
80 2,016 2,016 1,959 2,016
100.9 2,016 2,016 1,989 2,016
150 2,016 - 1,965 -
200 2,016 - 1,867 -
Table 7: Number of data points flagged for each filtering criteria for each height
Height [m]
System non-availability
Excluded wind sectors
Conditions outside operational envelope /
Wind speed inter-comparison
Icing / Low signal-to-
noise
SODAR Met
mast SODAR
Met mast
SODAR Met
mast SODAR
Met mast
60 0 0 0 0 0 0 15 0
80 0 0 0 0 0 0 57 0
100.9 0 0 0 0 0 0 27 0
150 0 0 0 0 0 0 51 0
200 0 0 0 0 0 0 149 0

WIEWT15422 – AQ510-005 Validation 12
4.2 Absolute Error
As a minimum criteria, no more than 10% of the calculated Absolute Errors should exceed 0.5m/s.
From the 1,989 concurrent measured points at 100.9 m, after filtering, 6.6% of the data was left
which had a difference greater than 0.5 m/s, as shown in Table 8 and Figure 6. Therefore, the
Absolute Error criterion is satisfied.
Table 8: Evaluation of absolute error over 0.5m/s at 100.9 m
WS 100.9 m
ABS[SODAR-Mast] > 0.5 m/s % total error points 6.6%
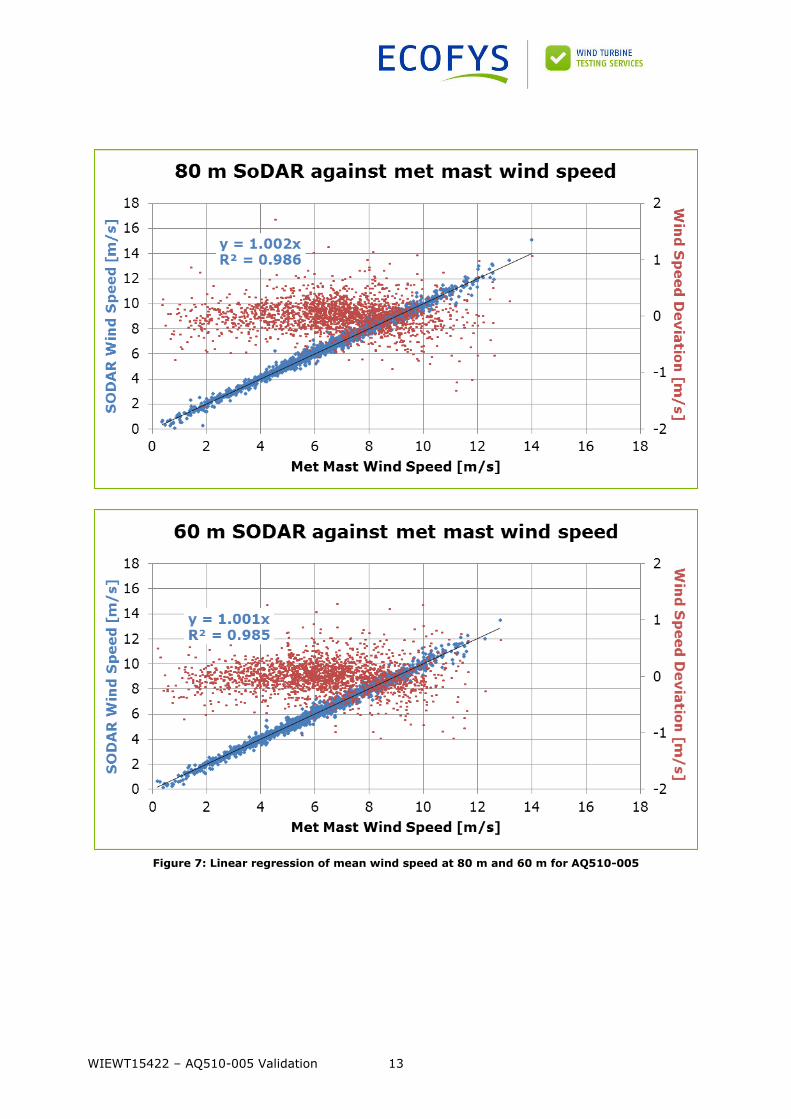
4.3 Linear Regression of Wind Speed
The mean wind speed measured by the SODAR is compared to the concurrent met mast
measurements in a scatter plot (see Figure 6 and Figure 7) and a single parameter Ordinary Least
Squares (OLS) linear regression is applied. The slope of the linear regression and the corresponding
coefficients of determination (R²) are shown. The wind speed deviation is defined as the SODAR
mean wind speed minus the met mast mean wind speed. The corresponding slopes and correlation
coefficients are shown in Table 9. The plots show excellent correlation between the SODAR and met
mast wind speed measurements.
Figure 6: Linear regression of mean wind speed at 100.9 m for AQ510-005
WIEWT15422 – AQ510-005 Validation 13
Figure 7: Linear regression of mean wind speed at 80 m and 60 m for AQ510-005

WIEWT15422 – AQ510-005 Validation 14
4.4 Linear Regression of Wind Direction
Similarly, a linear fit is applied to scatter plots of the wind direction, as shown in Figure 8. A two-
parameter Ordinary Least Squares linear regression is used, in order to identify any offset from zero,
with slopes, offsets and coefficients of determination (R²) plotted in the graphs.
The correlation between SODAR and met mast wind direction is generally very good, with a few
major outliers which reduce the quality of the correlation, as seen in Figure 8. Still, the slope is close
to unity and the offset is about +5° at 97 m that is within the mounting uncertainty of the SODAR
and wind vanes. Thus, there is no apparent offset.
Figure 8: Linear regression of mean wind direction at 97 m for AQ510-005

WIEWT15422 – AQ510-005 Validation 15
4.5 NORSEWInD criteria validation
The collected valid data points are validated against the NORSEWIND criteria outlined in Section 1.1.
The results are shown in Table 9, with passing results highlighted in green, failing results in red and
marginal passes shown in orange. A marginal pass is a result that deviates from the criteria by a
small amount.
The validation of AQ510-005 shows that this device meets most of the NORSEWInD criteria.
However, the correlation coefficients for the limited wind speed ranges (4-8 m/s and 8-12 m/s) are
below the NORSEWInD threshold. The excellent correlation for the entire dataset indicates that there
are no underlying issues with the SODAR, and that these deviations could be due to the statistical
limitations of a small sample or due to atmospheric conditions (the relatively short measurement
period means that data can be highly correlated). The overall high correlations and excellent linear
regression fit indicate that the SODAR is functioning properly, with high accuracy.
Table 9: NORSEWInD criteria analysis for AQ510-005
Criteria Category Threshold 100.9 m 80 m 60 m
Number of valid data points
4-8m/s >200 1,017 1,174 1,262
8-12 m/s >200 751 580 422
ALL >600 1,989 1,998 2,001
Absolute error <10% 6.6% 7.1% 6.3%
Linear
regression slope
4-8m/s 0.98-1.01 1.002 1.007 1.005
8-12 m/s 0.98-1.01 0.997 0.998 0.997
Variation in slope
<0.015 0.004 0.004 0.004
ALL 0.98-1.01 0.999 1.002 1.001
Linear regression – R2
4-8m/s >0.98 0.942 0.946 0.944
8-12 m/s >0.98 0.914 0.895 0.877
ALL >0.98 0.987 0.986 0.985

WIEWT15422 – AQ510-005 Validation 16
5 Conclusion
On request of AQSystem, Ecofys Wind Turbine Testing Services (WTTS) carried out the validation
analysis of an AQ510 SODAR (AQ510-005) against the reference Fimmerstad met mast. The
measurement campaign was performed by AQSystem.
The 103 m guyed mast is IEC-compliant and equipped with high-quality cup anemometers at 60, 80
and 100.9 m, with wind vanes at 55, 75 and 97 m. The SODAR was collecting wind data at 33
altitudes including six common heights with the met mast (55, 60, 75, 80, 95 and 100 m).
The validation measurement campaign was performed by the client. Raw data was provided, without
any processing, along with documentation of the test setup and campaign. The SODAR validation
campaign lasted from 05/10/2014 to 18/10/2014. Ecofys WTTS considers that the provided data and
documents are sufficient as a basis for this validation analysis.
All measured data was filtered to ensure entirely valid datasets. A sufficient amount of data was
collected for the SODAR: a minimum number of 600 concurrent data points from the valid sectors
and at least 200 data points in each of the two wind speed ranges: 4-8 m/s and 8-12 m/s.
Linear regression between the overall SODAR and met mast recordings showed consistent, highly-
correlated measurements with slopes near unity for all common measured heights both for wind
speed and wind direction.
The SODAR measurements were validated against NORSEWInD criteria [3] which stipulate thresholds
for the quality of the correlation. The AQ510-005 meets most of the NORSEWInD criteria for the
overall valid data. However, for the limited wind speed sub-ranges, namely 4-8 m/s and 8-12 m/s,
the correlation of the SoDAR and the met mast is lower than the NORSEWInD criterion threshold,
which may be due to the short duration of the test. The overall high correlations and excellent linear
regression fit indicate that the SODAR is functioning properly with high accuracy.
As a result of this test, Ecofys WTTS judges that the SODAR AQ510-005 is suitable for field
measurements as a replacement of cup anemometers in flat terrain. It is recommended to quantify
the uncertainty of the wind speed measurements in a longer verification campaign against a
reference met mast.
WIEWT15422 – AQ510-005 Validation 17
References
[1] IEC 61400-12-1 (ed 1.0), 2005, ‘Wind turbines – Part 12-1: Power performance
measurements of electricity producing wind turbines’
[2] IEC, IEC 61400-12-1 Ed. 2 (642/DCV) ‘Committee Draft - Power performance
measurements of electricity producing wind turbines’, 2013
[3] Kindler, D., Courtney, M., Oldroyd, A., 2009, ‘Testing and calibration of various SODAR
remote sensing devices for a 2 year offshore wind measurement campaign’, EWEC 2009
[4] Hansson, J., Rodén, S-O., 2014-03-19, 'Description of the Fimmerstad met mast and
surroundings', AQSystem 121101-22, rev 9
[5] Stein, D., Beeken, A., Frohböse, P., 2013-05-17, 'Technical Conformance of AQS Met Mast
and Test Site in Fimmerstad, Sweden', GLGH-4257 12 10162 267-R-0001-B
[6] Lehtevä, E., 2014-12-09, ‘Installation report - PROD105’, AQSystem
WIEWT15422 – AQ510-005 Validation 18
Appendix A. Calibration certificates of met mast
Top cup-anemometer A1 at 60 m

WIEWT15422 – AQ510-005 Validation 19
Cup-anemometer A1_2 at 60 m

WIEWT15422 – AQ510-005 Validation 20
Cup-anemometer A2 at 80 m

WIEWT15422 – AQ510-005 Validation 21
Cup-anemometer A2_2 at 80 m
WIEWT15422 – AQ510-005 Validation 22
Cup-anemometer A3 at 100.9 m

WIEWT15422 – AQ510-005 Validation 23
Cup-anemometer A4 at 100.9 m

ECOFYS WTTS B.V. | Kanaalweg 15G | 3526 KL Utrecht| T +31 (0)30 662-3827 | E [email protected] | I www.ecofyswtts.com
ECOFYS WTTS B.V.
Kanaalweg 15G
3526 KL Utrecht
T: +31 (0) 30 662-3300
F: +31 (0) 30 662-3301
I: www.ecofyswtts.com
ECOFYS WTTS B.V.
Kanaalweg 15G
3526 KL Utrecht
T: +31 (0) 30 662-3827
I: www.ecofyswtts.com