soe-lc cr clinical field experiences part i design of … · design of teacher preparation programs...
TRANSCRIPT

Schools of EducationLearning Collaborative
Design of Teacher Preparation ProgramsSuccessful Management and Integration of Clinical E xperiences
Collaborative ResearchPart 1 of 3
Catalog No. 13SOECRI0910September 2010

Design of Teacher Preparation ProgramsSuccessful Management and Integration of Clinical E xperiences
TABLE OF CONTENTS
Executive Summary 2
About This Study 7
Drivers Behind the Study 8
Collaborative Study Background 12
© 2010 Eduventures, Inc. 2
Respondent Demographics 14
Findings 15
Perceptions of Current Practice 15
Funding the Field Experience 18
Contending with Challenges 24
Supporting and Rewarding Cooperating Teachers 31
Benchmarking Key Indicators of Elementary Education Programs 36
Conclusion & Recommendations 49
Executive Summary
Schools of education (SOEs) report satisfaction wit h the quality of their approaches to the clinical and field experiences as well as deep relationships with cooperating teachers.
• Respondents report that in their largest preparation programs for elementary teacher education, candidates are required to spend an average of 15 weeksstudent teaching. This translates to 433 hours (master’s degrees programs) and 551 hours (bachelor’s degree programs). This amount of field experience hours well exceeds the 2009 NCATE Blue Ribbon Panel’s suggested length of student teaching experiences.
© 2010 Eduventures, Inc. 3
• In describing the strengths of their programs, many respondents also remarked on their programs’ careful design to build teacher candidates’ skills and knowledge and exposure to diverse classrooms and learners.
• SOEs that describe higher satisfaction with the qua lity of their cooperating teachers are more likely to describe higher satisfa ction with the quality of the overall field experience , underscoring the importance of recruiting and retaining high quality cooperating teachers.
Despite criticism, the majority of schools of educa tion have lengthy field experiences that encompass a high number of pre-certification clinical hours. In addition, high
percentages of students are placed in diverse setti ngs.

Executive Summary
The cost of the clinical component explains why it is oftentimes more expensive to educate a teacher education student as opposed to students in other fields. SOEs largely expend funds to staff th e administration of quality field experiences and rely upon teacher candidates’ tuition and state appropriations (in the case of Publics) for funding .
• SOEs report spending an average of $3,965 and median of $1,652 per initial teacher candidate . The majority of expenditures is spent on university staffing.
• At private universities, funding sources are largely student tuition-based; at public universities, they draw from a mixture of student tuition, state budget allocation,
© 2010 Eduventures, Inc. 4
universities, they draw from a mixture of student tuition, state budget allocation, and grant monies.
In addition, there are clear financial implications for deepening or lengthening the field experience further. Private universities wou ld likely need to pass on increased costs to students, and education students are a cos t-sensitive group. State budget cuts that filter down to reduced state appropriatio ns may affect the ability of public SOEs to fund the field experience—this in a time whe n policymakers are calling for
increased clinical time.
Smaller SOEs may want to consider partnering with e ach other to execute the clinical component, as there appears to be fina ncial and operational benefits.
• Overall, per-candidate spending is lower at research universities and larger universities, suggesting that economies of scale pay off .
• Over four in ten (43%) institutions indicated that “strong competition against other universities for placement” is a challenge they face, and private institutions are twice as likely to report competition against other universities for placement as a challenge (63%) in implementing the clinical
Executive Summary
© 2010 Eduventures, Inc.
universities for placement as a challenge (63%) in implementing the clinical experience compared to public institutions (30%).
5
There may be value in partnering with other institu tions to place student teachers in order to contain costs and preserve quality. Of cour se, the logistics are complex and
would require close attention.

Almost 2/3 of SOE’s clinical experience expenditure s are devoted to university faculty/staff, while a small percentage is devoted to compensation and support for cooperating teachers. Data indicates that there could be value in greater investments in trai ning and support.
• At least one-third of responding universities indicated facing challenges in having cooperating teachers and principals understand university curriculum and philosophy, identifying high quality cooperating teachers, and competing against other SOEs for placement spots.
• Many SOEs rely on a handbook to disseminate important information to
Executive Summary
© 2010 Eduventures, Inc.
• Many SOEs rely on a handbook to disseminate important information to cooperating teachers.
• To thank cooperating teachers for their time, SOEs provide an average payment of $238 for student teaching and most frequently send thank you letters for the early field experience.
6
Teacher mentorship training can be more strongly bu ilt into the cooperating teacher role. Schools of education might consider offering professional development
seminars or sessions that allow cooperating teacher s to interact with university faculty in order to better streamline communication and to openly discuss philosophy
and course requirements.
Design of Teacher Preparation ProgramsSuccessful Management and Integration of Clinical E xperiences
TABLE OF CONTENTS
Executive Summary 2
About This Study 7
Drivers Behind the Study 8
Collaborative Study Background 12
© 2010 Eduventures, Inc. 7
Respondent Demographics 14
Findings 15
Perceptions of Current Practice 15
Funding the Field Experience 18
Contending with Challenges 24
Supporting and Rewarding Cooperating Teachers 31
Benchmarking Key Indicators of Elementary Education Programs 36
Conclusion & Recommendations 49

Field Experiences Are Expected to be Carefully Desi gned to Develop Candidates’ Skills and Instructional Practices, But Implementation is Inconsistent
NCATE Description of Target
Collaborationbetween Unit and School Partners
Both unit and school-based faculty are involved in designing, implementing, and evaluating the unit’s conceptual framework and the school program; they each participate in the unit’s and the school partners’ professional development activities and instructional programs for candidates and for children. The unit and its school partners share expertise and integrate resources to support candidate learning.
Description of NCATE Standard 3, Clinical and Field Experiences
Drivers Behind the Study
© 2010 Eduventures, Inc. 8
Design, Implementationand Evaluation
Both field experiences and clinical practice extend the unit’s conceptual framework into practice through modeling by clinical faculty and well designed opportunities to learn through doing… Candidates are members of instructional teams in the school and are active participants in professional decisions. They are involved in a variety of school-based activities directed at the improvement of teaching and learning, such as collaborative projects with peers, using information technology, and engaging in service learning.
Developmentand Demonstration of Knowledge, Skills, and Dispositions
Candidates work collaboratively with other candidates and clinical faculty to critique and reflect on each others’ practice and their effects on student learning with the goal of improving practice... Candidates develop and demonstrate proficiencies that support learning by all students as shown in their work with students with exceptionalities and those from diverse ethnic/racial, linguistic, gender, and socioeconomic groups in classrooms and schools.
Source: NCATE Unit Standards, http://www.ncate.org/public/unitStandardsRubrics.asp?ch=4#stnd3

There are Calls for Changes in Practice and Standar dization in Clinical Field Experiences, Including from AACTE an d the NCATE Blue Ribbon Panel
Suggested Fieldwide Changes Include:
All teacher candidates should receive substantial and appropriate clinical preparation prior to becoming teachers of their own record in their own classrooms:
•Minimum of 1 semester of 450+ hours of clinical practice•1 full year of full-time clinical practice – 30 weeks of 900 hours – is
Drivers Behind the Study
© 2010 Eduventures, Inc. 9
•1 full year of full-time clinical practice – 30 weeks of 900 hours – is recommended
School districts and universities should jointly design and supervise strong clinical practice collaborations.
Clinical teachers shouldbe trained.
Clinical teachers should have at least 3 years of teachingexperience.
States should offer incentives to schools that actas clinical settings.
Source: AACTE. 2009. “The Clinical Preparation of Teachers: A Policy Brief.”
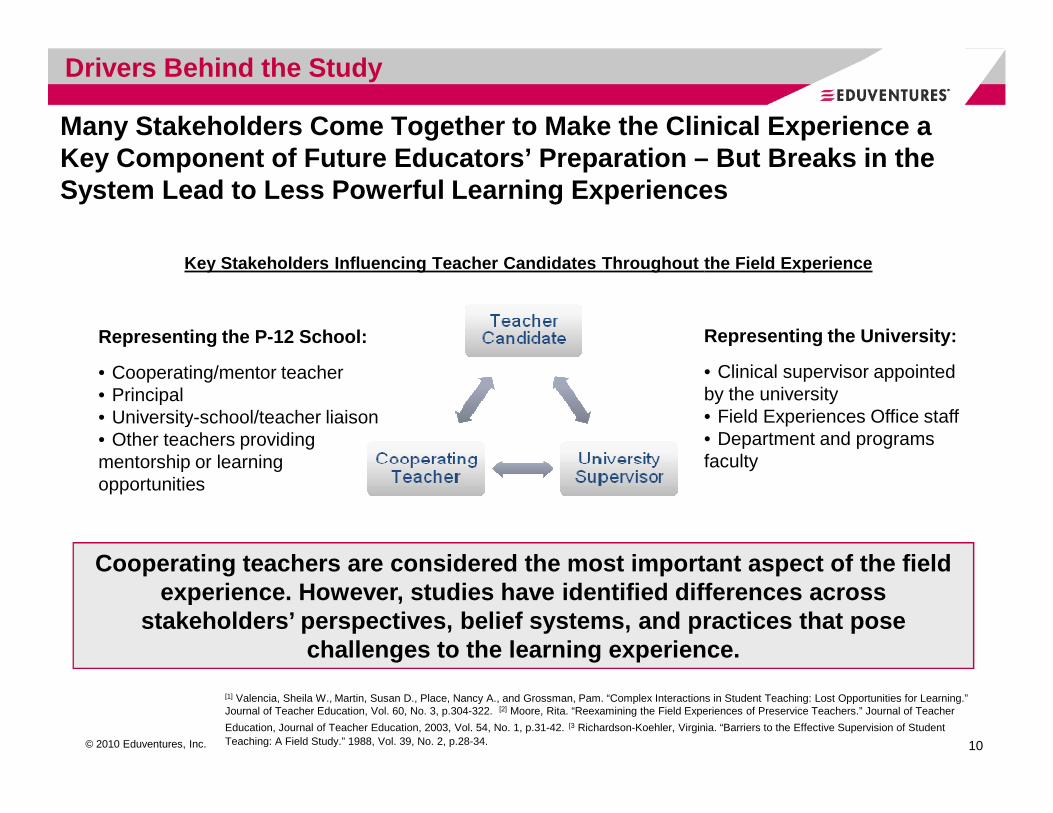
Representing the P-12 School:
• Cooperating/mentor teacher• Principal• University-school/teacher liaison
Many Stakeholders Come Together to Make the Clinica l Experience a Key Component of Future Educators’ Preparation – But Breaks in the System Lead to Less Powerful Learning Experiences
Representing the University:
• Clinical supervisor appointed by the university• Field Experiences Office staff
Key Stakeholders Influencing Teacher Candidates Thr oughout the Field Experience
Drivers Behind the Study
© 2010 Eduventures, Inc.
• University-school/teacher liaison• Other teachers providing mentorship or learning opportunities
10
• Field Experiences Office staff• Department and programs faculty
[1] Valencia, Sheila W., Martin, Susan D., Place, Nancy A., and Grossman, Pam. “Complex Interactions in Student Teaching: Lost Opportunities for Learning.” Journal of Teacher Education, Vol. 60, No. 3, p.304-322. [2] Moore, Rita. “Reexamining the Field Experiences of Preservice Teachers.” Journal of Teacher
Education, Journal of Teacher Education, 2003, Vol. 54, No. 1, p.31-42. [3 Richardson-Koehler, Virginia. “Barriers to the Effective Supervision of Student Teaching: A Field Study.” 1988, Vol. 39, No. 2, p.28-34.
Cooperating teachers are considered the most important aspect of the field experience. However, studies have identified differ ences across
stakeholders’ perspectives, belief systems, and pra ctices that pose challenges to the learning experience.

There Are Some Common Criticisms About Clinical Fie ld Experiences That This Study Sought to Explore
Common Criticisms• Teacher candidates and cooperating teachers are “thrown together” • Clinical and field experiences are haphazardly designed, especially the practicum or
early field experience• There is a divide between university-based teacher preparation and schools’
practices that needs to be bridged
There is a dearth of recent quantitatively-oriented research on the types and
Drivers Behind the Study
© 2010 Eduventures, Inc. 11
There is a dearth of recent quantitatively-oriented research on the types and level of support that cooperating teachers are providing to teacher candidates and also receiving from universities. As such, this study tests to what degree:• Cooperating teachers are well supported in providing mentorship to their
candidates and have positive relationships with universities• Cooperating teachers are recognized for their time and efforts• Teacher candidates are viewed as well prepared by the end of clinical
experiences• Amount of coursework compares to clinical practice in teacher preparation
programs
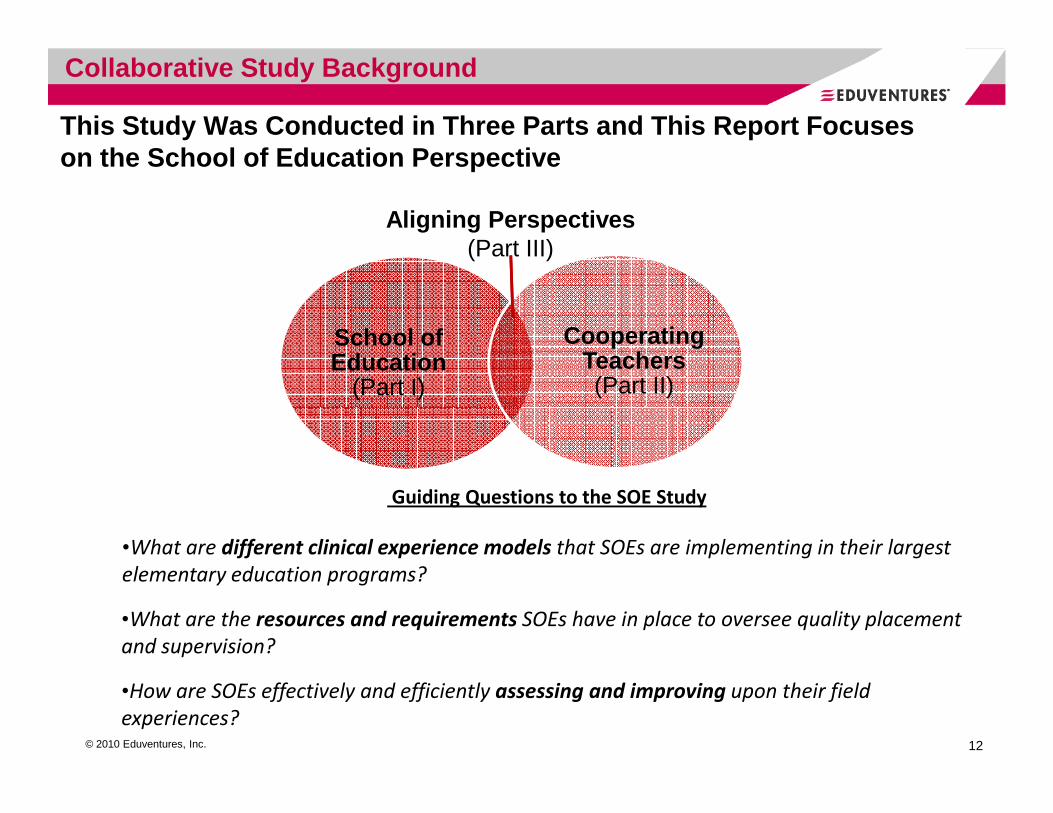
This Study Was Conducted in Three Parts and This Re port Focuses on the School of Education Perspective
Collaborative Study Background
School of Education
(Part I)
Cooperating Teachers(Part II)
Aligning Perspectives (Part III)
© 2010 Eduventures, Inc. 12
Guiding Questions to the SOE Study
•What are different clinical experience models that SOEs are implementing in their largest
elementary education programs?
•What are the resources and requirements SOEs have in place to oversee quality placement
and supervision?
•How are SOEs effectively and efficiently assessing and improving upon their field
experiences?

AACTE and Eduventures SOE-LC Member Institutions We re Asked to Answer a Brief Survey in June 2010 Regarding the Fo llowing Areas
Institutional Characteristics• Control of institution• Location• Number of programs and candidates
Selection Process and Support Offered
Innovative Models• Types of models in use• Reasons why it is considered
innovative
Collaborative Study Background
© 2010 Eduventures, Inc.
Selection Process and Support Offered• Requirements of cooperating teachers
and supervisors • Screening process• Training supports provided• Benefits the university provides• Activities the cooperating teacher is
expect to engage in
13
Through this survey, Eduventures staff aimed to identify current practices and benchmarks to inform future directions in clinical practice. Although the sample is sizeable, it is not a representative sample. Eduventures staff tested for differences in responses by institutional characteristics, such as location of institution, control of institution, and number of teachers’ prepared.

Leaders at 73 Institutions Completed the Survey; Mo st Have NCATE Accredited Programs and the Largest Percentage are Research Universities
• 56% public, 44% private institutions, including one private for-profit university
• Research universities (41%) and baccalaureate colleges (36%)
• NCATE accredited or seeking NCATE accreditation (75%)
Research
Universities,
41%Baccalaureate
Colleges, 36%
Special
Universities,
16%
Respondents by Carnegie Classification (2005)
65% of research universities are public
Respondent Demographics
© 2010 Eduventures, Inc. 14
Master's
Colleges and
Universities,
7%
53% of baccalaureate universities are public
Responding Institutions’ Program Size
• Main campuses in urban (39%) and suburban (38%) settings; there are slightly higher percentage of respondents from the Great Lakes (22%) and Southeast (22%) region
• In 2008-2009, responding institutions prepared an average of 246 teachers at the initial certification level through 13 initial teacher education programs
Number of: Mean Min Max
Teachers prepared across
all programs leading to
initial certification
(2008-2009):
246 11 986
Programs that lead to
traditional certification:13.5 1 51
Programs that lead to
non-traditional
certification:
3 0 43

Design of Teacher Preparation ProgramsSuccessful Management and Integration of Clinical E xperiences
TABLE OF CONTENTS
Executive Summary 2
About This Study 7
Drivers Behind the Study 8
Collaborative Study Background 12
© 2010 Eduventures, Inc. 15
Respondent Demographics 14
Findings 15
Perceptions of Current Practice 15
Funding the Field Experience 18
Contending with Challenges 24
Supporting and Rewarding Cooperating Teachers 31
Benchmarking Key Indicators of Elementary Education Programs 36
Conclusion & Recommendations 49

The Majority of Responding Teacher Education Instit utions Report Satisfaction with Their Field Experience Model
Perceptions of Current Practice
• Eight in Ten Institutions Report Satisfaction with the Current Quality of Their Field Experience Design and Execution
Average Rated Satisfaction with Quality of Field Ex perience Design & Execution, by 2005 Carnegie Classification
University Type N Satisfaction with Quality
“On a scale of ‘1’ to ‘5,’ with ‘5’ being very satisfied, how satisfied are you with the quality of your field experience’s design and execution and your school of education?
© 2010 Eduventures, Inc. 16
There is a disconnect between general calls for cha nge and improvement in clinical practice and SOE leaders’ perceptions of the qualit y of their current practice.
Furthermore, data outlined in this report indicates that many SOE’s have field experiences models that offer longer clinical experiences than the minimum recommended guidelines.
University Type N Satisfaction with Quality
Research Universities 29 3.93
Master's Colleges and Universities 5 4.40
Baccalaureate Colleges 26 3.92
Special Universities 12 4.08
Overall 72 3.99

Schools of Education That Report a Strong Relations hip with Their Cooperating Teachers are More Likely to be Satisfie d With the Clinical Practice
Perceptions of Current Practice
30%
40%
50%
60%
70%
Dep
th o
f the
Rel
atio
nshi
p w
ith C
oope
ratin
g Te
ache
rs AverageGoodExcellent
Satisfaction With Clinical Experience, By Depth of Cooperating Teacher Relationship
© 2010 Eduventures, Inc.
High quality cooperating teachers are crucial to ov erall program quality. Institutions that are satisfied with cooperating teachers report cont ending with fewer challenges in
administering field experiences, and they are less likely to report struggling with finding enough high-quality teachers and lacking human reso urces to assist in administering
the clinical experience.17
0%
10%
20%
30%
Very dissatisfied Dissatisfied Neither satisfied nor dissatisfied
Satisfied Very satisfiedDep
th o
f the
Rel
atio
nshi
p w
ith C
oope
ratin
g Te
ache
rs
Satisfaction of Overall Quality of the Clinical Com ponent

Design of Teacher Preparation ProgramsSuccessful Management and Integration of Clinical E xperiences
TABLE OF CONTENTS
Executive Summary 2
About This Study 7
Drivers Behind the Study 8
Collaborative Study Background 12
© 2010 Eduventures, Inc. 18
Respondent Demographics 14
Findings 15
Perceptions of Current Practice 15
Funding the Field Experience 18
Contending with Challenges 24
Supporting and Rewarding Cooperating Teachers 31
Benchmarking Key Indicators of Elementary Education Programs 36
Conclusion & Recommendations 49

Though SOEs’ Reported Expenditures on Candidates’ C linical Practice Varies Widely Between Institutions, It is Clearly Expensiv e to Implement High Quality Field Experiences
Funding the Field Experience
• Schools of education describe average expenditures of $557,000 and median expenditures of $364,750 to support fiel d experiences.
• Schools of Education estimate spending an average of $3,965 and median of $1,652 per initial teacher candidate on clinical field experiences.
Custom Analysis Opportunity: How does your SOE’s expenditures
© 2010 Eduventures, Inc. 19
This data demonstrates what Deans already know—It is expensive to prepare a teacher education student. In a fiscally tight environment, SOEs, like other
university units, are looking to increase efficiencies. A large portion of SOEs’ budgets is devoted to staff who maintain quality field experiences and candidate development. Policymakers need to know the costs of funding the clinical and field experience and
the direct impact of cuts on funding clinical components at public institutions.
• Over two-thirds of expenditures are reportedly going to university staffing.
• One-quarter of institutions (25%) are dissatisfied with their current expenditures affiliated with the clinical experience.
compare to peer schools of education?

By Far, the Highest Percentage of Institution’s Cli nical Budgets Go to University Staffing
Other, 14.0%
Average Breakdown of Budget by Expenditure Area
Funding the Field Experience
© 2010 Eduventures, Inc. 20
University
Staff, 66.4%
Cooperating
Teachers,
20.9%
Larger programs are able to keep the proportion of expenses going to of university staff relatively lower than smaller prog rams.
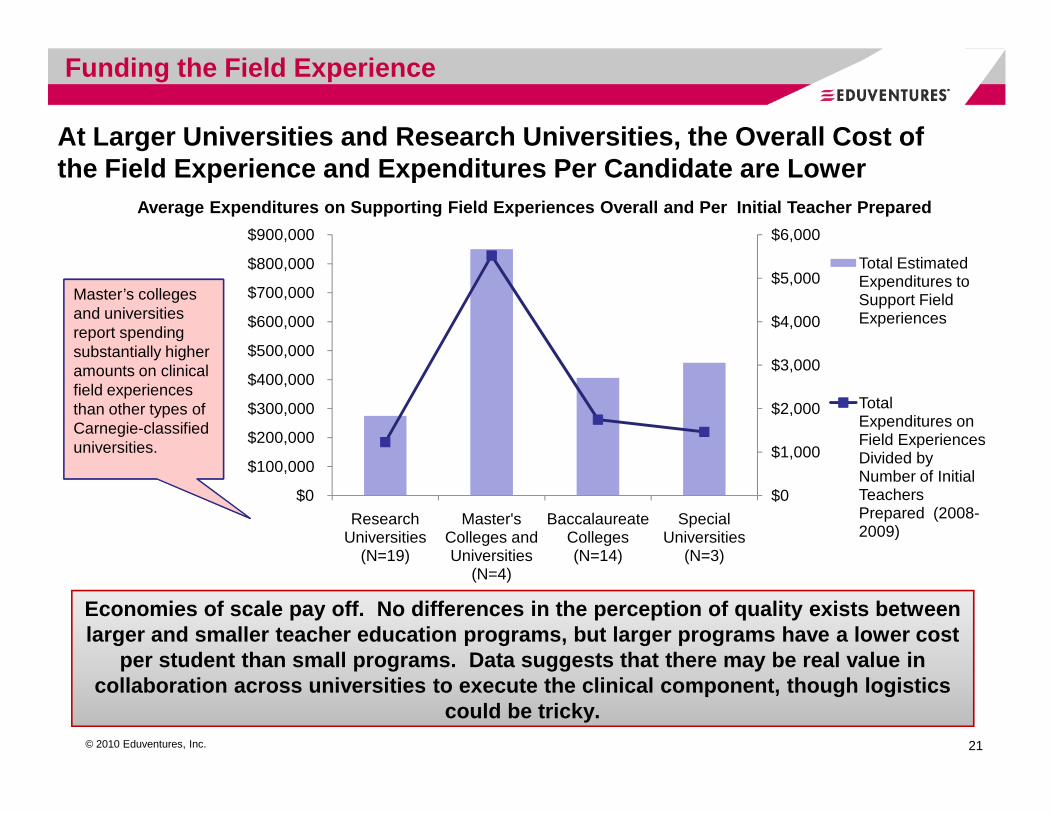
At Larger Universities and Research Universities, t he Overall Cost of the Field Experience and Expenditures Per Candidate are Lower
Average Expenditures on Supporting Field Experience s Overall and Per Initial Teacher Prepared
Funding the Field Experience
Master’s colleges and universities report spending substantially higher amounts on clinical field experiences than other types of $2,000
$3,000
$4,000
$5,000
$6,000
$300,000
$400,000
$500,000
$600,000
$700,000
$800,000
$900,000
Total Estimated Expenditures to Support Field Experiences
Total
© 2010 Eduventures, Inc. 21
than other types of Carnegie-classified universities.
Economies of scale pay off. No differences in the perception of quality exists between larger and smaller teacher education programs, but larger programs have a lower cost
per student than small programs. Data suggests tha t there may be real value in collaboration across universities to execute the cl inical component, though logistics
could be tricky.
$0
$1,000
$2,000
$0
$100,000
$200,000
$300,000
Research Universities
(N=19)
Master's Colleges and Universities
(N=4)
Baccalaureate Colleges (N=14)
Special Universities
(N=3)
Total Expenditures on Field Experiences Divided by Number of Initial Teachers Prepared (2008-2009)
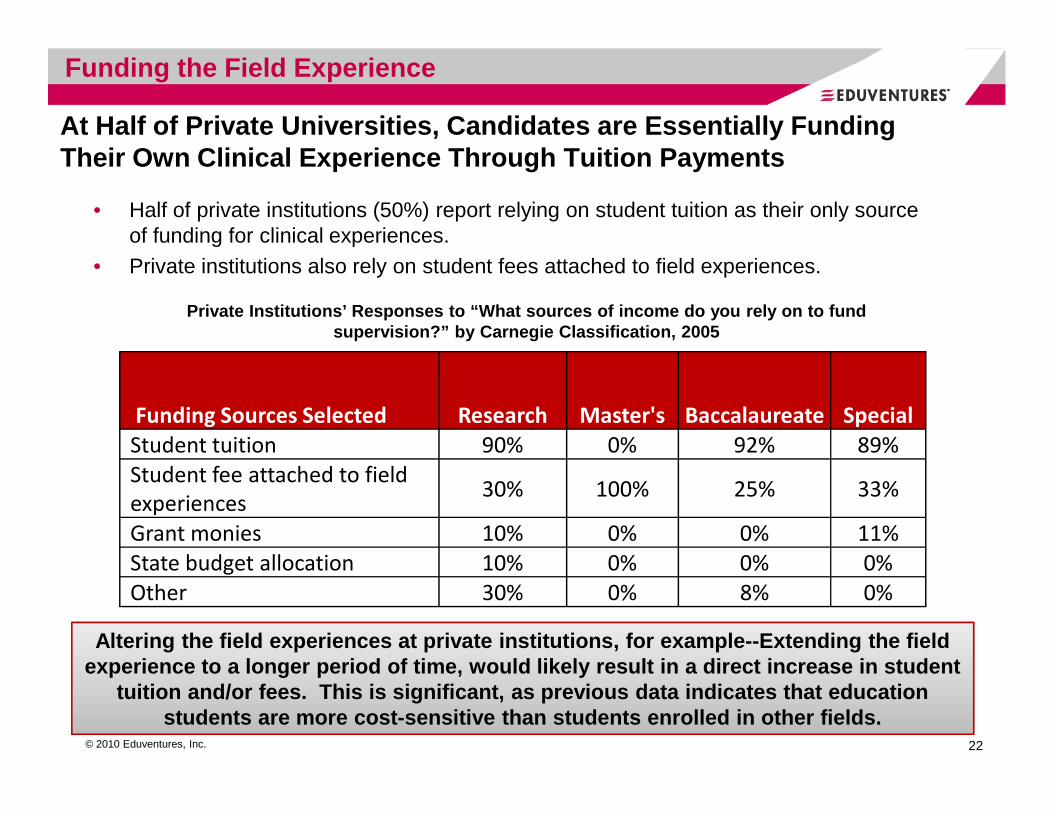
At Half of Private Universities, Candidates are Ess entially Funding Their Own Clinical Experience Through Tuition Payme nts
• Half of private institutions (50%) report relying on student tuition as their only source of funding for clinical experiences.
• Private institutions also rely on student fees attached to field experiences.
Funding Sources Selected Research Master's Baccalaureate Special
Private Institutions’ Responses to “What sources of income do you rely on to fund supervision?” by Carnegie Classification, 2005
Funding the Field Experience
© 2010 Eduventures, Inc. 22
Funding Sources Selected Research Master's Baccalaureate Special
Student tuition 90% 0% 92% 89%
Student fee attached to field
experiences30% 100% 25% 33%
Grant monies 10% 0% 0% 11%
State budget allocation 10% 0% 0% 0%
Other 30% 0% 8% 0%
Altering the field experiences at private instituti ons, for example--Extending the field experience to a longer period of time, would likely result in a direct increase in student
tuition and/or fees. This is significant, as previ ous data indicates that education students are more cost-sensitive than students enro lled in other fields.

In Addition to Student Tuition, Public Schools of E ducation Draw Largely on State Allocations to Fund Clinical Exper iences. Overall, 59% of Public Institutions Rely on State Budget All ocations to Fund the Clinical Component.
Funding Sources Selected
Research Master's Baccalaureate Special
Student tuition 89% 50% 31% 67%
Public Institutions’ Responses to “What sources of i ncome do you rely on to fund supervision?” by Carnegie Classification, 2005
Funding the Field Experience
© 2010 Eduventures, Inc. 23
Student tuition 89% 50% 31% 67%
State budget allocation 53% 50% 31% 33%
Grant monies 16% 75% 85% 0%
Student fee attached to field
experiences16% 50% 46% 67%
Other 16% 75% 92% 67%
State budget cuts to institutions, which filter dow n to SOE budgets, would likely results in a direct impact on the ability of SOE’s to fund a high-quality field experience for teacher education students. In a time when th ere are calls to deepen clinical components of teacher education programs, policymak ers need to clearly understand the implications of state budget cuts on teacher ed ucation programs.

Design of Teacher Preparation ProgramsSuccessful Management and Integration of Clinical E xperiences
TABLE OF CONTENTS
Executive Summary 2
About This Study 7
Drivers Behind the Study 8
Collaborative Study Background 12
© 2010 Eduventures, Inc. 24
Respondent Demographics 14
Findings 15
Perceptions of Current Practice 15
Funding the Field Experience 18
Contending with Challenges 24
Supporting and Rewarding Cooperating Teachers 31
Benchmarking Key Indicators of Elementary Education Programs 36
Conclusion & Recommendations 49
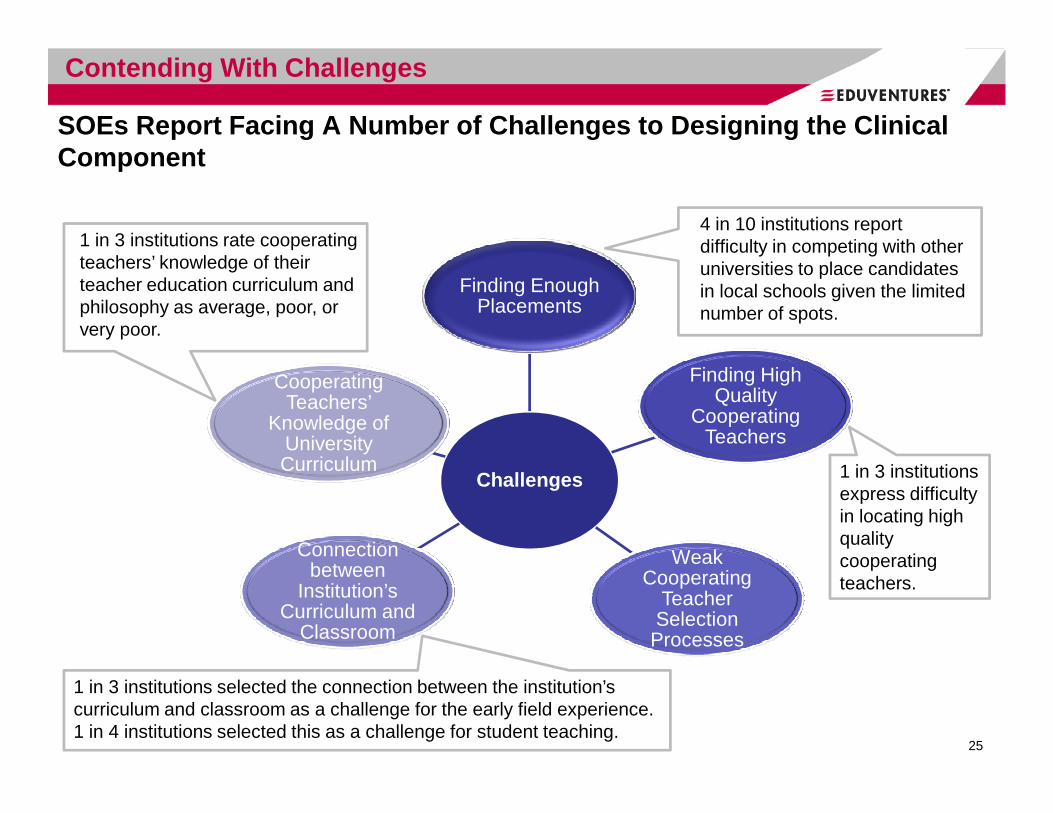
SOEs Report Facing A Number of Challenges to Design ing the Clinical Component
Finding Enough Placements
Finding High Quality
Cooperating
Cooperating Teachers’
Contending With Challenges
1 in 3 institutions rate cooperating teachers’ knowledge of their teacher education curriculum and philosophy as average, poor, or very poor.
4 in 10 institutions report difficulty in competing with other universities to place candidates in local schools given the limited number of spots.
© 2010 Eduventures, Inc. 25
Challenges
Cooperating Teachers
Weak Cooperating
Teacher Selection
Processes
Connection between
Institution’s Curriculum and
Classroom
Teachers’ Knowledge of
University Curriculum
1 in 3 institutions selected the connection between the institution’s curriculum and classroom as a challenge for the early field experience. 1 in 4 institutions selected this as a challenge for student teaching.
1 in 3 institutions express difficulty in locating high quality cooperating teachers.
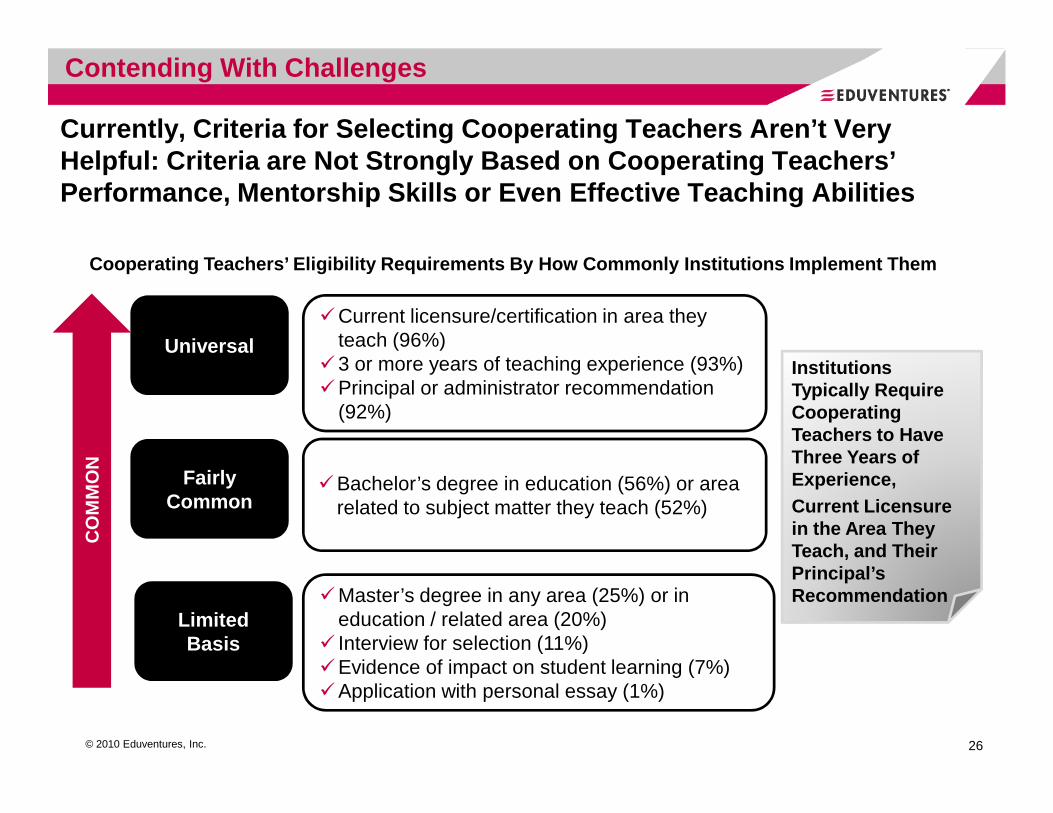
Currently, Criteria for Selecting Cooperating Teach ers Aren’t Very Helpful: Criteria are Not Strongly Based on Coopera ting Teachers’ Performance, Mentorship Skills or Even Effective Te aching Abilities
Universal
�Current licensure/certification in area they teach (96%)
�3 or more years of teaching experience (93%)�Principal or administrator recommendation
(92%)
Institutions Typically Require Cooperating
Cooperating Teachers’ Eligibility Requirements By H ow Commonly Institutions Implement Them
Contending With Challenges
© 2010 Eduventures, Inc. 26
Fairly Common
Limited Basis
(92%)
�Bachelor’s degree in education (56%) or area related to subject matter they teach (52%)
�Master’s degree in any area (25%) or in education / related area (20%)
� Interview for selection (11%)�Evidence of impact on student learning (7%)�Application with personal essay (1%)
CO
MM
ON
Cooperating Teachers to Have Three Years of Experience, Current Licensure in the Area They Teach, and Their Principal’s Recommendation

Principals’ Motivations to Recommend Teachers Are N ot Necessarily Aligned with Universities’ – Some Prefer Giving Over burdened, Under Resourced Teachers Another Set of Hands in the Clas sroom
• Principals aren’t always recommending their best teachers .
• Principals’ perceptions of their cooperating teachers may be biased.
Principal Selection
• SOEs are working with districts’ standard criteria. Without institutions conducting screening, they have limited input on ensuring mentors are effective.
• SOEs aren’t allowed to contact cooperating
District Selection
Pathways to Cooperating Teacher Selection
CH
ALL
EN
GE
Contending With Challenges
© 2010 Eduventures, Inc.
cooperating teachers may be biased.
27
“We need principal recommendations but sometimes principals select the teachers based on factors not related to teacher quality (i.e. pregnancy, need of extra help, etc.).”
“Often principals identify placements with cooperating teachers who need more help in the classroom or who are identified by the principal as someone who might benefit from learning new skills from the intern . Time to work with our partner schools to explain our philosophy of supervision and to have training for the entire staff is needed.”
• SOEs aren’t allowed to contact cooperating teachers.C
HA
LLE
NG
ED
ES
CR
IPT
ION
S
“Working through school district bureaucratic channels to get to the right teachers [is hard]. Some school district would not want us to contact the teachers directly, so we have to go through their setup to reach the teachers.”
“[We find it challenging to use] years of experience (as criteria for selection); sometimes the teachers without career status are more current, creative , and effective classroom teachers.”

Clearly, There are Challenges Associated With Findi ng Good Cooperating Teachers, and Good Teachers Are Not Necessarily Goo d Cooperating Teachers
• Institutions recognize that strong cooperating teach ers possess a special skill set. In their own words, respondents describe the abilities teachers must possess as an effective cooperating teacher:
“Our biggest challenge is finding someone who is willing to do so, who has good mentoring skills , can provide quality constructive feedback , and who can afford the time in relation to the demands of high stakes testing and
Contending With Challenges
© 2010 Eduventures, Inc. 28
can afford the time in relation to the demands of high stakes testing and NCLB.”
“[It’s not easy] selecting someone who can model and communicate effective strategies and is willing to teach and set high expectations . Often the mentor expects the candidate to be a first year teacher and "tells but doesn’t show.”
Schools of education vary widely in terms of criter ia they use when selecting cooperating teachers, and data suggests this can be a difficult process. An
opportunity may exist to develop a field-wide set o f criteria districts and principals should be looking for when identifying effective co operating teachers.
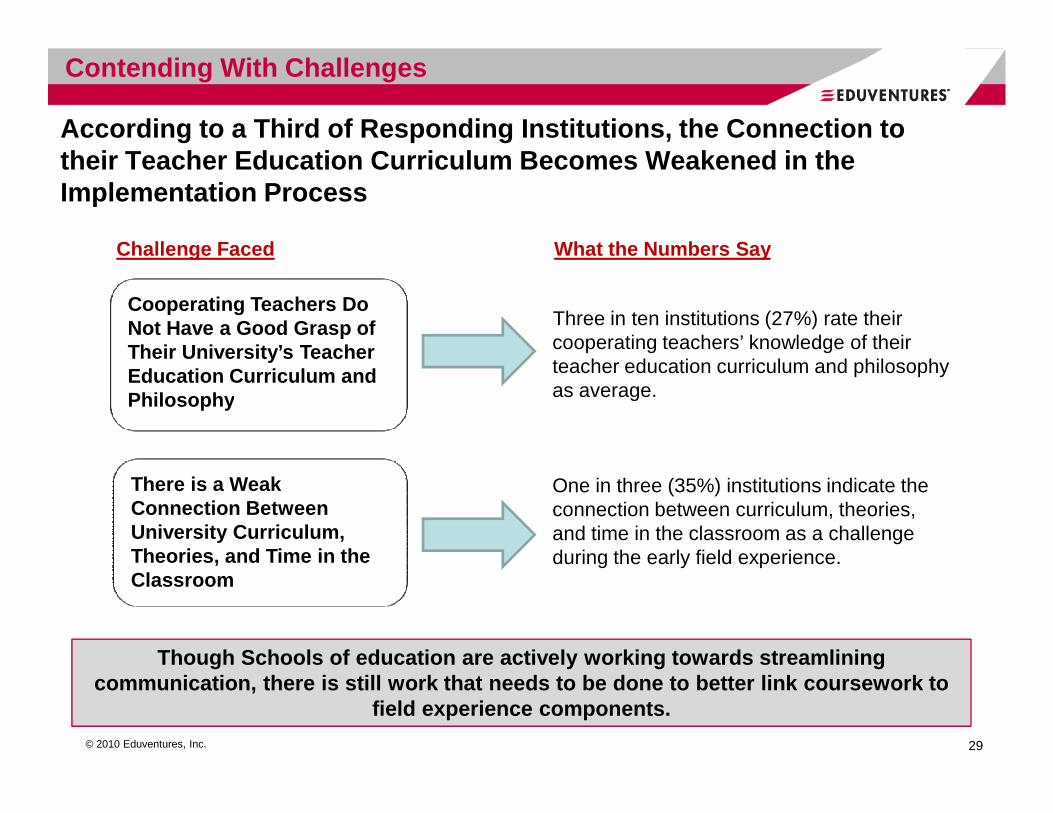
According to a Third of Responding Institutions, th e Connection to their Teacher Education Curriculum Becomes Weakened in the Implementation Process
Cooperating Teachers Do Not Have a Good Grasp of Their University’s Teacher Education Curriculum and Philosophy
Three in ten institutions (27%) rate their cooperating teachers’ knowledge of their teacher education curriculum and philosophy as average.
What the Numbers SayChallenge Faced
Contending With Challenges
© 2010 Eduventures, Inc. 29
Philosophy
There is a Weak Connection Between University Curriculum, Theories, and Time in the Classroom
One in three (35%) institutions indicate the connection between curriculum, theories, and time in the classroom as a challenge during the early field experience.
Though Schools of education are actively working to wards streamlining communication, there is still work that needs to be done to better link coursework to
field experience components.

Nearly Half of Institutions Report Strong Competiti on from Other Institutions for Field Placement Spots
• Over four in ten (43%) institutions indicated that “strong competition against other universities for placemen t” is a challenge they face.– Private institutions are twice as likely to report competition against other
universities for placement as a challenge (63%) in implementing the clinical experience compared to public institutions (30%).
Contending With Challenges
© 2010 Eduventures, Inc.
clinical experience compared to public institutions (30%).
• One-third of institutions (30%) also indicated not enough placement spots for early field experiences in loca l schools. The percentage of institutions experiencing this issue for student teaching was comparatively lower (22%).
30
Findings suggest that there could be great benefits to coordinating placement efforts, especially among smaller, privat e universities.
Design of Teacher Preparation ProgramsSuccessful Management and Integration of Clinical E xperiences
TABLE OF CONTENTS
Executive Summary 2
About This Study 7
Drivers Behind the Study 8
Collaborative Study Background 12
© 2010 Eduventures, Inc. 31
Respondent Demographics 14
Findings 15
Perceptions of Current Practice 15
Funding the Field Experience 18
Contending with Challenges 24
Supporting and Rewarding Cooperating Teachers 31
Benchmarking Key Indicators of Elementary Education Programs 36
Conclusion & Recommendations 49
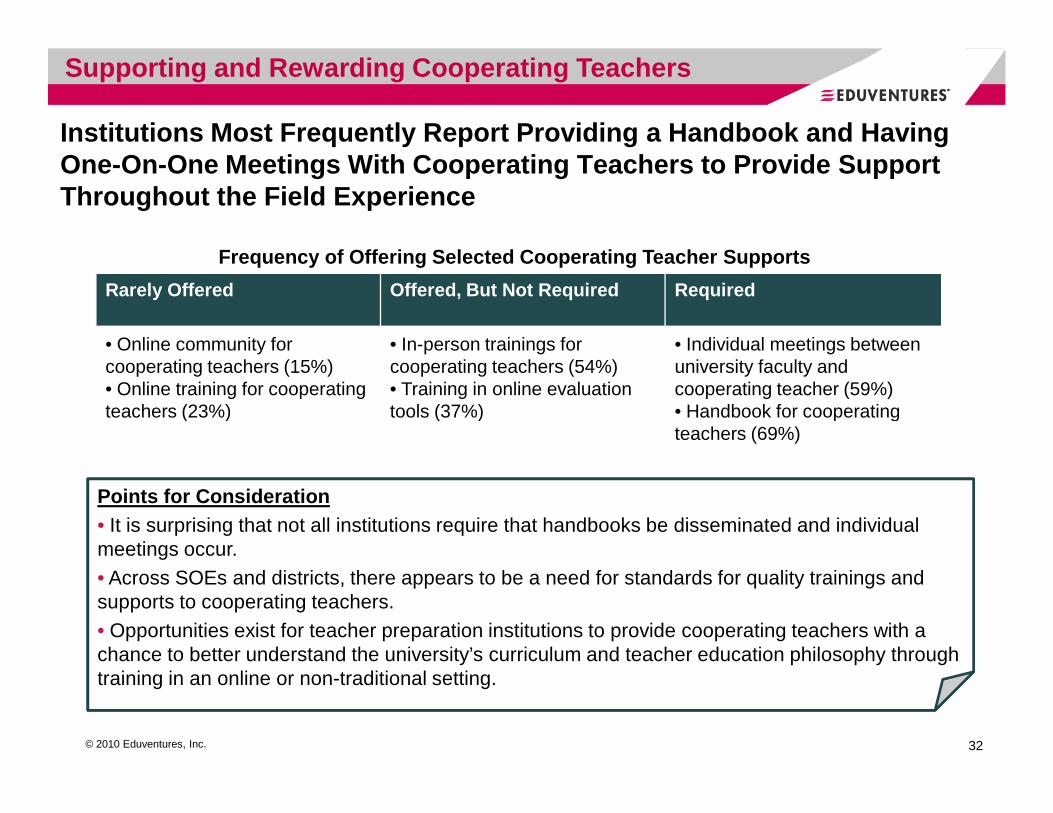
Institutions Most Frequently Report Providing a Han dbook and Having One-On-One Meetings With Cooperating Teachers to Pr ovide Support Throughout the Field Experience
Rarely Offered Offered, But Not Required Required
• Online community for cooperating teachers (15%)• Online training for cooperating teachers (23%)
• In-person trainings for cooperating teachers (54%)• Training in online evaluation tools (37%)
• Individual meetings between university faculty and cooperating teacher (59%)• Handbook for cooperating
Frequency of Offering Selected Cooperating Teacher Supports
Supporting and Rewarding Cooperating Teachers
© 2010 Eduventures, Inc. 32
teachers (23%) tools (37%) • Handbook for cooperating teachers (69%)
Points for Consideration• It is surprising that not all institutions require that handbooks be disseminated and individual meetings occur.• Across SOEs and districts, there appears to be a need for standards for quality trainings and supports to cooperating teachers.• Opportunities exist for teacher preparation institutions to provide cooperating teachers with a chance to better understand the university’s curriculum and teacher education philosophy through training in an online or non-traditional setting.

Schools of Education Most Commonly Reward Cooperati ng Teachers With Thank-You Letters and/or Monetary Compensation For Participation In The Early Field Experience
� Thank you letter (58%)
� Financial or monetary compensation (24%)
� Other (22%)
� None of the above (15%)
� Voucher for free course (14%)
� Invitations to special breakfasts or special events (11%)
CO
MM
ON
Responses to “How, if at all, do you compensate coo perating teachers for field experiences?” for the Early Field Experience
Supporting and Rewarding Cooperating Teachers
One in six institutions do not reward cooperating teachers for their
© 2010 Eduventures, Inc. 33
� Invitations to special breakfasts or special events (11%)
� Discounted tuition rates for coursework (8%)
� Library card (7%)
� University paraphernalia or tickets to university events (6%)
� Gift certificate (4%)
� Plaque or award (4%)
� Parking sticker (1%)
� Stipend for teaching supplies (1%)
CO
MM
ON teachers for their
participation in early field experiences.
Thank-you notes are low-cost, easy ways to let coop erating teachers know they are valued. It is surprising that less than 66% of sch ools of education report to currently
send thank-you notes to their early field experienc e cooperating teachers.

All Institutions Provide Some Reward to Cooperating Teachers for Their Assistance in Student Teaching, Though It Is Not Always Financial Compensation
• For student teaching, the majority, but not all institutions offer remuneration to cooperating teachers.
Financial or monetary compensation (65%)
Thank you letter (56%)
Invitations to special breakfasts or special events (29%)
Voucher for free course (26%)
Responses to “How, if at all, do you compensate coo perating teachers for field experiences?” for Student Teachi ng
Supporting and Rewarding Cooperating Teachers
© 2010 Eduventures, Inc. 34
teachers. • Similarly, roughly six in ten
provide a thank you letter. • Compared to the early field
experience, a relatively higher percentage of institutions offer vouchers for free courses.
Other (21%)
Discounted tuition rates for coursework (11%)
University paraphernalia or tickets to university events (10%)
Plaque or award (8%)
Library card (8%)
Stipend for teaching supplies (4%)
Gift certificate (1%)
Parking sticker (1%)
None of the above (0%)
CO
MM
ON

The Amount of Cooperating Teacher Compensation Has Increased Twofold Over the Past Twenty Years
Early Field Experience Student Teaching
$88 $238
$75 $200
� Average
� Median
A study conducted in 1992 found an average of $59 was paid to cooperating teachers for their participation in the
The 1992 study found an average of $112 honorariums being paid for student teaching
Supporting and Rewarding Cooperating Teachers
© 2010 Eduventures, Inc.
$10-250 $45-$750
35
� Low/High
The larger the institution, the lower the stipend tends to be for both early field experiences and student teaching. For example, those that prepared fewer than 125 teachers provided a stipend of $75 for early field experience and $212 for student teaching. This amount is higher compared to institutions that prepared
closer to 300+ students ($50 for early field experience and $185 for student teaching).
participation in the early field experience
student teaching
Barker, Bruce O. and others. “A National Study to Assess Payments and Benefits to Cooperating Teachers Working with Teacher Training Programs.” 1992.Paper presented at the Annual Meeting of the Association

Design of Teacher Preparation ProgramsSuccessful Management and Integration of Clinical E xperiences
TABLE OF CONTENTS
Executive Summary 2
About This Study 7
Drivers Behind the Study 8
Collaborative Study Background 12
© 2010 Eduventures, Inc. 36
Respondent Demographics 14
Findings 15
Perceptions of Current Practice 15
Funding the Field Experience 18
Contending with Challenges 24
Supporting and Rewarding Cooperating Teachers 31
Benchmarking Key Indicators of Elementary Education Programs 36
Conclusion & Recommendations 49

To Help Provide Comparable Information About Common Teacher Education Practices, Institutions Were Asked to Rep ort Information About their Largest Elementary Education Program
Survey Questions Asked
• Name of program• Number of candidates• Philosophy behind the program
• The SOE-LC requested information about institutions’ largest elementary education programs because:
1) They are one of the most common program areas
Benchmarking Elementary Education Programs
© 2010 Eduventures, Inc.
• Settings for field experiences• Time spent in clinical components• Strategies to enhance clinical
practice• Staffing models
37
program areas
2) There is relatively less variation at this level compared to Secondary Education and Special Education programs
3) The largest Elementary Education programs help create a view of experiences candidates are more likely to have at each institution
Through benchmarks, institutions can compare and re vise current practice against other institutions’ and better inform calls for field wide change.

How the Numbers Break Down: A Snapshot of the Typic al Structure of Elementary Education Programs at 62 Responding I nstitutions
• The majority of programs lead to traditional certification (95%) compared to alternative certification.
• They most frequently lead to master’s degrees (66%).
• The program takes an average of 2.5 years (31 weeks) to complete, though this
Student
teaching,
Average Percentage of Program Spent in Coursework and Fieldwork Components
Benchmarking Elementary Education Programs
© 2010 Eduventures, Inc.
years (31 weeks) to complete, though this varies by degree/certificate awarded.
• Courses still make up the majority of time spent (56%) in total preparation and more so than field work.
• Candidates have field experiences in a median of 3 different grade levels in 3 different schools . There is great variation between institutions, however, with candidates being placed in an average of 3 grades at 11 schools.
38
Courses,
56.4%Early field
experience,
16.7%
teaching,
27.5%
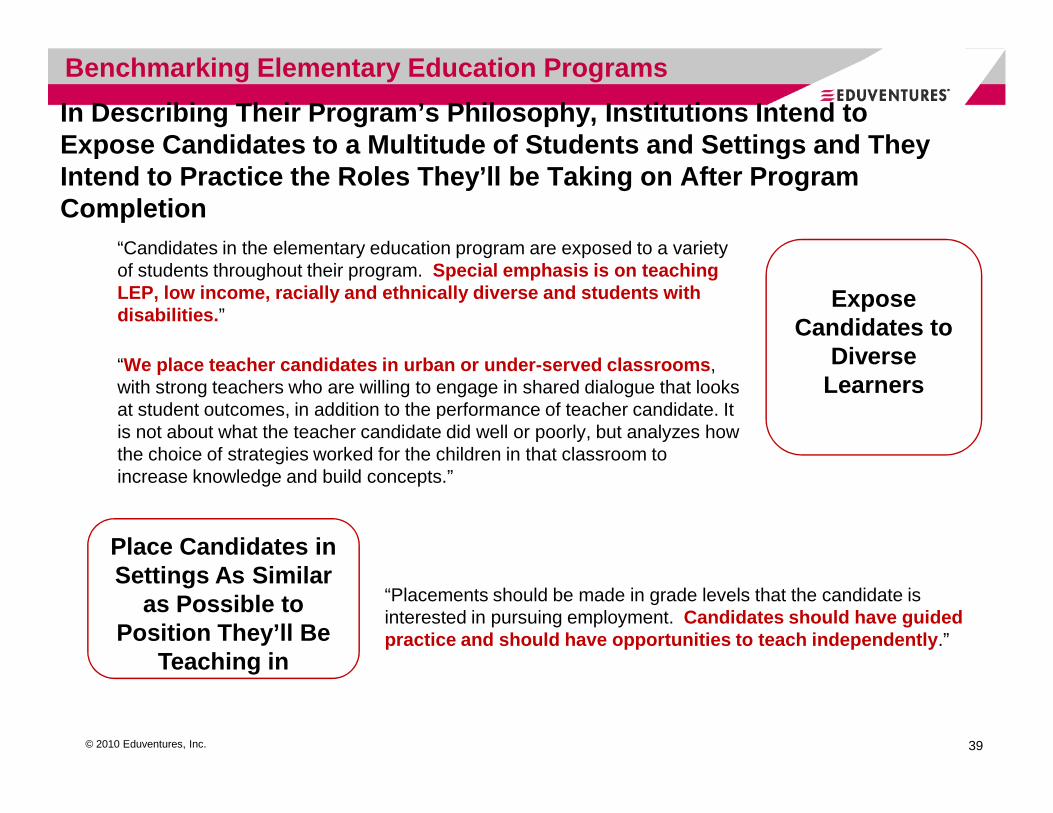
In Describing Their Program’s Philosophy, Instituti ons Intend to Expose Candidates to a Multitude of Students and Se ttings and They Intend to Practice the Roles They’ll be Taking on A fter Program Completion
“Candidates in the elementary education program are exposed to a variety of students throughout their program. Special emphasis is on teaching LEP, low income, racially and ethnically diverse an d students with disabilities. ”
“We place teacher candidates in urban or under-serve d classrooms , with strong teachers who are willing to engage in shared dialogue that looks at student outcomes, in addition to the performance of teacher candidate. It
Expose Candidates to
Diverse Learners
Benchmarking Elementary Education Programs
© 2010 Eduventures, Inc.
at student outcomes, in addition to the performance of teacher candidate. It is not about what the teacher candidate did well or poorly, but analyzes how the choice of strategies worked for the children in that classroom to increase knowledge and build concepts.”
39
“Placements should be made in grade levels that the candidate is interested in pursuing employment. Candidates should have guided practice and should have opportunities to teach ind ependently .”
Place Candidates in Settings As Similar
as Possible to Position They’ll Be
Teaching in

Institutions Note that Program Strengths Include th e Intentionality in their Largest Elementary Education Program’s Clinic al Design to Develop Candidate Awareness, Skills, and Knowledge
Sample Responses to “Please describe the philosophy behind the field placement in this teacher education program.”
“The clinical components of the Unified Elementary Program are aligned with programmatic themes and coursework each semester .” By semester, this institutional respondent described exposure to: 1. Multicultural and social justice orientation both through coursework
and fieldwork where students mentor children in public housing neighborhoods.
2. Pedagogy and behavior management principles working in dyads to complete assignments tied to coursework in elementary classrooms in
Program Has Carefully Designed
Candidates’ Exposure to
Benchmarking Elementary Education Programs
© 2010 Eduventures, Inc. 40
Program Promotes Understanding the Processes
Behind Candidates’ and Cooperating Teachers’ Decision
Making in the Classroom
complete assignments tied to coursework in elementary classrooms in rural and suburban settings.
3. Working with linguistically diverse students and families with coursework to support their experiences.
4. “Teachers as researchers " and conduct inquiry studies collaboratively with cooperating teachers in Professional Development Community schools.
5. Effective teaching in urban classrooms …”
“[Our program] builds insight and analysis and an understanding of WHY they make certain choices as well and what strategies to choose , when to choose them.”
Different, Important Skill and Student Learning Areas
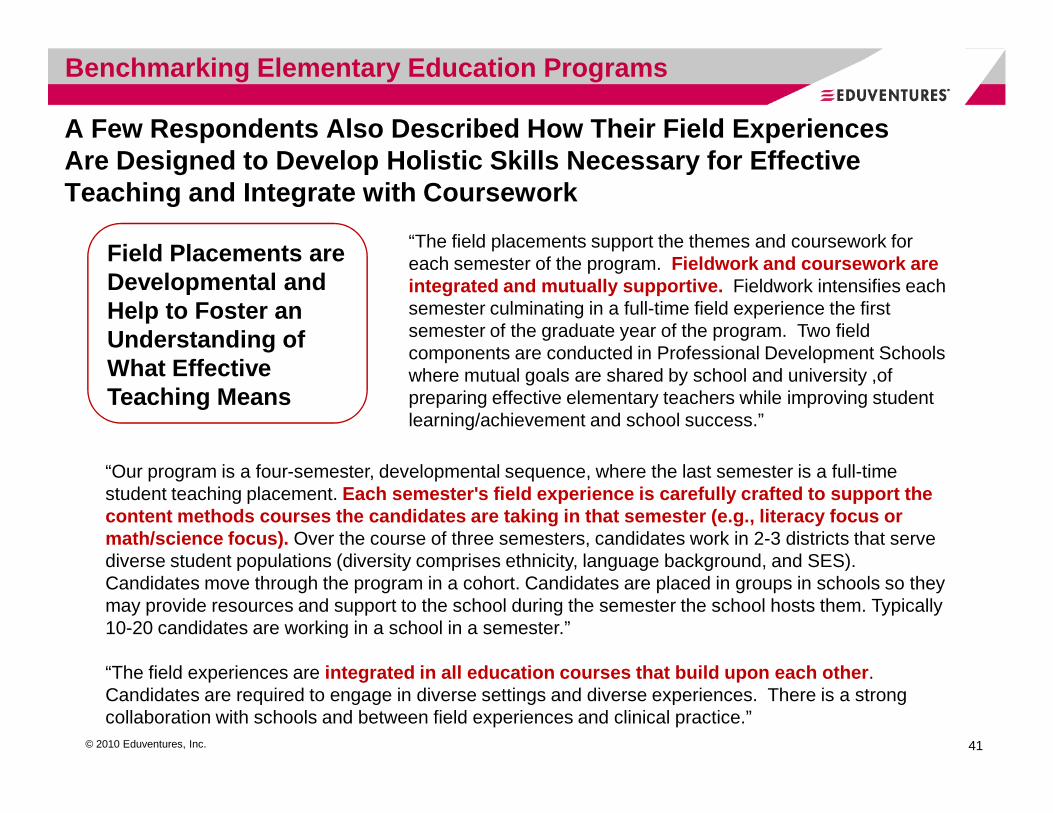
A Few Respondents Also Described How Their Field Ex periences Are Designed to Develop Holistic Skills Necessary f or Effective Teaching and Integrate with Coursework
“The field placements support the themes and coursework for each semester of the program. Fieldwork and coursework are integrated and mutually supportive. Fieldwork intensifies each semester culminating in a full-time field experience the first semester of the graduate year of the program. Two field components are conducted in Professional Development Schools where mutual goals are shared by school and university ,of preparing effective elementary teachers while improving student
Field Placements are Developmental and Help to Foster an Understanding of What Effective Teaching Means
Benchmarking Elementary Education Programs
© 2010 Eduventures, Inc. 41
preparing effective elementary teachers while improving student learning/achievement and school success.”
Teaching Means
“Our program is a four-semester, developmental sequence, where the last semester is a full-time student teaching placement. Each semester's field experience is carefully craft ed to support the content methods courses the candidates are taking i n that semester (e.g., literacy focus or math/science focus). Over the course of three semesters, candidates work in 2-3 districts that serve diverse student populations (diversity comprises ethnicity, language background, and SES). Candidates move through the program in a cohort. Candidates are placed in groups in schools so they may provide resources and support to the school during the semester the school hosts them. Typically 10-20 candidates are working in a school in a semester.”
“The field experiences are integrated in all education courses that build upon each other . Candidates are required to engage in diverse settings and diverse experiences. There is a strong collaboration with schools and between field experiences and clinical practice.”

Over Half of Institutions Report That Candidates Ha ve Field Experiences in Low and High Performing Schools
• Schools of education in urban areas are less likely to report conducting placements in professional development schools (30% versus 44% of suburban and rural-based SOEs)
31%88%
100%Urban settings
Responses to “In which of the following settings do teacher candidates typically complete their placements in the aforementioned program?” by SOE’s Geographic Setting
Benchmarking Elementary Education Programs
© 2010 Eduventures, Inc. 42
6%
13%
44%
81%
38%
56%
63%
31%
16%
24%
44%
44%
88%
80%
76%
13%
22%
30%
39%
61%
70%
83%
0% 20% 40% 60% 80% 100%
Lab schools
Other
Professional development schools
Rural settings
Suburban settings
High performing schools
Low performing schools
Urban
Suburban
Rural
SOE’s Geographic Setting
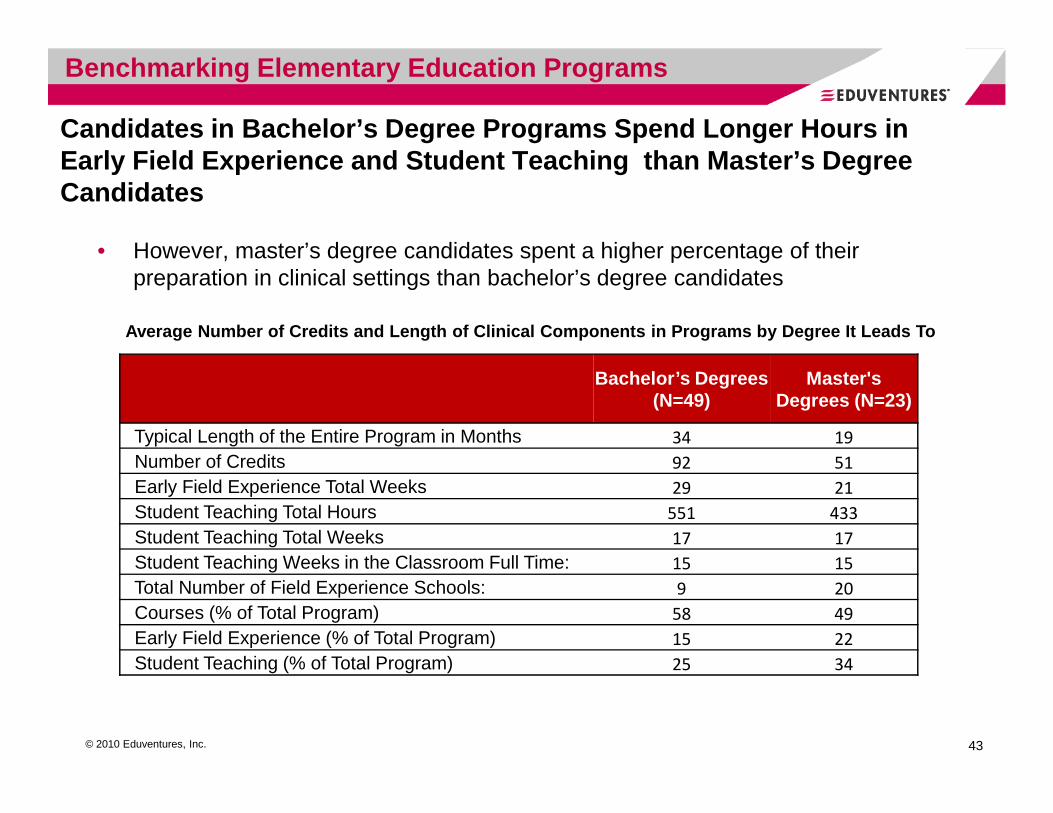
Candidates in Bachelor’s Degree Programs Spend Long er Hours in Early Field Experience and Student Teaching than M aster’s Degree Candidates
Bachelor’s Degrees (N=49)
Master's Degrees (N=23)
Average Number of Credits and Length of Clinical Co mponents in Programs by Degree It Leads To
• However, master’s degree candidates spent a higher percentage of their preparation in clinical settings than bachelor’s degree candidates
Benchmarking Elementary Education Programs
© 2010 Eduventures, Inc.
(N=49) Degrees (N=23)
Typical Length of the Entire Program in Months 34 19
Number of Credits 92 51
Early Field Experience Total Weeks 29 21
Student Teaching Total Hours 551 433
Student Teaching Total Weeks 17 17
Student Teaching Weeks in the Classroom Full Time: 15 15
Total Number of Field Experience Schools: 9 20
Courses (% of Total Program) 58 49
Early Field Experience (% of Total Program) 15 22
Student Teaching (% of Total Program) 25 34
43

However, There is Variation Across Institutions in Typical Clinical Requirements in Bachelor’s Programs, with Research Universities Requiring More Total Hours and Weeks in the Classro om
Average Number of Credits and Length of Clinical Co mponents in Programs that Lead to a Bachelor’s Degree Only, by Carnegie Classification (2005)
Benchmarking Elementary Education Programs
Research Universities
(N=17)
Master's Colleges
(N=4)
Bacc.(N=20)
Special Universities
(N=8)Typical Length of the Entire Program in Months 32 36 38 32Number of Credits 91 97 98 80
© 2010 Eduventures, Inc. 44
On average, research universities report longer ear ly field experiences and student teaching weeks despite comparably lower overall pro gram length.
Number of Credits 91 97 98 80Early Field Experience total weeks 42 5 24 22Student Teaching total hours 674 600 488 450Student Teaching total weeks 19 15 16 15Student Teaching weeks in the classroom full time 16 14 14 14Total number of field experience schools: 4 4 10 17Courses (% of Total Program) 56 78 58 59Early Field Experience (% of Total Program) 16 6 15 15Student Teaching (% of Total Program) 25 12 26 26

Despite Student Teaching for the Same Number of Wee ks, the Average Number of Student Teaching Hours Reported in Master ’s Degree Programs is Lower than in Bachelor’s Degree Program s
Average Number of Credits and Length of Various Cli nical Components in Programs that Lead to Master’s Degrees Only, by Carnegie Classification ( 2005)
Benchmarking Elementary Education Programs
Research Universities
(N=11)Bacc.(N=7)
Special Universities
(N=4)Typical Length of the Entire Program in Months 18 21 20
Number of Credits 56 49 43
© 2010 Eduventures, Inc. 45
Early Field Experience total weeks 24 21 15
Student Teaching total hours 414 481 373
Student Teaching total weeks 15 15 24
Student Teaching weeks in the classroom full time 14 15 18
Total number of field experience schools: 3 40 26
Courses (% of Total Program) 55 49 36
Early Field Experience (% of Total Program) 14 35 20
Student Teaching (% of Total Program) 31 32 43
On average, institutions report candidates in Maste r’s programs leading to initial licensure are spending 30 hours in the classroom du ring student teaching.

How is the Field Experience Being Enhanced? There i s a Stronger Emphasis on Video and Virtual Simulations in Early Field Experiences and Co-Teaching in Student Teaching
Benchmarking Elementary Education Programs
Co-Teaching
Video Review
Co-Teaching is common in four in ten (40%) of institutions’ practices in early field experience and
In both student teaching and early field
© 2010 Eduventures, Inc.
Other practices individual institutions reported engaging include guided observations and early field experiencesthat begin quickly in the program. Four in ten (37%) have early field experiences in community organizations
46
Virtual Simulations
institutions’ practices in early field experience and seven in ten (77%) institutions during student teaching, in which cooperating teachers and candidates jointly plan and teach.
In both student teaching and early field experiences, approximately half of institutions use video-based reviews of candidates’ own performance; video of other teachers’ practices and classrooms is less prevalent and more frequently found in the early field experience (35%).
Although relatively uncommon, virtual simulations are used more frequently in early field experiences (21%) than student teaching (6%).

Strong Relationships with Schools are Commonly Cons idered a Major Element of Successful Programs, and One-Third of Institutions Report Having PDS and On-Site Instruction at School s
• Approximately one in three institutions report placing candidates in professional development schools for their placement.
• A third also report having classroom-based courses for student teaching (32%) and the early field experience (35%).
• Many call out the close alignment between curriculum with the teacher education
Benchmarking Elementary Education Programs
© 2010 Eduventures, Inc.
“Elementary teacher candidates in the Urban Community Teacher Education Program spend an entire academic year immersed in a Professional Development School where they quickly become an integral member of the staff , important in children's lives just as any other teacher in the building. The biggest strength is that the university preparation curriculum is closely aligne d with the experiences of each internship carried out by the teacher candidate in his/her PDS, and the teacher candidate receives significant support an ongoing coaching feedback from his/her clinical teacher, site coordinator, and university site professor on a weekly basis.”
“Our biggest strength centers on our relationship with our partner schools that enables effective communication and collaboration , as well as the individual attention that we give to our teacher candidates in terms of clinical field supervision.”
47
• Many call out the close alignment between curriculum with the teacher education program as the biggest strength of their program. Sample comments follow:
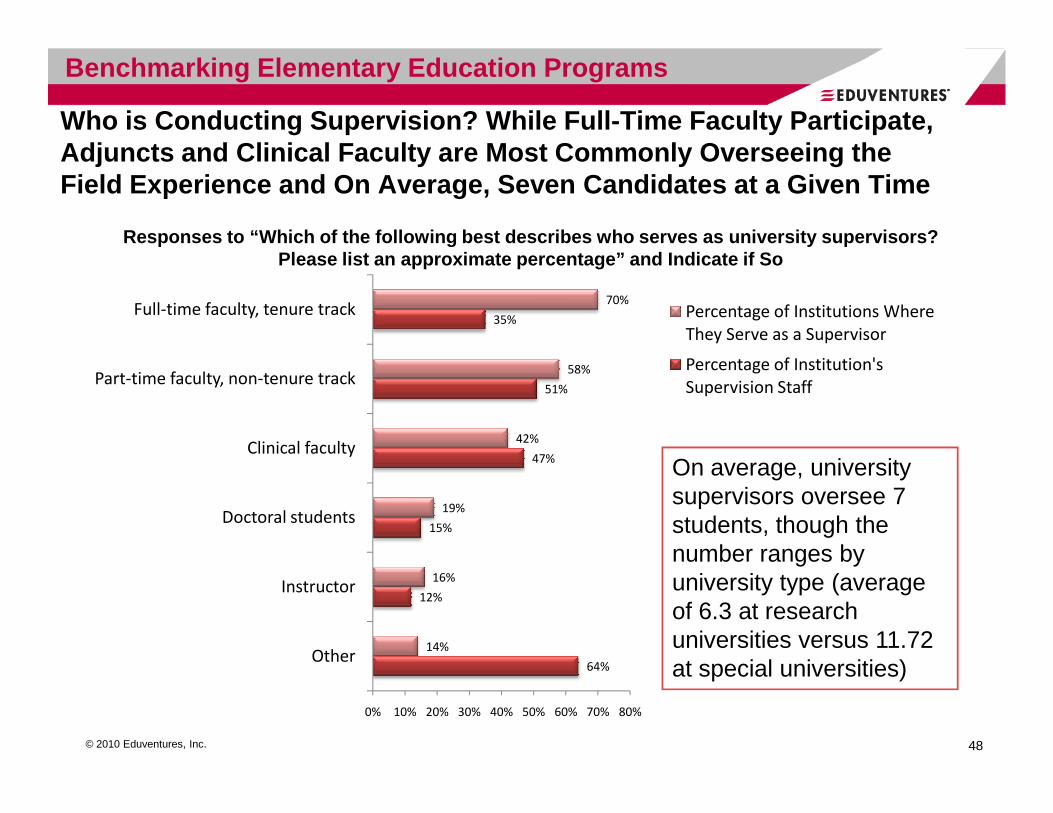
Who is Conducting Supervision? While Full-Time Facu lty Participate, Adjuncts and Clinical Faculty are Most Commonly Ove rseeing the Field Experience and On Average, Seven Candidates a t a Given Time
51%
35%
58%
70%
Part-time faculty, non-tenure track
Full-time faculty, tenure track Percentage of Institutions Where
They Serve as a Supervisor
Percentage of Institution's
Supervision Staff
Responses to “Which of the following best describes who serves as university supervisors? Please list an approximate percentage” and Indicate if So
Benchmarking Elementary Education Programs
© 2010 Eduventures, Inc. 48
64%
12%
15%
47%
14%
16%
19%
42%
0% 10% 20% 30% 40% 50% 60% 70% 80%
Other
Instructor
Doctoral students
Clinical faculty
On average, university supervisors oversee 7 students, though the number ranges by university type (average of 6.3 at research universities versus 11.72 at special universities)

Design of Teacher Preparation ProgramsSuccessful Management and Integration of Clinical E xperiences
TABLE OF CONTENTS
Executive Summary 2
About This Study 7
Drivers Behind the Study 8
Collaborative Study Background 12
© 2010 Eduventures, Inc. 49
Respondent Demographics 14
Findings 15
Perceptions of Current Practice 15
Funding the Field Experience 18
Contending with Challenges 24
Supporting and Rewarding Cooperating Teachers 31
Benchmarking Key Indicators of Elementary Education Programs 36
Conclusion & Recommendations 49

From a Logistical Standpoint, There are Several Are as to Consider Moving the Field Experience Forward
Selection
Bridging Field Experiences with
University Approaches
Rethinking Field and Clinical Experiences
Key Challenges in Implementation
• Issue a field-wide set of high selection criteria for cooperating teachers• Understand
• Share curriculum and philosophy through opportunities for cooperating teachers to attend a seminar with faculty
© 2010 Eduventures, Inc.
Costs Supports
50
• Understand cooperating teacher effectiveness based on performance data
seminar with faculty once a month/semester• Expand PDS relationships with appropriately sized schools
• Require cooperating teachers to attend training meetings • Offer virtual and in-person learning community options
•Consider cost-sharing collaborative models with nearby universities, especially for small universities

There May Be Immense Benefits to Thinking About Tea cher Education Programs From a More Organized Perspectiv e
As exhibited through many of the challenges institutions report experience, many SOEs feel their hands are tied in the field experience. The findings promote the importance of driving a more unified approach to field experiences across teacher education institutions field wide, through:
� Creating universal standards for high quality cooperating teachers� Building in mentorship and service as a cooperating teacher as a standard
Rethinking Field and Clinical Experiences
© 2010 Eduventures, Inc.
� Building in mentorship and service as a cooperating teacher as a standard and rewarded career progression in districts
� Creating more universal standards for school and university curriculum across institutions, to promote greater fidelity in implementation
� Considering the role of the state and third party providers in coordinating teacher quality and placement efforts and supervision
� Strengthening relationships with professional development schools
51
The Findings Also Raise Broader Questions About Cal ls for Change Amidst Beliefs that Clinical Teacher Preparation is Positive
• Eight in ten schools of education report satisfacti on with the design of their clinical components and a belief that it is h igh quality. This perception is supported by benchmarking data that indicates that on average, elementary education programs require well over the NCATE Blue Ribbon panel’s recommendation of at least 400 hours in clinical settings.
• Should the clinical program be deepened further, th e cost
Rethinking Field and Clinical Experiences
© 2010 Eduventures, Inc.
• Should the clinical program be deepened further, th e cost implications will be considerable . Public universities fund the cost of the clinical component largely with state appropriations. While policymakers call for lengthier field experiences, budget cuts are being passed on to public universities by the state, creating a difficult situation. Furthermore, private universities, where higher tuition is already a concern, would likely need to raise tuition or fees for students that are cost-sensitive.
52
The study reveals that the amount of time and perce ntage of preparation in clinical components in the largest teacher educatio n is sizeable; so too are
costs. This is an important point to communicate to policymakers and institutional leaders.
About Eduventures Schools of Education Learning Col laborativeThe Eduventures Schools of Education Learning Collaborative (SOE-LC) brings deans of schools of education together with their peers from other institutions to exchange best practices and to find solutions for shared challenges such as increasing operational efficiency, curriculum development, and outcomes assessment.
About Collaborative ResearchCollaborative Research investigations address issues of field-wide importance and draw upon the collective Schools of Education Learning Collaborative members to play a lead role in defining each investigation’s goals. These projects present a collaborative effort by members to create a dataset that benefits each institution. 2010 members to date include:
About Eduventures
© 2010 Eduventures, Inc. 53
Azusa Pacific UniversityBall State UniversityBoston UniversityCalifornia State University, ChicoChicago School of Professional PsychologyDePaul UniversityDrexel UniversityEastern Kentucky UniversityFordham UniversityGeorge Mason UniversityGrand Canyon UniversityIndiana UniversityKutztown University of PennsylvaniaLesley University
Long Island UniversityLouisiana State UniversityLoyola Marymount UniversityLoyola University of MarylandNational-Louis UniversityNorth Carolina A&T State UniversityNorth Georgia College and State UniversityNortheastern UniversityNorthern Arizona UniversityOhio UniversityOld Dominion UniversityPortland State University
Regis UniversityTemple UniversityUniversity of California, RiversideUniversity of DaytonUniversity of Illinois-ChicagoThe University of KansasUniversity of North TexasUniversity of PittsburghUniversity of San Diego University of Southern CaliforniaUniversity of the PacificUniversity of WyomingWestern Michigan UniversityWilliam Paterson University