soep scales manual (updated for soep-core v32.1)
TRANSCRIPT
SOEP Survey PapersSeries C – Data Documentation
The GermanSocio-EconomicPanel study
SOEP Scales Manual (updated for SOEP-Core v32.1)
423
SOEP — The German Socio-Economic Panel study at DIW Berlin 2017
David Richter, Julia Rohrer, Maria Metzing, Wiebke Nestler, Michael Weinhardt, Jürgen Schupp
Running since 1984, the German Socio-Economic Panel study (SOEP) is a wide-ranging representative longitudinal study of private households, located at the German Institute for Economic Research, DIW Berlin. The aim of the SOEP Survey Papers Series is to thoroughly document the survey’s data collection and data processing. The SOEP Survey Papers is comprised of the following series: Series A – Survey Instruments (Erhebungsinstrumente) Series B – Survey Reports (Methodenberichte) Series C – Data Documentation (Datendokumentationen) Series D – Variable Descriptions and Coding Series E – SOEPmonitors Series F – SOEP Newsletters Series G – General Issues and Teaching Materials The SOEP Survey Papers are available at http://www.diw.de/soepsurveypapers
Editors: Dr. Jan Goebel, DIW Berlin Prof. Dr. Martin Kroh, DIW Berlin and Humboldt Universität Berlin Prof. Dr. Carsten Schröder, DIW Berlin and Freie Universität Berlin Prof. Dr. Jürgen Schupp, DIW Berlin and Freie Universität Berlin
Please cite this paper as follows:
David Richter, Julia Rohrer, Maria Metzing, Wiebke Nestler, Michael Weinhardt, Jürgen Schupp. 2017. SOEP Scales Manual (updated for SOEP-Core v32.1). SOEP Survey Papers 423: Series C. Berlin: DIW/SOEP
This work is licensed under a Creative Commons Attribution-ShareAlike 4.0 International License. © 2017 by SOEP ISSN: 2193-5580 (online) DIW Berlin German Socio-Economic Panel (SOEP) Mohrenstr. 58 10117 Berlin Germany [email protected]
SOEP Scales Manual (updated for SOEP-Core v32.1)
David Richter*, Julia Rohrer**, Maria Metzing*, Wiebke Nestler**, Michael Weinhardt***, Jürgen Schupp*
* DIW Berlin, Socio-Economic Panel
** University of Leipzig
*** University of Bielefeld
1
Table of Contents Affective Well-Being .............................................................................................................................. 3
Anomie .................................................................................................................................................... 5
Cognitive Competencies ........................................................................................................................ 7
Symbol-Digit Test and Animal Naming Task ..................................................................................... 7
Multiple-Choice Vocabulary Intelligence Test (MWT) ...................................................................... 9
I-S-T 2000 R ...................................................................................................................................... 10
Impulsiveness & Patience ................................................................................................................... 15
Life Goals ............................................................................................................................................. 16
Life Satisfaction ................................................................................................................................... 20
Locus of Control .................................................................................................................................. 34
Optimism/Pessimism – Attitudes toward the Future ....................................................................... 37
Parenting Goals ................................................................................................................................... 39
Parenting Role ..................................................................................................................................... 41
Parenting Style ..................................................................................................................................... 43
Personality – Big Five .......................................................................................................................... 46
Big Five (Adults) ............................................................................................................................... 46
Big Five (Youth) ............................................................................................................................... 50
Big Five (11-12 year olds, self-report) .............................................................................................. 51
Big Five (9-10 year olds & 5-6 year olds, parent reports) ................................................................. 52
Big Five (2-3 year olds, parent reports) ............................................................................................. 55
Reciprocity ........................................................................................................................................... 56
Risk Aversion ....................................................................................................................................... 59
Self Esteem ........................................................................................................................................... 62
Sources of Social Inequality ................................................................................................................ 63
Strengths and Difficulties Questionnaire (SDQ) .............................................................................. 65
Strengths and Difficulties Questionnaire (5-6 year olds & 9-10 year olds, parent reports) .............. 65
Strengths and Difficulties Questionnaire (11-12 year olds, self-report)............................................ 68
Temperament ....................................................................................................................................... 72
Tendency to Forgive ............................................................................................................................ 74
Trust, Trustworthiness, Fairness ....................................................................................................... 76
Vineland Adaptive Behavior Scales ................................................................................................... 78
2
Introduction
This manual briefly describes the theoretical background and development of all of the scales used in the Socio-Economic Panel (SOEP) study. It also provides the relevant citations as well as the items belonging to the scales and the answer format, including the verbal anchors.
The unique value of this manual lies in the presentation of each scale in the form of easy-to-understand tables listing variable names of the items in the scale in a wave-specific dataset (labels). This allows the individual items to be found and aggregated quickly.
In addition, the tables in this manual include mean values (M), standard deviations (SD), corrected item-total correlations (CITC), and information as to whether the item has to be recoded before aggregation (R). The number of valid cases in the particular survey years, as well as two measures of reliability, the internal consistency (Cronbach’s Alpha) and test-retest correlations (if available), are also reported.
3
Affective Well-Being Summary Affective well-being describes the balance between positive and negative emotional experiences and is of interest for the research on well-being in psychology and economics as well as in the social sciences in general. The scale consists of four items and has been used in the SOEP since 2007. Theoretical Background In the psychological literature, subjective well-being is assumed to consist of two components: cognitive well-being and affective well-being (Schimmack et al., 2002). Here, affective well-being represents the emotional component of subjective well-being. In contrast to cognitive well-being, which is based on reflexive evaluation of subjective well-being, affective well-being hinges on the balance between positive and negative emotions (Sumner, 1996). The distinction between cognitive and affective well-being is important for the scientific investigation of subjective well-being and for policy considerations about public well-being. If the aim is to maximize subjective well-being on both the individual and the social level, and if the two are indeed separate components, it is crucial to measure their relative importance. Despite the importance of distinguishing between cognitive and affective well-being, their relationship has been researched little to date (Schimmack, 2009). Their relationship also highlights the need to examine factors such as unemployment that potentially influence subjective well-being (e.g., Schimmack et al., 2008). Conceptually, the relationship between affective well-being and other general personality characteristics is also of interest. Scale Development Theoretical considerations and results from the 2006 SOEP pretest led to the construction of a scale consisting of four items. One item deals with positive experiences (“happy”), while the other three items deal with negative experiences (annoyed, afraid, sad; Schimmack, 2009). In the pilot study, the measure constructed in this manner showed a high correlation with a longer measure of affective balance consisting of 10 items and produced results that are consistent with the previous results in the relevant psychological literature (Schimmack et al., 2008). References Schimmack, U. 2009. Measuring wellbeing in the SOEP. Schmollers Jahrbuch, 129, 241-249. Schimmack, U. Diener, E., & Oishi, S. (2002). Life-Satisfaction is a momentary judgment and a stable
personality characteristic: The use of chronically accessible and stable sources. Journal of Personality, 70, 345-384.
Schimmack, U., Schupp, J., & Wagner, G. G. (2008). The influence of environment and personality on the affective and cognitive component of subjective well-being. Social Indicators Research, 89, 41-60.
Sumner, L. W. (1996): Welfare, happiness, and ethics. Oxford: University Press. Items I will now read to you a number of feelings. Please indicate for each feeling how often or rarely you experienced this feeling in the last four weeks (Ich lese Ihnen eine Reihe von Gefühlen vor. Geben Sie bitte jeweils an, wie häufig oder selten Sie dieses Gefühl in den letzten vier Wochen erlebt haben):
1. Angry (ärgerlich gefühlt)? 2. Worried (ängstlich gefühlt)? 3. Happy (glücklich gefühlt)? 4. Sad (traurig gefühlt)?
Scale: 1 (Very rarely / Sehr selten) to 5 (Very often / Sehr oft) Test-Retest Correlations In 2009, this scale was included in a retest taken by a subsample (N = 164 completed the scale) within 30 to 49 days after the initial test. Test-retest correlations for the items were (in scale order) .46, .49, .51, and .46; scale scores correlated .54.
4
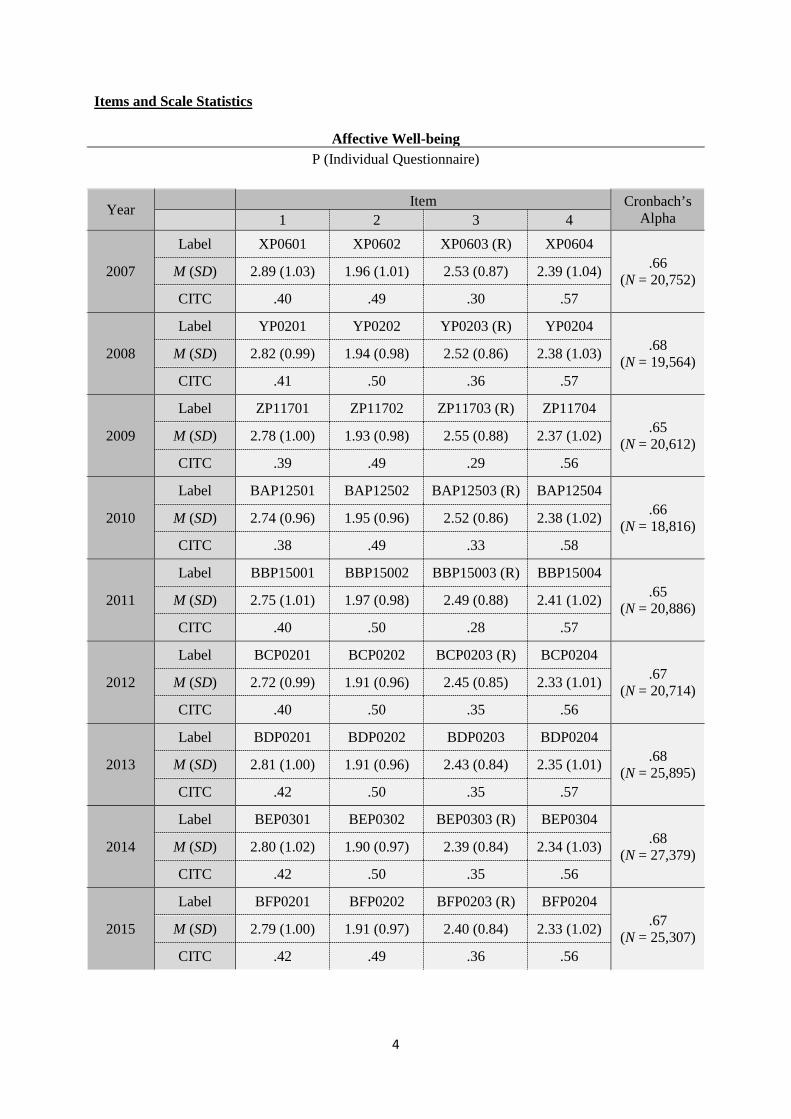
Items and Scale Statistics
Affective Well-being P (Individual Questionnaire)
Year Item Cronbach’s
Alpha 1 2 3 4
2007
Label XP0601 XP0602 XP0603 (R) XP0604 .66
(N = 20,752) M (SD) 2.89 (1.03) 1.96 (1.01) 2.53 (0.87) 2.39 (1.04)
CITC .40 .49 .30 .57
2008
Label YP0201 YP0202 YP0203 (R) YP0204 .68
(N = 19,564) M (SD) 2.82 (0.99) 1.94 (0.98) 2.52 (0.86) 2.38 (1.03)
CITC .41 .50 .36 .57
2009
Label ZP11701 ZP11702 ZP11703 (R) ZP11704 .65
(N = 20,612) M (SD) 2.78 (1.00) 1.93 (0.98) 2.55 (0.88) 2.37 (1.02)
CITC .39 .49 .29 .56
2010
Label BAP12501 BAP12502 BAP12503 (R) BAP12504 .66
(N = 18,816) M (SD) 2.74 (0.96) 1.95 (0.96) 2.52 (0.86) 2.38 (1.02)
CITC .38 .49 .33 .58
2011
Label BBP15001 BBP15002 BBP15003 (R) BBP15004 .65
(N = 20,886) M (SD) 2.75 (1.01) 1.97 (0.98) 2.49 (0.88) 2.41 (1.02)
CITC .40 .50 .28 .57
2012
Label BCP0201 BCP0202 BCP0203 (R) BCP0204 .67
(N = 20,714) M (SD) 2.72 (0.99) 1.91 (0.96) 2.45 (0.85) 2.33 (1.01)
CITC .40 .50 .35 .56
2013
Label BDP0201 BDP0202 BDP0203 BDP0204 .68
(N = 25,895) M (SD) 2.81 (1.00) 1.91 (0.96) 2.43 (0.84) 2.35 (1.01)
CITC .42 .50 .35 .57
2014
Label BEP0301 BEP0302 BEP0303 (R) BEP0304 .68
(N = 27,379) M (SD) 2.80 (1.02) 1.90 (0.97) 2.39 (0.84) 2.34 (1.03)
CITC .42 .50 .35 .56
2015
Label BFP0201 BFP0202 BFP0203 (R) BFP0204 .67
(N = 25,307) M (SD) 2.79 (1.00) 1.91 (0.97) 2.40 (0.84) 2.33 (1.02)
CITC .42 .49 .36 .56
5
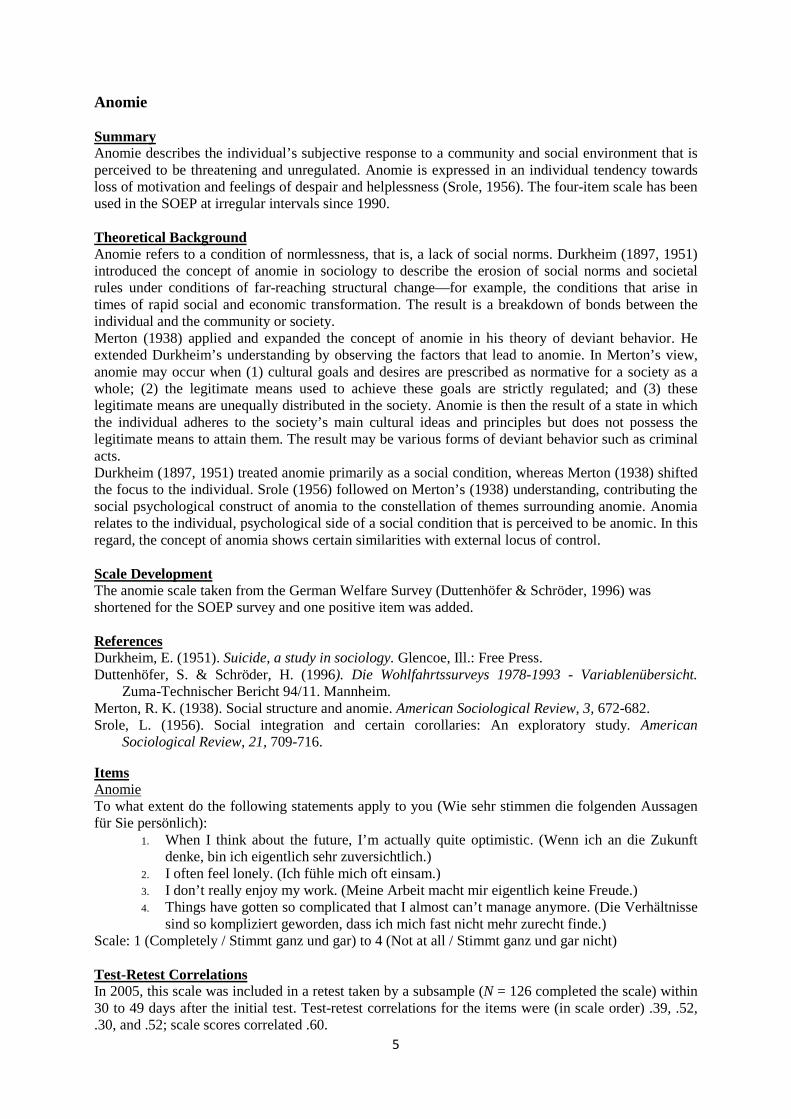
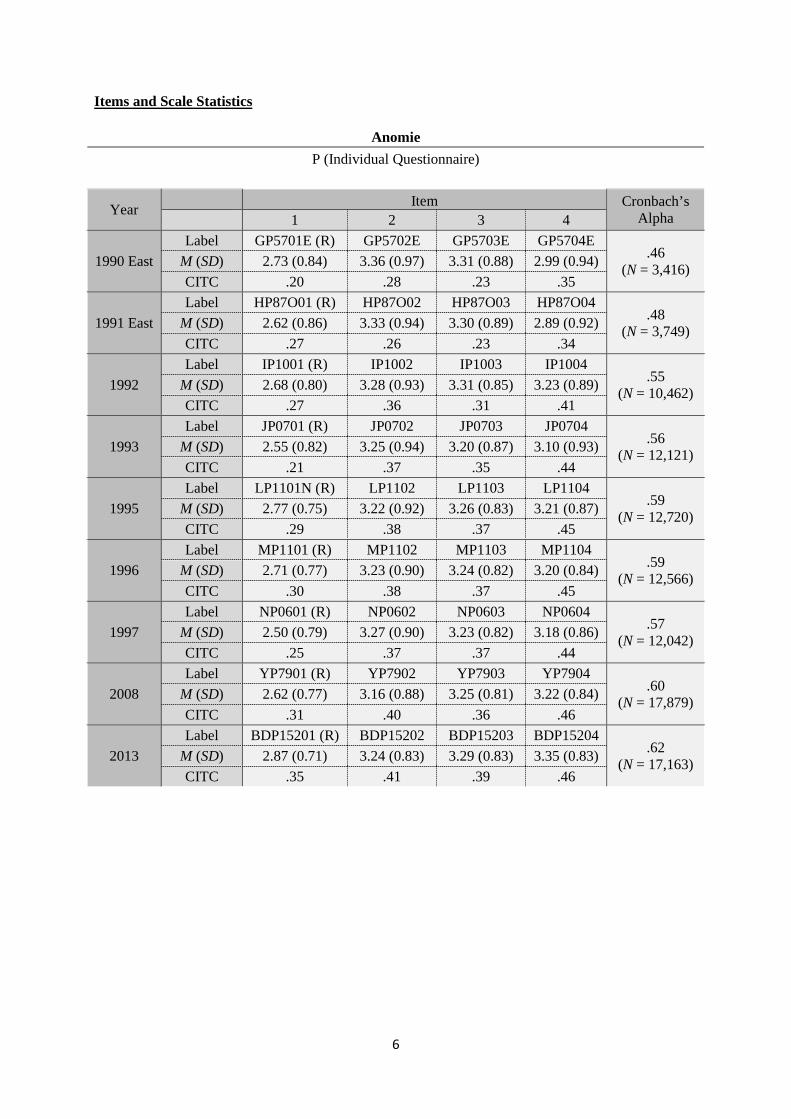
Anomie Summary Anomie describes the individual’s subjective response to a community and social environment that is perceived to be threatening and unregulated. Anomie is expressed in an individual tendency towards loss of motivation and feelings of despair and helplessness (Srole, 1956). The four-item scale has been used in the SOEP at irregular intervals since 1990. Theoretical Background Anomie refers to a condition of normlessness, that is, a lack of social norms. Durkheim (1897, 1951) introduced the concept of anomie in sociology to describe the erosion of social norms and societal rules under conditions of far-reaching structural change—for example, the conditions that arise in times of rapid social and economic transformation. The result is a breakdown of bonds between the individual and the community or society. Merton (1938) applied and expanded the concept of anomie in his theory of deviant behavior. He extended Durkheim’s understanding by observing the factors that lead to anomie. In Merton’s view, anomie may occur when (1) cultural goals and desires are prescribed as normative for a society as a whole; (2) the legitimate means used to achieve these goals are strictly regulated; and (3) these legitimate means are unequally distributed in the society. Anomie is then the result of a state in which the individual adheres to the society’s main cultural ideas and principles but does not possess the legitimate means to attain them. The result may be various forms of deviant behavior such as criminal acts. Durkheim (1897, 1951) treated anomie primarily as a social condition, whereas Merton (1938) shifted the focus to the individual. Srole (1956) followed on Merton’s (1938) understanding, contributing the social psychological construct of anomia to the constellation of themes surrounding anomie. Anomia relates to the individual, psychological side of a social condition that is perceived to be anomic. In this regard, the concept of anomia shows certain similarities with external locus of control. Scale Development The anomie scale taken from the German Welfare Survey (Duttenhöfer & Schröder, 1996) was shortened for the SOEP survey and one positive item was added. References Durkheim, E. (1951). Suicide, a study in sociology. Glencoe, Ill.: Free Press. Duttenhöfer, S. & Schröder, H. (1996). Die Wohlfahrtssurveys 1978-1993 - Variablenübersicht.
Zuma-Technischer Bericht 94/11. Mannheim. Merton, R. K. (1938). Social structure and anomie. American Sociological Review, 3, 672-682. Srole, L. (1956). Social integration and certain corollaries: An exploratory study. American
Sociological Review, 21, 709-716. Items Anomie To what extent do the following statements apply to you (Wie sehr stimmen die folgenden Aussagen für Sie persönlich):
1. When I think about the future, I’m actually quite optimistic. (Wenn ich an die Zukunft denke, bin ich eigentlich sehr zuversichtlich.)
2. I often feel lonely. (Ich fühle mich oft einsam.) 3. I don’t really enjoy my work. (Meine Arbeit macht mir eigentlich keine Freude.) 4. Things have gotten so complicated that I almost can’t manage anymore. (Die Verhältnisse
sind so kompliziert geworden, dass ich mich fast nicht mehr zurecht finde.) Scale: 1 (Completely / Stimmt ganz und gar) to 4 (Not at all / Stimmt ganz und gar nicht) Test-Retest Correlations In 2005, this scale was included in a retest taken by a subsample (N = 126 completed the scale) within 30 to 49 days after the initial test. Test-retest correlations for the items were (in scale order) .39, .52, .30, and .52; scale scores correlated .60.
6
Items and Scale Statistics
Anomie P (Individual Questionnaire)
Year Item Cronbach’s Alpha 1 2 3 4
1990 East Label GP5701E (R) GP5702E GP5703E GP5704E
.46 (N = 3,416) M (SD) 2.73 (0.84) 3.36 (0.97) 3.31 (0.88) 2.99 (0.94)
CITC .20 .28 .23 .35
1991 East Label HP87O01 (R) HP87O02 HP87O03 HP87O04
.48 (N = 3,749) M (SD) 2.62 (0.86) 3.33 (0.94) 3.30 (0.89) 2.89 (0.92)
CITC .27 .26 .23 .34
1992 Label IP1001 (R) IP1002 IP1003 IP1004
.55 (N = 10,462) M (SD) 2.68 (0.80) 3.28 (0.93) 3.31 (0.85) 3.23 (0.89)
CITC .27 .36 .31 .41
1993 Label JP0701 (R) JP0702 JP0703 JP0704
.56 (N = 12,121) M (SD) 2.55 (0.82) 3.25 (0.94) 3.20 (0.87) 3.10 (0.93)
CITC .21 .37 .35 .44
1995 Label LP1101N (R) LP1102 LP1103 LP1104
.59 (N = 12,720) M (SD) 2.77 (0.75) 3.22 (0.92) 3.26 (0.83) 3.21 (0.87)
CITC .29 .38 .37 .45
1996 Label MP1101 (R) MP1102 MP1103 MP1104
.59 (N = 12,566) M (SD) 2.71 (0.77) 3.23 (0.90) 3.24 (0.82) 3.20 (0.84)
CITC .30 .38 .37 .45
1997 Label NP0601 (R) NP0602 NP0603 NP0604
.57 (N = 12,042) M (SD) 2.50 (0.79) 3.27 (0.90) 3.23 (0.82) 3.18 (0.86)
CITC .25 .37 .37 .44
2008 Label YP7901 (R) YP7902 YP7903 YP7904
.60 (N = 17,879) M (SD) 2.62 (0.77) 3.16 (0.88) 3.25 (0.81) 3.22 (0.84)
CITC .31 .40 .36 .46
2013 Label BDP15201 (R) BDP15202 BDP15203 BDP15204
.62 (N = 17,163) M (SD) 2.87 (0.71) 3.24 (0.83) 3.29 (0.83) 3.35 (0.83)
CITC .35 .41 .39 .46
7
Cognitive Competencies
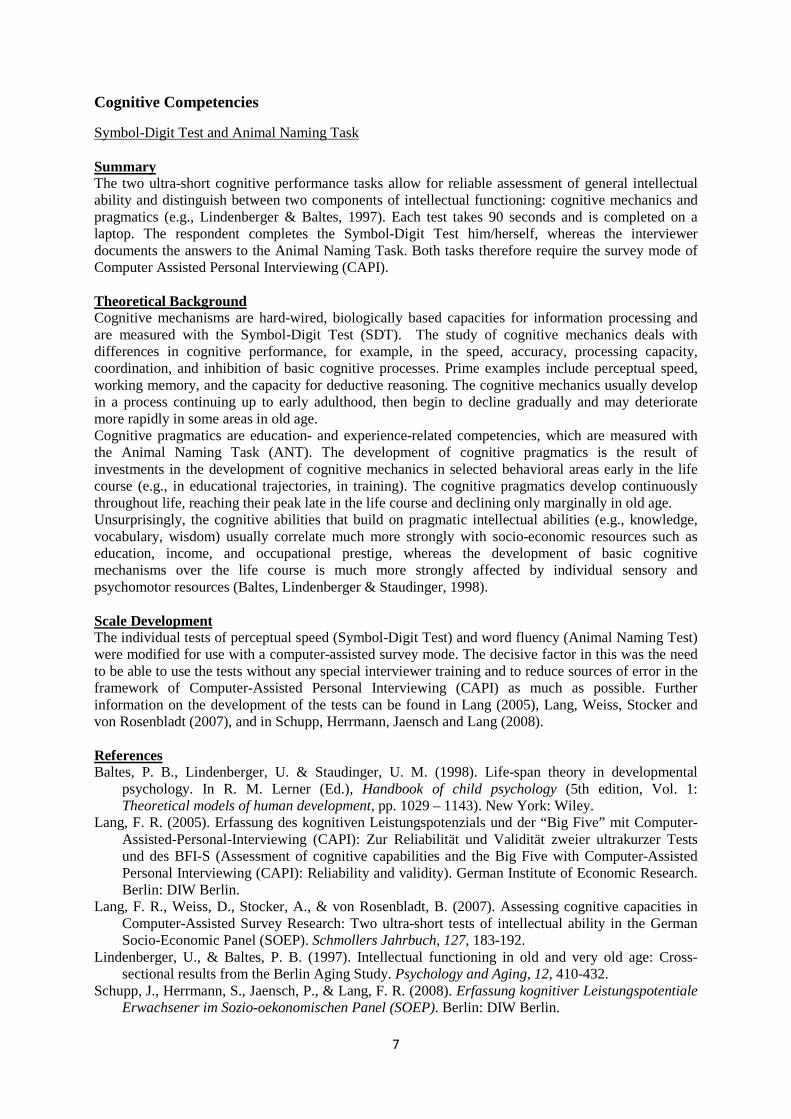
Symbol-Digit Test and Animal Naming Task Summary The two ultra-short cognitive performance tasks allow for reliable assessment of general intellectual ability and distinguish between two components of intellectual functioning: cognitive mechanics and pragmatics (e.g., Lindenberger & Baltes, 1997). Each test takes 90 seconds and is completed on a laptop. The respondent completes the Symbol-Digit Test him/herself, whereas the interviewer documents the answers to the Animal Naming Task. Both tasks therefore require the survey mode of Computer Assisted Personal Interviewing (CAPI). Theoretical Background Cognitive mechanisms are hard-wired, biologically based capacities for information processing and are measured with the Symbol-Digit Test (SDT). The study of cognitive mechanics deals with differences in cognitive performance, for example, in the speed, accuracy, processing capacity, coordination, and inhibition of basic cognitive processes. Prime examples include perceptual speed, working memory, and the capacity for deductive reasoning. The cognitive mechanics usually develop in a process continuing up to early adulthood, then begin to decline gradually and may deteriorate more rapidly in some areas in old age. Cognitive pragmatics are education- and experience-related competencies, which are measured with the Animal Naming Task (ANT). The development of cognitive pragmatics is the result of investments in the development of cognitive mechanics in selected behavioral areas early in the life course (e.g., in educational trajectories, in training). The cognitive pragmatics develop continuously throughout life, reaching their peak late in the life course and declining only marginally in old age. Unsurprisingly, the cognitive abilities that build on pragmatic intellectual abilities (e.g., knowledge, vocabulary, wisdom) usually correlate much more strongly with socio-economic resources such as education, income, and occupational prestige, whereas the development of basic cognitive mechanisms over the life course is much more strongly affected by individual sensory and psychomotor resources (Baltes, Lindenberger & Staudinger, 1998). Scale Development The individual tests of perceptual speed (Symbol-Digit Test) and word fluency (Animal Naming Test) were modified for use with a computer-assisted survey mode. The decisive factor in this was the need to be able to use the tests without any special interviewer training and to reduce sources of error in the framework of Computer-Assisted Personal Interviewing (CAPI) as much as possible. Further information on the development of the tests can be found in Lang (2005), Lang, Weiss, Stocker and von Rosenbladt (2007), and in Schupp, Herrmann, Jaensch and Lang (2008). References Baltes, P. B., Lindenberger, U. & Staudinger, U. M. (1998). Life-span theory in developmental
psychology. In R. M. Lerner (Ed.), Handbook of child psychology (5th edition, Vol. 1: Theoretical models of human development, pp. 1029 – 1143). New York: Wiley.
Lang, F. R. (2005). Erfassung des kognitiven Leistungspotenzials und der “Big Five” mit Computer-Assisted-Personal-Interviewing (CAPI): Zur Reliabilität und Validität zweier ultrakurzer Tests und des BFI-S (Assessment of cognitive capabilities and the Big Five with Computer-Assisted Personal Interviewing (CAPI): Reliability and validity). German Institute of Economic Research. Berlin: DIW Berlin.
Lang, F. R., Weiss, D., Stocker, A., & von Rosenbladt, B. (2007). Assessing cognitive capacities in Computer-Assisted Survey Research: Two ultra-short tests of intellectual ability in the German Socio-Economic Panel (SOEP). Schmollers Jahrbuch, 127, 183-192.
Lindenberger, U., & Baltes, P. B. (1997). Intellectual functioning in old and very old age: Cross-sectional results from the Berlin Aging Study. Psychology and Aging, 12, 410-432.
Schupp, J., Herrmann, S., Jaensch, P., & Lang, F. R. (2008). Erfassung kognitiver Leistungspotentiale Erwachsener im Sozio-oekonomischen Panel (SOEP). Berlin: DIW Berlin.
8
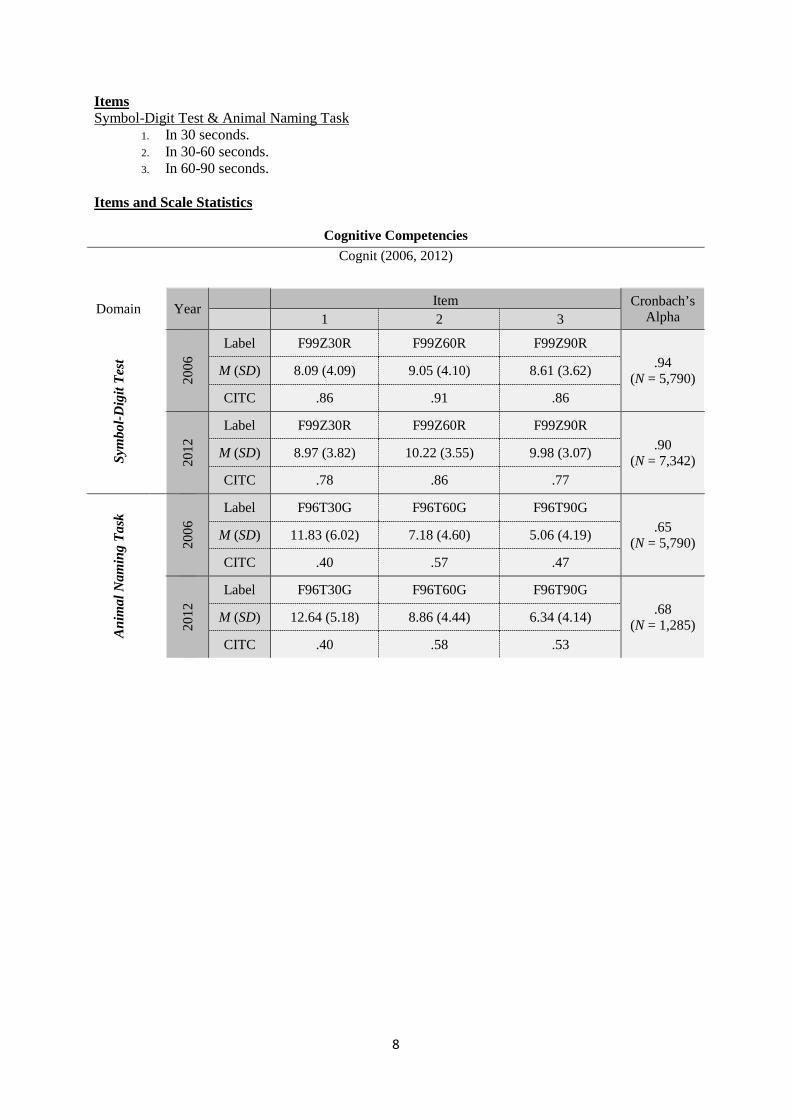
Items Symbol-Digit Test & Animal Naming Task
1. In 30 seconds. 2. In 30-60 seconds. 3. In 60-90 seconds.
Items and Scale Statistics
Cognitive Competencies Cognit (2006, 2012)
Domain
Year Item Cronbach’s Alpha 1 2 3
Sym
bol-D
igit
Test
20
06 Label F99Z30R F99Z60R F99Z90R
.94 (N = 5,790)
M (SD) 8.09 (4.09) 9.05 (4.10) 8.61 (3.62) CITC .86 .91 .86
20
12 Label F99Z30R F99Z60R F99Z90R
.90 (N = 7,342)
M (SD) 8.97 (3.82) 10.22 (3.55) 9.98 (3.07) CITC .78 .86 .77
Ani
mal
Nam
ing
Task
20
06 Label F96T30G F96T60G F96T90G
.65 (N = 5,790)
M (SD) 11.83 (6.02) 7.18 (4.60) 5.06 (4.19)
CITC .40 .57 .47
20
12 Label F96T30G F96T60G F96T90G
.68 (N = 1,285)
M (SD) 12.64 (5.18) 8.86 (4.44) 6.34 (4.14) CITC .40 .58 .53
9
Multiple-Choice Vocabulary Intelligence Test (MWT) Summary The Multiple-Choice Vocabulary Intelligence Test (Mehrfachwahl-Wortschatz-Intelligenztest; MWT; Lehrl, 2005) aims to measure the education- and experience-related cognitive pragmatics. The test asks for knowledge and is therefore only minimally influenced by currently availably cognitive capacities. The test takes about 5 minutes. The respondents are asked to find the existing and commonly known word in 37 groups of five words each with four words in each group being fictive and newly constructed (multiple-choice). The 37 groups are ordered by difficulty and the test is finished after three incorrect classifications. Scale Development The Multiple-Choice Vocabulary Intelligence Test (Version A) was modified for use with a computer-assisted survey mode. After pretesting in 2011 the test was introduced into the SOEP in 2012 (N = 6,864, M = 28.14, SD = 6.98). References Lehrl, S. (1991). Mehrfachwahl-Wortschatz-Intelligenztest MWT-A; (Parallelform zum MWT-B).
Erlangen: perimed-Fachbuch-Verl.-Ges. Items The MWT items are not allowed to be published.
10
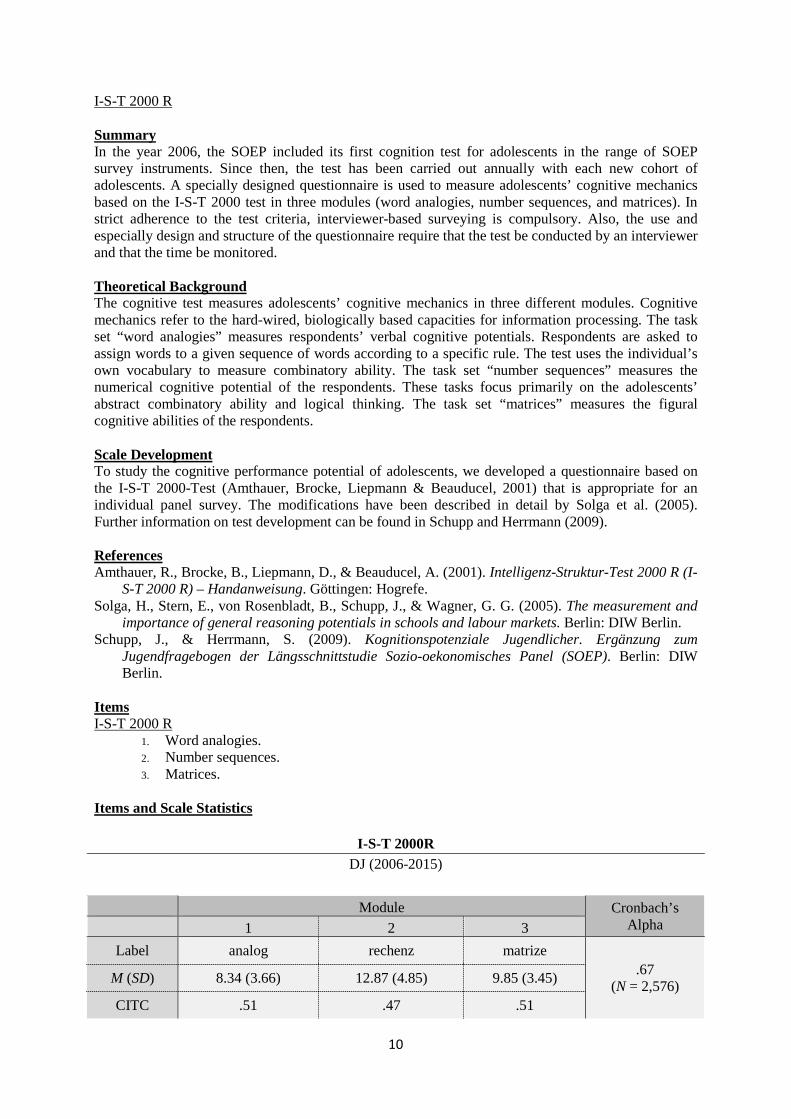
I-S-T 2000 R Summary In the year 2006, the SOEP included its first cognition test for adolescents in the range of SOEP survey instruments. Since then, the test has been carried out annually with each new cohort of adolescents. A specially designed questionnaire is used to measure adolescents’ cognitive mechanics based on the I-S-T 2000 test in three modules (word analogies, number sequences, and matrices). In strict adherence to the test criteria, interviewer-based surveying is compulsory. Also, the use and especially design and structure of the questionnaire require that the test be conducted by an interviewer and that the time be monitored. Theoretical Background The cognitive test measures adolescents’ cognitive mechanics in three different modules. Cognitive mechanics refer to the hard-wired, biologically based capacities for information processing. The task set “word analogies” measures respondents’ verbal cognitive potentials. Respondents are asked to assign words to a given sequence of words according to a specific rule. The test uses the individual’s own vocabulary to measure combinatory ability. The task set “number sequences” measures the numerical cognitive potential of the respondents. These tasks focus primarily on the adolescents’ abstract combinatory ability and logical thinking. The task set “matrices” measures the figural cognitive abilities of the respondents. Scale Development To study the cognitive performance potential of adolescents, we developed a questionnaire based on the I-S-T 2000-Test (Amthauer, Brocke, Liepmann & Beauducel, 2001) that is appropriate for an individual panel survey. The modifications have been described in detail by Solga et al. (2005). Further information on test development can be found in Schupp and Herrmann (2009). References Amthauer, R., Brocke, B., Liepmann, D., & Beauducel, A. (2001). Intelligenz-Struktur-Test 2000 R (I-
S-T 2000 R) – Handanweisung. Göttingen: Hogrefe. Solga, H., Stern, E., von Rosenbladt, B., Schupp, J., & Wagner, G. G. (2005). The measurement and
importance of general reasoning potentials in schools and labour markets. Berlin: DIW Berlin. Schupp, J., & Herrmann, S. (2009). Kognitionspotenziale Jugendlicher. Ergänzung zum
Jugendfragebogen der Längsschnittstudie Sozio-oekonomisches Panel (SOEP). Berlin: DIW Berlin.
Items I-S-T 2000 R
1. Word analogies. 2. Number sequences. 3. Matrices.
Items and Scale Statistics
I-S-T 2000R DJ (2006-2015)
Module Cronbach’s Alpha 1 2 3
Label analog rechenz matrize .67
(N = 2,576) M (SD) 8.34 (3.66) 12.87 (4.85) 9.85 (3.45)
CITC .51 .47 .51

11
Effort-Reward Imbalance Model
Summary The Effort-Reward Imbalance Model is designed to measure occupational and job stress. In this model, stress is conceptualized as high work-related effort coupled with low control over job-related rewards. The model also considers the personality trait of excessive willingness to overexert oneself, which exacerbates the negative health consequences of occupational stress. The SOEP uses a shortened version of the ERI questionnaire comprising a total of 16 four- or five-level items. The ERI questionnaire was used in the SOEP in 2006 and 2011. Theoretical Background The ERI model is a newly developed instrument used to measure job stress and its negative health consequences (Siegrist, 1996). Job stress is conceptualized as the relation between demands and efforts on the one hand and rewards on the other. This conceptualization is based on the assumption that job relations are subject to the general social norm of reciprocity. The general reciprocity norm states that social interaction (here the performance of job tasks) always takes place in expectation of appropriate compensation. If this expectation is not fulfilled over the long term—that is, if the reciprocity norm is violated—in many cases the interaction will be terminated. The termination of employment relationships is often not possible on short notice or without far-reaching consequences, which means that employment relationships often have to be maintained while violating the norm of reciprocity. The resulting imbalance between high perceived demands and low perceived rewards is referred to as a “gratification crisis.” Gratification crises lead to lower job satisfaction and high stress levels, and thus constitute a risk factor for numerous psycho-social and stress-related illnesses (Siegrist, 1996). Alongside these external factors in work stress, the ERI model also contains an intrinsic dimension, “overcommitment,” or the excessive willingness to overexert oneself. This is based on the hypothesis that people with an excessive willingness to overexert themselves suffer more severely from gratification crises than individuals with a lower willingness to overexert themselves. Scale Development In the previous version, the instrument only contained 23 items. With the goal of achieving a more broadly applicable instrument, it was shortened to 16 items and used for the first time in this form in the 2006 SOEP questionnaire. Overcomitment was not shortened in the SOEP version, since the scale is already the product of various validation studies. References Department of Medical Sociology, Duesseldorf University (2008). Effort-reward imbalance at work:
Theory, measurement and evidence. Düsseldorf. Siegrist, J. (1996). Adverse health effects of high-effort/low-reward conditions. Journal of
Occupational Health Psychology, 1, 27.
12
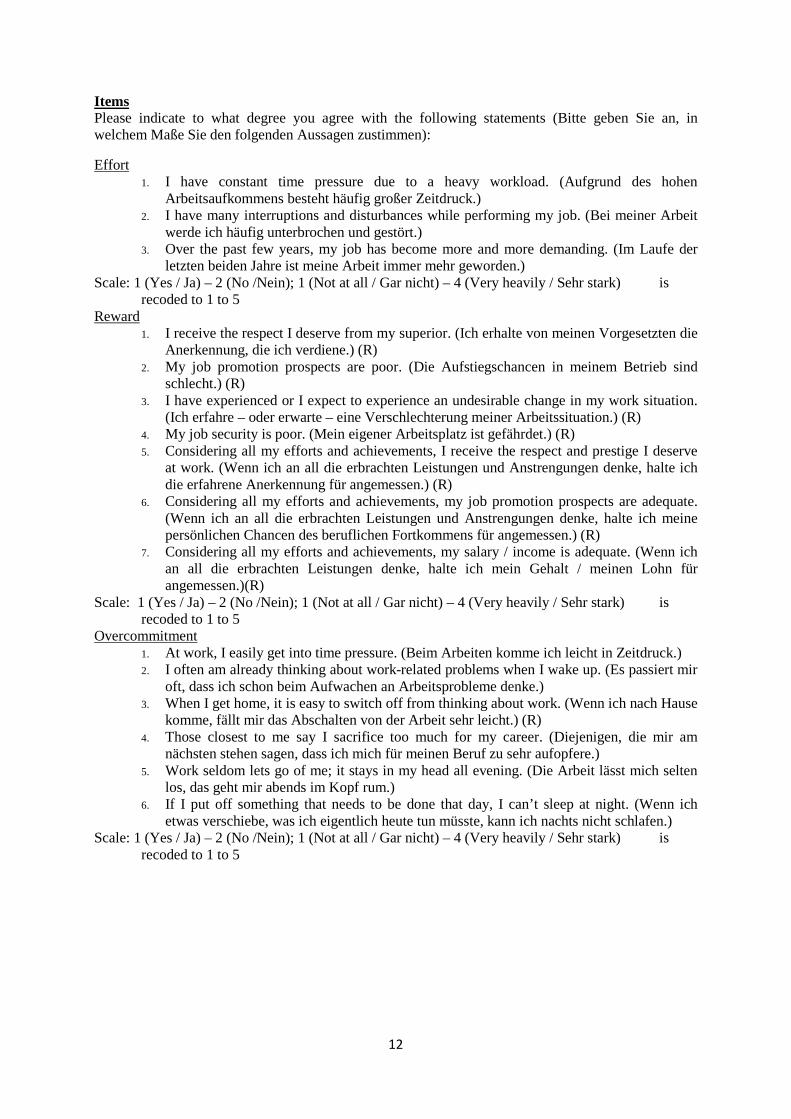
Items Please indicate to what degree you agree with the following statements (Bitte geben Sie an, in welchem Maße Sie den folgenden Aussagen zustimmen):
Effort 1. I have constant time pressure due to a heavy workload. (Aufgrund des hohen
Arbeitsaufkommens besteht häufig großer Zeitdruck.) 2. I have many interruptions and disturbances while performing my job. (Bei meiner Arbeit
werde ich häufig unterbrochen und gestört.) 3. Over the past few years, my job has become more and more demanding. (Im Laufe der
letzten beiden Jahre ist meine Arbeit immer mehr geworden.) Scale: 1 (Yes / Ja) – 2 (No /Nein); 1 (Not at all / Gar nicht) – 4 (Very heavily / Sehr stark) is
recoded to 1 to 5 Reward
1. I receive the respect I deserve from my superior. (Ich erhalte von meinen Vorgesetzten die Anerkennung, die ich verdiene.) (R)
2. My job promotion prospects are poor. (Die Aufstiegschancen in meinem Betrieb sind schlecht.) (R)
3. I have experienced or I expect to experience an undesirable change in my work situation. (Ich erfahre – oder erwarte – eine Verschlechterung meiner Arbeitssituation.) (R)
4. My job security is poor. (Mein eigener Arbeitsplatz ist gefährdet.) (R) 5. Considering all my efforts and achievements, I receive the respect and prestige I deserve
at work. (Wenn ich an all die erbrachten Leistungen und Anstrengungen denke, halte ich die erfahrene Anerkennung für angemessen.) (R)
6. Considering all my efforts and achievements, my job promotion prospects are adequate. (Wenn ich an all die erbrachten Leistungen und Anstrengungen denke, halte ich meine persönlichen Chancen des beruflichen Fortkommens für angemessen.) (R)
7. Considering all my efforts and achievements, my salary / income is adequate. (Wenn ich an all die erbrachten Leistungen denke, halte ich mein Gehalt / meinen Lohn für angemessen.)(R)
Scale: 1 (Yes / Ja) – 2 (No /Nein); 1 (Not at all / Gar nicht) – 4 (Very heavily / Sehr stark) is recoded to 1 to 5
Overcommitment 1. At work, I easily get into time pressure. (Beim Arbeiten komme ich leicht in Zeitdruck.) 2. I often am already thinking about work-related problems when I wake up. (Es passiert mir
oft, dass ich schon beim Aufwachen an Arbeitsprobleme denke.) 3. When I get home, it is easy to switch off from thinking about work. (Wenn ich nach Hause
komme, fällt mir das Abschalten von der Arbeit sehr leicht.) (R) 4. Those closest to me say I sacrifice too much for my career. (Diejenigen, die mir am
nächsten stehen sagen, dass ich mich für meinen Beruf zu sehr aufopfere.) 5. Work seldom lets go of me; it stays in my head all evening. (Die Arbeit lässt mich selten
los, das geht mir abends im Kopf rum.) 6. If I put off something that needs to be done that day, I can’t sleep at night. (Wenn ich
etwas verschiebe, was ich eigentlich heute tun müsste, kann ich nachts nicht schlafen.) Scale: 1 (Yes / Ja) – 2 (No /Nein); 1 (Not at all / Gar nicht) – 4 (Very heavily / Sehr stark) is
recoded to 1 to 5
13
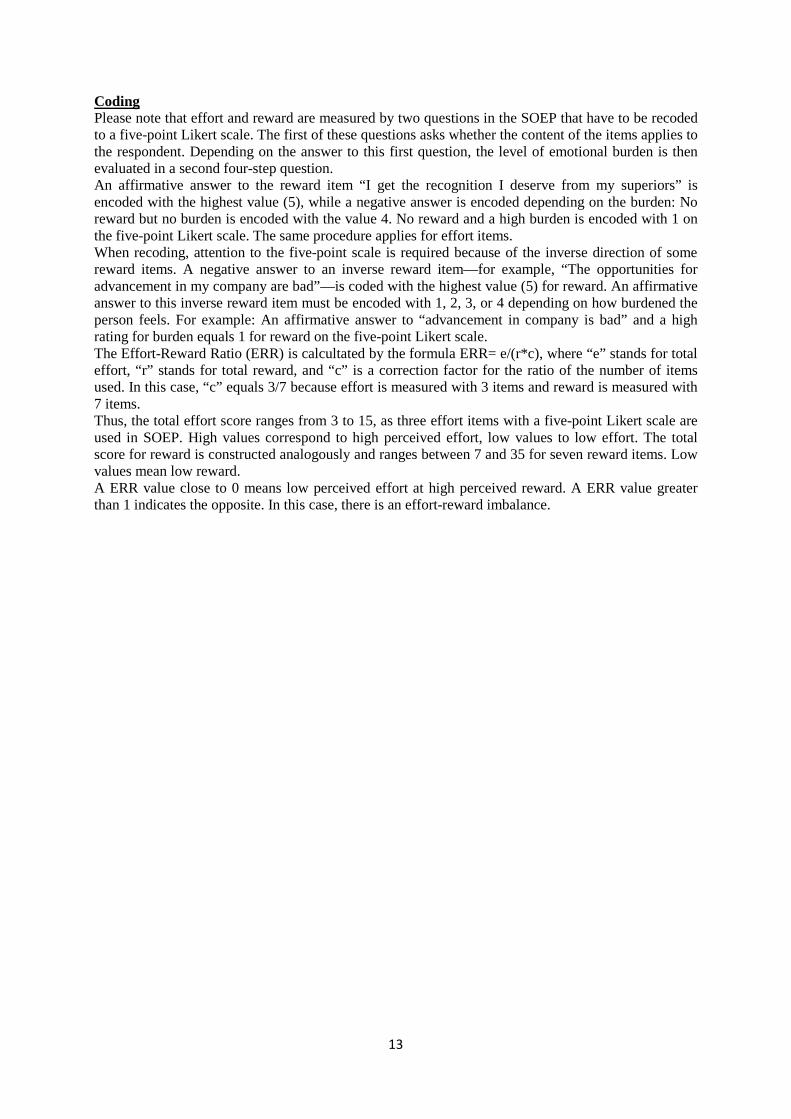
Coding Please note that effort and reward are measured by two questions in the SOEP that have to be recoded to a five-point Likert scale. The first of these questions asks whether the content of the items applies to the respondent. Depending on the answer to this first question, the level of emotional burden is then evaluated in a second four-step question. An affirmative answer to the reward item “I get the recognition I deserve from my superiors” is encoded with the highest value (5), while a negative answer is encoded depending on the burden: No reward but no burden is encoded with the value 4. No reward and a high burden is encoded with 1 on the five-point Likert scale. The same procedure applies for effort items. When recoding, attention to the five-point scale is required because of the inverse direction of some reward items. A negative answer to an inverse reward item—for example, “The opportunities for advancement in my company are bad”—is coded with the highest value (5) for reward. An affirmative answer to this inverse reward item must be encoded with 1, 2, 3, or 4 depending on how burdened the person feels. For example: An affirmative answer to “advancement in company is bad” and a high rating for burden equals 1 for reward on the five-point Likert scale. The Effort-Reward Ratio (ERR) is calcultated by the formula ERR= e/(r*c), where “e” stands for total effort, “r” stands for total reward, and “c” is a correction factor for the ratio of the number of items used. In this case, “c” equals 3/7 because effort is measured with 3 items and reward is measured with 7 items. Thus, the total effort score ranges from 3 to 15, as three effort items with a five-point Likert scale are used in SOEP. High values correspond to high perceived effort, low values to low effort. The total score for reward is constructed analogously and ranges between 7 and 35 for seven reward items. Low values mean low reward. A ERR value close to 0 means low perceived effort at high perceived reward. A ERR value greater than 1 indicates the opposite. In this case, there is an effort-reward imbalance.
Items and Scale Statistics
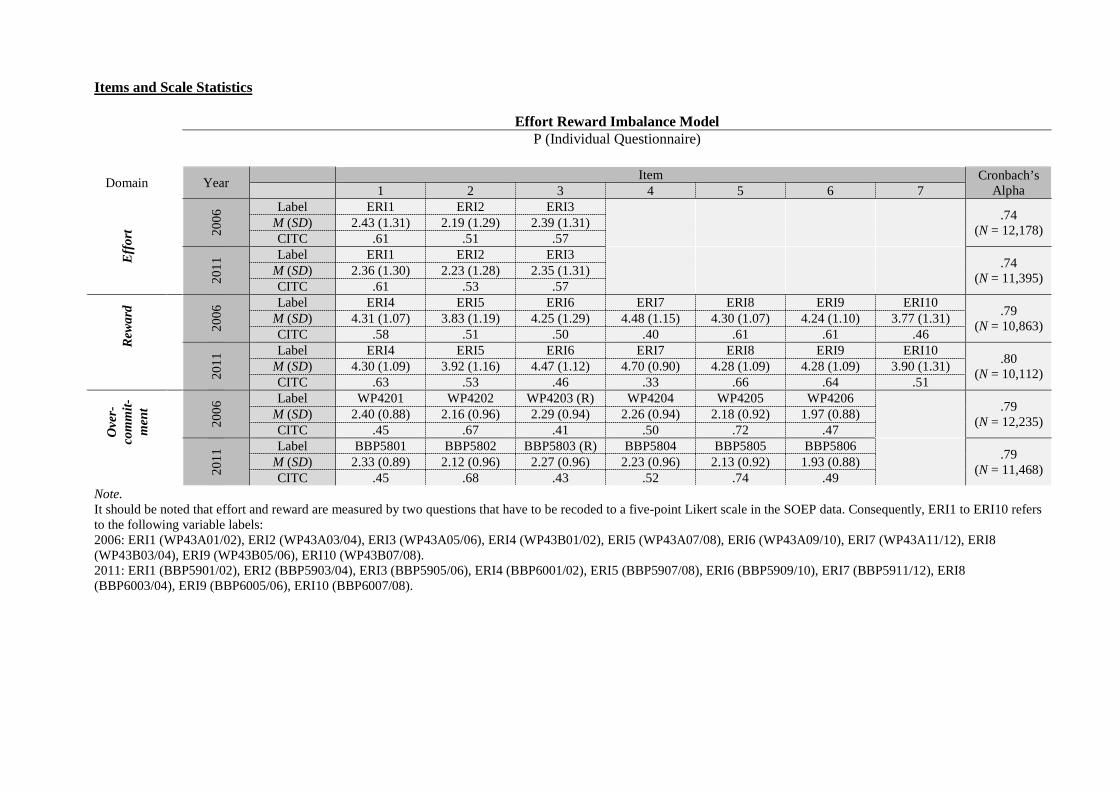
Effort Reward Imbalance Model
P (Individual Questionnaire)
Domain Year Item Cronbach’s Alpha 1 2 3 4 5 6 7
Eff
ort
2006
Label ERI1 ERI2 ERI3 .74
(N = 12,178) M (SD) 2.43 (1.31) 2.19 (1.29) 2.39 (1.31) CITC .61 .51 .57
2011
Label ERI1 ERI2 ERI3 .74
(N = 11,395) M (SD) 2.36 (1.30) 2.23 (1.28) 2.35 (1.31) CITC .61 .53 .57
Rew
ard
2006
Label ERI4 ERI5 ERI6 ERI7 ERI8 ERI9 ERI10 .79 (N = 10,863) M (SD) 4.31 (1.07) 3.83 (1.19) 4.25 (1.29) 4.48 (1.15) 4.30 (1.07) 4.24 (1.10) 3.77 (1.31)
CITC .58 .51 .50 .40 .61 .61 .46
2011
Label ERI4 ERI5 ERI6 ERI7 ERI8 ERI9 ERI10 .80 (N = 10,112) M (SD) 4.30 (1.09) 3.92 (1.16) 4.47 (1.12) 4.70 (0.90) 4.28 (1.09) 4.28 (1.09) 3.90 (1.31)
CITC .63 .53 .46 .33 .66 .64 .51
Ove
r-co
mm
it-m
ent
2006
Label WP4201 WP4202 WP4203 (R) WP4204 WP4205 WP4206 .79
(N = 12,235) M (SD) 2.40 (0.88) 2.16 (0.96) 2.29 (0.94) 2.26 (0.94) 2.18 (0.92) 1.97 (0.88) CITC .45 .67 .41 .50 .72 .47
2011
Label BBP5801 BBP5802 BBP5803 (R) BBP5804 BBP5805 BBP5806 .79
(N = 11,468) M (SD) 2.33 (0.89) 2.12 (0.96) 2.27 (0.96) 2.23 (0.96) 2.13 (0.92) 1.93 (0.88) CITC .45 .68 .43 .52 .74 .49
Note. It should be noted that effort and reward are measured by two questions that have to be recoded to a five-point Likert scale in the SOEP data. Consequently, ERI1 to ERI10 refers to the following variable labels: 2006: ERI1 (WP43A01/02), ERI2 (WP43A03/04), ERI3 (WP43A05/06), ERI4 (WP43B01/02), ERI5 (WP43A07/08), ERI6 (WP43A09/10), ERI7 (WP43A11/12), ERI8 (WP43B03/04), ERI9 (WP43B05/06), ERI10 (WP43B07/08). 2011: ERI1 (BBP5901/02), ERI2 (BBP5903/04), ERI3 (BBP5905/06), ERI4 (BBP6001/02), ERI5 (BBP5907/08), ERI6 (BBP5909/10), ERI7 (BBP5911/12), ERI8 (BBP6003/04), ERI9 (BBP6005/06), ERI10 (BBP6007/08).
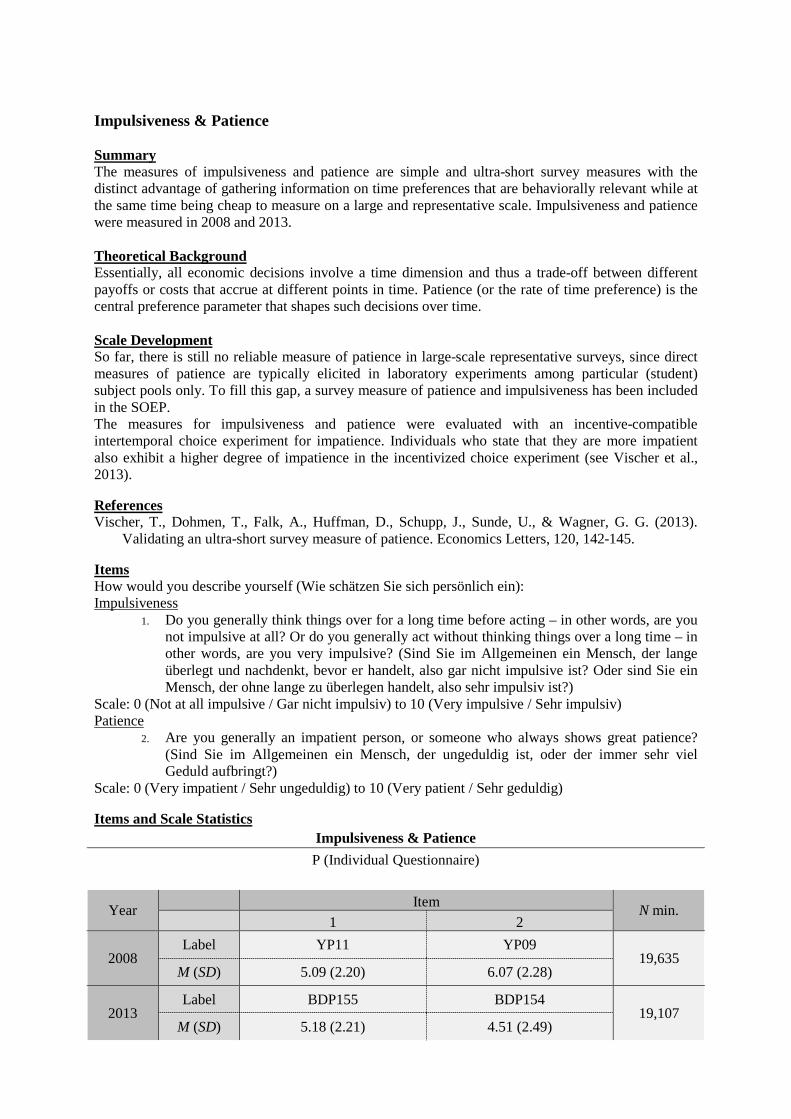
Impulsiveness & Patience Summary The measures of impulsiveness and patience are simple and ultra-short survey measures with the distinct advantage of gathering information on time preferences that are behaviorally relevant while at the same time being cheap to measure on a large and representative scale. Impulsiveness and patience were measured in 2008 and 2013. Theoretical Background Essentially, all economic decisions involve a time dimension and thus a trade-off between different payoffs or costs that accrue at different points in time. Patience (or the rate of time preference) is the central preference parameter that shapes such decisions over time. Scale Development So far, there is still no reliable measure of patience in large-scale representative surveys, since direct measures of patience are typically elicited in laboratory experiments among particular (student) subject pools only. To fill this gap, a survey measure of patience and impulsiveness has been included in the SOEP. The measures for impulsiveness and patience were evaluated with an incentive-compatible intertemporal choice experiment for impatience. Individuals who state that they are more impatient also exhibit a higher degree of impatience in the incentivized choice experiment (see Vischer et al., 2013). References Vischer, T., Dohmen, T., Falk, A., Huffman, D., Schupp, J., Sunde, U., & Wagner, G. G. (2013).
Validating an ultra-short survey measure of patience. Economics Letters, 120, 142-145. Items How would you describe yourself (Wie schätzen Sie sich persönlich ein): Impulsiveness
1. Do you generally think things over for a long time before acting – in other words, are you not impulsive at all? Or do you generally act without thinking things over a long time – in other words, are you very impulsive? (Sind Sie im Allgemeinen ein Mensch, der lange überlegt und nachdenkt, bevor er handelt, also gar nicht impulsive ist? Oder sind Sie ein Mensch, der ohne lange zu überlegen handelt, also sehr impulsiv ist?)
Scale: 0 (Not at all impulsive / Gar nicht impulsiv) to 10 (Very impulsive / Sehr impulsiv) Patience
2. Are you generally an impatient person, or someone who always shows great patience? (Sind Sie im Allgemeinen ein Mensch, der ungeduldig ist, oder der immer sehr viel Geduld aufbringt?)
Scale: 0 (Very impatient / Sehr ungeduldig) to 10 (Very patient / Sehr geduldig) Items and Scale Statistics
Impulsiveness & Patience P (Individual Questionnaire)
Year Item N min. 1 2
2008 Label YP11 YP09
19,635 M (SD) 5.09 (2.20) 6.07 (2.28)
2013 Label BDP155 BDP154
19,107 M (SD) 5.18 (2.21) 4.51 (2.49)
16
Life Goals Summary Respondents’ life goals have been measured in the SOEP since 1990 at two- to four-year intervals with ten items that can be grouped into three scales (success, family life, and altruism). Theoretical Background Life goals can be thought of as “relatively long- term, value-laden life objectives” (Meier et al., 1959). They have been conceptualized as “organizers” of developmental self-regulation that individuals use to influence their own development as they adapt to the constraints of a given situation (Heckhausen, 1999). Individual life goals correspond to societal values to the extent that they are aligned with cultural preferences, if not culturally prescribed norms. A classic example is the goal of material success as embodied in the achievement of money, power, and security, which in turn lead to prestige and social recognition. However, overarching non-monetary goals such as “the good life” or “personal development” are also taking on an increasingly important role in individuals’ lives (Meier et al., 1959). Research on life goals has investigated their impact on individuals’ future orientations and their occupational, educational, and family-related decision making (Chang et al., 2006). Life goals also play a prominent role in motivational theories of life-span development, which focus on goal commitment, planning, and eventual goal attainment (Heckhausen et al., 2010). Another strand of research is concerned with the prioritization of life goals and perceived control over goal attainment (Heckhausen, 1999). Recent evidence that life goals play a role in life satisfaction has contributed to the research on subjective well-being and life satisfaction (Heady 2008). Scale Development The items are based (albeit with some changes of wording) on a classification of goals and measures initially developed by Kluckhohn and Strodtbeck (1961) and translated into German by Bielenski and Strümpel (1988). More information on the development of the scale is given by Headey (2008). References Bielenski, H. & Strümpel, B. (1988). Eingeschränkte Erwerbsarbeit bei Frauen und Männern. Fakten
- Wünsche - Realisierungschancen. Berlin: Edition Sigma. Chang, E. S., Chen, C, Greenberger, E., Dooley, D., & Heckhausen, J. (2006). What do they want in
life?: The life goals of a multi-ethnic, multi-generational sample of high school seniors. Journal of Youth and Adolescence, 35, 302-313.
Headey, B. W. (2008). Life goals matter to happiness: A revision of set-point theory. Social Indicators Research, 86, 213-231.
Heckhausen, J. (1999). Developmental regulation in adulthood: Age-normative and sociostructional constraints as adaptive challenges. New York: Cambridge University Press.
Heckhausen, J., Wrosch, C., & Schulz, R. (2010). A motivational theory of life-span development. Psychological Review, 117, 32-60.
Kluckhohn, F. R., & Strodtbeck, F. L. (1961). Variations in value orientations. Evanston, Illinois: Row, Peterson.
Meier, D. L., & Bell, W. (1959). Anomia and differential access to the achievement of life goals. American Sociological Review, 24, 189-202.
17
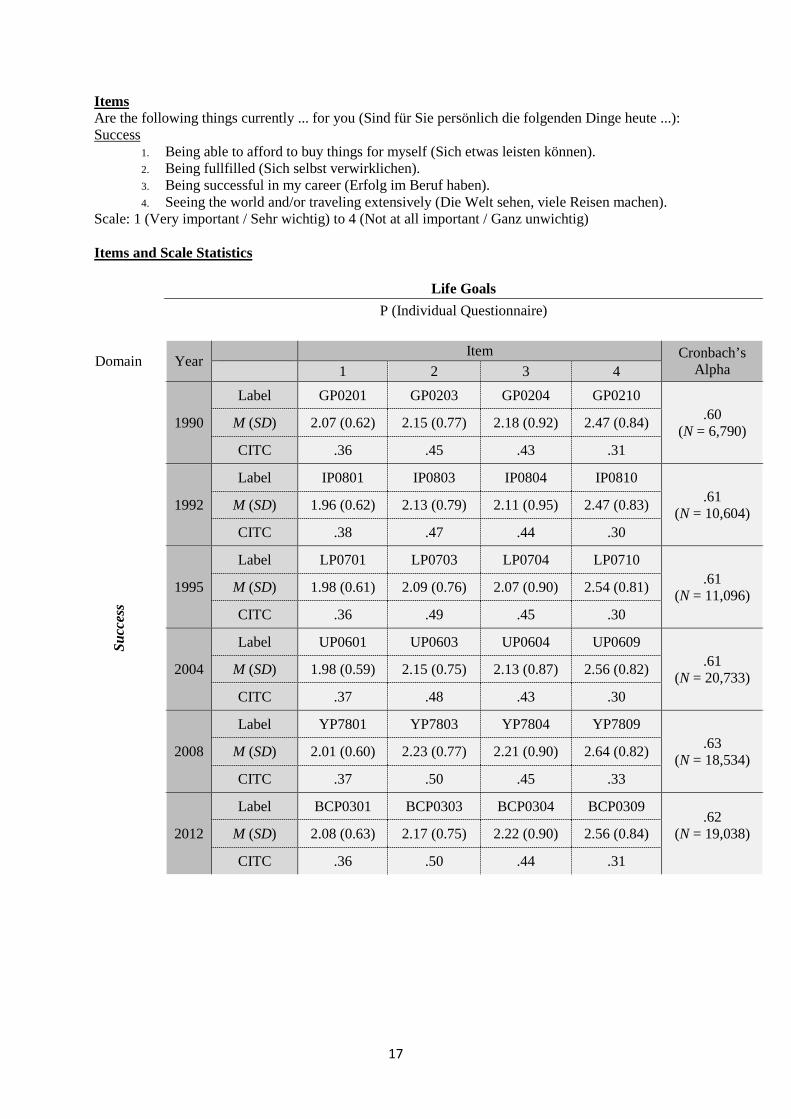
Items Are the following things currently ... for you (Sind für Sie persönlich die folgenden Dinge heute ...): Success
1. Being able to afford to buy things for myself (Sich etwas leisten können). 2. Being fullfilled (Sich selbst verwirklichen). 3. Being successful in my career (Erfolg im Beruf haben). 4. Seeing the world and/or traveling extensively (Die Welt sehen, viele Reisen machen).
Scale: 1 (Very important / Sehr wichtig) to 4 (Not at all important / Ganz unwichtig) Items and Scale Statistics
Life Goals P (Individual Questionnaire)
Domain
Year Item Cronbach’s Alpha 1 2 3 4
Succ
ess
1990
Label GP0201 GP0203 GP0204 GP0210 .60
(N = 6,790) M (SD) 2.07 (0.62) 2.15 (0.77) 2.18 (0.92) 2.47 (0.84) CITC .36 .45 .43 .31
1992
Label IP0801 IP0803 IP0804 IP0810 .61
(N = 10,604) M (SD) 1.96 (0.62) 2.13 (0.79) 2.11 (0.95) 2.47 (0.83) CITC .38 .47 .44 .30
1995
Label LP0701 LP0703 LP0704 LP0710 .61
(N = 11,096) M (SD) 1.98 (0.61) 2.09 (0.76) 2.07 (0.90) 2.54 (0.81) CITC .36 .49 .45 .30
2004
Label UP0601 UP0603 UP0604 UP0609 .61
(N = 20,733) M (SD) 1.98 (0.59) 2.15 (0.75) 2.13 (0.87) 2.56 (0.82) CITC .37 .48 .43 .30
2008
Label YP7801 YP7803 YP7804 YP7809 .63
(N = 18,534) M (SD) 2.01 (0.60) 2.23 (0.77) 2.21 (0.90) 2.64 (0.82) CITC .37 .50 .45 .33
2012
Label BCP0301 BCP0303 BCP0304 BCP0309 .62
(N = 19,038)
M (SD) 2.08 (0.63) 2.17 (0.75) 2.22 (0.90) 2.56 (0.84) CITC .36 .50 .44 .31
18
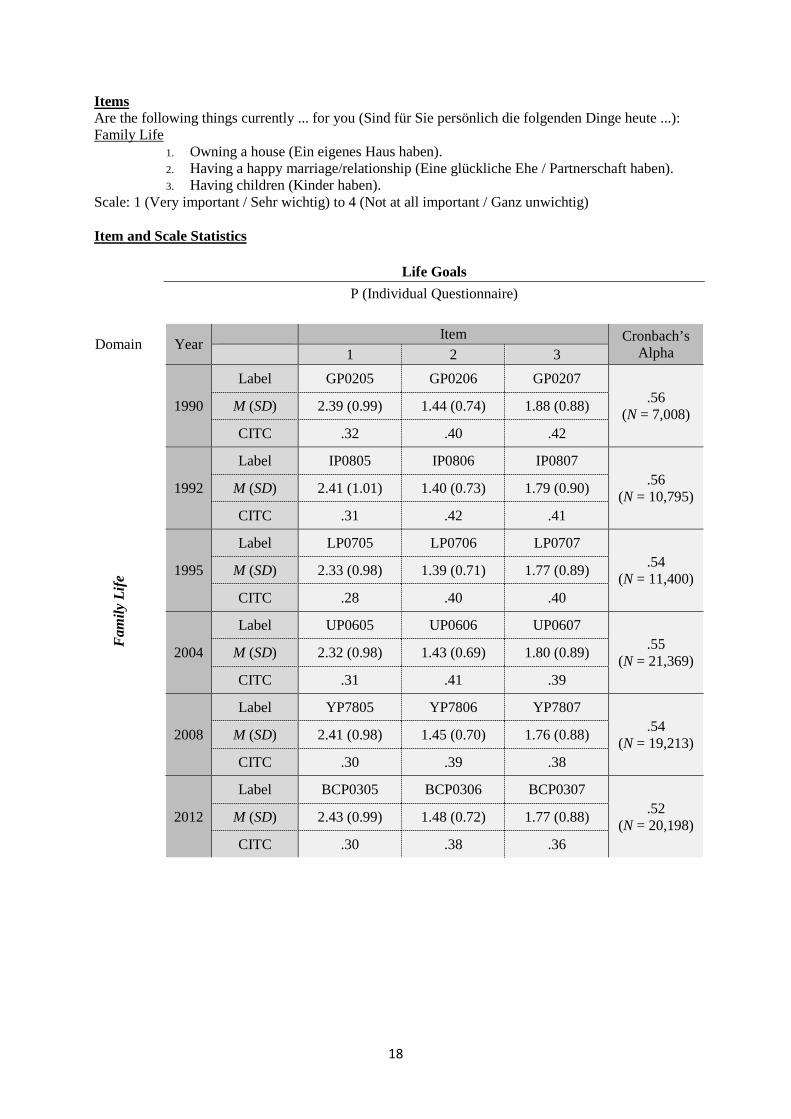
Items Are the following things currently ... for you (Sind für Sie persönlich die folgenden Dinge heute ...): Family Life
1. Owning a house (Ein eigenes Haus haben). 2. Having a happy marriage/relationship (Eine glückliche Ehe / Partnerschaft haben). 3. Having children (Kinder haben).
Scale: 1 (Very important / Sehr wichtig) to 4 (Not at all important / Ganz unwichtig) Item and Scale Statistics
Life Goals P (Individual Questionnaire)
Domain
Year Item Cronbach’s Alpha 1 2 3
Fam
ily L
ife
1990
Label GP0205 GP0206 GP0207 .56
(N = 7,008) M (SD) 2.39 (0.99) 1.44 (0.74) 1.88 (0.88) CITC .32 .40 .42
1992
Label IP0805 IP0806 IP0807 .56
(N = 10,795) M (SD) 2.41 (1.01) 1.40 (0.73) 1.79 (0.90) CITC .31 .42 .41
1995
Label LP0705 LP0706 LP0707 .54
(N = 11,400) M (SD) 2.33 (0.98) 1.39 (0.71) 1.77 (0.89) CITC .28 .40 .40
2004
Label UP0605 UP0606 UP0607 .55
(N = 21,369) M (SD) 2.32 (0.98) 1.43 (0.69) 1.80 (0.89) CITC .31 .41 .39
2008
Label YP7805 YP7806 YP7807 .54
(N = 19,213) M (SD) 2.41 (0.98) 1.45 (0.70) 1.76 (0.88) CITC .30 .39 .38
2012
Label BCP0305 BCP0306 BCP0307 .52
(N = 20,198) M (SD) 2.43 (0.99) 1.48 (0.72) 1.77 (0.88) CITC .30 .38 .36
19
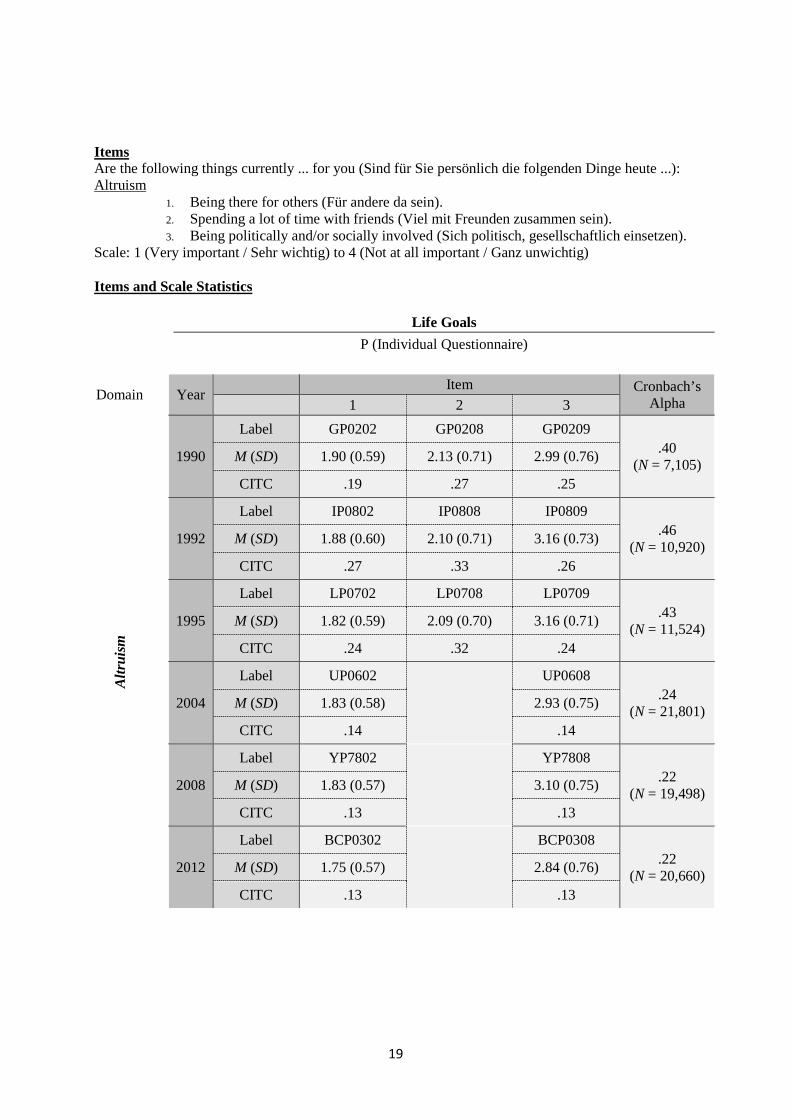
Items Are the following things currently ... for you (Sind für Sie persönlich die folgenden Dinge heute ...): Altruism
1. Being there for others (Für andere da sein). 2. Spending a lot of time with friends (Viel mit Freunden zusammen sein). 3. Being politically and/or socially involved (Sich politisch, gesellschaftlich einsetzen).
Scale: 1 (Very important / Sehr wichtig) to 4 (Not at all important / Ganz unwichtig) Items and Scale Statistics
Life Goals P (Individual Questionnaire)
Domain
Year Item Cronbach’s Alpha 1 2 3
Altr
uism
1990
Label GP0202 GP0208 GP0209 .40
(N = 7,105) M (SD) 1.90 (0.59) 2.13 (0.71) 2.99 (0.76) CITC .19 .27 .25
1992
Label IP0802 IP0808 IP0809 .46
(N = 10,920) M (SD) 1.88 (0.60) 2.10 (0.71) 3.16 (0.73) CITC .27 .33 .26
1995
Label LP0702 LP0708 LP0709 .43
(N = 11,524) M (SD) 1.82 (0.59) 2.09 (0.70) 3.16 (0.71) CITC .24 .32 .24
2004
Label UP0602
UP0608 .24
(N = 21,801) M (SD) 1.83 (0.58) 2.93 (0.75) CITC .14 .14
2008
Label YP7802
YP7808 .22
(N = 19,498) M (SD) 1.83 (0.57) 3.10 (0.75) CITC .13 .13
2012
Label BCP0302
BCP0308 .22
(N = 20,660) M (SD) 1.75 (0.57) 2.84 (0.76) CITC .13 .13
20
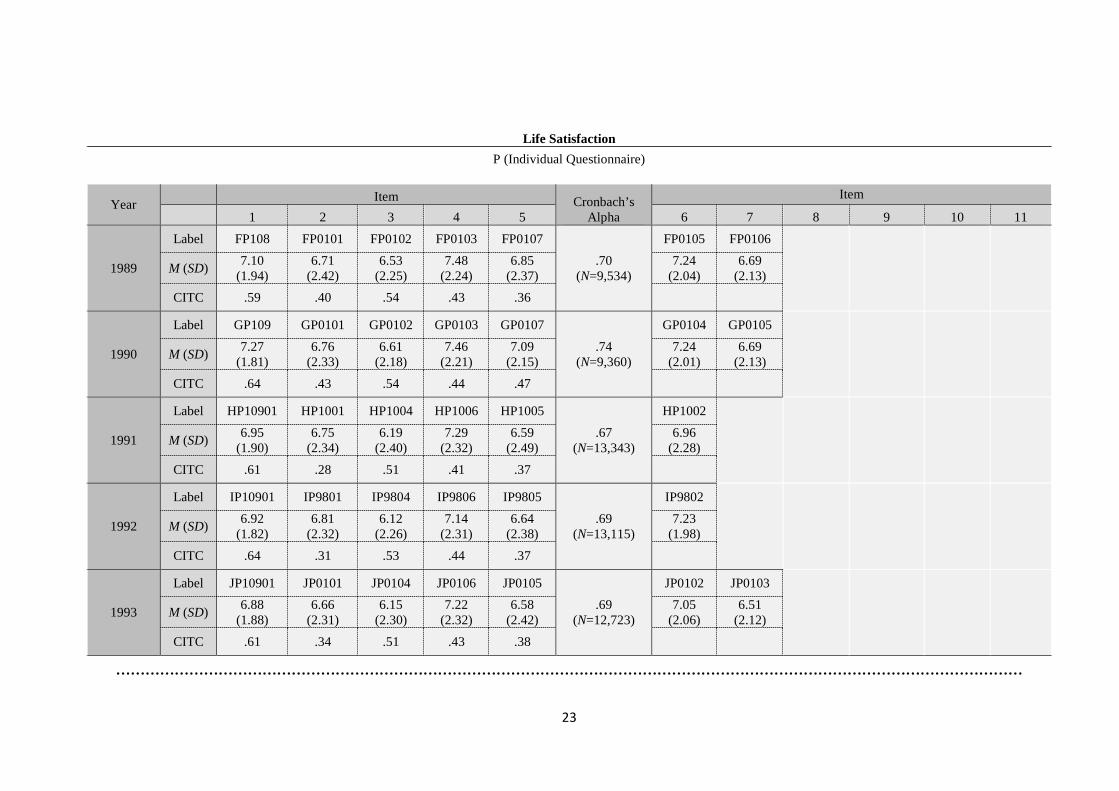
Life Satisfaction Summary General life satisfaction has been measured with an individual item in the SOEP on an annual basis since 1984. Domain-specific life satisfaction was initially measured with seven items (1984-1990), and since 2008 with ten items. Items 1 to 5 can be combined into one scale in all survey years (Schimmack, Krause, Wagner, & Schupp, 2009). In addition, satisfaction in 11 further domains is surveyed at irregular intervals. Theoretical Background Since its inception, the SOEP has included cognitive measures of well-being. The first measure is the global 11‐point rating of life satisfaction (Schimmack, Schupp, & Wagner, 2008). This item is used almost exclusively as a measure of well-being in the SOEP. The reasons for its popularity are its high face validity and the widespread use of life satisfaction ratings in the well-being literature. Single-item measures of life satisfaction are a reasonably valid and common way to measure general life satisfaction: moderate associations with other well-being measures, including written interviews, informant reports, and measures of daily affect are reported by Sandvik, Diener, and Seidlitz (1993). Research using the World Value Survey (http://www.worldvaluessurvey.org) found single-item measures of life satisfaction to be positively related to affect balance and positive affect, and inversely related to negative affect (Suh et al., 1998). The second measure is the average of various domain satisfactions that are routinely assessed in the SOEP (health, household income, dwelling, and leisure time). This measure has two drawbacks. First, it does not weigh domains by their subjective importance. Second, the measure fails to capture aspects of well-being that are not covered by the domains included in the survey (Schimmak, 2008). A key advantage of this measure is that it relies not solely on respondents’ ability to summarize and weigh all relevant aspects of their lives in response to a single question about satisfaction with life in general. Scale Development Information on the further development, reliability, and validity of the items can be found in Kroh (2006), in Schimmak (2008) and in Schimmack, Krause, Wagner, & Schupp (2009). References Kroh, M. (2006). An experimental evaluation of popular well-being measures. Berlin: DIW Berlin. Sandvik, E., Diener, E., & Seidlitz, L. (1993). Subjective well-being: The convergence and stability of
self-report and non-self-report measures. Journal of Personality, 61, 317–342. Schimmack, U., Schupp, J., & Wagner, G. G. (2008). The influence of environment and personality on
the affective and cognitive component of subjective well‐being. Social Indicators Research, 89, 41‐60.
Schimmack, U., Krause, P., Wagner, G. G., & Schupp, J. (2009). Stability and change of Well Being: An experimentally enhanced Latent State-Trait-Error Analysis. Social Indicators Research, 95, 19-31.
Suh, E., Diener, E., Oishi, S., & Triandis, H. C. (1998). The shifting basis of life satisfaction judgments across cultures: Emotions versus norms. Journal of Personality and Social Psychology, 74, 482–493.
21
Items 1. How satisfied are you with your life, all things considered? (Wie zufrieden sind Sie
gegenwärtig, alles in allem, mit Ihrem Leben?) How satisfied are you with (Wie zufrieden sind Sie):
2. your health (mit ihrer Gesundheit)? 3. your household income (mit dem Einkommen Ihres Haushalts)? 4. your dwelling (mit Ihrer Wohnung)? 5. your free time (mit Ihrer Freizeit / in den Jahren 1995, 1996: mit Ihrer Freizeittätigkeit)? 6. your job (mit ihrer Arbeit)? 7. your housework (mit ihrer Tätigkeit im Haushalt)? 8. the child care available (mit den vorhandenen Möglichkeiten der Kinderbetreuung)? 9. your personal income (mit Ihrem persönlichen Einkommen)? 10. your family life (mit Ihrem Familienleben)? 11. your sleep (mit Ihrem Schlaf)?
Scale: 0 (Completely dissatisfied / Ganz und gar unzufrieden) to 10 (Completely satisfied / Ganz und gar zufrieden) Test-Retest Correlations In 2005, 2006 and 2009, item 1 to 5 were included in retests taken by subsamples within 30 to 49 days after the initial test. Pooled across the years (minimal N = 603), test-retest correlations were (in scale order, item 1 to 5) .66, .64, .71, .67, and .56. The test-retest correlation of the scale based on these five items was .77.
22
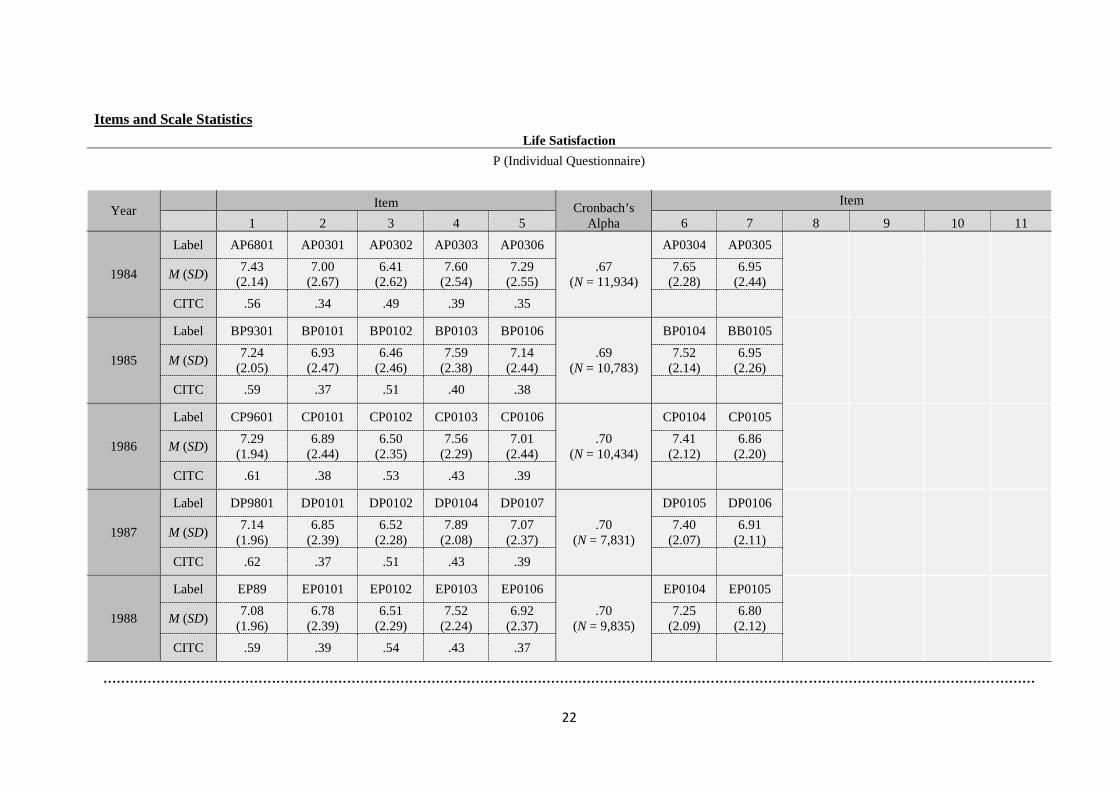
Items and Scale Statistics
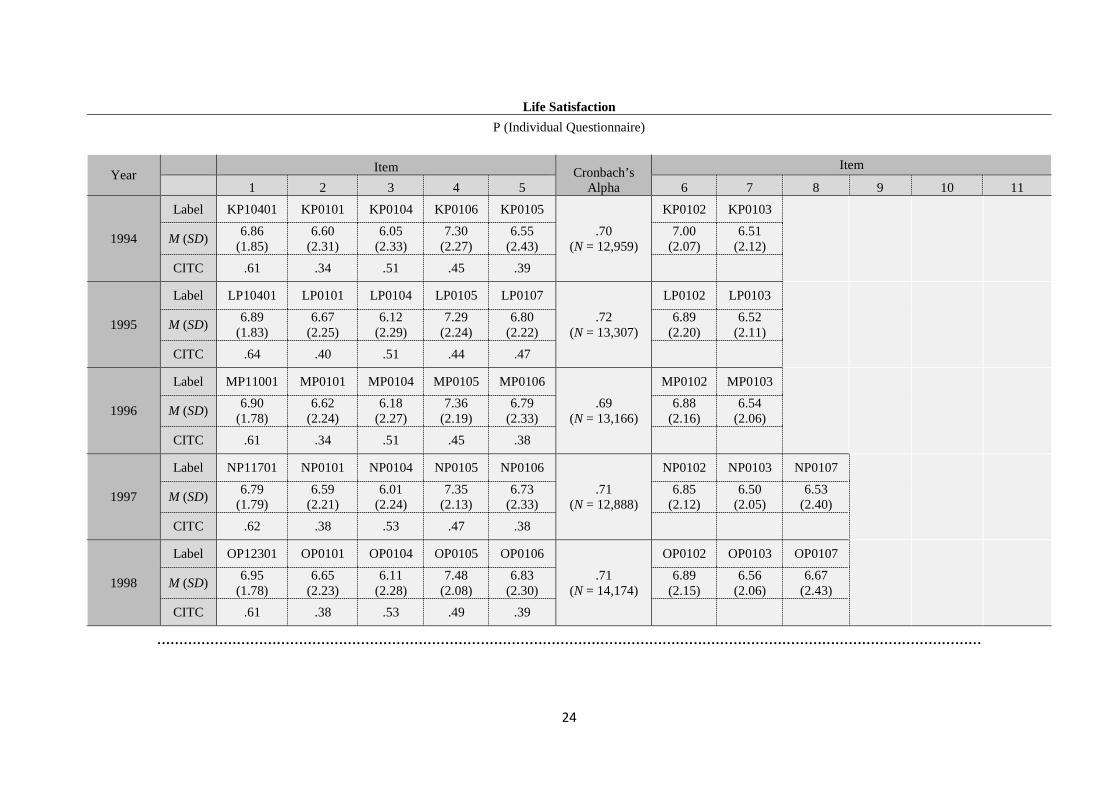
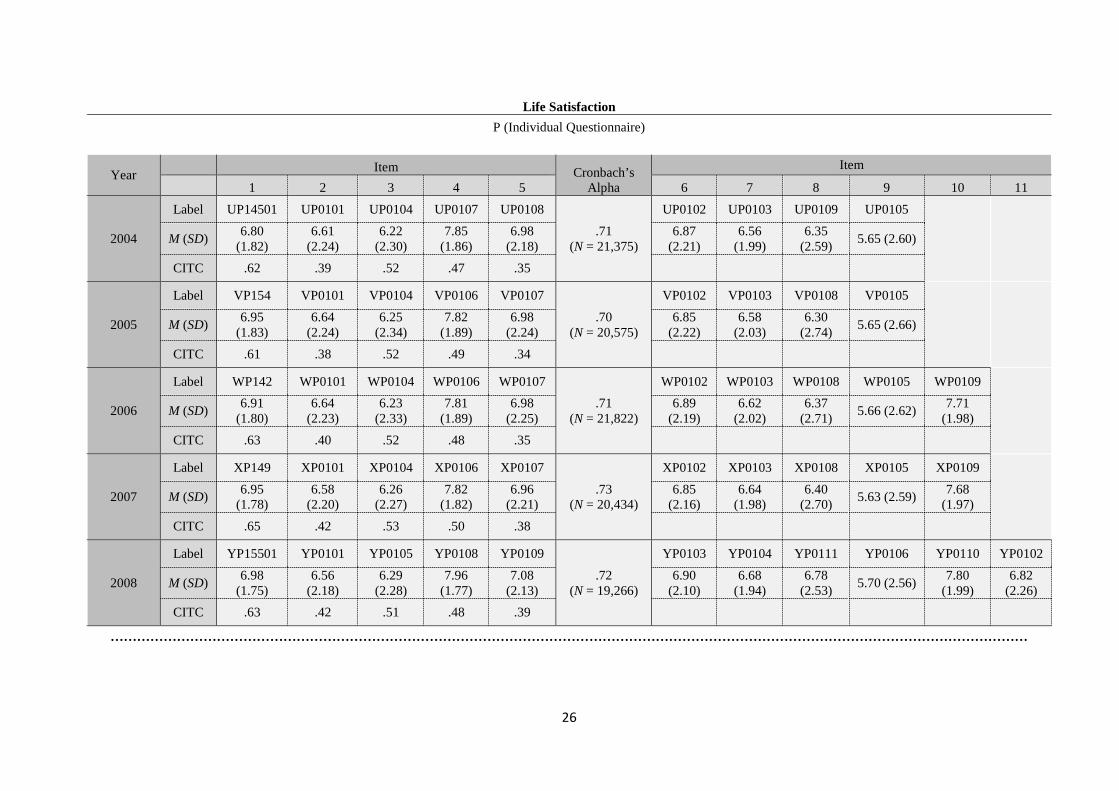
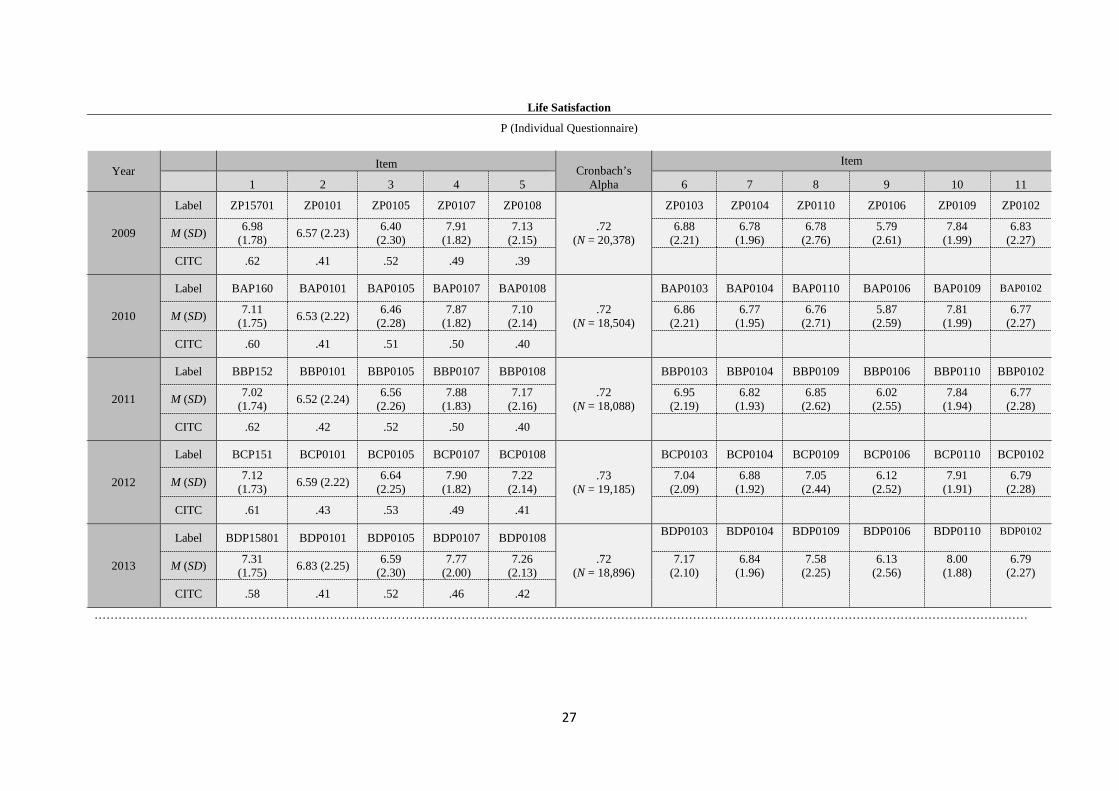
Life Satisfaction P (Individual Questionnaire)
Year Item Cronbach’s Alpha
Item 1 2 3 4 5 6 7 8 9 10 11
1984
Label AP6801 AP0301 AP0302 AP0303 AP0306 .67
(N = 11,934)
AP0304 AP0305
M (SD) 7.43 (2.14)
7.00 (2.67)
6.41 (2.62)
7.60 (2.54)
7.29 (2.55)
7.65 (2.28)
6.95 (2.44)
CITC .56 .34 .49 .39 .35
1985
Label BP9301 BP0101 BP0102 BP0103 BP0106 .69
(N = 10,783)
BP0104 BB0105
M (SD) 7.24 (2.05)
6.93 (2.47)
6.46 (2.46)
7.59 (2.38)
7.14 (2.44)
7.52 (2.14)
6.95 (2.26)
CITC .59 .37 .51 .40 .38
1986
Label CP9601 CP0101 CP0102 CP0103 CP0106 .70
(N = 10,434)
CP0104 CP0105
M (SD) 7.29 (1.94)
6.89 (2.44)
6.50 (2.35)
7.56 (2.29)
7.01 (2.44)
7.41 (2.12)
6.86 (2.20)
CITC .61 .38 .53 .43 .39
1987
Label DP9801 DP0101 DP0102 DP0104 DP0107 .70
(N = 7,831)
DP0105 DP0106
M (SD) 7.14 (1.96)
6.85 (2.39)
6.52 (2.28)
7.89 (2.08)
7.07 (2.37)
7.40 (2.07)
6.91 (2.11)
CITC .62 .37 .51 .43 .39
1988
Label EP89 EP0101 EP0102 EP0103 EP0106 .70
(N = 9,835)
EP0104 EP0105
M (SD) 7.08 (1.96)
6.78 (2.39)
6.51 (2.29)
7.52 (2.24)
6.92 (2.37)
7.25 (2.09)
6.80 (2.12)
CITC .59 .39 .54 .43 .37
…………………………………………………………………………………………………………………………………………………………………………………………
23
Life Satisfaction P (Individual Questionnaire)
Year Item Cronbach’s Alpha
Item 1 2 3 4 5 6 7 8 9 10 11
1989
Label FP108 FP0101 FP0102 FP0103 FP0107 .70
(N=9,534)
FP0105 FP0106
M (SD) 7.10 (1.94)
6.71 (2.42)
6.53 (2.25)
7.48 (2.24)
6.85 (2.37)
7.24 (2.04)
6.69 (2.13)
CITC .59 .40 .54 .43 .36
1990
Label GP109 GP0101 GP0102 GP0103 GP0107 .74
(N=9,360)
GP0104 GP0105
M (SD) 7.27 (1.81)
6.76 (2.33)
6.61 (2.18)
7.46 (2.21)
7.09 (2.15)
7.24 (2.01)
6.69 (2.13)
CITC .64 .43 .54 .44 .47
1991
Label HP10901 HP1001 HP1004 HP1006 HP1005 .67
(N=13,343)
HP1002
M (SD) 6.95 (1.90)
6.75 (2.34)
6.19 (2.40)
7.29 (2.32)
6.59 (2.49)
6.96 (2.28)
CITC .61 .28 .51 .41 .37
1992
Label IP10901 IP9801 IP9804 IP9806 IP9805 .69
(N=13,115)
IP9802
M (SD) 6.92 (1.82)
6.81 (2.32)
6.12 (2.26)
7.14 (2.31)
6.64 (2.38)
7.23 (1.98)
CITC .64 .31 .53 .44 .37
1993
Label JP10901 JP0101 JP0104 JP0106 JP0105 .69
(N=12,723)
JP0102 JP0103
M (SD) 6.88 (1.88)
6.66 (2.31)
6.15 (2.30)
7.22 (2.32)
6.58 (2.42)
7.05 (2.06)
6.51 (2.12)
CITC .61 .34 .51 .43 .38
……………………………………………………………………………………………………………………………………………………………………
24
Life Satisfaction P (Individual Questionnaire)
Year Item Cronbach’s Alpha
Item 1 2 3 4 5 6 7 8 9 10 11
1994
Label KP10401 KP0101 KP0104 KP0106 KP0105 .70
(N = 12,959)
KP0102 KP0103
M (SD) 6.86 (1.85)
6.60 (2.31)
6.05 (2.33)
7.30 (2.27)
6.55 (2.43)
7.00 (2.07)
6.51 (2.12)
CITC .61 .34 .51 .45 .39
1995
Label LP10401 LP0101 LP0104 LP0105 LP0107 .72
(N = 13,307)
LP0102 LP0103
M (SD) 6.89 (1.83)
6.67 (2.25)
6.12 (2.29)
7.29 (2.24)
6.80 (2.22)
6.89 (2.20)
6.52 (2.11)
CITC .64 .40 .51 .44 .47
1996
Label MP11001 MP0101 MP0104 MP0105 MP0106 .69
(N = 13,166)
MP0102 MP0103
M (SD) 6.90 (1.78)
6.62 (2.24)
6.18 (2.27)
7.36 (2.19)
6.79 (2.33)
6.88 (2.16)
6.54 (2.06)
CITC .61 .34 .51 .45 .38
1997
Label NP11701 NP0101 NP0104 NP0105 NP0106 .71
(N = 12,888)
NP0102 NP0103 NP0107
M (SD) 6.79 (1.79)
6.59 (2.21)
6.01 (2.24)
7.35 (2.13)
6.73 (2.33)
6.85 (2.12)
6.50 (2.05)
6.53 (2.40)
CITC .62 .38 .53 .47 .38
1998
Label OP12301 OP0101 OP0104 OP0105 OP0106 .71
(N = 14,174)
OP0102 OP0103 OP0107
M (SD) 6.95 (1.78)
6.65 (2.23)
6.11 (2.28)
7.48 (2.08)
6.83 (2.30)
6.89 (2.15)
6.56 (2.06)
6.67 (2.43)
CITC .61 .38 .53 .49 .39
……………………………………………………………………………………………………………………………………………………………………

25
Life Satisfaction P (Individual Questionnaire)
Year Item Cronbach’s Alpha
Item 1 2 3 4 5 6 7 8 9 10 11
1999
Label PP13501 PP0101 PP0104 PP0105 PP0106 .71
(N = 13,686)
PP0102 PP0103 PP0107
M (SD) 6.97 (1.78)
6.61 (2.24)
6.18 (2.25)
7.53 (2.04)
6.86 (2.29)
6.90 (2.12)
6.52 (2.05)
6.63 (2.42)
CITC .60 .38 .52 .48 .38
2000
Label QP13401 QP0101 QP0104 QP0105 QP0106 .70
(N = 23,929)
QP0102 QP0103 QP0107
M (SD) 7.09 (1.78)
6.76 (2.27)
6.40 (2.30)
7.72 (2.02)
7.01 (2.29)
7.05 (2.20)
6.60 (2.11)
6.61 (2.62)
CITC .62 .36 .52 .48 .38
2001
Label RP13501 RP0101 RP0104 RP0105 RP0106 .72
(N = 21,862)
RP0102 RP0103 RP0107
M (SD) 7.10 (1.74)
6.77 (2.24)
6.49 (2.24)
7.74 (1.95)
7.02 (2.25)
7.06 (2.16)
6.62 (2.08)
6.54 (2.70)
CITC .62 .37 .53 .50 .39
2002
Label SP13501 SP0101 SP0104 SP0105 SP0106 .72
(N = 23,308)
SP0102 SP0103 SP0107
M (SD) 7.05 (1.74)
6.75 (2.21)
6.50 (2.22)
7.78 (1.91)
7.00 (2.20)
7.04 (2.14)
6.57 (2.06)
6.53 (2.54)
CITC .64 .41 .54 .51 .37
2003
Label TP14201 TP0101 TP0104 TP0105 TP0106 .73
(N = 22,106)
TP0102 TP0103 TP0107
M (SD) 6.96 (1.78)
6.73 (2.19)
6.34 (2.29)
7.76 (1.92)
7.02 (2.19)
6.96 (2.17)
6.59 (2.02)
6.33 (2.47)
CITC .63 .40 .54 .51 .40
………………………………………………………………………………………………………………………………………………………………………………………….
26
Life Satisfaction P (Individual Questionnaire)
Year Item Cronbach’s Alpha
Item 1 2 3 4 5 6 7 8 9 10 11
2004
Label UP14501 UP0101 UP0104 UP0107 UP0108 .71
(N = 21,375)
UP0102 UP0103 UP0109 UP0105
M (SD) 6.80 (1.82)
6.61 (2.24)
6.22 (2.30)
7.85 (1.86)
6.98 (2.18)
6.87 (2.21)
6.56 (1.99)
6.35 (2.59) 5.65 (2.60)
CITC .62 .39 .52 .47 .35
2005
Label VP154 VP0101 VP0104 VP0106 VP0107 .70
(N = 20,575)
VP0102 VP0103 VP0108 VP0105
M (SD) 6.95 (1.83)
6.64 (2.24)
6.25 (2.34)
7.82 (1.89)
6.98 (2.24)
6.85 (2.22)
6.58 (2.03)
6.30 (2.74) 5.65 (2.66)
CITC .61 .38 .52 .49 .34
2006
Label WP142 WP0101 WP0104 WP0106 WP0107 .71
(N = 21,822)
WP0102 WP0103 WP0108 WP0105 WP0109
M (SD) 6.91 (1.80)
6.64 (2.23)
6.23 (2.33)
7.81 (1.89)
6.98 (2.25)
6.89 (2.19)
6.62 (2.02)
6.37 (2.71) 5.66 (2.62) 7.71
(1.98) CITC .63 .40 .52 .48 .35
2007
Label XP149 XP0101 XP0104 XP0106 XP0107 .73
(N = 20,434)
XP0102 XP0103 XP0108 XP0105 XP0109
M (SD) 6.95 (1.78)
6.58 (2.20)
6.26 (2.27)
7.82 (1.82)
6.96 (2.21)
6.85 (2.16)
6.64 (1.98)
6.40 (2.70) 5.63 (2.59) 7.68
(1.97) CITC .65 .42 .53 .50 .38
2008
Label YP15501 YP0101 YP0105 YP0108 YP0109 .72
(N = 19,266)
YP0103 YP0104 YP0111 YP0106 YP0110 YP0102
M (SD) 6.98 (1.75)
6.56 (2.18)
6.29 (2.28)
7.96 (1.77)
7.08 (2.13)
6.90 (2.10)
6.68 (1.94)
6.78 (2.53) 5.70 (2.56) 7.80
(1.99) 6.82
(2.26) CITC .63 .42 .51 .48 .39
………………………………………………………………………………………………………………………………………………………………………………………
27
Life Satisfaction
P (Individual Questionnaire)
Year Item Cronbach’s Alpha
Item
1 2 3 4 5 6 7 8 9 10 11
2009
Label ZP15701 ZP0101 ZP0105 ZP0107 ZP0108
.72 (N = 20,378)
ZP0103 ZP0104 ZP0110 ZP0106 ZP0109 ZP0102
M (SD) 6.98 (1.78) 6.57 (2.23) 6.40
(2.30) 7.91
(1.82) 7.13
(2.15) 6.88
(2.21) 6.78
(1.96) 6.78
(2.76) 5.79
(2.61) 7.84
(1.99) 6.83
(2.27)
CITC .62 .41 .52 .49 .39
2010
Label BAP160 BAP0101 BAP0105 BAP0107 BAP0108
.72 (N = 18,504)
BAP0103 BAP0104 BAP0110 BAP0106 BAP0109 BAP0102
M (SD) 7.11 (1.75) 6.53 (2.22) 6.46
(2.28) 7.87
(1.82) 7.10
(2.14) 6.86
(2.21) 6.77
(1.95) 6.76
(2.71) 5.87
(2.59) 7.81
(1.99) 6.77
(2.27)
CITC .60 .41 .51 .50 .40
2011
Label BBP152 BBP0101 BBP0105 BBP0107 BBP0108
.72 (N = 18,088)
BBP0103 BBP0104 BBP0109 BBP0106 BBP0110 BBP0102
M (SD) 7.02 (1.74) 6.52 (2.24) 6.56
(2.26) 7.88
(1.83) 7.17
(2.16) 6.95
(2.19) 6.82
(1.93) 6.85
(2.62) 6.02
(2.55) 7.84
(1.94) 6.77
(2.28)
CITC .62 .42 .52 .50 .40
2012
Label BCP151 BCP0101 BCP0105 BCP0107 BCP0108
.73 (N = 19,185)
BCP0103 BCP0104 BCP0109 BCP0106 BCP0110 BCP0102
M (SD) 7.12 (1.73) 6.59 (2.22) 6.64
(2.25) 7.90
(1.82) 7.22
(2.14) 7.04
(2.09) 6.88
(1.92) 7.05
(2.44) 6.12
(2.52) 7.91
(1.91) 6.79
(2.28)
CITC .61 .43 .53 .49 .41
2013
Label BDP15801 BDP0101 BDP0105 BDP0107 BDP0108
.72 (N = 18,896)
BDP0103 BDP0104 BDP0109 BDP0106 BDP0110 BDP0102
M (SD) 7.31 (1.75) 6.83 (2.25) 6.59
(2.30) 7.77
(2.00) 7.26
(2.13) 7.17
(2.10) 6.84
(1.96) 7.58
(2.25) 6.13
(2.56) 8.00
(1.88) 6.79
(2.27)
CITC .58 .41 .52 .46 .42
………………………………………………………………………………………………………………………………………………………………………………………………………………
28
Life Satisfaction
P (Individual Questionnaire)
Year Item Cronbach’s Alpha
Item 1 2 3 4 5 6 7 8 9 10 11
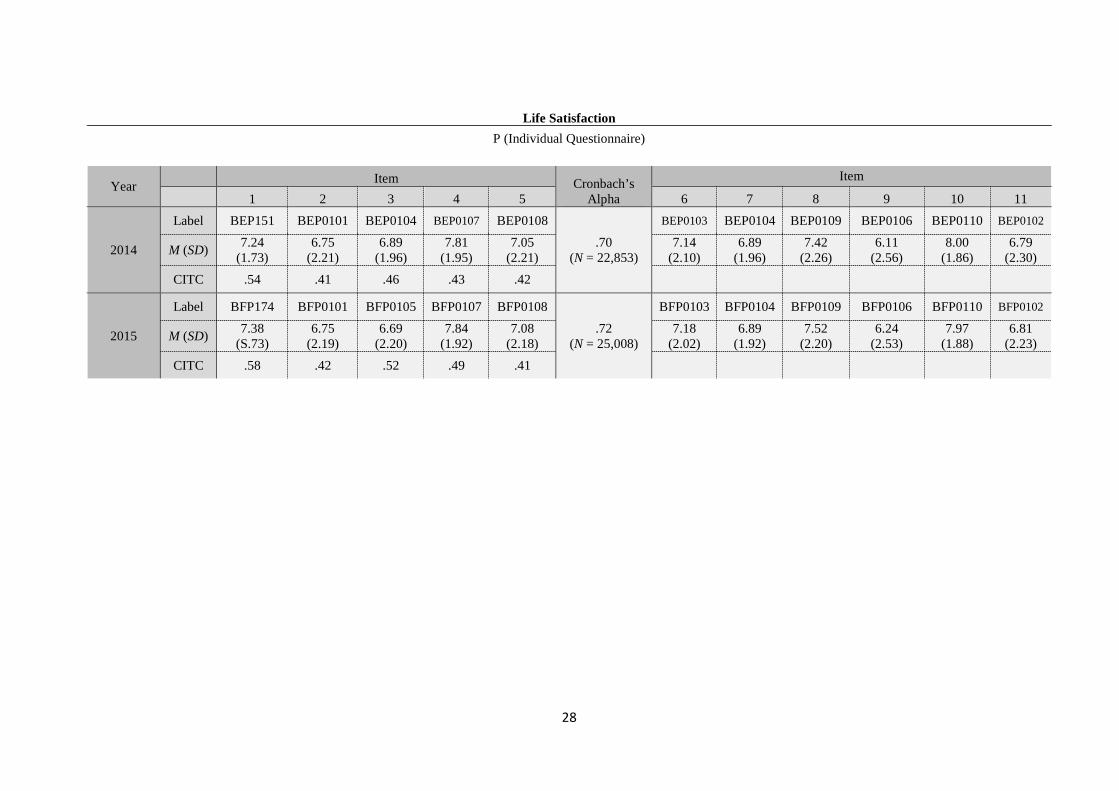
2014
Label BEP151 BEP0101 BEP0104 BEP0107 BEP0108 .70
(N = 22,853)
BEP0103 BEP0104 BEP0109 BEP0106 BEP0110 BEP0102
M (SD) 7.24 (1.73)
6.75 (2.21)
6.89 (1.96)
7.81 (1.95)
7.05 (2.21)
7.14 (2.10)
6.89 (1.96)
7.42 (2.26)
6.11 (2.56)
8.00 (1.86)
6.79 (2.30)
CITC .54 .41 .46 .43 .42
2015
Label BFP174 BFP0101 BFP0105 BFP0107 BFP0108 .72
(N = 25,008)
BFP0103 BFP0104 BFP0109 BFP0106 BFP0110 BFP0102
M (SD) 7.38 (S.73)
6.75 (2.19)
6.69 (2.20)
7.84 (1.92)
7.08 (2.18)
7.18 (2.02)
6.89 (1.92)
7.52 (2.20)
6.24 (2.53)
7.97 (1.88)
6.81 (2.23)
CITC .58 .42 .52 .49 .41
29
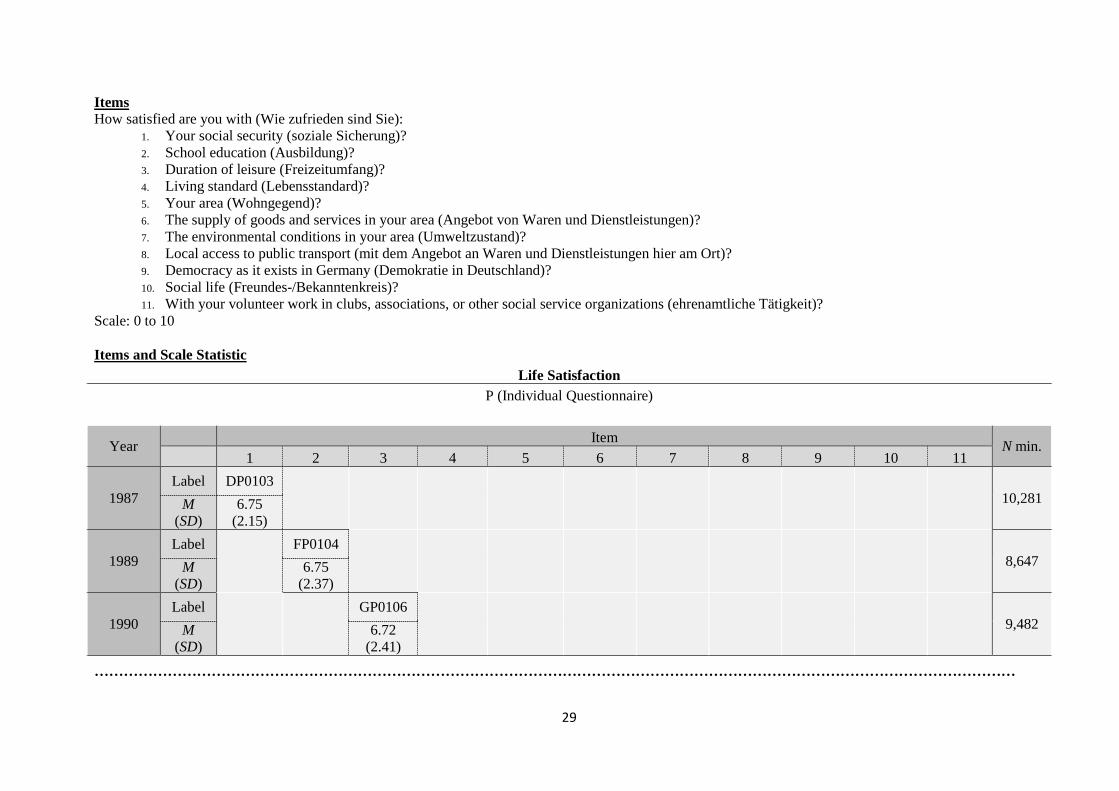
Items How satisfied are you with (Wie zufrieden sind Sie):
1. Your social security (soziale Sicherung)? 2. School education (Ausbildung)? 3. Duration of leisure (Freizeitumfang)? 4. Living standard (Lebensstandard)? 5. Your area (Wohngegend)? 6. The supply of goods and services in your area (Angebot von Waren und Dienstleistungen)? 7. The environmental conditions in your area (Umweltzustand)? 8. Local access to public transport (mit dem Angebot an Waren und Dienstleistungen hier am Ort)? 9. Democracy as it exists in Germany (Demokratie in Deutschland)? 10. Social life (Freundes-/Bekanntenkreis)? 11. With your volunteer work in clubs, associations, or other social service organizations (ehrenamtliche Tätigkeit)?
Scale: 0 to 10 Items and Scale Statistic
Life Satisfaction P (Individual Questionnaire)
Year Item N min. 1 2 3 4 5 6 7 8 9 10 11
1987 Label DP0103
10,281 M
(SD) 6.75
(2.15)
1989 Label
FP0104
8,647 M
(SD) 6.75
(2.37)
1990 Label
GP0106
9,482 M
(SD) 6.72
(2.41)
………………………………………………………………………………………………………………………………………………………………………
30
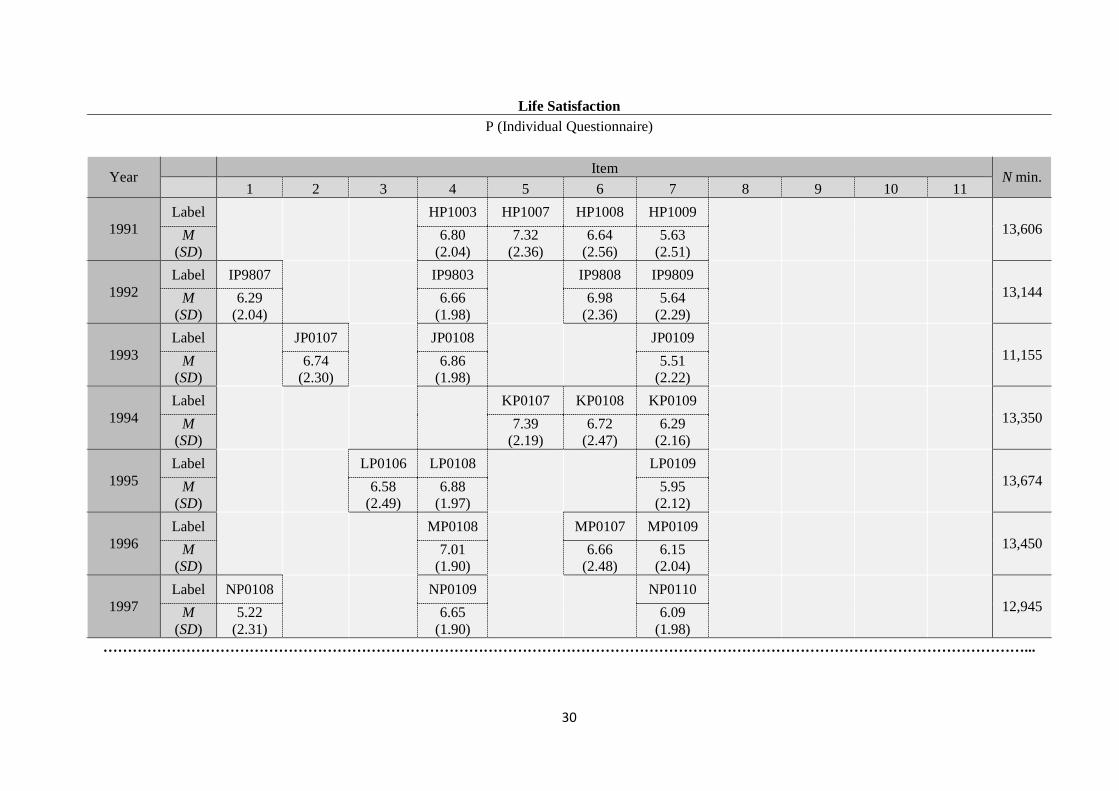
Life Satisfaction P (Individual Questionnaire)
Year Item N min. 1 2 3 4 5 6 7 8 9 10 11
1991 Label
HP1003 HP1007 HP1008 HP1009
13,606 M
(SD) 6.80
(2.04) 7.32
(2.36) 6.64
(2.56) 5.63
(2.51)
1992 Label IP9807
IP9803
IP9808 IP9809
13,144 M
(SD) 6.29
(2.04) 6.66
(1.98) 6.98
(2.36) 5.64
(2.29)
1993 Label
JP0107
JP0108
JP0109
11,155 M
(SD) 6.74
(2.30) 6.86
(1.98) 5.51
(2.22)
1994 Label
KP0107 KP0108 KP0109
13,350 M
(SD) 7.39
(2.19) 6.72
(2.47) 6.29
(2.16)
1995 Label
LP0106 LP0108
LP0109
13,674 M
(SD) 6.58
(2.49) 6.88
(1.97) 5.95
(2.12)
1996 Label
MP0108
MP0107 MP0109
13,450 M
(SD) 7.01
(1.90) 6.66
(2.48) 6.15
(2.04)
1997 Label NP0108
NP0109
NP0110
12,945 M
(SD) 5.22
(2.31) 6.65
(1.90) 6.09
(1.98) ………………………………………………………………………………………………………………………………………………………………………...
31
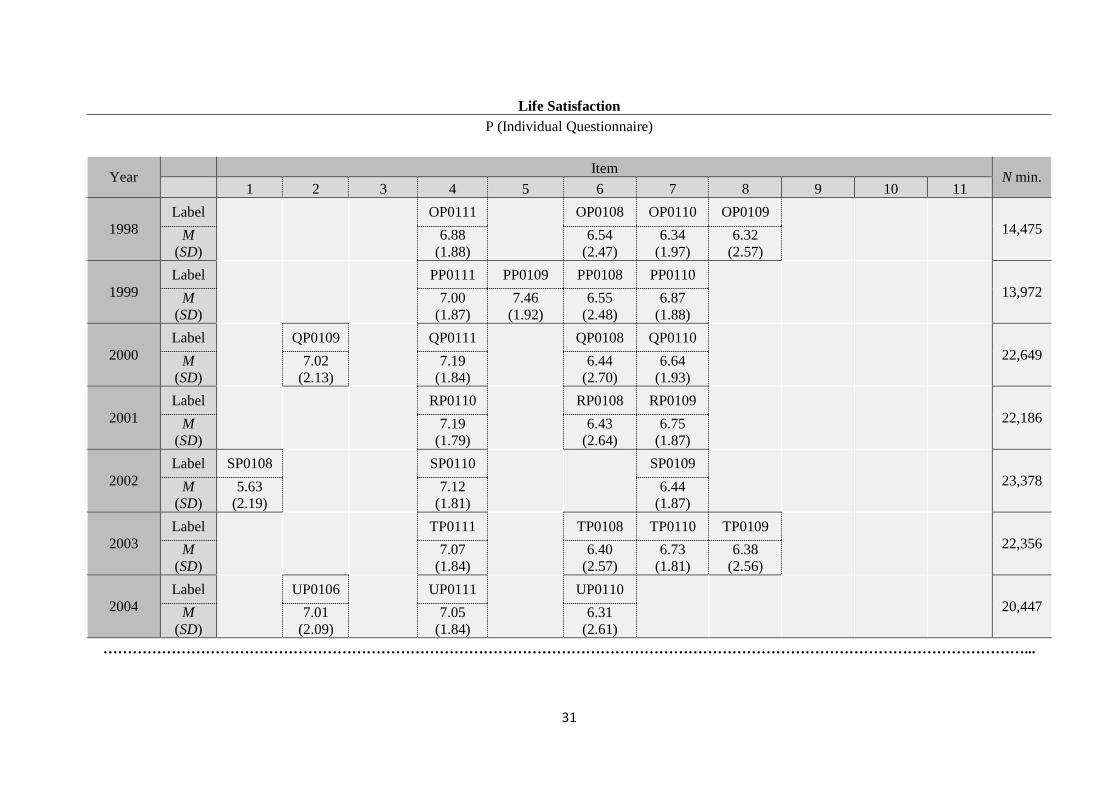
Life Satisfaction P (Individual Questionnaire)
Year Item N min. 1 2 3 4 5 6 7 8 9 10 11
1998 Label
OP0111
OP0108 OP0110 OP0109
14,475 M
(SD) 6.88
(1.88) 6.54
(2.47) 6.34
(1.97) 6.32
(2.57)
1999 Label
PP0111 PP0109 PP0108 PP0110
13,972 M
(SD) 7.00
(1.87) 7.46
(1.92) 6.55
(2.48) 6.87
(1.88)
2000 Label
QP0109
QP0111
QP0108 QP0110
22,649 M
(SD) 7.02
(2.13) 7.19
(1.84) 6.44
(2.70) 6.64
(1.93)
2001 Label
RP0110
RP0108 RP0109
22,186 M
(SD) 7.19
(1.79) 6.43
(2.64) 6.75
(1.87)
2002 Label SP0108
SP0110
SP0109
23,378 M
(SD) 5.63
(2.19) 7.12
(1.81) 6.44
(1.87)
2003 Label
TP0111
TP0108 TP0110 TP0109
22,356 M
(SD) 7.07
(1.84) 6.40
(2.57) 6.73
(1.81) 6.38
(2.56)
2004 Label
UP0106
UP0111
UP0110
20,447 M
(SD) 7.01
(2.09) 7.05
(1.84) 6.31
(2.61) ………………………………………………………………………………………………………………………………………………………………………...
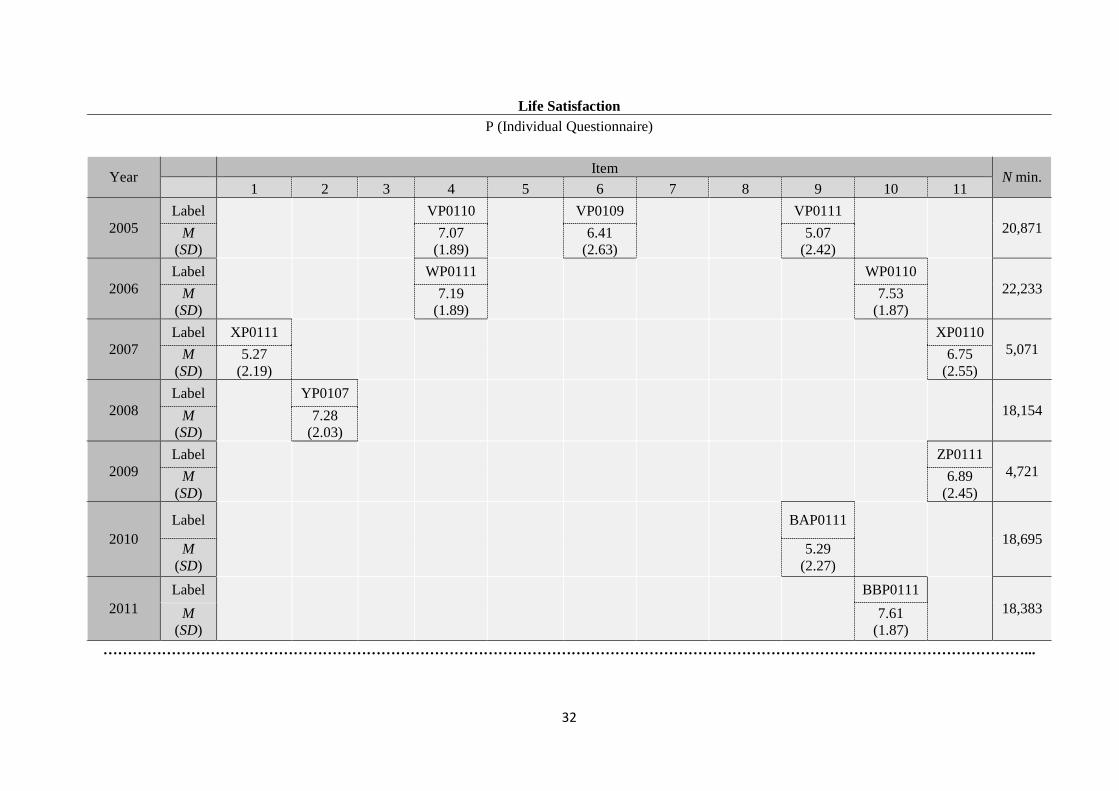
32
Life Satisfaction P (Individual Questionnaire)
Year Item N min. 1 2 3 4 5 6 7 8 9 10 11
2005 Label
VP0110
VP0109
VP0111
20,871 M
(SD) 7.07
(1.89) 6.41
(2.63) 5.07
(2.42)
2006 Label
WP0111
WP0110 22,233 M
(SD) 7.19
(1.89) 7.53
(1.87)
2007 Label XP0111
XP0110 5,071 M
(SD) 5.27
(2.19) 6.75
(2.55)
2008 Label
YP0107
18,154 M
(SD) 7.28
(2.03)
2009 Label
ZP0111 4,721 M
(SD) 6.89
(2.45)
2010 Label
BAP0111
18,695
M (SD)
5.29 (2.27)
2011 Label
BBP0111
18,383 M (SD)
7.61 (1.87)
………………………………………………………………………………………………………………………………………………………………………...
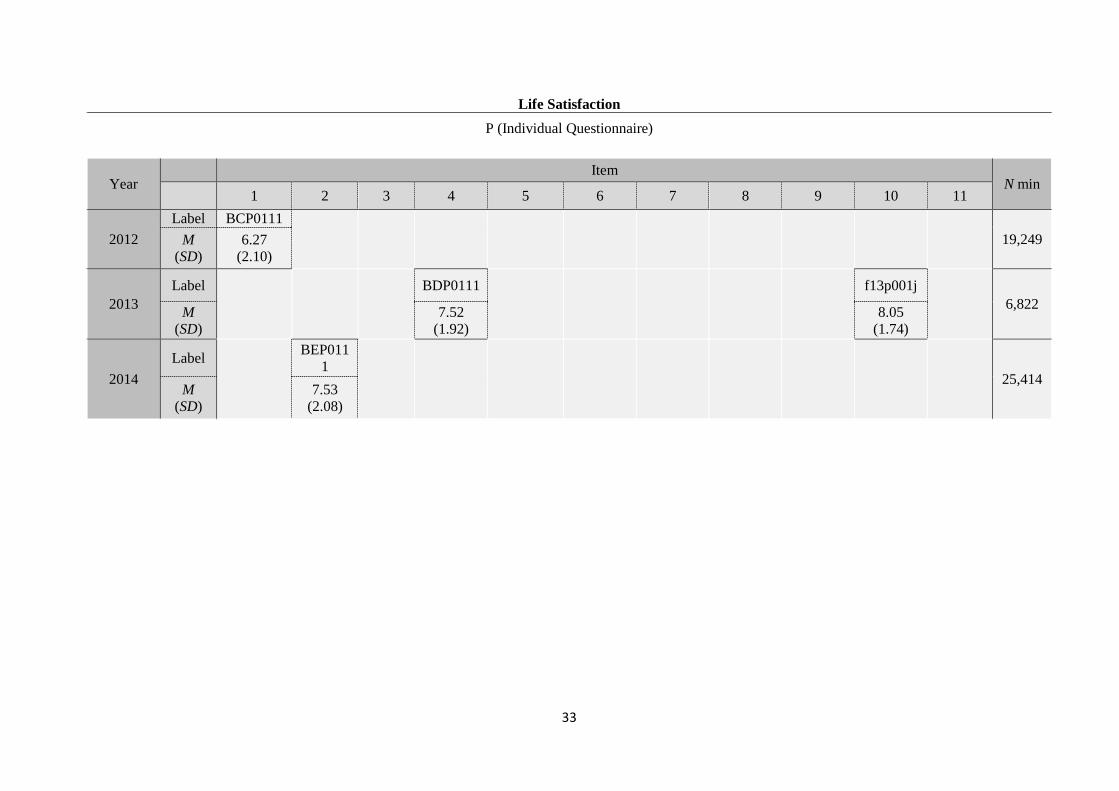
33
Life Satisfaction P (Individual Questionnaire)
Year Item
N min 1 2 3 4 5 6 7 8 9 10 11
2012 Label BCP0111
19,249 M (SD)
6.27 (2.10)
2013 Label
BDP0111
f13p001j 6,822 M
(SD) 7.52
(1.92) 8.05
(1.74)
2014 Label
BEP0111
25,414 M
(SD) 7.53
(2.08)
34
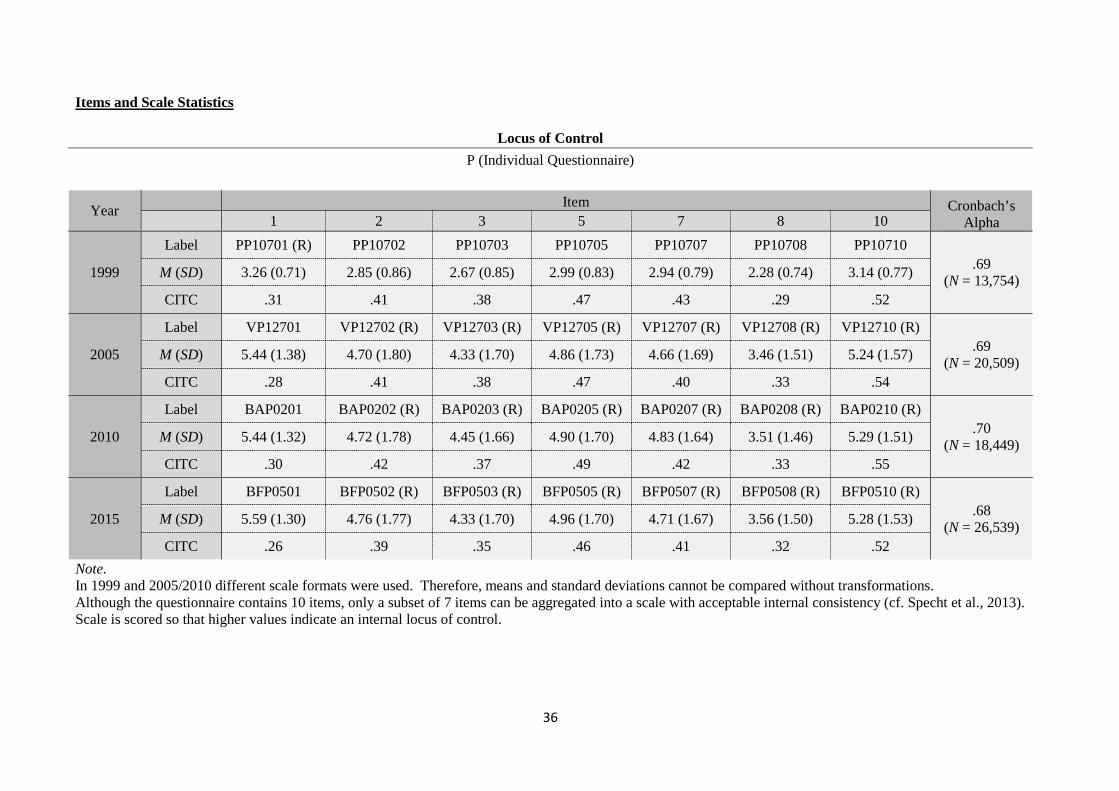
Locus of Control Summary The concept of locus of control describes the extent to which individuals believe they can determine events in their own lives, or conversely, the extent to which they feel dependent on factors that are outside of their control (Rotter, 1966). Locus of Control has been measured in SOEP in the years 1999, 2005, 2010, and 2015. Theoretical Background Locus of control may be internally or externally oriented. Individuals with an internal locus of control believe that their lives are the result of their own decisions and their own behavior. Individuals with an external locus of control believe that the things that happen to them in their lives are outside their personal control. For example, people with an external locus of control tend to avoid situations in which they feel overwhelmed. People with an internal locus of control tend to set higher goals for themselves, to persevere in difficult situations, and to pursue their goals successfully (Strauser, Ketz, & Keim, 2002). Scale Development The Locus of Control Scale was developed by Helmut Nolte (Nolte et al., 1997). In the original conception, it covered four dimensions: 1. Internal locus of control (3 Items), 2. External locus of control (E, 5 Items), 3. Attitudes about fairness or justice (1 Item) and 4. Individual vs. collective orientation (1 Item). Seven of the 10 items can be combined into an overall scale with good reliability (Specht, Egloff, & Schmukle, 2013). References Nolte, H., Weischer, C., Wilkesmann, U., Maetzel, J., & Tegethoff, H. G. (1997).
Kontrolleinstellungen zum Leben und zur Zukunft. Auswertung eines neuen, sozialpsychologischen Itemblocks im Soziooekonomischen Panel. Ruhr-Universität Bochum: Diskussionspapiere aus der Fakultaet für Sozialwissenschaft.
Rotter, J. B. (1996). Generalized expectancies for internal versus external control of reinforcement. Psychological Monographs: General and Applied, 80, 1-28.
Specht, J., Egloff, B., & Schmukle, S. C. (2013). Everything under control? The effects of age, gender, and education on trajectories of perceived control in a nationally representative German sample. Developmental Psychology, 49, 353-364.
Strauser, D. R., Ketz, K., & Keim, J. (2002). The relationship between self-efficacy, locus of control and work personality. The Journal of Rehabilitation, 68, 20-26.
35
Items The following statements apply to different attitudes towards life and the future. To what degree to you personally agree with the following statements (Die folgenden Aussagen kennzeichnen verschiedene Einstellungen zum Leben und zur Zukunft. In welchem Maße stimmen Sie persönlich den einzelnen Aussagen zu):
1. How my life goes depends on me (Wie mein Leben verläuft, hängt von mir selbst ab). 2. Compared to other people, I have not achieved what I deserve (Im Vergleich mit anderen
habe ich nicht das erreicht, was ich verdient habe). 3. What a person achieves in life is above all a question of fate or luck (Was man im Leben
erreicht, ist in erster Linie eine Frage von Schicksal oder Glück). 4. If a person is socially or politically active, he/she can have an effect on social conditions
(Wenn man sich sozial oder politisch engagiert, kann man die sozialen Verhältnisse beeinflussen).
5. I frequently have the experience that other people have a controlling influence over my life (Ich mache häufig die Erfahrung, dass andere über mein Leben bestimmen).
6. One has to work hard in order to succeed (Erfolg muss man sich hart erarbeiten). 7. If I run up against difficulties in life, I often doubt my own abilities (Wenn ich im Leben
auf Schwierigkeiten stoße, zweifle ich oft an meinen Fähigkeiten). 8. The opportunities that I have in life are determined by the social conditions (Welche
Möglichkeiten ich im Leben habe, wird von den sozialen Umständen bestimmt). 9. Innate abilities are more important than any efforts one can make (Wichtiger als alle
Anstrengungen sind die Fähigkeiten, die man mitbringt). 10. I have little control over the things that happen in my life (Ich habe wenig Kontrolle über
die Dinge, die in meinem Leben passieren). Scale: 1 (Not at all / Stimme überhaupt nicht zu) to 7 (Absolutely / Stimme voll zu); in 1999: 1 (Absolutely / Simme voll zu) to 4 (Not at all / Stimme überhaupt nicht zu) Test-Retest Correlations In 2005, this scale was included in a retest taken by a subsample (N = 160) within 30 to 49 days after the initial test. Test-retest correlations for the scale-relevant items 1, 2, 3, 5, 7, 8 , and 10 were .45, .47, .45, .33, .43, .26, .21; scale scores correlated .56.
36
Items and Scale Statistics
Locus of Control P (Individual Questionnaire)
Year Item Cronbach’s Alpha 1 2 3 5 7 8 10
1999
Label PP10701 (R) PP10702 PP10703 PP10705 PP10707 PP10708 PP10710 .69
(N = 13,754) M (SD) 3.26 (0.71) 2.85 (0.86) 2.67 (0.85) 2.99 (0.83) 2.94 (0.79) 2.28 (0.74) 3.14 (0.77)
CITC .31 .41 .38 .47 .43 .29 .52
2005
Label VP12701 VP12702 (R) VP12703 (R) VP12705 (R) VP12707 (R) VP12708 (R) VP12710 (R) .69
(N = 20,509) M (SD) 5.44 (1.38) 4.70 (1.80) 4.33 (1.70) 4.86 (1.73) 4.66 (1.69) 3.46 (1.51) 5.24 (1.57)
CITC .28 .41 .38 .47 .40 .33 .54
2010
Label BAP0201 BAP0202 (R) BAP0203 (R) BAP0205 (R) BAP0207 (R) BAP0208 (R) BAP0210 (R) .70
(N = 18,449) M (SD) 5.44 (1.32) 4.72 (1.78) 4.45 (1.66) 4.90 (1.70) 4.83 (1.64) 3.51 (1.46) 5.29 (1.51)
CITC .30 .42 .37 .49 .42 .33 .55
2015
Label BFP0501 BFP0502 (R) BFP0503 (R) BFP0505 (R) BFP0507 (R) BFP0508 (R) BFP0510 (R) .68
(N = 26,539) M (SD) 5.59 (1.30) 4.76 (1.77) 4.33 (1.70) 4.96 (1.70) 4.71 (1.67) 3.56 (1.50) 5.28 (1.53)
CITC .26 .39 .35 .46 .41 .32 .52 Note. In 1999 and 2005/2010 different scale formats were used. Therefore, means and standard deviations cannot be compared without transformations. Although the questionnaire contains 10 items, only a subset of 7 items can be aggregated into a scale with acceptable internal consistency (cf. Specht et al., 2013). Scale is scored so that higher values indicate an internal locus of control.
37
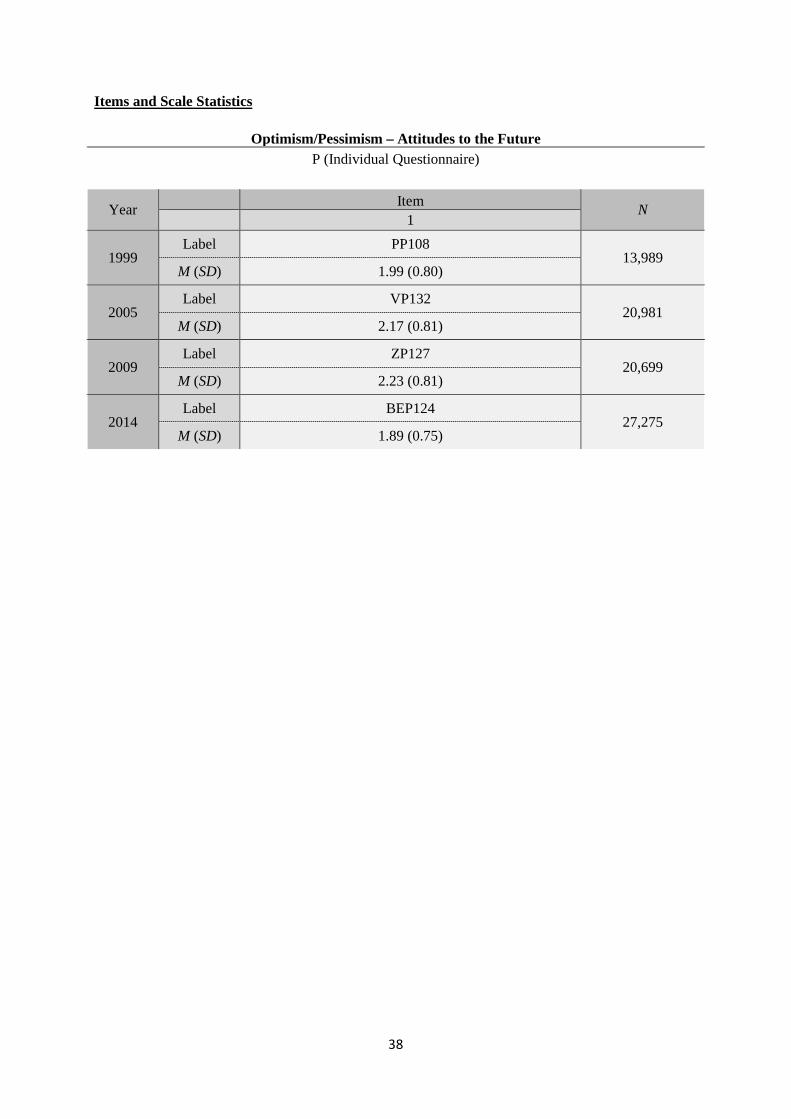
Optimism/Pessimism – Attitudes toward the Future Summary The SOEP measured respondents’ attitudes toward the future with an individual item in 1999, 2005, 2010, and 2014. Theoretical Background For pragmatic reasons and to save time, surveys usually measure attitudes about the future and future orientations by asking respondents whether they see the future positively or negatively, that is, optimistically or pessimistically. In the analysis of attitudes toward the future, questions on the nature and emergence of future orientations are of interest (e.g., whether attitudes about the future are less positive in adults than in young people, or whether young women are less optimistic about the future than young men; Trommsdorff, 1994). Furthermore, making assumptions about the future makes it possible to plan and anticipate one’s future actions. Attitudes about the future should therefore provide the basis for decisions and planning behavior. Scale Development The question about attitudes toward the future was included in the SOEP on the recommendation of Gisela Trommsdorff. Additional information on the validity of this individual item can be found in Trommsdorff (1994). References Trommsdorff, G. (1994). Zukunft als Teil individueller Handlungsorientierungen. In E. Holst, J. P.
Rinderspacher & J. Schupp (Hrsg.), Erwartungen an die Zukunft. Zeithorizonte und Wertewandel in der sozialwissenschaftlichen Diskussion (pp. 45-76). Frankfurt a. M.: Campus.
Items When you think about the future (Wenn Sie an die Zukunft denken): Optimism/Pessimism
1. Are you ( Sind Sie da ) ... Scale: 1 (optimistic / optimistisch) to 4 (pessimistic / pessimistisch) Test-Retest Correlations In 2009, this item was included in a retest taken by a subsample (N = 174) within 30 to 49 days after the initial test. Test-retest correlation was .60.
38
Items and Scale Statistics
Optimism/Pessimism – Attitudes to the Future P (Individual Questionnaire)
Year Item N 1
1999 Label PP108
13,989 M (SD) 1.99 (0.80)
2005 Label VP132
20,981 M (SD) 2.17 (0.81)
2009 Label ZP127
20,699 M (SD) 2.23 (0.81)
2014 Label BEP124
27,275 M (SD) 1.89 (0.75)
39
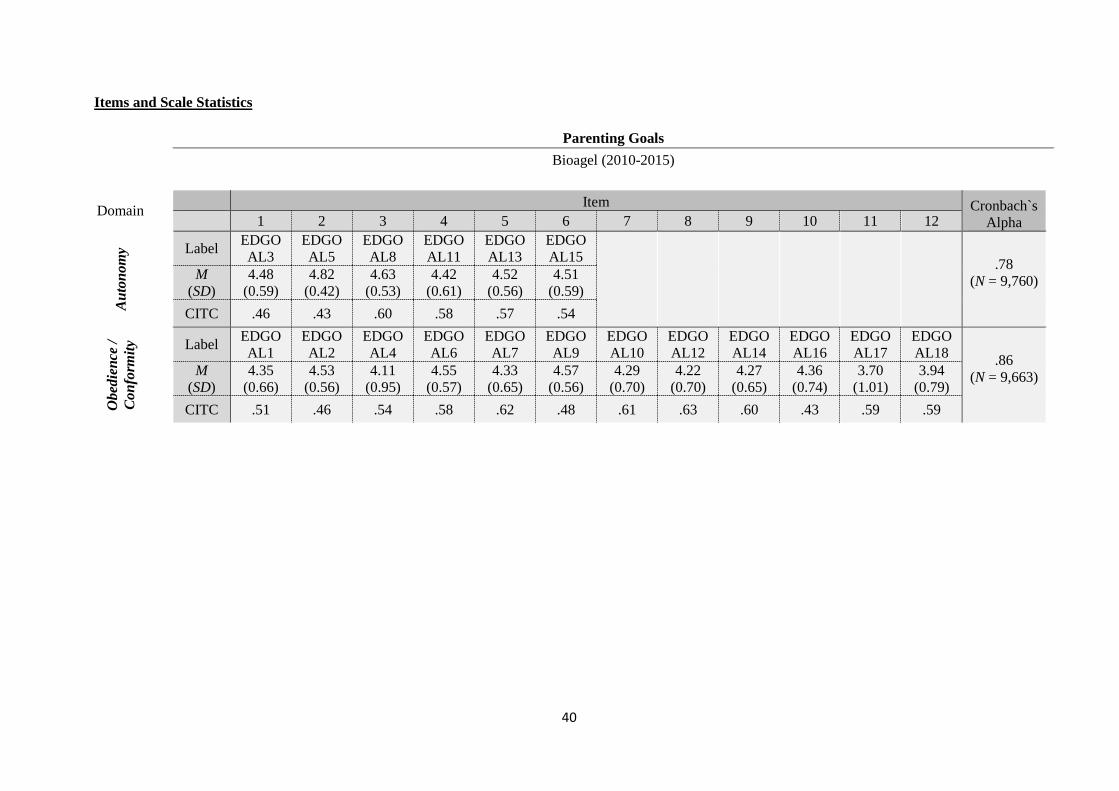
Parenting Goals Summary The questions on parenting goals were taken from Kohn (1977). The 18 items can be combined into two scales: “autonomy” and “conformity.” Parenting goals have been measured in the SOEP since 2010 in the questionnaire for parents of children between the ages of 7 and 8. Theoretical Background Kohn (1977) found an association between parenting goals (conformity and autonomy) and the parents’ social class: Working-class parents emphasized discipline, manners, cleanliness, good behavior in school, honesty, and obedience, whereas middle-class parents emphasized consideration, interest in why and how things happen, responsibility, and self-control. This suggests that lower-class parents place more value on conformity and higher-class parents place more value on personal autonomy. The different values of parents from different social classes regarding childrearing are transferred to their children through their own behavior and shape their children’s social character. Scale Development The scale measuring parenting goals was taken from the German General Social Survey (ALLBUS). Further information on the scale can be found in Terwey (2000). References Kohn, M. (1977). Class and conformity: A study in values. Chicago: University of Chicago Press. Terwey, M. (2000). ALLBUS: A German General Social Survey. Schmollers Jahrbuch, 120, 151-158. Items In the following, we will list a few traits and abilities that parents can foster in their children through their approach to parenting. How important do you consider the following parenting goals? That the child…: (Im Folgenden werden einige Eigenschaften und Fähigkeiten genannt, die man durch Erziehung fördern kann. Für wie wichtig halten Sie persönlich die folgenden Erziehungsziele? Dass das Kind… /) Autonomy / Selbstständigkeit
1. Is interested in how and why things happen (sich dafür interessiert, wie und warum bestimmte Dinge passieren).
2. Is honest (ehrlich ist). 3. Is responsible (verantwortungsbewusst ist). 4. Has good judgment (ein gutes Urteilsvermögen besitzt). 5. Strives to achieve his/her goals (sich bemüht, seine Ziele zu erreichen). 6. Learns to overcome obstacles in life (lernt, sich im Leben auch gegen Widerstände
durchzusetzen). Scale: 1 (Not at all important / Überhaupt nicht wichtig) to 5 (Very important / Sehr wichtig) Obedience / Conformity (Gehorsam / Konformität)
1. Is good in school (ein guter Schüler wird). 2. Gets along with other children (sich gut mit anderen Kindern versteht). 3. Behaves like normal girl/boy (sich wie ein normales Mädchen bzw. wie ein normaler
Junge verhält). 4. Has good manners (gute Umgangsformen hat). 5. Has good self-control (Selbstbeherrschung besitzt). 6. Is considerate of others (auf andere Rücksicht nimmt). 7. Obeys his/her parents (seinen Eltern gehorcht). 8. Is neat and clean (ordentlich und sauber ist). 9. Fits in well in groups (sich gut in Gruppen einfügen kann). 10. Is satisfied with his/her own abilities (zufrieden mit dem ist, was es hat und kann). 11. Learns to avoid risks in life (lernt, Risiken im Leben zu meiden). 12. Is liked by others, friendly (von anderen gemocht wird, liebenswert ist).
Scale: 1 (not at all important / überhaupt nicht wichtig) to 5 (very important / sehr wichtig)
40
Items and Scale Statistics
Parenting Goals Bioagel (2010-2015)
Domain Item Cronbach`s
Alpha 1 2 3 4 5 6 7 8 9 10 11 12
Aut
onom
y Label EDGOAL3
EDGOAL5
EDGOAL8
EDGOAL11
EDGOAL13
EDGOAL15
.78
(N = 9,760) M (SD)
4.48 (0.59)
4.82 (0.42)
4.63 (0.53)
4.42 (0.61)
4.52 (0.56)
4.51 (0.59)
CITC .46 .43 .60 .58 .57 .54
Obe
dien
ce /
Con
form
ity Label EDGO
AL1 EDGOAL2
EDGOAL4
EDGOAL6
EDGOAL7
EDGOAL9
EDGOAL10
EDGOAL12
EDGOAL14
EDGOAL16
EDGOAL17
EDGOAL18 .86
(N = 9,663) M (SD)
4.35 (0.66)
4.53 (0.56)
4.11 (0.95)
4.55 (0.57)
4.33 (0.65)
4.57 (0.56)
4.29 (0.70)
4.22 (0.70)
4.27 (0.65)
4.36 (0.74)
3.70 (1.01)
3.94 (0.79)
CITC .51 .46 .54 .58 .62 .48 .61 .63 .60 .43 .59 .59
41
Parenting Role Summary The questions on the parenting role were taken from the Panel Analysis of Intimate Relationships and Family Dynamics (pairfam) project’s parenting questionnaire (Wendt et. al., 2011). The ten items can be combined into three scales: “autonomy,” “hostile attributions,” and “willingness to make sacrifices.” The questions on the parenting role have been asked in the SOEP since 2010 in the questionnaire for parents of children aged 7-8 years. Theoretical Background The four items assessing “autonomy in the parenting role” are based on an instrument developed by Skinner and Regan (1992). The negative items measure the parents’ feelings of irksome dependence in their interaction with the child. Furthermore, it is assumed that the feeling of autonomy in the parenting role is also expressed as positive feelings towards the child. The three items of the scale “hostile attributions” are newly developed by pairfam and measure the parental disposition to interpret the child’s behavior as intentionally hostile or egoistic. The scale “willingness to make sacrifices” is an adapted version from the AGAPE scale developed by Bierhoff, Grau, & Ludwig (1993) to assess parents’ willingness to make sacrifices in their relationship with their child. Scale Development Information on the scale development can be found in the documentation provided by pairfam (Wendt et. al., 2011). References Bierhoff, H. W., Grau, I., & Ludwig, A. (1993). Marburger Einstellungsinventar für Liebesstile
(MEIL). Göttingen: Hogrefe. Skinner, E. A., & Regan, C. (1992). Parenting sense of autonomy. Technical Report. University of
Rochester, Rochester, NY. Wendt, E.-V., Schmahl, F., Thönnissen, C., Schaer, M., & Walper, S.(2011). Scales Manual of the
German Family Panel. pairfam (Panel Analysis of Intimate Relationships and Family Dynamics). Bremen, Chemnitz, Munich.
Items Autonomy
1. I have the feeling that taking care of my child/my children takes up all my strength and that my whole life revolves around it (R) (Ich habe das Gefühl, dass Betreuung und Erziehung meines Kindes mich völlig in Beschlag nehmen, mein ganzes Leben bestimmen).
2. I wish I didn’t feel so trapped by my parental duties (R) (Ich wünschte, ich würde mich durch meine Elternpflichten nicht so gefangen fühlen).
3. When I am with my child/children there is nothing else I’d rather be doing (Wenn ich mit meinem Kind zusammen bin, gibt es nichts anderes, was ich lieber täte).
4. I look forward to spending time with my child/children (Ich freue mich darauf, mit meinem Kind zusammen zu sein).
Scale: 1 (Not at all / stimme überhaupt nicht zu) to 5 (Absolutely / stimme voll und ganz zu) Hostile Attributions
1. When my child disobeys and breaks rules, he/she just wants to annoy me (Wenn mein Kind nicht gehorcht und etwas Verbotenes tut, will es mich ärgern).
2. If there are any problems with the way I raise my child, then it’s my child’s fault (Wenn es Probleme in der Erziehung gibt, liegt das an meinem Kind).
3. It seems to me that when my child misbehaves, he/she does it intentionally (Ich denke, wenn mein Kind sich falsch verhält, macht es das mit Absicht).
Scale: 1 (Not at all / stimme überhaupt nicht zu) to 5 (Absolutely / stimme voll und ganz zu)
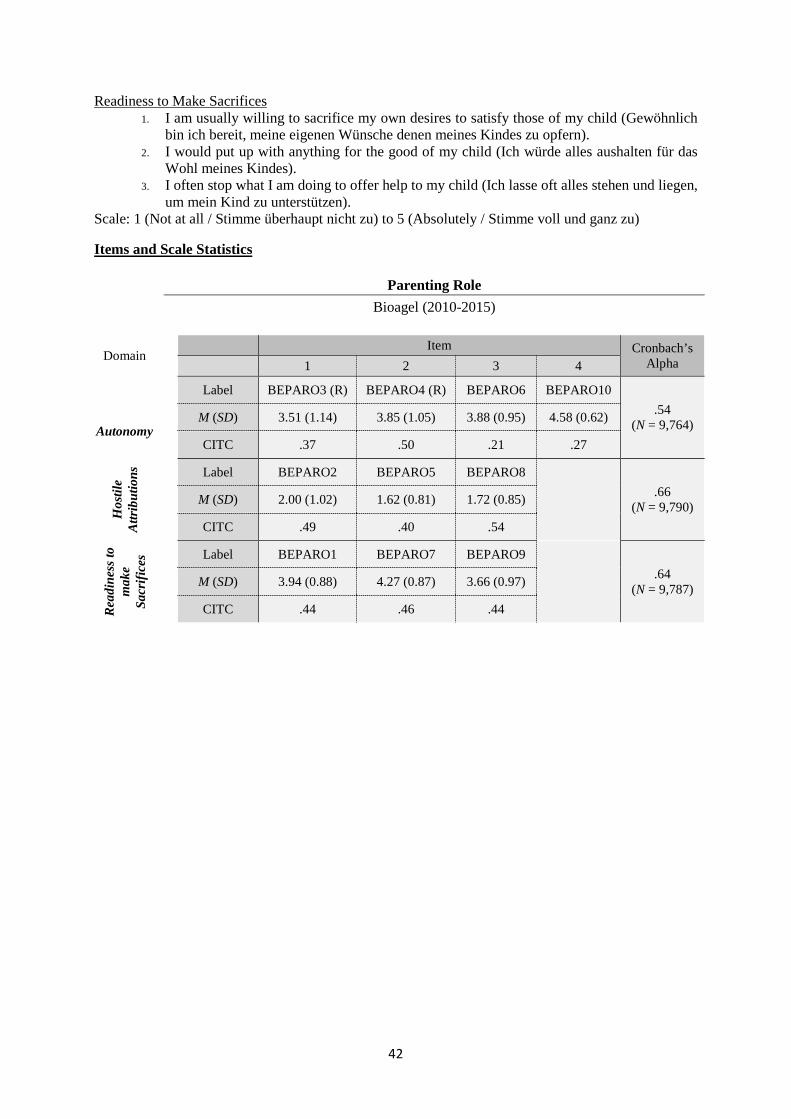
42
Readiness to Make Sacrifices 1. I am usually willing to sacrifice my own desires to satisfy those of my child (Gewöhnlich
bin ich bereit, meine eigenen Wünsche denen meines Kindes zu opfern). 2. I would put up with anything for the good of my child (Ich würde alles aushalten für das
Wohl meines Kindes). 3. I often stop what I am doing to offer help to my child (Ich lasse oft alles stehen und liegen,
um mein Kind zu unterstützen). Scale: 1 (Not at all / Stimme überhaupt nicht zu) to 5 (Absolutely / Stimme voll und ganz zu)
Items and Scale Statistics
Parenting Role Bioagel (2010-2015)
Domain Item Cronbach’s
Alpha 1 2 3 4
Label BEPARO3 (R) BEPARO4 (R) BEPARO6 BEPARO10 .54
(N = 9,764) Autonomy M (SD) 3.51 (1.14) 3.85 (1.05) 3.88 (0.95) 4.58 (0.62) CITC .37 .50 .21 .27
Hos
tile
Attr
ibut
ions
Label BEPARO2 BEPARO5 BEPARO8
.66 (N = 9,790)
M (SD) 2.00 (1.02) 1.62 (0.81) 1.72 (0.85) CITC .49 .40 .54
Rea
dine
ss to
m
ake
Sacr
ifice
s Label BEPARO1 BEPARO7 BEPARO9
.64 (N = 9,787)
M (SD) 3.94 (0.88) 4.27 (0.87) 3.66 (0.97) CITC .44 .46 .44
43
Parenting Style Summary The questions on the parenting style were taken from the Panel Analysis of Intimate Relationships and Family Dynamics (pairfam) project’s parenting questionnaire (Wendt et. al., 2011). The 18 items can be combined into six scales: “emotional warmth,” “inconsistent parenting,” “monitoring,” “negative communication,” “psychological control,” and “strict control.” The questions on parenting style have been asked in the SOEP since 2010 in the questionnaire for parents of children aged 7-8 years. Theoretical Background The scale “emotional warmth” comprises three items indicating the degree of affirmative attention and care in parenting. The items are based on mothers’ and fathers’ actual parenting behavior (see the corresponding scale of Jaursch, 2003, based on Perris et al., 1980, and Schuhmacher, Eisemann, & Brähler, 1999). The scale “inconsistent parenting” comprises three items indicating the degree of inconsistent behavior in parenting. The items are based on a questionnaire on parenting from Reichle and Franiek (2005). The scale “monitoring” comprises three items indicating the degree to which parents are informed about their child’s activities and social contacts. The items are based on a questionnaire on parenting from Reichle and Franiek (2005). The scale “negative communication” comprises three items indicating the degree to which parents behave negatively toward their child. The items are based on the instrument developed by Schwarz, Walper, Gödde, and Jurasic (1997). The scale “psychological control” consists of three items. The items assess negative intrusive thoughts, feelings, and behavior of parents toward their child and are a shortened and adapted version of the scale “psychological pressure” from the “Zurich Brief Questionnaire for the Assessment of Parental Behaviors” (Reitzle et al. 2001). The scale “strict control” comprises three items indicating harsh control and authoritarian behavior of parents. The items are based on the instrument of Schwarz et al. (1997). Scale Development Information on the scale development can be found in the documentation of pairfam (Wendt et. al., 2011). References Perris, C., Jacobsson, L., Lindström, H., von Knorring, L., & Perris, H. (1980). Development of a new
inventory for assessing memories of parental rearing behaviour. Acta Psychiatrica Scandinavica, 61, 265-274.
Jaursch, Stefanie, 2003. Erinnertes und aktuelles Erziehungsverhalten von Müttern und Vätern: Intergenerationale Zusammenhänge und kontextuelle Faktoren. Dissertation. Friedrich-Alexander-Universität Erlangen-Nürnberg.
Reichle, B., & Franiek, S. (2005). Erziehungsstil aus Elternsicht - Erweiterte deutsche Version des Alabama Parenting Questionnaire (EDAPQ) (Expanded GermanVersion of the Alabama Parenting Questionnaire). Hochschule Ludwigsburg: Institut für Pädagogische Psychologie und Soziologie.
Reitzle, M., Winkler Metzke, C., & Steinhausen, H.-C. (2001). Eltern und Kinder: Der Zürcher Kurzfragebogen zum Erziehungsverhalten (Zurich Brief Questionnaire for the Assessment of Parental Behaviors). Diagnostica, 47, 196-207.
Schumacher, J., Eisemann, M., & Brähler, E. (1999). Rückblick auf die Eltern: Der Fragebogen zum erinnerten elterlichen Erziehungsverhalten (FEE). Diagnostika, 45, 194-204.
Schwarz, B., Walper, S., Gödde, M., & Jurasic, S. (1997). Dokumentation der Erhebungsinstrumente der 1. Haupterhebung (überarb. Version). Berichte aus der Arbeitsgruppe “Familienentwicklung nach der Trennung,” 14.
Wendt, E.-V., Schmahl, F., Thönnissen, C., Schaer, M., & Walper, S.). Scales Manual of the German Family Panel. pairfam (Panel Analysis of Intimate Relationships and Family Dynamics). Bremen, Chemnitz, Munich.

44
Items Emotional Warmth
1. I show my child with words and gestures that I care about him/her (Ich zeige meinem Kind mit Worten und Gesten, dass ich es gerne habe).
2. I console child up when he/she is sad (Ich tröste mein Kind, wenn es traurig ist). 3. I praise my child (Ich lobe mein Kind).
Scale: 1 (Never / nie) to 5 (Frequently / sehr häufig) Inconsistent Parenting
1. I reduce punishments or end them early (Ich schwäche eine Bestrafung ab oder hebe sie vorzeitig auf).
2. I threaten my child with a punishment but don’t actually follow through (Ich drohe meinem Kind eine Strafe an, bestrafe es aber dann doch nicht).
3. I find it hard to set and keep consistent rules for my child (Es fällt mir schwer in meiner Erziehung konsequent zu sein).
Scale: 1 (Never / nie) to 5 (Frequently / sehr häufig) Monitoring
1. I try to actively influence my child’s circle of friends (Ich versuche den Freundeskreis meines Kindes aktiv zu beeinflussen).
2. When my child goes out, I ask what he/she did and experienced (Wenn mein Kind unterwegs war, frage ich nach, was es getan und erlebt hat).
3. When my child goes out, I know exactly where he/she is (Wenn mein Kind außer Haus ist, weiß ich genau, wo es sich aufhält).
Scale: 1 (Never / nie) to 5 (Frequently / sehr häufig) Negative Communication
1. I criticize my child (Ich kritisiere mein Kind). 2. I yell at my child when he/she does something wrong (Ich schreie mein Kind an, wenn es
etwas falsch gemacht hat). 3. I scold my child when I am angry at him/her (Ich beschimpfe mein Kind, weil ich wütend
auf es bin). Scale: 1 (Never / nie) to 5 (Frequently / sehr häufig) Psychological Control
1. I am disappointed and sad when my child misbehaves (Ich bin enttäuscht und traurig, wenn sich mein Kind schlecht benommen hat).
2. I think my child is ungrateful when he/she does not obey me (Ich halte mein Kind für undankbar, wenn es mir nicht gehorcht).
3. I don’t talk to my child for a while when he/she does something wrong (Ich rede eine Zeit lang nicht mit meinem Kind, wenn es etwas angestellt hat).
Scale: 1 (Never / nie) to 5 (Frequently / sehr häufig) Strict Control
1. I tend to be a strict parent (Ich bin eher streng zu meinem Kind). 2. If my child does something against my will, I punish him/her (Wenn mein Kind etwas
gegen meinen Willen tut, bestrafe ich es). 3. I make it clear to my child that he/she is not to break my rules or question my decisions
(Ich gebe meinem Kind zu verstehen, dass es sich meinen Anordnungen und Entscheidungen nicht widersetzen soll).
Scale: 1 (Never / nie) to 5 (Frequently / sehr häufig)
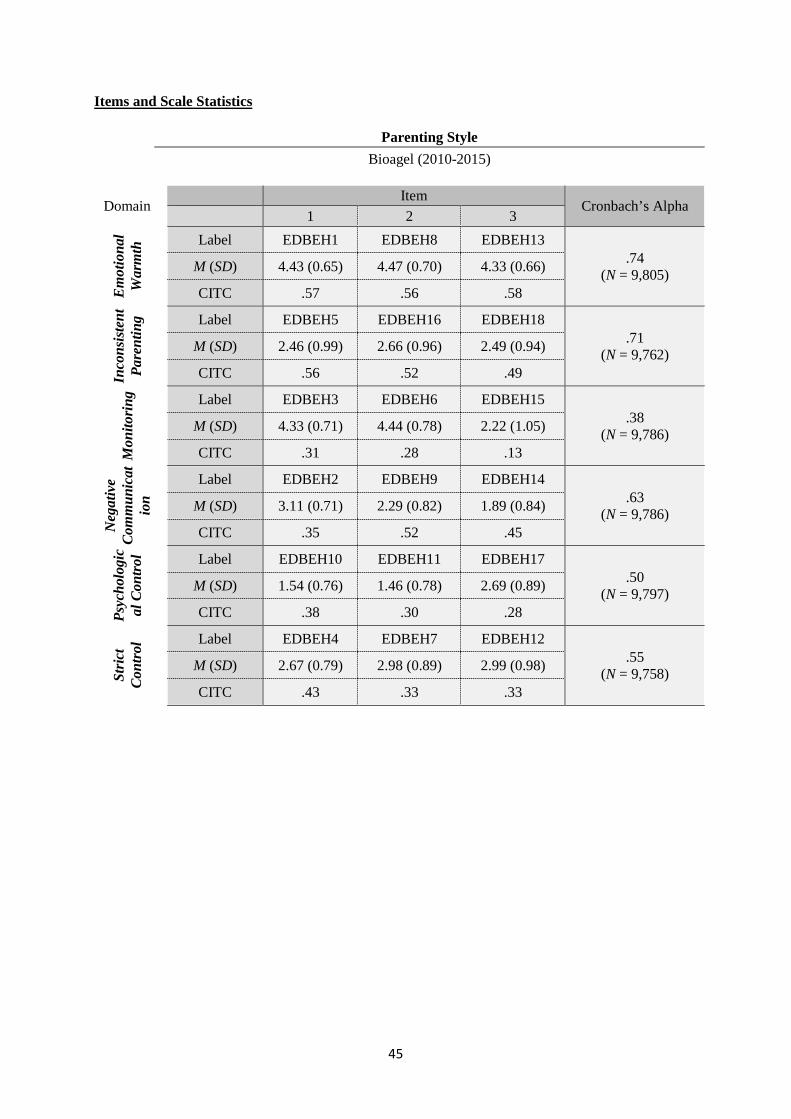
45
Items and Scale Statistics
Parenting Style Bioagel (2010-2015)
Domain Item Cronbach’s Alpha
1 2 3
Em
otio
nal
War
mth
Label EDBEH1 EDBEH8 EDBEH13 .74
(N = 9,805) M (SD) 4.43 (0.65) 4.47 (0.70) 4.33 (0.66)
CITC .57 .56 .58
Inco
nsis
tent
Pa
rent
ing Label EDBEH5 EDBEH16 EDBEH18
.71 (N = 9,762) M (SD) 2.46 (0.99) 2.66 (0.96) 2.49 (0.94)
CITC .56 .52 .49
Mon
itori
ng
Label EDBEH3 EDBEH6 EDBEH15 .38
(N = 9,786) M (SD) 4.33 (0.71) 4.44 (0.78) 2.22 (1.05)
CITC .31 .28 .13
Neg
ativ
e C
omm
unic
atio
n
Label EDBEH2 EDBEH9 EDBEH14 .63
(N = 9,786) M (SD) 3.11 (0.71) 2.29 (0.82) 1.89 (0.84)
CITC .35 .52 .45
Psyc
holo
gic
al C
ontr
ol Label EDBEH10 EDBEH11 EDBEH17
.50 (N = 9,797) M (SD) 1.54 (0.76) 1.46 (0.78) 2.69 (0.89)
CITC .38 .30 .28
Stri
ct
Con
trol
Label EDBEH4 EDBEH7 EDBEH12 .55
(N = 9,758) M (SD) 2.67 (0.79) 2.98 (0.89) 2.99 (0.98)
CITC .43 .33 .33
46
Personality – Big Five
Big Five (Adults) Summary The Big Five concept makes it possible to describe human personality traits in terms of individually differing behaviors and experiences. At the heart of this approach lies the assumption that there exist five broad, non-overlapping dimensions of personality that can be used to describe human personality: openness, conscientiousness, extraversion, agreeableness, and neuroticism. The scale consists of 15 items measuring the “Big Five” and was used in the SOEP in 2005, 2009, and 2013. In 2009 and 2013 the scale was extended by one additional item measuring openness. Theoretical Background The Big Five Model of personality traits, or the “Five-Factor Model,” is a psychological approach aimed at comprehensively describing the human personality. According to this model, intra-individual personality differences can be measured in five broad dimensions – the so-called “Big Five.” Personality traits are coherent and constant structures of feelings, thoughts, and forms of behavior that influence psychological conditions and individual actions (Costa & McCrae, 1985). The Five-Factor Model assumes that values in these different dimensions vary from one individual to the next, but that the basic structure of the personality, at least for individuals from Western cultures, remains constant. The five personality dimensions are: openness to experience, conscientiousness, extraversion, agreeableness, and neuroticism. Individuals with high openness to experience describe themselves as having a lively imagination, being original and creative, and appreciating artistic and aesthetic experiences. Individuals with high conscientiousness describe themselves as highly motivated, success-oriented, thorough in their work, and as completing their tasks effectively and efficiently. Individuals with high extroversion see themselves as communicative, talkative, open, and outgoing. In contrast, introverted individuals describe themselves as reserved or shy. Individuals with high values for neuroticism describe themselves as nervous, often worried, and as having difficulties dealing with stress. The antithesis of neuroticism is emotional stability. Finally, individuals with high agreeableness describe themselves as considerate and friendly, willing to forgive, and as not being unkind to others. The Big Five approach has its origins in two distinct traditions in psychology: first, in the psycho-lexical tradition of Allport (1937) and Cattell (1946), and second, in the differential diagnosis or clinical tradition of personality research pioneered by Stern (1911) and Eysenck (1947). Both lines of research were ultimately brought together into a single model and formalized by Costa and McCrae (1985). Since then, the validity of this approach has been confirmed in a number of studies of different groups of individuals from different countries including the USA, England, Germany, Spain, Sweden, and China. Scale Development For reasons of space and time, the SOEP required a short and efficient scale that is nevertheless capable of reflecting the basic structure of the Five-Factor Model in a robust and reliable way. The choice of items was made based on five criteria: (1) the conditions and limitations that result from the SOEP questionnaire, (2) the aim of achieving balanced coverage of the basic personality dimensions, (3) the internal consistency of the scale, (4) the dimensionality of the items, and (5) the correspondence with other, established measurement instruments. The guideline in developing the short scale was to use at least three items per latent construct. The development and validation of the scale took place in the framework of a SOEP pretest, which represents an independent representative survey of the resident population of Germany. The items were taken from the Ten-Item Personality Inventory (TIPI; Gosling et al., 2003) and the BFI-25. The BFI-25 was developed based on a principal component analysis carried out with the entire inventory by John et al. (1991): the five items for each personality dimension with the highest factor loadings were included. Further information can be found in Gerlitz und Schupp (2005) and in Lang et al. (2011).
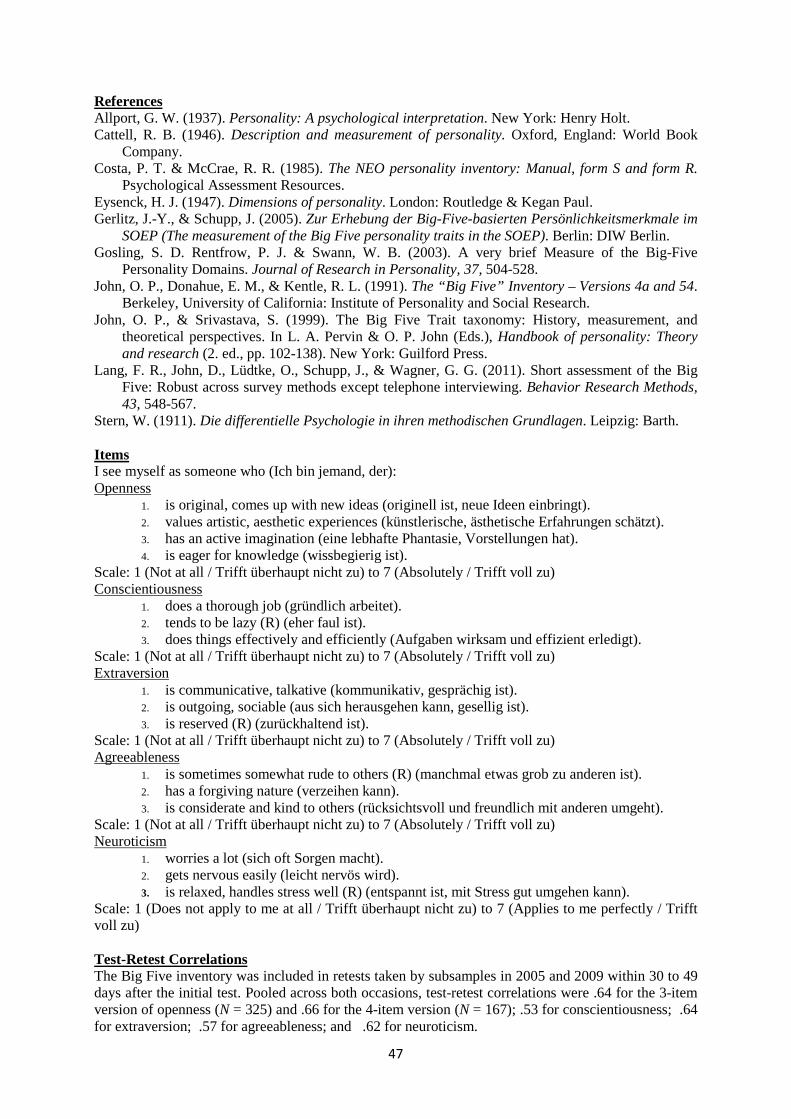
47
References Allport, G. W. (1937). Personality: A psychological interpretation. New York: Henry Holt. Cattell, R. B. (1946). Description and measurement of personality. Oxford, England: World Book
Company. Costa, P. T. & McCrae, R. R. (1985). The NEO personality inventory: Manual, form S and form R.
Psychological Assessment Resources. Eysenck, H. J. (1947). Dimensions of personality. London: Routledge & Kegan Paul. Gerlitz, J.-Y., & Schupp, J. (2005). Zur Erhebung der Big-Five-basierten Persönlichkeitsmerkmale im
SOEP (The measurement of the Big Five personality traits in the SOEP). Berlin: DIW Berlin. Gosling, S. D. Rentfrow, P. J. & Swann, W. B. (2003). A very brief Measure of the Big-Five
Personality Domains. Journal of Research in Personality, 37, 504-528. John, O. P., Donahue, E. M., & Kentle, R. L. (1991). The “Big Five” Inventory – Versions 4a and 54.
Berkeley, University of California: Institute of Personality and Social Research. John, O. P., & Srivastava, S. (1999). The Big Five Trait taxonomy: History, measurement, and
theoretical perspectives. In L. A. Pervin & O. P. John (Eds.), Handbook of personality: Theory and research (2. ed., pp. 102-138). New York: Guilford Press.
Lang, F. R., John, D., Lüdtke, O., Schupp, J., & Wagner, G. G. (2011). Short assessment of the Big Five: Robust across survey methods except telephone interviewing. Behavior Research Methods, 43, 548-567.
Stern, W. (1911). Die differentielle Psychologie in ihren methodischen Grundlagen. Leipzig: Barth. Items I see myself as someone who (Ich bin jemand, der): Openness
1. is original, comes up with new ideas (originell ist, neue Ideen einbringt). 2. values artistic, aesthetic experiences (künstlerische, ästhetische Erfahrungen schätzt). 3. has an active imagination (eine lebhafte Phantasie, Vorstellungen hat). 4. is eager for knowledge (wissbegierig ist).
Scale: 1 (Not at all / Trifft überhaupt nicht zu) to 7 (Absolutely / Trifft voll zu) Conscientiousness
1. does a thorough job (gründlich arbeitet). 2. tends to be lazy (R) (eher faul ist). 3. does things effectively and efficiently (Aufgaben wirksam und effizient erledigt).
Scale: 1 (Not at all / Trifft überhaupt nicht zu) to 7 (Absolutely / Trifft voll zu) Extraversion
1. is communicative, talkative (kommunikativ, gesprächig ist). 2. is outgoing, sociable (aus sich herausgehen kann, gesellig ist). 3. is reserved (R) (zurückhaltend ist).
Scale: 1 (Not at all / Trifft überhaupt nicht zu) to 7 (Absolutely / Trifft voll zu) Agreeableness
1. is sometimes somewhat rude to others (R) (manchmal etwas grob zu anderen ist). 2. has a forgiving nature (verzeihen kann). 3. is considerate and kind to others (rücksichtsvoll und freundlich mit anderen umgeht).
Scale: 1 (Not at all / Trifft überhaupt nicht zu) to 7 (Absolutely / Trifft voll zu) Neuroticism
1. worries a lot (sich oft Sorgen macht). 2. gets nervous easily (leicht nervös wird). 3. is relaxed, handles stress well (R) (entspannt ist, mit Stress gut umgehen kann).
Scale: 1 (Does not apply to me at all / Trifft überhaupt nicht zu) to 7 (Applies to me perfectly / Trifft voll zu) Test-Retest Correlations The Big Five inventory was included in retests taken by subsamples in 2005 and 2009 within 30 to 49 days after the initial test. Pooled across both occasions, test-retest correlations were .64 for the 3-item version of openness (N = 325) and .66 for the 4-item version (N = 167); .53 for conscientiousness; .64 for extraversion; .57 for agreeableness; and .62 for neuroticism.

48
Big Five (Adults) P (Individual Questionnaire)
Domain Year Item Cronbach’s Alpha 1 2 3 4
O
2005
Label VP12504 VP12509 VP12514
.63 (N = 20,768)
M (SD) 4.57 (1.44) 4.11 (1.82) 4.80 (1.53) CITC .46 .39 .47
2009
Label ZP12004 ZP12009 ZP12014 ZP12016 .67
(N = 20,430) M (SD) 4.51 (1.44) 3.99 (1.85) 4.70 (1.55) 5.34 (1.35) CITC .49 .42 .49 .45
2013
Label BDP15104 BDP15109 BDP15114 BDP1516 .66
(N = 18,939) M (SD) 4.67 (1.39) 4.25 (1.83) 4.83 (1.50) 5.48 (1.26) CITC .48 .41 .48 .44
C
2005
Label VP12501 VP12507 (R) VP12511
.62 (N = 20,803)
M (SD) 6.18 (1.03) 5.74 (1.53) 5.78 (1.13) CITC .53 .37 .45
2009
Label ZP12001 ZP12007 (R) ZP12011
.59 (N = 20,472)
M (SD) 6.14 (1.06) 5.57 (1.58) 5.75 (1.15) CITC .50 .33 .43
2013
Label BDP15101 BDP15107 (R) BDP15111
.58 (N = 18,997)
M (SD) 6.15 (0.99) 5.54 (1.59) 5.79 (1.08) CITC .49 .33 .43
E
2005
Label VP12502 VP12508 VP12512 (R)
.66 (N = 20,901)
M (SD) 5.50 (1.34) 5.09 (1.45) 3.90 (1.63) CITC .54 .53 .36
2009
Label ZP12002 ZP12008 ZP12012 (R)
.66 (N = 20,521)
M (SD) 5.43 (1.37) 4.98 (1.46) 3.91 (1.59) CITC .54 .53 .36
2013
Label BDP15102 BDP15108 BDP15112 (R)
.66 (N = 19,024)
M (SD) 5.55 (1.30) 5.15 (1.41) 3.87 (1.59) CITC .54 .54 .36
…………………………………………………………………………………………………………….
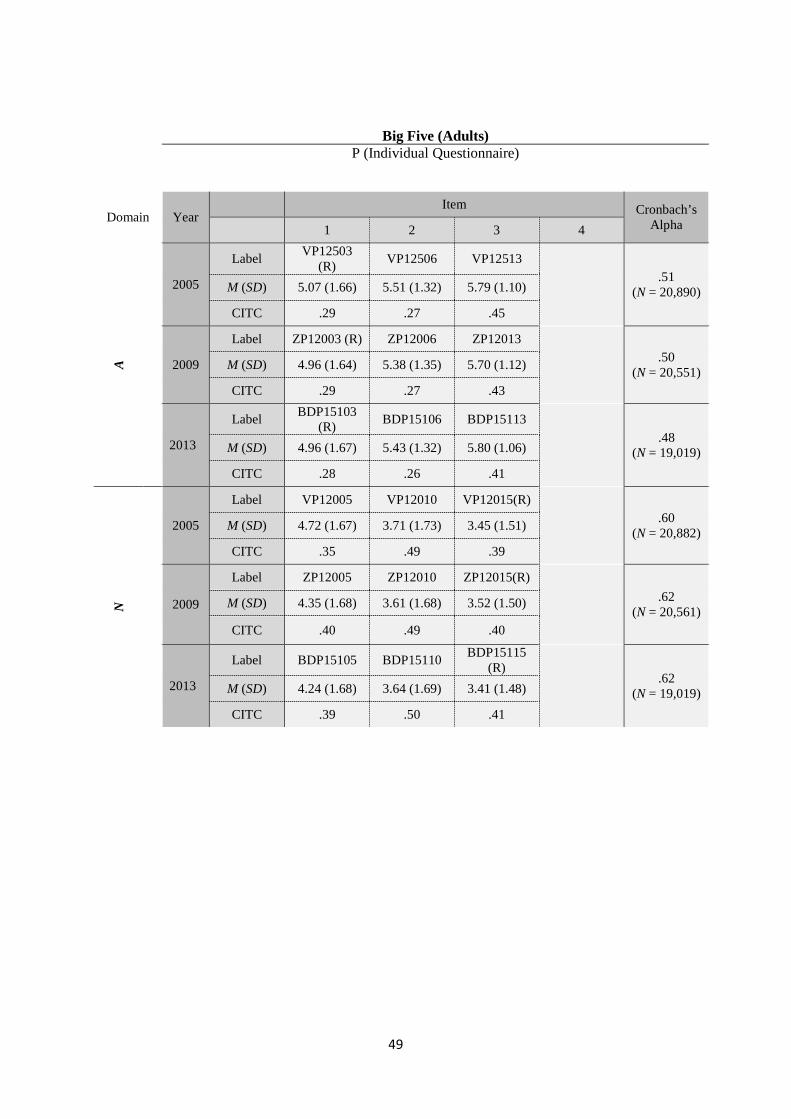
49
Big Five (Adults) P (Individual Questionnaire)
Domain Year Item Cronbach’s
Alpha 1 2 3 4
A
2005
Label VP12503 (R) VP12506 VP12513
.51 (N = 20,890)
M (SD) 5.07 (1.66) 5.51 (1.32) 5.79 (1.10) CITC .29 .27 .45
2009
Label ZP12003 (R) ZP12006 ZP12013
.50 (N = 20,551)
M (SD) 4.96 (1.64) 5.38 (1.35) 5.70 (1.12) CITC .29 .27 .43
2013
Label BDP15103 (R) BDP15106 BDP15113
.48 (N = 19,019)
M (SD) 4.96 (1.67) 5.43 (1.32) 5.80 (1.06) CITC .28 .26 .41
N
2005
Label VP12005 VP12010 VP12015(R)
.60 (N = 20,882)
M (SD) 4.72 (1.67) 3.71 (1.73) 3.45 (1.51) CITC .35 .49 .39
2009
Label ZP12005 ZP12010 ZP12015(R)
.62 (N = 20,561)
M (SD) 4.35 (1.68) 3.61 (1.68) 3.52 (1.50) CITC .40 .49 .40
2013
Label BDP15105 BDP15110 BDP15115 (R)
.62 (N = 19,019)
M (SD) 4.24 (1.68) 3.64 (1.69) 3.41 (1.48) CITC .39 .50 .41
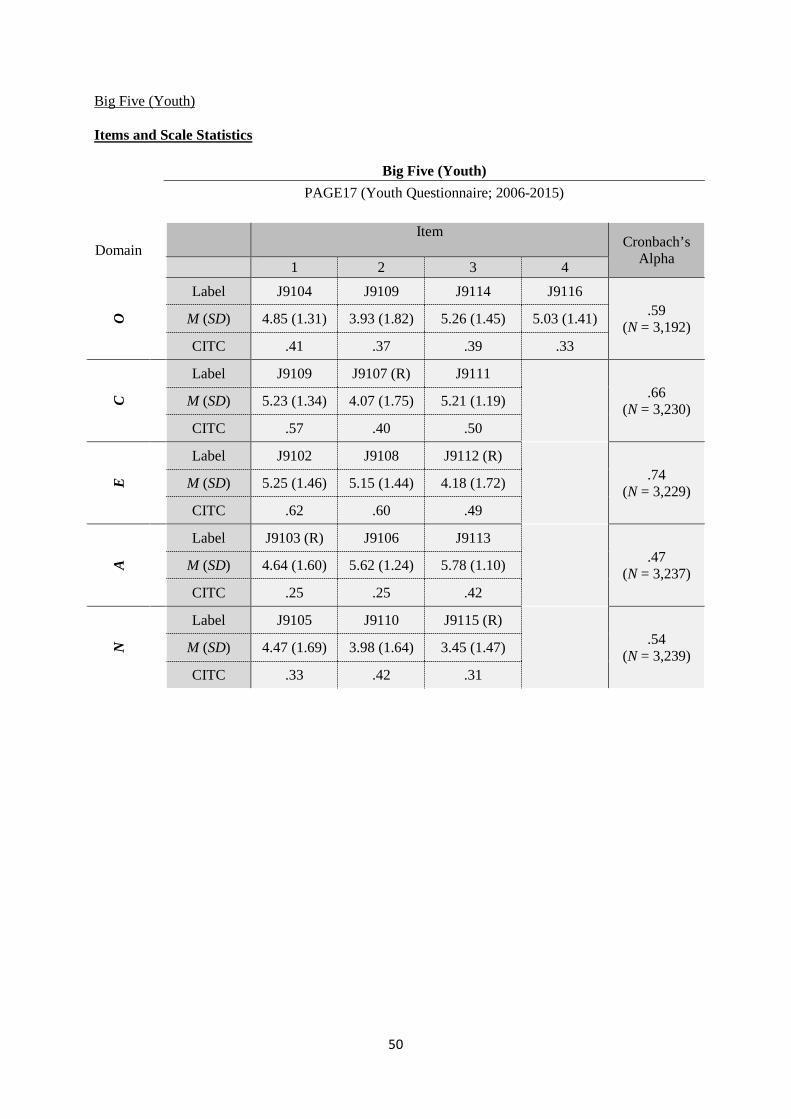
50
Big Five (Youth) Items and Scale Statistics
Big Five (Youth) PAGE17 (Youth Questionnaire; 2006-2015)
Domain Item
Cronbach’s Alpha 1 2 3 4
O
Label J9104 J9109 J9114 J9116 .59
(N = 3,192) M (SD) 4.85 (1.31) 3.93 (1.82) 5.26 (1.45) 5.03 (1.41) CITC .41 .37 .39 .33
C
Label J9109 J9107 (R) J9111
.66 (N = 3,230)
M (SD) 5.23 (1.34) 4.07 (1.75) 5.21 (1.19) CITC .57 .40 .50
E
Label J9102 J9108 J9112 (R)
.74 (N = 3,229)
M (SD) 5.25 (1.46) 5.15 (1.44) 4.18 (1.72) CITC .62 .60 .49
A
Label J9103 (R) J9106 J9113
.47 (N = 3,237)
M (SD) 4.64 (1.60) 5.62 (1.24) 5.78 (1.10) CITC .25 .25 .42
N
Label J9105 J9110 J9115 (R)
.54 (N = 3,239)
M (SD) 4.47 (1.69) 3.98 (1.64) 3.45 (1.47) CITC .33 .42 .31
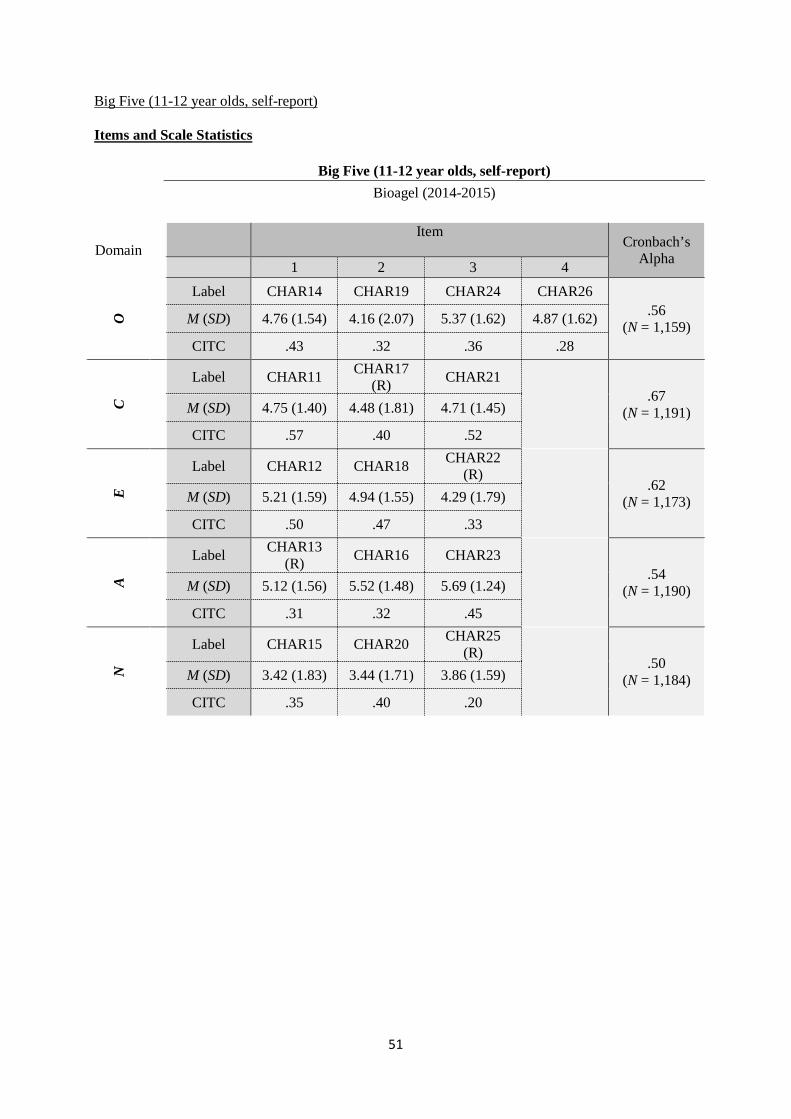
51
Big Five (11-12 year olds, self-report) Items and Scale Statistics
Big Five (11-12 year olds, self-report) Bioagel (2014-2015)
Domain Item
Cronbach’s Alpha 1 2 3 4
O
Label CHAR14 CHAR19 CHAR24 CHAR26 .56
(N = 1,159) M (SD) 4.76 (1.54) 4.16 (2.07) 5.37 (1.62) 4.87 (1.62) CITC .43 .32 .36 .28
C
Label CHAR11 CHAR17 (R) CHAR21
.67 (N = 1,191)
M (SD) 4.75 (1.40) 4.48 (1.81) 4.71 (1.45) CITC .57 .40 .52
E
Label CHAR12 CHAR18 CHAR22 (R)
.62 (N = 1,173)
M (SD) 5.21 (1.59) 4.94 (1.55) 4.29 (1.79) CITC .50 .47 .33
A
Label CHAR13 (R) CHAR16 CHAR23
.54 (N = 1,190)
M (SD) 5.12 (1.56) 5.52 (1.48) 5.69 (1.24) CITC .31 .32 .45
N
Label CHAR15 CHAR20 CHAR25 (R)
.50 (N = 1,184)
M (SD) 3.42 (1.83) 3.44 (1.71) 3.86 (1.59) CITC .35 .40 .20
52
Big Five (9-10 year olds & 5-6 year olds, parent reports) References Asendorpf, J. B., & van Aken, M. A. G. (2003). Validity of Big Five personality judgments in
childhood: A 9 year longitudinal study. European Journal of Personality, 17, 1-17. Weinert, S., Asendorpf, J. B., Beelmann, A., Doil, H., Frevert, S., Lohaus, A., & Hasselhorn, M.
(2007). Expertise zur Erfassung von psychologischen Personmerkmalen bei Kindern im Alter von fünf Jahren im Rahmen des SOEP. Berlin: DIW Berlin.
Items How would you rank your child in comparison to other children of the same age (Wie würden Sie Ihr Kind im Vergleich zu anderen Kindern gleichen Alters beurteilen): Openness/Intellect
1. Child is not that interested – hungry for knowledge (ist wenig interessiert – ist wissensdurstig).
2. Child understands quickly – needs more time (begreift schnell – braucht mehr Zeit). Scale: 0 to 10 Conscientiousness
1. Child is tidy – untidy (ist unordentlich – ist ordentlich). 2. Child is focused – easy to distract (ist konzentriert – ist leicht ablenkbar).
Scale: 0 to 10 Extraversion
1. Child is talkative – quiet (ist gesprächig – ist still). 2. Child is withdrawn – sociable (ist zurückgezogen– ist kontaktfreudig).
Scale: 0 to 10 Agreeableness
1. Child is good-natured – irritable (ist gutmütig – ist reizbar). 2. Child is obstinate – compliant (ist trotzig – ist fügsam).
Scale: 0 to 10 Neuroticism
1. Child is self-confident – insecure (hat Selbstvertrauen – ist unsicher). 2. Child is fearful – fearless (ist ängstlich – ist unängstlich).
Scale: 0 to 10

53
Items and Scale Statistics
Big Five (9-10 year olds, parent reports) Bioagel (2012-2015)
Domain Item Cronbach’s
Alpha 1 2
O
Label CHAR7 CHAR4 (R) .56
(N = 4,672) M (SD) 7.63 (2.21) 6.90 (2.82) CITC .40 .40
C
Label CHAR5 CHAR2 (R) .46
(N = 4,664) M (SD) 4.85 (2.78) 5.32 (3.06) CITC .30 .30
E
Label CHAR1B (R) CHAR9 .64
(N = 4,670) M (SD) 7.29 (2.53) 7.54 (2.30) CITC .47 .47
A
Label CHAR6 (R) CHAR3 .51
(N = 4,655) M (SD) 6.98 (2.58) 5.65 (2.51) CITC .34 .34
N
Label CHAR8 CHAR10 (R) .59
(N = 4,670) M (SD) 3.49 (2.61) 3.75 (2.51) CITC .42 .42
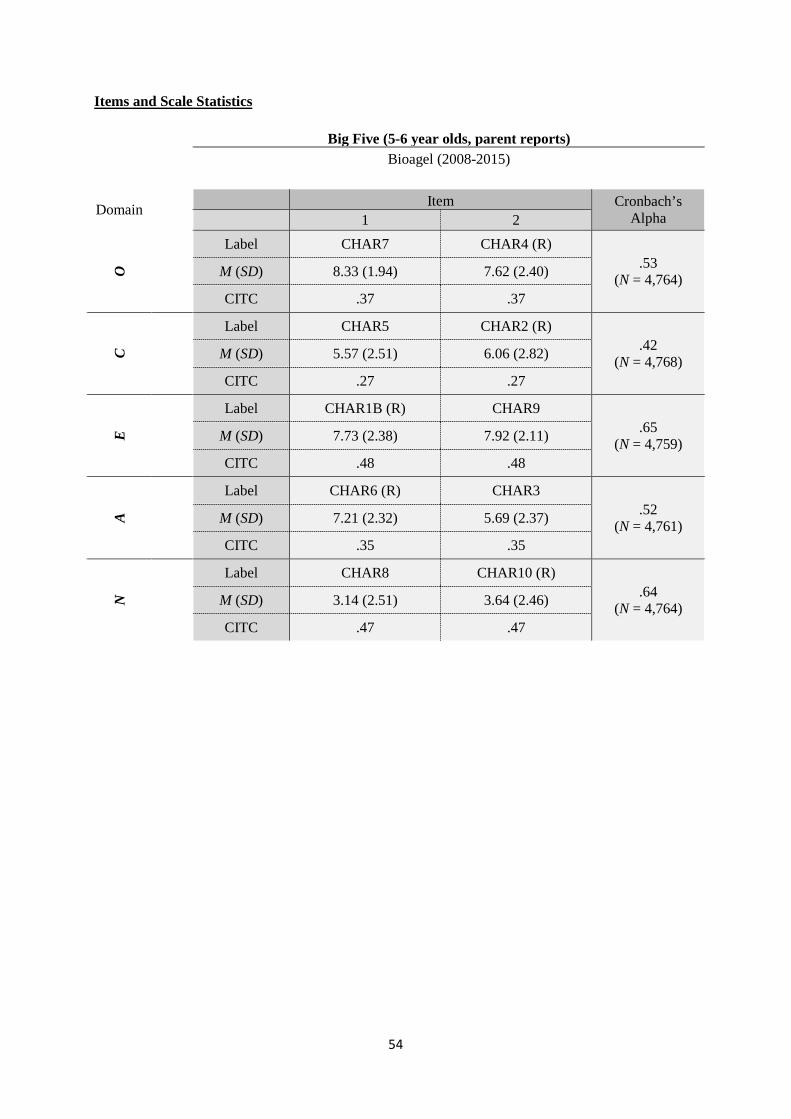
54
Items and Scale Statistics
Big Five (5-6 year olds, parent reports) Bioagel (2008-2015)
Domain Item Cronbach’s
Alpha 1 2
O
Label CHAR7 CHAR4 (R) .53
(N = 4,764) M (SD) 8.33 (1.94) 7.62 (2.40) CITC .37 .37
C
Label CHAR5 CHAR2 (R) .42
(N = 4,768) M (SD) 5.57 (2.51) 6.06 (2.82) CITC .27 .27
E
Label CHAR1B (R) CHAR9 .65
(N = 4,759) M (SD) 7.73 (2.38) 7.92 (2.11) CITC .48 .48
A
Label CHAR6 (R) CHAR3 .52
(N = 4,761) M (SD) 7.21 (2.32) 5.69 (2.37) CITC .35 .35
N
Label CHAR8 CHAR10 (R) .64
(N = 4,764) M (SD) 3.14 (2.51) 3.64 (2.46) CITC .47 .47
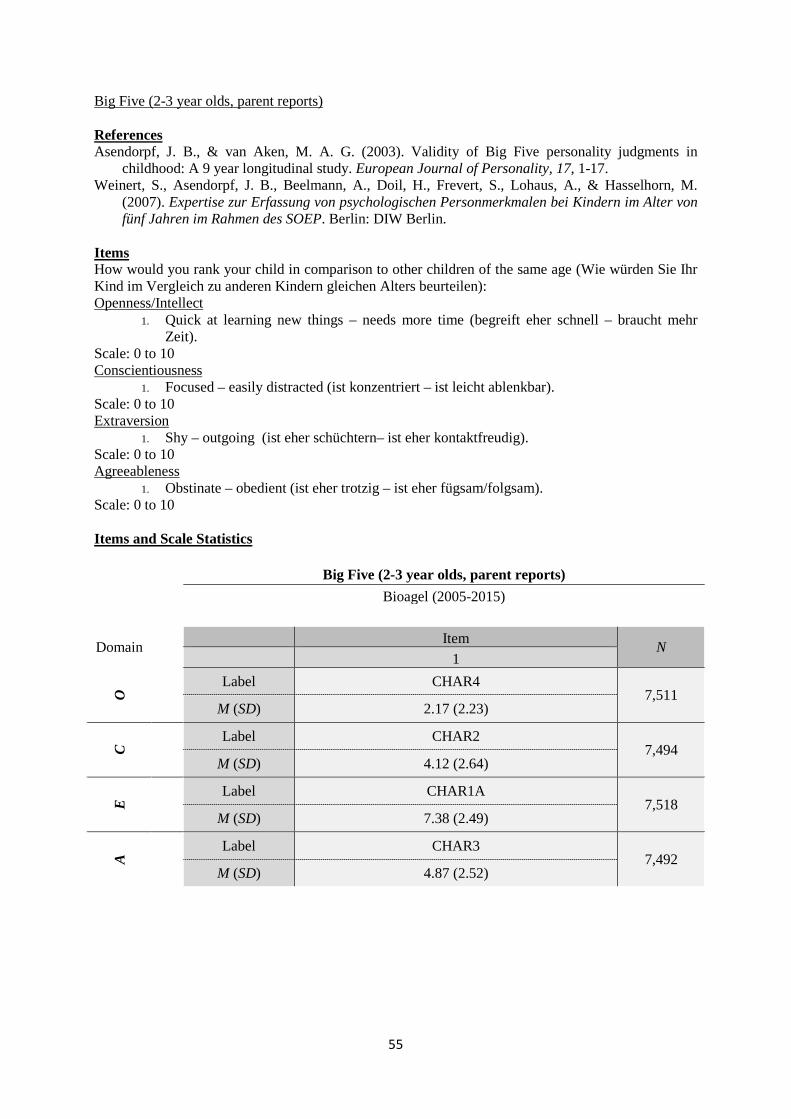
55
Big Five (2-3 year olds, parent reports) References Asendorpf, J. B., & van Aken, M. A. G. (2003). Validity of Big Five personality judgments in
childhood: A 9 year longitudinal study. European Journal of Personality, 17, 1-17. Weinert, S., Asendorpf, J. B., Beelmann, A., Doil, H., Frevert, S., Lohaus, A., & Hasselhorn, M.
(2007). Expertise zur Erfassung von psychologischen Personmerkmalen bei Kindern im Alter von fünf Jahren im Rahmen des SOEP. Berlin: DIW Berlin.
Items How would you rank your child in comparison to other children of the same age (Wie würden Sie Ihr Kind im Vergleich zu anderen Kindern gleichen Alters beurteilen): Openness/Intellect
1. Quick at learning new things – needs more time (begreift eher schnell – braucht mehr Zeit).
Scale: 0 to 10 Conscientiousness
1. Focused – easily distracted (ist konzentriert – ist leicht ablenkbar). Scale: 0 to 10 Extraversion
1. Shy – outgoing (ist eher schüchtern– ist eher kontaktfreudig). Scale: 0 to 10 Agreeableness
1. Obstinate – obedient (ist eher trotzig – ist eher fügsam/folgsam). Scale: 0 to 10 Items and Scale Statistics
Big Five (2-3 year olds, parent reports) Bioagel (2005-2015)
Domain Item N 1
O Label CHAR4
7,511 M (SD) 2.17 (2.23)
C Label CHAR2
7,494 M (SD) 4.12 (2.64)
E Label CHAR1A
7,518 M (SD) 7.38 (2.49)
A Label CHAR3
7,492 M (SD) 4.87 (2.52)
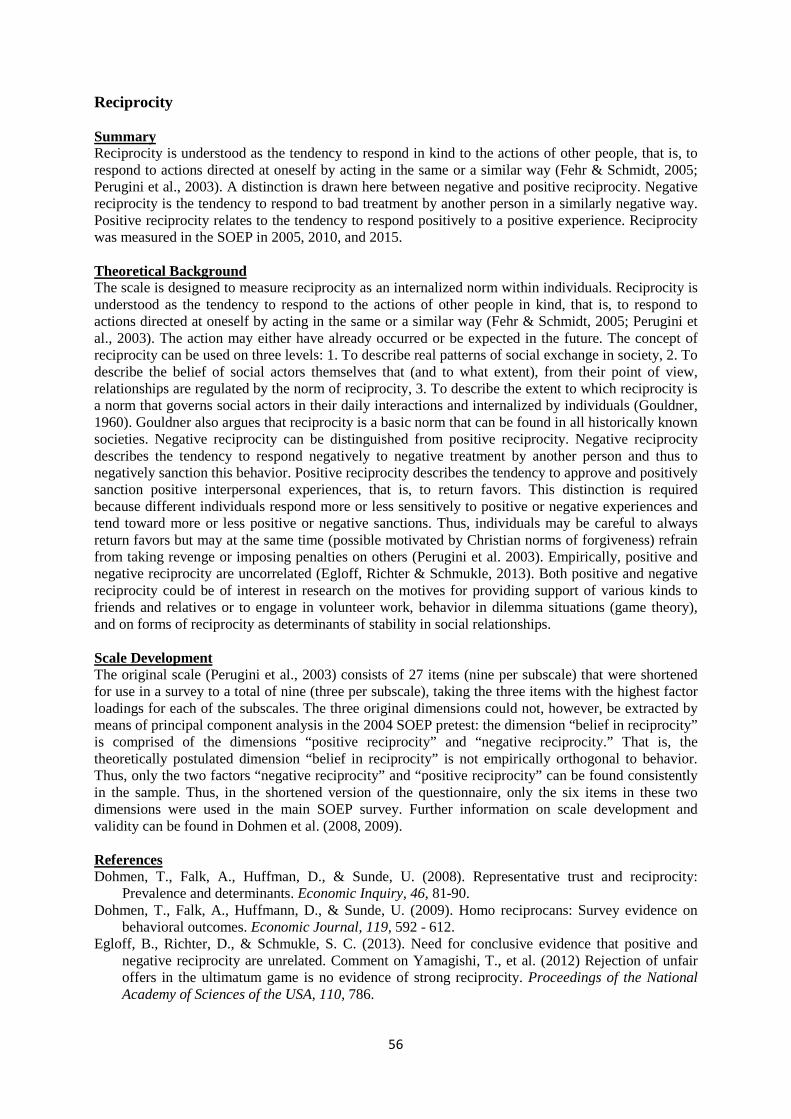
56
Reciprocity Summary Reciprocity is understood as the tendency to respond in kind to the actions of other people, that is, to respond to actions directed at oneself by acting in the same or a similar way (Fehr & Schmidt, 2005; Perugini et al., 2003). A distinction is drawn here between negative and positive reciprocity. Negative reciprocity is the tendency to respond to bad treatment by another person in a similarly negative way. Positive reciprocity relates to the tendency to respond positively to a positive experience. Reciprocity was measured in the SOEP in 2005, 2010, and 2015. Theoretical Background The scale is designed to measure reciprocity as an internalized norm within individuals. Reciprocity is understood as the tendency to respond to the actions of other people in kind, that is, to respond to actions directed at oneself by acting in the same or a similar way (Fehr & Schmidt, 2005; Perugini et al., 2003). The action may either have already occurred or be expected in the future. The concept of reciprocity can be used on three levels: 1. To describe real patterns of social exchange in society, 2. To describe the belief of social actors themselves that (and to what extent), from their point of view, relationships are regulated by the norm of reciprocity, 3. To describe the extent to which reciprocity is a norm that governs social actors in their daily interactions and internalized by individuals (Gouldner, 1960). Gouldner also argues that reciprocity is a basic norm that can be found in all historically known societies. Negative reciprocity can be distinguished from positive reciprocity. Negative reciprocity describes the tendency to respond negatively to negative treatment by another person and thus to negatively sanction this behavior. Positive reciprocity describes the tendency to approve and positively sanction positive interpersonal experiences, that is, to return favors. This distinction is required because different individuals respond more or less sensitively to positive or negative experiences and tend toward more or less positive or negative sanctions. Thus, individuals may be careful to always return favors but may at the same time (possible motivated by Christian norms of forgiveness) refrain from taking revenge or imposing penalties on others (Perugini et al. 2003). Empirically, positive and negative reciprocity are uncorrelated (Egloff, Richter & Schmukle, 2013). Both positive and negative reciprocity could be of interest in research on the motives for providing support of various kinds to friends and relatives or to engage in volunteer work, behavior in dilemma situations (game theory), and on forms of reciprocity as determinants of stability in social relationships. Scale Development The original scale (Perugini et al., 2003) consists of 27 items (nine per subscale) that were shortened for use in a survey to a total of nine (three per subscale), taking the three items with the highest factor loadings for each of the subscales. The three original dimensions could not, however, be extracted by means of principal component analysis in the 2004 SOEP pretest: the dimension “belief in reciprocity” is comprised of the dimensions “positive reciprocity” and “negative reciprocity.” That is, the theoretically postulated dimension “belief in reciprocity” is not empirically orthogonal to behavior. Thus, only the two factors “negative reciprocity” and “positive reciprocity” can be found consistently in the sample. Thus, in the shortened version of the questionnaire, only the six items in these two dimensions were used in the main SOEP survey. Further information on scale development and validity can be found in Dohmen et al. (2008, 2009). References Dohmen, T., Falk, A., Huffman, D., & Sunde, U. (2008). Representative trust and reciprocity:
Prevalence and determinants. Economic Inquiry, 46, 81-90. Dohmen, T., Falk, A., Huffmann, D., & Sunde, U. (2009). Homo reciprocans: Survey evidence on
behavioral outcomes. Economic Journal, 119, 592 - 612. Egloff, B., Richter, D., & Schmukle, S. C. (2013). Need for conclusive evidence that positive and
negative reciprocity are unrelated. Comment on Yamagishi, T., et al. (2012) Rejection of unfair offers in the ultimatum game is no evidence of strong reciprocity. Proceedings of the National Academy of Sciences of the USA, 110, 786.
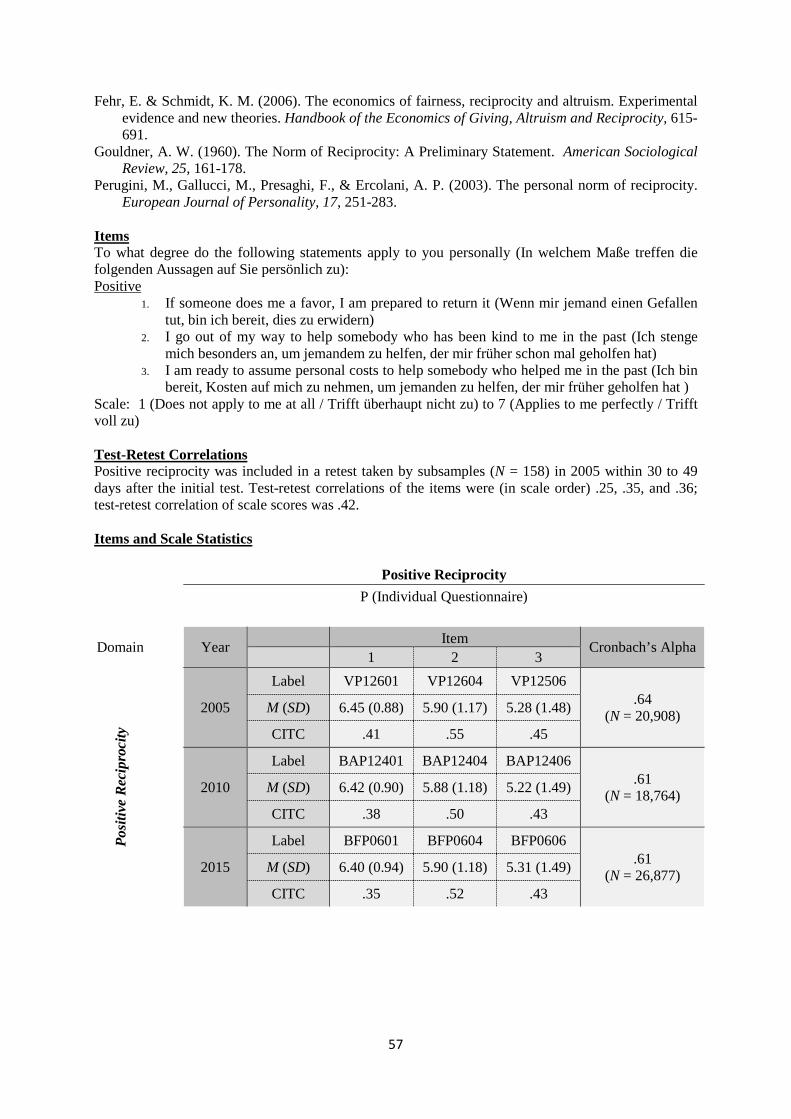
57
Fehr, E. & Schmidt, K. M. (2006). The economics of fairness, reciprocity and altruism. Experimental evidence and new theories. Handbook of the Economics of Giving, Altruism and Reciprocity, 615-691.
Gouldner, A. W. (1960). The Norm of Reciprocity: A Preliminary Statement. American Sociological Review, 25, 161-178.
Perugini, M., Gallucci, M., Presaghi, F., & Ercolani, A. P. (2003). The personal norm of reciprocity. European Journal of Personality, 17, 251-283.
Items To what degree do the following statements apply to you personally (In welchem Maße treffen die folgenden Aussagen auf Sie persönlich zu): Positive
1. If someone does me a favor, I am prepared to return it (Wenn mir jemand einen Gefallen tut, bin ich bereit, dies zu erwidern)
2. I go out of my way to help somebody who has been kind to me in the past (Ich stenge mich besonders an, um jemandem zu helfen, der mir früher schon mal geholfen hat)
3. I am ready to assume personal costs to help somebody who helped me in the past (Ich bin bereit, Kosten auf mich zu nehmen, um jemanden zu helfen, der mir früher geholfen hat )
Scale: 1 (Does not apply to me at all / Trifft überhaupt nicht zu) to 7 (Applies to me perfectly / Trifft voll zu) Test-Retest Correlations Positive reciprocity was included in a retest taken by subsamples (N = 158) in 2005 within 30 to 49 days after the initial test. Test-retest correlations of the items were (in scale order) .25, .35, and .36; test-retest correlation of scale scores was .42. Items and Scale Statistics
Positive Reciprocity P (Individual Questionnaire)
Domain
Year Item Cronbach’s Alpha 1 2 3
Posi
tive
Rec
ipro
city
2005
Label VP12601 VP12604 VP12506 .64
(N = 20,908) M (SD) 6.45 (0.88) 5.90 (1.17) 5.28 (1.48) CITC .41 .55 .45
2010
Label BAP12401 BAP12404 BAP12406 .61
(N = 18,764) M (SD) 6.42 (0.90) 5.88 (1.18) 5.22 (1.49) CITC .38 .50 .43
2015
Label BFP0601 BFP0604 BFP0606 .61
(N = 26,877) M (SD) 6.40 (0.94) 5.90 (1.18) 5.31 (1.49) CITC .35 .52 .43
58
Items To what degree do the following statements apply to you personally (In welchem Maße treffen die folgenden Aussagen auf Sie persönlich zu): Negative
1. If I suffer a serious wrong, I will take revenge as soon as possible, no matter what the cost (Wenn mir schweres Unrecht zuteilwird, werde ich mich um jeden Preis bei der nächsten Gelegenheit dafür rächen)
2. If somebody puts me in a difficult position, I will do the same to him/her (Wenn mich jemand in eine schwierige Lage bringt, werde ich das Gleiche mit ihm zu machen)
3. If somebody offends me, I will offend him/her back (Wenn mich jemand beleidigt, werde ich mich ihm gegenüber beleidigend verhalten)
Scale: 1 (Does not apply to me at all / Trifft überhaupt nicht zu) to 7 (Applies to me perfectly / Trifft voll zu) Test-Retest Correlations Negative reciprocity was included in a retest taken by a subsample (N = 158) in 2005 within 30 to 49 days after the initial test. Test-retest correlations of the items were (in scale order) .44, .42, and .58; test-retest correlation of scale scores was .64. Items and Scale Statistics
Negative Reciprocity P (Individual Questionnaire)
Domain
Year Item Cronbach’s Alpha 1 2 3
Neg
ativ
e R
ecip
roci
ty
2005
Label VP12602 VP12603 VP12605 .83
(N = 20,854) M (SD) 3.21 (1.73) 2.88 (1.63) 3.24 (1.73) CITC .71 .73 .61
2010
Label BAP12402 BAP12403 BAP12405 .82
(N = 18,720) M (SD) 3.18 (1.69) 2.83 (1.59) 3.12 (1.70) CITC .70 .73 .59
2015
Label BFP0602 BFP0603 BFP0605 .81
(N = 26,921) M (SD) 2.77 (1.67) 2.47 (1.53) 2.85 (1.70) CITC .68 .72 .56
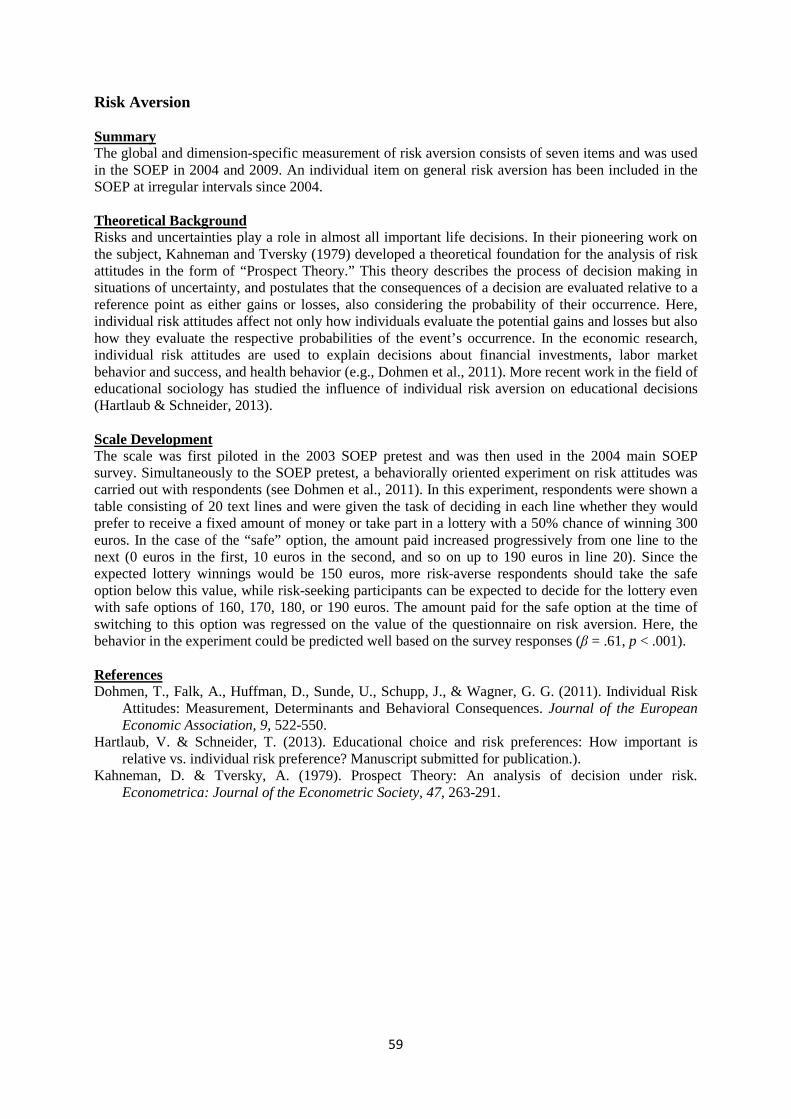
59
Risk Aversion Summary The global and dimension-specific measurement of risk aversion consists of seven items and was used in the SOEP in 2004 and 2009. An individual item on general risk aversion has been included in the SOEP at irregular intervals since 2004. Theoretical Background Risks and uncertainties play a role in almost all important life decisions. In their pioneering work on the subject, Kahneman and Tversky (1979) developed a theoretical foundation for the analysis of risk attitudes in the form of “Prospect Theory.” This theory describes the process of decision making in situations of uncertainty, and postulates that the consequences of a decision are evaluated relative to a reference point as either gains or losses, also considering the probability of their occurrence. Here, individual risk attitudes affect not only how individuals evaluate the potential gains and losses but also how they evaluate the respective probabilities of the event’s occurrence. In the economic research, individual risk attitudes are used to explain decisions about financial investments, labor market behavior and success, and health behavior (e.g., Dohmen et al., 2011). More recent work in the field of educational sociology has studied the influence of individual risk aversion on educational decisions (Hartlaub & Schneider, 2013). Scale Development The scale was first piloted in the 2003 SOEP pretest and was then used in the 2004 main SOEP survey. Simultaneously to the SOEP pretest, a behaviorally oriented experiment on risk attitudes was carried out with respondents (see Dohmen et al., 2011). In this experiment, respondents were shown a table consisting of 20 text lines and were given the task of deciding in each line whether they would prefer to receive a fixed amount of money or take part in a lottery with a 50% chance of winning 300 euros. In the case of the “safe” option, the amount paid increased progressively from one line to the next (0 euros in the first, 10 euros in the second, and so on up to 190 euros in line 20). Since the expected lottery winnings would be 150 euros, more risk-averse respondents should take the safe option below this value, while risk-seeking participants can be expected to decide for the lottery even with safe options of 160, 170, 180, or 190 euros. The amount paid for the safe option at the time of switching to this option was regressed on the value of the questionnaire on risk aversion. Here, the behavior in the experiment could be predicted well based on the survey responses (β = .61, p < .001). References Dohmen, T., Falk, A., Huffman, D., Sunde, U., Schupp, J., & Wagner, G. G. (2011). Individual Risk
Attitudes: Measurement, Determinants and Behavioral Consequences. Journal of the European Economic Association, 9, 522-550.
Hartlaub, V. & Schneider, T. (2013). Educational choice and risk preferences: How important is relative vs. individual risk preference? Manuscript submitted for publication.).
Kahneman, D. & Tversky, A. (1979). Prospect Theory: An analysis of decision under risk. Econometrica: Journal of the Econometric Society, 47, 263-291.
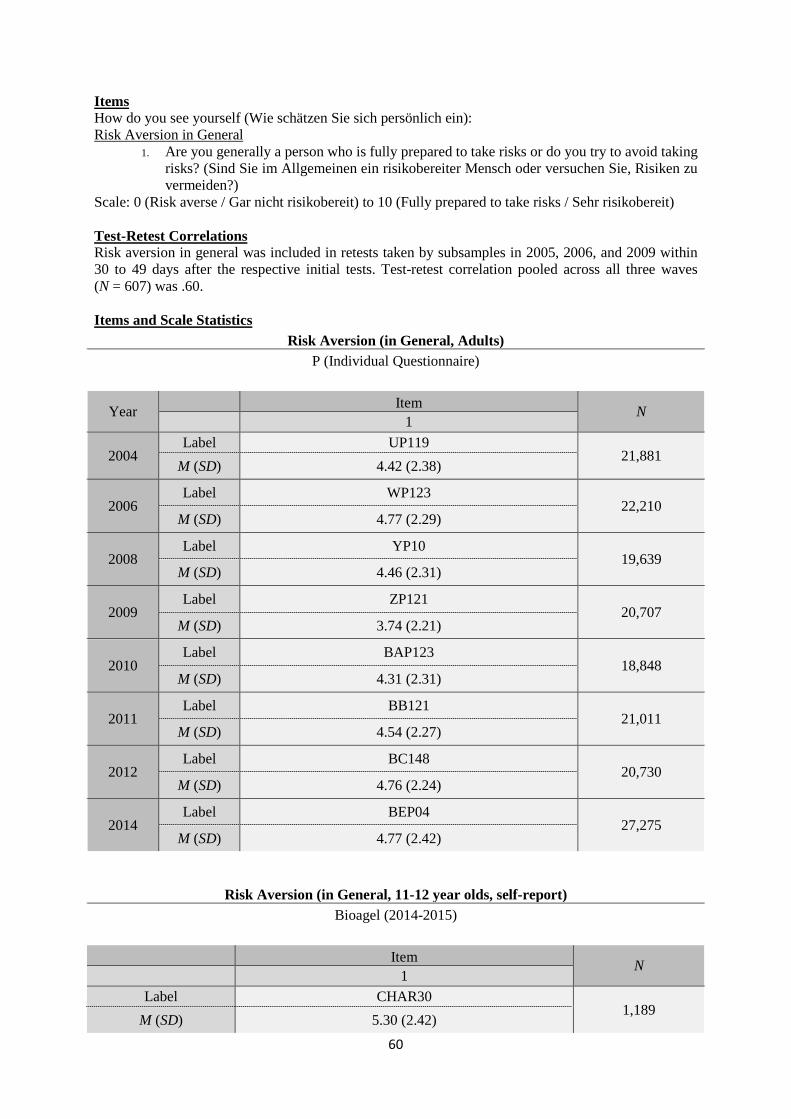
60
Items How do you see yourself (Wie schätzen Sie sich persönlich ein): Risk Aversion in General
1. Are you generally a person who is fully prepared to take risks or do you try to avoid taking risks? (Sind Sie im Allgemeinen ein risikobereiter Mensch oder versuchen Sie, Risiken zu vermeiden?)
Scale: 0 (Risk averse / Gar nicht risikobereit) to 10 (Fully prepared to take risks / Sehr risikobereit) Test-Retest Correlations Risk aversion in general was included in retests taken by subsamples in 2005, 2006, and 2009 within 30 to 49 days after the respective initial tests. Test-retest correlation pooled across all three waves (N = 607) was .60. Items and Scale Statistics
Risk Aversion (in General, Adults) P (Individual Questionnaire)
Year Item N 1
2004 Label UP119
21,881 M (SD) 4.42 (2.38)
2006 Label WP123
22,210 M (SD) 4.77 (2.29)
2008 Label YP10
19,639 M (SD) 4.46 (2.31)
2009 Label ZP121
20,707 M (SD) 3.74 (2.21)
2010 Label BAP123
18,848 M (SD) 4.31 (2.31)
2011 Label BB121
21,011 M (SD) 4.54 (2.27)
2012 Label BC148
20,730 M (SD) 4.76 (2.24)
2014 Label BEP04
27,275 M (SD) 4.77 (2.42)
Risk Aversion (in General, 11-12 year olds, self-report) Bioagel (2014-2015)
Item N 1
Label CHAR30 1,189
M (SD) 5.30 (2.42)
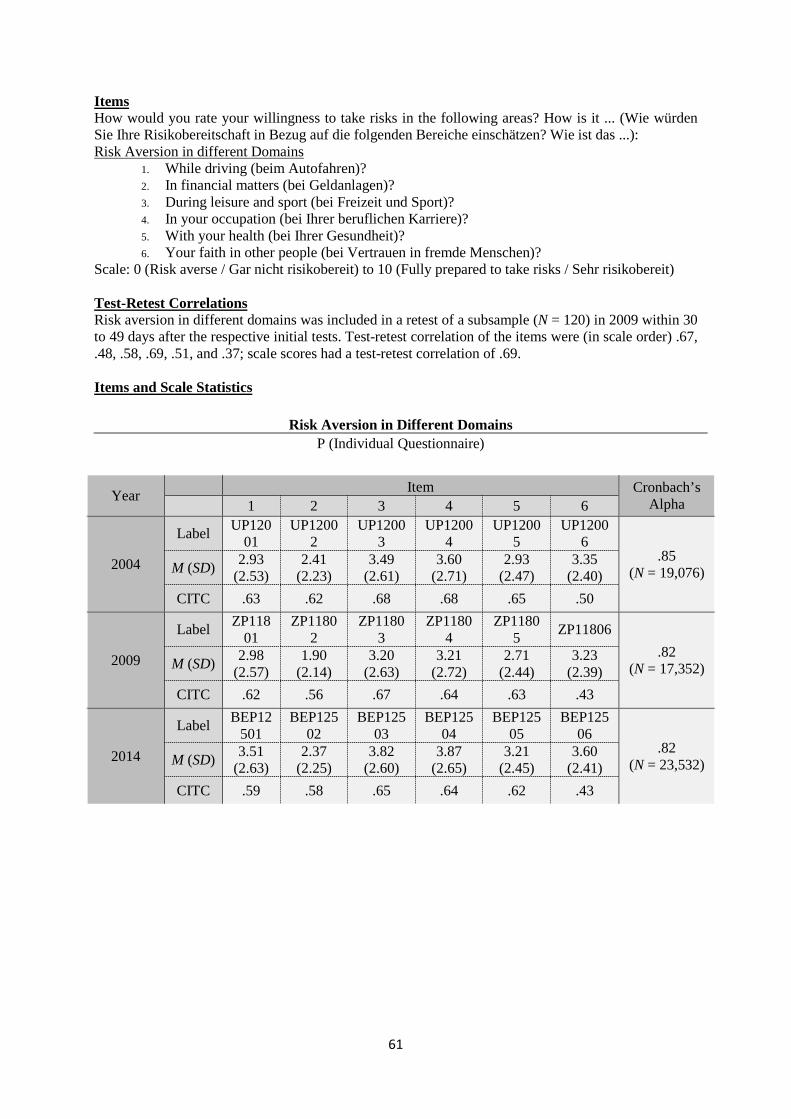
61
Items How would you rate your willingness to take risks in the following areas? How is it ... (Wie würden Sie Ihre Risikobereitschaft in Bezug auf die folgenden Bereiche einschätzen? Wie ist das ...): Risk Aversion in different Domains
1. While driving (beim Autofahren)? 2. In financial matters (bei Geldanlagen)? 3. During leisure and sport (bei Freizeit und Sport)? 4. In your occupation (bei Ihrer beruflichen Karriere)? 5. With your health (bei Ihrer Gesundheit)? 6. Your faith in other people (bei Vertrauen in fremde Menschen)?
Scale: 0 (Risk averse / Gar nicht risikobereit) to 10 (Fully prepared to take risks / Sehr risikobereit) Test-Retest Correlations Risk aversion in different domains was included in a retest of a subsample (N = 120) in 2009 within 30 to 49 days after the respective initial tests. Test-retest correlation of the items were (in scale order) .67, .48, .58, .69, .51, and .37; scale scores had a test-retest correlation of .69. Items and Scale Statistics
Risk Aversion in Different Domains P (Individual Questionnaire)
Year Item Cronbach’s Alpha 1 2 3 4 5 6
2004
Label UP12001
UP12002
UP12003
UP12004
UP12005
UP12006
.85 (N = 19,076) M (SD) 2.93
(2.53) 2.41
(2.23) 3.49
(2.61) 3.60
(2.71) 2.93
(2.47) 3.35
(2.40) CITC .63 .62 .68 .68 .65 .50
2009
Label ZP11801
ZP11802
ZP11803
ZP11804
ZP11805 ZP11806
.82 (N = 17,352) M (SD) 2.98
(2.57) 1.90
(2.14) 3.20
(2.63) 3.21
(2.72) 2.71
(2.44) 3.23
(2.39) CITC .62 .56 .67 .64 .63 .43
2014
Label BEP12501
BEP12502
BEP12503
BEP12504
BEP12505
BEP12506
.82 (N = 23,532) M (SD) 3.51
(2.63) 2.37
(2.25) 3.82
(2.60) 3.87
(2.65) 3.21
(2.45) 3.60
(2.41) CITC .59 .58 .65 .64 .62 .43
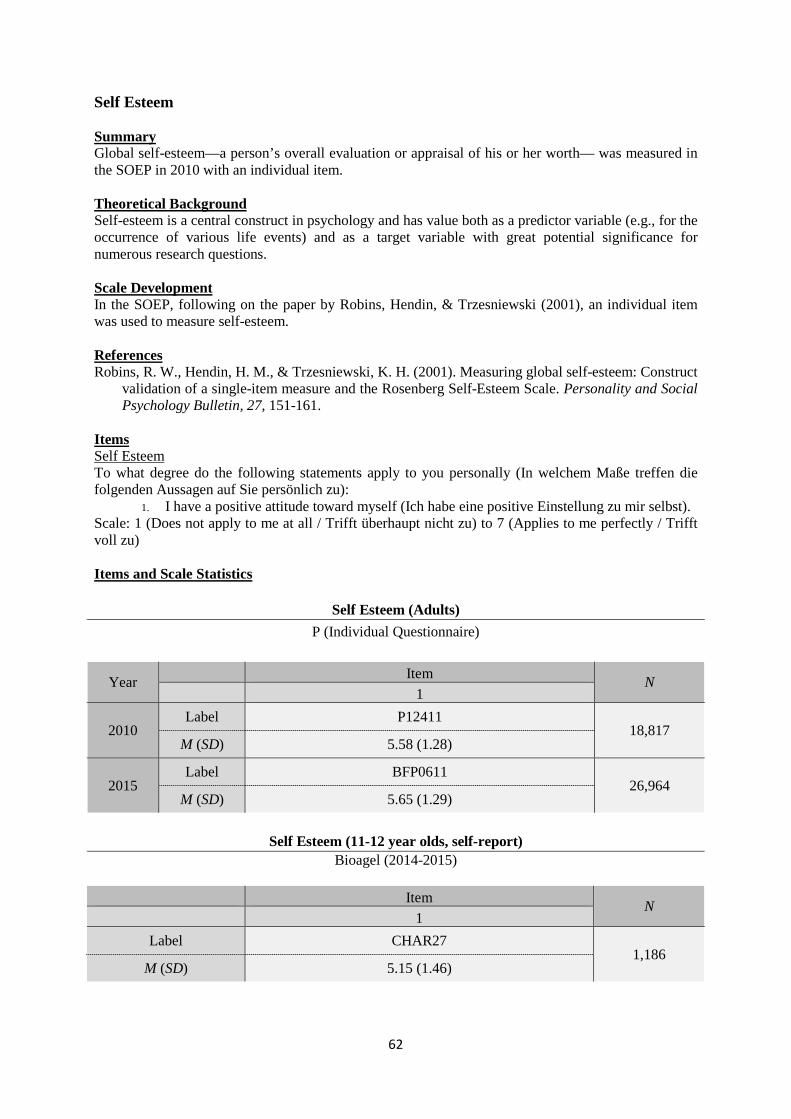
62
Self Esteem Summary Global self-esteem—a person’s overall evaluation or appraisal of his or her worth— was measured in the SOEP in 2010 with an individual item. Theoretical Background Self-esteem is a central construct in psychology and has value both as a predictor variable (e.g., for the occurrence of various life events) and as a target variable with great potential significance for numerous research questions. Scale Development In the SOEP, following on the paper by Robins, Hendin, & Trzesniewski (2001), an individual item was used to measure self-esteem. References Robins, R. W., Hendin, H. M., & Trzesniewski, K. H. (2001). Measuring global self-esteem: Construct
validation of a single-item measure and the Rosenberg Self-Esteem Scale. Personality and Social Psychology Bulletin, 27, 151-161.
Items Self Esteem To what degree do the following statements apply to you personally (In welchem Maße treffen die folgenden Aussagen auf Sie persönlich zu):
1. I have a positive attitude toward myself (Ich habe eine positive Einstellung zu mir selbst). Scale: 1 (Does not apply to me at all / Trifft überhaupt nicht zu) to 7 (Applies to me perfectly / Trifft voll zu) Items and Scale Statistics
Self Esteem (Adults) P (Individual Questionnaire)
Year Item N 1
2010 Label P12411
18,817 M (SD) 5.58 (1.28)
2015 Label BFP0611
26,964 M (SD) 5.65 (1.29)
Self Esteem (11-12 year olds, self-report)
Bioagel (2014-2015)
Item N 1
Label CHAR27 1,186
M (SD) 5.15 (1.46)
63
Sources of Social Inequality Summary The scale measures respondents’ attributions of upward mobility and success in society to the use of legitimate or illegitimate means, whereby the categories of “legitimate” and “illegitimate” are evaluated from the perspective of the prevailing universalistic ideology of meritocratic achievement. The scale has been used in the SOEP youth questionnaire since 2001. Theoretical Background The scale measures a non-normative aspect: namely, beliefs about the extent to which success can be achieved by specific means. Theoretically, the scale is implicitly oriented toward measuring respondents’ perceptions of legitimacy or their critique of the social status assignment process. The legitimization of existing social inequality is necessary for the functioning of a society, independent of the form that this legitimation takes. In German society, as in most Western societies, social inequalities are legitimized meritocratically, that is, inequalities are considered justified if they are based on non-ascriptive characteristics such as individual abilities and achievements, as expressed, for example, in educational degrees. To this end, it must be determined, first, whether the individual supports the normative basis for this meritocratic ideology, and second, to what extent the respondent views these normative standards as being realized in the society. The second, cognitive aspect is measured with the items described below. Both aspects together allow for an estimation of whether the inequality that exists in a society is perceived as legitimate or as worthy of criticism. Scale Development For the SOEP surveys, 11 items from the original scale by Sandberger (1983) were selected. Item 11 (having the right gender) was added later. References Sandberger, J.-U. (1983). Zwischen Legitimation und Kritik. Vorstellungen von Akademikern,
Studenten und Bevölkerung zur sozialen Ungleichheit. Zeitschrift für Soziologie, 12, 181-202. Items In your opinion, what are the most important factors for achieving success and improving one’s social situation in Germany (Wovon hängt es Ihrer Meinung nach in Deutschland tatsächlich ab, ob jemand Erfolg hat und sozial aufsteigt): Legitimate instruments (Legitime Mittel)
1. Working hard (Man muss sich anstrengen und fleißig sein) 2. Being gifted and intelligent (Man muss begabt und intelligent sein) 3. Having good training in a specialized field (Man muss gute Fachkenntnisse auf seinem
Spezialgebiet haben) 4. Having good grades at school (Man muss einen möglichst guten Schulabschluss haben) 5. Being dynamic and exhibiting initiative (Man muss dynamisch sein und Initiative haben)
Scale: 1 (I agree completely/Stimme voll zu) to 4 (I don’t agree at all/Stimme überhaupt nicht zu) Illegitimate instruments (Illegitime Mittel)
1. Exploiting others (Man muss andere ausnutzen) 2. Being from the right family (Man muss aus der richtigen Familie stammen) 3. Having a lot of money and assets (Man muss Geld und Vermögen haben) 4. Being tough and ruthless (Man muss rücksichtslos und hart sein) 5. Having connections to the right people (Man muss Beziehungen zu den richtigen Leuten
haben) 6. Being politically active in the right party (Man muss sich auf der richtigen Seite politische
engagieren) 7. Having the right gender; men have better career opportunities (Man muss das richtige
Geschlecht haben; Männer haben bessere Aufstiegschancen) Scale: 1 (I agree completely / Stimme voll zu) to 4 (I don’t agree at all / Stimme überhaupt nicht zu)
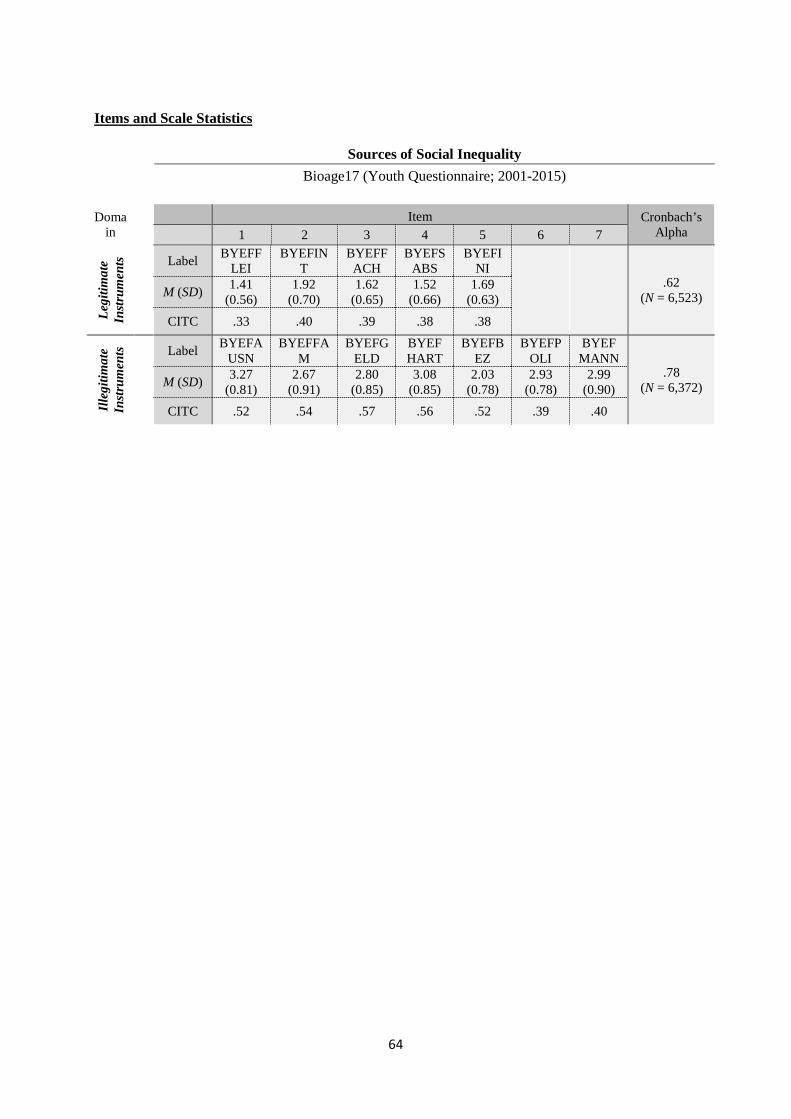
64
Items and Scale Statistics
Sources of Social Inequality Bioage17 (Youth Questionnaire; 2001-2015)
Domain
Item Cronbach’s Alpha 1 2 3 4 5 6 7
Legi
timat
e In
stru
men
ts Label BYEFF
LEI BYEFIN
T BYEFFACH
BYEFSABS
BYEFINI
.62 (N = 6,523)
M (SD) 1.41 (0.56)
1.92 (0.70)
1.62 (0.65)
1.52 (0.66)
1.69 (0.63)
CITC .33 .40 .39 .38 .38
Illeg
itim
ate
Inst
rum
ents
Label BYEFAUSN
BYEFFAM
BYEFGELD
BYEFHART
BYEFBEZ
BYEFPOLI
BYEFMANN
.78 (N = 6,372)
M (SD) 3.27 (0.81)
2.67 (0.91)
2.80 (0.85)
3.08 (0.85)
2.03 (0.78)
2.93 (0.78)
2.99 (0.90)
CITC .52 .54 .57 .56 .52 .39 .40
65
Strengths and Difficulties Questionnaire (SDQ) Summary The Strengths and Difficulties Questionnaire (SDQ; Goodman 1997; German version by Woerner et al. 2002) captures the child’s behavior on five scales “hyperactivity,” “emotional problems,” “prosocial behavior,” “conduct problems,” and “peer problems.” The Strengths and Difficulties Questionnaire has been given to parents of children aged 5-6 years since 2008 and to parents of children aged 9-10 years since 2012. Since 2014, children aged 11-12 years fill in the questionnaire themselves. Theoretical Background The SDQ is currently one of the most frequently used screening instruments for child and adolescent mental health throughout the world. The instrument includes four problem subscales of five items each that also yield a total difficulties score, in addition to a prosocial dimension. Scale Development The scale was shortened for the SOEP to 17 items for the bioage06 questionnaire and to 18 items for the bioage10 questionnaire. The answer format was modified to seven levels. For the 11-12 year olds, the full version of the SDQ with an answer format of three levels was used. References Goodman, R. (1997). The Strengths and Difficulties Questionnaire: A research note. Journal of Child
Psychology and Psychiatry, 38, 581-586. Woerner, W., Becker, A., Friedrich, C., Klasen, H., Goodman, R. & Rothenberger, A. (2002).
Normierung und Evaluation der deutschen Elternversion des Strengths and Difficulties Questionnaire (SDQ): Ergebnisse einer repräsentativen Felderhebung. Zeitschrift für Kinder- und Jugendpsychiatrie und Psychotherapie, 30, 105-112.
Strengths and Difficulties Questionnaire (5-6 year olds & 9-10 year olds, parent reports) Items To what extent do the following statements apply to your child (Inwieweit treffen folgende Aussagen auf ihr Kind zu): Hyperactivity
1. Child is agitated, hyperactive, cannot sit still (ist unruhig, überaktiv, kann nicht lange stillsitzen)
2. Child is fidgety (ist ständig zappelig) 3. Child is easily distracted and lacks concentration (ist leicht ablenkbar, unkonzentriert) 4. Child finishes tasks, is able to concentrate (führt Aufgaben zu Ende; kann sich lange
konzentrieren) 5. Child thinks before acting (Denkt nach bevor es handelt)
Scale: 1 (Does not apply at all / Trifft überhaupt nicht zu) to 7 (Applies completely / Trifft voll zu) Emotional Problems
1. Child is often unhappy or dejected (unglücklich, niedergeschlagen) 2. Child is nervous or clingy in new situations, loses self-confidence easily (ist nervös oder
anklammernd in neuen Situationen; verliert leicht das Selbstvertrauen) 3. Child has many fears, becomes frightened easily (hat viele Ängste; fürchtet sich leicht)
Scale: 1 (Does not apply at all/Trifft überhaupt nicht zu) to 7 (Applies completely /Trifft voll zu) Prosocial Behavior
1. Child is considerate (ist rücksichtsvoll) 2. Child likes to share with others (sweets, toys, crayons) (teilt gerne mit anderen Kindern
(Süßigkeiten, Spielzeug, Buntstifte usw.)) 3. Child is helpful if others are hurt, sick, or sad (ist hilfsbereit, wenn andere verletzt, krank
oder betrübt sind) 4. Child helps others of his/her own accord (parents, teachers, other children) (hilft anderen
oft freiwillig (Eltern, Erziehern, anderen Kindern)) Scale: 1 (Does not apply at all / Trifft überhaupt nicht zu) to 7 (Applies completely / Trifft voll zu)
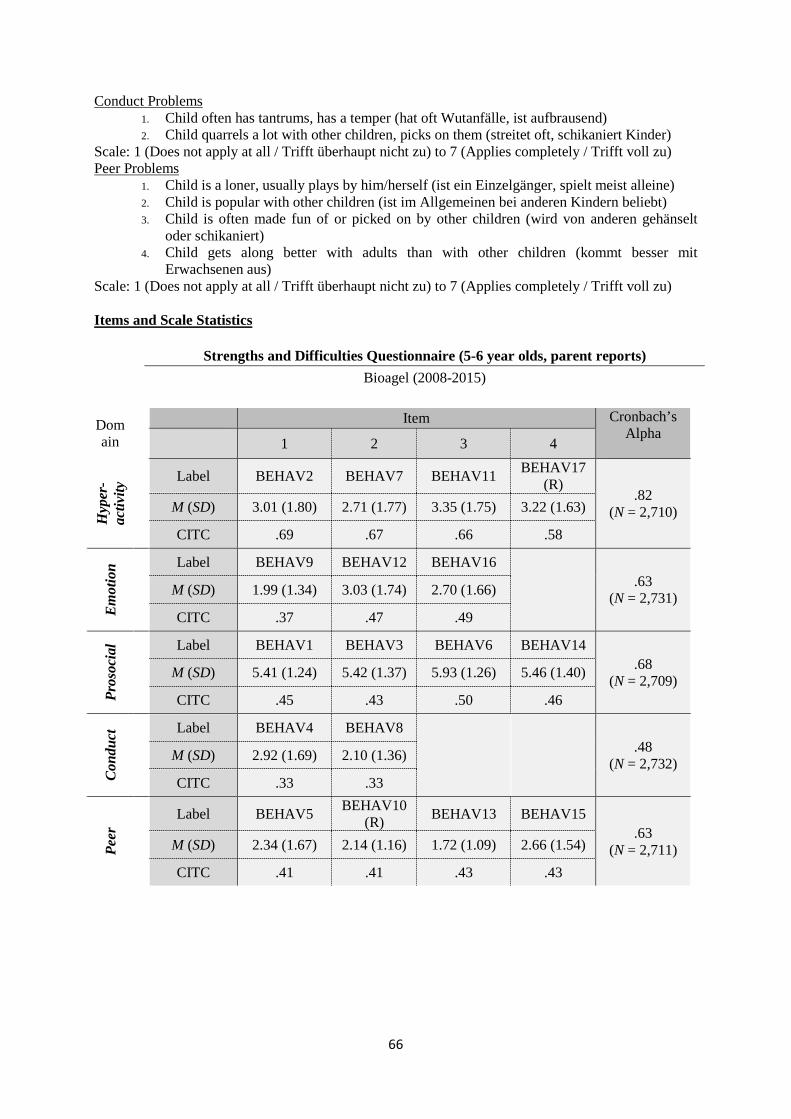
66
Conduct Problems 1. Child often has tantrums, has a temper (hat oft Wutanfälle, ist aufbrausend) 2. Child quarrels a lot with other children, picks on them (streitet oft, schikaniert Kinder)
Scale: 1 (Does not apply at all / Trifft überhaupt nicht zu) to 7 (Applies completely / Trifft voll zu) Peer Problems
1. Child is a loner, usually plays by him/herself (ist ein Einzelgänger, spielt meist alleine) 2. Child is popular with other children (ist im Allgemeinen bei anderen Kindern beliebt) 3. Child is often made fun of or picked on by other children (wird von anderen gehänselt
oder schikaniert) 4. Child gets along better with adults than with other children (kommt besser mit
Erwachsenen aus) Scale: 1 (Does not apply at all / Trifft überhaupt nicht zu) to 7 (Applies completely / Trifft voll zu) Items and Scale Statistics
Strengths and Difficulties Questionnaire (5-6 year olds, parent reports) Bioagel (2008-2015)
Dom ain
Item Cronbach’s Alpha
1 2 3 4
Hyp
er-
activ
ity
Label BEHAV2 BEHAV7 BEHAV11 BEHAV17 (R)
.82 (N = 2,710)
M (SD) 3.01 (1.80) 2.71 (1.77) 3.35 (1.75) 3.22 (1.63) CITC .69 .67 .66 .58
Em
otio
n
Label BEHAV9 BEHAV12 BEHAV16
.63 (N = 2,731)
M (SD) 1.99 (1.34) 3.03 (1.74) 2.70 (1.66) CITC .37 .47 .49
Pros
ocia
l Label BEHAV1 BEHAV3 BEHAV6 BEHAV14 .68
(N = 2,709) M (SD) 5.41 (1.24) 5.42 (1.37) 5.93 (1.26) 5.46 (1.40) CITC .45 .43 .50 .46
Con
duct
Label BEHAV4 BEHAV8
.48 (N = 2,732)
M (SD) 2.92 (1.69) 2.10 (1.36) CITC .33 .33
Peer
Label BEHAV5 BEHAV10 (R) BEHAV13 BEHAV15
.63 (N = 2,711)
M (SD) 2.34 (1.67) 2.14 (1.16) 1.72 (1.09) 2.66 (1.54) CITC .41 .41 .43 .43
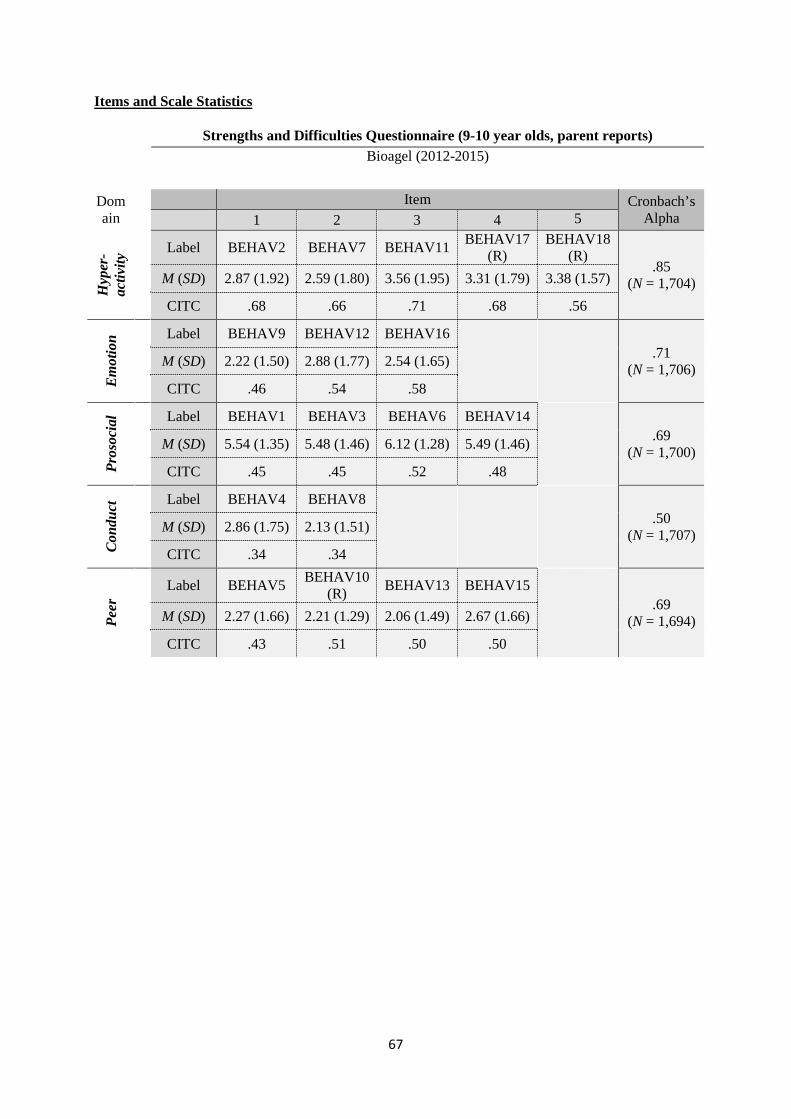
67
Items and Scale Statistics
Strengths and Difficulties Questionnaire (9-10 year olds, parent reports) Bioagel (2012-2015)
Domain
Item Cronbach’s Alpha 1 2 3 4 5
Hyp
er-
activ
ity
Label BEHAV2 BEHAV7 BEHAV11 BEHAV17 (R)
BEHAV18 (R)
.85 (N = 1,704)
M (SD) 2.87 (1.92) 2.59 (1.80) 3.56 (1.95) 3.31 (1.79) 3.38 (1.57) CITC .68 .66 .71 .68 .56
Em
otio
n
Label BEHAV9 BEHAV12 BEHAV16
.71 (N = 1,706)
M (SD) 2.22 (1.50) 2.88 (1.77) 2.54 (1.65) CITC .46 .54 .58
Pros
ocia
l Label BEHAV1 BEHAV3 BEHAV6 BEHAV14
.69 (N = 1,700)
M (SD) 5.54 (1.35) 5.48 (1.46) 6.12 (1.28) 5.49 (1.46) CITC .45 .45 .52 .48
Con
duct
Label BEHAV4 BEHAV8
.50 (N = 1,707)
M (SD) 2.86 (1.75) 2.13 (1.51) CITC .34 .34
Peer
Label BEHAV5 BEHAV10 (R) BEHAV13 BEHAV15
.69 (N = 1,694)
M (SD) 2.27 (1.66) 2.21 (1.29) 2.06 (1.49) 2.67 (1.66) CITC .43 .51 .50 .50
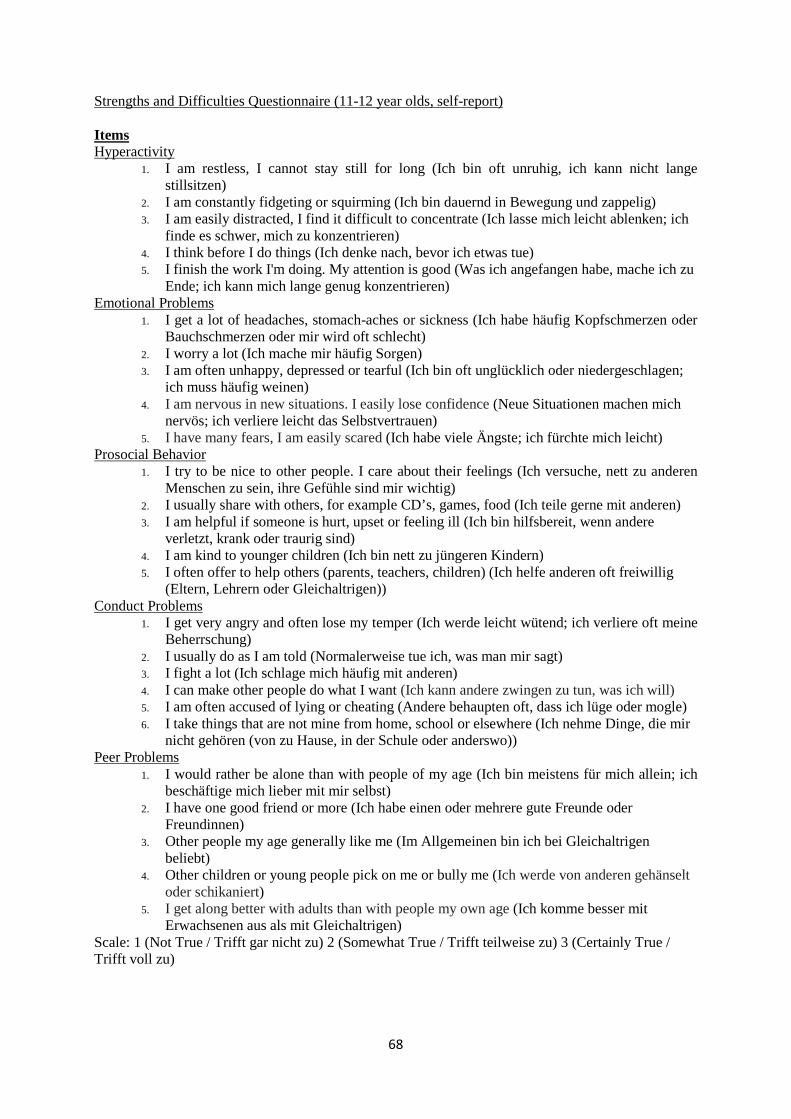
68
Strengths and Difficulties Questionnaire (11-12 year olds, self-report) Items Hyperactivity
1. I am restless, I cannot stay still for long (Ich bin oft unruhig, ich kann nicht lange stillsitzen)
2. I am constantly fidgeting or squirming (Ich bin dauernd in Bewegung und zappelig) 3. I am easily distracted, I find it difficult to concentrate (Ich lasse mich leicht ablenken; ich
finde es schwer, mich zu konzentrieren) 4. I think before I do things (Ich denke nach, bevor ich etwas tue) 5. I finish the work I'm doing. My attention is good (Was ich angefangen habe, mache ich zu
Ende; ich kann mich lange genug konzentrieren) Emotional Problems
1. I get a lot of headaches, stomach-aches or sickness (Ich habe häufig Kopfschmerzen oder Bauchschmerzen oder mir wird oft schlecht)
2. I worry a lot (Ich mache mir häufig Sorgen) 3. I am often unhappy, depressed or tearful (Ich bin oft unglücklich oder niedergeschlagen;
ich muss häufig weinen) 4. I am nervous in new situations. I easily lose confidence (Neue Situationen machen mich
nervös; ich verliere leicht das Selbstvertrauen) 5. I have many fears, I am easily scared (Ich habe viele Ängste; ich fürchte mich leicht)
Prosocial Behavior 1. I try to be nice to other people. I care about their feelings (Ich versuche, nett zu anderen
Menschen zu sein, ihre Gefühle sind mir wichtig) 2. I usually share with others, for example CD’s, games, food (Ich teile gerne mit anderen) 3. I am helpful if someone is hurt, upset or feeling ill (Ich bin hilfsbereit, wenn andere
verletzt, krank oder traurig sind) 4. I am kind to younger children (Ich bin nett zu jüngeren Kindern) 5. I often offer to help others (parents, teachers, children) (Ich helfe anderen oft freiwillig
(Eltern, Lehrern oder Gleichaltrigen)) Conduct Problems
1. I get very angry and often lose my temper (Ich werde leicht wütend; ich verliere oft meine Beherrschung)
2. I usually do as I am told (Normalerweise tue ich, was man mir sagt) 3. I fight a lot (Ich schlage mich häufig mit anderen) 4. I can make other people do what I want (Ich kann andere zwingen zu tun, was ich will) 5. I am often accused of lying or cheating (Andere behaupten oft, dass ich lüge oder mogle) 6. I take things that are not mine from home, school or elsewhere (Ich nehme Dinge, die mir
nicht gehören (von zu Hause, in der Schule oder anderswo)) Peer Problems
1. I would rather be alone than with people of my age (Ich bin meistens für mich allein; ich beschäftige mich lieber mit mir selbst)
2. I have one good friend or more (Ich habe einen oder mehrere gute Freunde oder Freundinnen)
3. Other people my age generally like me (Im Allgemeinen bin ich bei Gleichaltrigen beliebt)
4. Other children or young people pick on me or bully me (Ich werde von anderen gehänselt oder schikaniert)
5. I get along better with adults than with people my own age (Ich komme besser mit Erwachsenen aus als mit Gleichaltrigen)
Scale: 1 (Not True / Trifft gar nicht zu) 2 (Somewhat True / Trifft teilweise zu) 3 (Certainly True / Trifft voll zu)
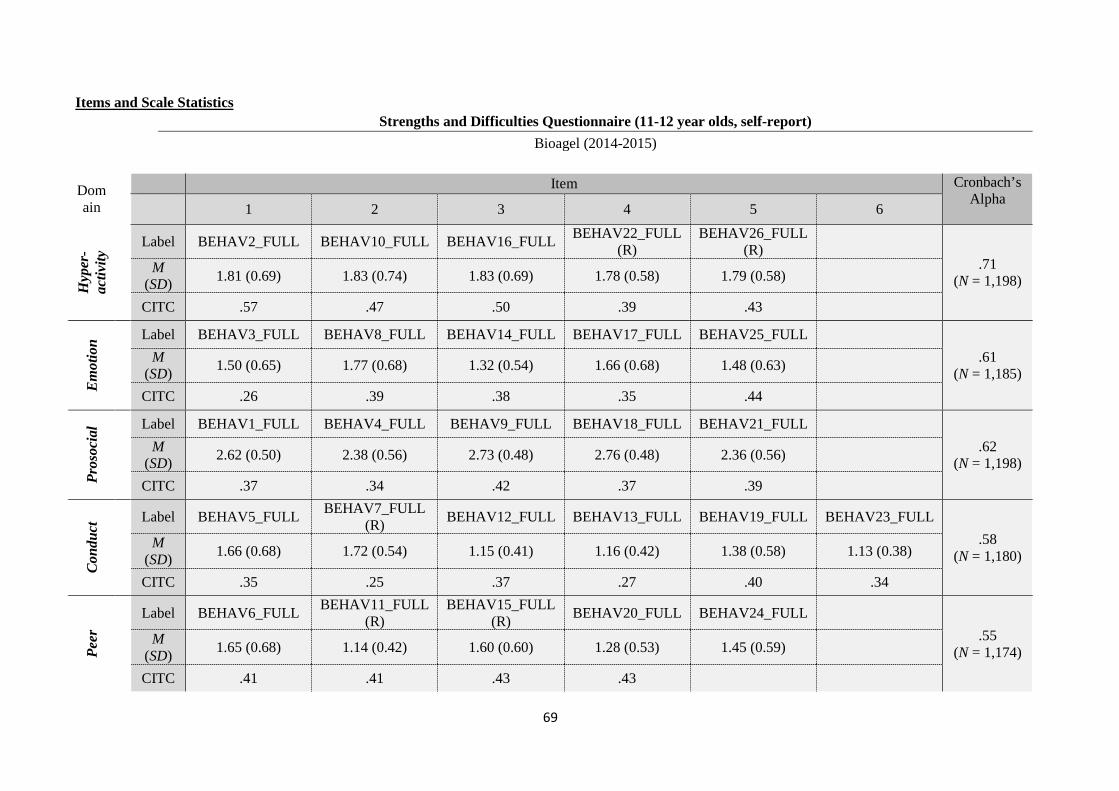
69
Items and Scale Statistics Strengths and Difficulties Questionnaire (11-12 year olds, self-report) Bioagel (2014-2015)
Dom ain
Item Cronbach’s Alpha
1 2 3 4 5 6
Hyp
er-
activ
ity
Label BEHAV2_FULL BEHAV10_FULL BEHAV16_FULL BEHAV22_FULL (R)
BEHAV26_FULL (R)
.71 (N = 1,198)
M (SD) 1.81 (0.69) 1.83 (0.74) 1.83 (0.69) 1.78 (0.58) 1.79 (0.58)
CITC .57 .47 .50 .39 .43
Em
otio
n
Label BEHAV3_FULL BEHAV8_FULL BEHAV14_FULL BEHAV17_FULL BEHAV25_FULL .61
(N = 1,185) M
(SD) 1.50 (0.65) 1.77 (0.68) 1.32 (0.54) 1.66 (0.68) 1.48 (0.63)
CITC .26 .39 .38 .35 .44
Pros
ocia
l Label BEHAV1_FULL BEHAV4_FULL BEHAV9_FULL BEHAV18_FULL BEHAV21_FULL .62
(N = 1,198) M
(SD) 2.62 (0.50) 2.38 (0.56) 2.73 (0.48) 2.76 (0.48) 2.36 (0.56)
CITC .37 .34 .42 .37 .39
Con
duct
Label BEHAV5_FULL BEHAV7_FULL (R) BEHAV12_FULL BEHAV13_FULL BEHAV19_FULL BEHAV23_FULL
.58 (N = 1,180)
M (SD) 1.66 (0.68) 1.72 (0.54) 1.15 (0.41) 1.16 (0.42) 1.38 (0.58) 1.13 (0.38)
CITC .35 .25 .37 .27 .40 .34
Peer
Label BEHAV6_FULL BEHAV11_FULL (R)
BEHAV15_FULL (R) BEHAV20_FULL BEHAV24_FULL
.55 (N = 1,174)
M (SD) 1.65 (0.68) 1.14 (0.42) 1.60 (0.60) 1.28 (0.53) 1.45 (0.59)
CITC .41 .41 .43 .43
70
Supportive Parenting
Summary Supportive parenting describes a style of childrearing based on warmth, love, constructive communication, and a generally positive way of interacting in the parent-child relationship. The scale has been used in the SOEP youth questionnaires since 2001. Theoretical Background Parenting is not understood here as a series of techniques and abilities, but as a special form of relationship between parents and children. The concept is based on the idea that efforts by parents to create a supportive, wholesome environment have a positive impact on the cognitive and social development of the children. A supportive parenting style is part of such a supportive environment (Simons et al., 1992) and can be described as follows: Supportive parents express interest in children’s activities, talk to or play games with them, provide help with everyday problems and schoolwork, express enthusiasm and praise over accomplishments, and show affection and love (Amato, 1990). Scale Development The scale is based on the Supportive Parenting Scale (SPS) of Simons et al. (1992), and this version was translated into German by Schwarz et al. (1997). References Amato, Paul R. 1990. Dimensions of the family environment as perceived by children: A
multidimensional scaling analysis. Journal of marriage and family, 52, 613_620. Schwarz, B., Walper, S., Gödde, M., & Jurasic, S. (1997). Dokumentation der Erhebungsinstrumente
der 1. Hauptbefragung. Berichte aus der Arbeitsgruppe “Familienentwicklung nach der Trennung.” University of Munich: Unpublished manuscript.
Simons, R. L., Lorenz, F. O., Conger, R. D., & Wu, C.-I. (1992). Support from spouse as mediator and moderator of the disruptive influence of economic strain on parenting. Child Development, 63, 1282-1301.
Items How often do the following situations occur with your mother and father? How often… (Wie häufig treten in Ihrer Beziehung zu Ihren Eltern die folgenden Situationen auf? Wie häufig kommt es vor...):
1. Do your parents talk to you about things you do or experience (dass Ihre Eltern mit Ihnen über Dinge sprechen, die Sie tun oder erlebt haben)?
2. Do your parents bring up things that bother or worry you (dass Ihre Eltern Dinge ansprechen, die Sie ärgern oder belasten)?
3. Do your parents ask you for your opinion before they decide something that affects you (dass Ihre Eltern nach Ihrer Meinung fragen, bevor sie etwas entscheiden, das Sie betrifft)?
4. Do your parents express their opinion when you do something that they like or approve of (dass, wenn Sie etwas tun, was Ihre Eltern gut finden, Ihre Eltern Ihnen auch zeigen, dass sie sich darüber freuen)?
5. Are you and your parents able to find a solution together to problems you have with each other (dass, wenn Sie und Ihre Eltern ein Problem miteinander haben, Sie dann gemeinsam eine Lösung finden können)?
6. Do your parents give you the impression that they really trust you (dass ihre Eltern Ihnen das Gefühl geben, dass sie Ihnen wirklich vertrauen)?
7. Do your parents ask for your opinion before they make decisions on family matters or issues (dass Ihre Eltern nach Ihrer Meinung fragen, bevor sie über Familienangelegenheiten entscheiden)?
8. Do your parents give you an explanation for their decisions (dass Ihre Eltern Ihnen gegenüber Entscheidungen begründen)?
9. Do your parents show you that they really love you (dass Ihre Eltern Ihnen zeigen, dass sie Sie wirklich lieben)?
Scale: 1 (Very often / Sehr häufig ) to 5 (Never / Nie)
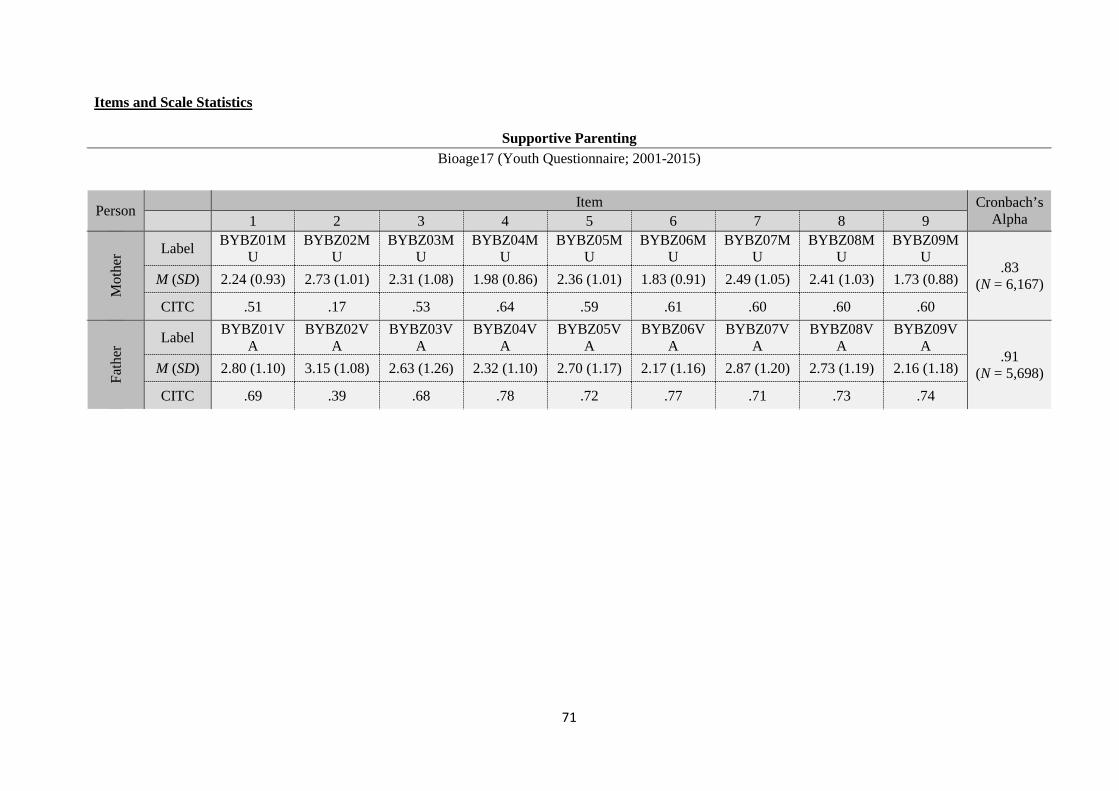
71
Items and Scale Statistics
Supportive Parenting Bioage17 (Youth Questionnaire; 2001-2015)
Person Item Cronbach’s Alpha 1 2 3 4 5 6 7 8 9
Mot
her Label BYBZ01M
U BYBZ02M
U BYBZ03M
U BYBZ04M
U BYBZ05M
U BYBZ06M
U BYBZ07M
U BYBZ08M
U BYBZ09M
U .83
(N = 6,167) M (SD) 2.24 (0.93) 2.73 (1.01) 2.31 (1.08) 1.98 (0.86) 2.36 (1.01) 1.83 (0.91) 2.49 (1.05) 2.41 (1.03) 1.73 (0.88)
CITC .51 .17 .53 .64 .59 .61 .60 .60 .60
Fath
er Label BYBZ01V
A BYBZ02V
A BYBZ03V
A BYBZ04V
A BYBZ05V
A BYBZ06V
A BYBZ07V
A BYBZ08V
A BYBZ09V
A .91
(N = 5,698) M (SD) 2.80 (1.10) 3.15 (1.08) 2.63 (1.26) 2.32 (1.10) 2.70 (1.17) 2.17 (1.16) 2.87 (1.20) 2.73 (1.19) 2.16 (1.18)
CITC .69 .39 .68 .78 .72 .77 .71 .73 .74
72
Temperament Summary In the SOEP since 2003, two dimensions of temperament in early childhood, “affect” and “activity,” have been measured with five items assessed by one of the parents for children below the age of 2 and for those aged 2-3. Theoretical Background Temperament describes the way a person acts and reacts and is comprised of emotions, motor, attention-related reactions, and self-regulation. The concept of the “early childhood temperament” is used in developmental psychopathology and in the research and theory on child and youth psychiatry. Temperament characteristics are treated here as risk factors for the emergence of behavioral disorders, as characteristics influencing parental interactive behavior, and as characteristics that show heightened vulnerability to unfavorable environmental conditions. Scale Development Based on an expert report by Pauen & Vonderlin (2007), the Infant Behavior Questionnaire (IBQ) of Rothbart (1981; German version by Pauli-Pott, Mertesacker, & Beckmann, 2003) was used as a point of orientation for the measurement of early child temperament, but shortened significantly. References Pauen, S., & Vonderlin, E. (2007). Entwicklungsdiagnostik in den ersten drei Lebensjahren
Empfehlungen zum Ausbau des Erhebungsinstrumentariums über Kinder im Sozio-oekonomischen Panel (SOEP). Berlin: DIW Berlin.
Pauli-Pott, U., Mertesacker, B., & Beckmann, D. (2003). Ein Fragebogen zur Erfassung des frühkindlichen Temperaments im Elternurteil. Zeitschrift für Kinder- und Jugendpsychiatrie und Psychotherapie, 31, 99-110.
Rothbart, M. K. (1981). Measurement of temperament in infancy. Child Development, 52, 569-578. Items How do you see your child today (Wie sehen Sie Ihr Kind heute): Affect
1. My child is generally happy and satisfied (Mein Kind ist meist fröhlich und zufrieden) 2. My child is easily irritated and cries frequently (Mein Kind ist leicht erregbar und weint
häufig) 3. My child is difficult to console (Mein Kind ist schwer zu trösten)
Scale: 1 (Applies fully / Trifft voll zu) to 4 (Does not apply at all / Trifft gar nicht zu) Activity
1. My child is curious and active (Mein Kind ist neugierig und aktiv) 2. (since 2007) My child is more reserved (Mein Kind ist eher zurückhaltend) 3. My child is communicative and likes to talk (Mein Kind ist gesprächig und redet gern)
Scale: 1 (Applies fully / Trifft voll zu) to 4 (Does not apply at all / Trifft gar nicht zu)
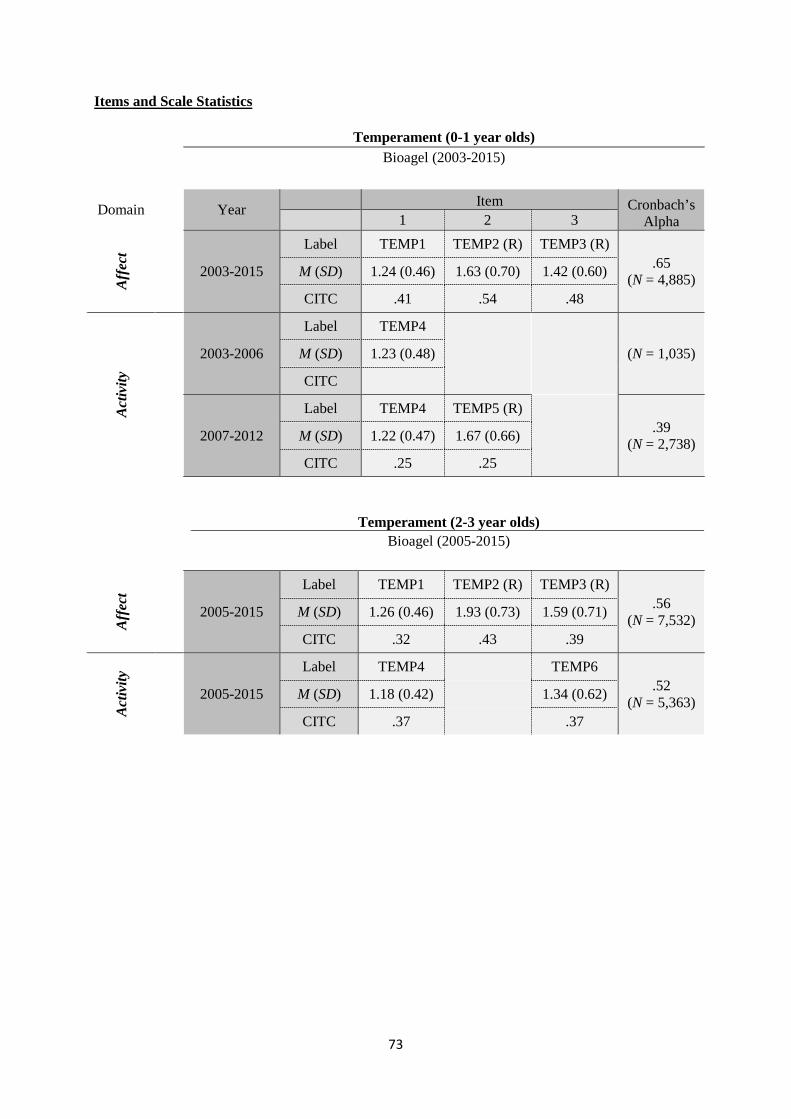
73
Items and Scale Statistics
Temperament (0-1 year olds) Bioagel (2003-2015)
Domain
Year Item Cronbach’s Alpha 1 2 3
Aff
ect
2003-2015
Label TEMP1 TEMP2 (R) TEMP3 (R) .65
(N = 4,885) M (SD) 1.24 (0.46) 1.63 (0.70) 1.42 (0.60) CITC .41 .54 .48
Act
ivity
2003-2006
Label TEMP4
(N = 1,035) M (SD) 1.23 (0.48) CITC
2007-2012
Label TEMP4 TEMP5 (R)
.39 (N = 2,738)
M (SD) 1.22 (0.47) 1.67 (0.66) CITC .25 .25
Temperament (2-3 year olds) Bioagel (2005-2015)
Aff
ect
2005-2015
Label TEMP1 TEMP2 (R) TEMP3 (R) .56
(N = 7,532) M (SD) 1.26 (0.46) 1.93 (0.73) 1.59 (0.71) CITC .32 .43 .39
Act
ivity
2005-2015
Label TEMP4 TEMP6 .52
(N = 5,363) M (SD) 1.18 (0.42) 1.34 (0.62) CITC .37 .37
74
Tendency to Forgive Summary The tendency to forgive is an individual disposition to forgive other people after being hurt or treated unjustly by them and was measured in SOEP in 2010. Theoretical Background The individual tendency to forgive is the tendency to either maintain or overcome one’s own anger or resentment after being personally injured: “the TTF is a simple, four-item scale designed to assess the extent to which individuals typically experience or engage in forgiveness when they have been wronged by others” (Brown, 2003). The scale is not designed to measure the process of forgiving (how or when one forgives), but to measure individual differences in the outcome of this process (to what extent an individual typically forgives). The tendency to forgive is understood as an individual disposition and not as a process linked to specific situations or actions. As a construct, the tendency to forgive shows similarities to other constructs such as revenge, feelings of aggression, desire for reconciliation, and negative reciprocity. For the research, it is of interest to study the consequences the individual tendency to forgive on mental health and life satisfaction. Furthermore, the individual tendency to forgive may play a role as a strategy in decision conflicts and dilemma situations. Scale Development The scale is the German translation of the already validated Tendency to Forgive Scale. Information on the validity of the original scale can be found in Brown and Phillips (2005). The scale was used for the first time in the SOEP in the 2009 SOEP pretest (representative random sample of the German population, N = 1.007) and displays, given the typical characteristics of population surveys (low number of items, high heterogeneity of survey respondents), satisfactory reliability and factorial validity (Weinhardt & Schupp, 2011). Based on the satisfactory results of the 2009 SOEP pretest, the Tendency to Forgive scale was included in the main SOEP survey in 2010. References Brown, R., & Phillips, A. (2005). Letting bygones be bygones: Further evidence for the validity of the
tendency to forgive scale. Personality and Individual Differences, 38, 627-638. Brown, R. P. (2003). Measuring individual differences in the tendency to forgive: Construct validity
and links with depression. Personality and Social Psychology Bulletin, 29, 759-771. Weinhardt, M., & Schupp, J. (2011). Die Messung individueller Vergebungstendenz im SOEP:
Skaleneigenschaften der deutschen Version der Tendency-to-Forgive-Scale. Berlin: DIW Berlin. Items To what degree do the following statements apply to you personally (In welchem Maße treffen die folgenden Aussagen auf Sie persönlich zu):
1. I get over it relatively quickly when someone hurts my feelings (Ich komme relativ leicht darüber hinweg, wenn jemand mich emotional verletzt).
2. When somebody has wronged me, I often think about it for quite a while (R) (Wenn jemand mir unrecht getan hat, denke ich oft lange darüber nach).
3. I tend to bear grudges (R) (Ich bin tendenziell nachtragend). 4. When other people wrong me I try to just forgive and forget (Wenn andere mir unrecht
tun, versuche ich einfach zu vergeben und zu vergessen). Scale: 1 (Does not apply to me at all / Trifft überhaupt nicht zu) to 7 (Applies to me perfectly / Trifft voll zu)

75
Items and Scale Statistics
Tendency to Forgive P (Individual Questionnaire)
Year Item Cronbach’s
Alpha 1 2 3 4
2010
Label BAP12407 BAP12408 (R)
BAP12409 (R) BAP12410
.57 (N = 18,706) M (SD) 3.62 (1.63) 3.26 (1.68) 4.79 (1.67) 4.16 (1.54)
CITC .34 .33 .39 .35
2015
Label BFP0607 BFP0608 (R)
BFP0609 (R) BFP0610
.57 (N = 26,749) M (SD) 3.59 (1.68) 3.29 (1.75) 4.81 (1.74) 4.27 (1.58)
CITC .33 .34 .40 .33
76
Trust, Trustworthiness, Fairness Summary Trust, trustworthiness, and fairness were measured in the SOEP in 2003, 2008, and 2013, using five items. Three of the items can be combined into a single scale for measuring generalized trust. Theoretical Background In sociology and political science, generalized trust describes the average expectation of trustworthiness in strangers (Stolle, 2002). Trust is interpreted as a measure of cooperative relationships among citizens that allows people to interact in a complex social environment and to reduce their transaction costs (Luhmann, 2000). For sociologist James Coleman, two points are characteristic for the concept of trust: on the one hand, trust means that the person trusting entrusts specific goods to another person without being able to directly control or sanction the actions of the other person. On the other hand, there must be a potential benefit as an incentive: the person must gain some advantage from having trusted another person if the latter proves to be trustworthy. In this conception, trust is less a personality characteristic than a specific behavior. Generalized trust (trust in strangers) also differs from trust in institutions and from trust in acquaintances. In social psychology, the concept is also important: “Interpersonal trust is defined here as an expectancy held by an individual or a group that the word, promise, verbal or written statement of another individual or group can be relied upon” (Rotter, 1967). Scale Development The scale used to measure trust was based on the scales used in the General Social Survey (GSS) and in the World Values Survey (WVS), and an additional (Item 2) was added. The scale was first piloted in the 2002 SOEP pretest and used in 2003 in the main SOEP survey. The scale was further validated in the 2003, 2004, 2005, and 2006 SOEP pretests (through parallel surveying of the personality dimension “agreeableness: trust” from the NEO-PI-R and testing of sequence effects; Naef & Schupp, 2009). Further information can be found in Dohmen et al. (2008). References Dohmen, T., Falk, A., Huffman, D., & Sunde, U. (2008). Representative trust and reciprocity:
Prevalence and determinants. Economic Inquiry, 46, 81-90. Naef, M., & Schupp, J. (2009). Measuring Trust: Experiments and Surveys in Contrast and
Combination. Berlin: DIW Berlin. Luhmann, N. (2000). Vertrauen: Ein Mechanismus der Reduktion sozialer Komplexität. Stuttgart:
Lucius & Lucius. Rotter, J. B. (1967). A new scale for the measurement of interpersonal trust. Journal of Personality,
35, 651-665. Stolle, D. (2002). Trusting Strangers - Generalized trust in perspective. Österreichische Zeitschrift für
Politikwissenschaft, 31, 397-412. Items What is your opinion on the following three statements (Was ist Ihre Meinung zu den folgenden drei Aussagen):
1. On the whole, one can trust people (Im Allgemeinen kann man den Menschen vertrauen) 2. Nowadays one can’t depend on anyone (Heutzutage kann man sich auf niemanden mehr
verlassen) 3. When dealing with strangers, it is better to be cautious before trusting them (Wenn man
mit fremden zu tun hat, ist es besser, vorsichtig zu sein, bevor man ihnen vertraut) Scale: 1 (Agree completely/ Stimme voll zu) to 4 (Disagree completely/ Lehne voll ab)
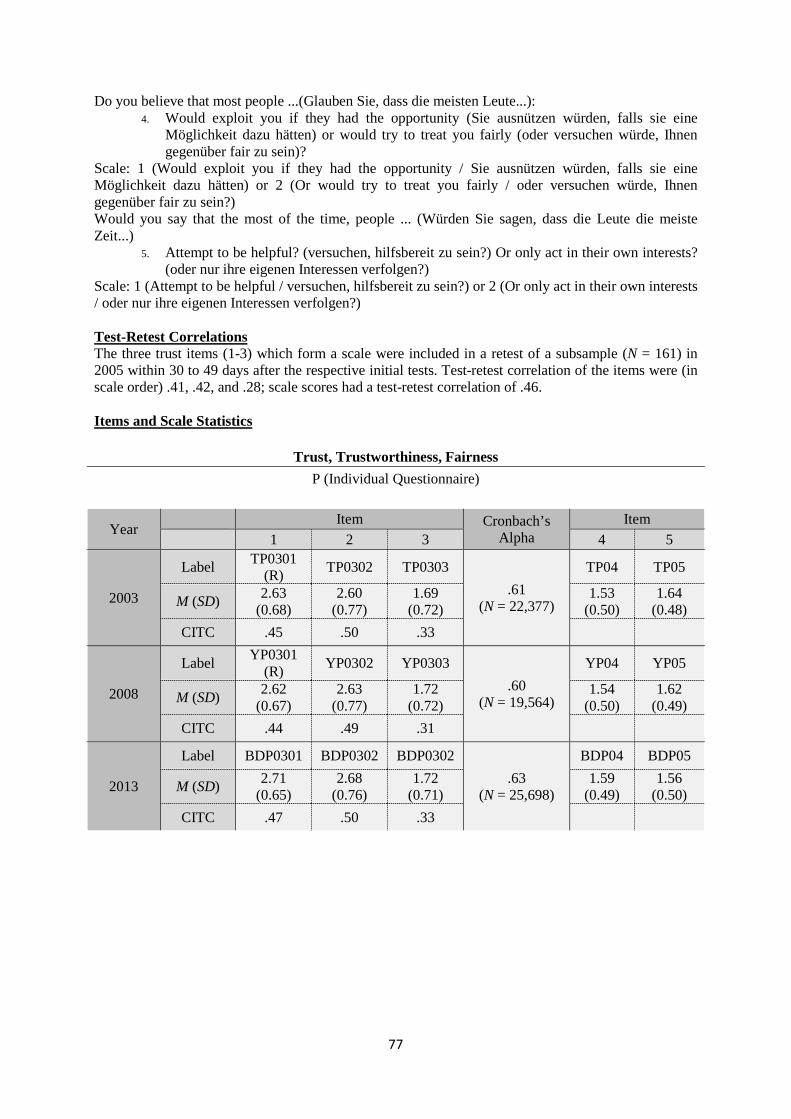
77
Do you believe that most people ...(Glauben Sie, dass die meisten Leute...): 4. Would exploit you if they had the opportunity (Sie ausnützen würden, falls sie eine
Möglichkeit dazu hätten) or would try to treat you fairly (oder versuchen würde, Ihnen gegenüber fair zu sein)?
Scale: 1 (Would exploit you if they had the opportunity / Sie ausnützen würden, falls sie eine Möglichkeit dazu hätten) or 2 (Or would try to treat you fairly / oder versuchen würde, Ihnen gegenüber fair zu sein?) Would you say that the most of the time, people ... (Würden Sie sagen, dass die Leute die meiste Zeit...)
5. Attempt to be helpful? (versuchen, hilfsbereit zu sein?) Or only act in their own interests? (oder nur ihre eigenen Interessen verfolgen?)
Scale: 1 (Attempt to be helpful / versuchen, hilfsbereit zu sein?) or 2 (Or only act in their own interests / oder nur ihre eigenen Interessen verfolgen?) Test-Retest Correlations The three trust items (1-3) which form a scale were included in a retest of a subsample (N = 161) in 2005 within 30 to 49 days after the respective initial tests. Test-retest correlation of the items were (in scale order) .41, .42, and .28; scale scores had a test-retest correlation of .46. Items and Scale Statistics
Trust, Trustworthiness, Fairness P (Individual Questionnaire)
Year Item Cronbach’s Alpha
Item 1 2 3 4 5
2003
Label TP0301 (R) TP0302 TP0303
.61 (N = 22,377)
TP04 TP05
M (SD) 2.63 (0.68)
2.60 (0.77)
1.69 (0.72)
1.53 (0.50)
1.64 (0.48)
CITC .45 .50 .33
2008
Label YP0301 (R) YP0302 YP0303
.60 (N = 19,564)
YP04 YP05
M (SD) 2.62 (0.67)
2.63 (0.77)
1.72 (0.72)
1.54 (0.50)
1.62 (0.49)
CITC .44 .49 .31
2013
Label BDP0301 BDP0302 BDP0302 .63
(N = 25,698)
BDP04 BDP05
M (SD) 2.71 (0.65)
2.68 (0.76)
1.72 (0.71)
1.59 (0.49)
1.56 (0.50)
CITC .47 .50 .33
78
Vineland Adaptive Behavior Scales Summary The 20-item Vineland Adaptive Behavior Scale has been used in the SOEP since 2005 to assess parents’ ratings of their 2-3-year-old children in the areas of language, everyday skills, motor skills, and social relationships. Theoretical Background Especially at an age when individual functions such as linguistic, mathematic, and social competencies are still relatively undifferentiated, adaptive behavior offers a true-to-life measure of child development in an everyday life context that is significant for the child. Measuring this adaptive behavior also does not require testing the child but rather takes place in the framework of a reporting procedure in which a person who is familiar with the child’s adaptive behavior in everyday life provides specific descriptions of the child’s behavior. Scale Development The scale is based on a German adaptation (Tietze et al. 1998) of the Vineland Adaptive Behavior Scale by Sparrow, Balla und Cichetti (1984). For use in the SOEP survey framework, the scale was reduced to 20 items. Further information can be found in Schmiade, Spieß, & Tietze (2008). References Schmiade, N., Spieß, C. K., & Tietze, W. (2008). Zur Erhebung des adaptiven Verhaltens von zwei-
und dreijährigen Kindern im Sozio-oekonomischen Panel (SOEP). Berlin: DIW Berlin. Sparrow, S. S., Balla, D. A., & Cicchetti, D. V. (1984). Vineland Adaptive Behavior Scale. A revision
of the Vineland Social Maturity Scale by Edbar A. Doll. Survey Form Manual. Circle Pines, Minnesota: American Guidance Service.
Tietze, W., Meischner, T., Gänsfuß, R., Grenner, K., Schuster, K.-M., Völkel, P., & Roßbach, H.-G. (1998). Wie gut sind unsere Kindergärten? Eine Untersuchung zur pädagogischen Qualität in deutschen Kindergärten. Neuwied: Luchterhand.
Items For parents, it is always a big event when their child learns something new. Please tell us what new things your child can do (Für Eltern ist es immer ein großes Erlebnis, wenn das Kind schon wieder etwas Neues kann. Bitte geben Sie an, welche Dinge das bei Ihrem Kind sind): Talking (Sprechen)
1. Understands brief instructions such as “go get your shoes” (Versteht kurze Anweisungen, wie z.B. „hole deine Schuhe”)
2. Forms sentences with at least two words (Bildet Sätze mit mindestens zwei Wörtern) 3. Speaks in full sentences (with four or more words) (Spricht in ganzen Sätzen (mit vier und
mehr Wörtern)) 4. Listens attentively to a story for five minutes or longer (Hört einer Geschichte 5 Minuten
oder länger aufmerksam zu sein) 5. Passes on simple messages such as “dinner is ready” (Überbringt einfache Nachrichten
wie z.B. „Essen is fertig”) 6. (since 2010) Follows instructions (heard five minutes before) (Folgt Anweisungen, die es
fünf Minuten zuvor gehört hat) 7. (since 2010) Tells his/her first and lastname when asked for it (Nennt seinen Vor- und
Nachnamen, wenn es danach gefragt wird) 8. (since 2010) Listens attentively to stories for at least 15 Minutes (Hört in der Regel
Geschichten mindestens 15 Min. aufmerksam zu) Scale: 1 (Yes / ja), 2 (To some extent / teilweise), 3 (No / nein)
79
Everyday skills (Alltagsfertigkeiten) 1. Uses a spoon to eat without assistance and without dripping (Isst selbstständig mit dem
Löffel, ohne zu kleckern) 2. Blows his/her nose without assistance (Putzt sich selbst die Nase) 3. Uses the toilet to do “number two” (Benutzt für „großes Geschäft” die Toilette) 4. Puts on pants and underpants the right way around (Zieht sich Hosen und Unterhosen
selbst richtig herum an) 5. Brushes his/her teeth without assistance (Putzt sich selbst die Zähne)
Scale: 1 (Yes / ja), 2 (To some extent/teilweise), 3 (No/nein) Movement (Bewegung):
1. Walks forward down the stairs (Läuft Treppen vorwärts herunter) 2. Opens doors with the door handle (Öffnet Türen mit Türklinke) 3. Climbs up playground climbing equipment and other high slayground structures (Klettert
auf Klettergerüste und andere hohe Spielgeräte) 4. Cuts paper with scissors (Schneidet mit einer Schere Papier durch) 5. Paints/draws recognizable shapes on paper (Malt auf Papier erkennbare Formen) 6. (since 2010) Holds pens in the right way (not fist grip) when drawing (Hält Stifte richtig
(nicht mit der Faust), um zu malen) Scale: 1 (Yes / ja), 2 (To some extent/teilweise), 3 (No/nein) Social relationships (Soziale Beziehungen):
1. Calls familar people by name; for example, says “mommy” and “daddy” or uses the father’s first name (Nennt vertraute Personen beim Namen; sagt z.B. „Mama.” „Papa” oder verwendet den Vornamen des Vaters)
2. Participates in games with other children (Nimmt an Spielen mit anderen Kindern teil) 3. Gets involved in role-playing games (“playing pretend”) (Beschäftigt sich mit
Rollenspielen („tun als ob”)) 4. Shows a special liking for particular playmates or friends (Zeigt eine Vorliebe für
bestimmte Spielgefährten oder Freunde) 5. Calls his/her own feelings by name, for example, “sad,” “happy,” “scared” (Benennt
eigene Gefühle, z. B. „traurig,” „freuen,” „Angst”) 6. (since 2010) Takes turns with other children when playing without beeing asked to do so
(Wechselt sich mit anderen beim Spielen ab, ohne darum gebeten zu werden) Scale: 1 (Yes / ja), 2 (To some extent/teilweise), 3 (No/nein)
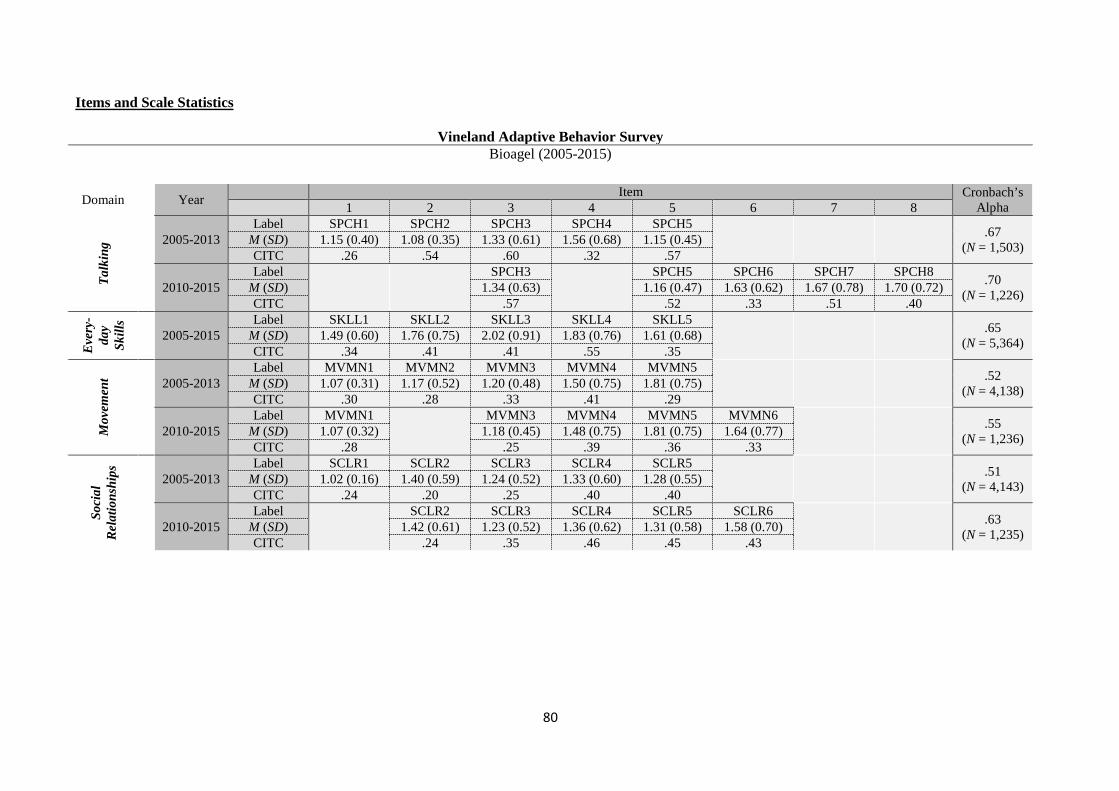
80
Items and Scale Statistics
Vineland Adaptive Behavior Survey Bioagel (2005-2015)
Domain Year Item Cronbach’s Alpha 1 2 3 4 5 6 7 8
Talk
ing
2005-2013
Label SPCH1 SPCH2 SPCH3 SPCH4 SPCH5 .67
(N = 1,503) M (SD) 1.15 (0.40) 1.08 (0.35) 1.33 (0.61) 1.56 (0.68) 1.15 (0.45) CITC .26 .54 .60 .32 .57
2010-2015 Label
SPCH3
SPCH5 SPCH6 SPCH7 SPCH8 .70
(N = 1,226) M (SD) 1.34 (0.63) 1.16 (0.47) 1.63 (0.62) 1.67 (0.78) 1.70 (0.72) CITC .57 .52 .33 .51 .40
Eve
ry-
day
Skill
s 2005-2015
Label SKLL1 SKLL2 SKLL3 SKLL4 SKLL5 .65
(N = 5,364) M (SD) 1.49 (0.60) 1.76 (0.75) 2.02 (0.91) 1.83 (0.76) 1.61 (0.68) CITC .34 .41 .41 .55 .35
Mov
emen
t
2005-2013
Label MVMN1 MVMN2 MVMN3 MVMN4 MVMN5 .52
(N = 4,138) M (SD) 1.07 (0.31) 1.17 (0.52) 1.20 (0.48) 1.50 (0.75) 1.81 (0.75) CITC .30 .28 .33 .41 .29
2010-2015 Label MVMN1
MVMN3 MVMN4 MVMN5 MVMN6
.55 (N = 1,236) M (SD) 1.07 (0.32) 1.18 (0.45) 1.48 (0.75) 1.81 (0.75) 1.64 (0.77)
CITC .28 .25 .39 .36 .33
Soci
al
Rel
atio
nshi
ps
2005-2013 Label SCLR1 SCLR2 SCLR3 SCLR4 SCLR5
.51 (N = 4,143) M (SD) 1.02 (0.16) 1.40 (0.59) 1.24 (0.52) 1.33 (0.60) 1.28 (0.55)
CITC .24 .20 .25 .40 .40
2010-2015 Label
SCLR2 SCLR3 SCLR4 SCLR5 SCLR6
.63 (N = 1,235) M (SD) 1.42 (0.61) 1.23 (0.52) 1.36 (0.62) 1.31 (0.58) 1.58 (0.70)
CITC .24 .35 .46 .45 .43