software diversity for information security gaurav kataria carnegie mellon university
TRANSCRIPT

Software Diversity for Information Security
Gaurav KatariaCarnegie Mellon University

The Problem?
Many networked machines running software with shared vulnerabilities
Vulnerabilities present in software with large critical mass invite a larger number of attacks
Attacks propagate over networks
Diversification – the use of software with fewer shared vulnerabilities – is an approach to mitigate the risk of correlated failure
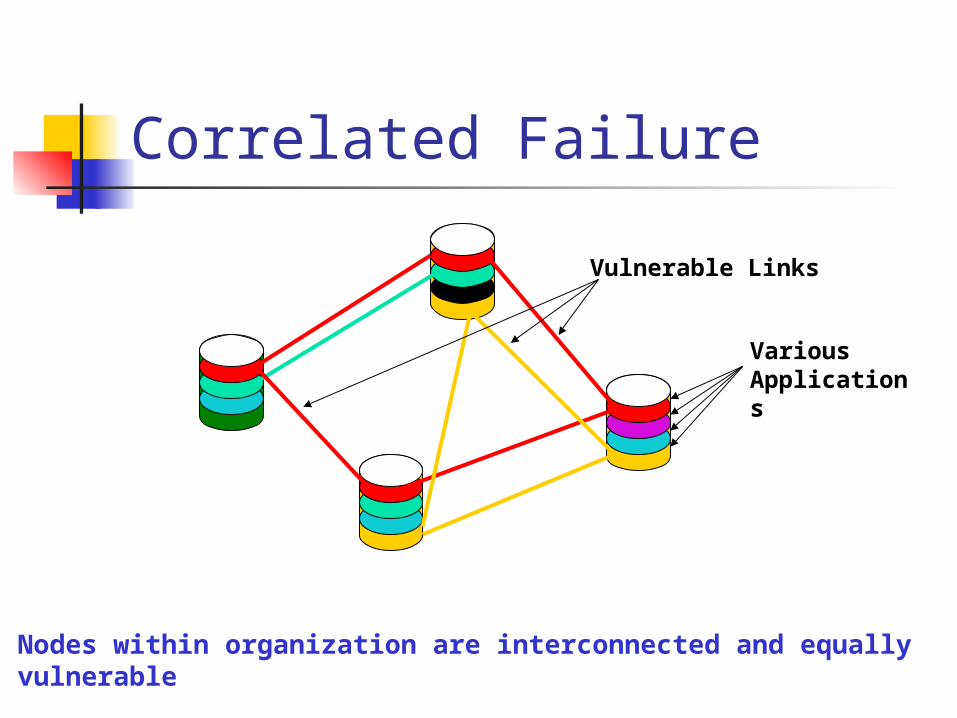
Correlated Failure
Nodes within organization are interconnected and equally vulnerable
VariousApplications
Vulnerable Links

Too much uniformity-monoculture According to market researcher
OneStat.com, Windows now controls 97.46% of the global desktop operating system market, compared to just 1.43% for Apple Macintosh and 0.26% for Linux.
Microsoft Internet Explorer has 87.28% browser market share compared to 8.45% for Firefox and 1.21% for Apple’s Safari.
Why uniformity? Homogeneity has “network effects”
Network effect is the positive externality from consuming a software that others use due to Better connectivity Integration Support etc.
But..
Homogeneity means putting all your eggs in one basket…
…if one node fails then so will others

How can diversity be introduced?
Choosing a different product? Linux vs. Windows vs. MAC OS? IE vs. Firefox Outlook vs. thunderbird
Different builds using different components MIME-handler and email header processors in
mail clients? Sensor network nodes distributed with
multiple OS’s in ROM?

Diversity: Definition Two software choices
Incumbent software 1 Competing software 2
Diversity defined in percentage terms The firm may choose to have x1 proportion of its
systems on incumbent software 1, while having the remaining 1-x1 on the competing software 2
50% diversity implies half nodes running software 1 and the other half running software 2

Diversification Strategy Model Correlated Failure
Beta-binomial distribution
Estimate Loss due to an Attack Downtime is crucial economic loss Mean time to recover as a metric for loss
Security Investment Tradeoffs Service capacity or preparedness Network configuration

Modeling Correlated Failure General randomized Binomial distribution
1
0
)()1(*),()( dppfppiNCib piNi
N
The intensity function fp(p) gives the probability distribution that a fraction of all nodes will fail
The node failure distribution is beta-binomial when fp(p) follows beta distribution with parameters:
,1
,
Where,
π is the (expected) probability of computer failure in an attack, θ ε (0, infinity) is the correlation level

Beta-binomial
α = 0.1 and β = 0.9 (high corr.)α = 1 and β = 9α = 10 and β = 90α = 100 and β = 900 (low corr.)
BN(i)
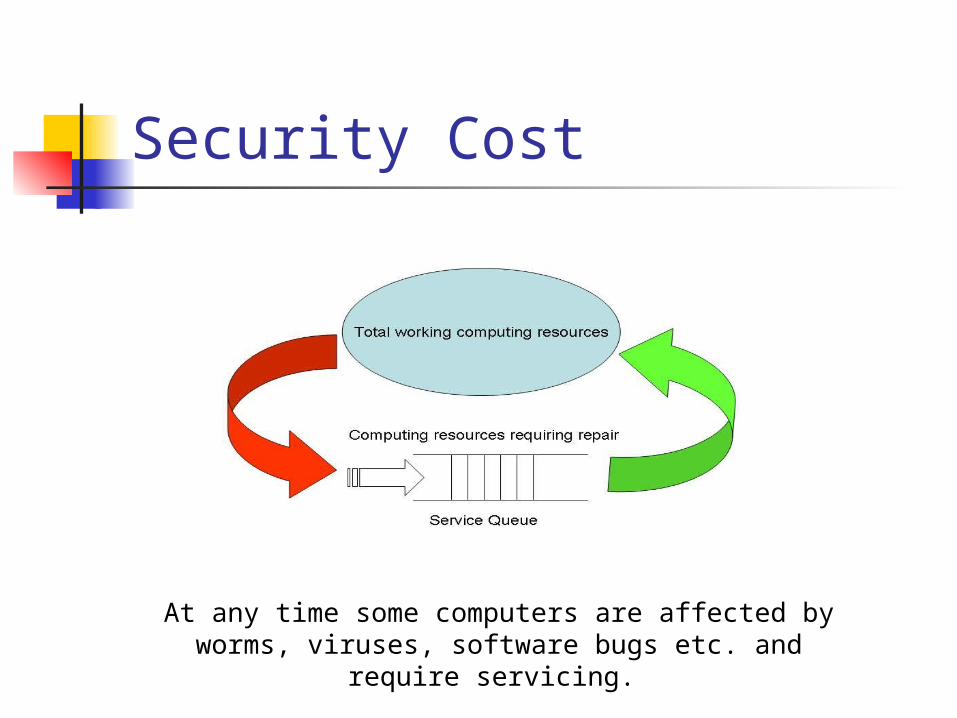
Security Cost
At any time some computers are affected by worms, viruses, software bugs etc. and require servicing.

Loss from an Attack
= Expected Repair Time
M/G/1 queueM (memoryless): Poisson arrival process, intensity
λ, which captures the arrival rate for attacksG (general): general service time distribution,
mean E[S] = 1/μ, which captures the service time to bring all infected systems back to normal status
1 : single server, load ρ = λ E[S] (in a stable queue ρ is always less than 1)

(Contd.)Loss from an Attack Mean time to bring every node up is given by
Pollaczek-Khinchin mean formula
)1(2
])[][(][][
2
SESV
SETE
Note: Mean downtime depends only on the expectation
E[S] and variance V[S] of the service time distribution but not on higher moments, and
Mean value increases linearly with the variance.

Number of Attacks Attack arrival modeled as a Poisson process
with arrival rate λ
λ, may depend on many factors including type of software industry where it is used inherent security level of software market share of the software product
Economies of scale in attack
Let mλ be mean # of attacks against software 2

Loss Reduction Via Diversity
Where,
y = # of computers affected by attack on either type of software
y1 = # of computers affected by attack on incumbent software
y2 = # of computers affected by attack on competing software
Individual f(y,x) are given by Beta-Binomial distribution
)1(*),(
)1(
1*),()(
)_2_Pr(*),()_1_Pr(*),()(
21
21
m
mxyf
mxyfyf
attacktypexyfattacktypexyfyf

(Contd.)Loss Reduction Via Diversity
Where,Service time S = k*y, where k is the measure of
service capability; by investing in the IT department’s capacity a firm can decrease service time by decreasing k.
λ+mλ = total number of attacks faced; 1/1+m are of type 1 and m/1+m of type 2.
])[*)(1(2
])[][(*)(][
])[*)(1(2
])[][(*)(][][
22
2
ykEm
yEyVkmykE
kyEm
kyEkyVmkyETE
Variables of Interest
Diversity (x) Service capacity (k) Network configuration (θ)

Diversity vs. Service Capacity
m is kept constant at 0.5 i.e. software 2 receives half as many attacks as incumbent software 1; π = .05 (5% probability of failure)
Investment in service capacity offsets investment in diversity
0
5
10
15
20
25
30
35
Diversity (=1-x)
Ex
pec
ted
Lo
ss=
E[T
]
k=1
k=0.8
k=0.6
k=0.4
k=0.2

Diversity vs. Network Config.
m is kept constant at 0.5 i.e. software 2 receives half as many attacks as incumbent software 1; π = .05 (5% probability of failure)
Investment in network config. offsets investment in diversity
0
5
10
15
20
25
30
35
00.
10.
20.
30.
40.
50.
60.
70.
80.
9 1
Diversity (=1-x)
Ex
pe
cte
d L
os
s =
E[T
]
correlation =1
correlation =0.50
correlation =0.10
correlation =0.01

Optimal Diversity
Optimal diversity (i.e. optimal proportion of software 2) declines as software 2 receives more attacks vis-à-vis software 1
π = .05 (5% probability of failure); k = 1; θ = 1, λ=0.1.
0
0.2
0.4
0.6
0.8
1
1.2
00.
20.
40.
60.
8 11.
21.
41.
61.
8 22.
22.
42.
62.
8 3
m: ratio of # of attacks against software 2 / software 1
Op
tim
al D
ive
rsit
y (
=1
-x)

Future Research Game-theoretic decision models for
distributed network partition Graph coloring approach Each agent decides its color taking into account
both the benefits and costs of being the same color as its neighbors
Additional costs may be imposed by network administrator (social planner)
Market Equilibrium Strategic interaction Role of government and industry groups

Questions?