software equity group flash report · software equity group is an investment bank and m&a...
TRANSCRIPT

Software Equity Group Flash Report
Select M&A Transactions and Valuations and
Financial and Valuation Performance of 250+ Publicly Traded Software, SaaS and Internet
Companies by Product Category

• Industry leading boutique investment bank, founded in 1992, representing public and private software and internet companies seeking:
• Strategic exit• Growth capital• Buyout • Inorganic growth via acquisition• Buy and sell-side mentoring• Fairness opinions and valuations
• Sell-side client revenue range: $5 - 75 million• Buy-side clients include private equity firms and
NASDAQ, NYSE and foreign exchange listed companies• Clients span virtually every software technology, product
category, delivery model and vertical market• Global presence providing advice and guidance to more
than 2,000 private and public companies throughout US, Canada, Europe, Asia-Pacific, Africa and Israel
• Strong cross-functional team leveraging transaction, operating, legal and engineering experience
• Unparalleled software industry reputation and track record.
• Highly referenceable base of past clients
LEADERS IN SOFTWARE M&A
We Do Deals.
Copyright © 2015 by Software Equity Group, L.L.C., All Rights Reserved
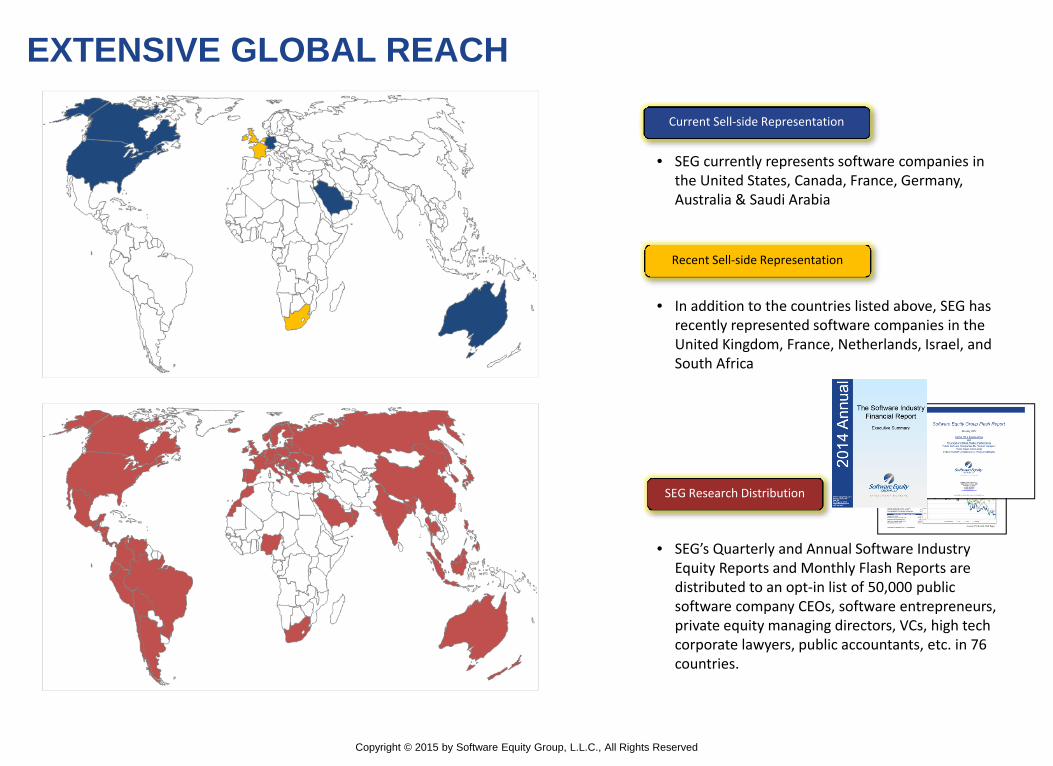
EXTENSIVE GLOBAL REACH
SEG Research Distribution
Current Sell‐side Representation
Recent Sell‐side Representation
• SEG currently represents software companies in the United States, Canada, France, Germany, Australia & Saudi Arabia
• In addition to the countries listed above, SEG has recently represented software companies in the United Kingdom, France, Netherlands, Israel, and South Africa
• SEG’s Quarterly and Annual Software Industry Equity Reports and Monthly Flash Reports are distributed to an opt‐in list of 50,000 public software company CEOs, software entrepreneurs, private equity managing directors, VCs, high tech corporate lawyers, public accountants, etc. in 76 countries.
Copyright © 2015 by Software Equity Group, L.L.C., All Rights Reserved

Software Equity Group is an investment bank and M&A advisory serving the software and technology sectors. Founded in 1992, our firm has guided and advised companies on five continents, including privately‐held software and technology companies in the United States, Canada, Europe, Asia Pacific, Africa and Israel. We have represented public companies listed on the NASDAQ, NYSE, American, Toronto, London and Euronext exchanges. Software Equity Group also advises several of the world's leading private equity firms. We are ranked among the top ten investment banks worldwide for application software mergers and acquisitions.
Our value proposition is unique and compelling. We are skilled and accomplished investment bankers with extraordinary software, internet and technology domain expertise. Our industry knowledge and experience span virtually every software product category, technology, market and delivery model, including Software‐as‐a‐Service (Saas), software on‐demand and perpetual license. We have profound understanding of software company finances, operations and valuation. We monitor and analyze every publicly disclosed software M&A transaction, as well as the market, economy and technology trends that impact these deals. We're formidable negotiators and savvy dealmakers who facilitate strategic combinations that enhance shareholder value.
Perhaps most important are the relationships we've built and the industry reputation we enjoy. Software Equity Group is known and respected by publicly traded and privately owned software and technology companies worldwide, and we speak with them often. Our Quarterly and Annual Software Industry Equity Reports are read and relied upon by more than thousands of industry executives, entrepreneurs and equity investors in sixty‐one countries, and we have been quoted widely in such leading publications as The Wall Street Journal, Barrons, Information Week, The Daily Deal, The Street.com, U.S. News & World Report, Reuters, Mergers & Acquisitions, USA Today, Arizona Republic, Detroit Free Press, Entrepreneur Magazine, Softletter, Software Success, Software CEO Online and Software Business Magazine.
To keep your finger on the pulse of the software equity markets, subscribe to our Annual and Quarterly Research Reports.
Software Equity Group is an investment bank and M&A advisory serving the software and technology sectors. For a confidential consultation without obligation, please [email protected] , 2800‐509) 858Beible, Director, Business Development (Kris contact
CONTACT INFORMATION:
Software Equity Group, L.L.C.12220 El Camino Real, Suite 320San Diego, CA 92130www.softwareequity.comp: (858) 509‐2800
The information contained in this Report is obtained from sources we believe to be reliable, but no representation or guarantee is made about the accuracy or completeness of such information, or the opinions expressed herein. Nothing in this Report is intended to be a recommendation of a specific security or company or intended to constitute an offer to buy or sell, or the solicitation of an offer to buy or sell, any security. Software Equity Group LLC may have an interest in one or more of the securities or companies discussed herein. Financial data provided by Capital IQ.
This Report may not be reproduced in whole or in part without the expressed prior written authorization of Software Equity Group, L.L.C.Software Equity Group registers each Report with the U.S. Copyright Office and vigorously enforces its intellectual property rights.
ABOUT SOFTWARE EQUITY GROUP
Copyright © 2015 by Software Equity Group, L.L.C., All Rights Reserved

List of Commonly Used Acronyms
Copyright © 2015 by Software Equity Group, L.L.C., All Rights Reserved

Removals:
Acquired by Zillow Group, Inc. ($3.3B)
Acquired by Siris Capital Group, LLC ($1.0B)
Acquired by Vector Capital ($270.0M)
Acquired by 3D Systems Corp. ($96.5M)
SEG Index ChangesPrevious Category
Digital River, Inc.
Company Ticker Previous IndexTrulia, Inc.
- Internet Commerce & Infrastructure
- ServicesInternet
-Saba Software, Inc.
Software Not Categorized
- SoftwareCimatron Ltd.
Engineering & PLM
Copyright © 2015 by Software Equity Group, L.L.C., All Rights Reserved

Copyright © 2015 by Software Equity Group, L.L.C., All Rights Reserved
Table of Contents
SEG Software Index
Select Software Industry M&A Transactions
SEG SaaS Index
SEG Internet Index

Copyright © 2015 by Software Equity Group, L.L.C., All Rights Reserved
SEG Software Index
Select Software Industry M&A Transactions
SEG SaaS Index
SEG Internet Index
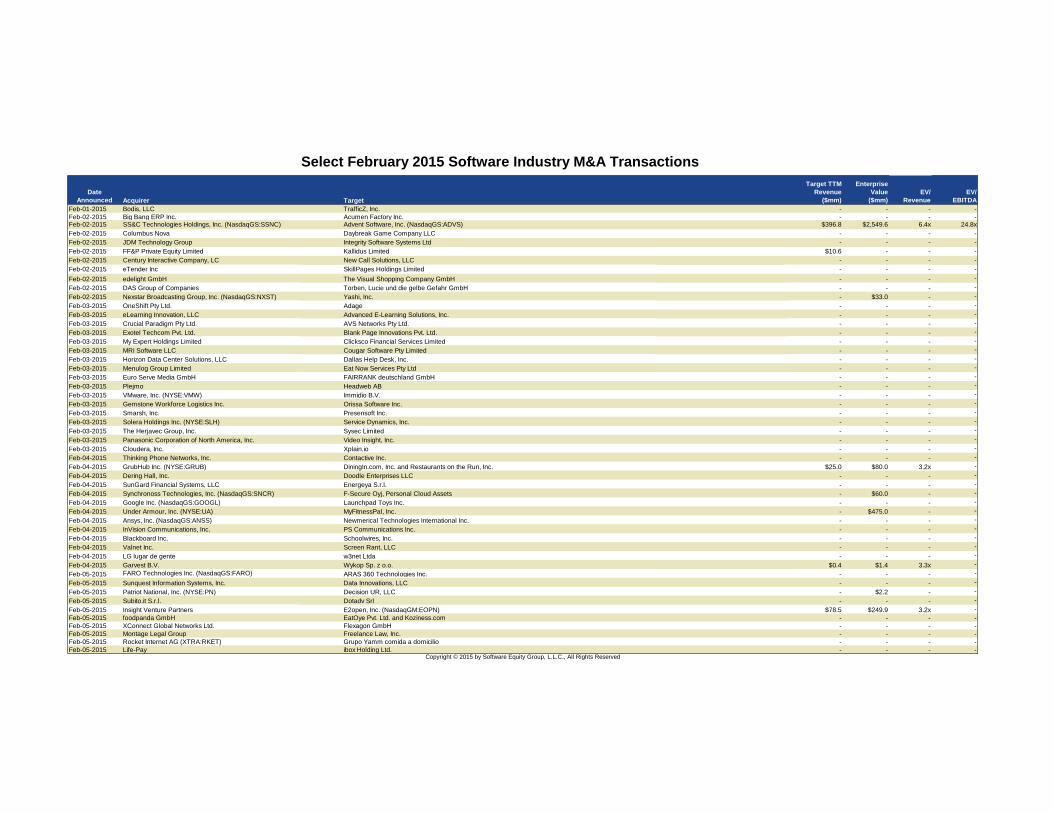
Select February 2015 Software Industry M&A Transactions
Date Announced Target
Target TTM Revenue
($mm)
Enterprise Value
($mm)EV/
RevenueEV/
EBITDAFeb-01-2015 Bodis, LLC TrafficZ, Inc. - - - -Feb-02-2015 Big Bang ERP Inc. Acumen Factory Inc. - - - -Feb-02-2015 SS&C Technologies Holdings, Inc. (NasdaqGS:SSNC) Advent Software, Inc. (NasdaqGS:ADVS) $396.8 $2,549.6 6.4x 24.8xFeb-02-2015 Columbus Nova Daybreak Game Company LLC - - - -Feb-02-2015 JDM Technology Group Integrity Software Systems Ltd - - - -Feb-02-2015 FF&P Private Equity Limited Kallidus Limited $10.6 - - -Feb-02-2015 Century Interactive Company, LC New Call Solutions, LLC - - - -Feb-02-2015 eTender Inc SkillPages Holdings Limited - - - -Feb-02-2015 edelight GmbH The Visual Shopping Company GmbH - - - -Feb-02-2015 DAS Group of Companies Torben, Lucie und die gelbe Gefahr GmbH - - - -Feb-02-2015 Nexstar Broadcasting Group, Inc. (NasdaqGS:NXST) Yashi, Inc. - $33.0 - -Feb-03-2015 OneShift Pty Ltd. Adage - - - -Feb-03-2015 eLearning Innovation, LLC Advanced E-Learning Solutions, Inc. - - - -Feb-03-2015 Crucial Paradigm Pty Ltd. AVS Networks Pty Ltd. - - - -Feb-03-2015 Exotel Techcom Pvt. Ltd. Blank Page Innovations Pvt. Ltd. - - - -Feb-03-2015 My Expert Holdings Limited Clicksco Financial Services Limited - - - -Feb-03-2015 MRI Software LLC Cougar Software Pty Limited - - - -Feb-03-2015 Horizon Data Center Solutions, LLC Dallas Help Desk, Inc. - - - -Feb-03-2015 Menulog Group Limited Eat Now Services Pty Ltd - - - -Feb-03-2015 Euro Serve Media GmbH FAIRRANK deutschland GmbH - - - -Feb-03-2015 Plejmo Headweb AB - - - -Feb-03-2015 VMware, Inc. (NYSE:VMW) Immidio B.V. - - - -Feb-03-2015 Gemstone Workforce Logistics Inc. Orissa Software Inc. - - - -Feb-03-2015 Smarsh, Inc. Presensoft Inc. - - - -Feb-03-2015 Solera Holdings Inc. (NYSE:SLH) Service Dynamics, Inc. - - - -
Acquirer
Feb-03-2015 The Herjavec Group, Inc. Sysec Limited - - - -Feb-03-2015 Panasonic Corporation of North America, Inc. Video Insight, Inc. - - - -Feb-03-2015 Cloudera, Inc. Xplain.io - - - -Feb-04-2015 Thinking Phone Networks, Inc. Contactive Inc. - - - -Feb-04-2015 GrubHub Inc. (NYSE:GRUB) DiningIn.com, Inc. and Restaurants on the Run, Inc. $25.0 $80.0 3.2x -Feb-04-2015 Dering Hall, Inc. Doodle Enterprises LLC - - - -Feb-04-2015 SunGard Financial Systems, LLC Energeya S.r.l. - - - -Feb-04-2015 Synchronoss Technologies, Inc. (NasdaqGS:SNCR) F-Secure Oyj, Personal Cloud Assets - $60.0 - -Feb-04-2015 Google Inc. (NasdaqGS:GOOGL) Launchpad Toys Inc. - - - -Feb-04-2015 Under Armour, Inc. (NYSE:UA) MyFitnessPal, Inc. - $475.0 - -Feb-04-2015 Ansys, Inc. (NasdaqGS:ANSS) Newmerical Technologies International Inc. - - - -Feb-04-2015 InVision Communications, Inc. PS Communications Inc. - - - -Feb-04-2015 Blackboard Inc. Schoolwires, Inc. - - - -Feb-04-2015 Valnet Inc. Screen Rant, LLC - - - -Feb-04-2015 LG lugar de gente w3net Ltda - - - -Feb-04-2015 Garvest B.V. Wykop Sp. z o.o. $0.4 $1.4 3.3x -Feb-05-2015 FARO Technologies Inc. (NasdaqGS:FARO) ARAS 360 Technologies Inc. - - - -Feb-05-2015 Sunquest Information Systems, Inc. Data Innovations, LLC - - - -Feb-05-2015 Patriot National, Inc. (NYSE:PN) Decision UR, LLC - $2.2 - -Feb-05-2015 Subito.it S.r.l. Dotadv Srl - - - -Feb-05-2015 Insight Venture Partners E2open, Inc. (NasdaqGM:EOPN) $78.5 $249.9 3.2x -Feb-05-2015 foodpanda GmbH EatOye Pvt. Ltd. and Koziness.com - - - -Feb-05-2015 XConnect Global Networks Ltd. Flexagon GmbH - - - -Feb-05-2015 Montage Legal Group Freelance Law, Inc. - - - -Feb-05-2015 Rocket Internet AG (XTRA:RKET) Grupo Yamm comida a domicilio - - - -Feb-05-2015 Life-Pay ibox Holding Ltd. - - - -
Copyright © 2015 by Software Equity Group, L.L.C., All Rights Reserved

Select February 2015 Software Industry M&A Transactions
Date Announced Target
Target TTM Revenue
($mm)
Enterprise Value
($mm)EV/
RevenueEV/
EBITDAFeb-05-2015 SponsorsOne Inc. (DB:5SO) JWalk NY LLC - $6.0 - -Feb-05-2015 - Michael Williams Web Design, Inc. - - - -Feb-05-2015 BASE, Inc. Pay.jp - - - -Feb-05-2015 Message Systems, Inc. Port25 Solutions, Inc. - - - -Feb-05-2015 Intuit Inc. (NasdaqGS:INTU) Porticor Ltd. - $10.0 - -Feb-05-2015 GORGES, Inc. Push Interactive, LLC - - - -Feb-05-2015 Brocade Communications Systems, Inc. (NasdaqGS:BRCD) Riverbed Technology, Inc., SteelApp Business $31.1 - - -Feb-05-2015 Marin Software Incorporated (NYSE:MRIN) Social Moov SAS - $18.8 - -Feb-05-2015 Managed Health Care Associates, Inc. SoftWriters, Inc. - - - -Feb-05-2015 Divalto-SA SwingMobility, SAS - - - -Feb-06-2015 Pisces Eservices Pvt. Ltd. Achindra Online Marketing Pvt. Ltd. - - - -Feb-06-2015 TriTech Software Systems Inc. CompuDyne - Public Safety & Justice, Inc. - - - -Feb-06-2015 - CROOZ Korea Corporation $2.0 $0.5 0.3x -Feb-06-2015 Cuponzote DescuentoHoy.com - - - -Feb-06-2015 Battery Ventures Enviance, Inc. - - - -Feb-06-2015 Palantir Technologies Inc. FT Technologies, Inc. - - - -Feb-06-2015 Groupe T2i Notys Solutions SARL - - - -Feb-06-2015 Synoptek, Inc. Pay Per Cloud, Inc. - - - -Feb-06-2015 - The Brand Establishment LLC - - - -Feb-06-2015 Dongguan YouDai Financial Information Services Co., Ltd Yinfu Gold Corporation (OTCPK:ELRE) - - - -Feb-08-2015 Genex Infosys Ltd. Green and Red Technologies, Ltd. - - - -Feb-08-2015 Google Inc. (NasdaqGS:GOOGL) Nimbuz, Inc. - - - -Feb-09-2015 NIZIGExN Co.,Ltd. aeronauts,INC. $1.3 $2.1 1.7x -Feb-09-2015 FactSet Research Systems Inc. (NYSE:FDS) Code Red, Inc. - - - -Feb-09-2015 Frontline Technologies Group LLC CRS Advanced Technology, Inc. - - - -F b 09 2015 C b t d LLC C b V l t I
Acquirer
Feb-09-2015 Curbstand, LLC Curby Valet, Inc. - - - -Feb-09-2015 Enprise Group Limited (NZSE:ENS) GlobalBizPro Limited, MYOB EXO Practice - $0.6 - -Feb-09-2015 Dalian Wanda Group Corporation Ltd. Infront Sports & Media AG $906.2 $1,189.3 1.3x -Feb-09-2015 Aysling Digital Media Solutions Juggernaut LLC - - - -Feb-09-2015 Accel-KKR LLC Kerridge Commercial Systems Limited - - - -Feb-09-2015 Bilendi SA (ENXTPA:ALBLD) M3 Research A/S $4.5 - - -Feb-09-2015 Nexus AG (XTRA:NXU) quCare Solutions B.V. $17.0 $22.7 1.3x -Feb-09-2015 Enigmo Inc. (TSE:3665) Rocket Venture Inc. $0.1 $4.2 64.4x -Feb-09-2015 Teaching Strategies, LLC Tadpoles LLC - - - -Feb-09-2015 Shotgun Software Inc. Tweak Software, Inc. - - - -Feb-09-2015 Hewlett-Packard Company (NYSE:HPQ) Voltage Security, Inc. - - - -Feb-09-2015 LINE Pay Corporation WebPay Holdings - - - -Feb-10-2015 Invoke Solutions, Inc. Academic Management Systems, Inc. - - - -Feb-10-2015 MCI Brazil S/A Acqua Consultoria And AB Eventos - - - -Feb-10-2015 Bentley Systems, Incorporated Acute3D SAS - - - -Feb-10-2015 Temenos U.S.A., Inc. Akcelerant Software LLC - $55.0 - -Feb-10-2015 - Al Rai International Company for Marketing and Advertising W.L.L. - $0.3 - -Feb-10-2015 Mobile Network Group S.A. (ENXTPA:ALMNG) Appsfire SAS - $30.0 - -Feb-10-2015 BroadVoice, Inc. DSL Extreme, Inc. - - - -Feb-10-2015 Yelp, Inc. (NYSE:YELP) Eat24Hours.com, Inc. - $134.2 - -Feb-10-2015 Moore Communications Group, Inc. Financial Social Media - - - -Feb-10-2015 Clearlake Capital Group, LLC HEAT Software - - - -Feb-10-2015 Mosaic US Holdings Inc. Launch! - - - -Feb-10-2015 Bravofly Rumbo Group N.V. (SWX:BRG) Map2app, Inc. - - - -Feb-10-2015 Go Daddy Software, Inc. Nodejitsu Inc. - - - -Feb-10-2015 ArbiterSports, LLC Pay OGFE Inc. - - - -
Copyright © 2015 by Software Equity Group, L.L.C., All Rights Reserved
Select February 2015 Software Industry M&A Transactions
Date Announced Target
Target TTM Revenue
($mm)
Enterprise Value
($mm)EV/
RevenueEV/
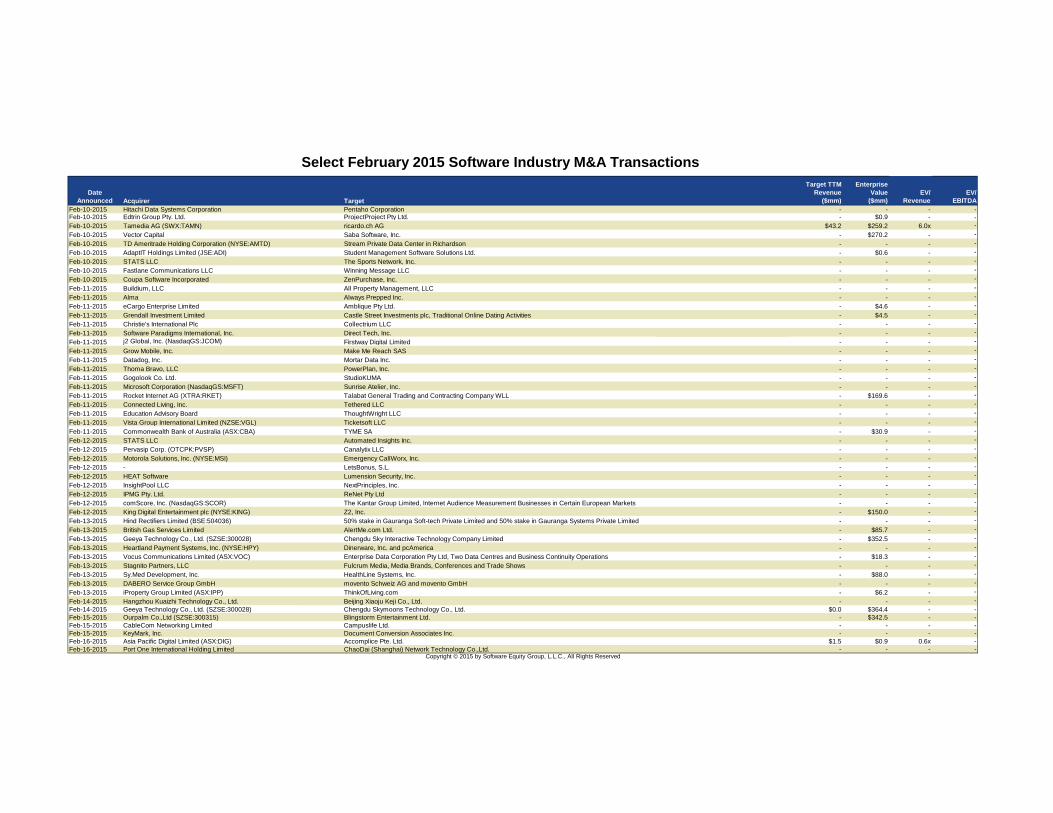
EBITDAFeb-10-2015 Hitachi Data Systems Corporation Pentaho Corporation - - - -Feb-10-2015 Edtrin Group Pty. Ltd. ProjectProject Pty Ltd. - $0.9 - -Feb-10-2015 Tamedia AG (SWX:TAMN) ricardo.ch AG $43.2 $259.2 6.0x -Feb-10-2015 Vector Capital Saba Software, Inc. - $270.2 - -Feb-10-2015 TD Ameritrade Holding Corporation (NYSE:AMTD) Stream Private Data Center in Richardson - - - -Feb-10-2015 AdaptIT Holdings Limited (JSE:ADI) Student Management Software Solutions Ltd. - $0.6 - -Feb-10-2015 STATS LLC The Sports Network, Inc. - - - -Feb-10-2015 Fastlane Communications LLC Winning Message LLC - - - -Feb-10-2015 Coupa Software Incorporated ZenPurchase, Inc. - - - -Feb-11-2015 Buildium, LLC All Property Management, LLC - - - -Feb-11-2015 Alma Always Prepped Inc. - - - -Feb-11-2015 eCargo Enterprise Limited Amblique Pty Ltd. - $4.6 - -Feb-11-2015 Grendall Investment Limited Castle Street Investments plc, Traditional Online Dating Activities - $4.5 - -Feb-11-2015 Christie's International Plc Collectrium LLC - - - -Feb-11-2015 Software Paradigms International, Inc. Direct Tech, Inc. - - - -Feb-11-2015 j2 Global, Inc. (NasdaqGS:JCOM) Firstway Digital Limited - - - -Feb-11-2015 Grow Mobile, Inc. Make Me Reach SAS - - - -Feb-11-2015 Datadog, Inc. Mortar Data Inc. - - - -Feb-11-2015 Thoma Bravo, LLC PowerPlan, Inc. - - - -Feb-11-2015 Gogolook Co. Ltd. StudioKUMA - - - -Feb-11-2015 Microsoft Corporation (NasdaqGS:MSFT) Sunrise Atelier, Inc. - - - -Feb-11-2015 Rocket Internet AG (XTRA:RKET) Talabat General Trading and Contracting Company WLL - $169.6 - -Feb-11-2015 Connected Living, Inc. Tethered LLC - - - -Feb-11-2015 Education Advisory Board ThoughtWright LLC - - - -Feb-11-2015 Vista Group International Limited (NZSE:VGL) Ticketsoft LLC - - - -
Acquirer
Feb-11-2015 Commonwealth Bank of Australia (ASX:CBA) TYME SA - $30.9 - -Feb-12-2015 STATS LLC Automated Insights Inc. - - - -Feb-12-2015 Pervasip Corp. (OTCPK:PVSP) Canalytix LLC - - - -Feb-12-2015 Motorola Solutions, Inc. (NYSE:MSI) Emergency CallWorx, Inc. - - - -Feb-12-2015 - LetsBonus, S.L. - - - -Feb-12-2015 HEAT Software Lumension Security, Inc. - - - -Feb-12-2015 InsightPool LLC NextPrinciples, Inc. - - - -Feb-12-2015 IPMG Pty. Ltd. ReNet Pty Ltd - - - -Feb-12-2015 comScore, Inc. (NasdaqGS:SCOR) The Kantar Group Limited, Internet Audience Measurement Businesses in Certain European Markets - - - -Feb-12-2015 King Digital Entertainment plc (NYSE:KING) Z2, Inc. - $150.0 - -Feb-13-2015 Hind Rectifiers Limited (BSE:504036) 50% stake in Gauranga Soft-tech Private Limited and 50% stake in Gauranga Systems Private Limited - - - -Feb-13-2015 British Gas Services Limited AlertMe.com Ltd. - $85.7 - -Feb-13-2015 Geeya Technology Co., Ltd. (SZSE:300028) Chengdu Sky Interactive Technology Company Limited - $352.5 - -Feb-13-2015 Heartland Payment Systems, Inc. (NYSE:HPY) Dinerware, Inc. and pcAmerica - - - -Feb-13-2015 Vocus Communications Limited (ASX:VOC) Enterprise Data Corporation Pty Ltd, Two Data Centres and Business Continuity Operations - $18.3 - -Feb-13-2015 Stagnito Partners, LLC Fulcrum Media, Media Brands, Conferences and Trade Shows - - - -Feb-13-2015 Sy.Med Development, Inc. HealthLine Systems, Inc. - $88.0 - -Feb-13-2015 DABERO Service Group GmbH movento Schweiz AG and movento GmbH - - - -Feb-13-2015 iProperty Group Limited (ASX:IPP) ThinkOfLiving.com - $6.2 - -Feb-14-2015 Hangzhou Kuaizhi Technology Co., Ltd. Beijing Xiaoju Keji Co., Ltd. - - - -Feb-14-2015 Geeya Technology Co., Ltd. (SZSE:300028) Chengdu Skymoons Technology Co., Ltd. $0.0 $364.4 - -Feb-15-2015 Ourpalm Co.,Ltd (SZSE:300315) Blingstorm Entertainment Ltd. - $342.5 - -Feb-15-2015 CableCom Networking Limited Campuslife Ltd. - - - -Feb-15-2015 KeyMark, Inc. Document Conversion Associates Inc. - - - -Feb-16-2015 Asia Pacific Digital Limited (ASX:DIG) Accomplice Pte. Ltd. $1.5 $0.9 0.6x -Feb-16-2015 Port One International Holding Limited ChaoDai (Shanghai) Network Technology Co.,Ltd. - - - -
Copyright © 2015 by Software Equity Group, L.L.C., All Rights Reserved

Select February 2015 Software Industry M&A Transactions
Date Announced Target
Target TTM Revenue
($mm)
Enterprise Value
($mm)EV/
RevenueEV/
EBITDAFeb-16-2015 Subdirect, LLC Consumer Marketing Solutions, LLC - - - -Feb-16-2015 Enterprise Development Holdings Limited (SEHK:1808) Gravitas Group Limited $3.5 $26.4 7.5x -Feb-16-2015 Guangdong Sky Dragon Printing Ink Group Co., Ltd. Mconnect $12.8 $37.5 2.9x -Feb-16-2015 Infosys Ltd. (BSE:500209) Panaya Ltd. - $200.0 - -Feb-16-2015 Bosch Software Innovations GmbH ProSyst Software GmbH - - - -Feb-16-2015 NEXMachine, LLC Scholastic Connections, LLC - - - -Feb-16-2015 Triberr, Inc. Scoutle - - - -Feb-16-2015 JUST EAT plc (LSE:JE.) Sindelantal Mexico, S.A. de C.V. - - - -Feb-16-2015 Oneflare Pty Ltd. Word Of Mouth Online Pty Ltd. - - - -Feb-17-2015 Vizeat Limited Cookening SAS - - - -Feb-17-2015 MINDBODY, Inc. Fitness Mobile Apps - - - -Feb-17-2015 Billups, Inc. Generation Outdoor, Inc. - - - -Feb-17-2015 Fitmob, Inc. Gymsurfing - - - -Feb-17-2015 Journal Newspapers (The) LDSJournal, LTD. - - - -Feb-17-2015 WaterTrax, Inc. Linko Data Systems Inc. - - - -Feb-17-2015 InvestiQuant, Inc. Overnight Edges, LLC - - - -Feb-17-2015 MSC Software Corporation Simufact Engineering GmbH - - - -Feb-17-2015 Haynes Publishing Group plc (LSE:HYNS) Teon Media Limited - $0.7 - -Feb-17-2015 EatOye Pvt. Ltd. Urbanite Inc. - - - -Feb-18-2015 W2O Group ARC2 Communications & Media, Inc. - - - -Feb-18-2015 Did-it.com, LLC Bridge Global Strategies LLC - - - -Feb-18-2015 Atigeo, LLC Captimo, Inc. - - - -Feb-18-2015 - Crown Castle Australia Pty Ltd. $117.7 - - -Feb-18-2015 Criteo SA (NasdaqGS:CRTO) DataPop, Inc. - - - -Feb-18-2015 Apple Rock Advertising and Promotion, Inc. ExhibitCraft, Inc. - - - -
Acquirer
Feb-18-2015 Central European Media & Publishing Femina Média Kft. - - - -Feb-18-2015 NAHL Group plc (AIM:NAH) Fitzalan Partners Ltd - $6.6 - -Feb-18-2015 Check Point Software Technologies Ltd. (NasdaqGS:CHKP) Hyperwise Security Ltd. - - - -Feb-18-2015 auFeminin.com (ENXTPA:FEM) Livingly Media, Inc. $15.0 $50.0 3.3x -Feb-18-2015 Samsung Electronics America, Inc. LoopPay, Inc. - - - -Feb-18-2015 Match Marketing Group Inc. Magnet Engagement Group - - - -Feb-18-2015 ZetaDisplay AB (OM:ZETA) Market Media Oy - $2.3 - -Feb-18-2015 CompuGroup Medical AG (DB:COP) Medical EDI Services (Pty) Ltd. - - - -Feb-18-2015 CohereOne, Inc. Melasa Group LLC - - - -Feb-18-2015 Abila, Inc. Peach New Media, Inc. - - - -Feb-18-2015 GrowthPlay, LLC SSS Consulting, Inc. - - - -Feb-18-2015 Snow Software AB The Institution AB - - - -Feb-18-2015 - Vidmind Ltd - $2.4 - -Feb-18-2015 Syncsort Incorporated William Data Systems Ltd. - - - -Feb-18-2015 NewSpring Capital X5 Solutions, Inc. - - - -Feb-19-2015 DIMOCO Europe GmbH Amaze, Carrier Billing And Mobile Messaging Business - - - -Feb-19-2015 HitFox AppLift GmbH appiris GmbH - - - -Feb-19-2015 Visual Box S.r.l. Denuo Limited - - - -Feb-19-2015 Navent Group Dridco S.A. - - - -Feb-19-2015 Land O Lakes Inc. Farmer, Lumpe & Mcclelland Advertising Agency, Ltd. - - - -Feb-19-2015 Epicor Software Corporation Insite Software Solutions, Leading Shipping Solutions Business - - - -Feb-19-2015 Mobi724 Global Solutions Inc. (OTCPK:FPOT.F) iQ 7/24 Inc. - - - -Feb-19-2015 Wealth-X Pte. Ltd. Ledbury Research Limited - - - -Feb-19-2015 Global Telecom & Technology Americas, Inc. MegaPath Corporation, Managed Services Business $124.0 $152.4 1.2x 7.6xFeb-19-2015 DAQRI LLC Melon Technologies Inc. - - - -Feb-19-2015 Comexposium S.A. Mobile Motion, LLC - - - -
Copyright © 2015 by Software Equity Group, L.L.C., All Rights Reserved
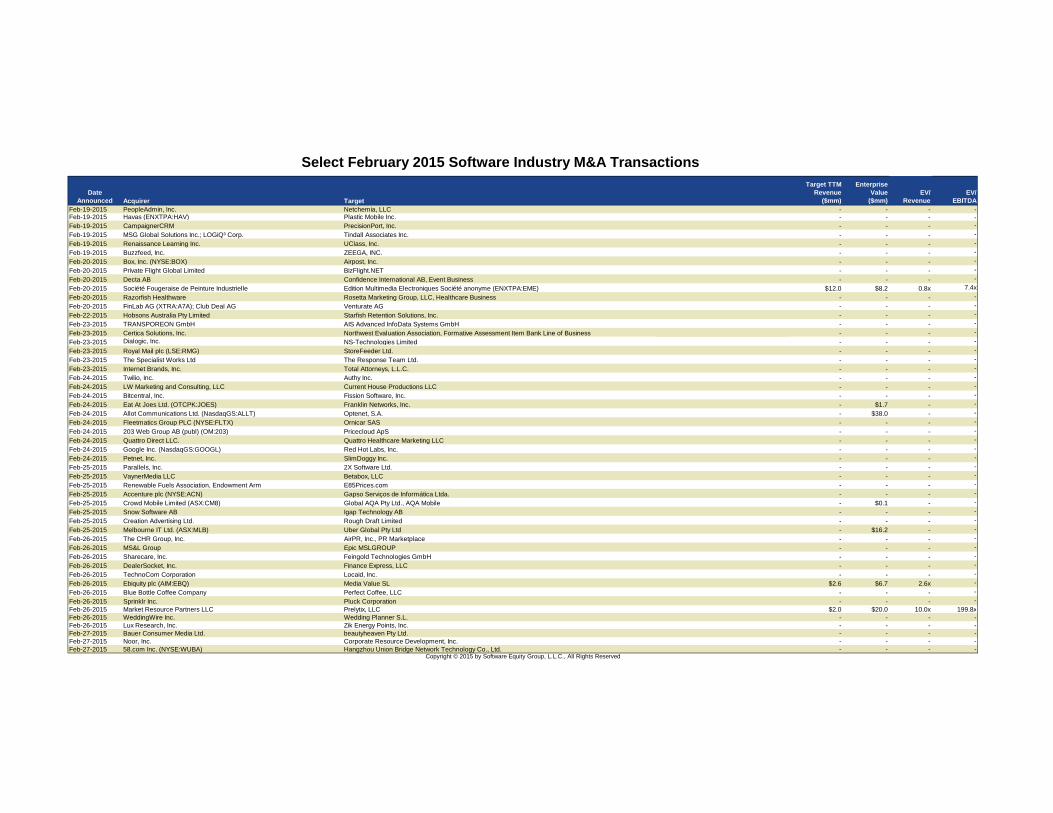
Select February 2015 Software Industry M&A Transactions
Date Announced Target
Target TTM Revenue
($mm)
Enterprise Value
($mm)EV/
RevenueEV/
EBITDAFeb-19-2015 PeopleAdmin, Inc. Netchemia, LLC - - - -Feb-19-2015 Havas (ENXTPA:HAV) Plastic Mobile Inc. - - - -Feb-19-2015 CampaignerCRM PrecisionPort, Inc. - - - -Feb-19-2015 MSG Global Solutions Inc.; LOGiQ³ Corp. Tindall Associates Inc. - - - -Feb-19-2015 Renaissance Learning Inc. UClass, Inc. - - - -Feb-19-2015 Buzzfeed, Inc. ZEEGA, INC. - - - -Feb-20-2015 Box, Inc. (NYSE:BOX) Airpost, Inc. - - - -Feb-20-2015 Private Flight Global Limited BizFlight.NET - - - -Feb-20-2015 Decta AB Confidence International AB, Event Business - - - -Feb-20-2015 Société Fougeraise de Peinture Industrielle Edition Multimedia Electroniques Société anonyme (ENXTPA:EME) $12.0 $8.2 0.8x 7.4xFeb-20-2015 Razorfish Healthware Rosetta Marketing Group, LLC, Healthcare Business - - - -Feb-20-2015 FinLab AG (XTRA:A7A); Club Deal AG Venturate AG - - - -Feb-22-2015 Hobsons Australia Pty Limited Starfish Retention Solutions, Inc. - - - -Feb-23-2015 TRANSPOREON GmbH AIS Advanced InfoData Systems GmbH - - - -Feb-23-2015 Certica Solutions, Inc. Northwest Evaluation Association, Formative Assessment Item Bank Line of Business - - - -Feb-23-2015 Dialogic, Inc. NS-Technologies Limited - - - -Feb-23-2015 Royal Mail plc (LSE:RMG) StoreFeeder Ltd. - - - -Feb-23-2015 The Specialist Works Ltd The Response Team Ltd. - - - -Feb-23-2015 Internet Brands, Inc. Total Attorneys, L.L.C. - - - -Feb-24-2015 Twilio, Inc. Authy Inc. - - - -Feb-24-2015 LW Marketing and Consulting, LLC Current House Productions LLC - - - -Feb-24-2015 Bitcentral, Inc. Fission Software, Inc. - - - -Feb-24-2015 Eat At Joes Ltd. (OTCPK:JOES) Franklin Networks, Inc. - $1.7 - -Feb-24-2015 Allot Communications Ltd. (NasdaqGS:ALLT) Optenet, S.A. - $38.0 - -Feb-24-2015 Fleetmatics Group PLC (NYSE:FLTX) Ornicar SAS - - - -
Acquirer
Feb-24-2015 203 Web Group AB (publ) (OM:203) Pricecloud ApS - - - -Feb-24-2015 Quattro Direct LLC. Quattro Healthcare Marketing LLC - - - -Feb-24-2015 Google Inc. (NasdaqGS:GOOGL) Red Hot Labs, Inc. - - - -Feb-24-2015 Petnet, Inc. SlimDoggy Inc. - - - -Feb-25-2015 Parallels, Inc. 2X Software Ltd. - - - -Feb-25-2015 VaynerMedia LLC Betabox, LLC - - - -Feb-25-2015 Renewable Fuels Association, Endowment Arm E85Prices.com - - - -Feb-25-2015 Accenture plc (NYSE:ACN) Gapso Serviços de Informática Ltda. - - - -Feb-25-2015 Crowd Mobile Limited (ASX:CM8) Global AQA Pty Ltd., AQA Mobile - $0.1 - -Feb-25-2015 Snow Software AB Igap Technology AB - - - -Feb-25-2015 Creation Advertising Ltd. Rough Draft Limited - - - -Feb-25-2015 Melbourne IT Ltd. (ASX:MLB) Uber Global Pty Ltd - $16.2 - -Feb-26-2015 The CHR Group, Inc. AirPR, Inc., PR Marketplace - - - -Feb-26-2015 MS&L Group Epic MSLGROUP - - - -Feb-26-2015 Sharecare, Inc. Feingold Technologies GmbH - - - -Feb-26-2015 DealerSocket, Inc. Finance Express, LLC - - - -Feb-26-2015 TechnoCom Corporation Locaid, Inc. - - - -Feb-26-2015 Ebiquity plc (AIM:EBQ) Media Value SL $2.6 $6.7 2.6x -Feb-26-2015 Blue Bottle Coffee Company Perfect Coffee, LLC - - - -Feb-26-2015 Sprinklr Inc. Pluck Corporation - - - -Feb-26-2015 Market Resource Partners LLC Prelytix, LLC $2.0 $20.0 10.0x 199.8xFeb-26-2015 WeddingWire Inc. Wedding Planner S.L. - - - -Feb-26-2015 Lux Research, Inc. Zik Energy Points, Inc. - - - -Feb-27-2015 Bauer Consumer Media Ltd. beautyheaven Pty Ltd. - - - -Feb-27-2015 Noor, Inc. Corporate Resource Development, Inc. - - - -Feb-27-2015 58.com Inc. (NYSE:WUBA) Hangzhou Union Bridge Network Technology Co., Ltd. - - - -
Copyright © 2015 by Software Equity Group, L.L.C., All Rights Reserved

Select February 2015 Software Industry M&A Transactions
Date Announced Target
Target TTM Revenue
($mm)
Enterprise Value
($mm)EV/
RevenueEV/
EBITDAFeb-27-2015 Kochava Inc. InferSystems Corporation - - - -Feb-27-2015 Eli Global, LLC IO Practiceware, Inc. - - - -
Acquirer
Copyright © 2015 by Software Equity Group, L.L.C., All Rights Reserved

Copyright © 2015 by Software Equity Group, L.L.C., All Rights Reserved
SEG Software Index
Select Software Industry M&A Transactions
SEG SaaS Index
SEG Internet Index
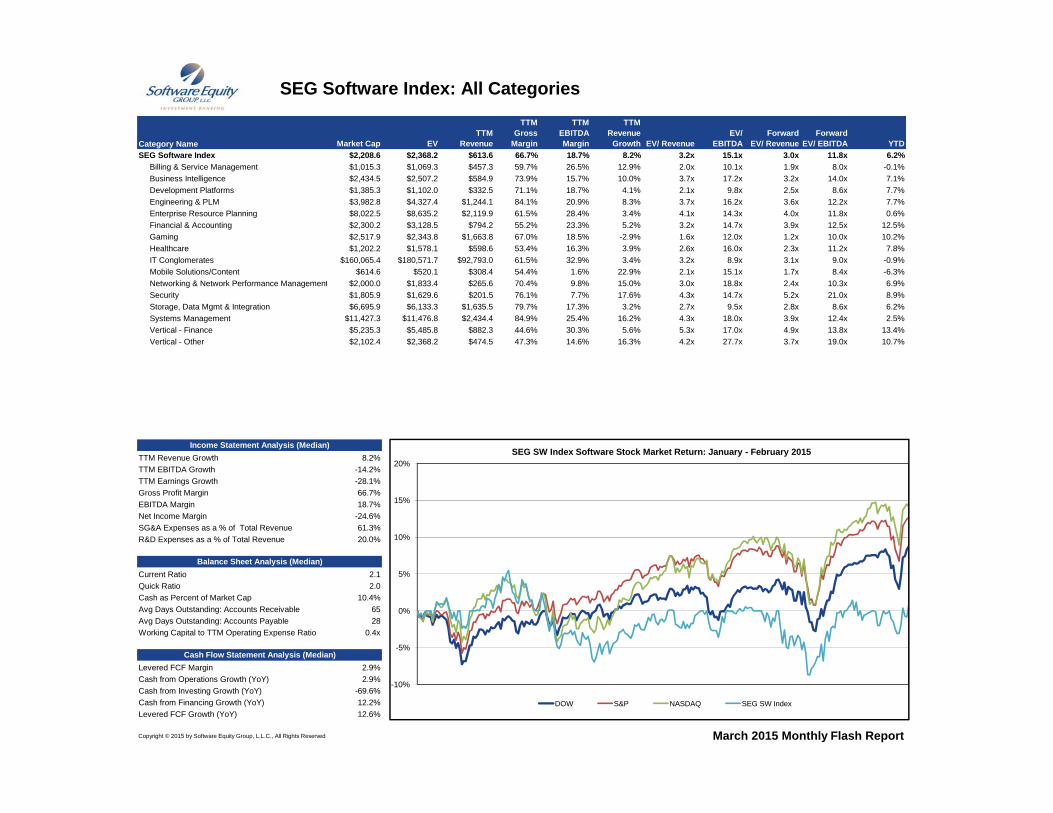
SEG Software Index: All Categories
Market Cap EVTTM
Revenue
TTM Gross
Margin
TTM EBITDA Margin
TTM Revenue
Growth EV/ RevenueEV/
EBITDAForward
EV/ RevenueForward
EV/ EBITDA YTDSEG Software Index $2,208.6 $2,368.2 $613.6 66.7% 18.7% 8.2% 3.2x 15.1x 3.0x 11.8x 6.2% Billing & Service Management $1,015.3 $1,069.3 $457.3 59.7% 26.5% 12.9% 2.0x 10.1x 1.9x 8.0x -0.1% Business Intelligence $2,434.5 $2,507.2 $584.9 73.9% 15.7% 10.0% 3.7x 17.2x 3.2x 14.0x 7.1% Development Platforms $1,385.3 $1,102.0 $332.5 71.1% 18.7% 4.1% 2.1x 9.8x 2.5x 8.6x 7.7% Engineering & PLM $3,982.8 $4,327.4 $1,244.1 84.1% 20.9% 8.3% 3.7x 16.2x 3.6x 12.2x 7.7% Enterprise Resource Planning $8,022.5 $8,635.2 $2,119.9 61.5% 28.4% 3.4% 4.1x 14.3x 4.0x 11.8x 0.6% Financial & Accounting $2,300.2 $3,128.5 $794.2 55.2% 23.3% 5.2% 3.2x 14.7x 3.9x 12.5x 12.5% Gaming $2,517.9 $2,343.8 $1,663.8 67.0% 18.5% -2.9% 1.6x 12.0x 1.2x 10.0x 10.2% Healthcare $1,202.2 $1,578.1 $598.6 53.4% 16.3% 3.9% 2.6x 16.0x 2.3x 11.2x 7.8% IT Conglomerates $160,065.4 $180,571.7 $92,793.0 61.5% 32.9% 3.4% 3.2x 8.9x 3.1x 9.0x -0.9% Mobile Solutions/Content $614.6 $520.1 $308.4 54.4% 1.6% 22.9% 2.1x 15.1x 1.7x 8.4x -6.3% Networking & Network Performance Management $2,000.0 $1,833.4 $265.6 70.4% 9.8% 15.0% 3.0x 18.8x 2.4x 10.3x 6.9% Security $1,805.9 $1,629.6 $201.5 76.1% 7.7% 17.6% 4.3x 14.7x 5.2x 21.0x 8.9% Storage, Data Mgmt & Integration $6,695.9 $6,133.3 $1,635.5 79.7% 17.3% 3.2% 2.7x 9.5x 2.8x 8.6x 6.2% Systems Management $11,427.3 $11,476.8 $2,434.4 84.9% 25.4% 16.2% 4.3x 18.0x 3.9x 12.4x 2.5% Vertical - Finance $5,235.3 $5,485.8 $882.3 44.6% 30.3% 5.6% 5.3x 17.0x 4.9x 13.8x 13.4% Vertical - Other $2,102.4 $2,368.2 $474.5 47.3% 14.6% 16.3% 4.2x 27.7x 3.7x 19.0x 10.7%
Category Name
TTM Revenue Growth 8.2%TTM EBITDA Growth -14.2%TTM Earnings Growth -28.1%Gross Profit Margin 66.7%EBITDA Margin 18.7%Net Income Margin -24.6%SG&A Expenses as a % of Total Revenue 61.3%R&D Expenses as a % of Total Revenue 20.0%
Current Ratio 2.1Quick Ratio 2.0Cash as Percent of Market Cap 10.4%Avg Days Outstanding: Accounts Receivable 65Avg Days Outstanding: Accounts Payable 28Working Capital to TTM Operating Expense Ratio 0.4x
Levered FCF Margin 2.9%Cash from Operations Growth (YoY) 2.9%Cash from Investing Growth (YoY) -69.6%Cash from Financing Growth (YoY) 12.2%Levered FCF Growth (YoY) 12.6%
Copyright © 2015 by Software Equity Group, L.L.C., All Rights Reserved March 2015 Monthly Flash Report
Income Statement Analysis (Median)
Balance Sheet Analysis (Median)
Cash Flow Statement Analysis (Median)
-10%
-5%
0%
5%
10%
15%
20%SEG SW Index Software Stock Market Return: January - February 2015
DOW S&P NASDAQ SEG SW Index
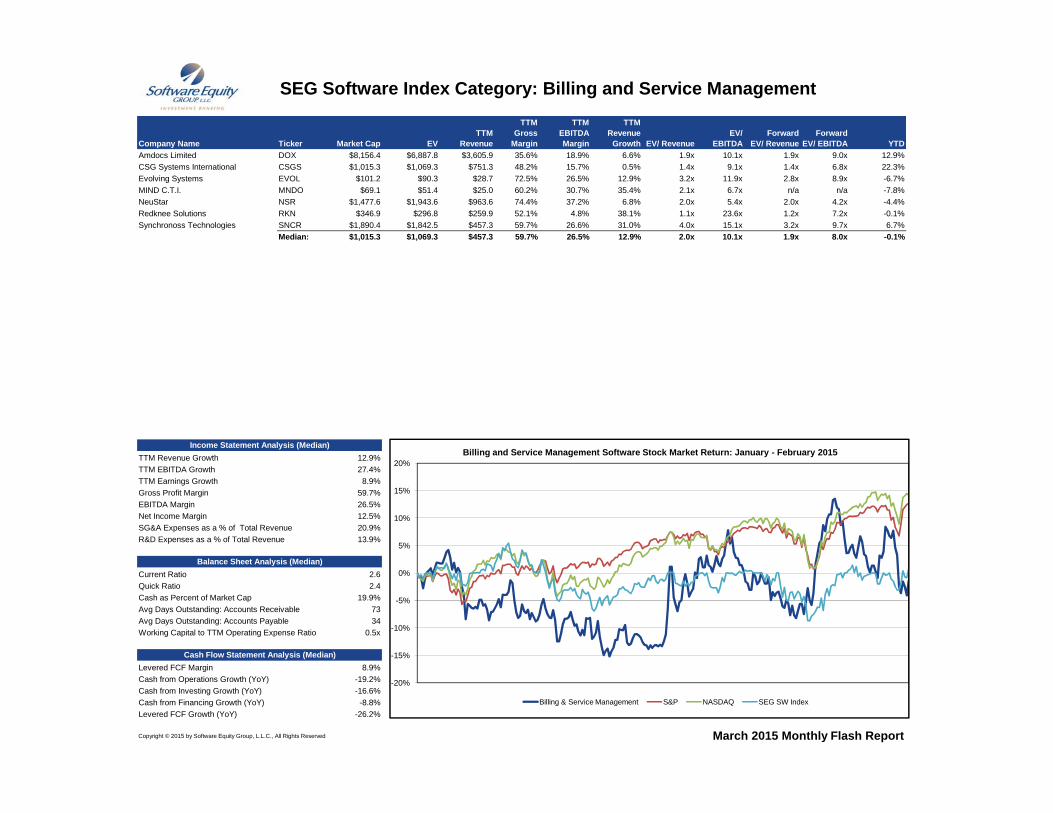
SEG Software Index Category: Billing and Service Management
Company Name Ticker Market Cap EVTTM
Revenue
TTM Gross
Margin
TTM EBITDA Margin
TTM Revenue
Growth EV/ RevenueEV/
EBITDAForward
EV/ RevenueForward
EV/ EBITDA YTDAmdocs Limited DOX $8,156.4 $6,887.8 $3,605.9 35.6% 18.9% 6.6% 1.9x 10.1x 1.9x 9.0x 12.9%CSG Systems International CSGS $1,015.3 $1,069.3 $751.3 48.2% 15.7% 0.5% 1.4x 9.1x 1.4x 6.8x 22.3%Evolving Systems EVOL $101.2 $90.3 $28.7 72.5% 26.5% 12.9% 3.2x 11.9x 2.8x 8.9x -6.7%MIND C.T.I. MNDO $69.1 $51.4 $25.0 60.2% 30.7% 35.4% 2.1x 6.7x n/a n/a -7.8%NeuStar NSR $1,477.6 $1,943.6 $963.6 74.4% 37.2% 6.8% 2.0x 5.4x 2.0x 4.2x -4.4%Redknee Solutions RKN $346.9 $296.8 $259.9 52.1% 4.8% 38.1% 1.1x 23.6x 1.2x 7.2x -0.1%Synchronoss Technologies SNCR $1,890.4 $1,842.5 $457.3 59.7% 26.6% 31.0% 4.0x 15.1x 3.2x 9.7x 6.7%
Median: $1,015.3 $1,069.3 $457.3 59.7% 26.5% 12.9% 2.0x 10.1x 1.9x 8.0x -0.1%
TTM Revenue Growth 12.9%TTM EBITDA Growth 27.4%TTM Earnings Growth 8.9%Gross Profit Margin 59.7%EBITDA Margin 26.5%Net Income Margin 12.5%SG&A Expenses as a % of Total Revenue 20.9%R&D Expenses as a % of Total Revenue 13.9%
Current Ratio 2.6Quick Ratio 2.4Cash as Percent of Market Cap 19.9%Avg Days Outstanding: Accounts Receivable 73Avg Days Outstanding: Accounts Payable 34Working Capital to TTM Operating Expense Ratio 0.5x
Levered FCF Margin 8.9%Cash from Operations Growth (YoY) -19.2%Cash from Investing Growth (YoY) -16.6%Cash from Financing Growth (YoY) -8.8%Levered FCF Growth (YoY) -26.2%
Copyright © 2015 by Software Equity Group, L.L.C., All Rights Reserved March 2015 Monthly Flash Report
Income Statement Analysis (Median)
Balance Sheet Analysis (Median)
Cash Flow Statement Analysis (Median)
-20%
-15%
-10%
-5%
0%
5%
10%
15%
20%Billing and Service Management Software Stock Market Return: January - February 2015
Billing & Service Management S&P NASDAQ SEG SW Index

SEG Software Index Category: Business Intelligence
Company Name Ticker Market Cap EVTTM
Revenue
TTM Gross
Margin
TTM EBITDA Margin
TTM Revenue
Growth EV/ RevenueEV/
EBITDAForward
EV/ RevenueForward
EV/ EBITDA YTDFair Isaac FICO $2,675.0 $3,187.3 $794.2 67.5% 23.3% 7.6% 4.0x 17.3x 3.8x 13.5x 17.9%Informatica INFA $4,699.6 $3,977.9 $1,048.0 82.4% 18.7% 10.5% 3.8x 20.3x 3.5x 14.7x 13.4%MicroStrategy MSTR $2,019.9 $1,674.4 $579.8 76.7% 6.9% 0.7% 2.9x 42.0x 2.9x 12.6x 9.3%Pegasystems PEGA $1,510.8 $1,299.6 $590.0 68.6% 12.8% 15.9% 2.2x 17.2x 2.0x 14.0x -2.8%Progress Software PRGS $1,385.3 $1,102.0 $332.5 90.6% 31.5% -0.4% 3.3x 10.5x 2.6x 8.7x 2.2%PROS Holdings PRO $711.1 $660.5 $185.8 68.7% -2.7% 28.3% 3.6x n/a 2.9x 21.8x -7.6%Qlik Technologies QLIK $2,949.2 $2,705.2 $556.8 86.4% 0.5% 18.4% 4.9x 947.5x 4.4x 46.3x 4.8%Software AG SOW $2,194.1 $2,309.2 $1,113.2 71.1% 24.2% -9.8% 2.1x 8.6x 2.4x 8.5x 12.7%Splunk SPLK $8,154.9 $7,304.8 $450.9 84.8% -45.1% 49.0% 16.2x n/a 12.1x 200.2x 14.4%Teradata TDC $6,811.6 $6,445.6 $2,732.0 54.1% 22.0% 1.5% 2.4x 10.7x 2.4x 9.7x 1.2%Varonis Systems VRNS $762.8 $651.0 $101.3 90.2% -15.8% 35.8% 6.4x n/a 4.9x n/a -6.7%Verisk VRSK $11,353.8 $12,747.5 $1,746.7 59.2% 45.2% 9.5% 7.3x 16.1x 6.8x 14.5x 12.3%
Median: $2,434.5 $2,507.2 $584.9 73.9% 15.7% 10.0% 3.7x 17.2x 3.2x 14.0x 7.1%
TTM Revenue Growth 10.0%TTM EBITDA Growth -5.1%TTM Earnings Growth -18.7%Gross Profit Margin 73.9%EBITDA Margin 15.7%Net Income Margin 8.3%SG&A Expenses as a % of Total Revenue 45.2%R&D Expenses as a % of Total Revenue 17.8%
Current Ratio 2.1Quick Ratio 1.9Cash as Percent of Market Cap 14.3%Avg Days Outstanding: Accounts Receivable 87Avg Days Outstanding: Accounts Payable 39Working Capital to TTM Operating Expense Ratio 0.4x
Levered FCF Margin 18.5%Cash from Operations Growth (YoY) 15.9%Cash from Investing Growth (YoY) -8.5%Cash from Financing Growth (YoY) -39.0%Levered FCF Growth (YoY) 2.7%
Copyright © 2015 by Software Equity Group, L.L.C., All Rights Reserved March 2015 Monthly Flash Report
Income Statement Analysis (Median)
Balance Sheet Analysis (Median)
Cash Flow Statement Analysis (Median)
-20%
-15%
-10%
-5%
0%
5%
10%
15%
20%Business Intelligence Software Stock Market Return: January - February 2015
Business Intelligence S&P NASDAQ SEG SW Index
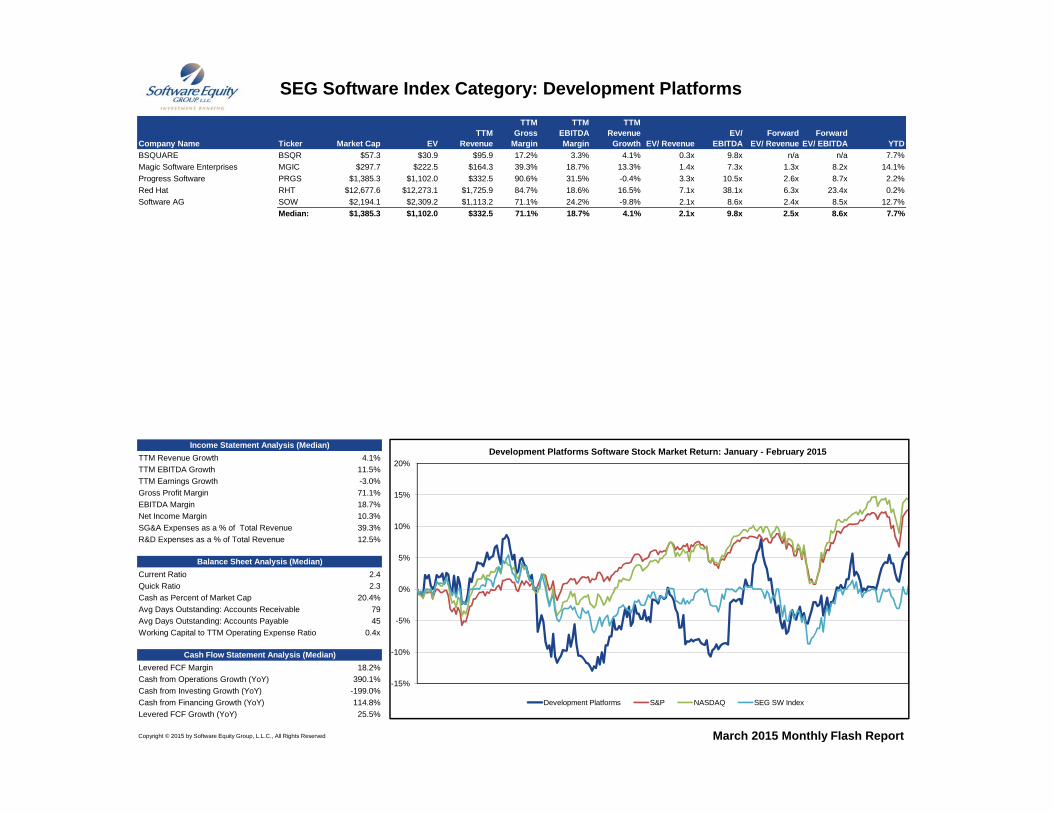
SEG Software Index Category: Development Platforms
Company Name Ticker Market Cap EVTTM
Revenue
TTM Gross
Margin
TTM EBITDA Margin
TTM Revenue
Growth EV/ RevenueEV/
EBITDAForward
EV/ RevenueForward
EV/ EBITDA YTDBSQUARE BSQR $57.3 $30.9 $95.9 17.2% 3.3% 4.1% 0.3x 9.8x n/a n/a 7.7%Magic Software Enterprises MGIC $297.7 $222.5 $164.3 39.3% 18.7% 13.3% 1.4x 7.3x 1.3x 8.2x 14.1%Progress Software PRGS $1,385.3 $1,102.0 $332.5 90.6% 31.5% -0.4% 3.3x 10.5x 2.6x 8.7x 2.2%Red Hat RHT $12,677.6 $12,273.1 $1,725.9 84.7% 18.6% 16.5% 7.1x 38.1x 6.3x 23.4x 0.2%Software AG SOW $2,194.1 $2,309.2 $1,113.2 71.1% 24.2% -9.8% 2.1x 8.6x 2.4x 8.5x 12.7%
Median: $1,385.3 $1,102.0 $332.5 71.1% 18.7% 4.1% 2.1x 9.8x 2.5x 8.6x 7.7%
TTM Revenue Growth 4.1%TTM EBITDA Growth 11.5%TTM Earnings Growth -3.0%Gross Profit Margin 71.1%EBITDA Margin 18.7%Net Income Margin 10.3%SG&A Expenses as a % of Total Revenue 39.3%R&D Expenses as a % of Total Revenue 12.5%
Current Ratio 2.4Quick Ratio 2.3Cash as Percent of Market Cap 20.4%Avg Days Outstanding: Accounts Receivable 79Avg Days Outstanding: Accounts Payable 45Working Capital to TTM Operating Expense Ratio 0.4x
Levered FCF Margin 18.2%Cash from Operations Growth (YoY) 390.1%Cash from Investing Growth (YoY) -199.0%Cash from Financing Growth (YoY) 114.8%Levered FCF Growth (YoY) 25.5%
Copyright © 2015 by Software Equity Group, L.L.C., All Rights Reserved March 2015 Monthly Flash Report
Income Statement Analysis (Median)
Balance Sheet Analysis (Median)
Cash Flow Statement Analysis (Median)
-15%
-10%
-5%
0%
5%
10%
15%
20%Development Platforms Software Stock Market Return: January - February 2015
Development Platforms S&P NASDAQ SEG SW Index
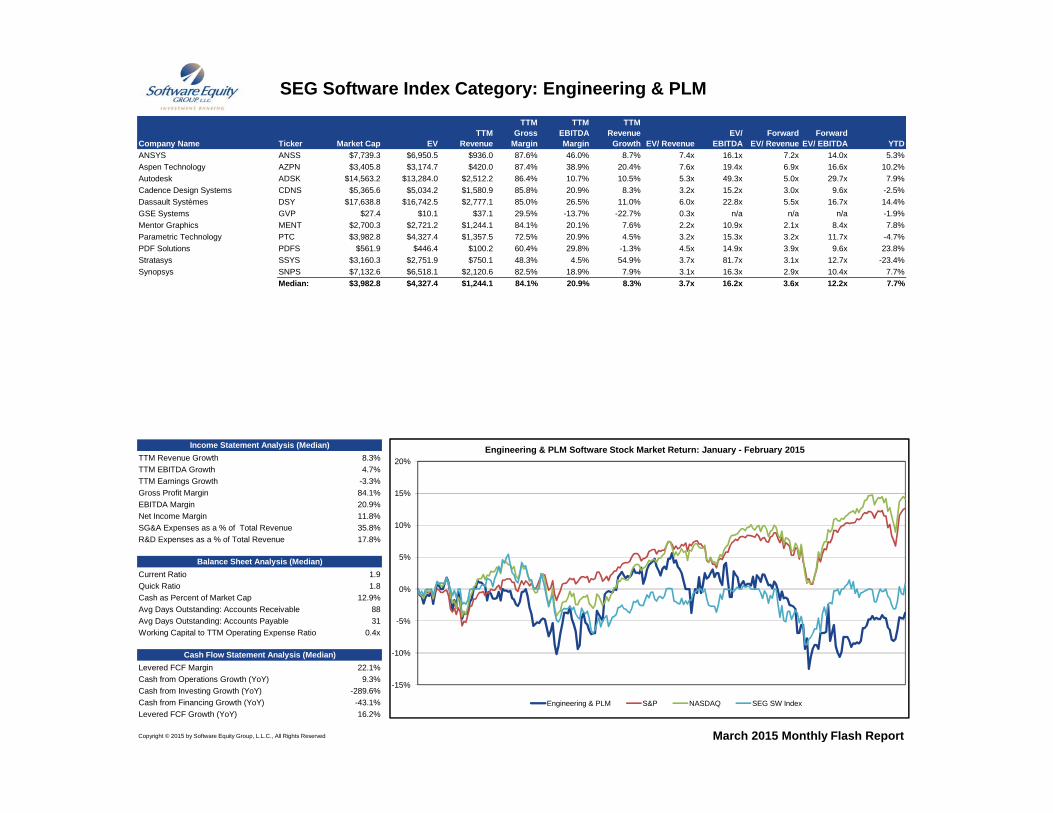
SEG Software Index Category: Engineering & PLM
Company Name Ticker Market Cap EVTTM
Revenue
TTM Gross
Margin
TTM EBITDA Margin
TTM Revenue
Growth EV/ RevenueEV/
EBITDAForward
EV/ RevenueForward
EV/ EBITDA YTDANSYS ANSS $7,739.3 $6,950.5 $936.0 87.6% 46.0% 8.7% 7.4x 16.1x 7.2x 14.0x 5.3%Aspen Technology AZPN $3,405.8 $3,174.7 $420.0 87.4% 38.9% 20.4% 7.6x 19.4x 6.9x 16.6x 10.2%Autodesk ADSK $14,563.2 $13,284.0 $2,512.2 86.4% 10.7% 10.5% 5.3x 49.3x 5.0x 29.7x 7.9%Cadence Design Systems CDNS $5,365.6 $5,034.2 $1,580.9 85.8% 20.9% 8.3% 3.2x 15.2x 3.0x 9.6x -2.5%Dassault Systèmes DSY $17,638.8 $16,742.5 $2,777.1 85.0% 26.5% 11.0% 6.0x 22.8x 5.5x 16.7x 14.4%GSE Systems GVP $27.4 $10.1 $37.1 29.5% -13.7% -22.7% 0.3x n/a n/a n/a -1.9%Mentor Graphics MENT $2,700.3 $2,721.2 $1,244.1 84.1% 20.1% 7.6% 2.2x 10.9x 2.1x 8.4x 7.8%Parametric Technology PTC $3,982.8 $4,327.4 $1,357.5 72.5% 20.9% 4.5% 3.2x 15.3x 3.2x 11.7x -4.7%PDF Solutions PDFS $561.9 $446.4 $100.2 60.4% 29.8% -1.3% 4.5x 14.9x 3.9x 9.6x 23.8%Stratasys SSYS $3,160.3 $2,751.9 $750.1 48.3% 4.5% 54.9% 3.7x 81.7x 3.1x 12.7x -23.4%Synopsys SNPS $7,132.6 $6,518.1 $2,120.6 82.5% 18.9% 7.9% 3.1x 16.3x 2.9x 10.4x 7.7%
Median: $3,982.8 $4,327.4 $1,244.1 84.1% 20.9% 8.3% 3.7x 16.2x 3.6x 12.2x 7.7%
TTM Revenue Growth 8.3%TTM EBITDA Growth 4.7%TTM Earnings Growth -3.3%Gross Profit Margin 84.1%EBITDA Margin 20.9%Net Income Margin 11.8%SG&A Expenses as a % of Total Revenue 35.8%R&D Expenses as a % of Total Revenue 17.8%
Current Ratio 1.9Quick Ratio 1.8Cash as Percent of Market Cap 12.9%Avg Days Outstanding: Accounts Receivable 88Avg Days Outstanding: Accounts Payable 31Working Capital to TTM Operating Expense Ratio 0.4x
Levered FCF Margin 22.1%Cash from Operations Growth (YoY) 9.3%Cash from Investing Growth (YoY) -289.6%Cash from Financing Growth (YoY) -43.1%Levered FCF Growth (YoY) 16.2%
Copyright © 2015 by Software Equity Group, L.L.C., All Rights Reserved March 2015 Monthly Flash Report
Income Statement Analysis (Median)
Balance Sheet Analysis (Median)
Cash Flow Statement Analysis (Median)
-15%
-10%
-5%
0%
5%
10%
15%
20%Engineering & PLM Software Stock Market Return: January - February 2015
Engineering & PLM S&P NASDAQ SEG SW Index

SEG Software Index Category: Enterprise Resource Planning
Company Name Ticker Market Cap EVTTM
Revenue
TTM Gross
Margin
TTM EBITDA Margin
TTM Revenue
Growth EV/ RevenueEV/
EBITDAForward
EV/ RevenueForward
EV/ EBITDA YTDAmerican Software AMSW.A $271.9 $214.6 $101.2 52.9% 13.1% 1.3% 2.1x 16.1x 1.9x 9.5x 8.5%Oracle ORCL $192,429.7 $180,571.7 $38,822.0 61.5% 43.6% 3.4% 4.7x 10.7x 4.5x 9.4x -0.9%QAD QADA $337.8 $281.6 $289.1 55.6% 6.5% 11.8% 1.0x 15.1x 0.9x 12.5x -6.3%Sage Group SGE $8,022.5 $8,635.2 $2,119.9 94.3% 28.4% -5.0% 4.1x 14.3x 4.0x 13.2x 5.9%SAP SAP $83,980.9 $88,274.2 $21,255.2 70.0% 32.9% 4.4% 4.2x 12.6x 4.1x 11.8x 0.6%
Median: $8,022.5 $8,635.2 $2,119.9 61.5% 28.4% 3.4% 4.1x 14.3x 4.0x 11.8x 0.6%
TTM Revenue Growth 3.4%TTM EBITDA Growth -7.9%TTM Earnings Growth -2.0%Gross Profit Margin 61.5%EBITDA Margin 28.4%Net Income Margin 14.3%SG&A Expenses as a % of Total Revenue 32.1%R&D Expenses as a % of Total Revenue 13.5%
Current Ratio 1.2Quick Ratio 1.0Cash as Percent of Market Cap 21.1%Avg Days Outstanding: Accounts Receivable 78Avg Days Outstanding: Accounts Payable 24Working Capital to TTM Operating Expense Ratio 0.1x
Levered FCF Margin 17.9%Cash from Operations Growth (YoY) -6.7%Cash from Investing Growth (YoY) -156.7%Cash from Financing Growth (YoY) 42.3%Levered FCF Growth (YoY) -1.1%
Copyright © 2015 by Software Equity Group, L.L.C., All Rights Reserved March 2015 Monthly Flash Report
Income Statement Analysis (Median)
Balance Sheet Analysis (Median)
Cash Flow Statement Analysis (Median)
-15%
-10%
-5%
0%
5%
10%
15%
20%Enterprise Resource Planning Software Stock Market Return: January - February 2015
Enterprise Resource Planning S&P NASDAQ SEG SW Index

SEG Software Index Category: Financial & Accounting
Company Name Ticker Market Cap EVTTM
Revenue
TTM Gross
Margin
TTM EBITDA Margin
TTM Revenue
Growth EV/ RevenueEV/
EBITDAForward
EV/ RevenueForward
EV/ EBITDA YTDACI Worldwide ACIW $2,300.2 $3,128.5 $1,016.1 55.2% 20.5% 17.5% 3.1x 15.0x 2.9x 11.2x 0.7%Bottomline Technologies EPAY $1,055.8 $1,022.7 $323.5 57.7% 12.6% 19.8% 3.2x 25.0x 2.9x 14.5x 4.5%DST Systems DST $3,943.8 $4,345.2 $2,749.3 16.5% 15.5% 3.4% 1.6x 10.2x 2.2x 9.5x 12.7%Evertec EVTC $1,625.7 $2,283.2 $361.1 56.7% 45.2% 1.1% 6.3x 14.0x 6.2x 12.2x -4.7%Fair Isaac FICO $2,675.0 $3,187.3 $794.2 67.5% 23.3% 7.6% 4.0x 17.3x 3.8x 13.5x 17.9%Fiserv FISV $18,634.8 $22,143.8 $5,066.0 43.1% 29.7% 5.2% 4.4x 14.7x 4.2x 12.5x 10.5%Intuit INTU $27,016.8 $26,148.8 $4,582.0 84.8% 30.6% 11.0% 5.7x 18.7x 5.8x 17.7x 7.3%Model N MODN $317.3 $220.9 $82.3 54.6% -23.9% -18.6% 2.7x n/a 2.4x n/a 16.5%NetSol Technologies NETSOL $37.9 $38.7 $25.8 5.3% -17.0% -9.6% 1.5x n/a n/a n/a 12.5%Sage Group SGE $8,022.5 $8,635.2 $2,119.9 94.3% 28.4% -5.0% 4.1x 14.3x 4.0x 13.2x 53.4%Qiwi QIWI $1,276.9 $898.3 $350.4 49.7% 30.8% 26.1% 2.6x 8.3x 6.2x 10.7x 14.9%
Median: $2,300.2 $3,128.5 $794.2 55.2% 23.3% 5.2% 3.2x 14.7x 3.9x 12.5x 12.5%
TTM Revenue Growth 5.2%TTM EBITDA Growth 6.8%TTM Earnings Growth 16.4%Gross Profit Margin 55.2%EBITDA Margin 23.3%Net Income Margin 14.3%SG&A Expenses as a % of Total Revenue 31.7%R&D Expenses as a % of Total Revenue 14.2%
Current Ratio 1.2Quick Ratio 0.9Cash as Percent of Market Cap 3.8%Avg Days Outstanding: Accounts Receivable 69Avg Days Outstanding: Accounts Payable 38Working Capital to TTM Operating Expense Ratio 0.1x
Levered FCF Margin 17.9%Cash from Operations Growth (YoY) 10.0%Cash from Investing Growth (YoY) 9.6%Cash from Financing Growth (YoY) -29.0%Levered FCF Growth (YoY) 2.4%
Copyright © 2015 by Software Equity Group, L.L.C., All Rights Reserved March 2015 Monthly Flash Report
Income Statement Analysis (Median)
Balance Sheet Analysis (Median)
Cash Flow Statement Analysis (Median)
-20%
-15%
-10%
-5%
0%
5%
10%
15%
20%Financial & Accounting Software Stock Market Return: January - February 2015
Financial & Accounting S&P NASDAQ SEG SW Index

SEG Software Index Category: Gaming
Company Name Ticker Market Cap EVTTM
Revenue
TTM Gross
Margin
TTM EBITDA Margin
TTM Revenue
Growth EV/ RevenueEV/
EBITDAForward
EV/ RevenueForward
EV/ EBITDA YTDActivision Blizzard ATVI $16,858.4 $16,324.4 $4,408.0 65.4% 28.9% -3.8% 3.7x 12.8x 3.7x 11.1x 15.8%Electronic Arts EA $17,779.3 $15,472.3 $4,453.0 68.5% 24.9% 21.6% 3.5x 14.0x 3.5x 12.4x 22.0%GameLoft SA GFT $375.7 $311.7 $322.0 82.6% 11.3% 5.7% 1.0x 8.6x 1.1x 12.9x 11.1%Konami TSE: 9766 $2,800.9 $2,654.1 $1,815.8 29.8% 12.2% -1.9% 1.5x 12.0x 1.3x 8.9x 9.3%Take-Two Interactive TTWO $2,234.9 $1,728.8 $978.1 46.8% -4.9% -60.2% 1.8x n/a 1.1x 7.4x -5.7%Ubisoft Entertainment UBI $1,984.2 $2,033.4 $1,511.8 74.9% 28.0% -5.7% 1.3x 4.8x 1.2x 2.9x 0.7%
Median: $2,517.9 $2,343.8 $1,663.8 67.0% 18.5% -2.9% 1.6x 12.0x 1.2x 10.0x 10.2%
TTM Revenue Growth -2.9%TTM EBITDA Growth -12.1%TTM Earnings Growth -22.0%Gross Profit Margin 67.0%EBITDA Margin 18.5%Net Income Margin 2.5%SG&A Expenses as a % of Total Revenue 26.5%R&D Expenses as a % of Total Revenue 24.7%
Current Ratio 2.5Quick Ratio 1.8Cash as Percent of Market Cap 19.7%Avg Days Outstanding: Accounts Receivable 41Avg Days Outstanding: Accounts Payable 71Working Capital to TTM Operating Expense Ratio 0.5x
Levered FCF Margin 6.7%Cash from Operations Growth (YoY) 17.1%Cash from Investing Growth (YoY) -74.1%Cash from Financing Growth (YoY) 12.8%Levered FCF Growth (YoY) 5.5%
Copyright © 2015 by Software Equity Group, L.L.C., All Rights Reserved March 2015 Monthly Flash Report
Income Statement Analysis (Median)
Balance Sheet Analysis (Median)
Cash Flow Statement Analysis (Median)
-20%
-15%
-10%
-5%
0%
5%
10%
15%
20%Gaming Software Stock Market Return: January - February 2015
Gaming S&P NASDAQ SEG SW Index
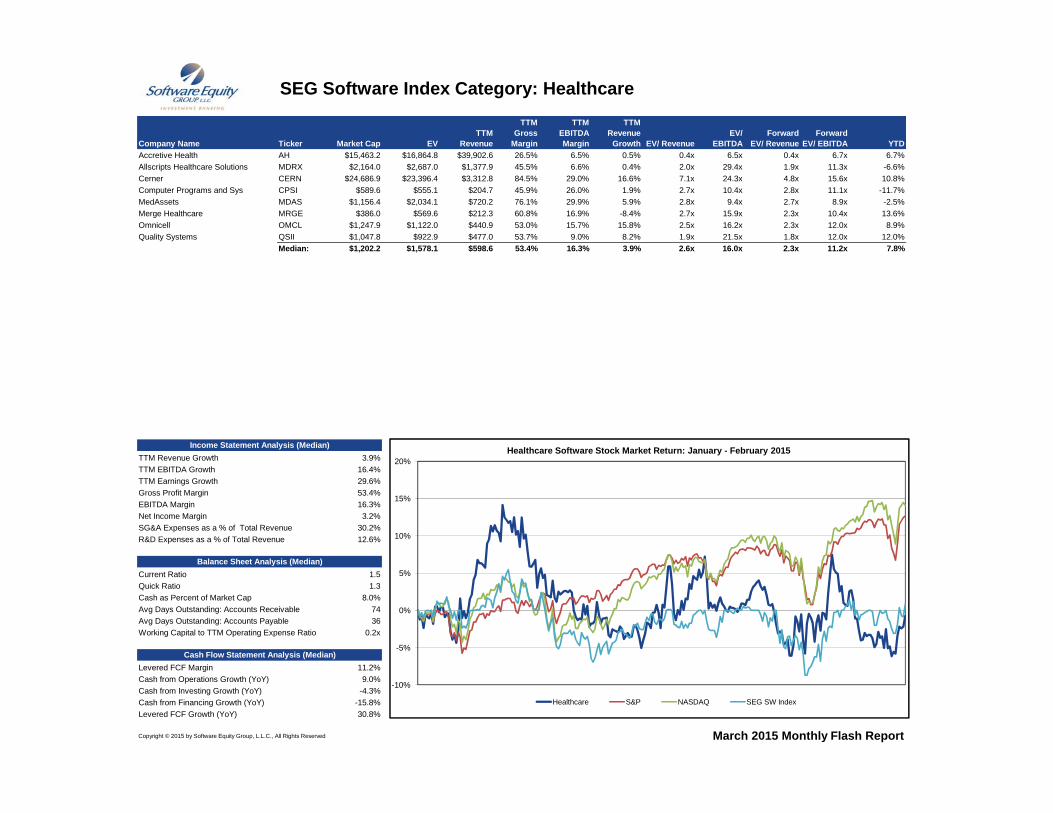
SEG Software Index Category: Healthcare
Company Name Ticker Market Cap EVTTM
Revenue
TTM Gross
Margin
TTM EBITDA Margin
TTM Revenue
Growth EV/ RevenueEV/
EBITDAForward
EV/ RevenueForward
EV/ EBITDA YTDAccretive Health AH $15,463.2 $16,864.8 $39,902.6 26.5% 6.5% 0.5% 0.4x 6.5x 0.4x 6.7x 6.7%Allscripts Healthcare Solutions MDRX $2,164.0 $2,687.0 $1,377.9 45.5% 6.6% 0.4% 2.0x 29.4x 1.9x 11.3x -6.6%Cerner CERN $24,686.9 $23,396.4 $3,312.8 84.5% 29.0% 16.6% 7.1x 24.3x 4.8x 15.6x 10.8%Computer Programs and Sys CPSI $589.6 $555.1 $204.7 45.9% 26.0% 1.9% 2.7x 10.4x 2.8x 11.1x -11.7%MedAssets MDAS $1,156.4 $2,034.1 $720.2 76.1% 29.9% 5.9% 2.8x 9.4x 2.7x 8.9x -2.5%Merge Healthcare MRGE $386.0 $569.6 $212.3 60.8% 16.9% -8.4% 2.7x 15.9x 2.3x 10.4x 13.6%Omnicell OMCL $1,247.9 $1,122.0 $440.9 53.0% 15.7% 15.8% 2.5x 16.2x 2.3x 12.0x 8.9%Quality Systems QSII $1,047.8 $922.9 $477.0 53.7% 9.0% 8.2% 1.9x 21.5x 1.8x 12.0x 12.0%
Median: $1,202.2 $1,578.1 $598.6 53.4% 16.3% 3.9% 2.6x 16.0x 2.3x 11.2x 7.8%
TTM Revenue Growth 3.9%TTM EBITDA Growth 16.4%TTM Earnings Growth 29.6%Gross Profit Margin 53.4%EBITDA Margin 16.3%Net Income Margin 3.2%SG&A Expenses as a % of Total Revenue 30.2%R&D Expenses as a % of Total Revenue 12.6%
Current Ratio 1.5Quick Ratio 1.3Cash as Percent of Market Cap 8.0%Avg Days Outstanding: Accounts Receivable 74Avg Days Outstanding: Accounts Payable 36Working Capital to TTM Operating Expense Ratio 0.2x
Levered FCF Margin 11.2%Cash from Operations Growth (YoY) 9.0%Cash from Investing Growth (YoY) -4.3%Cash from Financing Growth (YoY) -15.8%Levered FCF Growth (YoY) 30.8%
Copyright © 2015 by Software Equity Group, L.L.C., All Rights Reserved March 2015 Monthly Flash Report
Income Statement Analysis (Median)
Balance Sheet Analysis (Median)
Cash Flow Statement Analysis (Median)
-10%
-5%
0%
5%
10%
15%
20%Healthcare Software Stock Market Return: January - February 2015
Healthcare S&P NASDAQ SEG SW Index
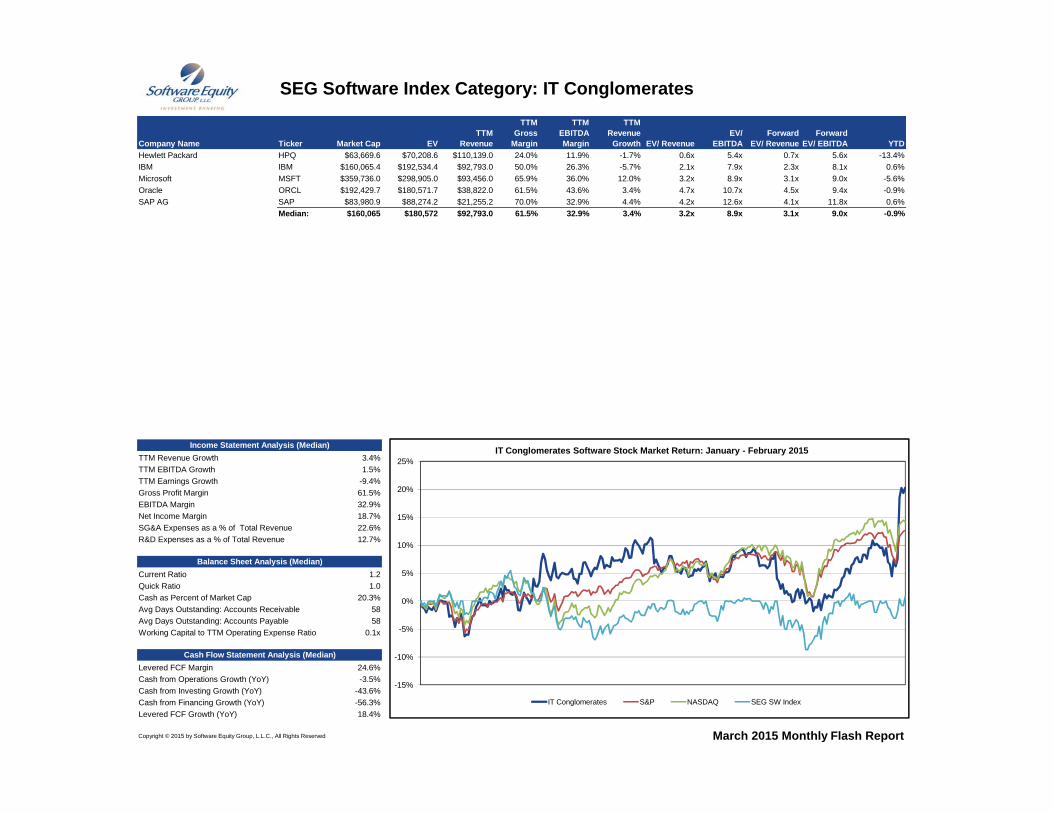
SEG Software Index Category: IT Conglomerates
Company Name Ticker Market Cap EVTTM
Revenue
TTM Gross
Margin
TTM EBITDA Margin
TTM Revenue
Growth EV/ RevenueEV/
EBITDAForward
EV/ RevenueForward
EV/ EBITDA YTDHewlett Packard HPQ $63,669.6 $70,208.6 $110,139.0 24.0% 11.9% -1.7% 0.6x 5.4x 0.7x 5.6x -13.4%IBM IBM $160,065.4 $192,534.4 $92,793.0 50.0% 26.3% -5.7% 2.1x 7.9x 2.3x 8.1x 0.6%Microsoft MSFT $359,736.0 $298,905.0 $93,456.0 65.9% 36.0% 12.0% 3.2x 8.9x 3.1x 9.0x -5.6%Oracle ORCL $192,429.7 $180,571.7 $38,822.0 61.5% 43.6% 3.4% 4.7x 10.7x 4.5x 9.4x -0.9%SAP AG SAP $83,980.9 $88,274.2 $21,255.2 70.0% 32.9% 4.4% 4.2x 12.6x 4.1x 11.8x 0.6%
Median: $160,065 $180,572 $92,793.0 61.5% 32.9% 3.4% 3.2x 8.9x 3.1x 9.0x -0.9%
TTM Revenue Growth 3.4%TTM EBITDA Growth 1.5%TTM Earnings Growth -9.4%Gross Profit Margin 61.5%EBITDA Margin 32.9%Net Income Margin 18.7%SG&A Expenses as a % of Total Revenue 22.6%R&D Expenses as a % of Total Revenue 12.7%
Current Ratio 1.2Quick Ratio 1.0Cash as Percent of Market Cap 20.3%Avg Days Outstanding: Accounts Receivable 58Avg Days Outstanding: Accounts Payable 58Working Capital to TTM Operating Expense Ratio 0.1x
Levered FCF Margin 24.6%Cash from Operations Growth (YoY) -3.5%Cash from Investing Growth (YoY) -43.6%Cash from Financing Growth (YoY) -56.3%Levered FCF Growth (YoY) 18.4%
Copyright © 2015 by Software Equity Group, L.L.C., All Rights Reserved March 2015 Monthly Flash Report
Income Statement Analysis (Median)
Balance Sheet Analysis (Median)
Cash Flow Statement Analysis (Median)
-15%
-10%
-5%
0%
5%
10%
15%
20%
25%IT Conglomerates Software Stock Market Return: January - February 2015
IT Conglomerates S&P NASDAQ SEG SW Index
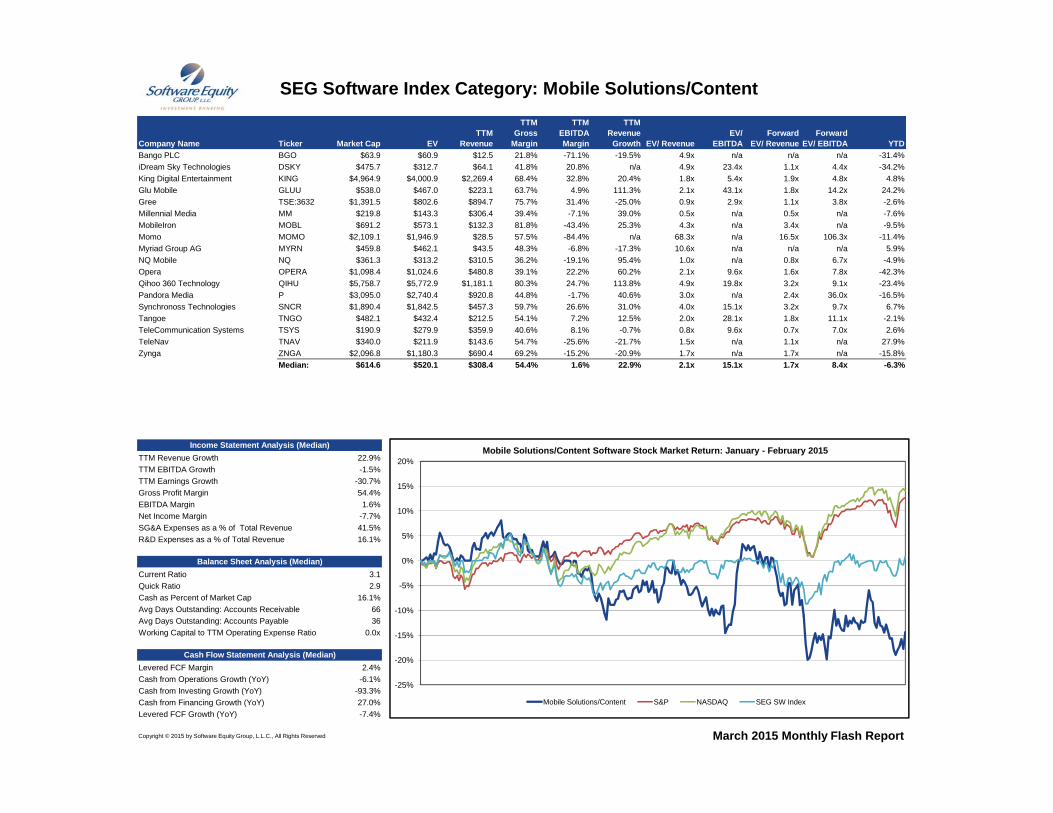
SEG Software Index Category: Mobile Solutions/Content
Company Name Ticker Market Cap EVTTM
Revenue
TTM Gross
Margin
TTM EBITDA Margin
TTM Revenue
Growth EV/ RevenueEV/
EBITDAForward
EV/ RevenueForward
EV/ EBITDA YTDBango PLC BGO $63.9 $60.9 $12.5 21.8% -71.1% -19.5% 4.9x n/a n/a n/a -31.4%iDream Sky Technologies DSKY $475.7 $312.7 $64.1 41.8% 20.8% n/a 4.9x 23.4x 1.1x 4.4x -34.2%King Digital Entertainment KING $4,964.9 $4,000.9 $2,269.4 68.4% 32.8% 20.4% 1.8x 5.4x 1.9x 4.8x 4.8%Glu Mobile GLUU $538.0 $467.0 $223.1 63.7% 4.9% 111.3% 2.1x 43.1x 1.8x 14.2x 24.2%Gree TSE:3632 $1,391.5 $802.6 $894.7 75.7% 31.4% -25.0% 0.9x 2.9x 1.1x 3.8x -2.6%Millennial Media MM $219.8 $143.3 $306.4 39.4% -7.1% 39.0% 0.5x n/a 0.5x n/a -7.6%MobileIron MOBL $691.2 $573.1 $132.3 81.8% -43.4% 25.3% 4.3x n/a 3.4x n/a -9.5%Momo MOMO $2,109.1 $1,946.9 $28.5 57.5% -84.4% n/a 68.3x n/a 16.5x 106.3x -11.4%Myriad Group AG MYRN $459.8 $462.1 $43.5 48.3% -6.8% -17.3% 10.6x n/a n/a n/a 5.9%NQ Mobile NQ $361.3 $313.2 $310.5 36.2% -19.1% 95.4% 1.0x n/a 0.8x 6.7x -4.9%Opera OPERA $1,098.4 $1,024.6 $480.8 39.1% 22.2% 60.2% 2.1x 9.6x 1.6x 7.8x -42.3%Qihoo 360 Technology QIHU $5,758.7 $5,772.9 $1,181.1 80.3% 24.7% 113.8% 4.9x 19.8x 3.2x 9.1x -23.4%Pandora Media P $3,095.0 $2,740.4 $920.8 44.8% -1.7% 40.6% 3.0x n/a 2.4x 36.0x -16.5%Synchronoss Technologies SNCR $1,890.4 $1,842.5 $457.3 59.7% 26.6% 31.0% 4.0x 15.1x 3.2x 9.7x 6.7%Tangoe TNGO $482.1 $432.4 $212.5 54.1% 7.2% 12.5% 2.0x 28.1x 1.8x 11.1x -2.1%TeleCommunication Systems TSYS $190.9 $279.9 $359.9 40.6% 8.1% -0.7% 0.8x 9.6x 0.7x 7.0x 2.6%TeleNav TNAV $340.0 $211.9 $143.6 54.7% -25.6% -21.7% 1.5x n/a 1.1x n/a 27.9%Zynga ZNGA $2,096.8 $1,180.3 $690.4 69.2% -15.2% -20.9% 1.7x n/a 1.7x n/a -15.8%
Median: $614.6 $520.1 $308.4 54.4% 1.6% 22.9% 2.1x 15.1x 1.7x 8.4x -6.3%
TTM Revenue Growth 22.9%TTM EBITDA Growth -1.5%TTM Earnings Growth -30.7%Gross Profit Margin 54.4%EBITDA Margin 1.6%Net Income Margin -7.7%SG&A Expenses as a % of Total Revenue 41.5%R&D Expenses as a % of Total Revenue 16.1%
Current Ratio 3.1Quick Ratio 2.9Cash as Percent of Market Cap 16.1%Avg Days Outstanding: Accounts Receivable 66Avg Days Outstanding: Accounts Payable 36Working Capital to TTM Operating Expense Ratio 0.0x
Levered FCF Margin 2.4%Cash from Operations Growth (YoY) -6.1%Cash from Investing Growth (YoY) -93.3%Cash from Financing Growth (YoY) 27.0%Levered FCF Growth (YoY) -7.4%
Copyright © 2015 by Software Equity Group, L.L.C., All Rights Reserved March 2015 Monthly Flash Report
Income Statement Analysis (Median)
Balance Sheet Analysis (Median)
Cash Flow Statement Analysis (Median)
-25%
-20%
-15%
-10%
-5%
0%
5%
10%
15%
20%Mobile Solutions/Content Software Stock Market Return: January - February 2015
Mobile Solutions/Content S&P NASDAQ SEG SW Index
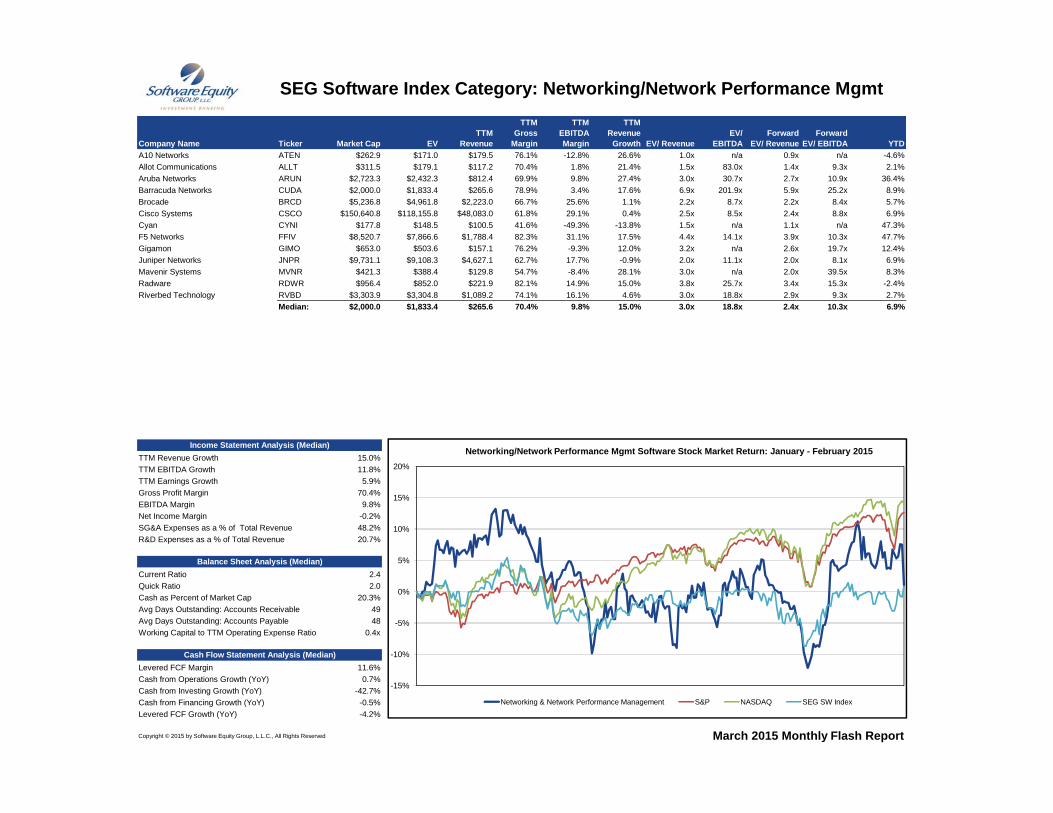
SEG Software Index Category: Networking/Network Performance Mgmt
Company Name Ticker Market Cap EVTTM
Revenue
TTM Gross
Margin
TTM EBITDA Margin
TTM Revenue
Growth EV/ RevenueEV/
EBITDAForward
EV/ RevenueForward
EV/ EBITDA YTDA10 Networks ATEN $262.9 $171.0 $179.5 76.1% -12.8% 26.6% 1.0x n/a 0.9x n/a -4.6%Allot Communications ALLT $311.5 $179.1 $117.2 70.4% 1.8% 21.4% 1.5x 83.0x 1.4x 9.3x 2.1%Aruba Networks ARUN $2,723.3 $2,432.3 $812.4 69.9% 9.8% 27.4% 3.0x 30.7x 2.7x 10.9x 36.4%Barracuda Networks CUDA $2,000.0 $1,833.4 $265.6 78.9% 3.4% 17.6% 6.9x 201.9x 5.9x 25.2x 8.9%Brocade BRCD $5,236.8 $4,961.8 $2,223.0 66.7% 25.6% 1.1% 2.2x 8.7x 2.2x 8.4x 5.7%Cisco Systems CSCO $150,640.8 $118,155.8 $48,083.0 61.8% 29.1% 0.4% 2.5x 8.5x 2.4x 8.8x 6.9%Cyan CYNI $177.8 $148.5 $100.5 41.6% -49.3% -13.8% 1.5x n/a 1.1x n/a 47.3%F5 Networks FFIV $8,520.7 $7,866.6 $1,788.4 82.3% 31.1% 17.5% 4.4x 14.1x 3.9x 10.3x 47.7%Gigamon GIMO $653.0 $503.6 $157.1 76.2% -9.3% 12.0% 3.2x n/a 2.6x 19.7x 12.4%Juniper Networks JNPR $9,731.1 $9,108.3 $4,627.1 62.7% 17.7% -0.9% 2.0x 11.1x 2.0x 8.1x 6.9%Mavenir Systems MVNR $421.3 $388.4 $129.8 54.7% -8.4% 28.1% 3.0x n/a 2.0x 39.5x 8.3%Radware RDWR $956.4 $852.0 $221.9 82.1% 14.9% 15.0% 3.8x 25.7x 3.4x 15.3x -2.4%Riverbed Technology RVBD $3,303.9 $3,304.8 $1,089.2 74.1% 16.1% 4.6% 3.0x 18.8x 2.9x 9.3x 2.7%
Median: $2,000.0 $1,833.4 $265.6 70.4% 9.8% 15.0% 3.0x 18.8x 2.4x 10.3x 6.9%
TTM Revenue Growth 15.0%TTM EBITDA Growth 11.8%TTM Earnings Growth 5.9%Gross Profit Margin 70.4%EBITDA Margin 9.8%Net Income Margin -0.2%SG&A Expenses as a % of Total Revenue 48.2%R&D Expenses as a % of Total Revenue 20.7%
Current Ratio 2.4Quick Ratio 2.0Cash as Percent of Market Cap 20.3%Avg Days Outstanding: Accounts Receivable 49Avg Days Outstanding: Accounts Payable 48Working Capital to TTM Operating Expense Ratio 0.4x
Levered FCF Margin 11.6%Cash from Operations Growth (YoY) 0.7%Cash from Investing Growth (YoY) -42.7%Cash from Financing Growth (YoY) -0.5%Levered FCF Growth (YoY) -4.2%
Copyright © 2015 by Software Equity Group, L.L.C., All Rights Reserved
Income Statement Analysis (Median)
Balance Sheet Analysis (Median)
Cash Flow Statement Analysis (Median)
March 2015 Monthly Flash Report
-15%
-10%
-5%
0%
5%
10%
15%
20%
Networking/Network Performance Mgmt Software Stock Market Return: January - February 2015
Networking & Network Performance Management S&P NASDAQ SEG SW Index

SEG Software Index Category: Security
Company Name Ticker Market Cap EVTTM
Revenue
TTM Gross
Margin
TTM EBITDA Margin
TTM Revenue
Growth EV/ RevenueEV/
EBITDAForward
EV/ RevenueForward
EV/ EBITDA YTDAVG Technologies AVG $1,164.2 $1,290.2 $374.1 86.1% 30.2% -8.1% 3.4x 11.4x 3.1x 8.2x 15.3%Barracuda Networks CUDA $2,000.0 $1,833.4 $265.6 78.9% 3.4% 17.6% 6.9x 201.9x 5.9x 25.2x 8.9%Cyberark Software CYBR $1,805.9 $1,629.6 $103.0 85.7% 20.6% 55.7% 15.8x 76.9x 12.3x 118.9x 52.4%Check Point Software Tech CHKP $15,929.1 $14,616.6 $1,495.8 88.2% 54.3% 7.3% 9.8x 18.0x 9.0x 16.1x 6.4%A10 Networks ATEN $262.9 $171.0 $179.5 76.1% -12.8% 26.6% 1.0x n/a 0.9x n/a -4.6%Cyren CYRN $87.8 $81.6 $31.9 74.6% -12.4% -1.0% 2.6x n/a 2.1x n/a 63.7%Fortinet FTNT $5,540.8 $4,820.8 $770.4 70.0% 10.6% 25.2% 6.3x 59.3x 5.2x 31.8x 9.2%Guidance Software GUID $175.7 $157.5 $108.7 66.9% -5.3% -1.7% 1.4x n/a 1.4x 92.8x -16.3%Imperva IMPV $1,225.6 $1,115.8 $164.0 77.8% -32.2% 19.1% 6.8x n/a 5.6x n/a -4.9%Palo Alto Networks PANW $11,455.3 $11,155.6 $738.9 72.8% -10.4% 53.0% 15.1x n/a 12.3x 74.0x 17.1%Proofpoint PFPT $2,208.6 $2,156.0 $195.6 66.4% -16.4% 41.8% 11.0x n/a 8.7x n/a 19.3%Sourcefire FIRE $12.4 $12.8 $17.1 32.1% 7.7% 10.3% 0.7x 9.8x n/a n/a -0.8%Symantec SYMC $17,168.7 $15,523.7 $6,615.0 83.4% 29.0% -2.7% 2.3x 8.1x n/a 7.1x -1.1%Trend Micro TSE:4704 $4,582.8 $3,434.3 $961.6 82.3% 35.8% 6.4% 3.6x 10.0x 3.3x 9.6x 22.3%VASCO VDSI $1,005.4 $868.0 $201.5 63.4% 20.0% 30.0% 4.3x n/a 3.8x 16.8x -6.2%
Median: $1,805.9 $1,629.6 $201.5 76.1% 7.7% 17.6% 4.3x 14.7x 5.2x 21.0x 8.9%
TTM Revenue Growth 17.6%TTM EBITDA Growth -6.0%TTM Earnings Growth -0.1%Gross Profit Margin 76.1%EBITDA Margin 7.7%Net Income Margin 3.3%SG&A Expenses as a % of Total Revenue 51.9%R&D Expenses as a % of Total Revenue 19.6%
Current Ratio 1.9Quick Ratio 1.8Cash as Percent of Market Cap 10.4%Avg Days Outstanding: Accounts Receivable 66Avg Days Outstanding: Accounts Payable 52Working Capital to TTM Operating Expense Ratio 0.4x
Levered FCF Margin 12.3%Cash from Operations Growth (YoY) 4.5%Cash from Investing Growth (YoY) -91.4%Cash from Financing Growth (YoY) 111.7%Levered FCF Growth (YoY) -1.7%
Copyright © 2015 by Software Equity Group, L.L.C., All Rights Reserved March 2015 Monthly Flash Report
Income Statement Analysis (Median)
Balance Sheet Analysis (Median)
Cash Flow Statement Analysis (Median)
-10%
-5%
0%
5%
10%
15%
20%Security Software Stock Market Return: January - February 2015
Security S&P NASDAQ SEG SW Index
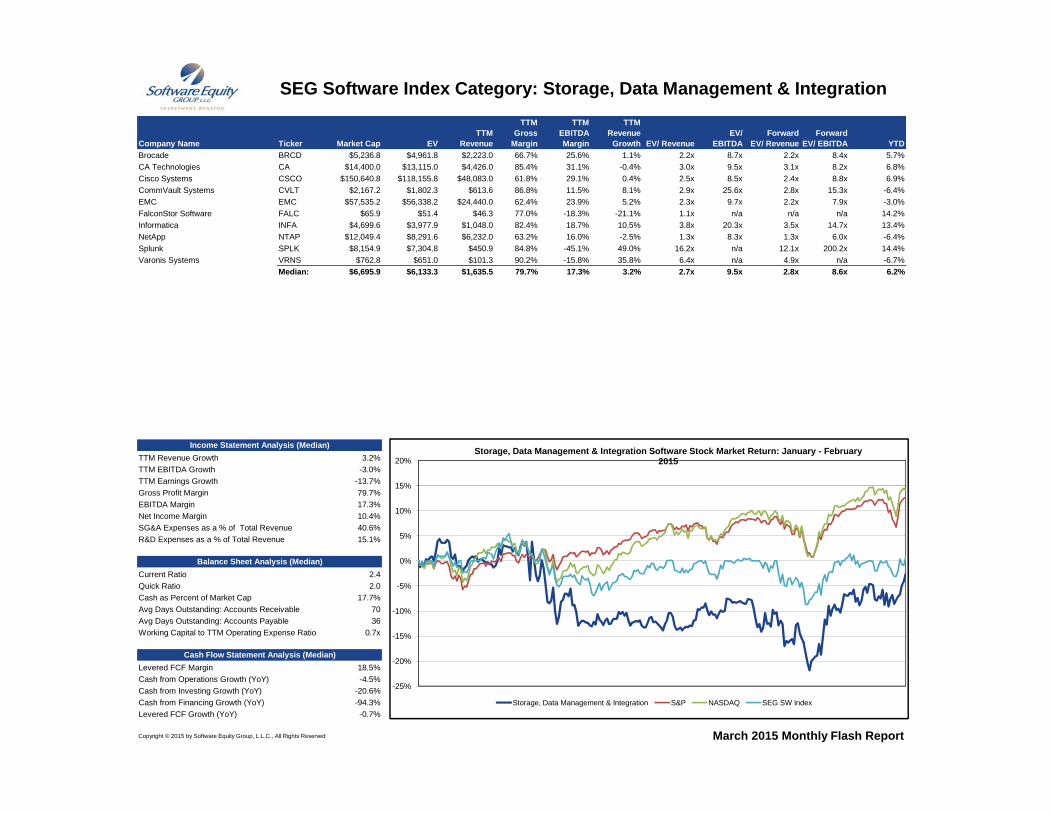
SEG Software Index Category: Storage, Data Management & Integration
Company Name Ticker Market Cap EVTTM
Revenue
TTM Gross
Margin
TTM EBITDA Margin
TTM Revenue
Growth EV/ RevenueEV/
EBITDAForward
EV/ RevenueForward
EV/ EBITDA YTDBrocade BRCD $5,236.8 $4,961.8 $2,223.0 66.7% 25.6% 1.1% 2.2x 8.7x 2.2x 8.4x 5.7%CA Technologies CA $14,400.0 $13,115.0 $4,426.0 85.4% 31.1% -0.4% 3.0x 9.5x 3.1x 8.2x 6.8%Cisco Systems CSCO $150,640.8 $118,155.8 $48,083.0 61.8% 29.1% 0.4% 2.5x 8.5x 2.4x 8.8x 6.9%CommVault Systems CVLT $2,167.2 $1,802.3 $613.6 86.8% 11.5% 8.1% 2.9x 25.6x 2.8x 15.3x -6.4%EMC EMC $57,535.2 $56,338.2 $24,440.0 62.4% 23.9% 5.2% 2.3x 9.7x 2.2x 7.9x -3.0%FalconStor Software FALC $65.9 $51.4 $46.3 77.0% -18.3% -21.1% 1.1x n/a n/a n/a 14.2%Informatica INFA $4,699.6 $3,977.9 $1,048.0 82.4% 18.7% 10.5% 3.8x 20.3x 3.5x 14.7x 13.4%NetApp NTAP $12,049.4 $8,291.6 $6,232.0 63.2% 16.0% -2.5% 1.3x 8.3x 1.3x 6.0x -6.4%Splunk SPLK $8,154.9 $7,304.8 $450.9 84.8% -45.1% 49.0% 16.2x n/a 12.1x 200.2x 14.4%Varonis Systems VRNS $762.8 $651.0 $101.3 90.2% -15.8% 35.8% 6.4x n/a 4.9x n/a -6.7%
Median: $6,695.9 $6,133.3 $1,635.5 79.7% 17.3% 3.2% 2.7x 9.5x 2.8x 8.6x 6.2%
TTM Revenue Growth 3.2%TTM EBITDA Growth -3.0%TTM Earnings Growth -13.7%Gross Profit Margin 79.7%EBITDA Margin 17.3%Net Income Margin 10.4%SG&A Expenses as a % of Total Revenue 40.6%R&D Expenses as a % of Total Revenue 15.1%
Current Ratio 2.4Quick Ratio 2.0Cash as Percent of Market Cap 17.7%Avg Days Outstanding: Accounts Receivable 70Avg Days Outstanding: Accounts Payable 36Working Capital to TTM Operating Expense Ratio 0.7x
Levered FCF Margin 18.5%Cash from Operations Growth (YoY) -4.5%Cash from Investing Growth (YoY) -20.6%Cash from Financing Growth (YoY) -94.3%Levered FCF Growth (YoY) -0.7%
Copyright © 2015 by Software Equity Group, L.L.C., All Rights Reserved
Income Statement Analysis (Median)
Balance Sheet Analysis (Median)
Cash Flow Statement Analysis (Median)
March 2015 Monthly Flash Report
-25%
-20%
-15%
-10%
-5%
0%
5%
10%
15%
20%Storage, Data Management & Integration Software Stock Market Return: January - February
2015
Storage, Data Management & Integration S&P NASDAQ SEG SW Index
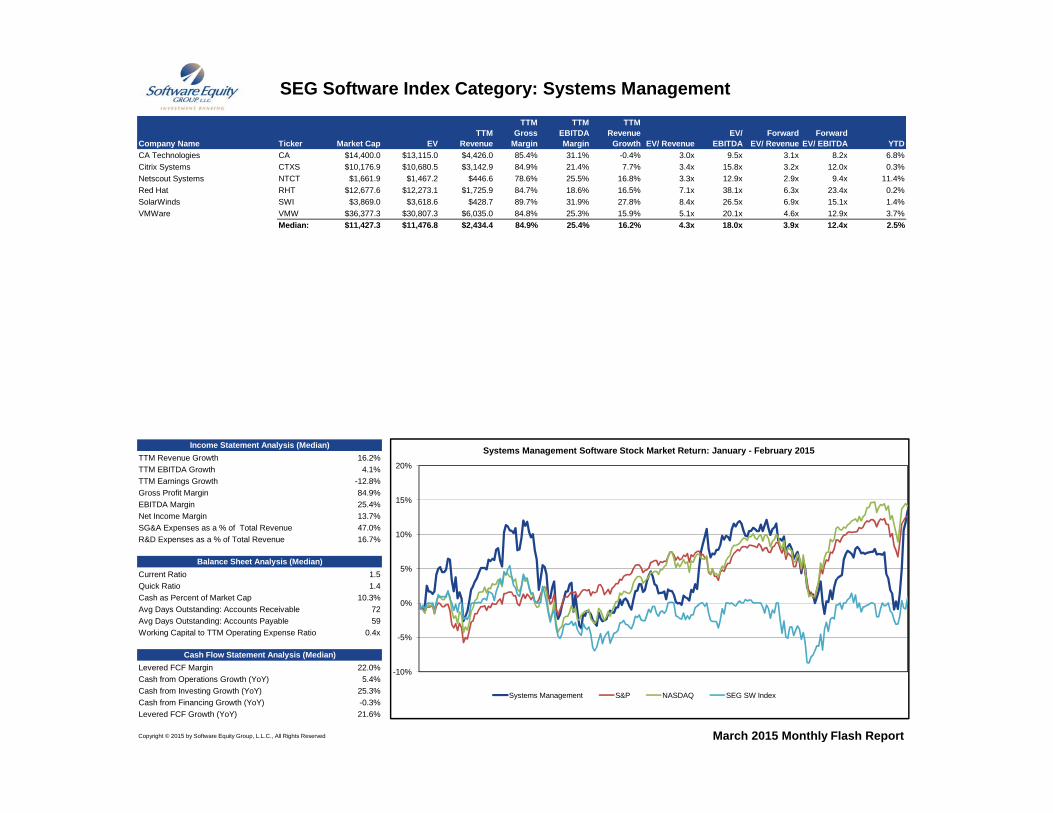
SEG Software Index Category: Systems Management
Company Name Ticker Market Cap EVTTM
Revenue
TTM Gross
Margin
TTM EBITDA Margin
TTM Revenue
Growth EV/ RevenueEV/
EBITDAForward
EV/ RevenueForward
EV/ EBITDA YTDCA Technologies CA $14,400.0 $13,115.0 $4,426.0 85.4% 31.1% -0.4% 3.0x 9.5x 3.1x 8.2x 6.8%Citrix Systems CTXS $10,176.9 $10,680.5 $3,142.9 84.9% 21.4% 7.7% 3.4x 15.8x 3.2x 12.0x 0.3%Netscout Systems NTCT $1,661.9 $1,467.2 $446.6 78.6% 25.5% 16.8% 3.3x 12.9x 2.9x 9.4x 11.4%Red Hat RHT $12,677.6 $12,273.1 $1,725.9 84.7% 18.6% 16.5% 7.1x 38.1x 6.3x 23.4x 0.2%SolarWinds SWI $3,869.0 $3,618.6 $428.7 89.7% 31.9% 27.8% 8.4x 26.5x 6.9x 15.1x 1.4%VMWare VMW $36,377.3 $30,807.3 $6,035.0 84.8% 25.3% 15.9% 5.1x 20.1x 4.6x 12.9x 3.7%
Median: $11,427.3 $11,476.8 $2,434.4 84.9% 25.4% 16.2% 4.3x 18.0x 3.9x 12.4x 2.5%
TTM Revenue Growth 16.2%TTM EBITDA Growth 4.1%TTM Earnings Growth -12.8%Gross Profit Margin 84.9%EBITDA Margin 25.4%Net Income Margin 13.7%SG&A Expenses as a % of Total Revenue 47.0%R&D Expenses as a % of Total Revenue 16.7%
Current Ratio 1.5Quick Ratio 1.4Cash as Percent of Market Cap 10.3%Avg Days Outstanding: Accounts Receivable 72Avg Days Outstanding: Accounts Payable 59Working Capital to TTM Operating Expense Ratio 0.4x
Levered FCF Margin 22.0%Cash from Operations Growth (YoY) 5.4%Cash from Investing Growth (YoY) 25.3%Cash from Financing Growth (YoY) -0.3%Levered FCF Growth (YoY) 21.6%
Copyright © 2015 by Software Equity Group, L.L.C., All Rights Reserved March 2015 Monthly Flash Report
Income Statement Analysis (Median)
Balance Sheet Analysis (Median)
Cash Flow Statement Analysis (Median)
-10%
-5%
0%
5%
10%
15%
20%
Systems Management Software Stock Market Return: January - February 2015
Systems Management S&P NASDAQ SEG SW Index

SEG Software Index Category: Vertical - Finance
Company Name Ticker Market Cap EVTTM
Revenue
TTM Gross
Margin
TTM EBITDA Margin
TTM Revenue
Growth EV/ RevenueEV/
EBITDAForward
EV/ RevenueForward
EV/ EBITDA YTDAdvent Software ADVS $2,312.3 $2,496.2 $396.8 72.1% 25.9% 3.6% 6.3x 24.3x 5.9x 17.4x 46.5%Broadridge Financial BR $6,433.5 $6,643.6 $2,622.6 31.4% 19.9% 4.6% 2.5x 12.7x 2.4x 10.6x 16.7%Fidessa FDSA $1,365.1 $1,246.5 $428.6 20.5% 18.2% -1.4% 2.9x 16.0x 2.7x 12.0x -4.1%Jack Henry & Associates JKHY $5,356.3 $5,327.9 $1,254.8 42.8% 34.6% 6.5% 4.2x 12.3x 4.0x 11.3x 5.7%MSCI MSCI $7,139.1 $7,430.3 $996.7 69.0% 41.3% 9.1% 7.5x 18.0x 6.9x 16.7x 18.0%SS&C SSNC $5,114.3 $5,643.6 $767.9 46.5% 38.9% 7.7% 7.3x 18.9x 6.5x 15.6x 10.0%
Median: $5,235.3 $5,485.8 $882.3 44.6% 30.3% 5.6% 5.3x 17.0x 4.9x 13.8x 13.4%
TTM Revenue Growth 5.6%TTM EBITDA Growth 7.2%TTM Earnings Growth 8.8%Gross Profit Margin 44.6%EBITDA Margin 30.3%Net Income Margin 14.7%SG&A Expenses as a % of Total Revenue 14.2%R&D Expenses as a % of Total Revenue 7.5%
Current Ratio 1.5Quick Ratio 1.4Cash as Percent of Market Cap 3.5%Avg Days Outstanding: Accounts Receivable 63Avg Days Outstanding: Accounts Payable 9Working Capital to TTM Operating Expense Ratio 0.2x
Levered FCF Margin 24.5%Cash from Operations Growth (YoY) 16.9%Cash from Investing Growth (YoY) -30.7%Cash from Financing Growth (YoY) 25.5%Levered FCF Growth (YoY) 20.8%
Copyright © 2015 by Software Equity Group, L.L.C., All Rights Reserved
Cash Flow Statement Analysis (Median)
March 2015 Monthly Flash Report
Income Statement Analysis (Median)
Balance Sheet Analysis (Median)
-15%
-10%
-5%
0%
5%
10%
15%
20%Vertical - Finance Software Stock Market Return:January - February 2015
Vertical - Finance S&P NASDAQ SEG SW Index
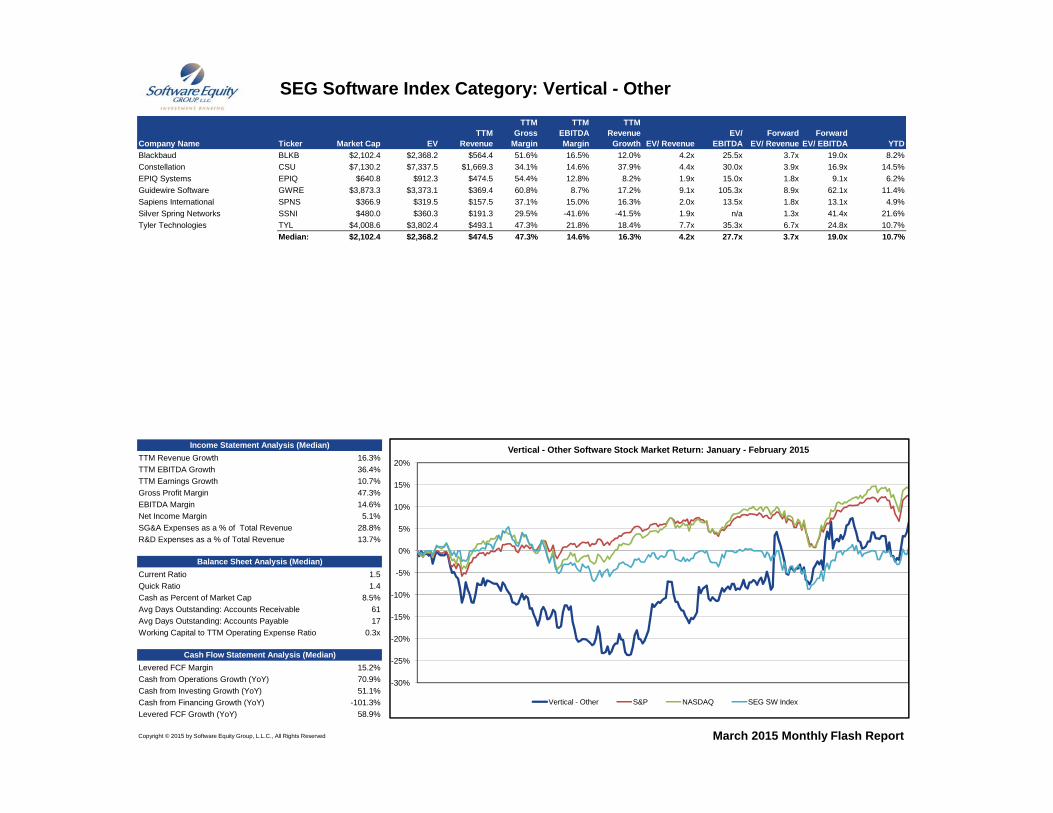
SEG Software Index Category: Vertical - Other
Company Name Ticker Market Cap EVTTM
Revenue
TTM Gross
Margin
TTM EBITDA Margin
TTM Revenue
Growth EV/ RevenueEV/
EBITDAForward
EV/ RevenueForward
EV/ EBITDA YTDBlackbaud BLKB $2,102.4 $2,368.2 $564.4 51.6% 16.5% 12.0% 4.2x 25.5x 3.7x 19.0x 8.2%Constellation CSU $7,130.2 $7,337.5 $1,669.3 34.1% 14.6% 37.9% 4.4x 30.0x 3.9x 16.9x 14.5%EPIQ Systems EPIQ $640.8 $912.3 $474.5 54.4% 12.8% 8.2% 1.9x 15.0x 1.8x 9.1x 6.2%Guidewire Software GWRE $3,873.3 $3,373.1 $369.4 60.8% 8.7% 17.2% 9.1x 105.3x 8.9x 62.1x 11.4%Sapiens International SPNS $366.9 $319.5 $157.5 37.1% 15.0% 16.3% 2.0x 13.5x 1.8x 13.1x 4.9%Silver Spring Networks SSNI $480.0 $360.3 $191.3 29.5% -41.6% -41.5% 1.9x n/a 1.3x 41.4x 21.6%Tyler Technologies TYL $4,008.6 $3,802.4 $493.1 47.3% 21.8% 18.4% 7.7x 35.3x 6.7x 24.8x 10.7%
Median: $2,102.4 $2,368.2 $474.5 47.3% 14.6% 16.3% 4.2x 27.7x 3.7x 19.0x 10.7%
TTM Revenue Growth 16.3%TTM EBITDA Growth 36.4%TTM Earnings Growth 10.7%Gross Profit Margin 47.3%EBITDA Margin 14.6%Net Income Margin 5.1%SG&A Expenses as a % of Total Revenue 28.8%R&D Expenses as a % of Total Revenue 13.7%
Current Ratio 1.5Quick Ratio 1.4Cash as Percent of Market Cap 8.5%Avg Days Outstanding: Accounts Receivable 61Avg Days Outstanding: Accounts Payable 17Working Capital to TTM Operating Expense Ratio 0.3x
Levered FCF Margin 15.2%Cash from Operations Growth (YoY) 70.9%Cash from Investing Growth (YoY) 51.1%Cash from Financing Growth (YoY) -101.3%Levered FCF Growth (YoY) 58.9%
Copyright © 2015 by Software Equity Group, L.L.C., All Rights Reserved March 2015 Monthly Flash Report
Balance Sheet Analysis (Median)
Cash Flow Statement Analysis (Median)
Income Statement Analysis (Median)
-30%
-25%
-20%
-15%
-10%
-5%
0%
5%
10%
15%
20%Vertical - Other Software Stock Market Return: January - February 2015
Vertical - Other S&P NASDAQ SEG SW Index
Copyright © 2015 by Software Equity Group, L.L.C., All Rights Reserved
SEG Software Index
Select Software Industry M&A Transactions
SEG SaaS Index
SEG Internet Index
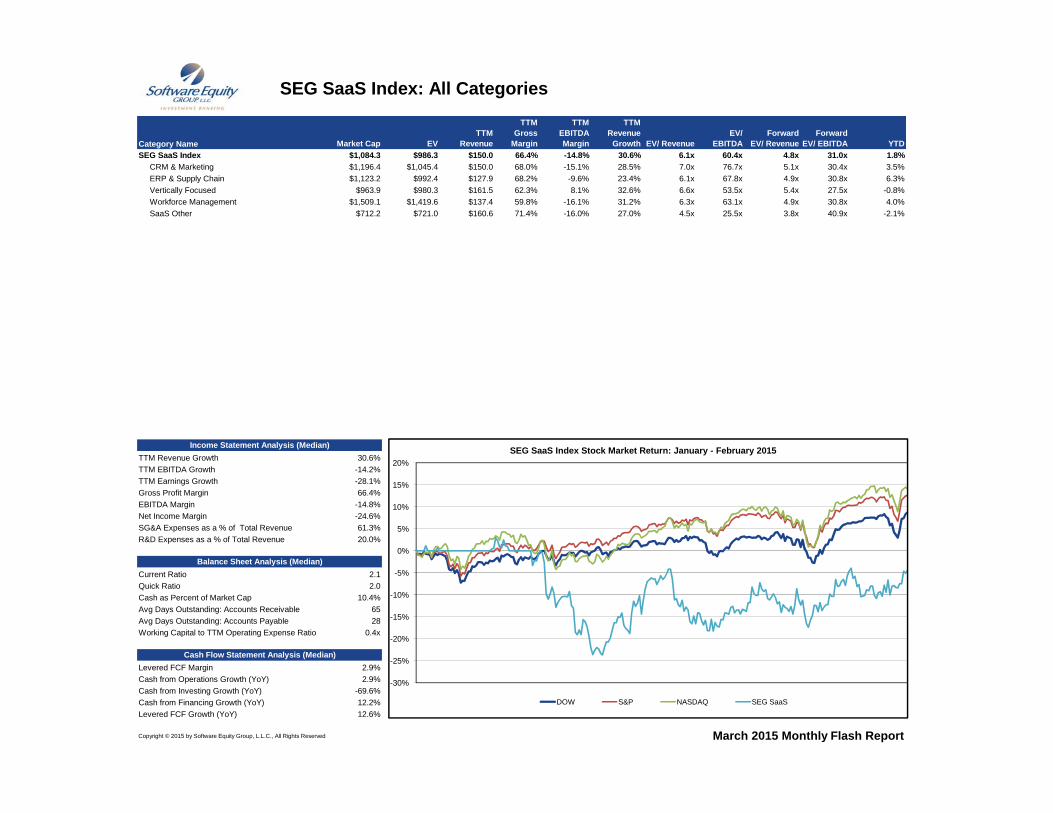
SEG SaaS Index: All Categories
Market Cap EVTTM
Revenue
TTM Gross
Margin
TTM EBITDA Margin
TTM Revenue
Growth EV/ RevenueEV/
EBITDAForward
EV/ RevenueForward
EV/ EBITDA YTDSEG SaaS Index $1,084.3 $986.3 $150.0 66.4% -14.8% 30.6% 6.1x 60.4x 4.8x 31.0x 1.8% CRM & Marketing $1,196.4 $1,045.4 $150.0 68.0% -15.1% 28.5% 7.0x 76.7x 5.1x 30.4x 3.5% ERP & Supply Chain $1,123.2 $992.4 $127.9 68.2% -9.6% 23.4% 6.1x 67.8x 4.9x 30.8x 6.3% Vertically Focused $963.9 $980.3 $161.5 62.3% 8.1% 32.6% 6.6x 53.5x 5.4x 27.5x -0.8% Workforce Management $1,509.1 $1,419.6 $137.4 59.8% -16.1% 31.2% 6.3x 63.1x 4.9x 30.8x 4.0% SaaS Other $712.2 $721.0 $160.6 71.4% -16.0% 27.0% 4.5x 25.5x 3.8x 40.9x -2.1%
Category Name
TTM Revenue Growth 30.6%TTM EBITDA Growth -14.2%TTM Earnings Growth -28.1%Gross Profit Margin 66.4%EBITDA Margin -14.8%Net Income Margin -24.6%SG&A Expenses as a % of Total Revenue 61.3%R&D Expenses as a % of Total Revenue 20.0%
Current Ratio 2.1Quick Ratio 2.0Cash as Percent of Market Cap 10.4%Avg Days Outstanding: Accounts Receivable 65Avg Days Outstanding: Accounts Payable 28Working Capital to TTM Operating Expense Ratio 0.4x
Levered FCF Margin 2.9%Cash from Operations Growth (YoY) 2.9%Cash from Investing Growth (YoY) -69.6%Cash from Financing Growth (YoY) 12.2%Levered FCF Growth (YoY) 12.6%
Copyright © 2015 by Software Equity Group, L.L.C., All Rights Reserved March 2015 Monthly Flash Report
Income Statement Analysis (Median)
Balance Sheet Analysis (Median)
Cash Flow Statement Analysis (Median)
-30%
-25%
-20%
-15%
-10%
-5%
0%
5%
10%
15%
20%SEG SaaS Index Stock Market Return: January - February 2015
DOW S&P NASDAQ SEG SaaS
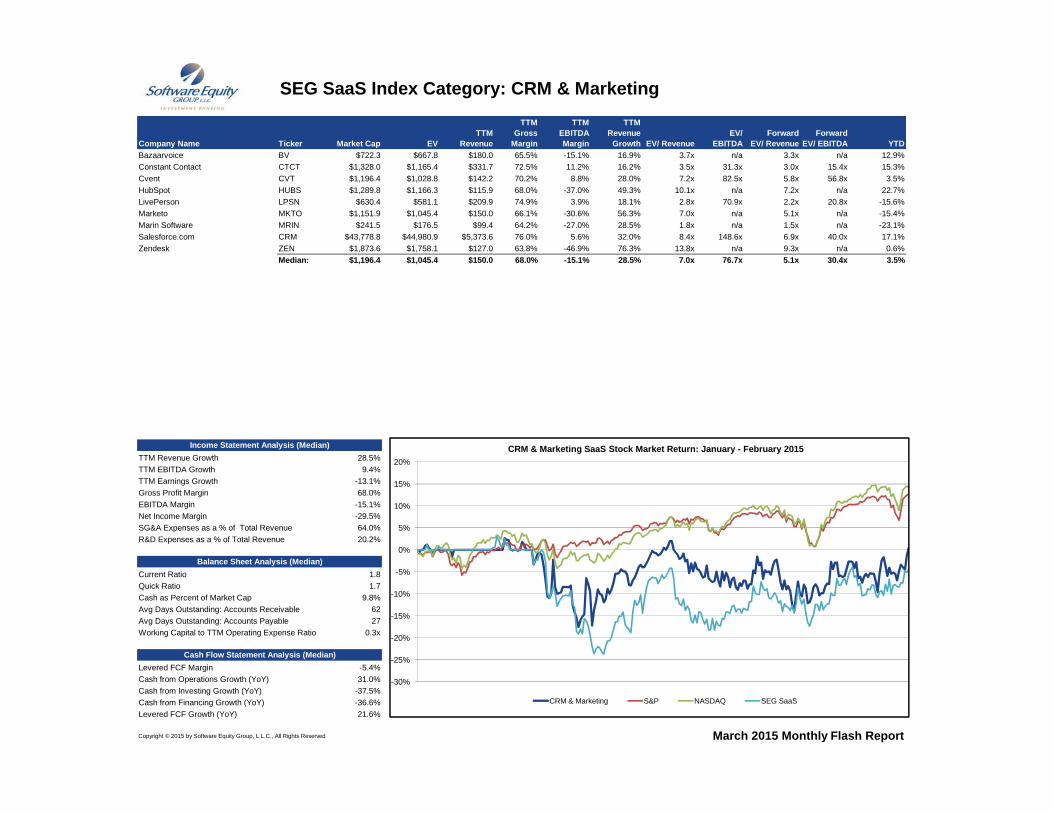
SEG SaaS Index Category: CRM & Marketing
Company Name Ticker Market Cap EVTTM
Revenue
TTM Gross
Margin
TTM EBITDA Margin
TTM Revenue
Growth EV/ RevenueEV/
EBITDAForward
EV/ RevenueForward
EV/ EBITDA YTDBazaarvoice BV $722.3 $667.8 $180.0 65.5% -15.1% 16.9% 3.7x n/a 3.3x n/a 12.9%Constant Contact CTCT $1,328.0 $1,165.4 $331.7 72.5% 11.2% 16.2% 3.5x 31.3x 3.0x 15.4x 15.3%Cvent CVT $1,196.4 $1,028.8 $142.2 70.2% 8.8% 28.0% 7.2x 82.5x 5.8x 56.8x 3.5%HubSpot HUBS $1,289.8 $1,166.3 $115.9 68.0% -37.0% 49.3% 10.1x n/a 7.2x n/a 22.7%LivePerson LPSN $630.4 $581.1 $209.9 74.9% 3.9% 18.1% 2.8x 70.9x 2.2x 20.8x -15.6%Marketo MKTO $1,151.9 $1,045.4 $150.0 66.1% -30.6% 56.3% 7.0x n/a 5.1x n/a -15.4%Marin Software MRIN $241.5 $176.5 $99.4 64.2% -27.0% 28.5% 1.8x n/a 1.5x n/a -23.1%Salesforce.com CRM $43,778.8 $44,980.9 $5,373.6 76.0% 5.6% 32.0% 8.4x 148.6x 6.9x 40.0x 17.1%Zendesk ZEN $1,873.6 $1,758.1 $127.0 63.8% -46.9% 76.3% 13.8x n/a 9.3x n/a 0.6%
Median: $1,196.4 $1,045.4 $150.0 68.0% -15.1% 28.5% 7.0x 76.7x 5.1x 30.4x 3.5%
TTM Revenue Growth 28.5%TTM EBITDA Growth 9.4%TTM Earnings Growth -13.1%Gross Profit Margin 68.0%EBITDA Margin -15.1%Net Income Margin -29.5%SG&A Expenses as a % of Total Revenue 64.0%R&D Expenses as a % of Total Revenue 20.2%
Current Ratio 1.8Quick Ratio 1.7Cash as Percent of Market Cap 9.8%Avg Days Outstanding: Accounts Receivable 62Avg Days Outstanding: Accounts Payable 27Working Capital to TTM Operating Expense Ratio 0.3x
Levered FCF Margin -5.4%Cash from Operations Growth (YoY) 31.0%Cash from Investing Growth (YoY) -37.5%Cash from Financing Growth (YoY) -36.6%Levered FCF Growth (YoY) 21.6%
Copyright © 2015 by Software Equity Group, L.L.C., All Rights Reserved
Cash Flow Statement Analysis (Median)
March 2015 Monthly Flash Report
Income Statement Analysis (Median)
Balance Sheet Analysis (Median)
-30%
-25%
-20%
-15%
-10%
-5%
0%
5%
10%
15%
20%CRM & Marketing SaaS Stock Market Return: January - February 2015
CRM & Marketing S&P NASDAQ SEG SaaS

SEG SaaS Index Category: ERP & Supply Chain
Company Name Ticker Market Cap EVTTM
Revenue
TTM Gross
Margin
TTM EBITDA Margin
TTM Revenue
Growth EV/ RevenueEV/
EBITDAForward
EV/ RevenueForward
EV/ EBITDA YTDAmber Road AMBR $218.5 $180.7 $64.8 57.6% -33.9% 23.4% 2.8x n/a 2.6x n/a -16.6%E2open EOPN $251.3 $233.6 $78.5 63.0% -33.1% 13.0% 3.0x n/a 2.8x n/a -7.8%Fleetmatics FLTX $1,561.7 $1,411.0 $231.6 75.2% 25.1% 30.6% 6.1x 24.3x 4.9x 15.3x 16.5%Netsuite N $7,399.2 $7,214.5 $556.3 68.2% -9.6% 34.2% 13.0x n/a 10.0x 117.9x -10.1%SciQuest SQI $480.1 $349.2 $101.9 69.1% 5.1% 13.0% 3.4x 67.8x 3.2x 15.7x 21.2%SPS Commerce SPSC $1,123.2 $992.4 $127.9 68.7% 10.3% 22.6% 7.8x 75.0x 6.3x 45.8x 23.5%Workday WDAY $15,988.5 $14,624.5 $787.9 66.4% -19.9% 68.0% 18.6x n/a 12.8x n/a 6.3%
Median: $1,123.2 $992.4 $127.9 68.2% -9.6% 23.4% 6.1x 67.8x 4.9x 30.8x 6.3%
TTM Revenue Growth 23.4%TTM EBITDA Growth -24.2%TTM Earnings Growth -28.1%Gross Profit Margin 68.2%EBITDA Margin -9.6%Net Income Margin -18.0%SG&A Expenses as a % of Total Revenue 53.5%R&D Expenses as a % of Total Revenue 19.2%
Current Ratio 2.1Quick Ratio 2.0Cash as Percent of Market Cap 11.6%Avg Days Outstanding: Accounts Receivable 65Avg Days Outstanding: Accounts Payable 26Working Capital to TTM Operating Expense Ratio 0.7x
Levered FCF Margin 6.9%Cash from Operations Growth (YoY) 20.4%Cash from Investing Growth (YoY) -94.1%Cash from Financing Growth (YoY) -73.5%Levered FCF Growth (YoY) 3.0%
Copyright © 2015 by Software Equity Group, L.L.C., All Rights Reserved
Cash Flow Statement Analysis (Median)
March 2015 Monthly Flash Report
Income Statement Analysis (Median)
Balance Sheet Analysis (Median)
-35%
-30%
-25%
-20%
-15%
-10%
-5%
0%
5%
10%
15%
20%ERP & Supply Chain SaaS Stock Market Return: January - February 2015
ERP & Supply Chain S&P NASDAQ SEG SaaS
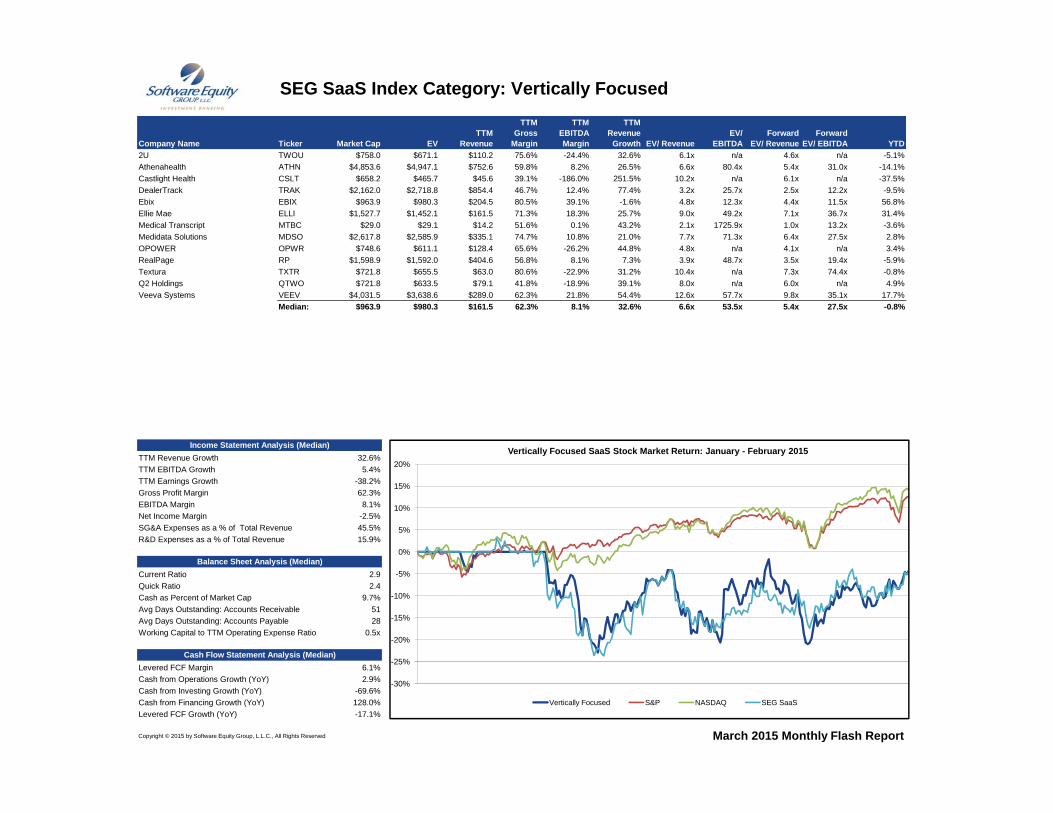
SEG SaaS Index Category: Vertically Focused
Company Name Ticker Market Cap EVTTM
Revenue
TTM Gross
Margin
TTM EBITDA Margin
TTM Revenue
Growth EV/ RevenueEV/
EBITDAForward
EV/ RevenueForward
EV/ EBITDA YTD2U TWOU $758.0 $671.1 $110.2 75.6% -24.4% 32.6% 6.1x n/a 4.6x n/a -5.1%Athenahealth ATHN $4,853.6 $4,947.1 $752.6 59.8% 8.2% 26.5% 6.6x 80.4x 5.4x 31.0x -14.1%Castlight Health CSLT $658.2 $465.7 $45.6 39.1% -186.0% 251.5% 10.2x n/a 6.1x n/a -37.5%DealerTrack TRAK $2,162.0 $2,718.8 $854.4 46.7% 12.4% 77.4% 3.2x 25.7x 2.5x 12.2x -9.5%Ebix EBIX $963.9 $980.3 $204.5 80.5% 39.1% -1.6% 4.8x 12.3x 4.4x 11.5x 56.8%Ellie Mae ELLI $1,527.7 $1,452.1 $161.5 71.3% 18.3% 25.7% 9.0x 49.2x 7.1x 36.7x 31.4%Medical Transcript MTBC $29.0 $29.1 $14.2 51.6% 0.1% 43.2% 2.1x 1725.9x 1.0x 13.2x -3.6%Medidata Solutions MDSO $2,617.8 $2,585.9 $335.1 74.7% 10.8% 21.0% 7.7x 71.3x 6.4x 27.5x 2.8%OPOWER OPWR $748.6 $611.1 $128.4 65.6% -26.2% 44.8% 4.8x n/a 4.1x n/a 3.4%RealPage RP $1,598.9 $1,592.0 $404.6 56.8% 8.1% 7.3% 3.9x 48.7x 3.5x 19.4x -5.9%Textura TXTR $721.8 $655.5 $63.0 80.6% -22.9% 31.2% 10.4x n/a 7.3x 74.4x -0.8%Q2 Holdings QTWO $721.8 $633.5 $79.1 41.8% -18.9% 39.1% 8.0x n/a 6.0x n/a 4.9%Veeva Systems VEEV $4,031.5 $3,638.6 $289.0 62.3% 21.8% 54.4% 12.6x 57.7x 9.8x 35.1x 17.7%
Median: $963.9 $980.3 $161.5 62.3% 8.1% 32.6% 6.6x 53.5x 5.4x 27.5x -0.8%
TTM Revenue Growth 32.6%TTM EBITDA Growth 5.4%TTM Earnings Growth -38.2%Gross Profit Margin 62.3%EBITDA Margin 8.1%Net Income Margin -2.5%SG&A Expenses as a % of Total Revenue 45.5%R&D Expenses as a % of Total Revenue 15.9%
Current Ratio 2.9Quick Ratio 2.4Cash as Percent of Market Cap 9.7%Avg Days Outstanding: Accounts Receivable 51Avg Days Outstanding: Accounts Payable 28Working Capital to TTM Operating Expense Ratio 0.5x
Levered FCF Margin 6.1%Cash from Operations Growth (YoY) 2.9%Cash from Investing Growth (YoY) -69.6%Cash from Financing Growth (YoY) 128.0%Levered FCF Growth (YoY) -17.1%
Copyright © 2015 by Software Equity Group, L.L.C., All Rights Reserved
Cash Flow Statement Analysis (Median)
March 2015 Monthly Flash Report
Income Statement Analysis (Median)
Balance Sheet Analysis (Median)
-30%
-25%
-20%
-15%
-10%
-5%
0%
5%
10%
15%
20%Vertically Focused SaaS Stock Market Return: January - February 2015
Vertically Focused S&P NASDAQ SEG SaaS
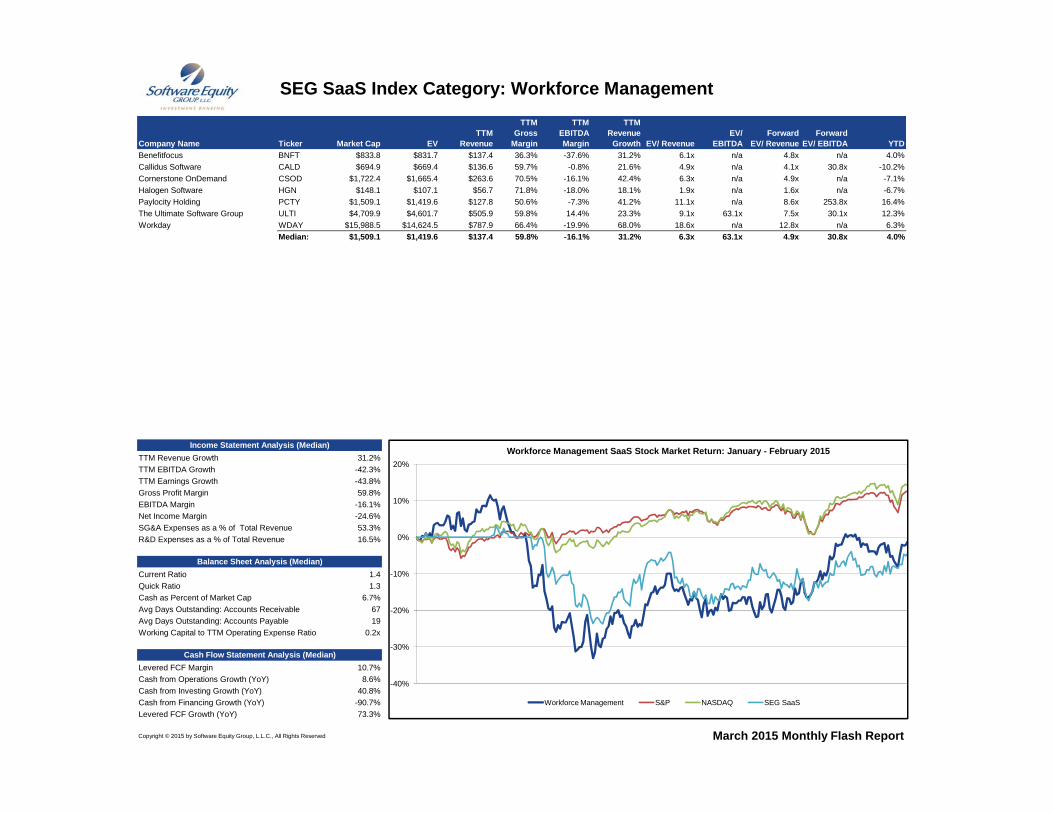
SEG SaaS Index Category: Workforce Management
Company Name Ticker Market Cap EVTTM
Revenue
TTM Gross
Margin
TTM EBITDA Margin
TTM Revenue
Growth EV/ RevenueEV/
EBITDAForward
EV/ RevenueForward
EV/ EBITDA YTDBenefitfocus BNFT $833.8 $831.7 $137.4 36.3% -37.6% 31.2% 6.1x n/a 4.8x n/a 4.0%Callidus Software CALD $694.9 $669.4 $136.6 59.7% -0.8% 21.6% 4.9x n/a 4.1x 30.8x -10.2%Cornerstone OnDemand CSOD $1,722.4 $1,665.4 $263.6 70.5% -16.1% 42.4% 6.3x n/a 4.9x n/a -7.1%Halogen Software HGN $148.1 $107.1 $56.7 71.8% -18.0% 18.1% 1.9x n/a 1.6x n/a -6.7%Paylocity Holding PCTY $1,509.1 $1,419.6 $127.8 50.6% -7.3% 41.2% 11.1x n/a 8.6x 253.8x 16.4%The Ultimate Software Group ULTI $4,709.9 $4,601.7 $505.9 59.8% 14.4% 23.3% 9.1x 63.1x 7.5x 30.1x 12.3%Workday WDAY $15,988.5 $14,624.5 $787.9 66.4% -19.9% 68.0% 18.6x n/a 12.8x n/a 6.3%
Median: $1,509.1 $1,419.6 $137.4 59.8% -16.1% 31.2% 6.3x 63.1x 4.9x 30.8x 4.0%
TTM Revenue Growth 31.2%TTM EBITDA Growth -42.3%TTM Earnings Growth -43.8%Gross Profit Margin 59.8%EBITDA Margin -16.1%Net Income Margin -24.6%SG&A Expenses as a % of Total Revenue 53.3%R&D Expenses as a % of Total Revenue 16.5%
Current Ratio 1.4Quick Ratio 1.3Cash as Percent of Market Cap 6.7%Avg Days Outstanding: Accounts Receivable 67Avg Days Outstanding: Accounts Payable 19Working Capital to TTM Operating Expense Ratio 0.2x
Levered FCF Margin 10.7%Cash from Operations Growth (YoY) 8.6%Cash from Investing Growth (YoY) 40.8%Cash from Financing Growth (YoY) -90.7%Levered FCF Growth (YoY) 73.3%
Copyright © 2015 by Software Equity Group, L.L.C., All Rights Reserved
Cash Flow Statement Analysis (Median)
March 2015 Monthly Flash Report
Income Statement Analysis (Median)
Balance Sheet Analysis (Median)
-40%
-30%
-20%
-10%
0%
10%
20%Workforce Management SaaS Stock Market Return: January - February 2015
Workforce Management S&P NASDAQ SEG SaaS

SEG SaaS Index Category: Other Public SaaS Companies
Company Name Ticker Market Cap EVTTM
Revenue
TTM Gross
Margin
TTM EBITDA Margin
TTM Revenue
Growth EV/ RevenueEV/
EBITDAForward
EV/ RevenueForward
EV/ EBITDA YTDBox BOX $2,172.9 $2,047.6 $192.6 78.8% -71.0% 83.4% 10.6x n/a 7.9x n/a -19.7%ChannelAdvisors ECOM $246.5 $181.9 $84.9 71.5% -33.2% 24.8% 2.1x n/a 1.9x n/a -54.1%Covisint COVS $97.5 $54.2 $89.5 33.8% -37.6% -9.1% 0.6x n/a 0.6x n/a -2.3%Demandware DWRE $2,294.4 $2,051.5 $160.6 73.8% -13.2% 54.8% 12.8x n/a 8.8x 216.8x 12.0%FireEye FEYE $6,659.1 $6,256.9 $425.7 58.9% -89.1% 163.5% 14.7x n/a 10.1x n/a 42.6%HortonWorks HDP $944.0 $739.5 $46.0 -75.6% -373.3% 71.8% 16.1x n/a 8.6x n/a -9.7%inContact SAAS $712.2 $702.4 $171.8 48.7% -4.6% 32.1% 4.1x n/a 3.4x 74.4x 33.4%IntraLinks Holdings IL $582.0 $608.3 $255.8 72.9% 10.8% 9.1% 2.4x 22.0x 2.2x 15.6x -9.4%J2 Global JCOM $3,215.0 $3,278.5 $599.0 82.3% 41.7% 15.0% 5.5x 13.1x 4.7x 10.8x 10.3%Jive Software JIVE $376.4 $268.8 $178.7 62.7% -22.2% 22.6% 1.5x n/a 1.4x 270.8x -16.6%Liquid Holdings Group LIQD $17.5 n/a $5.2 54.2% n/a 1.3% n/a n/a n/a n/a -15.3%New Relic NEWR $1,621.4 $1,416.6 $96.8 81.0% -40.8% 82.2% 14.6x n/a 10.5x n/a -5.5%Qualys QLYS $1,533.7 $1,406.5 $133.6 78.3% 15.8% 23.7% 10.5x 66.5x 8.4x 32.4x 23.4%RingCentral RNG $1,084.3 $968.3 $219.9 65.1% -15.8% 37.0% 4.4x n/a 3.4x n/a 7.1%Rally Software Development RALY $300.1 $229.6 $82.6 74.1% -31.8% 17.6% 2.8x n/a 2.3x n/a 1.8%Service-now.com NOW $11,309.4 $11,084.3 $682.6 63.6% -16.1% 60.7% 16.2x n/a 11.2x 85.5x 13.2%Tableau Software DATA $6,656.9 $5,976.3 $412.6 91.0% 4.8% 77.5% 14.5x 301.3x 10.2x 123.7x 9.3%Tangoe TNGO $482.1 $432.4 $212.5 54.1% 7.2% 12.5% 2.0x 28.1x 1.8x 11.1x -2.1%TrueCar TRUE $1,535.2 $1,393.8 $206.6 91.5% -19.5% 54.3% 6.7x n/a 4.9x 49.3x -8.5%Upland Software UPLD $107.2 $183.7 $60.2 65.2% -14.4% n/a 3.0x n/a 2.5x n/a -25.9%Workiva WK $505.9 $495.6 $106.1 71.4% -27.2% n/a 4.7x n/a 3.8x n/a -5.7%Yodlee YDLE $377.2 $306.1 $89.1 60.5% -1.9% 27.0% 3.4x n/a 2.8x 31.0x 5.7%Zix ZIXI $227.3 $205.6 $50.3 83.5% 17.8% 4.6% 4.1x 22.9x 3.8x 15.0x 12.7%
Median: $712.2 $721.0 $160.6 71.4% -16.0% 27.0% 4.5x 25.5x 3.8x 40.9x -2.1%
TTM Revenue Growth 27.0%TTM EBITDA Growth -23.8%TTM Earnings Growth -29.6%Gross Profit Margin 71.4%EBITDA Margin -16.0%Net Income Margin -26.3%SG&A Expenses as a % of Total Revenue 64.2%R&D Expenses as a % of Total Revenue 21.7%
Current Ratio 2.1Quick Ratio 2.0Cash as Percent of Market Cap 10.6%Avg Days Outstanding: Accounts Receivable 71Avg Days Outstanding: Accounts Payable 40Working Capital to TTM Operating Expense Ratio 0.4x
Levered FCF Margin 0.1%Cash from Operations Growth (YoY) -8.9%Cash from Investing Growth (YoY) -90.1%Cash from Financing Growth (YoY) 12.1%Levered FCF Growth (YoY) 16.8%
Copyright © 2015 by Software Equity Group, L.L.C., All Rights Reserved
Cash Flow Statement Analysis (Median)
March 2015 Monthly Flash Report
Income Statement Analysis (Median)
Balance Sheet Analysis (Median)
-30%
-25%
-20%
-15%
-10%
-5%
0%
5%
10%
15%
20%Other Public SaaS Companies SaaS Stock Market Return: January - February 2015
Other SaaS S&P NASDAQ SEG SaaS
Copyright © 2015 by Software Equity Group, L.L.C., All Rights Reserved
SEG Software Index
Select Software Industry M&A Transactions
SEG SaaS Index
SEG Internet Index

SEG Internet Index: All Categories
Category Name Market Cap EVTTM
Revenue
TTM Gross
Margin
TTM EBITDA Margin
TTM Revenue
Growth EV/ RevenueEV/
EBITDAForward
EV/ RevenueForward
EV/ EBITDA YTDSEG Internet Index $1,332.6 $1,211.9 $498.9 64.1% 8.8% 19.5% 2.5x 19.6x 2.2x 13.5x 0.4% Ad Tech & Lead Generation $1,359.0 $1,205.2 $651.0 53.7% 4.2% 20.4% 2.0x 21.5x 1.8x 19.9x -10.7% Commerce $745.4 $592.7 $473.5 37.7% 9.7% 16.5% 1.7x 21.5x 1.5x 12.8x 2.0% Content & Media $2,453.0 $1,846.8 $597.4 49.3% 10.6% 18.4% 2.4x 26.8x 2.3x 12.1x -11.7% Gaming $2,060.99 $1,652.3 $762.1 70.5% 18.3% 23.4% 2.6x 20.2x 1.7x 9.2x -0.2% Infrastructure $687.74 $582.9 $296.3 60.3% 5.9% 7.1% 1.5x 16.6x 1.5x 12.9x 7.4% Search $38,601.25 $36,263.4 $5,509.3 70.2% 32.0% 23.7% 5.6x 15.7x 4.9x 13.4x -1.2% Services $698.17 $599.0 $253.9 73.0% 6.9% 28.2% 2.5x 23.8x 2.1x 14.3x 3.3% Social $3,970.89 $3,304.4 $582.9 68.2% 10.5% 58.4% 8.5x 33.7x 5.5x 25.2x 0.7% Travel $4,693.64 $4,506.8 $1,025.9 82.8% 13.8% 22.5% 4.3x 19.4x 4.6x 18.9x 7.1%
TTM Revenue Growth 19.5%TTM EBITDA Growth 6.9%TTM Earnings Growth -1.1%Gross Profit Margin 64.1%EBITDA Margin 8.8%Net Income Margin 1.0%SG&A Expenses as a % of Total Revenue 39.2%R&D Expenses as a % of Total Revenue 14.9%
Current Ratio 2.5Quick Ratio 2.1Cash as Percent of Market Cap 17.0%Avg Days Outstanding: Accounts Receivable 40Avg Days Outstanding: Accounts Payable 47Working Capital to TTM Operating Expense Ratio 0.5
Levered FCF Margin 7.9%Cash from Operations Growth (YoY) 18.3%Cash from Investing Growth (YoY) -58.8%Cash from Financing Growth (YoY) 8.4%Levered FCF Growth (YoY) 20.3%
Copyright © 2015 by Software Equity Group, L.L.C., All Rights Reserved March 2015 Monthly Flash Report
Income Statement Analysis (Median)
Balance Sheet Analysis (Median)
Cash Flow Statement Analysis (Median)
-25%
-20%
-15%
-10%
-5%
0%
5%
10%
15%
20%SEG Internet Index Stock Market Return: January - February 2015
DOW S&P NASDAQ SEG Internet Index

SEG Internet Index Category: Ad Tech
Company Name Ticker Market Cap EVTTM
Revenue
TTM Gross
Margin
TTM EBITDA Margin
TTM Revenue
Growth EV/ RevenueEV/
EBITDAForward
EV/ RevenueForward
EV/ EBITDA YTDAOL AOL $3,178.9 $3,151.7 $2,527.2 26.5% 17.3% 8.9% 1.2x 7.2x 1.2x 6.2x -10.9%Baidu.com BIDU $71,529.0 $66,882.7 $7,909.1 68.8% 31.5% 53.6% 8.5x 26.8x 6.1x 20.5x -8.7%Criteo SA CRTO $2,762.5 $2,428.3 $901.9 35.9% 8.6% 67.8% 2.7x 31.2x 4.9x 19.2x 13.6%Google GOOGL $381,497.8 $326,879.8 $66,001.0 61.6% 32.5% 18.9% 5.0x 15.2x 4.3x 11.1x 6.2%Marchex MCHX $174.2 $94.1 $182.6 37.3% 4.9% 19.7% 0.5x 10.6x 0.7x 7.5x -12.6%ReachLocal RLOC $87.2 $44.3 $474.9 46.8% -4.5% -7.6% 0.1x n/a 0.1x n/a -12.3%Rocket Fuel FUEL $403.5 $383.3 $354.7 48.3% -8.3% 81.8% 1.1x n/a 0.7x n/a -39.2%The Rubicon Project RUBI $692.9 $595.8 $125.3 83.4% -5.0% 49.5% 4.8x n/a 3.4x 28.2x 17.4%Sohu.com SOHU $2,025.2 $1,814.5 $1,673.1 59.0% 3.5% 19.5% 1.1x 31.1x 0.9x 21.9x 0.4%Tremor TRMR $124.1 $46.3 $159.5 36.2% -10.4% 21.0% 0.3x n/a 0.2x n/a -15.9%TubeMogul TUBE $412.4 $368.5 $114.2 70.3% -0.6% 99.7% 3.2x n/a 2.5x n/a -34.2%Yahoo! YHOO $41,451.4 $34,717.3 $4,618.1 71.9% 14.8% -1.3% 7.5x 50.9x 8.0x 30.9x -11.7%Yandex YNDX $5,225.2 $5,220.2 $827.2 71.8% 39.0% 28.5% 6.3x 16.2x 5.6x 15.7x -10.5%YuMe YUME $184.4 $120.2 $178.1 47.7% -1.8% 17.9% 0.7x n/a 0.6x 51.4x 8.6%
Median: $1,359.0 $1,205.2 $651.0 53.7% 4.2% 20.4% 2.0x 21.5x 1.8x 19.9x -10.7%
TTM Revenue Growth 20.4%TTM EBITDA Growth -33.9%TTM Earnings Growth -53.1%Gross Profit Margin 53.7%EBITDA Margin 4.2%Net Income Margin -4.3%SG&A Expenses as a % of Total Revenue 37.6%R&D Expenses as a % of Total Revenue 14.9%
Current Ratio 2.2xQuick Ratio 2.0xCash as Percent of Market Cap 17.9%Avg Days Outstanding: Accounts Receivable 67.9xAvg Days Outstanding: Accounts Payable 67.5xWorking Capital to TTM Operating Expense Ratio 0.5x
Levered FCF Margin 2.2%Cash from Operations Growth (YoY) 12.8%Cash from Investing Growth (YoY) -83.8%Cash from Financing Growth (YoY) -26.9%Levered FCF Growth (YoY) 42.9%
Copyright © 2015 by Software Equity Group, L.L.C., All Rights Reserved March 2015 Monthly Flash Report
Income Statement Analysis (Median)
Balance Sheet Analysis (Median)
Cash Flow Statement Analysis (Median)
-50%
-40%
-30%
-20%
-10%
0%
10%
20%Internet Ad Tech Stock Market Return: January - February 2015
Ad Tech & Lead Generation S&P NASDAQ SEG Internet Index
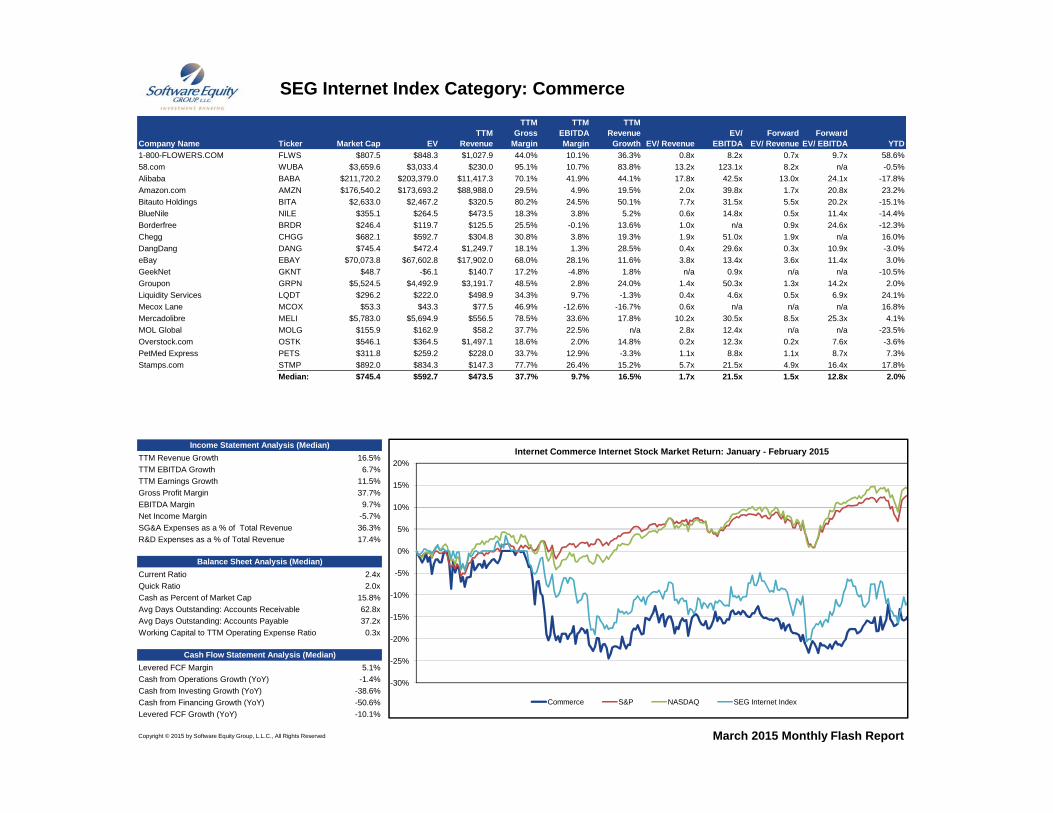
SEG Internet Index Category: Commerce
Company Name Ticker Market Cap EVTTM
Revenue
TTM Gross
Margin
TTM EBITDA Margin
TTM Revenue
Growth EV/ RevenueEV/
EBITDAForward
EV/ RevenueForward
EV/ EBITDA YTD1-800-FLOWERS.COM FLWS $807.5 $848.3 $1,027.9 44.0% 10.1% 36.3% 0.8x 8.2x 0.7x 9.7x 58.6%58.com WUBA $3,659.6 $3,033.4 $230.0 95.1% 10.7% 83.8% 13.2x 123.1x 8.2x n/a -0.5%Alibaba BABA $211,720.2 $203,379.0 $11,417.3 70.1% 41.9% 44.1% 17.8x 42.5x 13.0x 24.1x -17.8%Amazon.com AMZN $176,540.2 $173,693.2 $88,988.0 29.5% 4.9% 19.5% 2.0x 39.8x 1.7x 20.8x 23.2%Bitauto Holdings BITA $2,633.0 $2,467.2 $320.5 80.2% 24.5% 50.1% 7.7x 31.5x 5.5x 20.2x -15.1%BlueNile NILE $355.1 $264.5 $473.5 18.3% 3.8% 5.2% 0.6x 14.8x 0.5x 11.4x -14.4%Borderfree BRDR $246.4 $119.7 $125.5 25.5% -0.1% 13.6% 1.0x n/a 0.9x 24.6x -12.3%Chegg CHGG $682.1 $592.7 $304.8 30.8% 3.8% 19.3% 1.9x 51.0x 1.9x n/a 16.0%DangDang DANG $745.4 $472.4 $1,249.7 18.1% 1.3% 28.5% 0.4x 29.6x 0.3x 10.9x -3.0%eBay EBAY $70,073.8 $67,602.8 $17,902.0 68.0% 28.1% 11.6% 3.8x 13.4x 3.6x 11.4x 3.0%GeekNet GKNT $48.7 -$6.1 $140.7 17.2% -4.8% 1.8% n/a 0.9x n/a n/a -10.5%Groupon GRPN $5,524.5 $4,492.9 $3,191.7 48.5% 2.8% 24.0% 1.4x 50.3x 1.3x 14.2x 2.0%Liquidity Services LQDT $296.2 $222.0 $498.9 34.3% 9.7% -1.3% 0.4x 4.6x 0.5x 6.9x 24.1%Mecox Lane MCOX $53.3 $43.3 $77.5 46.9% -12.6% -16.7% 0.6x n/a n/a n/a 16.8%Mercadolibre MELI $5,783.0 $5,694.9 $556.5 78.5% 33.6% 17.8% 10.2x 30.5x 8.5x 25.3x 4.1%MOL Global MOLG $155.9 $162.9 $58.2 37.7% 22.5% n/a 2.8x 12.4x n/a n/a -23.5%Overstock.com OSTK $546.1 $364.5 $1,497.1 18.6% 2.0% 14.8% 0.2x 12.3x 0.2x 7.6x -3.6%PetMed Express PETS $311.8 $259.2 $228.0 33.7% 12.9% -3.3% 1.1x 8.8x 1.1x 8.7x 7.3%Stamps.com STMP $892.0 $834.3 $147.3 77.7% 26.4% 15.2% 5.7x 21.5x 4.9x 16.4x 17.8%
Median: $745.4 $592.7 $473.5 37.7% 9.7% 16.5% 1.7x 21.5x 1.5x 12.8x 2.0%
TTM Revenue Growth 16.5%TTM EBITDA Growth 6.7%TTM Earnings Growth 11.5%Gross Profit Margin 37.7%EBITDA Margin 9.7%Net Income Margin -5.7%SG&A Expenses as a % of Total Revenue 36.3%R&D Expenses as a % of Total Revenue 17.4%
Current Ratio 2.4xQuick Ratio 2.0xCash as Percent of Market Cap 15.8%Avg Days Outstanding: Accounts Receivable 62.8xAvg Days Outstanding: Accounts Payable 37.2xWorking Capital to TTM Operating Expense Ratio 0.3x
Levered FCF Margin 5.1%Cash from Operations Growth (YoY) -1.4%Cash from Investing Growth (YoY) -38.6%Cash from Financing Growth (YoY) -50.6%Levered FCF Growth (YoY) -10.1%
Copyright © 2015 by Software Equity Group, L.L.C., All Rights Reserved March 2015 Monthly Flash Report
Income Statement Analysis (Median)
Balance Sheet Analysis (Median)
Cash Flow Statement Analysis (Median)
-30%
-25%
-20%
-15%
-10%
-5%
0%
5%
10%
15%
20%Internet Commerce Internet Stock Market Return: January - February 2015
Commerce S&P NASDAQ SEG Internet Index
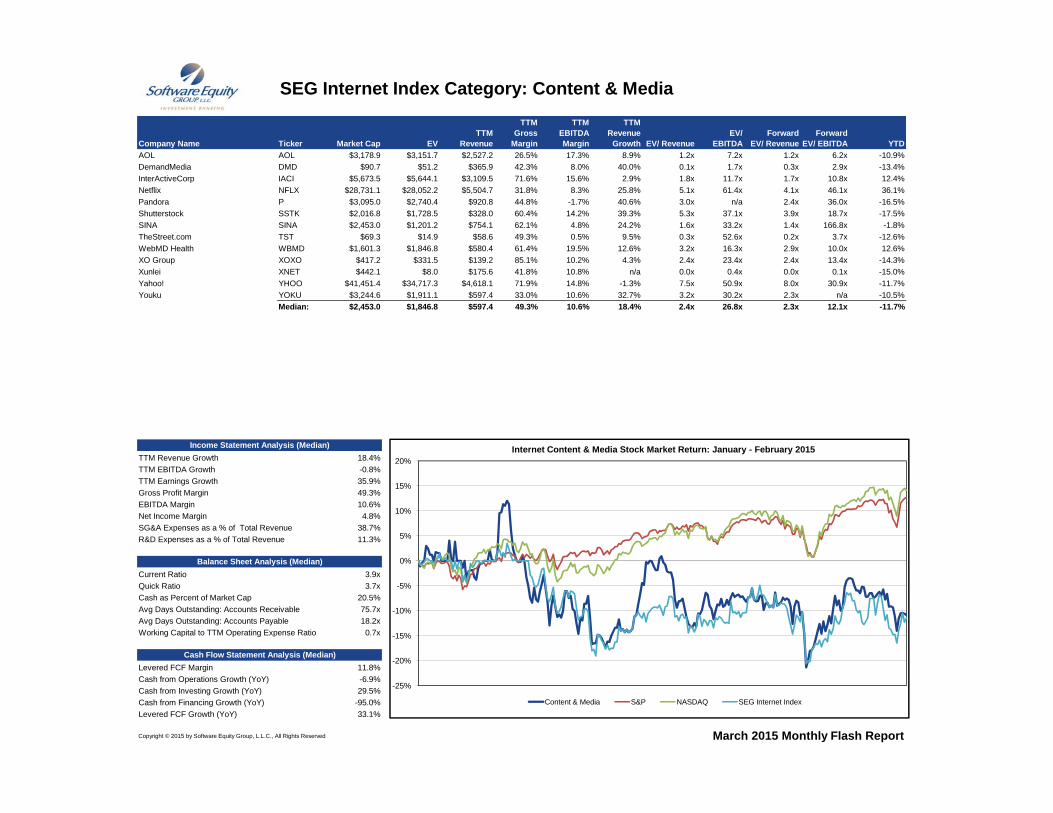
SEG Internet Index Category: Content & Media
Company Name Ticker Market Cap EVTTM
Revenue
TTM Gross
Margin
TTM EBITDA Margin
TTM Revenue
Growth EV/ RevenueEV/
EBITDAForward
EV/ RevenueForward
EV/ EBITDA YTDAOL AOL $3,178.9 $3,151.7 $2,527.2 26.5% 17.3% 8.9% 1.2x 7.2x 1.2x 6.2x -10.9%DemandMedia DMD $90.7 $51.2 $365.9 42.3% 8.0% 40.0% 0.1x 1.7x 0.3x 2.9x -13.4%InterActiveCorp IACI $5,673.5 $5,644.1 $3,109.5 71.6% 15.6% 2.9% 1.8x 11.7x 1.7x 10.8x 12.4%Netflix NFLX $28,731.1 $28,052.2 $5,504.7 31.8% 8.3% 25.8% 5.1x 61.4x 4.1x 46.1x 36.1%Pandora P $3,095.0 $2,740.4 $920.8 44.8% -1.7% 40.6% 3.0x n/a 2.4x 36.0x -16.5%Shutterstock SSTK $2,016.8 $1,728.5 $328.0 60.4% 14.2% 39.3% 5.3x 37.1x 3.9x 18.7x -17.5%SINA SINA $2,453.0 $1,201.2 $754.1 62.1% 4.8% 24.2% 1.6x 33.2x 1.4x 166.8x -1.8%TheStreet.com TST $69.3 $14.9 $58.6 49.3% 0.5% 9.5% 0.3x 52.6x 0.2x 3.7x -12.6%WebMD Health WBMD $1,601.3 $1,846.8 $580.4 61.4% 19.5% 12.6% 3.2x 16.3x 2.9x 10.0x 12.6%XO Group XOXO $417.2 $331.5 $139.2 85.1% 10.2% 4.3% 2.4x 23.4x 2.4x 13.4x -14.3%Xunlei XNET $442.1 $8.0 $175.6 41.8% 10.8% n/a 0.0x 0.4x 0.0x 0.1x -15.0%Yahoo! YHOO $41,451.4 $34,717.3 $4,618.1 71.9% 14.8% -1.3% 7.5x 50.9x 8.0x 30.9x -11.7%Youku YOKU $3,244.6 $1,911.1 $597.4 33.0% 10.6% 32.7% 3.2x 30.2x 2.3x n/a -10.5%
Median: $2,453.0 $1,846.8 $597.4 49.3% 10.6% 18.4% 2.4x 26.8x 2.3x 12.1x -11.7%
TTM Revenue Growth 18.4%TTM EBITDA Growth -0.8%TTM Earnings Growth 35.9%Gross Profit Margin 49.3%EBITDA Margin 10.6%Net Income Margin 4.8%SG&A Expenses as a % of Total Revenue 38.7%R&D Expenses as a % of Total Revenue 11.3%
Current Ratio 3.9xQuick Ratio 3.7xCash as Percent of Market Cap 20.5%Avg Days Outstanding: Accounts Receivable 75.7xAvg Days Outstanding: Accounts Payable 18.2xWorking Capital to TTM Operating Expense Ratio 0.7x
Levered FCF Margin 11.8%Cash from Operations Growth (YoY) -6.9%Cash from Investing Growth (YoY) 29.5%Cash from Financing Growth (YoY) -95.0%Levered FCF Growth (YoY) 33.1%
Copyright © 2015 by Software Equity Group, L.L.C., All Rights Reserved
Income Statement Analysis (Median)
Balance Sheet Analysis (Median)
Cash Flow Statement Analysis (Median)
March 2015 Monthly Flash Report
-25%
-20%
-15%
-10%
-5%
0%
5%
10%
15%
20%Internet Content & Media Stock Market Return: January - February 2015
Content & Media S&P NASDAQ SEG Internet Index

SEG Internet Index Category: Gaming
Company Name Ticker Market Cap EVTTM
Revenue
TTM Gross
Margin
TTM EBITDA Margin
TTM Revenue
Growth EV/ RevenueEV/
EBITDAForward
EV/ RevenueForward
EV/ EBITDA YTDChangYou.com CYOU $1,480.2 $1,490.2 $755.3 73.3% 7.0% 2.4% 2.0x 28.2x 1.7x 8.3x 3.9%Giant Interactive GA $0.5 $4.4 $0.5 -57.8% n/a n/a 8.2x n/a n/a n/a -6.3%Netease NTES $13,006.3 $9,696.6 $1,888.6 72.2% 42.2% 27.4% 5.1x 12.2x 4.1x 10.1x 1.6%NCSoft A036570 $3,239.6 $2,505.7 $769.0 71.7% 34.8% n/a 3.3x 9.4x 3.1x 8.1x -0.8%Perfect World PWRD $931.3 $590.0 $601.6 73.5% 18.3% 30.4% 1.0x 5.4x 0.8x 6.4x -2.7%Sohu.com SOHU $2,025.2 $1,814.5 $1,673.1 59.0% 3.5% 19.5% 1.1x 31.1x 0.9x 21.9x 0.4%Tencent Holdings SEHK:700 $162,590.5 $160,022.2 $12,205.6 59.4% 37.3% 34.7% 13.1x 35.2x 11.0x 26.1x 20.5%Zynga ZNGA $2,096.8 $1,180.3 $690.4 69.2% -15.2% -20.9% 1.7x n/a 1.7x n/a -15.8%
Median: $2,061.0 $1,652.3 $762.1 70.5% 18.3% 23.4% 2.6x 20.2x 1.7x 9.2x -0.2%
TTM Revenue Growth 23.4%TTM EBITDA Growth 4.1%TTM Earnings Growth -23.4%Gross Profit Margin 70.5%EBITDA Margin 18.3%Net Income Margin 8.4%SG&A Expenses as a % of Total Revenue 38.0%R&D Expenses as a % of Total Revenue 25.1%
Current Ratio 2.5xQuick Ratio 1.8xCash as Percent of Market Cap 27.9%Avg Days Outstanding: Accounts Receivable 28.5xAvg Days Outstanding: Accounts Payable 67.5xWorking Capital to TTM Operating Expense Ratio 0.6x
Levered FCF Margin 27.2%Cash from Operations Growth (YoY) 19.2%Cash from Investing Growth (YoY) -48.9%Cash from Financing Growth (YoY) 11.8%Levered FCF Growth (YoY) 220.9%
Copyright © 2015 by Software Equity Group, L.L.C., All Rights Reserved March 2015 Monthly Flash Report
Income Statement Analysis (Median)
Balance Sheet Analysis (Median)
Cash Flow Statement Analysis (Median)
-25%
-20%
-15%
-10%
-5%
0%
5%
10%
15%
20%Internet Gaming Stock Market Return: January - February 2015
Gaming S&P NASDAQ SEG Internet Index
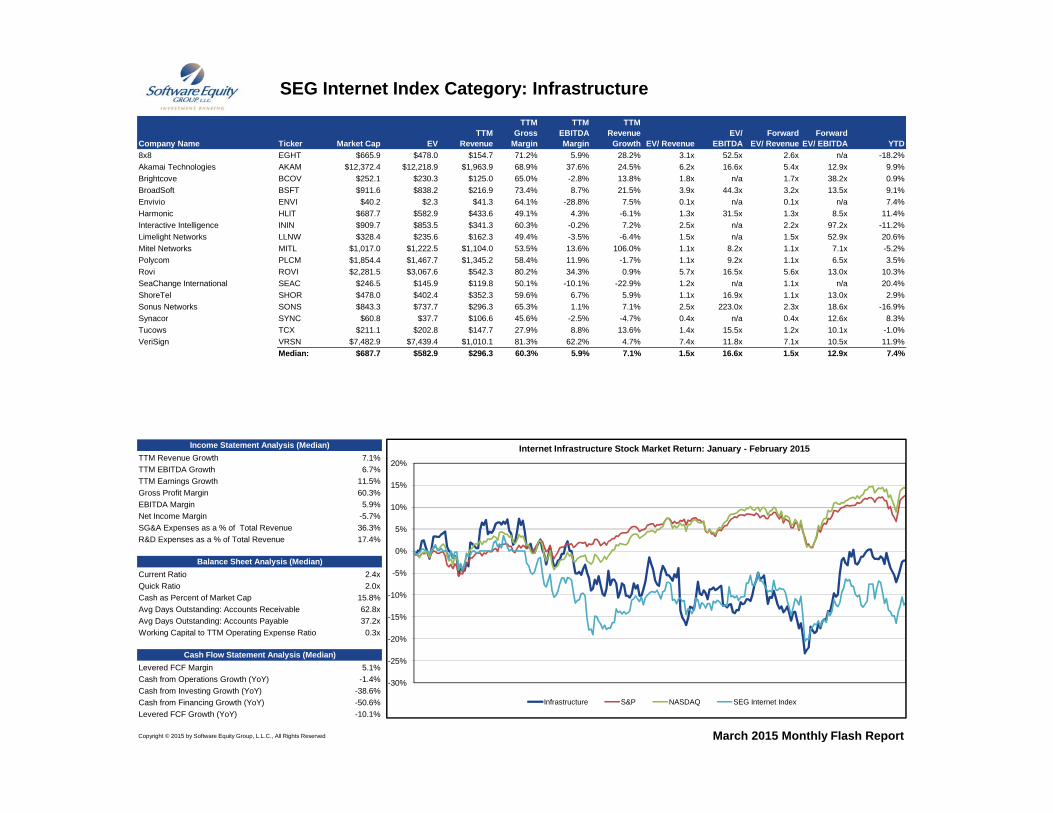
SEG Internet Index Category: Infrastructure
Company Name Ticker Market Cap EVTTM
Revenue
TTM Gross
Margin
TTM EBITDA Margin
TTM Revenue
Growth EV/ RevenueEV/
EBITDAForward
EV/ RevenueForward
EV/ EBITDA YTD8x8 EGHT $665.9 $478.0 $154.7 71.2% 5.9% 28.2% 3.1x 52.5x 2.6x n/a -18.2%Akamai Technologies AKAM $12,372.4 $12,218.9 $1,963.9 68.9% 37.6% 24.5% 6.2x 16.6x 5.4x 12.9x 9.9%Brightcove BCOV $252.1 $230.3 $125.0 65.0% -2.8% 13.8% 1.8x n/a 1.7x 38.2x 0.9%BroadSoft BSFT $911.6 $838.2 $216.9 73.4% 8.7% 21.5% 3.9x 44.3x 3.2x 13.5x 9.1%Envivio ENVI $40.2 $2.3 $41.3 64.1% -28.8% 7.5% 0.1x n/a 0.1x n/a 7.4%Harmonic HLIT $687.7 $582.9 $433.6 49.1% 4.3% -6.1% 1.3x 31.5x 1.3x 8.5x 11.4%Interactive Intelligence ININ $909.7 $853.5 $341.3 60.3% -0.2% 7.2% 2.5x n/a 2.2x 97.2x -11.2%Limelight Networks LLNW $328.4 $235.6 $162.3 49.4% -3.5% -6.4% 1.5x n/a 1.5x 52.9x 20.6%Mitel Networks MITL $1,017.0 $1,222.5 $1,104.0 53.5% 13.6% 106.0% 1.1x 8.2x 1.1x 7.1x -5.2%Polycom PLCM $1,854.4 $1,467.7 $1,345.2 58.4% 11.9% -1.7% 1.1x 9.2x 1.1x 6.5x 3.5%Rovi ROVI $2,281.5 $3,067.6 $542.3 80.2% 34.3% 0.9% 5.7x 16.5x 5.6x 13.0x 10.3%SeaChange International SEAC $246.5 $145.9 $119.8 50.1% -10.1% -22.9% 1.2x n/a 1.1x n/a 20.4%ShoreTel SHOR $478.0 $402.4 $352.3 59.6% 6.7% 5.9% 1.1x 16.9x 1.1x 13.0x 2.9%Sonus Networks SONS $843.3 $737.7 $296.3 65.3% 1.1% 7.1% 2.5x 223.0x 2.3x 18.6x -16.9%Synacor SYNC $60.8 $37.7 $106.6 45.6% -2.5% -4.7% 0.4x n/a 0.4x 12.6x 8.3%Tucows TCX $211.1 $202.8 $147.7 27.9% 8.8% 13.6% 1.4x 15.5x 1.2x 10.1x -1.0%VeriSign VRSN $7,482.9 $7,439.4 $1,010.1 81.3% 62.2% 4.7% 7.4x 11.8x 7.1x 10.5x 11.9%
Median: $687.7 $582.9 $296.3 60.3% 5.9% 7.1% 1.5x 16.6x 1.5x 12.9x 7.4%
TTM Revenue Growth 7.1%TTM EBITDA Growth 6.7%TTM Earnings Growth 11.5%Gross Profit Margin 60.3%EBITDA Margin 5.9%Net Income Margin -5.7%SG&A Expenses as a % of Total Revenue 36.3%R&D Expenses as a % of Total Revenue 17.4%
Current Ratio 2.4xQuick Ratio 2.0xCash as Percent of Market Cap 15.8%Avg Days Outstanding: Accounts Receivable 62.8xAvg Days Outstanding: Accounts Payable 37.2xWorking Capital to TTM Operating Expense Ratio 0.3x
Levered FCF Margin 5.1%Cash from Operations Growth (YoY) -1.4%Cash from Investing Growth (YoY) -38.6%Cash from Financing Growth (YoY) -50.6%Levered FCF Growth (YoY) -10.1%
Copyright © 2015 by Software Equity Group, L.L.C., All Rights Reserved March 2015 Monthly Flash Report
Income Statement Analysis (Median)
Balance Sheet Analysis (Median)
Cash Flow Statement Analysis (Median)
-30%
-25%
-20%
-15%
-10%
-5%
0%
5%
10%
15%
20%
Internet Infrastructure Stock Market Return: January - February 2015
Infrastructure S&P NASDAQ SEG Internet Index
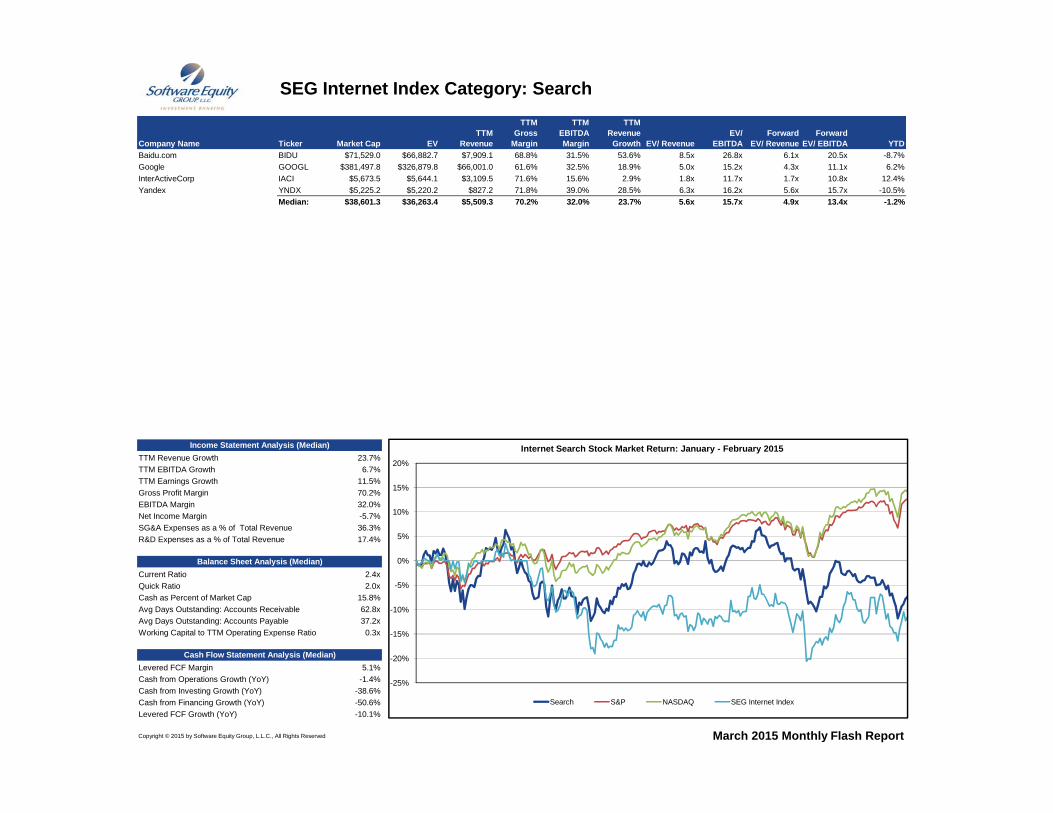
SEG Internet Index Category: Search
Company Name Ticker Market Cap EVTTM
Revenue
TTM Gross
Margin
TTM EBITDA Margin
TTM Revenue
Growth EV/ RevenueEV/
EBITDAForward
EV/ RevenueForward
EV/ EBITDA YTDBaidu.com BIDU $71,529.0 $66,882.7 $7,909.1 68.8% 31.5% 53.6% 8.5x 26.8x 6.1x 20.5x -8.7%Google GOOGL $381,497.8 $326,879.8 $66,001.0 61.6% 32.5% 18.9% 5.0x 15.2x 4.3x 11.1x 6.2%InterActiveCorp IACI $5,673.5 $5,644.1 $3,109.5 71.6% 15.6% 2.9% 1.8x 11.7x 1.7x 10.8x 12.4%Yandex YNDX $5,225.2 $5,220.2 $827.2 71.8% 39.0% 28.5% 6.3x 16.2x 5.6x 15.7x -10.5%
Median: $38,601.3 $36,263.4 $5,509.3 70.2% 32.0% 23.7% 5.6x 15.7x 4.9x 13.4x -1.2%
TTM Revenue Growth 23.7%TTM EBITDA Growth 6.7%TTM Earnings Growth 11.5%Gross Profit Margin 70.2%EBITDA Margin 32.0%Net Income Margin -5.7%SG&A Expenses as a % of Total Revenue 36.3%R&D Expenses as a % of Total Revenue 17.4%
Current Ratio 2.4xQuick Ratio 2.0xCash as Percent of Market Cap 15.8%Avg Days Outstanding: Accounts Receivable 62.8xAvg Days Outstanding: Accounts Payable 37.2xWorking Capital to TTM Operating Expense Ratio 0.3x
Levered FCF Margin 5.1%Cash from Operations Growth (YoY) -1.4%Cash from Investing Growth (YoY) -38.6%Cash from Financing Growth (YoY) -50.6%Levered FCF Growth (YoY) -10.1%
Copyright © 2015 by Software Equity Group, L.L.C., All Rights Reserved
Income Statement Analysis (Median)
Balance Sheet Analysis (Median)
Cash Flow Statement Analysis (Median)
March 2015 Monthly Flash Report
-25%
-20%
-15%
-10%
-5%
0%
5%
10%
15%
20%
Internet Search Stock Market Return: January - February 2015
Search S&P NASDAQ SEG Internet Index

SEG Internet Index Category: Services
Company Name Ticker Market Cap EVTTM
Revenue
TTM Gross
Margin
TTM EBITDA Margin
TTM Revenue
Growth EV/ RevenueEV/
EBITDAForward
EV/ RevenueForward
EV/ EBITDA YTDAngie's List ANGI $394.4 $389.0 $315.0 73.0% -1.4% 28.2% 1.2x n/a 1.1x 13.5x 5.6%Bankrate RATE $1,332.6 $1,453.6 $531.0 65.3% 22.5% 24.0% 2.7x 12.2x 2.5x 9.2x 3.3%Carbonite CARB $406.4 $345.3 $122.6 68.5% 4.7% 14.4% 2.8x 59.6x 2.5x 16.7x 6.6%Care.com CRCM $251.6 $168.5 $105.7 75.9% -31.2% 41.1% 1.6x n/a 1.1x n/a 1.8%Cimpress CMPR $2,722.4 $3,049.9 $1,398.2 62.7% 14.6% 15.2% 2.2x 15.0x 2.0x 12.1x 13.1%Coupons.com COUP $779.5 $585.9 $221.8 61.1% -5.2% 32.1% 2.6x n/a 2.1x 15.1x -43.5%eHealth EHTH $162.1 $110.7 $179.7 97.5% 0.5% 0.3% 0.6x 115.7x 0.7x n/a -62.4%Everyday Health EVDY $440.7 $423.1 $184.3 73.3% 14.5% 18.3% 2.3x 15.8x 2.0x 10.6x -2.3%GrubHub GRUB $3,424.9 $3,111.7 $253.9 65.5% 26.7% 85.1% 12.3x 46.0x 8.9x 28.8x 14.9%LendingClub LC $7,577.5 n/a $211.1 81.9% n/a 115.4% n/a n/a n/a n/a -18.3%LifeLock LOCK $1,314.5 $1,040.6 $476.0 74.7% 7.8% 28.8% 2.2x 27.9x 1.8x 13.1x -12.0%Monster Worldwide MWW $610.3 $781.6 $770.0 47.6% 8.9% -4.7% 1.0x 11.4x 1.0x 6.8x 47.7%Qihoo QIHU $5,758.7 $5,772.9 $1,181.1 80.3% 24.7% 113.8% 4.9x 19.8x 3.2x 9.1x -23.4%QuinStreet QNST $298.5 $252.1 $275.3 10.7% -0.6% -7.6% 0.9x n/a 0.9x 15.9x 11.8%Shutterfly SFLY $1,812.4 $1,701.9 $921.6 50.9% 9.8% 17.6% 1.8x 18.9x 1.6x 8.9x 15.1%Tree.Com TREE $603.9 $517.7 $167.4 95.3% 8.1% 20.2% 3.1x 38.2x 2.6x 18.5x 12.0%Wix.com WIX $698.2 $612.2 $141.8 81.6% -37.2% 76.3% 4.3x n/a 3.0x 135.0x -12.9%Xoom XOOM $658.0 $507.0 $159.1 71.5% 5.9% 30.2% 3.2x 53.8x 2.6x 21.8x -1.6%Zillow Z $6,594.4 $6,221.8 $325.9 91.0% -0.8% 65.0% 19.1x n/a 9.5x 51.5x 10.7%
Median: $698.2 $599.0 $253.9 73.0% 6.9% 28.2% 2.5x 23.8x 2.1x 14.3x 3.3%
TTM Revenue Growth 28.2%TTM EBITDA Growth 15.0%TTM Earnings Growth -95.4%Gross Profit Margin 73.0%EBITDA Margin 6.9%Net Income Margin -7.6%SG&A Expenses as a % of Total Revenue 50.6%R&D Expenses as a % of Total Revenue 19.7%
Current Ratio 2.7xQuick Ratio 2.4xCash as Percent of Market Cap 15.5%Avg Days Outstanding: Accounts Receivable 20.2xAvg Days Outstanding: Accounts Payable 56.8xWorking Capital to TTM Operating Expense Ratio 0.4x
Levered FCF Margin 6.8%Cash from Operations Growth (YoY) 55.1%Cash from Investing Growth (YoY) -97.1%Cash from Financing Growth (YoY) 74.6%Levered FCF Growth (YoY) 17.0%
Copyright © 2015 by Software Equity Group, L.L.C., All Rights Reserved March 2015 Monthly Flash Report
Income Statement Analysis (Median)
Balance Sheet Analysis (Median)
Cash Flow Statement Analysis (Median)
-30%
-25%
-20%
-15%
-10%
-5%
0%
5%
10%
15%
20%
Internet Services Stock Market Return: January - February 2015
Services S&P NASDAQ SEG Internet Index
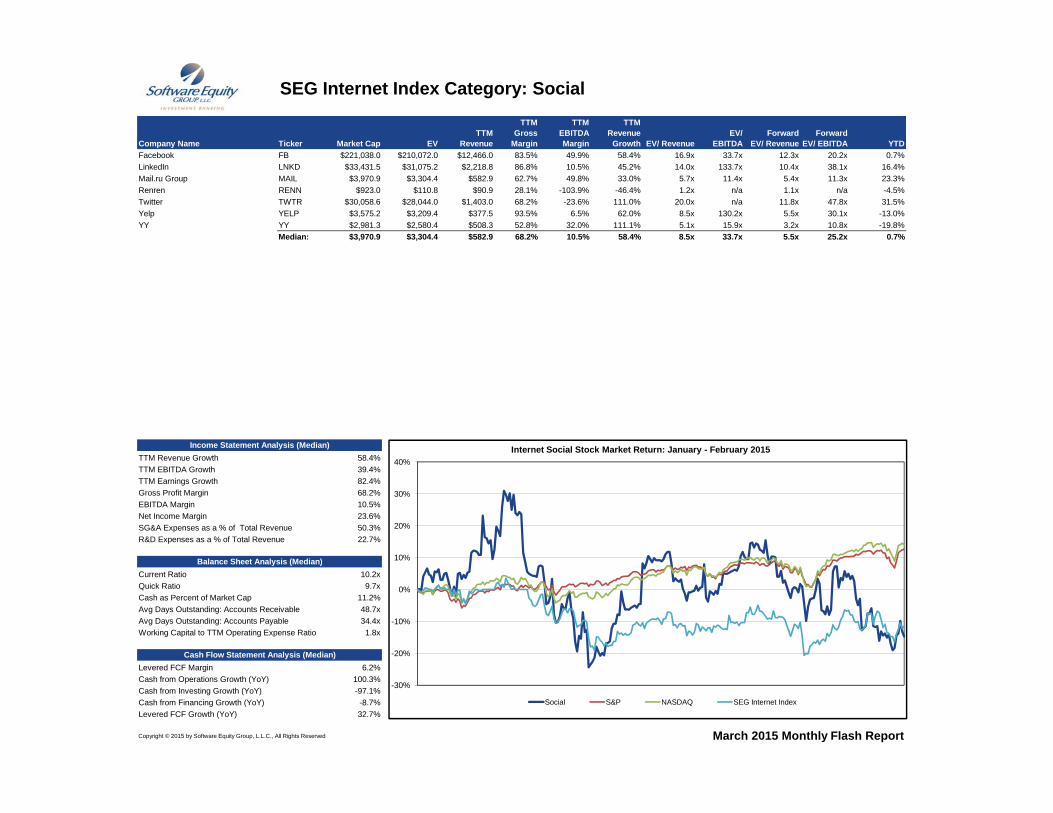
SEG Internet Index Category: Social
Company Name Ticker Market Cap EVTTM
Revenue
TTM Gross
Margin
TTM EBITDA Margin
TTM Revenue
Growth EV/ RevenueEV/
EBITDAForward
EV/ RevenueForward
EV/ EBITDA YTDFacebook FB $221,038.0 $210,072.0 $12,466.0 83.5% 49.9% 58.4% 16.9x 33.7x 12.3x 20.2x 0.7%LinkedIn LNKD $33,431.5 $31,075.2 $2,218.8 86.8% 10.5% 45.2% 14.0x 133.7x 10.4x 38.1x 16.4%Mail.ru Group MAIL $3,970.9 $3,304.4 $582.9 62.7% 49.8% 33.0% 5.7x 11.4x 5.4x 11.3x 23.3%Renren RENN $923.0 $110.8 $90.9 28.1% -103.9% -46.4% 1.2x n/a 1.1x n/a -4.5%Twitter TWTR $30,058.6 $28,044.0 $1,403.0 68.2% -23.6% 111.0% 20.0x n/a 11.8x 47.8x 31.5%Yelp YELP $3,575.2 $3,209.4 $377.5 93.5% 6.5% 62.0% 8.5x 130.2x 5.5x 30.1x -13.0%YY YY $2,981.3 $2,580.4 $508.3 52.8% 32.0% 111.1% 5.1x 15.9x 3.2x 10.8x -19.8%
Median: $3,970.9 $3,304.4 $582.9 68.2% 10.5% 58.4% 8.5x 33.7x 5.5x 25.2x 0.7%
TTM Revenue Growth 58.4%TTM EBITDA Growth 39.4%TTM Earnings Growth 82.4%Gross Profit Margin 68.2%EBITDA Margin 10.5%Net Income Margin 23.6%SG&A Expenses as a % of Total Revenue 50.3%R&D Expenses as a % of Total Revenue 22.7%
Current Ratio 10.2xQuick Ratio 9.7xCash as Percent of Market Cap 11.2%Avg Days Outstanding: Accounts Receivable 48.7xAvg Days Outstanding: Accounts Payable 34.4xWorking Capital to TTM Operating Expense Ratio 1.8x
Levered FCF Margin 6.2%Cash from Operations Growth (YoY) 100.3%Cash from Investing Growth (YoY) -97.1%Cash from Financing Growth (YoY) -8.7%Levered FCF Growth (YoY) 32.7%
Copyright © 2015 by Software Equity Group, L.L.C., All Rights Reserved
Balance Sheet Analysis (Median)
Cash Flow Statement Analysis (Median)
March 2015 Monthly Flash Report
Income Statement Analysis (Median)
-30%
-20%
-10%
0%
10%
20%
30%
40%Internet Social Stock Market Return: January - February 2015
Social S&P NASDAQ SEG Internet Index
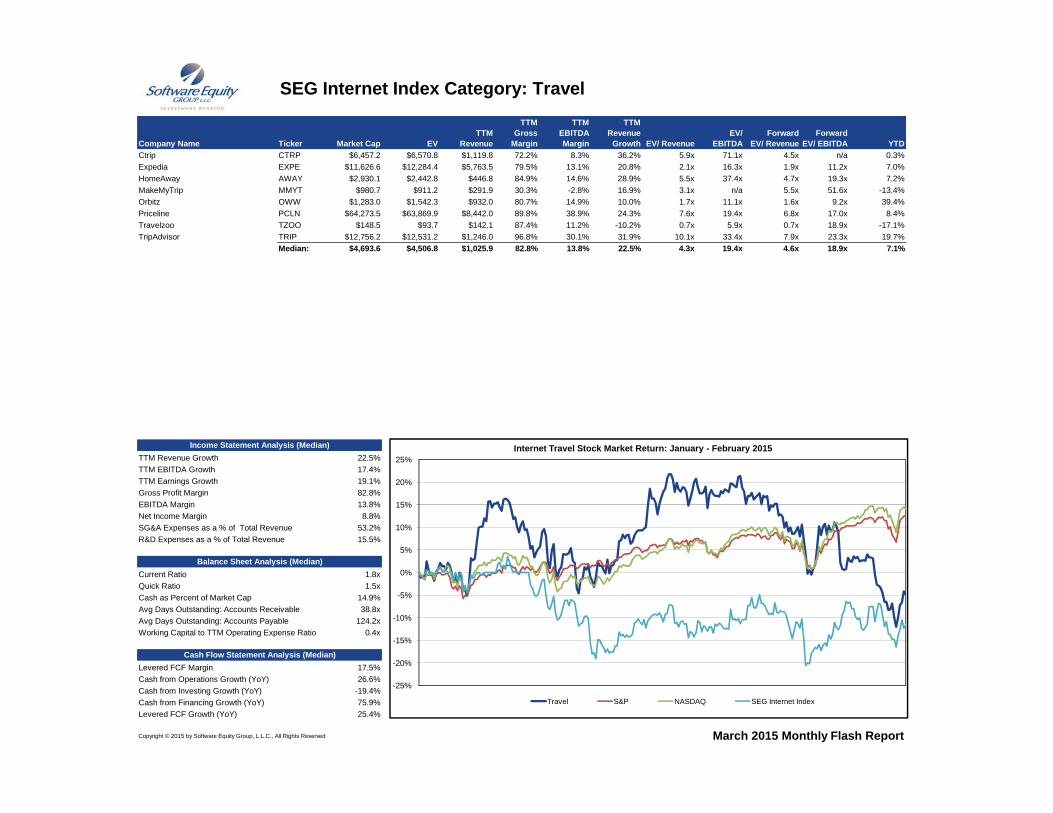
SEG Internet Index Category: Travel
Company Name Ticker Market Cap EVTTM
Revenue
TTM Gross
Margin
TTM EBITDA Margin
TTM Revenue
Growth EV/ RevenueEV/
EBITDAForward
EV/ RevenueForward
EV/ EBITDA YTDCtrip CTRP $6,457.2 $6,570.8 $1,119.8 72.2% 8.3% 36.2% 5.9x 71.1x 4.5x n/a 0.3%Expedia EXPE $11,626.6 $12,284.4 $5,763.5 79.5% 13.1% 20.8% 2.1x 16.3x 1.9x 11.2x 7.0%HomeAway AWAY $2,930.1 $2,442.8 $446.8 84.9% 14.6% 28.9% 5.5x 37.4x 4.7x 19.3x 7.2%MakeMyTrip MMYT $980.7 $911.2 $291.9 30.3% -2.8% 16.9% 3.1x n/a 5.5x 51.6x -13.4%Orbitz OWW $1,283.0 $1,542.3 $932.0 80.7% 14.9% 10.0% 1.7x 11.1x 1.6x 9.2x 39.4%Priceline PCLN $64,273.5 $63,869.9 $8,442.0 89.8% 38.9% 24.3% 7.6x 19.4x 6.8x 17.0x 8.4%Travelzoo TZOO $148.5 $93.7 $142.1 87.4% 11.2% -10.2% 0.7x 5.9x 0.7x 18.9x -17.1%TripAdvisor TRIP $12,756.2 $12,531.2 $1,246.0 96.8% 30.1% 31.9% 10.1x 33.4x 7.9x 23.3x 19.7%
Median: $4,693.6 $4,506.8 $1,025.9 82.8% 13.8% 22.5% 4.3x 19.4x 4.6x 18.9x 7.1%
TTM Revenue Growth 22.5%TTM EBITDA Growth 17.4%TTM Earnings Growth 19.1%Gross Profit Margin 82.8%EBITDA Margin 13.8%Net Income Margin 8.8%SG&A Expenses as a % of Total Revenue 53.2%R&D Expenses as a % of Total Revenue 15.5%
Current Ratio 1.8xQuick Ratio 1.5xCash as Percent of Market Cap 14.9%Avg Days Outstanding: Accounts Receivable 38.8xAvg Days Outstanding: Accounts Payable 124.2xWorking Capital to TTM Operating Expense Ratio 0.4x
Levered FCF Margin 17.5%Cash from Operations Growth (YoY) 26.6%Cash from Investing Growth (YoY) -19.4%Cash from Financing Growth (YoY) 75.9%Levered FCF Growth (YoY) 25.4%
Copyright © 2015 by Software Equity Group, L.L.C., All Rights Reserved March 2015 Monthly Flash Report
Income Statement Analysis (Median)
Balance Sheet Analysis (Median)
Cash Flow Statement Analysis (Median)
-25%
-20%
-15%
-10%
-5%
0%
5%
10%
15%
20%
25%Internet Travel Stock Market Return: January - February 2015
Travel S&P NASDAQ SEG Internet Index