software for glucose data management - menarini diagnostics · indicates that the result has been...
TRANSCRIPT

Software for glucosedata management
Manual

Table of contents
Fundamentals........................................................................................2Icons....................................................................................................3Home Page............................................................................................5
Data transfer......................................................................................7Print-outs...........................................................................................7 Import/Export....................................................................................8Patient.............................................................................................13Glycaemia.........................................................................................16
List of results..................................................................................16Diary of results...............................................................................17
Reports............................................................................................18Line graph......................................................................................18Day chart.......................................................................................21Bar chart.......................................................................................23
Other data.......................................................................................24Configuration....................................................................................26
Tests.............................................................................................26Patient...........................................................................................28Event Descriptions...........................................................................29System..........................................................................................32
Printing............................................................................................33
1
Fundamentals
Using the mouse
To access the required procedure, click left button of mouse.
Entering information in the display screen fields:
Use the tab key to pass to the next field on the display screen; press the shift + tab keys simultaneously to return to the previous field. Use the mouse also to move directly to the desired field (click on it with the left button).
Dates
For fields containing dates, the required date can be entered in any dd/mm/yyyy format, provided the day – month – year are separated in some way, even with a space. For example 01/01/2008 can be written in any of the following ways: 01-01-2008; 01.01.2008; 01/01/2008; 01\01\2008; 01 01 2008.
2
Icons
The main icons used in the programme and their relative functions are illustrated below.
Many other icons are present in the application. Their use is illustrated with a brief description that appears when the mouse hovers over the button.
This icon is present at the beginning of each line of a list of information and allows you to select a line, which is then highlighted in a different colour (green, red, blue) from the others.
Present at the end of each line of a list of information; if selected, it allows you to consult further information related to that indicated on the selected line.
Enables new information to be entered. For example, in “List of results”, information relating to a new glycaemia reading can be entered.
Enables all information relating to the selected line to be deleted.
Associated with a list, it allows you to delete all information in the list.
Present at the end of each line of a list of information, it allows you to edit data relating to that line.
For confirming changes just made to data
Allows you to delete current operation, with consequent loss of information just entered or edited.
Allows you to view graph relating to the data managed by current function.
Exports results in csv format.
Prints information managed by current function.
Prints information managed by the current function.
Present in the configuration area of the application, it allows you to enter new information.
Present in pages relating to a patient’s data management, it allows you to enter new information on insulin therapy and the periods into which the patient’s day is divided.
This icon allows you to enter all personal and clinical information relating to a new patient.
It allows you to edit a patient’s data.
It allows you to confirm the entry or the change in a patient’s data.
3
Associated with glycaemia result, this icon indicates that the result has been entered manually.
Associated with glycaemia result, it indicates that the result, initially read by an instrument, has subsequently been modified manually one or more times. If selected, it enables the original value to be restored.
Associated with the glycaemia result, it indicates that the result has been imported from a Dialogue file.
Associated with the glycaemia result, it indicates that the result has been imported from a MenaDiab file.
Allows graphic comparison of glycaemia results for two different time periods.
Allows dots on glycaemia results graph to be joined by a broken line.
Gives access to a calendar.
Icon associated with a filter, it allows you to obtain a list of information consistent with the filter settings.
This icon indicates that subsequently listed items are errors made while entering new information
If selected, this icon starts the procedure for importing glycaemia results from the meter connected to the PC.
Imports glycaemia results from file.
Exports glycaemia results to a file
4

Home Page
The information appearing on the home page regards the selected patient, whose name appears on the top page of the application.
The page is divided into three areas:
Diary
The left part of the page shows a diary displaying glycaemia results for 30 days prior to the last result acquired.
Results with a value above high level are shown in red, while those below low level are shown in blue. Results between high and low levels are shown in white.
Each result may be flanked by one of the following icons:
indicates that the result has been entered manually
indicates that the result has been read by an instrument and subsequently changed manually.
indicates that the result has been imported from a TXT file generated by Dialogue software.
indicates that the result has been imported from a MenaDiab file.
Results graph
The graph at top right of the page displays glycaemia results for the last two weeks or the last month prior to the last result acquired.
5

Data transfer
The options available in this area allow the user to:
• Acquire data (see Home Page - transfer)
• Print imported data (See Home Page – print-outs )
• Export and import results in file form (See Home Page – import/export )
The image and the name of the last instrument from which results have been acquired appear on the left. Immediately
below appear the words “Select Other”, followed by the icon. By selecting one of these two, the area changes to display a list of instruments associated with the patient. They appear in a list that scrolls to the right or left by selecting the arrows on the right or left.
6
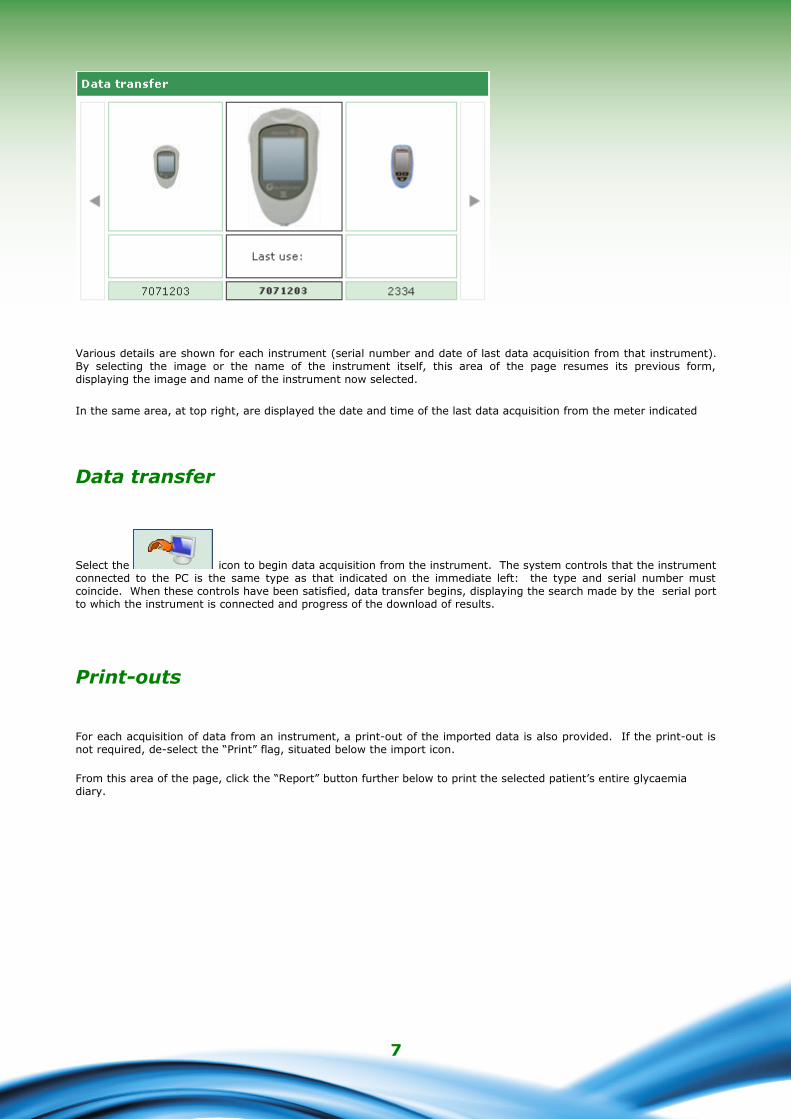
Various details are shown for each instrument (serial number and date of last data acquisition from that instrument). By selecting the image or the name of the instrument itself, this area of the page resumes its previous form, displaying the image and name of the instrument now selected.
In the same area, at top right, are displayed the date and time of the last data acquisition from the meter indicated
Data transfer
Select the icon to begin data acquisition from the instrument. The system controls that the instrument connected to the PC is the same type as that indicated on the immediate left: the type and serial number must coincide. When these controls have been satisfied, data transfer begins, displaying the search made by the serial port to which the instrument is connected and progress of the download of results.
Print-outs
For each acquisition of data from an instrument, a print-out of the imported data is also provided. If the print-out is not required, de-select the “Print” flag, situated below the import icon.
From this area of the page, click the “Report” button further below to print the selected patient’s entire glycaemia diary.
7

Import/Export
Select the icon to export test results.
Select the icon to display a pop-up menu in which two dates can be indicated to delineate the period of time to which the exported tests must refer.
Select the icon to begin exporting test results.
Select the icon to import test results.
Select the icon to display a pop-up menu from which you can select the file from which information is to be acquired, by specifying whether it is a new or old format TXT file. In addition two dates can be specified to delineate the period of time to which the imported tests must refer.
Select the icon to begin importing results.
Add Patient
This function is accessed from the patient function and serves to register a new patient.
An identical page is used to edit the data of a patient already registered: in this case the information stored in the system will be displayed and the glucometers are managed together with the other information.
The page is divided into two parts, an upper grey area and a lower area with the menu.
In passing from one item to another in the menu, the information entered is stored but not saved, even when the lower part of the page changes appearance depending on the item (tab) selected.
8

The information entered is memorized only after the icon has been selected and no errors have been found in the data entered. Any errors are listed in a box appearing at the top of the window.
The error box is positioned so that it is possible to view the list of errors and at the same time pass from one menu item to another, or to the grey band at the top to make the necessary corrections.
Select the icon to delete the current operation.
Basic information regarding the patient, e.g. name, surname, date of birth, sex, can be entered in the grey part of the page. Two dates (which cannot be changed)are also displayed and set to the current date; these indicate the date of patient registration and the date of the last change made. While the registration date remains the same over time, each time information regarding the patient is changed, the date of the last change varies to assume the value of the date of change.
The code (patient ID) assigned to each patient is displayed in this part of the page. This information may be indicated by the system (in which case it cannot be modified) or entered by the user. The method of entry and code format depend on the settings specified in configuration – system – parameters.
The menu at the bottom of the page allows all patient information necessary for the system to be entered/edited.
Personal data
This item of the menu manages the patient’s main personal details (address, telephone number, etc.).
9

Clinical data
This item of the menu manages all the patient’s clinical details, including type of diabetes, date of diagnosis, reference doctor, high level and low level.
Insulin therapy
This option enables the patient’s insulin therapy to be specified over a 24 hour period, (time, type and dose of insulin).
The icon (top right) enables a new prescription to be entered. Each line of the list ends with an icon which allows the prescription to be deleted, after confirming.
Periods
A patient’s day is divided into time periods. The system proposes a standard sub-division which, through this item of the menu, can be personalised for each individual patient.
10

The icon (at top right) allows a new period to be entered; it is necessary to indicate start and end time, the period, (a brief description e.g. breakfast), and whether it is a before-meal time band). For the sub-division of the day to be accepted, the time periods must comply with the following conditions:
• The “Start time” of a period must coincide with the “End time” of the previous period.
• The “Start time” of the first period must coincide with the “End time” of the last period.
• The individual periods must be consecutive.
Each line of the list of periods ends with an icon allowing the period to be deleted, after confirming.
Meters
After selecting the icon to confirm the data entered, if no errors have been made, the following page appears, allowing one or two meters to be associated with the newly-registered patient.
The right side of the page displays a list of all types of meters managed by the application. To associate a meter with
a patient, select the meter by clicking on the word “select” or on the icon. In this way the selected meter is added to the list of meters on the left side of the page for which serial numbers must be specified. In this list the same type of meter may appear more than once, but should have a different serial number. Each line of the list of meters
associated with a patient ends with an icon. This allows the meter to be deleted, after confirming. New meters can be added to the list of available meters (list on the right), by choosing “Select”, next to the meter generically denominated “new” at the bottom of the list.
Again, select the icon to make the association definitive: associations become definitive if no errors are found.
To delete the operation select the icon. The patient will remain registered with all previously entered information, but will have no associated meter.
11

Functions
The application is structured in 4 distinct sections described below from top to bottom:
Information
To return to Home Page but also to access Help, Info, Contact and Credits.
Top
On the left appears the name of the selected patient to whom all information consultable in the various pages of the application refers. The “Refresh” function on the right updates the Home Page.
Menu
The menu accesses the functions described in this section. When an icon is selected its background becomes white, while the others remain grey.
Work Area
The area where data selected from the Menu section are displayed.
12

Patient
This function manages information relating to a patient registered in the application.
The page is divided into three areas: the filter (at the top), the list of patients (at the centre) the operations toolbar (at the bottom).
The list of patients displays only some information for each patient (I.D., surname, name, date of birth, type of diabetes, therapy, age).
To select a patient in the list, select the icon at the beginning of the corresponding line, which will then be highlighted in green.
The list of patients depends on the data specified in the filter (grey part at the top of the page): only those patients
who conform to all the specified characteristics are entered in the list. Select the icon to update the list in accordance with pre-set indications.
Print the list of patients by selecting the icon on the operations toolbar. Select the icon to delete the selected patient, after confirming.
Select, respectively, the icons to edit information relating to the selected patient or enter a new patient. Both icons access the same page (See Add Patient).
13

In the event of a change being made on the page, the information stored in the system regarding the selected patient is displayed; In the event of a new patient’s data being entered, however, no information is displayed. In either case,
two icons are present at the bottom of the page: The icon confirms the information entered or edited on the
page, while the icon cancels the current operation.
14

Glycaemia
This function allows you to consult glycaemia information relating to the patient whose name appears on the left, immediately below the function menu.
The page has a sub-menu (on the right of the green band at the top) which accesses information on glycaemia.
List of results
Select this item from the menu to view and manage glycaemia information, displayed as a list of results.
The diary on the left of the page displays glycaemia results.
Results showing a value above high level are displayed in red, while those displayed in blue have a value below low level. Results shown in white have a value between low and high level. The value of the two levels is indicated at the top left of the page.
The number of readings present in the list is indicated at the bottom left, below the list of results.
One of the following icons may appear alongside each result:
indicates that the result has been entered manually.
indicates that the result has been read from an instrument and subsequently changed manually.
indicates that the result has been imported from a TXT file generated by Dialogue software.
indicates that the result has been imported from a MenaDiab file.
The details relating to the result selected in the diary are displayed on the right side of the page, highlighted by a coloured line: green if the result comes within low and high level, red if the result is above high level and blue if the result is below low level.
The operations toolbar at the bottom of the page, from left to right, allows you to:
15
• Confirm variation or entry of data
• Delete the selected result, after confirming.
• Enter a new result
• Export in an Excel file, the results obtained within a specified time interval, indicating the two dates in the pop-up menu displayed on selecting the icon.
• Print the report
Diary of results
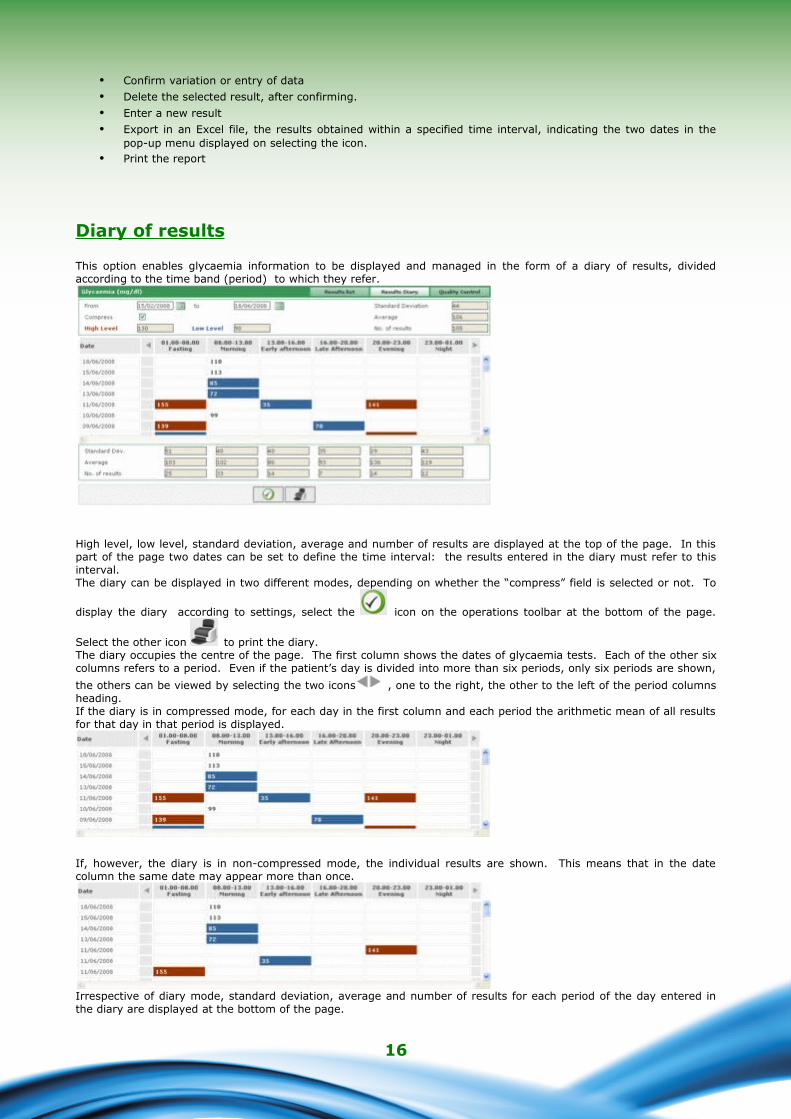
This option enables glycaemia information to be displayed and managed in the form of a diary of results, divided according to the time band (period) to which they refer.
High level, low level, standard deviation, average and number of results are displayed at the top of the page. In this part of the page two dates can be set to define the time interval: the results entered in the diary must refer to this interval. The diary can be displayed in two different modes, depending on whether the “compress” field is selected or not. To
display the diary according to settings, select the icon on the operations toolbar at the bottom of the page.
Select the other icon to print the diary.The diary occupies the centre of the page. The first column shows the dates of glycaemia tests. Each of the other six columns refers to a period. Even if the patient’s day is divided into more than six periods, only six periods are shown,
the others can be viewed by selecting the two icons , one to the right, the other to the left of the period columns heading. If the diary is in compressed mode, for each day in the first column and each period the arithmetic mean of all results for that day in that period is displayed.
If, however, the diary is in non-compressed mode, the individual results are shown. This means that in the date column the same date may appear more than once.
Irrespective of diary mode, standard deviation, average and number of results for each period of the day entered in the diary are displayed at the bottom of the page.
16
Quality control
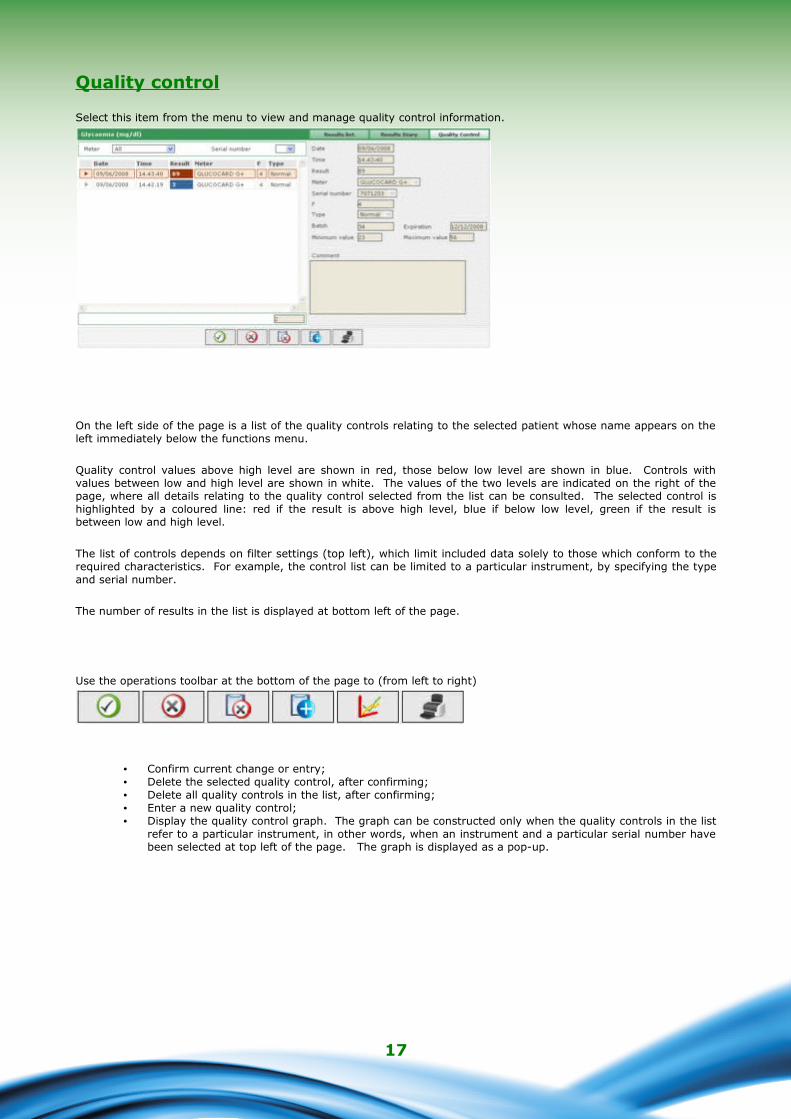
Select this item from the menu to view and manage quality control information.
On the left side of the page is a list of the quality controls relating to the selected patient whose name appears on the left immediately below the functions menu.
Quality control values above high level are shown in red, those below low level are shown in blue. Controls with values between low and high level are shown in white. The values of the two levels are indicated on the right of the page, where all details relating to the quality control selected from the list can be consulted. The selected control is highlighted by a coloured line: red if the result is above high level, blue if below low level, green if the result is between low and high level.
The list of controls depends on filter settings (top left), which limit included data solely to those which conform to the required characteristics. For example, the control list can be limited to a particular instrument, by specifying the type and serial number.
The number of results in the list is displayed at bottom left of the page.
Use the operations toolbar at the bottom of the page to (from left to right)
• Confirm current change or entry;• Delete the selected quality control, after confirming;• Delete all quality controls in the list, after confirming; • Enter a new quality control;• Display the quality control graph. The graph can be constructed only when the quality controls in the list
refer to a particular instrument, in other words, when an instrument and a particular serial number have been selected at top left of the page. The graph is displayed as a pop-up.
17

The two dates in the pop-up define the time interval to which the quality controls considered for the graph must refer. Initially the two dates delineate a time interval corresponding to the last three months. These
dates can be changed and a new graph obtained by selecting the icon at the bottom of the pop-up.
To print the graph select the icon at top right.
• Print the list of quality controls
Reports
This function creates graphs using glycaemia data relating to the patient whose name appears on the left immediately below the function menu.
Select the desired type of graph from the sub-menu on the page (on the right of the green band at the top).
Line graph
Select this item from the menu to consult glycaemia results in line graph form.
18

The graph always displays two lines, a red one indicating high level and a blue one indicating low level of glycaemia.
By default, the results shown on the graph refer to the thirty days prior to the last result. The period of time to which the data refer can be varied by changing the “from” and “to” dates”. The period of time can also be varied by selecting a period of weeks (field below the “from” field).
The selected time period determines the abscissae axis on the graph, in which the dates of the days included in the period are displayed. Conversely, the axis of ordinates is determined by the value of glycaemia results. Both axes on
the graph can be translated using the icons below the abscissae axis and the icons on the left of the axis of ordinates.
A sub-set of the results for the selected period can be included in the graphs; for example, only those that refer to a given period in which the day is divided (“period” field).
By default the results are displayed on the graph by a black dot. By positioning the mouse on one of the dots it is possible to read the day and time the result was recorded, in addition to the value and measurement unit used.
Results referring to a particular day of the week can be highlighted; for example to highlight all results that refer to Monday, just select MON in the grey part.
and then select the icon on the right of the grey band on the page. By way of example, the following graph will be displayed:
19

With this type of graph, by selecting the icon it is possible to join up all the dots with a broken line.
Comparison of two line graphs referring to two different time periods is also possible. To obtain the two graphs, select
the icon: on the left of the grey band another two dates will be displayed in place of the period. The second graph refers to the time interval delineated by these two dates. To view and compare the two graphs select
the icon; below is an example of the page that will appear:
Any other setting selected for the graphs regarding days, time interval, dot joining, will apply to both graphs.
Select the icon to print the graph or graphs displayed on the page.
20
Cumulative Daily Profile
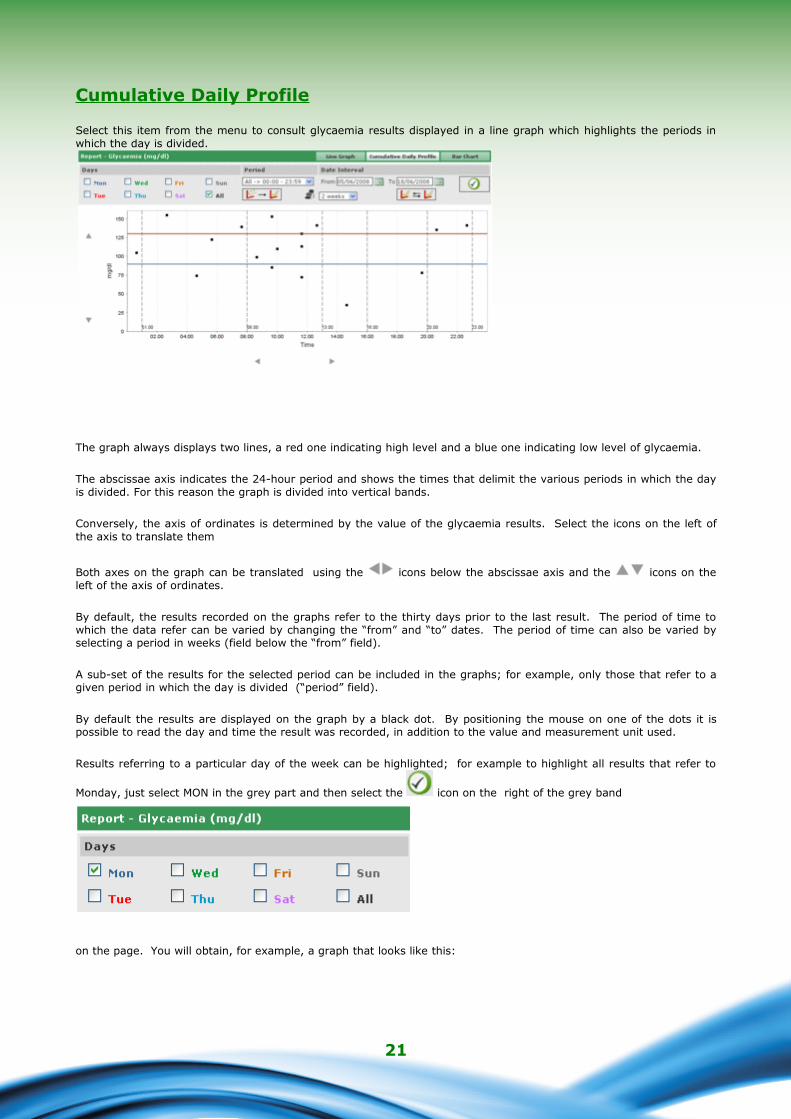
Select this item from the menu to consult glycaemia results displayed in a line graph which highlights the periods in which the day is divided.
The graph always displays two lines, a red one indicating high level and a blue one indicating low level of glycaemia.
The abscissae axis indicates the 24-hour period and shows the times that delimit the various periods in which the day is divided. For this reason the graph is divided into vertical bands.
Conversely, the axis of ordinates is determined by the value of the glycaemia results. Select the icons on the left of the axis to translate them
Both axes on the graph can be translated using the icons below the abscissae axis and the icons on the left of the axis of ordinates.
By default, the results recorded on the graphs refer to the thirty days prior to the last result. The period of time to which the data refer can be varied by changing the “from” and “to” dates. The period of time can also be varied by selecting a period in weeks (field below the “from” field).
A sub-set of the results for the selected period can be included in the graphs; for example, only those that refer to a given period in which the day is divided (“period” field).
By default the results are displayed on the graph by a black dot. By positioning the mouse on one of the dots it is possible to read the day and time the result was recorded, in addition to the value and measurement unit used.
Results referring to a particular day of the week can be highlighted; for example to highlight all results that refer to
Monday, just select MON in the grey part and then select the icon on the right of the grey band
on the page. You will obtain, for example, a graph that looks like this:
21

On this type of graph, by selecting the icon all the dots can be joined up with a broken line.
Comparison of two line graphs referring to two different time periods is also possible. To obtain the two graphs, select
the icon: on the left of the grey band another two dates will be displayed in place of the period. The second graph refers to the time interval delineated by these two dates. To view and compare the two graphs select
the icon; below is an example of the page that will appear:
Any other setting selected for the graphs regarding days, time interval, dot joining, will apply to both graphs.
Select the icon to print the graph or graphs displayed on the page.
22

Bar chart
Select this item from the menu to consult glycaemia results in a bar chart, one bar for each day of the week, and in a pie chart.
By default the results shown on the graph refer to the thirty days prior to the last result. The period of time to which the data refer can also be varied by changing the “from” and “to” dates. The period of time can also be varied by selecting a period in weeks (field to the right of the dates).
A sub-set of the results for the selected period can be included in the graphs; for example, only those that refer to a given period in which the day is divided (“period” field). Alternatively, the graphs can be limited solely to results that are above high level, below low level or between minimum and maximum level (“result of” field).
To view the graph in conformity with last settings, select the icon, also on the right of the grey band
To print the graphs select the icon, also on the right of the grey band,.
The mean of results and their standard deviation, in addition to the proportion of those included in the graph as opposed to total number are also shown on the grey band.
23

Other data
This function manages information regarding tests recognized by the application, with the exclusion of glycaemia , relating to a selected patient whose name appears on the left immediately below the functions menu. The application recognizes as data all tests recorded in configuration - tests – tests.
The left of the page is almost fully occupied by the list of test results for each of which only the date, acronym, result and measurement unit are displayed. The results of the various tests may be highlighted in red or blue. Results that are above the high level envisaged are highlighted in red, those below the low level in blue.
The list of controls depends on filter settings (top left), which limit the data included solely to those which conform to the required characteristics. For example, the list of results can be limited to a single type of data, by selecting the appropriate item in the filter data field. In this case, two fields will appear immediately below the data indicating respectively minimum and maximum level of the selected item.
The filter has a second field in which a sequence of characters can be entered. In this case only those tests which have the specified characters in their data acronym will be included in the list.
The number of results in the list is displayed at the bottom left of the page.
All information relating to the result selected in the list, highlighted by a coloured line, is displayed on the right of the page: red, if the result is above high level, blue if below low level, green if the result is between low and high level.
To select a result, select the icon at the beginning of the corresponding line.The operations toolbar at the bottom of the page, from left to right, allows you to:
24
• Confirm current change or entry
• Delete the selected result, after confirming
• Delete all results, after confirming;
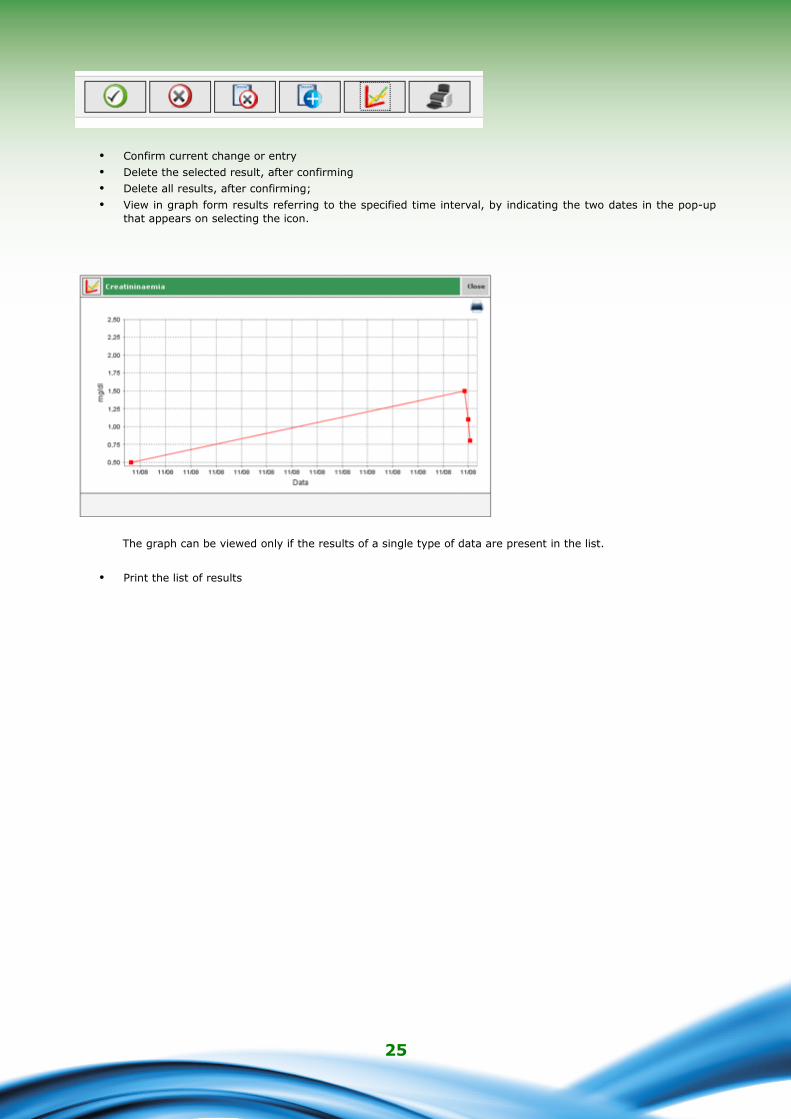
• View in graph form results referring to the specified time interval, by indicating the two dates in the pop-up that appears on selecting the icon.
The graph can be viewed only if the results of a single type of data are present in the list.
• Print the list of results
25

Configuration
Configuration is not part of the classic functions; it is an area of the application from which it is possible to manage information that is essential to the correct use and functioning of the functions proper.
The information managed is divided into four groups:
• tests
• patient
• event descriptions
• system
Tests
The ‘Tests” section in the configuration area has two menu items “Measurement units” and “Tests”.
Measurement Units
‘Measurement Units’ manages the units of measure in which the results of the various tests are expressed.
Measurement units already registered are shown line by line in a list. There are two buttons beside their description.
Select the icon to delete, if confirmed, the measurement unit. Select the icon to change the description of the measurement unit.
Select the icons at the end of the line, respectively to confirm and delete the change.
Select the icon at top right of the page to enter a new measurement unit. Select the icons at the end of the line respectively to confirm or delete.
Of all the units of measure, mg/dl and mmol/l are exceptions and must always be available. They are installed with the application and cannot be changed or deleted.
26
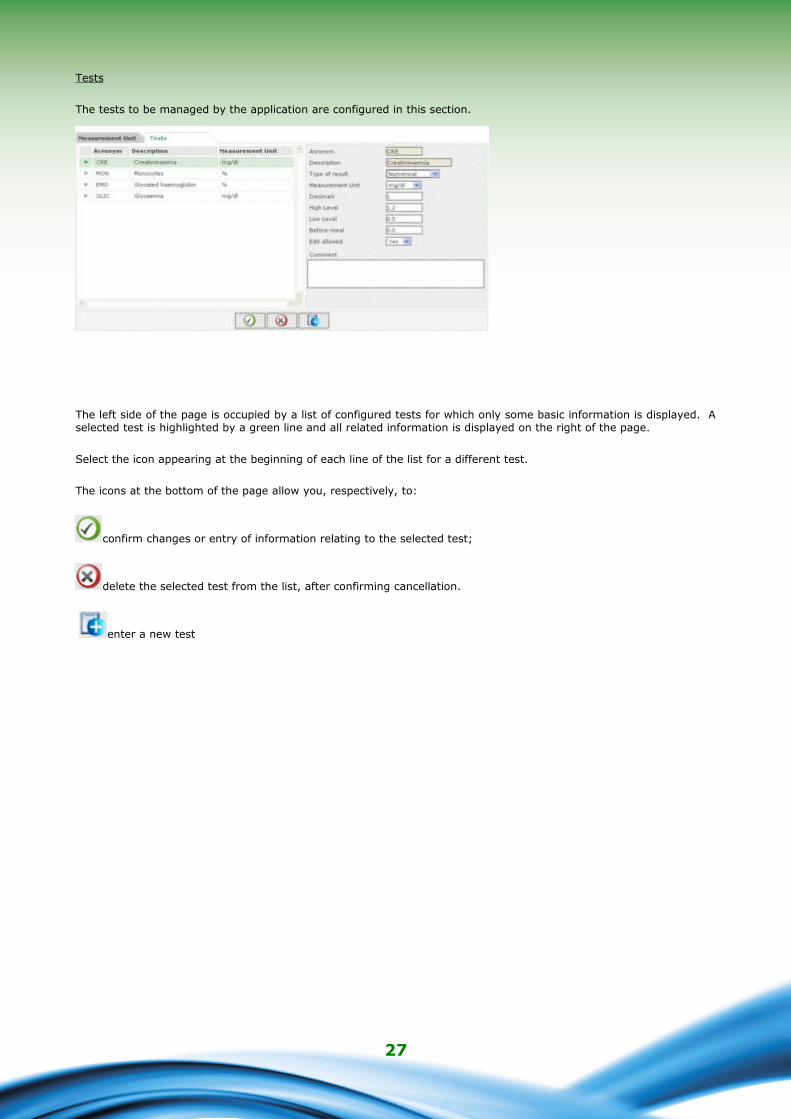
Tests
The tests to be managed by the application are configured in this section.
The left side of the page is occupied by a list of configured tests for which only some basic information is displayed. A selected test is highlighted by a green line and all related information is displayed on the right of the page.
Select the icon appearing at the beginning of each line of the list for a different test.
The icons at the bottom of the page allow you, respectively, to:
confirm changes or entry of information relating to the selected test;
delete the selected test from the list, after confirming cancellation.
enter a new test
27

Patient
The “Patient” section in the configuration area displays a menu with three items: “Diabetes”, “Type of insulin” and “Therapy”.
Diabetes
The various types of diabetes are managed in 'Diabetes'.
The types of diabetes already recorded are shown line by line in a list. There are two buttons beside the description.
Select the icon to delete, if confirmed, the type of diabetes or the icon to edit the description of diabetes type.
Select the icons at the end of the line, respectively, to confirm or cancel the change.
Select the icon at top right to enter a new type of diabetes. Select the icons at the end of the line respectively to confirm or cancel.
Type of insulin
The “Type of insulin” option serves to manage information regarding the various types of insulin.
28

The page is identical to the “Diabetes” page and should be treated in the same way.
Therapy
The “Therapy” option serves to manage information regarding the various treatments to control diabetes.
The page is identical to the “Diabetes” page and should be treated in the same way.
Event Descriptions
The “Event Descriptions” section in the configuration area has a menu with three items: “Events”, “Time Periods” and “Intervals”.
Events
The various events that may be associated with a diabetes reading are managed in “Events” .
Events already recorded are displayed line by line in a list. There are two icons beside the description. Select the
icon to delete, if confirmed, the event; select the to change the description of the event.
29
Select the icons at the end of the line, respectively, to confirm or cancel the change.
Select the icon at top right to enter a new event. Select the icons at the end of the line, respectively, to confirm or cancel.
An exception is the sub-set of events which must, always be available. They are configured with the application and cannot be changed or deleted.
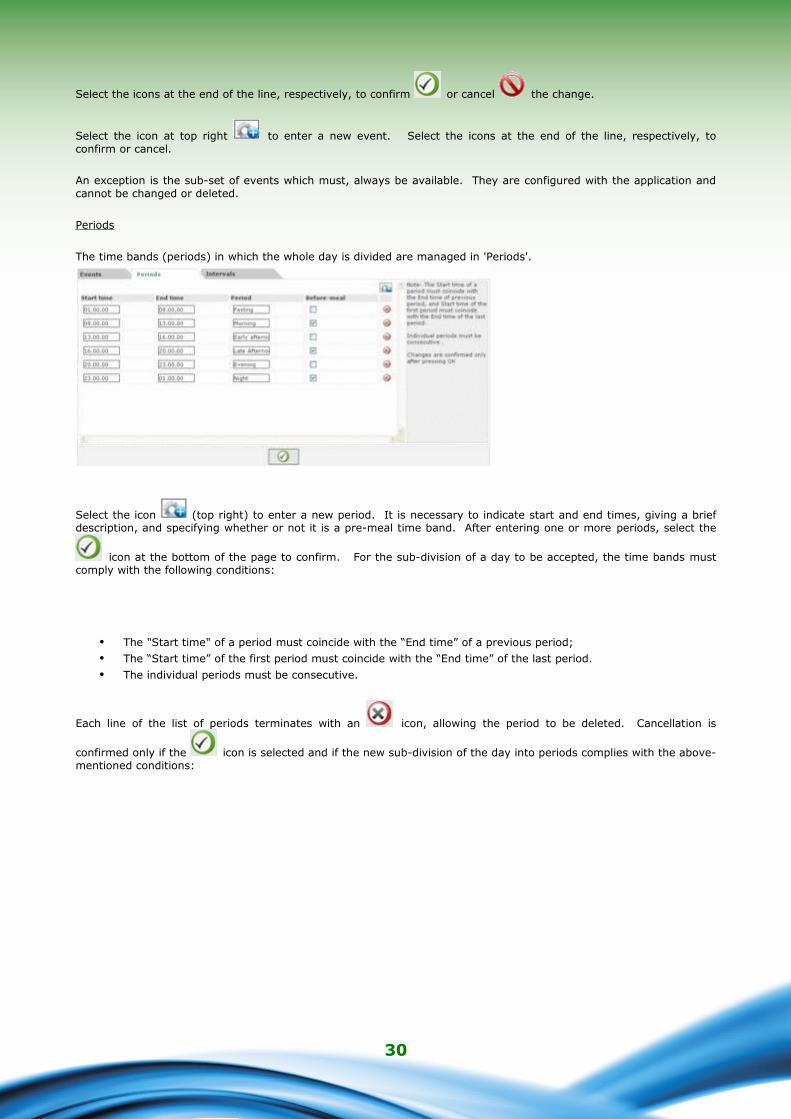
Periods
The time bands (periods) in which the whole day is divided are managed in 'Periods'.
Select the icon (top right) to enter a new period. It is necessary to indicate start and end times, giving a brief description, and specifying whether or not it is a pre-meal time band. After entering one or more periods, select the
icon at the bottom of the page to confirm. For the sub-division of a day to be accepted, the time bands must comply with the following conditions:
• The "Start time" of a period must coincide with the “End time” of a previous period;
• The “Start time” of the first period must coincide with the “End time” of the last period.
• The individual periods must be consecutive.
Each line of the list of periods terminates with an icon, allowing the period to be deleted. Cancellation is
confirmed only if the icon is selected and if the new sub-division of the day into periods complies with the above-mentioned conditions:
30
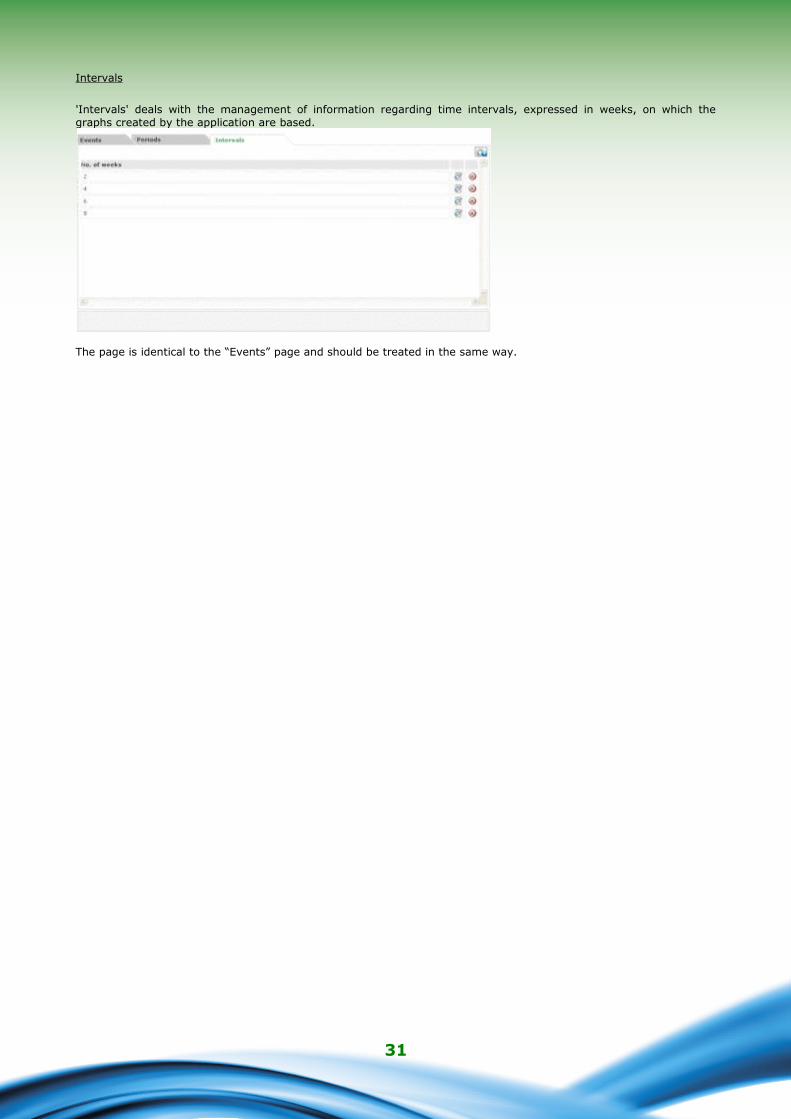
Intervals
'Intervals' deals with the management of information regarding time intervals, expressed in weeks, on which the graphs created by the application are based.
The page is identical to the “Events” page and should be treated in the same way.
31
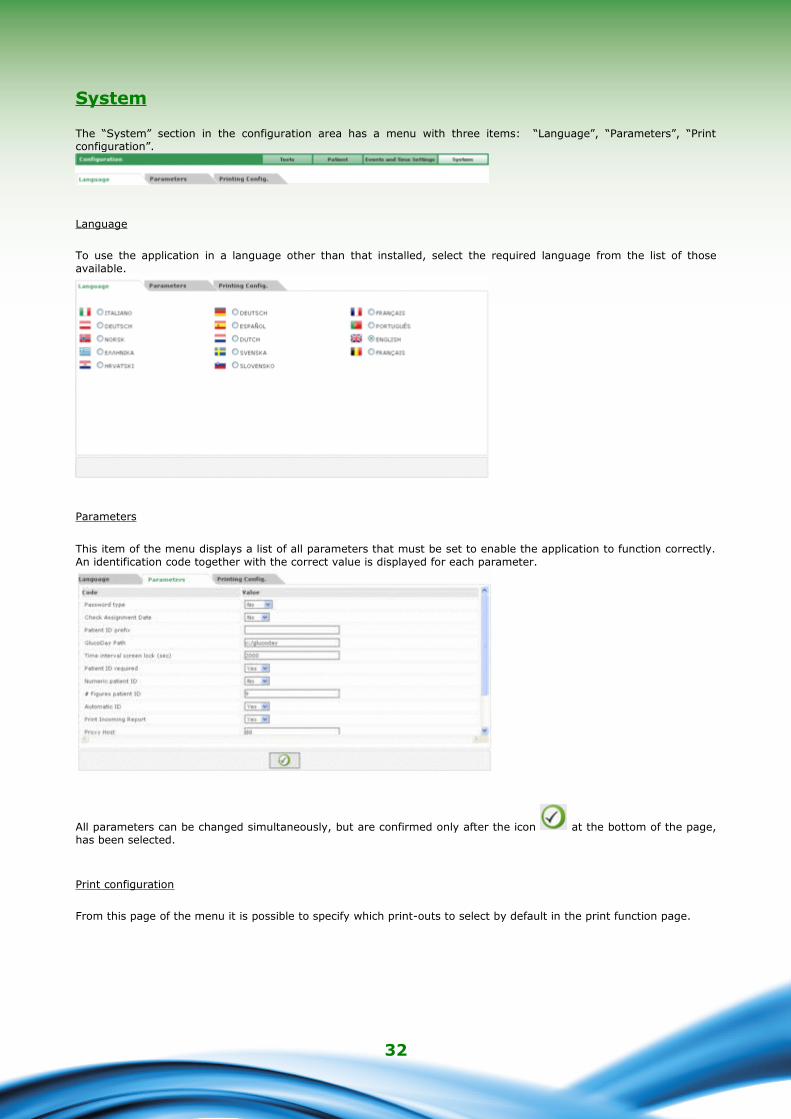
System
The “System” section in the configuration area has a menu with three items: “Language”, “Parameters”, “Print configuration”.
Language
To use the application in a language other than that installed, select the required language from the list of those available.
Parameters
This item of the menu displays a list of all parameters that must be set to enable the application to function correctly. An identification code together with the correct value is displayed for each parameter.
All parameters can be changed simultaneously, but are confirmed only after the icon at the bottom of the page, has been selected.
Print configuration
From this page of the menu it is possible to specify which print-outs to select by default in the print function page.
32

Pint configuration becomes effective only after the icon, at the bottom of the page, has been selected.
Printing
Graphs or data can be printed from some pages of the application.
The print function allows one or more prints to be obtained simultaneously.
From this page it is possible to print:
• Glycaemia results corresponding to printable data in the list of results in the glycaemia function.
• Other results corresponding to printable data in the other data function
• Glycaemia diary corresponding to printable data in the diary of results in the glycaemia function.
33
In this case it is possible to choose between compressed view and extended view, corresponding to the diary when selected in compressed mode (default), or extended view.
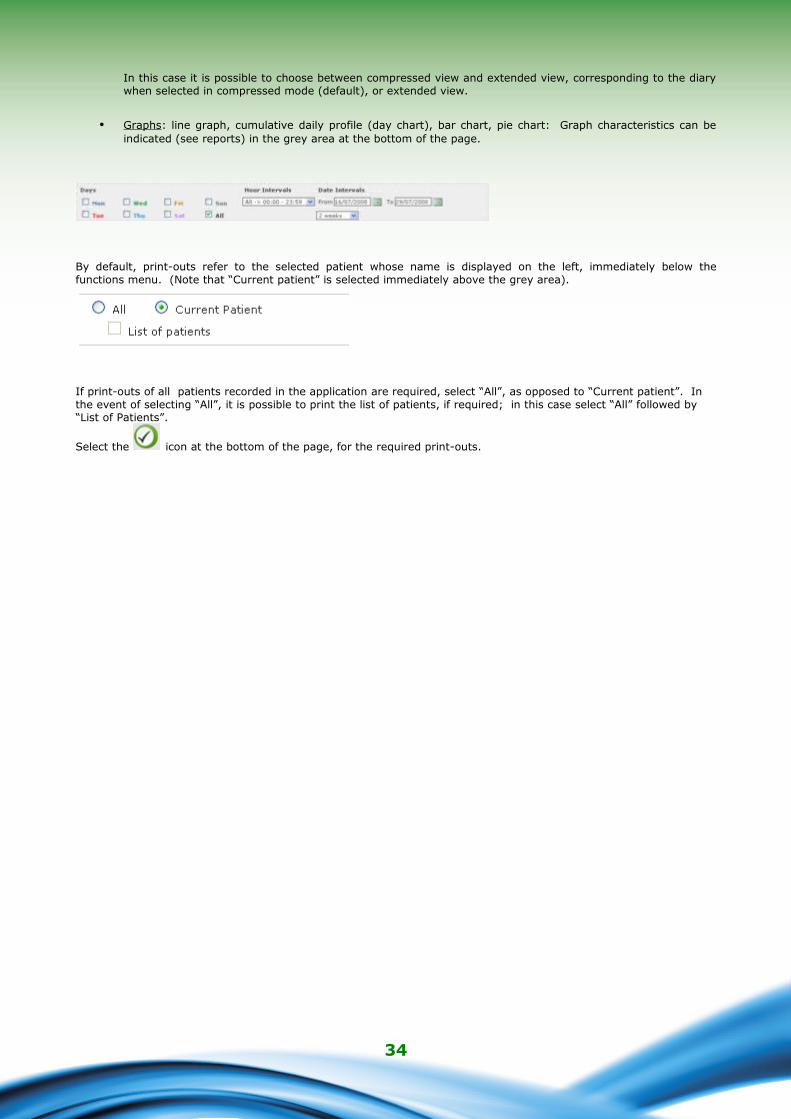
• Graphs : line graph, cumulative daily profile (day chart), bar chart, pie chart: Graph characteristics can be indicated (see reports) in the grey area at the bottom of the page.
By default, print-outs refer to the selected patient whose name is displayed on the left, immediately below the functions menu. (Note that “Current patient” is selected immediately above the grey area).
If print-outs of all patients recorded in the application are required, select “All”, as opposed to “Current patient”. In the event of selecting “All”, it is possible to print the list of patients, if required; in this case select “All” followed by “List of Patients”.
Select the icon at the bottom of the page, for the required print-outs.
34