software for multivariable data analysis and visualization
TRANSCRIPT

Canoco 5 – a short introduction
Software for multivariable data analysis and visualization
Canoco shows it!
Cajo J.F. ter Braak and Petr Šmilauer

Ex1: Comparison of microbiota among three groups
Feces transplant study: van Nood et al. 2013 NEJM
Data: microbiota taxa (Susana Fuentes, W. de Vos)
Donors
Patients: Before
Patients: After
Unconstrained (PCA)

Ex2: Comparison among two groups (1)
▪ Extension of t-test
▪ Horizontal (constrained) axis = difference of Control and Colic
▪ Vertical (unconstrained) axis = main residual pattern
▪ Correlation with Crying of babies
De Weerth et al 2012, Pediatrics
Microbiota (Susana Fuentes, W. de Vos)
Constrained (RDA)

Ex2: Comparison among two groups (2)
We see three types of data in this example
▪ Response data (the main/focal data :
● Amounts of 33 microbiota taxa
▪ Explanatory data:
● Treatment, a factor with 2 levels (Control and Colic)
▪ Supplementary data:
● Crying

Roles of data tables
▪ Response data (main data table)
● to be visualized, perhaps in combination with others
▪ Supplementary data
● to interpret the response data
▪ Explanatory data
● to explain the response data
▪ Covariate data (for advanced users)
● to account or adjust for.
● to enable detection of structure in response afteraccounting for the variation explained by these covariates
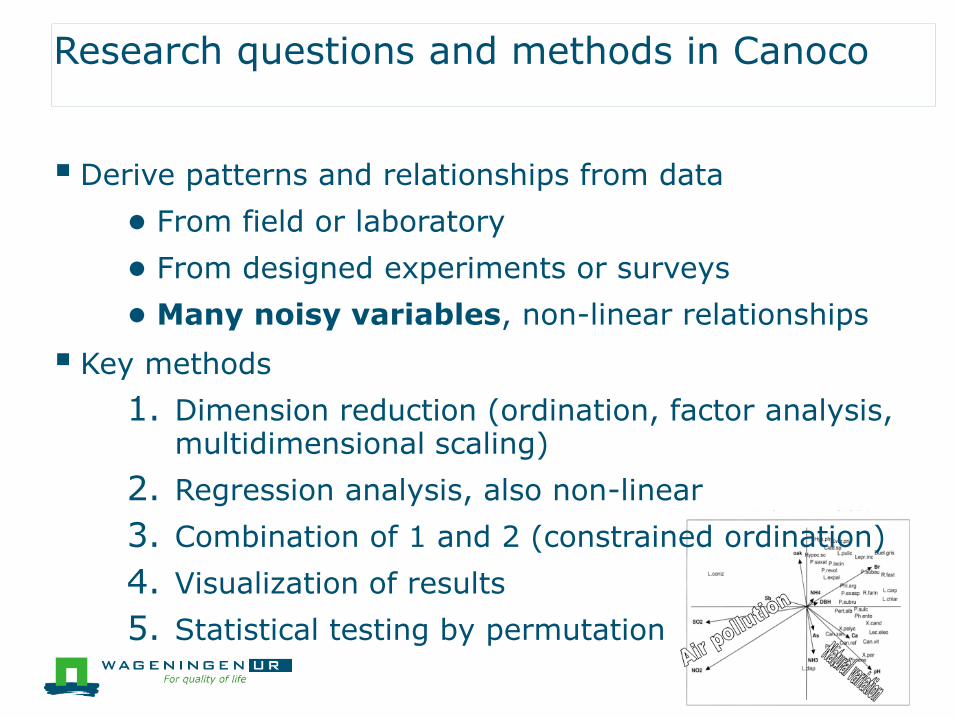
Research questions and methods in Canoco
▪ Derive patterns and relationships from data
● From field or laboratory
● From designed experiments or surveys
● Many noisy variables, non-linear relationships
▪ Key methods
1. Dimension reduction (ordination, factor analysis, multidimensional scaling)
2. Regression analysis, also non-linear
3. Combination of 1 and 2 (constrained ordination)
4. Visualization of results
5. Statistical testing by permutation
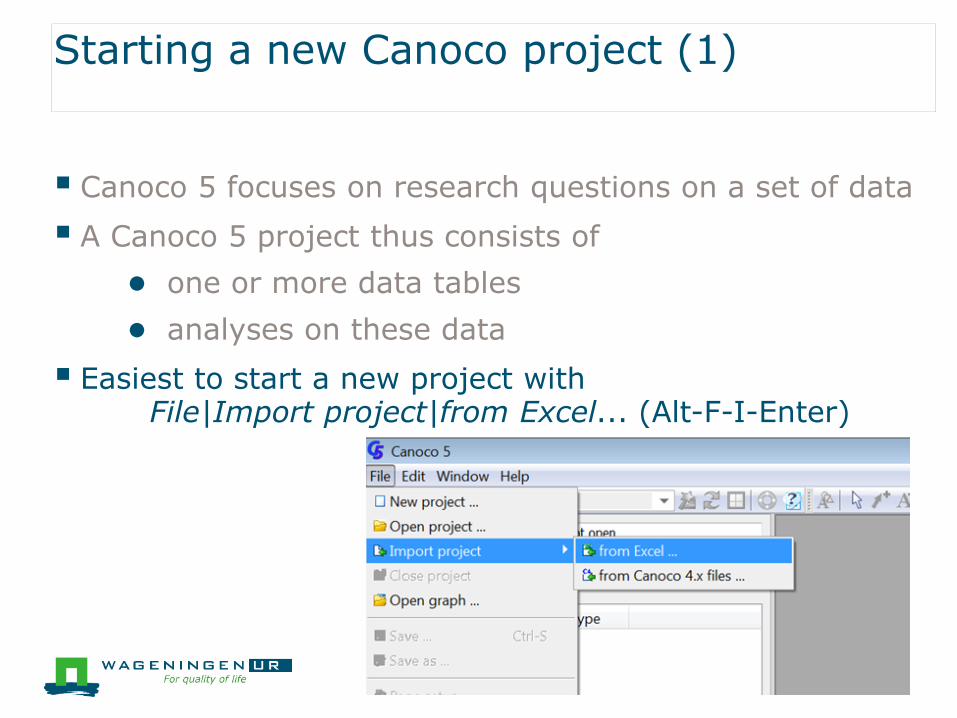
Starting a new Canoco project (1)
▪ Canoco 5 focuses on research questions on a set of data
▪ A Canoco 5 project thus consists of
● one or more data tables
● analyses on these data
▪ Easiest to start a new project with File|Import project|from Excel... (Alt-F-I-Enter)

Starting a new Canoco project (2)
▪ Select one or more Excel files, here 1
▪ Excel file can contain more than one sheet
▪ Each sheet can give ≥1 data tables
▪ Select the number of project data tables, here 2
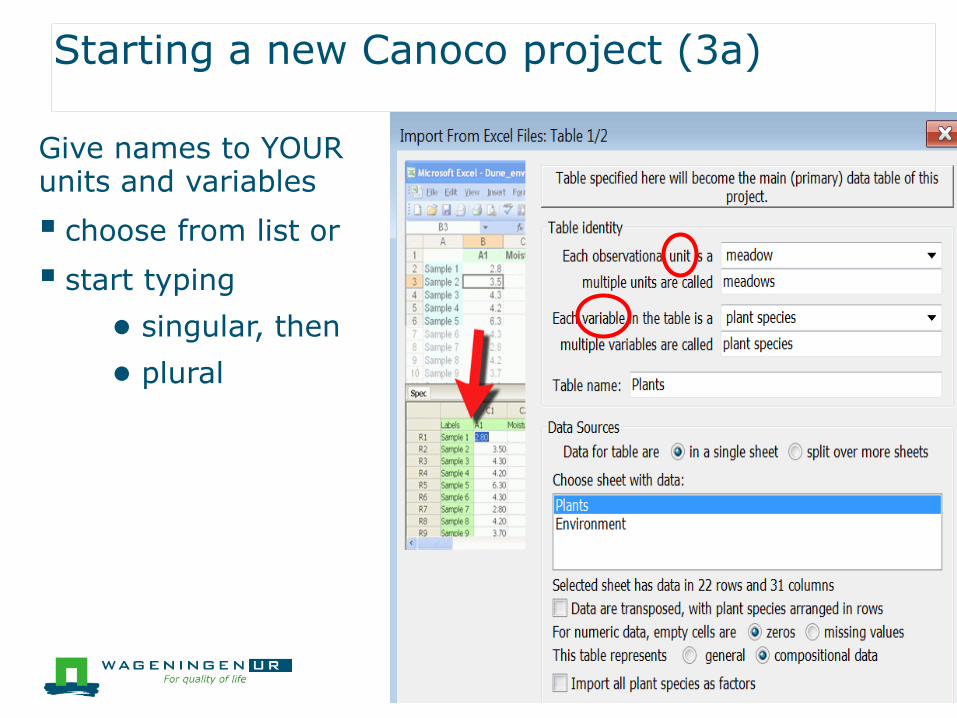
Starting a new Canoco project (3a)
Give names to YOUR units and variables
▪ choose from list or
▪ start typing
● singular, then
● plural

Starting a new Canoco project (3b)
Give names to YOUR units and variables
Empty cells: 0 or mis
Data kind is
▪ General or
▪ Compositional:
-row sum has meaning
-variables measured on the same scale
The right choice helps to
select suitable methods

Starting a new Canoco project (5)
Result: two project data tables (Plants and Environment) and offer for starting analysis
Data tables:
you can
- View
- Edit
- Copy
- Export
- Change kind/name etc.

Starting a new Canoco project (6)
Accepting the offer and all default choices leads to
-Summary of DCA analysis
-Two graphs
Save your project!
▪ File Save.. or
▪ Ctrl-S
Species-environment correlation

Starting a new Canoco project (6)
Accepting the offer and all default choices leads to
-Summary of DCA analysis
-Two graphs
Save your project!
▪ File Save.. or
▪ Cntr-S
Species-environment correlation
To view the data again, click Plants

Inspecting a graph with Describe Contents

All scores are available too:
Edit | Settings | Canoco5 Options:
● Click on the toolbar
● Click again to hide the score tabs
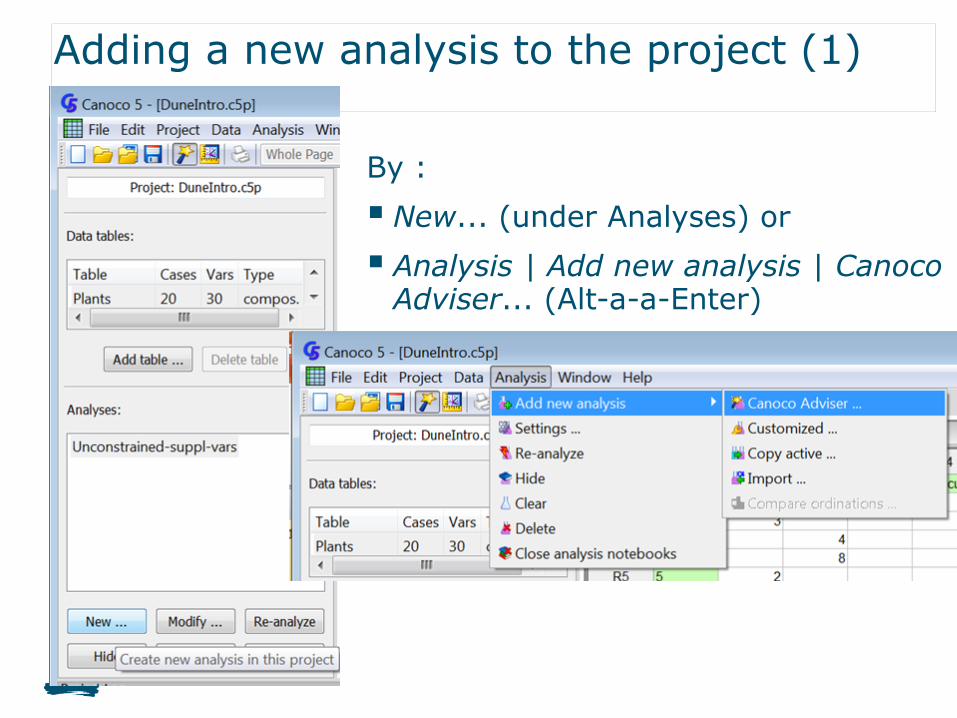
Adding a new analysis to the project (1)
By :
▪ New... (under Analyses) or
▪ Analysis | Add new analysis | Canoco Adviser... (Alt-a-a-Enter)

Adding a new analysis to the project (2)
1. Tables
2. Focal table
Select:
3. Template for analysis

Adding a new analysis to the project (3)
3. Select template
-double click on bold terms to fold/unfold
(Can enlarge dialog window to see all)
Alphabetic list oftemplates

Adding a new analysis to the project (4)
Standard analyses:
▪ Constrained: response variables ~ predictors
▪ Unconstrained: response variables
response variables ~ [supplementary variables]
▪ Compare constrained – unconstrained
▪ Test constrained axes
▪ Interactive forward selection of predictors
- See also: Summarize effects of explvariables
See Advanced ... for constrained analysis with covariates

Adding a new analysis to the project (5)
PCA: Principal component analysis
RDA: Redundancy analysis
CA (DCA): Correspondence analysis(Detrended)
CCA: Canonical correspondence analysis
Standard analyses:

Adding a new analysis to the project (6)

Summarize effects of expl. variables.
Dune meadow data
▪ Plant species ~ Environment (CCA)

Forward selection of expl. variables
▪ Color code for significance
▪ FDR testing on-line, but only for viewed variables
● Tip: increase window size to get correct FDR

Canoco Adviser
On the basis of the data properties the Adviser suggests
▪ Transformation and standardization of variables
right-click on top-left cell in data sheet
Or use
Data | Default transformation and ...

On the basis of the data properties the Adviser suggests
▪ Transformation and standardization of variables
▪ Common analyses via templates
▪ Choice between Linear and Unimodal
Canoco Adviser

Methods in Canoco 5
▪ Standard multivariate methods such as [partial] PCA/RDA/CA/DCA/CCA
But also:
▪ Response curves (regression by GLM/GAMs with one predictor)
▪ Contour plots (GLM/GAM with two predictors)
▪ Distance-based methods incl. nonmetric multidimensional scaling (NMDS)
▪ Variation partitioning
▪ Principal response curves (PRC)
▪ Generalized linear models (GLM) with permutation tests
▪ Double-constrained analyses (dc-CA and dc-PCA)and more...

Nonlinear response curves via GLM or GAM
Expected number of
12 spider species
plotted against a
synthetic explanatory
variable

GAMs or GLMs with two predictors

Distance-based methods eg. NMDS
▪ E.g. from intercity train-time to a map of cities
▪ PCO/NMDS/db-RDA/Procrustes analysis
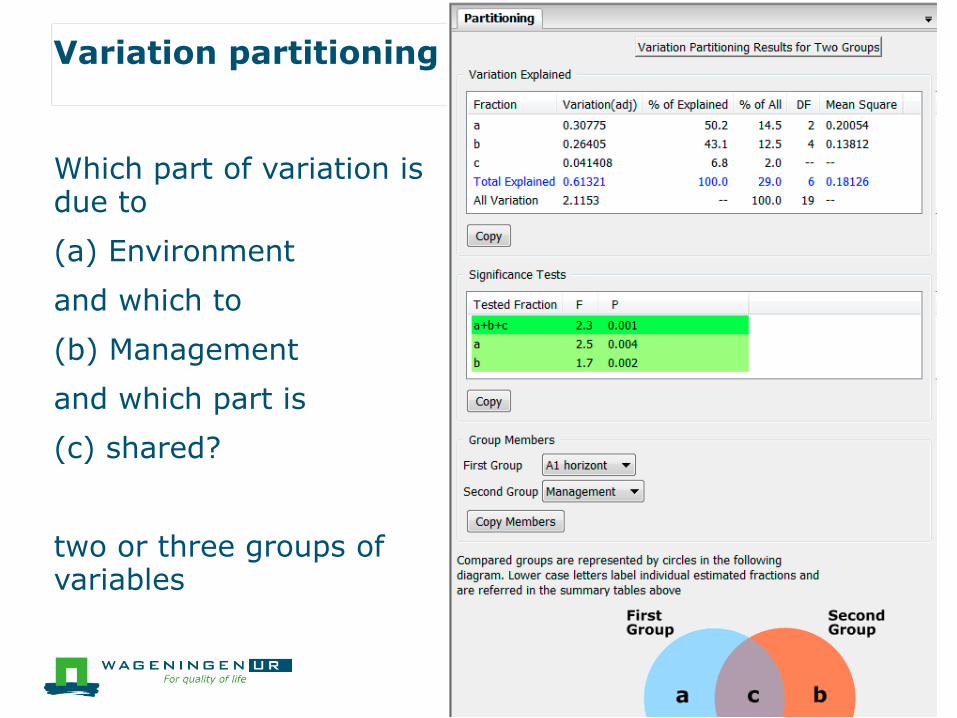
Variation partitioning
Which part of variation is due to
(a) Environment
and which to
(b) Management
and which part is
(c) shared?
two or three groups of variables

Principal response curves (PRC)
Method to show main effect + interaction
“How does the effect of a pesticide change over time?

Principal response curves (PRC)(2)
▪ Specify Time and Treatment factors
▪ Specify time values for horizontal axis (default often good)

PRC diagram: Invertebrates~ treatment.time | time
▪ Example
Van den Brink & ter Braak (1999)
Graph 1 in Canoco5\Samples\Advanced\PRC.c5p
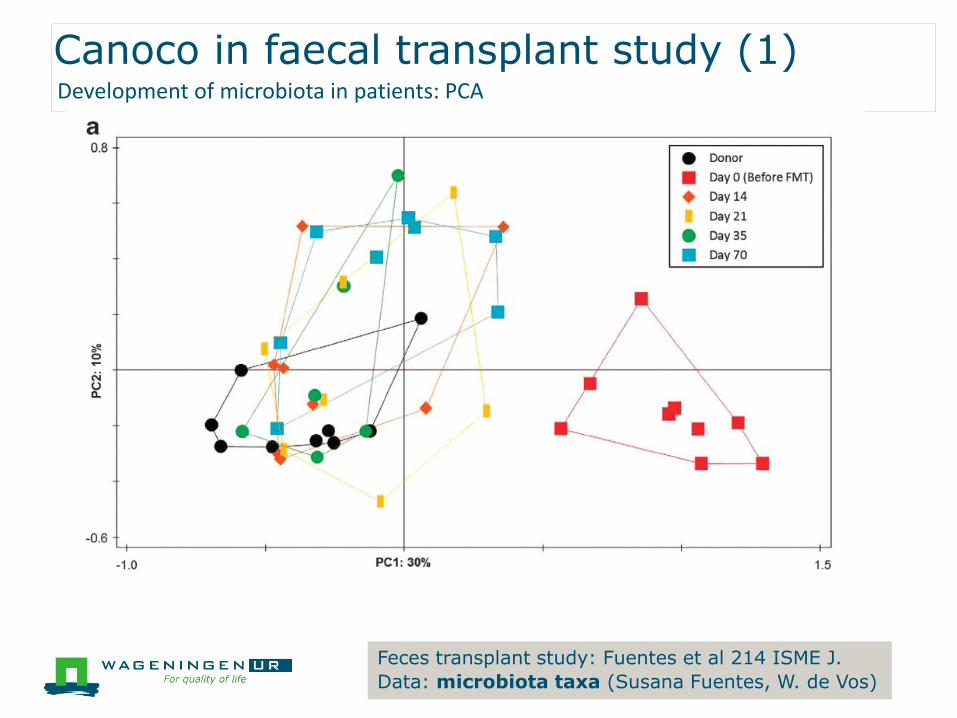
Canoco in faecal transplant study (1)
Feces transplant study: Fuentes et al 214 ISME J.
Data: microbiota taxa (Susana Fuentes, W. de Vos)
Development of microbiota in patients: PCA

Canoco in faecal transplant study (2)
Feces transplant study: Fuentes et al 214 ISME J.
Data: microbiota taxa (Susana Fuentes, W. de Vos)
Development of microbiota in patients

Co-correspondence analysis
▪ How are two compositional data tables related?
e.g.
plant and beetle communities
(Schaffers et al. 2008)
auto- and hetero-trophic microbial assemblages
(Alric et al. 2018, Mol Ecol Res)

Trait-based analyses and phylogenetic relations
▪ Trait averages
▪ Functional diversity
▪ Double-constrained correspondence analysis (dc-CA)
▪ Phylogenetic corrections
dc-CA: ter Braak et al. 2018 http://rdcu.be/ETPh Peng et al. 2021
https://doi.org/10.1016/j.scitotenv.2020.142171

Generalized linear models (GLM)
Via
▪ GLM template for ≥ 1 predictors
▪ Graph| Attribute plots
1 predictor:
● Multiple response curves in single graph
2 predictors:
● Contour plot

Find out how to get a method,eg. GAM (1)
▪ Help|Help contents (Alt-h-h) opens the help system
▪ Type GAM in search field, press Enter, gives
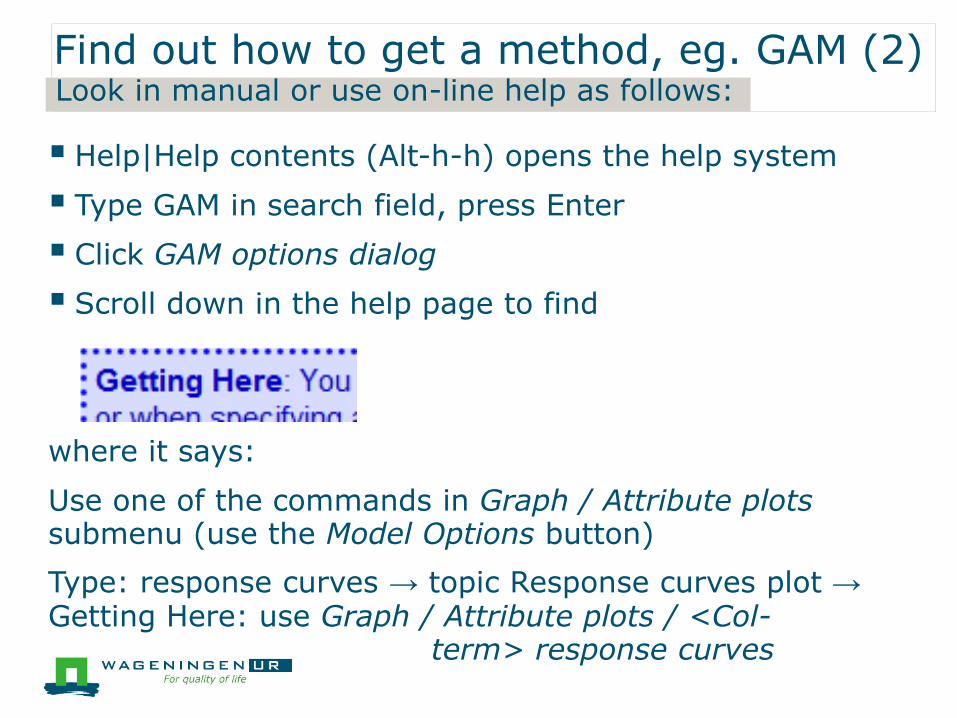
▪ Help|Help contents (Alt-h-h) opens the help system
▪ Type GAM in search field, press Enter
▪ Click GAM options dialog
▪ Scroll down in the help page to find
where it says:
Use one of the commands in Graph / Attribute plots submenu (use the Model Options button)
Type: response curves → topic Response curves plot →Getting Here: use Graph / Attribute plots / <Col-
term> response curves
Find out how to get a method, eg. GAM (2)Look in manual or use on-line help as follows:
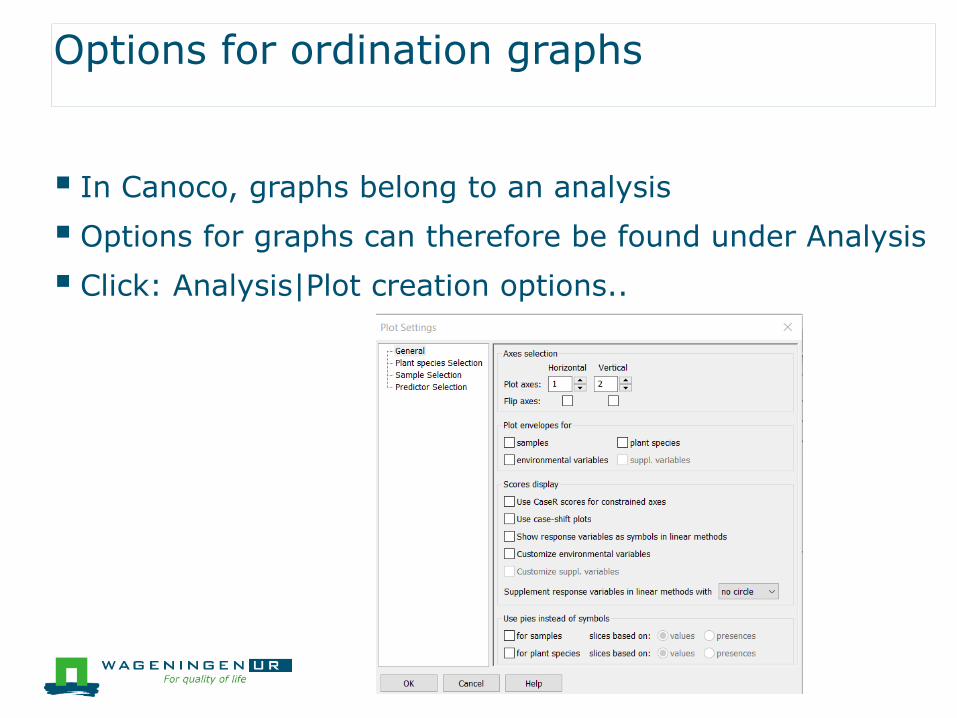
Options for ordination graphs
▪ In Canoco, graphs belong to an analysis
▪ Options for graphs can therefore be found under Analysis
▪ Click: Analysis|Plot creation options..

Classification and groups
Click Project on the toolbar
▪ to create classifications, groups or series1 of samples and species
● for use in plotting (e.g. symbols or colours per class)
● to plot a subset
● etc.
▪ See example on next slide
1 See https://doi.org/10.6084/m9.figshare.13259534.v1
for more example

Ellipses and transparent colours

Calibration of arrows
▪ E.g. PCA on
Environment data of Dune Meadows
Arrow for Moisture calibrated
Management automatic expanded to dummies
(Graffelman & Van Eeuwijk, 2005)

Also available in Canoco 5
▪ Predicted and fitted response values for constrained methods, via Data | Add new table | Predict..; Alt-d-a-p
▪ Calibration - predicted explanatory values; imputing of missing explanatory values on basis of constrained meth. via Advanced constrained template
▪ Diversity indices, via Data | Add new table | Statistics; Alt-d-a-s
▪ Functional diversity via Alt-d-f
▪ Indicator values of species for a grouping
▪ Multiple testing and FDR
▪ Multi-step analyses andmore...

Resources/help
▪ Canoco 5 Tutorial under Programs
▪ Canoco 5 manual: ~500 pp
▪ Support site with Discussion list: www.canoco5.com
▪ Demo and practical
For Canoco projects of published analyseshttps://doi.org/10.6084/m9.figshare.13259534

Thank you!