software risk master™ (srm) sizing and estimating … · 2 introduction software risk master...
TRANSCRIPT

1
Software Risk Master™ (SRM) Sizing and Estimating Examples
Capers Jones, VP and CTO
Namcook Analytics LLC
Web: www.Namcook.com Blog: http://Namcookanalytics.com Email: [email protected]
Version 10.0 April 29, 2015
Abstract Software Risk Master (SRM) is a powerful parametric estimation tool with patent-pending features for early and rapid sizing prior to full requirements. It predicts size in 23 metrics; risks, quality, schedules, staffing, effort, and costs for development and three years of maintenance and enhancements. SRM also has an accurate benchmark or measurement mode that can collect project data with very high precision. Accurate historical data is needed in order to calibrate the estimating algorithms, so measurement and estimation are synergistic.
Copyright 2013-2015 by Capers Jones. All rights reserved.

2
Introduction Software Risk Master (SRM) combines a powerful and patent-pending software sizing and estimating engine with an equally powerful benchmark collection feature. In estimating mode SRM is aimed at very early estimating prior to requirements using pattern matching. SRM places projects to be estimated on a formal taxonomy, and then extracts results from the Namcook Analytics knowledge base of all projects with the same taxonomy patterns. SRM predicts risks, size in 23 metrics, schedules, staffing, costs by activity, quality, and three years of maintenance, support and enhancement. The 23 metrics that SRM supports for early sizing are:
SRM Sizing Metrics
1 IFPUG 4.3 2 Automated code based 3 Automated UML-based 4 Backfired function points 5 Cosmic function points 6 Fast function points 7 Feature points 8 FISMA function points 9 Full function points
10 Function points light 11 IntegraNova models 12 Mark II function points 13 NESMA function points 14 RICE objects 15 SCCQI function points 16 Simple function points 17 SNAP non functional metrics 18 SRM pattern matching 19 Story points 20 Unadjusted function points 21 Use case points 22 Logical code statements 23 Physical LOC (blank, comments)
SRM can be used earlier than any other parametric tool. Its patent-pending sizing feature is also the fastest available sizing method and requires less than five minutes to size any application in terms of function points, physical and logical lines of code, and other metrics such as story points

3
and use-case points as well. SRM also includes some special estimating features such as predicting user costs for internal projects, predicting the odds and costs of outsource litigation, the costs of cyber-attacks, and predicting the results of venture funded startup software companies. SRM also has a portfolio sizing and maintenance estimating feature that includes ERP deployment costs. In benchmark measurement mode SRM collects data on the same topics as used in estimates. SRM provides default values for many variables to speed up both estimation and measurement. For example SRM has data on 50 methodologies ranging from agile to RUP, TSP, and waterfall. SRM also supports hybrid methodologies. SRM is also is pre-loaded with monthly work hours for 55 countries, although these values can be changed to match specific local conditions. SRM can predict code size in any combination of 80 programming languages, and new languages can be added if needed. Software Risk Master’s (SRM) patent-pending sizing method operates over a range that spans from 1 to more than 300,000 function points in size. It also produces size in a total of 23 metrics: IFPUG function points, COSMIC, FISMA, and NESMA function points (and other functional metrics), SNAP points, story points, use-case points, logical and physical lines of code, and many other metrics. As an example of the versatility of SRM, following are the 50 methodologies for which SRM can estimate results. This is the most complete and comprehensive set of methodologies of any parametric estimating tool: Table 1: Fifty Methodologies in Alphabetical Order
Methodologies
1 Agile scrum 2 Anti patterns 3 CASE 4 Clean room 5 CMMI 3 6 Continuous development 7 Cowboy 8 Crystal 9 DevOps 10 DSDM 11 EVO 12 Feature driven (FDD) 13 Global 24 hour 14 Hybrid 15 Information engineering (IE) 16 IntegraNova
4
17 Iterative 18 Kaizen/Kanban 19 Lean 20 Legacy data mining 21 Legacy redevelopment 22 Legacy renovation 23 Mashup 24 Merise 25 Microsoft solutions 26 Model-driven 27 Object Oriented (OO) 28 Open-source 29 Pair programming 30 Pattern-based 31 Prince 2 32 Product Line engineering 33 Prototypes - disposable 34 Prototypes - evolutionary 35 Personal Software Process (PSP) 36 Rapid Application Development (RAD) 37 Reengineering 38 Reuse-oriented 39 Reverse engineering 40 Rational Unified Process (RUP) 41 Service-Oriented modeling 42 Specifications by Example 43 Spiral development 44 Structured development 45 Test-driven development 46 Team Software Process (TSP) plus PSP 47 T-VEC 48 V-Model 49 Waterfall 50 Extreme Programming (XP)
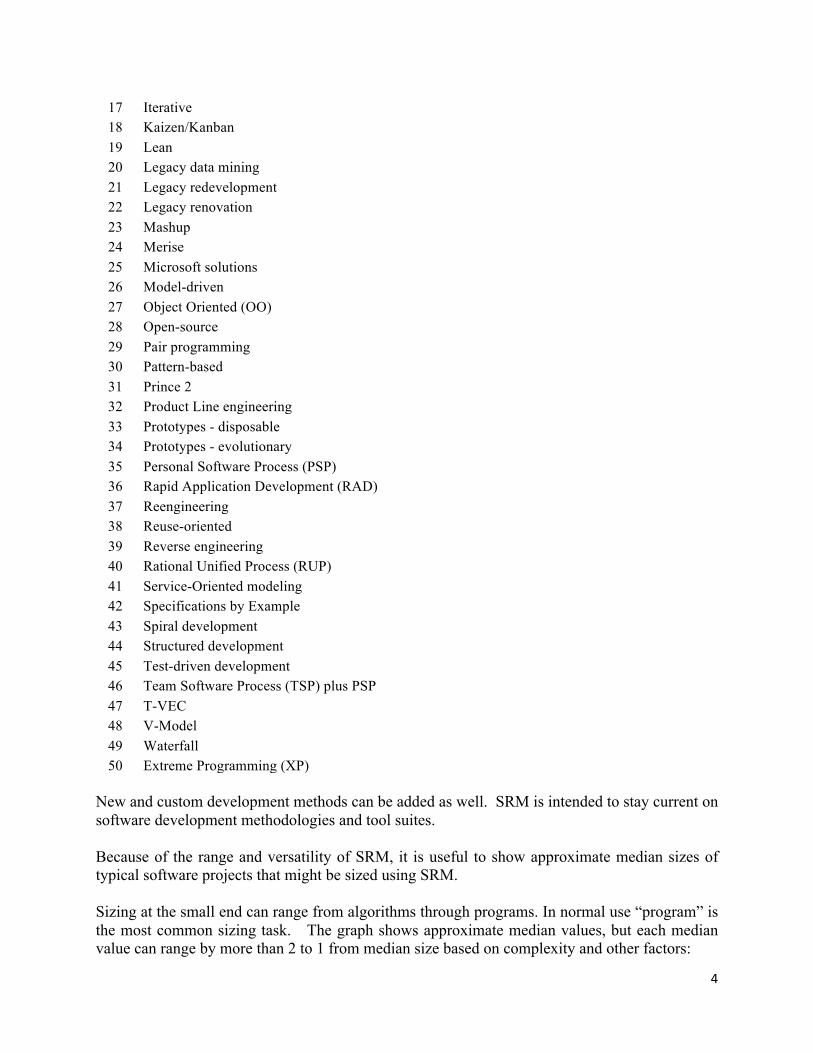
New and custom development methods can be added as well. SRM is intended to stay current on software development methodologies and tool suites. Because of the range and versatility of SRM, it is useful to show approximate median sizes of typical software projects that might be sized using SRM. Sizing at the small end can range from algorithms through programs. In normal use “program” is the most common sizing task. The graph shows approximate median values, but each median value can range by more than 2 to 1 from median size based on complexity and other factors:
5
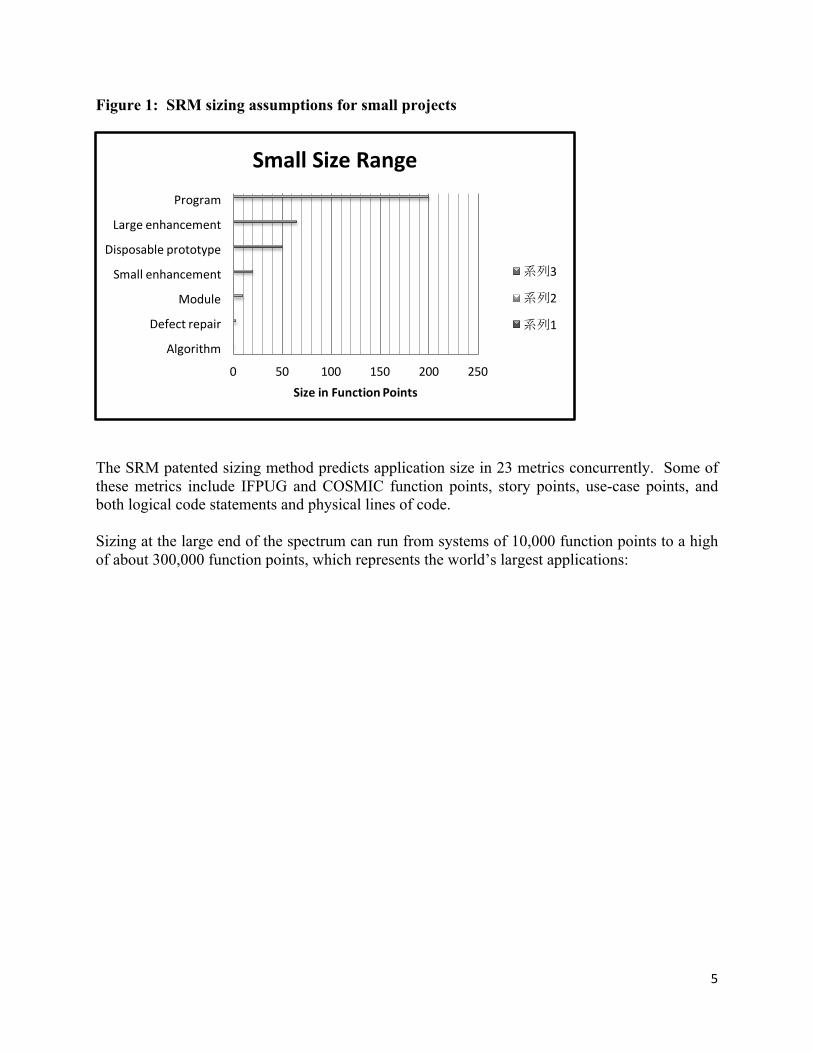
Figure 1: SRM sizing assumptions for small projects
The SRM patented sizing method predicts application size in 23 metrics concurrently. Some of these metrics include IFPUG and COSMIC function points, story points, use-case points, and both logical code statements and physical lines of code. Sizing at the large end of the spectrum can run from systems of 10,000 function points to a high of about 300,000 function points, which represents the world’s largest applications:
0 50 100 150 200 250
Algorithm
Defectrepair
Module
Smallenhancement
Disposableprototype
Largeenhancement
Program
SizeinFunctionPoints
SmallSizeRange
系列3
系列2
系列1

6
Figure 2: SRM sizing assumptions for large applications
A global system is a major application used all over the world, such as large ERP packages including SAP and Oracle or the military World-Wide Military Command and Control System (WWMCCS). Obviously some global systems are available in many national languages: English, French, Japanese, etc. These international versions tend to add to overall application size. Global systems tend to run from 100,000 to 300,000 function points. A national system is a major application used for important business or technical reasons in a country such as the U.S. air-traffic control system and some of the shared software for Obamacare used by multiple state governments. These tend to run from 75,000 to more than 100,000 function points. An enterprise system is a major application used to support every operating unit of a large corporation such as their internal HR and financial accounting systems. Some ERP packages also support enterprise data. These tend to run from 25,000 to more than 50,000 function points. Enterprise software applications also occur with conglomerates, such as the financial system for ITT which encompassed over 200 corporations owned by ITT. A corporate system is a major application that supports mid-sized to large companies such as payrolls or the smaller ERP packages. Some state government systems are in this category such as state income tax applications. These tend to run from 10,000 to more than 25,000 function points. A departmental system supports primarily a single operating unit such as engineering, marketing, sales, or shareholder data. These tend to run from 5,000 to more than 10,000 function points. Some state government systems such as automobile registrations and drivers licenses are in this class.
0 50000 100000 150000 200000
Systemcomponent
Departmentalsystem
Corporatesystem
Enterprisesystem
Nationalsystem
Globalsystem
SizeinFunctionPoints
LargeSizeRange
系列3
系列2
系列1
7
Large-system sizing has been very difficult in the past because of the slow speed of manual function point sizing. The SRM pattern-matching approach makes large system sizing rapid and easy to perform. The patent-pending SRM sizing feature can also operate before full requirements, allowing size to be predicted earlier than other standard sizing methods such as manual function point analysis by certified function point personnel. Early sizing for large systems is valuable because early sizing allows early risk analysis and early risk solution deployment. Large systems have high failure rates, frequently run late, almost always exceed planned budgets, and many end up in litigation for poor quality or excessive delays. Once software systems go into production they continue to grow and change for as long as they have active users. The average growth over time is about 8% per calendar year. This growth is not even: there can be “system releases” with major upgrades to the full system; “major enhancements” which add significant new functions; and “minor enhancements” which are the most common. SRM can size any or all of these. The approximate variation for a typical departmental system resembles the following chart:
8
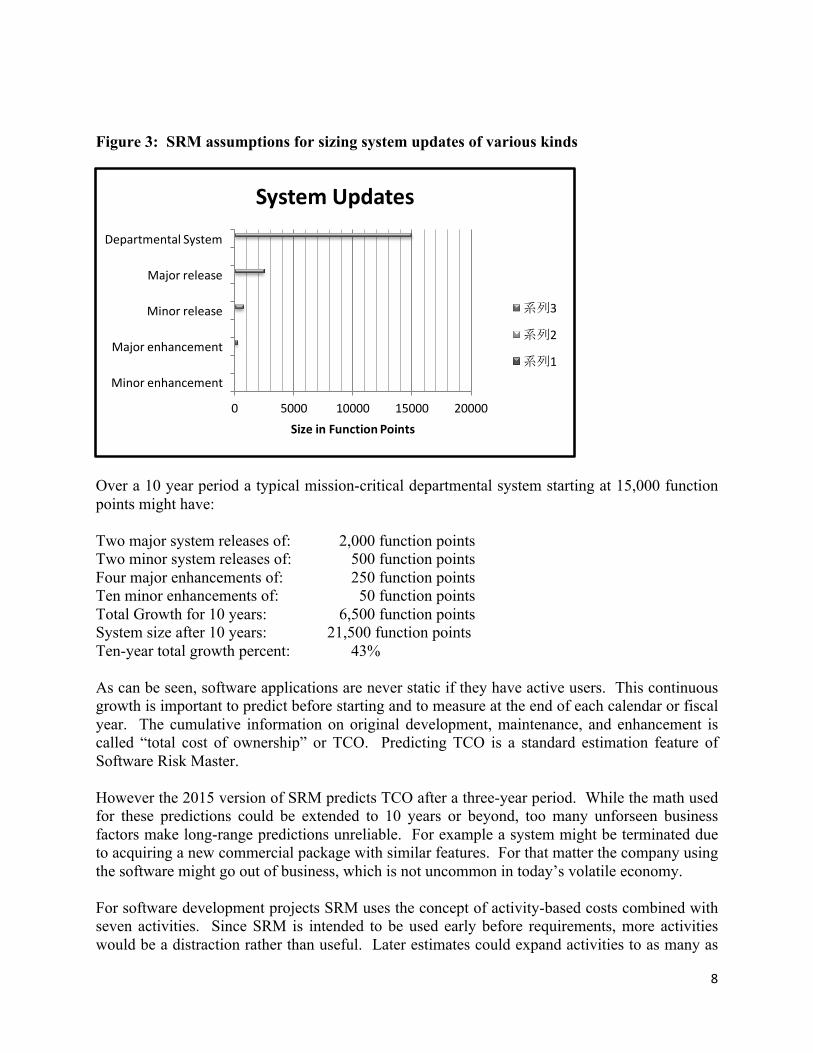
Figure 3: SRM assumptions for sizing system updates of various kinds
Over a 10 year period a typical mission-critical departmental system starting at 15,000 function points might have: Two major system releases of: 2,000 function points Two minor system releases of: 500 function points Four major enhancements of: 250 function points Ten minor enhancements of: 50 function points Total Growth for 10 years: 6,500 function points System size after 10 years: 21,500 function points Ten-year total growth percent: 43% As can be seen, software applications are never static if they have active users. This continuous growth is important to predict before starting and to measure at the end of each calendar or fiscal year. The cumulative information on original development, maintenance, and enhancement is called “total cost of ownership” or TCO. Predicting TCO is a standard estimation feature of Software Risk Master. However the 2015 version of SRM predicts TCO after a three-year period. While the math used for these predictions could be extended to 10 years or beyond, too many unforseen business factors make long-range predictions unreliable. For example a system might be terminated due to acquiring a new commercial package with similar features. For that matter the company using the software might go out of business, which is not uncommon in today’s volatile economy. For software development projects SRM uses the concept of activity-based costs combined with seven activities. Since SRM is intended to be used early before requirements, more activities would be a distraction rather than useful. Later estimates could expand activities to as many as
0 5000 10000 15000 20000
Minorenhancement
Majorenhancement
Minorrelease
Majorrelease
DepartmentalSystem
SizeinFunctionPoints
SystemUpdates
系列3
系列2
系列1
9
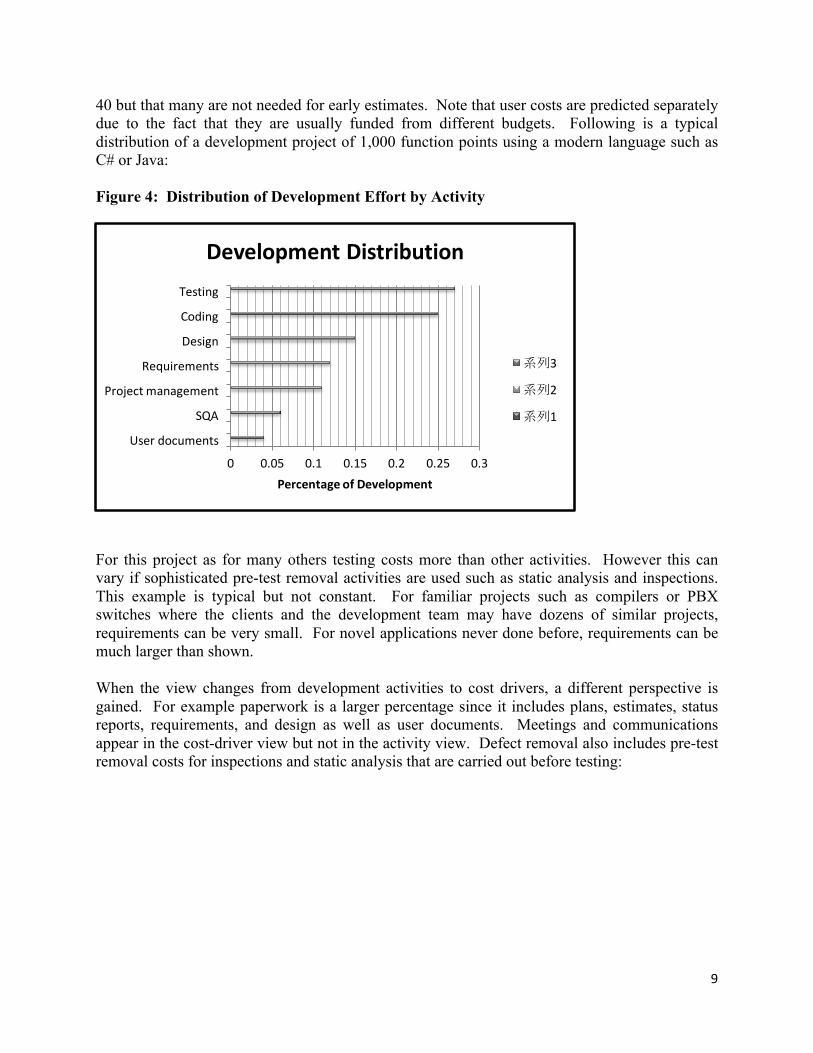
40 but that many are not needed for early estimates. Note that user costs are predicted separately due to the fact that they are usually funded from different budgets. Following is a typical distribution of a development project of 1,000 function points using a modern language such as C# or Java: Figure 4: Distribution of Development Effort by Activity
For this project as for many others testing costs more than other activities. However this can vary if sophisticated pre-test removal activities are used such as static analysis and inspections. This example is typical but not constant. For familiar projects such as compilers or PBX switches where the clients and the development team may have dozens of similar projects, requirements can be very small. For novel applications never done before, requirements can be much larger than shown. When the view changes from development activities to cost drivers, a different perspective is gained. For example paperwork is a larger percentage since it includes plans, estimates, status reports, requirements, and design as well as user documents. Meetings and communications appear in the cost-driver view but not in the activity view. Defect removal also includes pre-test removal costs for inspections and static analysis that are carried out before testing:
0 0.05 0.1 0.15 0.2 0.25 0.3
Userdocuments
SQA
Projectmanagement
Requirements
Design
Coding
Testing
PercentageofDevelopment
DevelopmentDistribution
系列3
系列2
系列1

10
Figure 5: Software Cost Drivers
In the SRM cost-driver view requirements changes are shown to be a major expense element, but they do not show up in normal activity-based cost reporting. Both the activity view and the cost-driver view are useful because they provide clients with different pictures of what goes into software development. Because user costs are generally funded from business-unit budgets rather than software development budgets, their costs are accumulated seprately by SRM. However user costs are included in total costs of ownership. Following is a typical pattern of user costs for the same application:
0 0.05 0.1 0.15 0.2 0.25 0.3 0.35
Meetings/communications
Requirementschanges
Paperdocuments
Programming/coding
Finding/fixingbugs
PercentageofDevelopment
SoftwareCostDrivers
系列3
系列2
系列1
11
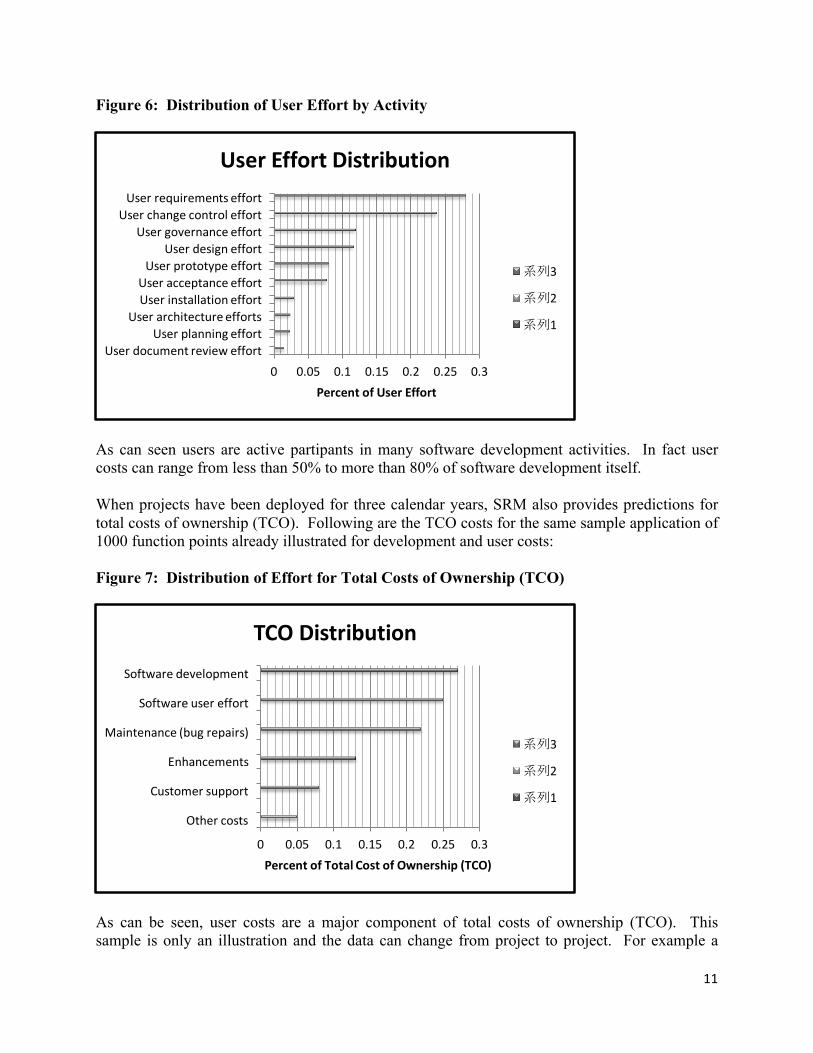
Figure 6: Distribution of User Effort by Activity
As can seen users are active partipants in many software development activities. In fact user costs can range from less than 50% to more than 80% of software development itself. When projects have been deployed for three calendar years, SRM also provides predictions for total costs of ownership (TCO). Following are the TCO costs for the same sample application of 1000 function points already illustrated for development and user costs: Figure 7: Distribution of Effort for Total Costs of Ownership (TCO)
As can be seen, user costs are a major component of total costs of ownership (TCO). This sample is only an illustration and the data can change from project to project. For example a
0 0.05 0.1 0.15 0.2 0.25 0.3Userdocumentrevieweffort
UserplanningeffortUserarchitectureeffortsUserinstallationeffortUseracceptanceeffortUserprototypeeffort
UserdesigneffortUsergovernanceeffort
UserchangecontroleffortUserrequirementseffort
PercentofUserEffort
UserEffortDistribution
系列3
系列2
系列1
0 0.05 0.1 0.15 0.2 0.25 0.3
Othercosts
Customersupport
Enhancements
Maintenance(bugrepairs)
Softwareusereffort
Softwaredevelopment
PercentofTotalCostofOwnership(TCO)
TCODistribution
系列3
系列2
系列1
12
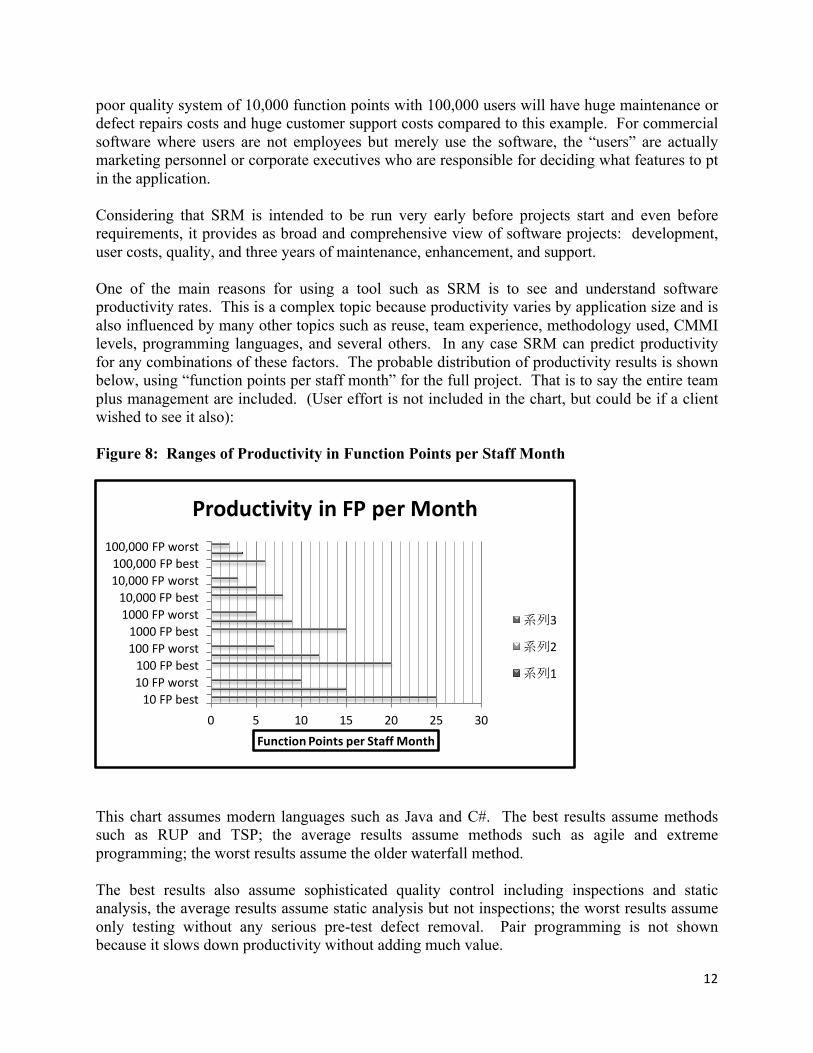
poor quality system of 10,000 function points with 100,000 users will have huge maintenance or defect repairs costs and huge customer support costs compared to this example. For commercial software where users are not employees but merely use the software, the “users” are actually marketing personnel or corporate executives who are responsible for deciding what features to pt in the application. Considering that SRM is intended to be run very early before projects start and even before requirements, it provides as broad and comprehensive view of software projects: development, user costs, quality, and three years of maintenance, enhancement, and support. One of the main reasons for using a tool such as SRM is to see and understand software productivity rates. This is a complex topic because productivity varies by application size and is also influenced by many other topics such as reuse, team experience, methodology used, CMMI levels, programming languages, and several others. In any case SRM can predict productivity for any combinations of these factors. The probable distribution of productivity results is shown below, using “function points per staff month” for the full project. That is to say the entire team plus management are included. (User effort is not included in the chart, but could be if a client wished to see it also): Figure 8: Ranges of Productivity in Function Points per Staff Month
This chart assumes modern languages such as Java and C#. The best results assume methods such as RUP and TSP; the average results assume methods such as agile and extreme programming; the worst results assume the older waterfall method. The best results also assume sophisticated quality control including inspections and static analysis, the average results assume static analysis but not inspections; the worst results assume only testing without any serious pre-test defect removal. Pair programming is not shown because it slows down productivity without adding much value.
0 5 10 15 20 25 3010FPbest
10FPworst100FPbest
100FPworst1000FPbest
1000FPworst10,000FPbest
10,000FPworst100,000FPbest
100,000FPworst
FunctionPointsperStaffMonth
ProductivityinFPperMonth
系列3
系列2
系列1

13
As can seen large systems are intrinsically slow in 2015. The best technology for making major improvements in large system productivity would be to move past custom designs and hand coding and move toward construction from standard reusable materials, with at least 75% of the entire application being in the form of reusable components. It might be thought that dividing large systems into small independent components would boost productivity. However that is somewhat like trying to decompose an 80,000 ton cruise ship into 5,000 small boats. The total tonnage may be the same but the overall results are not the same. As of 2015 there are no proven technologies for decomposing large systems into small independent components. It may be that the new SEMAT method will improve the ability to handle decomposition. One of the main reasons clients use Software Risk Master is to get an early prediction of software development schedules. Schedule prediction is a key output of all parametric estimation tools, and also a key factor in benchmark data collection. The range of software schedules is shown below: Figure 9: Ranges of Software Schedules
As can be seen the gap between “best case” schedules and “worst case” schedules grows larger as applications increase in size. This is because large systems that combine huge volumes of unplanned requirements creep and poor quality control can stretch out to more than twice their original planned schedule durations. It is an interesting phenomenon that development schedules do not follow a normal bell-shaped curve. The tail on the “bad” side of the curve is larger than the tail on the “good” side of the curve. This is primarly due to the fact that many companies don’t have a clue as to the best and most effective methods for building software, so they botch up many more projects than they should. Early sizing, early estimating, and early risk analysis could theoretically change the
0 20 40 60 80 100 12010FPbest
10FPworst100FPbest
100FPworst1000FPbest
1000FPworst10,000FPbest
10,000FPworst100,000FPbest
100,000FPworst
CalendarMonths
SoftwareScheduleRanges
系列3
系列2
系列1
14
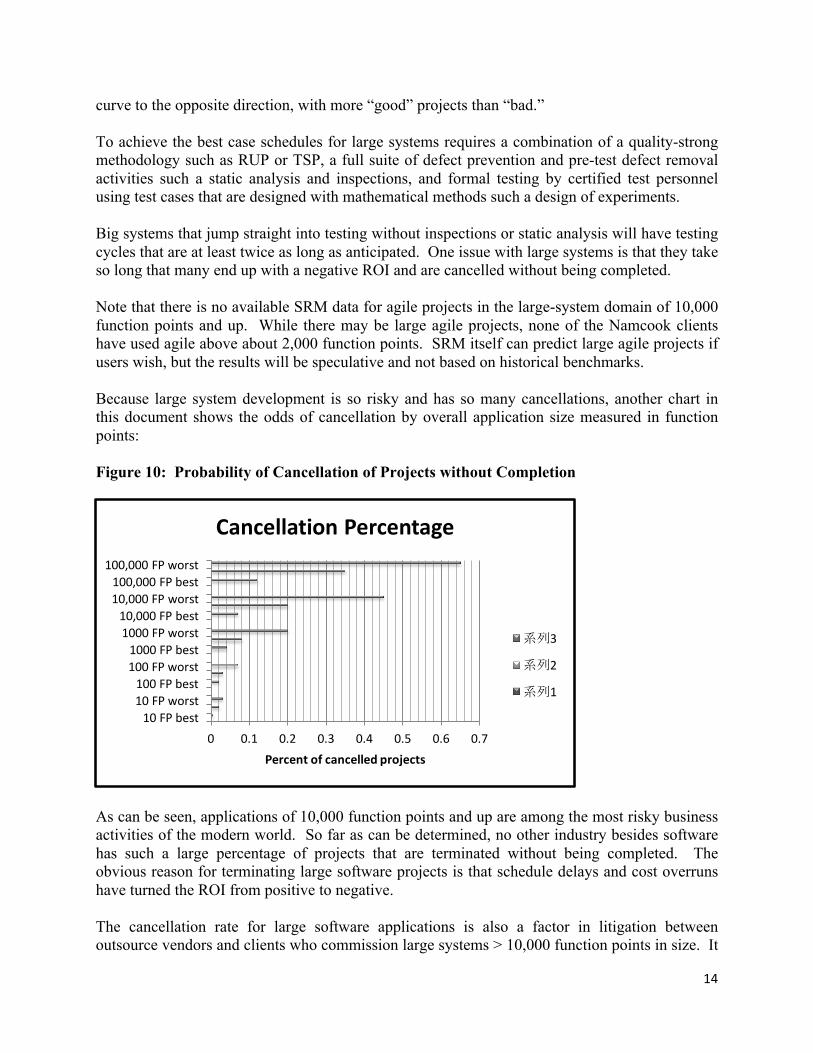
curve to the opposite direction, with more “good” projects than “bad.” To achieve the best case schedules for large systems requires a combination of a quality-strong methodology such as RUP or TSP, a full suite of defect prevention and pre-test defect removal activities such a static analysis and inspections, and formal testing by certified test personnel using test cases that are designed with mathematical methods such a design of experiments. Big systems that jump straight into testing without inspections or static analysis will have testing cycles that are at least twice as long as anticipated. One issue with large systems is that they take so long that many end up with a negative ROI and are cancelled without being completed. Note that there is no available SRM data for agile projects in the large-system domain of 10,000 function points and up. While there may be large agile projects, none of the Namcook clients have used agile above about 2,000 function points. SRM itself can predict large agile projects if users wish, but the results will be speculative and not based on historical benchmarks. Because large system development is so risky and has so many cancellations, another chart in this document shows the odds of cancellation by overall application size measured in function points: Figure 10: Probability of Cancellation of Projects without Completion
As can be seen, applications of 10,000 function points and up are among the most risky business activities of the modern world. So far as can be determined, no other industry besides software has such a large percentage of projects that are terminated without being completed. The obvious reason for terminating large software projects is that schedule delays and cost overruns have turned the ROI from positive to negative. The cancellation rate for large software applications is also a factor in litigation between outsource vendors and clients who commission large systems > 10,000 function points in size. It
0 0.1 0.2 0.3 0.4 0.5 0.6 0.710FPbest
10FPworst100FPbest
100FPworst1000FPbest
1000FPworst10,000FPbest
10,000FPworst100,000FPbest
100,000FPworst
Percentofcancelledprojects
CancellationPercentage
系列3
系列2
系列1
15
is no coincidence that all but one of the breach of contract cases where the author has been an expert witness have been > 10,000 function points in size. To avoid the risks of cancellation, litigation, cost overruns, and schedule overruns a synergistic combination of methods are needed:
• Early sizing and early risk analysis • Effective estimates that include requirements changes • Effective change control throughout development • Quality-strong development methods such as RUP, TSP, and Agile for small projects. • Effective defect prevention such as JAD, QFD, models, and prototypes • Effective pre-test defect removal such as inspections and static analysis • Effective testing by certified test personnel using modern test case designs
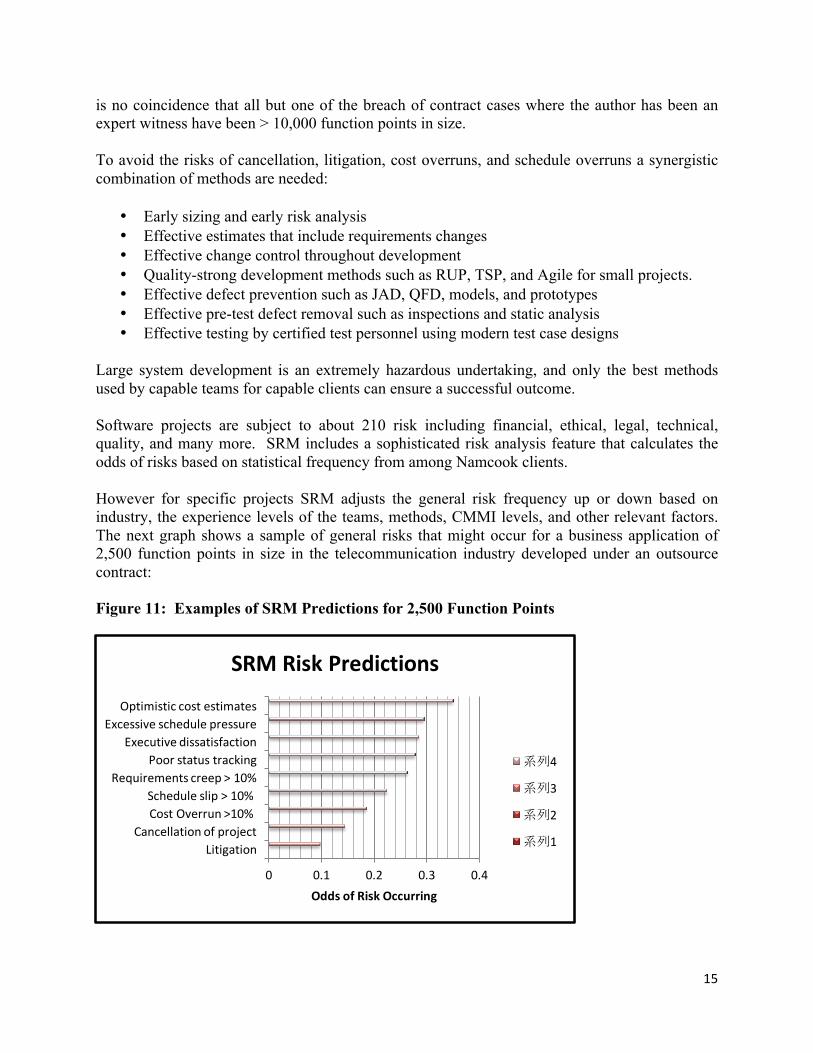
Large system development is an extremely hazardous undertaking, and only the best methods used by capable teams for capable clients can ensure a successful outcome. Software projects are subject to about 210 risk including financial, ethical, legal, technical, quality, and many more. SRM includes a sophisticated risk analysis feature that calculates the odds of risks based on statistical frequency from among Namcook clients. However for specific projects SRM adjusts the general risk frequency up or down based on industry, the experience levels of the teams, methods, CMMI levels, and other relevant factors. The next graph shows a sample of general risks that might occur for a business application of 2,500 function points in size in the telecommunication industry developed under an outsource contract: Figure 11: Examples of SRM Predictions for 2,500 Function Points
0 0.1 0.2 0.3 0.4
LitigationCancellationofproject
CostOverrun>10%Scheduleslip>10%
Requirementscreep>10%Poorstatustracking
ExecutivedissatisfactionExcessiveschedulepressure
Optimisticcostestimates
OddsofRiskOccurring
SRMRiskPredictions
系列4
系列3
系列2
系列1

16
This chart is only a small sample of 25 risks that SRM predicts for all projects. Risk analysis is a standard feature of SRM, as the name “Software Risk Master” indicates. Because SRM operates prior to requriements there should be time to deploy risk solutions. Note that for the “litigation” risk odds SRM actually predicts two types of litigation: 1) Breach of contract for outsource contracts or other forms of contract; 2) Patent litigation. SRM also has a special estimating mode that predicts the costs of the litigation for both the plaintiff and the defendant should the case go all the way through trial. (Out of court settlements are unpredictable.) Because quality is the critical element of software and finding bugs has been the major cost driver for more than 50 years, one of the main purposes of Software Risk Master is to predict quality results before projects start. The main predictions are “defect potentials,” “defect removal efficiency (DRE),” and “delivered defects.” The term defect potential refers to the sum total of possible bugs that might be found in requirements, design, code, documents, and bad fixes. SRM predicts all of these plus security flaws. All for levels of the IBM severity scale are predicted. The term defect removal efficiency (DRE) refers to the percentage of bugs found before the application is delivered to clients. In real life DRE ranges from below 80% to a maximum of about 99.9%. Delivered defects are the remaining defects that are still latent in software applications when they are delivered. SRM predicts both actual numbers of defects and also defects per function point and defects per KLOC. The normal distribution of delivered defects by severity level is approximately: Severity 1 total failure 1% Severity 2 major 15% Severity 3 minor 35% Severity 4 cosmetic 49% (However since high-severity defects are fixed faster than low, there is a tendency for clients to report artificially large numbers of severity 2 defects. Bugs reported by users often total > 50% severity 2, but this is artificial when the bugs are analyzed and a final score assigned by change teams or quality assurance using standard definitions of severity levels.) Following are overall results for software defect potentials. Note that data is expressed in terms of defects per function point rather than defects per KLOC. KLOC cannot be used for requirements and design defects, while function points can be used for every defect source. KLOC also penalizes high-level programming languages. It is a very hazardous and unreliable metric for an industry with over 2,500 programming languages and applications that normally contain multiple languages.

17
Figure 12: Software Defect Potentials
As can be seen there is quite a wide range between the best and worst cases. As can also be seen, defect potentials increase with application size. The next quality topic predicted by SRM is that of defect removal efficiency (DRE). Based on IBM practices originating in the 1970’s DRE is normally calculated by comparing defects found during development with defects reported by users in the first 90 days of application usage.
0 2 4 6 810FPbest
10FPworst100FPbest
100FPworst1000FPbest
1000FPworst10,000FPbest
10,000FPworst100,000FPbest
100,000FPworst
DefectsperFunctionPoint
SoftwareDefectPotentials
系列3
系列2
系列1
18
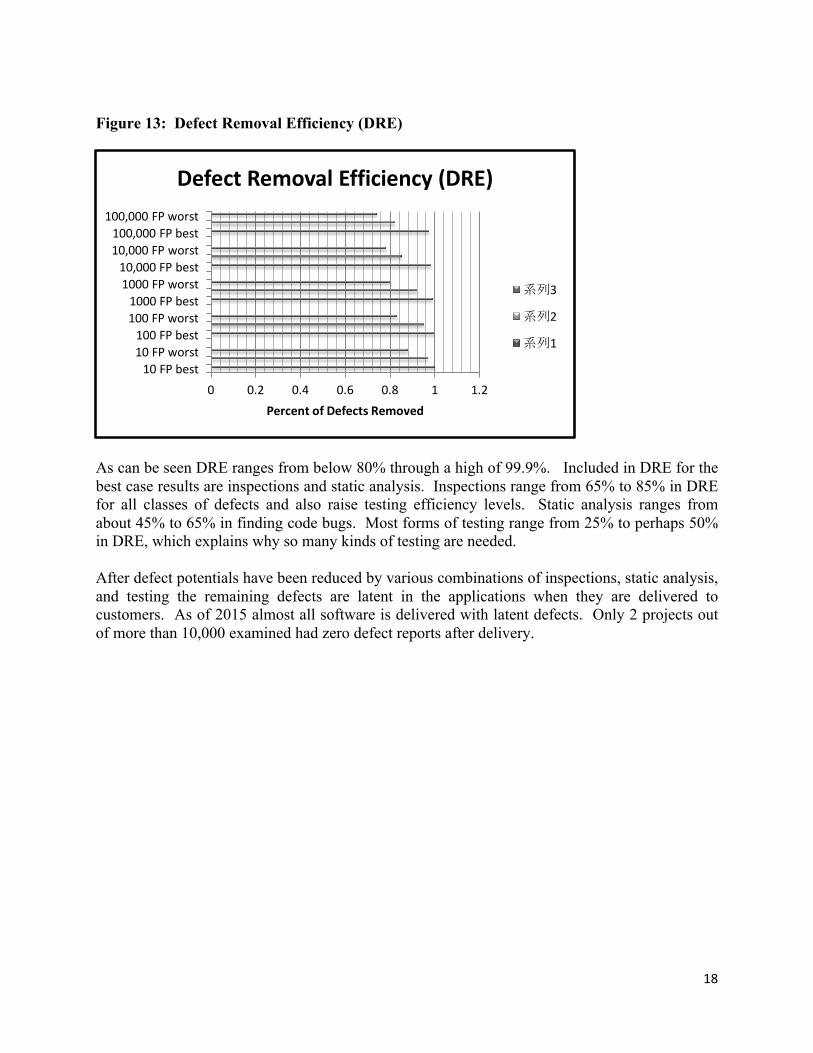
Figure 13: Defect Removal Efficiency (DRE)
As can be seen DRE ranges from below 80% through a high of 99.9%. Included in DRE for the best case results are inspections and static analysis. Inspections range from 65% to 85% in DRE for all classes of defects and also raise testing efficiency levels. Static analysis ranges from about 45% to 65% in finding code bugs. Most forms of testing range from 25% to perhaps 50% in DRE, which explains why so many kinds of testing are needed. After defect potentials have been reduced by various combinations of inspections, static analysis, and testing the remaining defects are latent in the applications when they are delivered to customers. As of 2015 almost all software is delivered with latent defects. Only 2 projects out of more than 10,000 examined had zero defect reports after delivery.
0 0.2 0.4 0.6 0.8 1 1.210FPbest
10FPworst100FPbest
100FPworst1000FPbest
1000FPworst10,000FPbest
10,000FPworst100,000FPbest
100,000FPworst
PercentofDefectsRemoved
DefectRemovalEfficiency(DRE)
系列3
系列2
系列1

19
Figure 14: Delivered Defects per Function Point
As can be seen there is a very large difference between the best and worst cases. The best case uses synergistic combinations of defect prevention, pre-test inspections and static analysis, and formal testing. The average case may use static analysis but usually omits inspections and also omits some of the more effective defect prevention methods such as Joint Application Design (JAD), modeling, and Quality Function Deployment (QFD). The worst case normally omits all forms of defect prevention and all forms of pre-test defect removal other than desk checking. Testing alone is not sufficient to achieve DRE levels much above 90%. Projects that use only testing without any pre-test defect removal normally run late and have many latent defects at delivery. Because sofware quality is such an important topic, it is surprising that many industries are not good at achieving high quality levels. The best industries are those that manufacture complex physical devices such as medical instruments, avionics packages, telephone switches, computers, and similar devices controlled by software. Following are approximate trends in defect removal by industry:
0 0.5 1 1.5 210FPbest
10FPworst100FPbest
100FPworst1000FPbest
1000FPworst10,000FPbest
10,000FPworst100,000FPbest
100,000FPworst
DefectsperFunctionPoint
DeliveredDefectsperFP
系列3
系列2
系列1

20
Figure 15: Software Defect Removal Efficiency (DRE) for Selected Industries
As can be seen the technical industries and those that control valuable property such as banks are the best. The comparatively poor showing for government software is often due to under staffing and lack of experience compared to the higher-paying corporations. Note that there are large variations in every industry. In every industry there are a few projects and organizations that approach 99% in DRE but there are many more of these in the high-technology industries than in the more generalized industries and government organizations. There are also interesting variances in quality at national levels. In general Japan which has a long tradition of high-quality in many industries is the top-ranked country. India has more high CMMI companies than almost any other, and has made quality a national initiative.
0.75 0.8 0.85 0.9 0.95 1Government- municipal
Government- state
Stock/commoditybrokerage
Insurance- Life
Banks- commercial
Software(commercial)
Manufacturing- electronics
DefectRemovalEfficiency(DRE)Percent
DefectRemovalbyIndustry
系列4
系列3
系列2
系列1
21
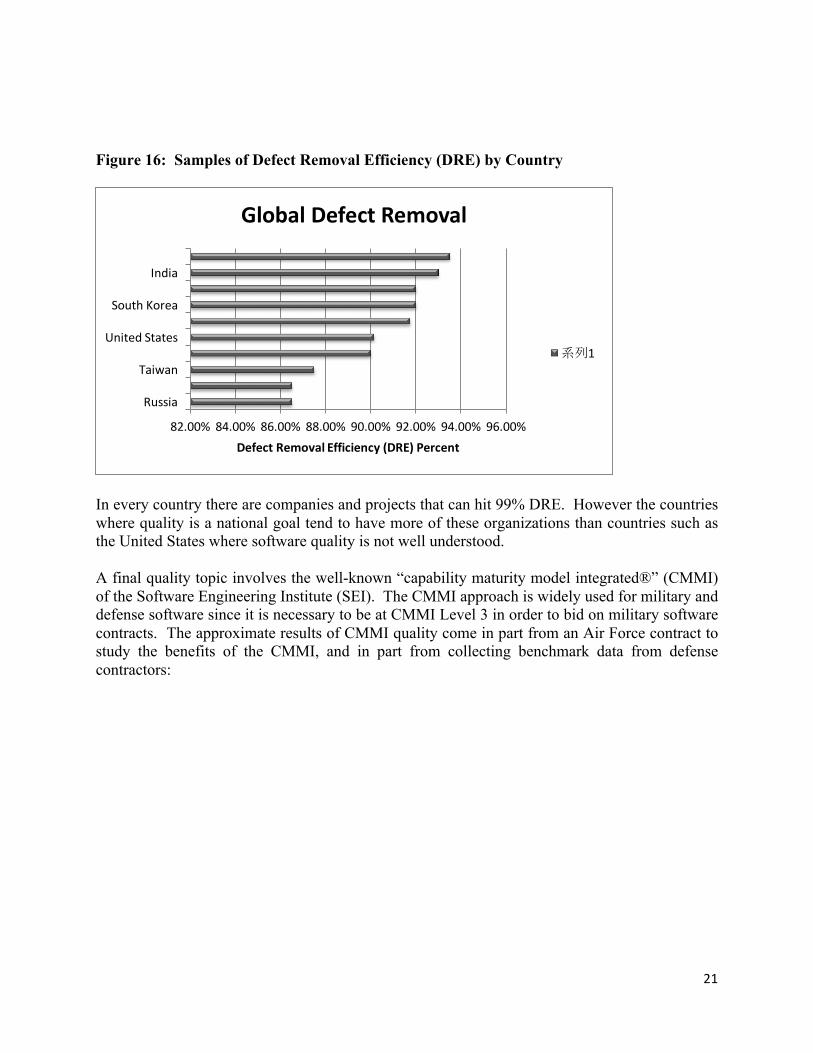
Figure 16: Samples of Defect Removal Efficiency (DRE) by Country
In every country there are companies and projects that can hit 99% DRE. However the countries where quality is a national goal tend to have more of these organizations than countries such as the United States where software quality is not well understood. A final quality topic involves the well-known “capability maturity model integrated®” (CMMI) of the Software Engineering Institute (SEI). The CMMI approach is widely used for military and defense software since it is necessary to be at CMMI Level 3 in order to bid on military software contracts. The approximate results of CMMI quality come in part from an Air Force contract to study the benefits of the CMMI, and in part from collecting benchmark data from defense contractors:
82.00% 84.00% 86.00% 88.00% 90.00% 92.00% 94.00% 96.00%
Russia
Taiwan
UnitedStates
SouthKorea
India
DefectRemovalEfficiency(DRE)Percent
GlobalDefectRemoval
系列1

22
Figure 17: CMMI and Defect Removal Efficiency (DRE)
As can be seen the higher levels of the CMMI from 3 up have good levels of defect removal efficiency (DRE). One might think that productivity would benefit too, but defense software carries heavy burdens of oversight and paperwork so it lags other industries in software development productivity. Actual coding speed is better than average, but with over 4,000 English words per function point combined with independent verification and validation and independent testing, defense software produces about three times the volume of paperwork of civilian projects of the same size and type. Another interesting international factor are the rather large variations in the effective work month. In the United States our nominal work month is 160 hours but the effective minus breaks and lunch is only about 132 hours per month. The effective work month has an impact on software schedules because more hours squeezed into a given month will clearly reduce the time required for production. The effective work hours per month for a small sample of countries is shown below:
0.75 0.8 0.85 0.9 0.95 1
CMMI1
CMMI2
CMMI3
CMMI4
CMMI5
DefectRemovalEfficiency(DRE)byCMMILevel
SEICMMIQualitybyLevel
系列2
系列1

23
Figure 18: Effective Work Hours per Month by Country
As can be seen India, China, and Japan have very long work month. South Korea actually used to be on top, but legislation since 2004 has reduced the Korean work month significantly. Japan is also trying to reduce work hours. The European Union has long been active in work hour reduction, and also in increasing paid vacations and sick time days. These are important topics for international estimation. A topic that is related to work hours is that of unpaid overtime. In the U.S. and many other countries software personnel may work quite a few hours on weekends and evenings without extra pay. In Scandanvia and countries where software personnel are unionzed overtime may be paid, but for much of the world software personnel are exempt from overtime pay. Unpaid overtime is seldom measured and this causes problems for estimation and also with using historical data as benchmarks. The missing unpaid overtime can make as much as 15% of total effort invisible! The following table is a standard SRM output and shows the impact of unpaid overtime on project costs for a project of 1000 function points or 53,333 Java statements. The graph shows unpaid overtime hours per calendar month for the full team; i.e. 2 hours per month for a team of 7 is 14 free hours worked each month:
0 50 100 150 200
SwedenKoreaCanada
USAMexicoChileJapanChinaIndia
Effectiveworkhourspermonth
EffectiveWorkHours
系列2
系列1

24
Figure 19: Impact of Unpaid Overtime on Software Project Costs
As can be seen unpaid overtime is a significant factor for software cost estimates, and it is equally significant for software schedule prediction. SRM includes unpaid overtime as a standard adjustment to estimates, but the default value is zero. Users need to provide local values for unpaid overtime in their specific organizations and for specific projects. The range of unpaid overtime runs from 0 to more than 20 hours per month. This is a major variable but one that is often not measured properly nor included properly in software cost estimates. When personnel are working long hours for free this has a big impact on project results. Another standard adjustment feature in SRM is that of raising or lowering project team sizes. By default SRM predicts the most likely team size for any given project. This means that a project with experts will need fewer personnel than the same project staffed with novices. However it often happens that to meet schedule pressure extra staff may be added. The reverse may also occur and staff might be diverted to some other project with higher priority. In any case adjusting staff size is a standard SRM feature that is available to users. Adding people tends to raise costs and lower productivity, so the main reason for doing it is to compress schedules. Assuming that a team size of 7 is normal for 1000 function points or 53,333 Java statements, the following table shows the schedule impact of raising or lowering team size:
1150000 1200000 1250000 1300000 1350000 1400000
Unpaid=16
Unpaid=12
Unpaid=8
Unpaid=4
Unpaid=2
Unpaid=0
ProjectCostswithMonthlyUnpaidOvertimeHours
UnpaidOvertimeandCosts
系列2
系列1
25
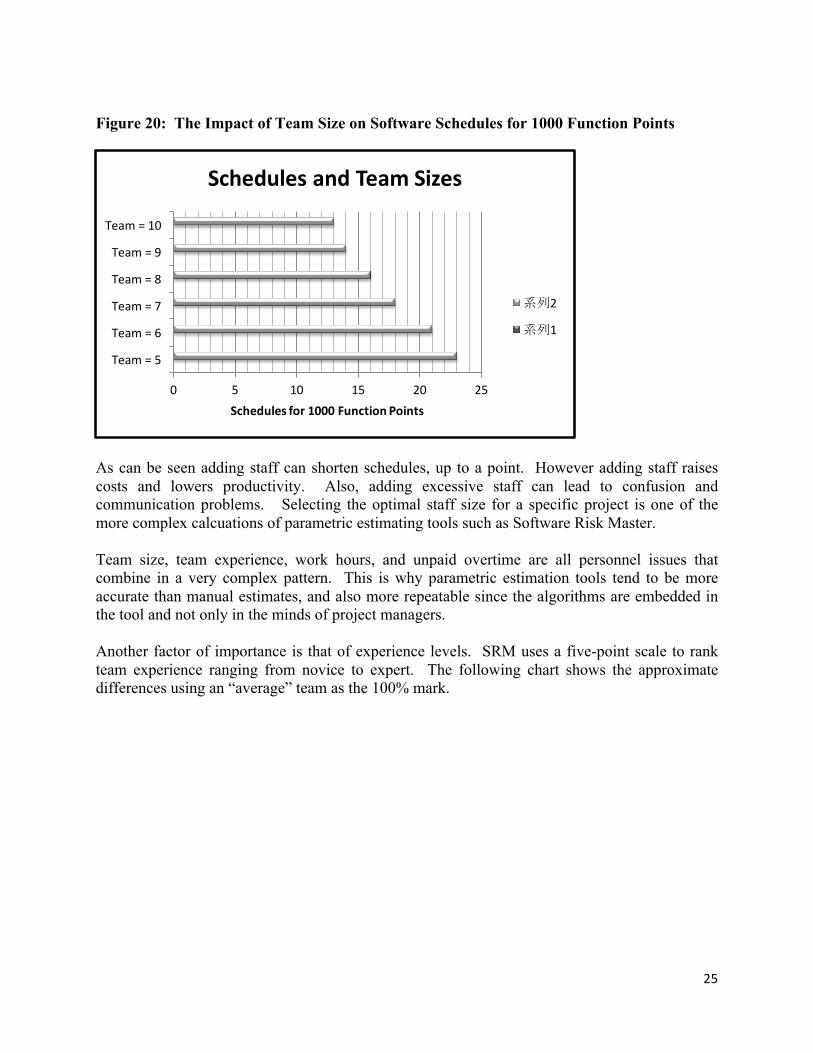
Figure 20: The Impact of Team Size on Software Schedules for 1000 Function Points
As can be seen adding staff can shorten schedules, up to a point. However adding staff raises costs and lowers productivity. Also, adding excessive staff can lead to confusion and communication problems. Selecting the optimal staff size for a specific project is one of the more complex calcuations of parametric estimating tools such as Software Risk Master. Team size, team experience, work hours, and unpaid overtime are all personnel issues that combine in a very complex pattern. This is why parametric estimation tools tend to be more accurate than manual estimates, and also more repeatable since the algorithms are embedded in the tool and not only in the minds of project managers. Another factor of importance is that of experience levels. SRM uses a five-point scale to rank team experience ranging from novice to expert. The following chart shows the approximate differences using an “average” team as the 100% mark.
0 5 10 15 20 25
Team=5
Team=6
Team=7
Team=8
Team=9
Team=10
Schedulesfor1000FunctionPoints
SchedulesandTeamSizes
系列2
系列1

26
Figure 21: Impact of Team Experience on Software Development Productivity
As can be seen results are slightly asymetrical. Top teams are about 30% more productive than average, but novice teams are only about 15% lower than average. The reason for this is that normal corporate training and appraisal programs tend to weed out the really unskilled so that they seldom become actual team members. The same appraisal programs reward the skilled, so that explains the fact that the best results have a longer tail. Software is a team activity. The ranges in performance for specific individuals can top 100%. But there are not very many of these super stars. Only about 5% to 10% of general software populations are at the really high level of the performance spectrum. One of the major factors that influence both quality and productivity is the availability of certified reusable materials that approach zero-defect quality levels. Reuse is much more than just code and also includes reusable requirements, architecture, design, test cases, code, user documents, training materials, and other artifacts of software development. The impact of varying amounts of reuse ranging from 0% to 90% is shown below for a typical application of 1,000 function points and 53,333 Java statements:
0 0.2 0.4 0.6 0.8 1 1.2 1.4
Novice
Inexperienced
Average
Experienced
Expert
Percentageofaverageperformance
ImpactofTeamExperience
系列2
系列1

27
Figure 22: Impact of Reuse on Software Productivity
As can be seen with 0% reuse productivity for this example is 10 function points per staff months (which is actually above average). For 90% reuse productivity is 100 function points per staff month. It is fair to ask what the results would be for 100% reuse, or constructing an application entirely from reusable materials without any manual coding at all. In this case requirements would still need to be collected and the application would still need to be tested before being deployed. The total effort would result in a productivity rate of about 500 function points per staff month. This volume of reuse is theoretically possible but uncommon. Mashup’s and a few kinds of specialized application generators approach 100% reuse. Overall industry norms for reuse range between 10% and 25%. However the industry tends to be careless and reuses uncertified materials which may contain bugs and security vulnerabilities. SRM predicts reuse based on a combination of team experience and programming languages (object-oriented languages tend to have more reuse than procedural languages). However the reuse amount is a variable that can be adjusted by SRM users to match local conditions. A question related to reuse deals with the relative performance of various software development methods. A topic of considerable interest to users of SRM and to the industry as a whole deals with the comparative productivity rates of various methodologies. With a total of at least 35 named development methods this topic is too large for this report. However the next chart shows a sample of common methods used for an application of 1,000 function points or 53,333 Java statements. Reuse is assemed to be 15% across all of the samples in figure 18. The three bars show worst, average, and best case results in terms of function points per staff month.
0 20 40 60 80 100 120
Reuse=0%
Reuse=20%
Reuse=40%
Reuse=60%
Reuse=80%
FunctionPointsperStaffMonth
ImpactofReuseonProductivity
系列2
系列1
28
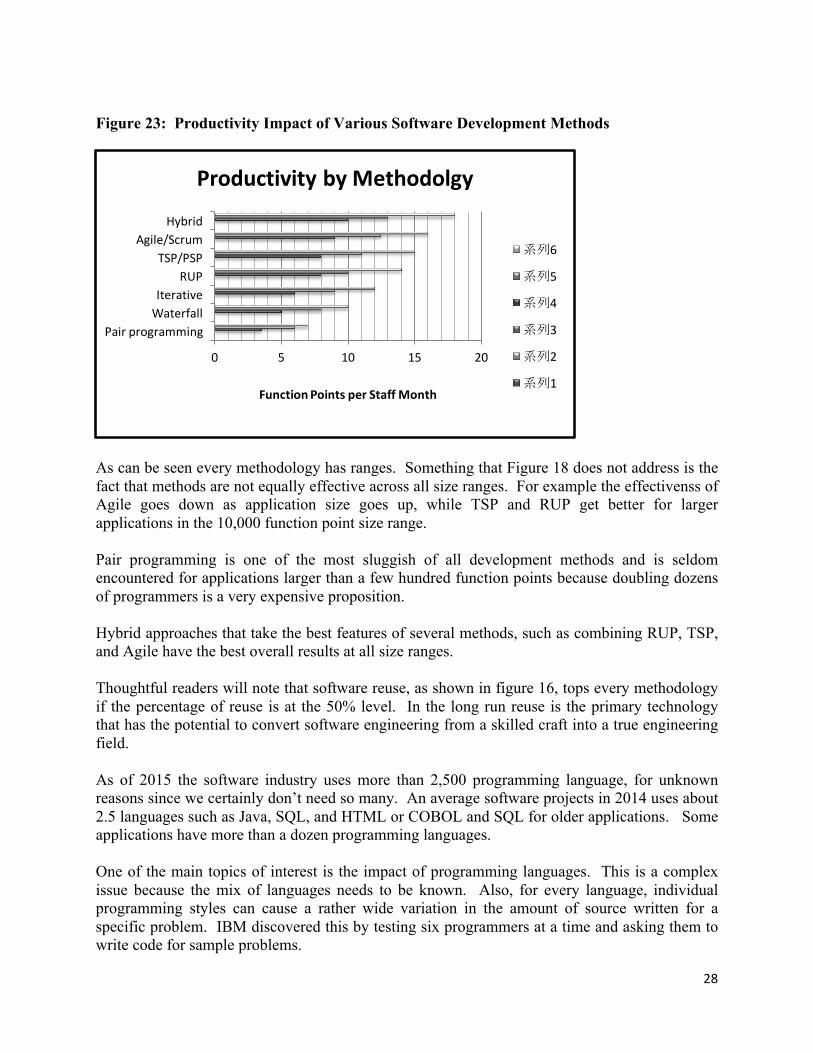
Figure 23: Productivity Impact of Various Software Development Methods
As can be seen every methodology has ranges. Something that Figure 18 does not address is the fact that methods are not equally effective across all size ranges. For example the effectivenss of Agile goes down as application size goes up, while TSP and RUP get better for larger applications in the 10,000 function point size range. Pair programming is one of the most sluggish of all development methods and is seldom encountered for applications larger than a few hundred function points because doubling dozens of programmers is a very expensive proposition. Hybrid approaches that take the best features of several methods, such as combining RUP, TSP, and Agile have the best overall results at all size ranges. Thoughtful readers will note that software reuse, as shown in figure 16, tops every methodology if the percentage of reuse is at the 50% level. In the long run reuse is the primary technology that has the potential to convert software engineering from a skilled craft into a true engineering field. As of 2015 the software industry uses more than 2,500 programming language, for unknown reasons since we certainly don’t need so many. An average software projects in 2014 uses about 2.5 languages such as Java, SQL, and HTML or COBOL and SQL for older applications. Some applications have more than a dozen programming languages. One of the main topics of interest is the impact of programming languages. This is a complex issue because the mix of languages needs to be known. Also, for every language, individual programming styles can cause a rather wide variation in the amount of source written for a specific problem. IBM discovered this by testing six programmers at a time and asking them to write code for sample problems.
0 5 10 15 20
PairprogrammingWaterfallIterative
RUPTSP/PSP
Agile/ScrumHybrid
FunctionPointsperStaffMonth
ProductivitybyMethodolgy
系列6
系列5
系列4
系列3
系列2
系列1

29
SRM can support all 2,500 languages but we provide clients with a pull down list of 100 common languages because 2,500 is too huge a volume to include in the input questionnaire. Following are the typical ratios of source code to function points for a small sample of programming languages: Figure 24: Ratios of Source Code to Function Points
As can be seen there are wide ranges in language code statements per function point. Figure 14 is based on logical code statements and not physical lines. (All SRM data dealing with source code uses logical statements.) The Objective C language has an interesting history. It was first developed at the ITT Corporation and then ownership was transferred to the Shoulders Corporation after Alcatel acquired the ITT telecommunications business. Steve Jobs selected Objective C for the Apple operating system and it is still the standard language today for Apple products. Steve Jobs also selected Objective C for the Next computer. Note that the values shown in figure 24 are variables and not constants. Individual programming styles and reusable code can cause large variations in source code per function point. The software industry uses a total of about 350 metrics. For function points alone, there are at least a dozen major variations including automated, backfired, COSMIC, FISMA, IFPUG, NESMA, SRM pattern matching, and unadjusted function points in alphabetical order. Although SRM uses IFPUG function points and logical code statements as default metrics, it actually produces size in a total of 23 different metrics. The following graph shows the relative sizes of a selection of metrics compared to IFPUG version 4.3:
0.00 50.00 100.00 150.00 200.00 250.00 300.00 350.00
BasicAssembly
C
Fortran
PL/I
C++
ObjectiveC
LogicalCodeStatementsperFunctionPoint
SourceCodetoFunctionPoints
系列1
30
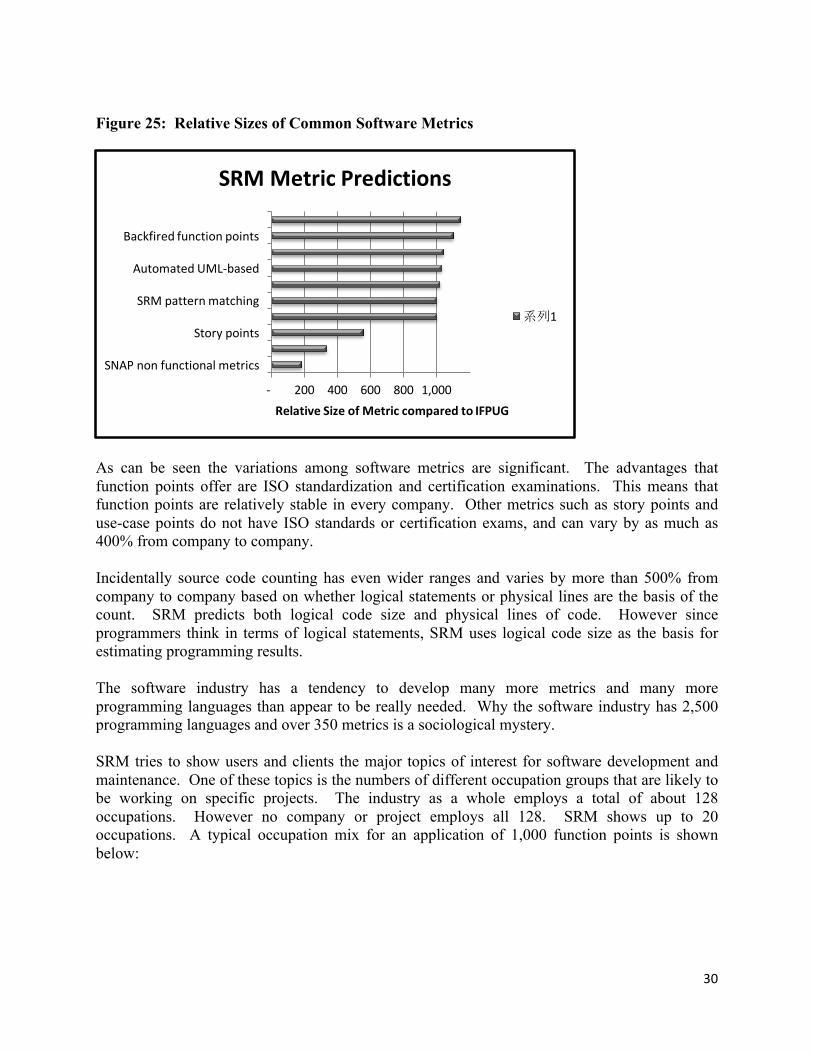
Figure 25: Relative Sizes of Common Software Metrics
As can be seen the variations among software metrics are significant. The advantages that function points offer are ISO standardization and certification examinations. This means that function points are relatively stable in every company. Other metrics such as story points and use-case points do not have ISO standards or certification exams, and can vary by as much as 400% from company to company. Incidentally source code counting has even wider ranges and varies by more than 500% from company to company based on whether logical statements or physical lines are the basis of the count. SRM predicts both logical code size and physical lines of code. However since programmers think in terms of logical statements, SRM uses logical code size as the basis for estimating programming results. The software industry has a tendency to develop many more metrics and many more programming languages than appear to be really needed. Why the software industry has 2,500 programming languages and over 350 metrics is a sociological mystery. SRM tries to show users and clients the major topics of interest for software development and maintenance. One of these topics is the numbers of different occupation groups that are likely to be working on specific projects. The industry as a whole employs a total of about 128 occupations. However no company or project employs all 128. SRM shows up to 20 occupations. A typical occupation mix for an application of 1,000 function points is shown below:
- 200 400 600 800 1,000
SNAPnonfunctionalmetrics
Storypoints
SRMpatternmatching
AutomatedUML-based
Backfiredfunctionpoints
RelativeSizeofMetriccomparedtoIFPUG
SRMMetricPredictions
系列1
31
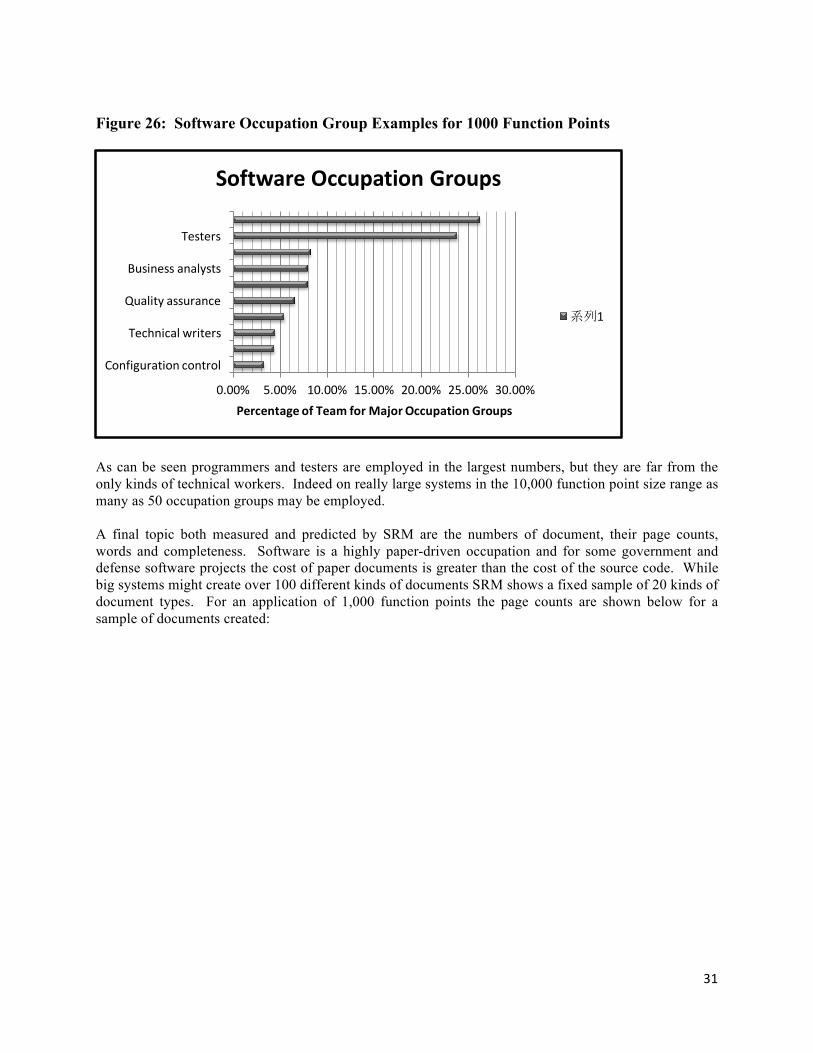
Figure 26: Software Occupation Group Examples for 1000 Function Points
As can be seen programmers and testers are employed in the largest numbers, but they are far from the only kinds of technical workers. Indeed on really large systems in the 10,000 function point size range as many as 50 occupation groups may be employed. A final topic both measured and predicted by SRM are the numbers of document, their page counts, words and completeness. Software is a highly paper-driven occupation and for some government and defense software projects the cost of paper documents is greater than the cost of the source code. While big systems might create over 100 different kinds of documents SRM shows a fixed sample of 20 kinds of document types. For an application of 1,000 function points the page counts are shown below for a sample of documents created:
0.00% 5.00% 10.00% 15.00% 20.00% 25.00% 30.00%
Configurationcontrol
Technicalwriters
Qualityassurance
Businessanalysts
Testers
PercentageofTeamforMajorOccupationGroups
SoftwareOccupationGroups
系列1

32
Figure 27: Software Document Types for 1000 Function Points
As can easily be seen, software is a very paper-intensive occupation. For big systems the sum total of document creation and document reading costs can hit 100 different kinds of documents and top 40% of the total development budget. Since documents can be measured with function points, but not with lines of code, the high costs of paperwork are invisible to projects that use lines of code as a productivity metric. One of the virtues of the agile methodology is that it reduces the volume of paper documents. Even agile cannot reduce them very much because it is necessary to keep records to satisfy tax and business requirements. It is also necessary to create substantial documents for software that requires FDA or FAA certification. All of the variables discussed in this paper operating concurrently. One of the reasons why parametric estimation using tools such as SRM is more accurate than manual estimates is that parametric estimation tools can handle the simultaneous impacts of multiple variables. Table 1 shows the ranges between the best, average, and worst cases for a variety of these variable topics. However to simplify the comparisons table 1 assumes U.S. development for all cases and excludes unpaid overtime. The idea is to show the impact of the technical variables and not the work habit variables:
- 200 400 600 800 1,000 1,200
Statusreports
Testplans
Courses
Changerequests
HELPtext
Usermanuals
Requirements
Initialdesign
Detaildesign
Bugreports
PagesProducedfor1000FunctionPoints
DocumentPagesbyType
系列1

33
Table 1: Comparisons of Excellent, Average, and Poor Software Results
Topics Excellent Average Poor
Monthly Costs (Salary+overhead) $10,000 $10,000 $10,000
Size at Delivery
Size in function points
1,000
1,000
1,000 Programming language Java Java Java Language Levels 6.25 6.00 5.75 Source code per function point 51.20 53.33 55.65 Size in logical code statements 51,200 53,333 55,652 Size in KLOC 51.20 53.33 55.65 Certified reuse percent 20.00% 10.00% 5.00%
Quality Defect potentials 2,818 3,467 4,266
Defects per function point 2.82 3.47 4.27 Defects per KLOC 55.05 65.01 76.65
Defect removal efficiency (DRE) 99.00% 90.00% 83.00% Delivered defects 28 347 725 High-severity defects 4 59 145 Security vulnerabilities 2 31 88 Delivered per function point 0.03 0.35 0.73 Delivered per KLOC 0.55 6.50 13.03
Formal inspections of deliverables Yes No No Static analysis of all code Yes Yes No Formal test case design Yes Yes No Testing by certified test personnel Yes No No
Project Parameter Results Schedule in calendar months 12.02 13.80 18.20
Technical staff + management 6.25 6.67 7.69 Effort in staff months 75.14 92.03 139.98
Effort in staff hours
9,919
12,147
18,477 Costs in Dollars $751,415 $920,256 $1,399,770 Cost per function point $751.42 $920.26 $1,399.77 Cost per KLOC $14,676 $17,255 $25,152

34
Productivity Rates Function points per staff month 13.31 10.87 7.14
Work hours per function point 9.92 12.15 18.48 Lines of code per staff month 681 580 398
Cost Drivers Bug repairs 25.00% 40.00% 45.00%
Paper documents 20.00% 17.00% 20.00% Code development 35.00% 18.00% 13.00% Meetings 8.00% 13.00% 10.00% Management 12.00% 12.00% 12.00% Total 100.00% 100.00% 100.00%
Methods, Tools, Practices Development Methods TSP/PSP Agile Waterfall
Requirements Methods JAD Embedded Interview CMMI Levels 5 3 1 Work hours per month 132 132 132 Unpaid overtime 0 0 0 Team experience Experienced Average Inexperienced Formal risk analysis Yes Yes No Formal quality analysis Yes No No Formal change control Yes Yes No Formal sizing of project Yes Yes No Parametric estimation tools Yes No No Inspections of key materials Yes No No Static analysis of all code Yes Yes No Formal test case design Yes No No Certified test personnel Yes No No Accurate status reporting Yes Yes No Accurate defect tracking Yes No No More than 15% certified reuse Yes Maybe No Low cyclomatic complexity Yes Maybe No Test coverage > 95% Yes Maybe No
The main goal of SRM is to provide clients with useful information before projects start and before serious money is expended. By highlighting and illustrating the results of various software methods and practices, it is hoped that SRM will move companies to adopt proven best practices and avoid harmful practices. Due to the patented early sizing and early estimation features of SRM, all of these predictions can all be made prior to requirements or between 60 days and 180 days earlier than other software estimation methods.
35
SRM produces a number of specialized estimates that are not included or discussed in this short report. Among these specialized estimates are:
• ERP deployment and training costs • Cyber attack recovery costs • Venture funding and equity dilution for software startups • Portfolio sizing and annual maintenance costs • Litigation costs for plaintiff and defendant in outsource cases • User training for complex applications • Meetings and communication costs, including Scrum • FDA and FAA certification costs • Sarbanes-Oxley governance costs • Function point counting costs
In addition SRM has empty cost “buckets” in which users can include unpredictable costs that they want to have added to the development and total cost of ownership (TCO) results:
• COTS acquisition costs • Outsource contract legal fees • Tool and hardware acquistion costs • Travel costs to clients • Travel costs to multiple development labs • Patent filing fees • Patent licencing fees • Marketing and advertizing for commercial software
The essential idea behind Software Risk Master is that early sizing and early estimating before requirements will provide software executives with advanced warning of risks and obstacles while there is still time to deploy effetive solutions before serious money is spent on projects that may fail or go off track later. This kind of early warning increases in value with application size. Small projects < 1000 function points have few risks and are often successful. Large systems > 10,000 function points have many risks and are often unsuccessful. Accuracy of SRM Predictions Compared to Client Historical Data Users of parametric estimation tools always ask about the accuracy of the estimates compared to historical data. Surprisingly, the estimates from SRM and indeed from other parametric estimation tools are usually more accurate than client historical data. Most companies’ historical data “leaks” and omits substantial volumes of effort and costs. The most common omissions are the work of project managers and also the work of part-time specialists such as business analysts, quality assurance, technical writers, and others. From
36
interviews with project teams and project managers, the accuracy of historical data averages only about 37% of total effort and costs. Companies that use DCUT or “design, code, and unit test” are even worse at about 30% of total costs. Unpaid overtime is also omitted, which is unfortunate because it has a bid impact on schedules and on apparent costs. There are some companies and projects that record 100% of costs with accuracy be these are in the minority. The most accurate costs and effort for software projects are those by outsource vendors who need accurate data in order to get paid. Some leading companies such as IBM also have accurate data, but many ordinary companies do not. Quality data also leaks and is less accurate than SRM predictions. Most companies do not start measuring quality until after unit test, so all bugs found by desk checking and static analysis are invisible. Companies that use formal inspections have better data than others. Companies that use the team software process (TSP) also have good data. Companies that use function point metrics are usually better than those that use lines of code, story points, or use-case points. Among the worst in terms of accuracy are internal projects produced under the cost center model and using methodologies that tend to skimp on measures such as agile development. The SRM benchmark method includes team interviews and interviews with project managers. The purpose of these interviews is to eliminate “leaks” in historical data and capture 100% of software costs and effort. Self-reported data without interviews is often inaccurate due to the endemic industry problems of leakage and partial data collection. Summary and Conclusions Software Risk Master (SRM) is a dual-purpose tool that can produce very early costs, schedule, and quality estimates before requirements with very good accuracy; often within 5%. It is also a powerful data collection or benchmark tool that can collect historical data with very high precision: in theory SRM can capture historical data to better than 1% precision. Good measurements lead to good estimates. Good measures combined with good estimates lead to successful projects that are on time, work well, have excllent quality, and also have happy customers and high employee morale.
37
References and Additional Information from Namcook Analytics
1. Namcook Blog: http://Namcookanalytics.com
2. Namcook web site: www.Namcook.com
3. Jones, Capers The Technical and Social History of Software Engineering; Addison Wesley Longman, Boston, MA; ISBN 978-0-321-90342-6 December 2013; 452 pages.
4. Jones, Capers and Bonsignour, Olivier; The Economics of Software Quality; Addison Wesley
Longman, Boston, MA; ISBN 10: 0-13-258220—1; 2011; 585 pages. 5. Jones, Capers; Software Engineering Best Practices; McGraw Hill, New York, NY; ISBN 978-0-
07-162161-8; 2010; 660 pages.
6. Jones, Capers; Applied Software Measurement; McGraw Hill, New York, NY; ISBN 978-0-07-150244-3; 2008; 662 pages.
7. Jones, Capers; Estimating Software Costs; McGraw Hill, New York, NY; 2007; ISBN-13: 978-0-
07-148300-1.
8. Jones, Capers; Software Assessments, Benchmarks, and Best Practices; Addison Wesley Longman, Boston, MA; ISBN 0-201-48542-7; 2000; 657 pages.
9. Jones, Capers; Conflict and Litigation Between Software Clients and Developers; Software
Productivity Research, Inc.; Burlington, MA; September 2007; 53 pages; (SPR technical report).
10. Jones, Capers; Assessment and Control of Software Risks; Prentice Hall, 1994; ISBN 0-13-741406-4; 711 pages.
11. Jones, Capers; Patterns of Software System Failure and Success; International Thomson
Computer Press, Boston, MA; December 1995; 250 pages; ISBN 1-850-32804-8; 292 pages.
12. Jones, Capers; “Early Sizing and Early Risk Analysis”; Namcook Analytics LLC; a. Narragansett, RI; July 2011.
13. Jones, Capers; Software Quality – Analysis and Guidelines for Success; International Thomson Computer Press, Boston, MA; ISBN 1-85032-876-6; 1997; 492 pages.
14. Jones, Capers: “Sizing Up Software;” Scientific American Magazine, Volume 279, No. 6,
December 1998; pages 104-111.
15. Jones, Capers; “Preventing Software Failure: Problems Noted in Breach of Contract Litigation”; Capers Jones & Associates, Narragansett, RI; 2008; 25 pages.