software to support expert elicitation
TRANSCRIPT

National Institute for Public Healthand the Environment P.O. Box 1 | 3720 BA Bilthovenwww.rivm.com
Software to support expert elicitationAn exploratory study of existing software packages
RIVM Letter Report 630003001/2011 J.L.A. Devilee | A.B. Knol

Software to support expert elicitation An exploratory study of existing software packages
RIVM Letter report 630003001/2011 J.L.A. Devilee | A.B. Knol

RIVM Letter report 630003001
Page 2 of 98
Colofon
© RIVM 2011 Parts of this publication may be reproduced, provided acknowledgement is given to the 'National Institute for Public Health and the Environment', along with the title and year of publication.
Jeroen Devilee, RIVM Anne B. Knol, RIVM Contact: Anne B. Knol MEV/MGO [email protected]
This investigation has been performed by order and for the account of Director General RIVM, within the framework of VAMPHIRE project, SOR 2006-2010

RIVM Letter report 630003001
Page 3 of 98
Abstract
Software to support expert elicitation. An exploratory study of existing software packages Expert elicitations are used to gather the informed opinion of experts on topics about which little or no knowledge is available. They can also be used to build consensus on controversial knowledge. Software packages can provide important support, but a lot of researchers are not well aware of that. The National Institute for Public Health and the Environment (RIVM) therefore made an overview of the different possibilities. For this overview scientific literature has been reviewed, supplemented with sources on the Internet. This has been funded from the strategic research program (SOR) of the institute. There appear to exist software packages that provide support in: 1) the collaboration of experts and building consensus; 2) characterization of uncertainties; 3) selection of experts; 4) design and execution of the process of estimation and; 5) aggregation and reporting about outcomes. When designing and executing the estimation process, software can assist in developing and analysing conceptual models. They can also assist in the assessment of scenarios and the estimation of model parameters. For the characterization of uncertainties only one type of software is available: the software of the Netherlands Environmental Assessment Agency (PBL). Currently, supporting software appears not to be equipped to moderate expert elicitations by mail or by using Internet as an alternative for gathering a group of experts on one specific location. As the exact and future usage of expert elicitation at RIVM is not known, it is not possible to provide specific advice on the use of software in these specific situations. Keywords: software, expert, elicitation, support, statistics, program

RIVM Letter report 630003001
Page 4 of 98
Rapport in het kort
Software ter ondersteuning van expert schattingen: een verkennende studie Expertschattingen worden gebruikt om opvattingen van experts te verzamelen over onderwerpen waarover nog weinig of geen kennis beschikbaar is. Ze kunnen ook worden ingezet om consensus over controversiële kennis te bereiken. Softwarepakketten kunnen hierbij belangrijke ondersteuning bieden, maar veel onderzoekers zijn daar niet goed van op de hoogte. Het RIVM heeft daarom een overzicht gemaakt van de verschillende mogelijkheden. Voor de inventarisatie is wetenschappelijke literatuur geraadpleegd, aangevuld met bronnen op internet. Dit is gefinancierd vanuit het strategische onderzoeksprogramma (SOR) van het instituut. Er blijken pakketten te bestaan die ondersteunen bij: 1) het samenwerken van experts en het bereiken van consensus over onderwerpen 2) de karakterisering van onzekerheden; 3) de selectie van experts; 4) het ontwerp en de uitvoering van het schattingsproces zelf en; 5) het bijeen brengen en rapporteren van de uitkomsten. Bij het ontwerpen en uitvoeren van het schattingsproces kan software helpen om de conceptuele modellen te ontwikkelen en te analyseren. Daarnaast kunnen ze assisteren bij de beoordeling van scenario’s, en bij het schatten van modelparameters. Voor de karakterisering van onzekerheden is slechts één type software beschikbaar, namelijk de software die door het Planbureau voor de Leefomgeving. De ondersteunende software blijkt momenteel vaak nog niet uitgerust om expertschattingen via internet of e-mail te laten verlopen, in plaats van door een groep experts op locatie bijeen te brengen. Omdat het huidige en toekomstige gebruik van expertschattingen op het RIVM onbekend is, kan er niet geadviseerd worden over het gebruik van software in deze specifieke situaties. Trefwoorden: software, expert, schatting, ondersteuning, statistiek, programma

RIVM Letter report 630003001
Page 5 of 98
Contents
Summary—7
1 Introduction and aims—11
2 Methods—13 2.1 Selecting software—13 2.2 Description of relevant features—13
3 Software to support the process of expert elicitation—15 3.1 Introduction—15 3.1.1 Tools for collaboration and consensus—16 3.2 Characterisation of uncertainties—16 3.3 Selection of experts—18 3.4 Design and execution of the elicitation session—19 3.4.1 Developing conceptual models—19 3.4.2 Analysing conceptual models—22 3.5 Possible aggregation and reporting—34
4 Conclusions and recommendations for software development—37
5 References—39
6 Appendix A—43 6.1 List of software packages—43 6.1.1 @Risk—43 6.1.2 1000Minds—43 6.1.3 AHP templates—44 6.1.4 Analytica—45 6.1.5 Arc Gis customized—46 6.1.6 B-course—47 6.1.7 CoFFEE—48 6.1.8 Criterium Decision plus—49 6.1.9 Crystal Ball—49 6.1.10 Decision Deck—50 6.1.11 Decision Explorer—51 6.1.12 Definite—52 6.1.13 Delphi Blue or a hosted version on realtimedelphi.com—53 6.1.14 DPL—54 6.1.15 ELI—55 6.1.16 Elicitor—55 6.1.17 Elicitor (v. 2010)—56 6.1.18 Equity 3—57 6.1.19 Excalibur—58 6.1.20 Expert Choice—59 6.1.21 Facilitate Pro—60 6.1.22 FC Mapper—61 6.1.23 Flash Q—61 6.1.24 GeNIe—62 6.1.25 GoldSim—63 6.1.26 Google docs—64 6.1.27 Hiview 3—65

RIVM Letter report 630003001
Page 6 of 98
6.1.28 Hugin—66 6.1.29 Limesurvey—67 6.1.30 Logical Decisions 6.1—68 6.1.31 Microsoft Baynesian Network Toolkit—68 6.1.32 Modelrisk 3.0—69 6.1.33 NETICA—70 6.1.34 Opinions-Online—71 6.1.35 Precision Tree—72 6.1.36 Prime Decisions—73 6.1.37 PROBES (part of DYNAMO)—74 6.1.38 Pqmethod—75 6.1.39 Quasta—76 6.1.40 RAMAS Constructor—77 6.1.41 RAMAS Risk Calc—78 6.1.42 Rich-Decisions—79 6.1.43 RiskSim—80 6.1.44 SamIam (Sensitivity analysis, modelling Interference, and more)—80 6.1.45 SensIt—81 6.1.46 SHELF 2.0 (beta)—82 6.1.47 Simlab—83 6.1.48 SL Gallery—84 6.1.49 Smart speed connect—84 6.1.50 Survey Monkey—85 6.1.51 Thinktank 3.2—86 6.1.52 TreeAge Pro Suite (Excel, Healthcare)—86 6.1.53 Treeplan—87 6.1.54 Unibalance—88 6.1.55 Unicorn (Uncertainty Analysis with Correlations)—89 6.1.56 Unigraphics—90 6.1.57 Uninet—91 6.1.58 Unisense—91 6.1.59 Vanguard System—92 6.1.60 Vanguard Decision Tree Suite—93 6.1.61 V.I.S.A.—94 6.1.62 Web-Hipre—94 6.1.63 Web Q—95 6.1.64 Win Pre—96 6.1.65 Ynsyte WebIQ—97

RIVM Letter report 630003001
Page 7 of 98
Summary
S 1 Introduction and aims Expert elicitation involves the structured questioning of experts on a subject about which knowledge is unavailable, incomplete or controversial. Previous experience in RIVM projects that concerned expert elicitation learned that the use of software, for instance to provide graphical feedback about the results of a elicitation session, was very useful. It enabled experts to view the results and compare their own judgments to others. There are many different types of software that could support different phases of the expert elicitation process. Unfortunately, currently no overview of existing software tools to support expert elicitation exists. Therefore, it is unknown which software packages could be applied for which phases and whether further tools are necessary. The main aims of this study were to:
- outline the possible means in which software programs may support expert elicitation;
- explore existing software programs that could support expert elicitation; - review the functionalities of these existing software projects and review
their potential usefulness for future expert elicitations. In answering these questions, this report intends to support scientists who want to organize an expert elicitation and helps them to take full advantage of the possibilities of different kinds of software.
S 2 Methods We have carried out desktop research (literature reviews and internet searches) to identify software packages that could be suitable to support (parts of) expert elicitation sessions. Even though our methods will not have identified all software available, we think we have been able to obtain a reasonably good overview of the general types of software that could be used to support expert elicitation sessions. In order to get a useful description of the software in relation to their potential use in expert elicitations, we made a list of potentially relevant features of the software, including functionality/purpose of the software, type of input by the experts, type of output and anonymity in a group session.
S 3 Software to support the process of expert elicitation Formal expert elicitation is often carried out according to a protocol, which outlines the different steps in the process. In the field of environment and health, a protocol has been developed –based on existing protocols- which contains the following seven steps: 1) characterization of uncertainties; 2) scope and format of the elicitation; 3) selection of experts; 4) design of the elicitation protocol; 5) preparation of the elicitation session; 6) elicitation of expert judgments and; 7) possible aggregation and reporting. For this report about software support not all steps are equally important. For steps 2 and 5, no software support is needed or available. Moreover, steps 4 and 6 are strongly interrelated from a software point of view and therefore combined in this report. In this report, we therefore distinguish the following steps: 1) Characterization

RIVM Letter report 630003001
Page 8 of 98
of uncertainties; 2) Selection of experts; 3) Design and execution of the elicitation session; and 4) Possible aggregation and reporting. In addition, we discuss software packages that can be used to support collaboration and consensus-building, which are not confined to a specific step, but can be useful throughout the elicitation process.
S 3.1 Tools for collaboration and consensus building Software for online collaboration can be used for brainstorming, categorizing, prioritizing, voting, carrying out surveys and action planning. Packages that can assist these activities are: Delphi Blue, Vanguard System, Facilitate Pro, Smart speed connect, CoFFEE, Thinktank 3.2, Ynsyte WebIQ.
S 3.2 Characterization of uncertainties In this phase, it can be identified whether expert elicitation is a relevant approach to deal with the uncertainties, by characterising the type of uncertainty at hand. The Netherlands Environmental Assessment agency has developed an online Guidance for uncertainty assessment and communication that has tools for characterizing uncertainties. The toolbox is suitable for projects with different combinations of a) the relevance of the uncertainty (little, medium, large) and b) the capacity/resources available (little, medium, large).
S 3.3 Selection of experts Selection of experts can for instance be carried out by asking authors of relevant papers to nominate experts. For this so-called two-step procedure, online literature databases (Pubmed, Scopus, Web of science, Google scholar) and online surveys can be useful instruments. Online databases can be used in the first step, while online surveys are useful in the nomination process. Specific advantages of online surveys are that they guarantee anonymity and that these surveys provide the possibility to include experts from different geographical locations who can fill out the survey at a time that suits them. Moreover, online surveys provide means to reveal the perspectives of the experts involved. Packages for online surveys include: Survey Monkey, Google Docs, Opinions-Online and Lime survey. Another technique to reveal the perspectives of experts is a Q-sort. The Q-sort is a card sort technique, which asks respondents to identify statements (on cards) they most or less agree with. Software that supports Q-sorts includes PQ-method, Flash Q and Web Q.
S 3.4 Design and execution of the elicitation process Expert elicitation can be used in the field of environment and health to contribute to 1) the development of conceptual models; 2) the analysis of conceptual models; 3) the evaluation of alternatives and scenario’s and; 4) the estimation of model parameters.
S 3.4.1 Software to develop conceptual models Conceptual models can be used to graphically represent the causal relationships between different variables, e.g. between an environmental exposure and a health effect. The elicitation of conceptual model can be aided by using software that graphically builds such models or by mind mapping, in which the ideas of experts about, for instance, a working mechanism are graphically represented. Software packages that support the development of conceptual models and mindmaps include MS Visio, Mindjet Mindmanager, Matchware Mindview, iMindmap, Diagram designer, VUE, Freemind and Xmind.

RIVM Letter report 630003001
Page 9 of 98
S 3.4.2 Software to analyse conceptual models There are several ways to analyse conceptual models, including: assigning plusses and minuses to relationships between variables; providing qualitative or quantitative estimates about the strength of relationships; and assigning probabilities to the possible states of variables. Experts can have a role in providing these different types of estimates. Software that could be used to support this process includes: Decision Explorer, DAG program, Quasta, FC Mapper. Tree Age Pro suite (Excel, Healthcare), Precision Tree, Analytica, DPL, NETICA, Hugin, Uninet, SamIam, B-course and the Microsoft Bayesian network toolkit
S 3.4.3 Software to evaluate alternatives and scenarios Evaluation of alternatives and scenario’s as part of an expert elicitation can be supported by software that implements decision trees or by software for Multi Criteria Analysis. Software that can be used for these purposes includes: Tree Age Pro Suite, (Excel, Healthcare), Precision Tree, Analytica, DPL, Equity3, Hiview3, Logical decisions 6.1, Expert Choice, Definite, 1000minds, V.I.S.A., Criterium Decision Plus, Unibalance-Unisense-Unigraphics, Web-Hipre, Rich decisions, Win pre, Prime Decisions, Decision Deck, AHP templates and NAIADE.
S 3.4.4 Software to estimate parameters Expert elicitation can also be used to get an idea of the magnitude and uncertainty of a particular ‘unknown’ variable. Such quantitative estimates are often expressed in probabilistic terms (min, max and most likely values; subjective probability density functions, etc). This type of elicitation can benefit substantially from graphical support by software. In addition, parameters can be elicited using specific software that helps experts to insert and check their estimates, or provides features to analyze results. Software that supports this process includes: SHELF, RAMAS constructor, ELI, Elicitor (v. 2010), Probes, Arc GIS customized, SL Gallery, Probes and Hypo. Although most software packages for sensitivity analysis are not specifically meant for expert elicitation, they often acknowledge that some of their input data can be based on information provided by experts. Consequently, the packages often provide input modules. Relevant software packages are: @Risk, Modelrisk 3.0, Crystall Ball, Goldsim, Risksim, RAMAS Risk Calc., Unicorn.
S 3.5 Possible aggregation and reporting This step of expert elicitation involves analysis of results, potential aggregation and reporting. All kinds of statistical software packages can assist in this aggregation process and a whole range of editors can be used to generate useful reports. Further discussion about these types of generic software packages, however, is beyond the scope of this report. More complex mathematical aggregation of expert judgments has the potential to perform better than just taking the mean. For example, the Excalibur package can be used to aggregate results based on the performance of the experts in providing valid estimates. .
S 4 Conclusions and recommendations for software development
In general the number and variety of software packages that can be used to support expert elicitation is large. Consequently, the needs in the different

RIVM Letter report 630003001
Page 10 of 98
elicitation phases seem to be satisfied sufficiently. This holds especially for the packages that assist in developing conceptual models, software to analyse influence diagrams, packages that can be used to evaluate different scenarios on the basis of decision trees and packages that can be used for eliciting single parameters, such as probabilities and probability distributions. The software available to characterize uncertainties is limited. To our knowledge only the Guidance for Uncertainty Assessment and Communication of the Netherlands Environmental Assessment Agency provides assistance. In addition, among the software we reviewed there is a lack of software that lowers the costs of expert elicitations in terms of travel, organizing and meeting time and consequently money. Software for online collaboration and discussion might have a role in that, but we think that special purpose, user-friendly elicitation software that can be used online or sent by e-mail can provide a fruitful additional contribution. The main barrier to use software in expert elicitations may be unfamiliarity with the possibilities and availability of existing software packages. With this report, we hope to increase this familiarity and thereby the use of relevant software in expert elicitations.

RIVM Letter report 630003001
Page 11 of 98
1 Introduction and aims
There are many ways in which environmental stressors may affect population health. Assessment of environmental health impacts often requires a variety of information, assumptions and data. Especially for the assessment of complex environmental health issues, such as climate change or Q fever, such information is often lacking, incomplete, controversial or inconsistent (Knol, Petersen, et al., 2009). There are many ways to deal with such uncertainties (Van der Sluijs et al., 2004). One of these is expert elicitation. Expert elicitation involves:
“the structured questioning of experts on a subject about which knowledge is unavailable, incomplete or controversial”(Knol et al., 2010; Slottje, van der Sluijs & Knol, 2008)
Expert elicitation can be useful means to provide a temporary summary of the limited available knowledge. This summary of knowledge can serve as a provisional basis for policy until further research has been carried out. Protocols for developing expert elicitation and discussion on the benefits and limitations of the methods can be found, amongst others, in (Cooke, 1991; Kahneman, Slovic & Tversky, 1982; Meyer & Booker, 1991; National Research, 1994; Plous, 1993). Within the SOR (Strategic Research RIVM) IQARUS project, a protocol for expert elicitation in the context of environmental health impact assessment has been developed and tested in two case studies about uncertainties in the assessment of the health impacts of ultrafine particle exposure (Hoek et al., 2010; Knol, De Hartog, et al., 2009). In these case studies, quantitative judgments provided by the experts were fed into a computer program during the elicitation session. This allowed the experts to view the results of the elicitation session and compare their own judgments to others’. This graphical feedback proved to be very useful, especially because many experts found the task of providing quantitative probability bounds or likelihood estimates daunting. The use of supporting software in the two case studies was rather limited, and the tools used were simple (MS Excel plots). A range of more sophisticated software tools are available, which are more targeted towards supporting expert elicitation, and which provide a much wider range of functionalities. Currently, no overview of existing software tools to support expert elicitation (including web pages) exists. Therefore, it is unknown which software packages could be applied and whether further tools are necessary. In order to get most benefit out of existing expert elicitation supporting software programs in future expert elicitation studies, we have set out in the SOR Vamphire (RIVM) project to:
- outline the possible means in which software programs may support expert elicitation;
- explore existing software programs that could support expert elicitation; - review the functionalities of these existing software projects and review
their potential usefulness for future expert elicitations.

RIVM Letter report 630003001
Page 12 of 98
The answers to these questions will support scientists who want to organize an expert elicitation to take full advantage of the possibilities of different kinds of software. In chapter 1 of this report, we will outline the methods we have used to select software programs and the criteria which we have used to review these programs. We will shortly outline the process of expert elicitation, focussing on those steps that could be supporting by software and we shortly list the software programs that could be used to support the specific steps. Chapter 2 will further describe these existing software programs and their functionalities. Finally, chapter 3 discusses the findings and outlines some opportunities for future research and development. In order to assist the reader in understanding the concepts discussed in this report, we recommend to read the previously mentioned article about the use of expert elicitation (Knol et al., 2010) which is freely available from the internet at http://www.ehjournal.net/content/9/1/19. In this paper, the seven different phases of expert elicitation within the context of environmental health impact assessment are described in more detail. Finally, please note that this is an exploratory study. Hence, we do not aim to cover all existing software programs that may be useful to support expert elicitation. Also, we do not intend to give a judgment about whether software is ‘good’ or ‘bad’. Rather, we outline for which purposes software may be applied and we give a selection of software packages that we consider suitable for these purposes.

RIVM Letter report 630003001
Page 13 of 98
2 Methods
2.1 Selecting software
We have carried out desktop research to identify software packages that are suitable to support (parts of) expert elicitation sessions. We used software packages that we identified earlier (Knol et al., 2010) or were mentioned in the ‘Tool catalogue for uncertainty assessment’ (Van der Sluijs et al., 2004) as a starting point. As a second step we followed a ‘snowball procedure’: we looked at the references in the articles mentioned above in order to identify more software packages that could be of potential use. This particularly helped to find software to elicit probability distributions and other variables. Additionally, we consulted the RIVM library and used Internet searches to identify more types of software. We realize that our methods will not have identified all software available, but we think we have been able to obtain a reasonably good overview of the general types of software that could be used to support expert elicitation sessions. 2.2 Description of relevant features
In order to provide a useful description of the software that could be used in expert elicitations, we propose a list of relevant features to evaluate the various software packages. These features can be used to get an impression of the characteristics and usability of software programs in the context of expert elicitation: o General functionality/purpose of the software: what may researchers do with
the package? o Type of input by the experts: what type of data or expertise has to be
delivered and at which point in the process? o Output: what type of data, knowledge or expertise is produced by the
package? o Type of platform: is the software meant for specific operating systems or
not? o Possibility of indicating the uncertainty range of the estimate: (only in case
of quantitative estimates) is the software able to provide uncertainty ranges?
o Possibility of indicating the basis of the estimations: what are the motives, arguments or scientific legitimations for the estimations?
o Suited for group elicitation, individual elicitation or both: in what elicitation context is it possible to use the software?
o Type of statistical analyses possible: : (only in case of quantitative estimates) does the package deliver statistics and what type?
o Possibility of feedback during the elicitation: does the package show experts (intermediate) results and do they get the opportunity to revise their arguments, estimates or opinions.
o Flexibility to fit to a specific situation: is the software designed for one specific purpose or are other applications feasible?
o User-friendliness: how easy is it to use the software by those who are not familiar with it?

RIVM Letter report 630003001
Page 14 of 98
o Anonymity in a group session: is it possible for experts to contribute their estimates anonymously. This might facilitate the willingness to participate in elicitation sessions.
o Costs and availability of the software: what is the price of the package and/or under which condition can it be obtained?
o Url: is there a specific website with information? o Manufacturer/ host organization: which company, person or organization did
develop the software package? o Positive aspects: is the package relatively good in one or more aspects? o Negative aspects: are there important disadvantages of the package? o References: are there any publications in which the software and its usage
are illustrated? The software packages have been evaluated based on these criteria in appendix A. We limit ourselves to information that is needed to get a useful first impression of the packages. Within the scope and resources of this project, we have not been able to intensively test and evaluate the packages ourselves. The interested reader can refer to the actual software packages for more detail.

RIVM Letter report 630003001
Page 15 of 98
3 Software to support the process of expert elicitation
3.1 Introduction
Several protocols have been developed to carry out formal expert elicitation (e.g. (Cooke & Goossens, 1999; Frey, 1998; Hora & Iman, 1989; Keeney & Von Winterfeldt, 1991; Kloprogge, Van der Sluijs & Petersen, 2009; Kotra et al., 1996; Loveridge, 2002; Meyer & Booker, 1991; Morgan & Henrion, 1990; Refsgaard et al., 2007; Risbey & Kandlikar, 2007; Rsc, 2004; Spetzler & Steal von Holstein, 1975; Van der Sluijs et al., 2005)). In this report we will use a protocol that has been specifically developed for organization of expert elicitation in the context of environmental health impact assessment. This protocol takes a broad perspective on the use of expert elicitation: it can be used not only to acquire quantitative figures, but also to gain information about assumptions or causal models.
Figure 1: Seven step expert elicitation procedure (Knol et al., 2010). The seven steps outlined in this protocol are presented in Figure 1 and further described in (Knol et al., 2010). In this report, we will focus on those elements of the process that may be supported by using specific software. For some steps, no software programs seem to be needed or available (steps 2 and 5), so they are not further discussed below. Moreover, the steps ‘design of the elicitation protocol’ (4) and ‘elicitation of expert judgment’ (6) are strongly interrelated from a software tools point of view: an elicitation will usually be designed for a specific software program and this program will subsequently be used in the execution step. Therefore, we combine these two steps in this report. Overall, we distinguish the following steps: 1) Characterization of uncertainties; 2) Selection of experts; 3) Design and execution of the elicitation session; and 4) Possible aggregation and reporting.

RIVM Letter report 630003001
Page 16 of 98
In this chapter, the software programs that can be used to support specific steps are presented in grey shaded boxes. For details about specific software features the reader can consult appendix A. Before we start discussing the software needed in the different steps of the expert elicitation protocol we briefly describe online collaboration software that can be used for brainstorming, categorizing, prioritizing, voting, and carrying out surveys and action planning. This software can be applied in the different steps of the expert elicitation protocol where collaboration and/or consensus is needed. 3.1.1 Tools for collaboration and consensus
A specific method for expert elicitation worth mentioning here is Realtime Delphi. The Delphi method is a well known methodology that is used to obtain an consensus among a group of experts. In classical Delphi, the judgments collected in one round are fed back to the participants in subsequent rounds. By contrast, Real Time Delphi is ‘roundless’ and answers generated are fed back to participants in real time. As in classical Delphi, participants are anonymous to one another and may omit any questions they wish. Software meant for online collaboration that is not tied to de Delphi Method might also provide a useful contribution to the collection of qualitative information. Delphi software One type of software that can be used to support this process is ”Delphi Blue”, which is an open source, Java/JSP implementation of the Delphi process for group decision making. It supports creation and editing of decision matrices which reflect group consensus. Concerns a Real Time Delphi as was used by the UN Millenium Project (see http://www.unmillenniumproject.org/). It can be used both for quantitative as well as qualitative estimates {Delphi Blue} Software that supports online collaboration and discussion There are several commercial packages on the market like the Vanguard System that is specifically meant for enterprises, Facilitate Pro, Smart speed connect, Thinktank 3.2 and Ynsyte WebIQ. For these packages, except WebIQ, both a version for an own server and a web application is available. For these packages holds that tools for brainstorming, categorizing, prioritizing, voting, surveys and action planning are provided in all of them. An open source application that was designed for an educational context is CoFFEE (Collaborative Face2Face Educational Environment). The software provides customisable tools for group collaboration, knowledge sharing and representation, such as a threaded discussion forum, a graphical concept mapping tool, dynamic voting and others. It has so far been translated into French, Spanish, Italian, Dutch and (experimental version) Hebrew and is being used in schools, colleges and universities in the UK, France, Italy and the Netherlands. Out of all these packages, only Facilitate Pro supports video. {Vanguard System, Facilitate Pro, Smart speed connect, CoFFEE, Thinktank 3.2, Ynsyte WebIQ} 3.2 Characterisation of uncertainties
The first step of the elicitation procedure is the characterisation of uncertainties. As there are many different types of uncertainties, characterisation of sources of

RIVM Letter report 630003001
Page 17 of 98
uncertainty can help to determine whether expert elicitation is a relevant approach to deal with the uncertainties. This can be supported by using an uncertainty typology. Knol et al. (2009) present a typology (table 1) of uncertainty that distinguishes between location, nature, range, recognized ignorance, methodological unreliability and value diversity among analysts, as six characteristics of uncertainty. These characteristics apply simultaneously on a piece of information. Uncertainty characterizations
Categories
Context: Definitions and boundaries of the system that is being assessed
Model structure: Structure and form of the relationships between the variables that describe the system
Parameters: Constants in functions that define the relationships between variables (such as relative risks or severity weights)
Location: the location at which the uncertainty manifests itself in the assessment
Input data: Input data sets (such as concentrations, demographic data, and incidence data)
Epistemic: resulting from incomplete knowledge
Process variability: resulting from natural and social variability in the system
Nature: the underlying cause of the uncertainty
Ontic
Normative uncertainty: resulting from a plurality of socio‐ethico‐normative considerations within a society
Statistical (range + chance) : specified probabilities and specified outcomes Range: expression of the uncertainty Scenario (range + “what if”) : specified outcomes, but unspecified probabilities
Recognized ignorance: unknown outcomes, unknown probabilities – uncertainties are present, but no useful estimate can be given
Methodological unreliability: Methodological quality of all different elements of the assessment; a qualitative judgment of the assessment process which can based on e.g. its theoretical foundation, empirical basis, reproducibility and acceptance within the peer community
Value diversity among analysts: Potential value‐ladeness of assumptions which inevitably involve – to some degree – arbitrary judgments by the analysts.
Table 1: typology of uncertainty For proper explanation about this table, we refer the reader to the original publication(Knol et al., 2010). Other relevant texts about the subject are e.g. Van der Sluijs et al. (2004), Janssen et al. (2005), Petersen (2006), Van der Sluijs et al. (2008), and Walker et al. (2003). The Netherlands Environmental Assessment Agency has developed an online application that has tools for characterizing uncertainties that are suited for projects with different combinations of a) the importance of uncertainty (little, medium, large) and b) the capacity/resources available (little, medium, large). Software to support characterization of uncertainties The Netherlands Environmental Assessment Agency has developed online guidance for uncertainty assessment and communication: called ‘Guidance for Uncertainty Assessment and Communication’ and available at http://leidraad.pbl.nl/. The guidance offers assistance in mapping and communicating uncertainties in environmental assessments. Special attention is paid to the following parts of assessments: problem framing;

RIVM Letter report 630003001
Page 18 of 98
involvement of stakeholders; selection of indicators; appraisal of knowledge base; mapping and assessment of relevant uncertainties; and reporting of uncertainty information. The guidance presents the important issues in the different steps of assessment of uncertain issues and points the reader to the associated tool and methods to deal with these issues. The guidance incorporates amongst others a mini-checklist, a quickscan questionnaire and a detailed guidance. {Guidance for Uncertainty Assessment and Communication} 3.3 Selection of experts
Experts can be selected using a structured selection process. This is important to ensure a balance between opposing views and schools of thought. One way to achieve a balanced sample of experts is by a two step nomination procedure. This involves first of all selecting authors of at least two peer-reviewed papers on the subject using a systematic literature review (Knol, De Hartog, et al., 2009). This review can be facilitated by means of online literature databases. Online literature databases A variety of online publication databases can be used for systematic literature reviews, including: PubMed (http://www.ncbi.nlm.nih.gov/sites/entrez?holding=inlrivmlib), Scopus (info.scopus.com), Web of Science (isiknowledge.com) and Google Scholar (scholar.google.com). More information about these types of programs and their functionalities is provided by Falagas et al. (2008). {Pubmed, Scopus, Web of Science, Google Scholar} The selected experts are subsequently asked to nominate experts who they think would be most qualified to participate in the elicitation. The most frequently nominated experts are subsequently invited. Nomination can simply be carried out be replying to an email. However, in order to provide for a more anonymous nomination, which may in some cases lead to slightly different nominations, online anonymous surveys can be used. Other useful characteristics of surveys are that input can be gathered I a structured way from experts from different geographical locations and that they can do this at a time that suits them. Moreover, surveys provide the possibility to include questions that reveal so-called ‘value diversity’ among experts. Experts may have different opinions and values related to topics that are relevant for the subject on which the experts are elicited. In case of a PM10 expert elicitation these opinions may be e.g. the attitude towards cars, the attitude towards environmental protection and the amount of risk one is willing to accept.

RIVM Letter report 630003001
Page 19 of 98
Online surveys Software that can assist is online surveys includes Survey Monkey, Google docs, Opinions-Online and Lime survey. Lime survey is an open source application that has to be hosted on an own server. The possibilities of Lime survey are impressive, but when you have a modest problem and are looking for a fast solution, you might opt for the other packages mentioned. For all these packages holds that questions have to be delivered in a format suited for Internet. Several types of questions are possible. Data acquired can be exported to text, CSV, PDF, SPSS, queXML en MS Excel format. Basic statistics and graphics can be made. {Survey Monkey, Google docs, Limesurvey, Opinions-Online} Another way to reveal value diversity is by conducting a Q-sort. In a Q-sort the discourse about a subject is written down in a deck of statements. The experts are asked to sort these statements in a forced normal distribution from ‘totally agree’ to ‘totally disagree’. In a next step, the correlations between the scores of the statements of the experts in the study are correlated and a principal component analysis is conducted. The result is that groups of experts with similar value patterns are distinguished. By calculating the factor scores and sort them from low to high it is possible to construct typical Q-sorts for groups and to get an idea of the perspectives of the different groups of experts. Q-sort software Software that is specifically useful for including different perspectives in the expert elicitation includes PQ-method, Flash Q and Web Q. All three packages support the Q-sort method. The Flash Q and Web Q software assist this process by enabling experts to sort the deck on their own computer and send the data to the researchers. The PQ-method software subsequently assists in the data-analysis. {PQ-method, Flash Q, Web Q} 3.4 Design and execution of the elicitation session
As said before, the steps ‘design of the elicitation protocol’ and ‘elicitation of expert judgment’ of a formal expert elicitation are strongly interrelated from a software tools point of view: an elicitation will usually be designed for a specific software program and this program will subsequently be used in the execution step. Therefore, we combine these two steps in this report. The format of the desired output of the elicitation session can for example be: - the development of a conceptual model - a contribution to the analysis of conceptual models - a contribution to the evaluation of alternatives and scenario’s - An estimate of single model parameters These four possibilities and the ways in which software can be used in their elicitation are described in the paragraphs below. 3.4.1 Developing conceptual models
Experts can provide a significant and meaningful contribution to the construction of conceptual models. Conceptual models can be used to graphically represent the relationships between different variables. In this section we will provide an

RIVM Letter report 630003001
Page 20 of 98
overview of the several ways in which graphical representations of relationships between variables can be supported by expert elicitation. The elicitation of conceptual models can be aided by using software to graphically build such models. There are several approaches in building conceptual models. One approach to build a conceptual model is by drawing a mind map (Buzan & Buzan, 1992). A mind map is a diagram used to represent words, ideas, tasks, or other items linked to and arranged around a central key word or idea. Mind maps are used to generate, visualize, structure and classify ideas, and as an aid to studying and organizing information, solving problems, making decisions and writing. The elements of a given mind map are arranged intuitively according to the importance of the concepts. Subsequently, they are classified into groups, branches or areas, with the goal of representing connections between portions of information. Mind maps may also aid recall of existing memories. For illustrative purposes in figure 1 a mind map of determinants of health is presented.
Figure 1: Mind map of determinants of health (source: www.mindmapart.com) A mind map can be contrasted with the similar idea of concept mapping. The former is based on radial hierarchies and tree structures denoting relationships with a central governing concept, whereas concept maps are based on connections between concepts in more diverse patterns. In practice the two approaches are often lumped together. For research in the field of environment and health both mindmapping and concept mapping can be useful approaches. Both mind maps and concept maps can be used to study the ideas of experts or groups of experts, while concept mapping is useful to examine specific mechanisms. An example of the last is the working mechanism behind the

RIVM Letter report 630003001
Page 21 of 98
health effects of exposure to ultrafine particles (ref: http://www.particleandfibretoxicology.com/content/6/1/19/ ). In the field of decision analysis a concept map that represents a decision problem is called an influence diagram. In this field, a decision tree is another often used way of representing a decision problem. Decision trees display the set of alternative values for each decision. The alternative values (chance variables) are represented as branches coming out of each node. Software to evaluate influence diagrams will be discussed later on in this section. The software to analyse decision trees will be dealt with in section 3.4.2.5. Software for conceptual models There is quite a lot of both proprietary and free software available that can be used to visualise ideas. Moreover, software that has been designed to quantify models (e.g. Analytica see paragraph 3.4.2.7.) or are intended to create presentations (e.g. MS Powerpoint) can sometimes also be used to draw conceptual models. In this report we limit ourselves to four popular proprietary and four free software packages for mind- and concept mapping. Mind mapping software is designed to help users in creating visual mind maps for various purposes including learning, teaching, presentation, meeting, decision making and problem solving. Advantages of the software are that the user can save time to create mind maps in comparison to drawing manually or using software that is not designed for mind mapping. Moreover, the software has many clipart and icons to use in the mind map and make it more professional and easy to understand. Most mind map software packages provide many different styles, formats and templates. Furthermore, mind maps can be exported to various file formats such as image (Gif, JPG, PNG), Powerpoint, HTML, etc. Most of the packages support decision trees and influence diagrams, but some of them that are closely tied to the traditional mind mapping concept do not do so. Despite of the differences between the packages, for all of them holds that they are extremely helpful in the process of visualizing ideas and making connections to other pieces of information e.g on the internet or in local databases. Of the proprietary software an obvious possibility is Microsoft Visio. This software package has been developed to present information in an efficient, descriptive way. This multi purpose package supports lots of different diagrams and schedules, but actually is not specifically designed for mind mapping. Probably the most popular of the proprietary mind map packages is Mindjet Mindmanager. MindManager’s visual information maps (mind maps) start with a central theme, and then add branches with ideas, notes, images, tasks, hyperlinks and attachments. Other relatively popular mind mapping packages are MatchWare Mindview and iMindMap. A freeware counterpart of Microsoft Visio is Diagram designer. This is a simple vector graphics editor for creating flowcharts, UML class diagrams, illustrations and slide shows. Moreover, it provides a simple graph plotter to plot mathematical expressions. Three of the most popular free mind- and concept mapping software packages are: Freemind, VUE (Visual Understanding Environment and Xmind (free version). Freemind is a package that focuses on traditional mind maps en provides the possibility to link to other sources. The Visual Understanding Environment (VUE) project at Tufts UIT Academic Technology is focused on creating flexible tools for managing and integrating digital resources in support of teaching, learning and research. VUE provides a flexible visual environment for structuring, presenting, and sharing digital information. Using VUE's concept mapping interface, faculty and students design
RIVM Letter report 630003001
Page 22 of 98
semantic networks of digital resources drawn from digital libraries, local and remote file systems. XMind is an open source brainstorming and mind mapping software tool. It helps people to capture ideas, organize to various charts, and share them for collaboration. It supports mind maps, Ishikawa diagrams (also called fishbone diagrams or cause-and-effect diagrams), tree diagrams, organization charts, and spreadsheets. It is often used for knowledge management, meeting minutes, task management, and GTD. XMind is compatible with FreeMind. {MS Visio, Mindjet Mindmanager, MatchWare Mindview, iMindMap, Diagram designer, VUE, FreeMind, Xmind} 3.4.2 Analysing conceptual models
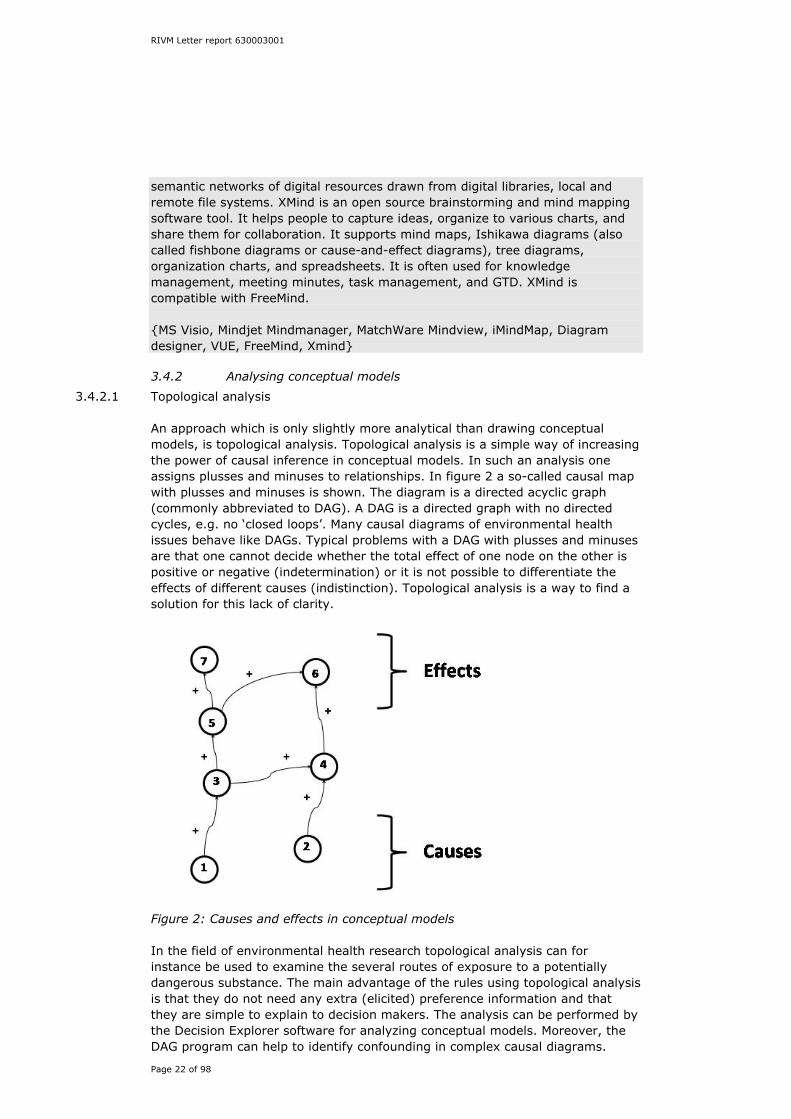
3.4.2.1 Topological analysis An approach which is only slightly more analytical than drawing conceptual models, is topological analysis. Topological analysis is a simple way of increasing the power of causal inference in conceptual models. In such an analysis one assigns plusses and minuses to relationships. In figure 2 a so-called causal map with plusses and minuses is shown. The diagram is a directed acyclic graph (commonly abbreviated to DAG). A DAG is a directed graph with no directed cycles, e.g. no ‘closed loops’. Many causal diagrams of environmental health issues behave like DAGs. Typical problems with a DAG with plusses and minuses are that one cannot decide whether the total effect of one node on the other is positive or negative (indetermination) or it is not possible to differentiate the effects of different causes (indistinction). Topological analysis is a way to find a solution for this lack of clarity.
Figure 2: Causes and effects in conceptual models In the field of environmental health research topological analysis can for instance be used to examine the several routes of exposure to a potentially dangerous substance. The main advantage of the rules using topological analysis is that they do not need any extra (elicited) preference information and that they are simple to explain to decision makers. The analysis can be performed by the Decision Explorer software for analyzing conceptual models. Moreover, the DAG program can help to identify confounding in complex causal diagrams.

RIVM Letter report 630003001
Page 23 of 98
Obviously, the functionality of this last package is much more limited than Decision Explorer. Software for analysing conceptual models Decision Explorer offers a number of tools to draw cognitive maps and to analyze their content. When models become quite large, Decision Explorer has several useful tools available to explore portions of the models. For instance, a cluster analysis can be used to create more manageable sets of concepts. Moreover, Decision Explorer has several tools to aid in showing relationships between concepts or sets in the model.
The literature on Decision Explorer encourages users to share their model output with consulted experts. For instance, if a model is constructed based on an interview, the resulting model can be constructed and shown to the informant for verification. This review of the model can provide another channel for communication between the interviewer and the informant and can provide a tool for gathering further information. The DAG program (DAG program(Knüppel, 2010; Knüppel & Stang, 2010)) has been developed specifically in order to identify confounding in complex causal diagrams using algorithms for backtracking. It is not specifically meant for use in expert elicitation, but may be used as such. {Decision Explorer, DAG program}
3.4.2.2 Analyzing on the basis of qualitative estimates of the strength of causality Information about the strength of causality can be elicited from experts or a group of decision-makers. With this information it is possible to construct more informative causal maps. In the method proposed by Kosko (1986), qualitative assessments of the strength of causality are elicited from the decision-makers using an ordinal scale (ordered qualitative labels). Moreover, simple calculation rules to calculate the total effect of a cause on an effect are provided.
Figure 3: Elicited strengths of preferences on an ordinal scale

RIVM Letter report 630003001
Page 24 of 98
Figure 3 shows a figure with plusses, minuses and a qualitative indication of the strength of the relationship. Kosko (1986) called this model a ‘fuzzy cognitive map’, suggesting that the qualitative labels could be “fuzzified”. The theory about fuzzy sets and fuzzy logic has been introduced by Zadeh (1965). He observed that humans deal with situations in which knowledge is uncertain, limited and qualitative by using qualitative, linguistic statements and arguments. Zadeh created the fuzzy sets and fuzzy logic as a mathematical means to implement this way of dealing with incomplete knowledge
Consequently, the ‘fuzzy-paradigm’ is well suited for problems in which the knowledge base is limited, qualitative and uncertain. As the arguments and expressions are motivated by experience the approach is well suited for situations in which different types of knowledge have to be integrated (inter- or multidisciplinarity, stakeholder participation). The formalism of the approach forces the participant to make their knowledge and arguments explicit and puts differences before the limelight
The fuzzy approach is found in the software packages FC Mapper, RAMAS Risk Calc and NAIADE we will discuss later on in this paragraph. It is predominantly used in situations in which uncertainty makes it difficult to define exact classes. Another approach that relies on qualitative estimates of the strength of relationships is a Qualitative Probabilistic Network (QPN). These QPNs are a qualitative abstraction of Bayesian Belief Networks (BNNs), which use probabilities for extending the power of inference in causal maps. BNNs require many quantitative probabilities, which are not always available. Another obstacle is that computer calculations of complex BNNs may take a lot of time. For these reasons, the formalism of Qualitative Probabilistic Networks (QPNs) was adopted (Wellman, 1990). These QPNs only define qualitative restrictions on the probabilities in terms of signs. This makes a QPN much faster than a BBN with the same number of nodes and arrows, although at the cost of level of detail.
Apart from improving speed, the QPN formalism can be useful in cases where there are no quantified probabilities available and when there is no time to gather them. This allows for studying the model’s behaviour without quantification.
Van Kouwen (2007) has adapted the original QPN algorithm and developed the so-called Quasta Approach. The technique of Quasta has some characteristics which make it quite unique. The most important is that it allows backward reasoning, without needing quantitative information. Apart from identifying effects of certain changes, it can also show how certain changes can be achieved, or why certain changes have occurred. Moreover, it shows the consequences of those changes that could (have) contribute(d) to the observed or desired change. The regular forward reasoning and Quasta’s qualitative backward reasoning can be done simultaneously. There is the freedom to enter all types of desired, feared, expected or observed changes in the diagram. Then, Quasta will show how these changes relate to the other concepts in the network. This process is supported by the Quasta software. The Quasta approach was used in a prospective study called ‘Sustainable living at sea: the Dutch coast in 2080’ (TNO et al., 2007). In this study Quasta was used to create a conceptual model and to study the influence of changes in variables. In this way it is possible to study different scenario’s for the Dutch coast in a qualitative way. The technique is enables integrated assessments and as a possible consequence integrated policy making

RIVM Letter report 630003001
Page 25 of 98
Qualitative Probability Network software The original version of Quasta consisted of a QPN-based Cognitive Mapping which uses the sign-propagation algorithm as adapted by Van Kouwen et al. (Van Kouwen, Renooij & Schot, 2009; Van Kouwen, Schot & Wassen, 2008). This algorithm was implemented in Java. The qualitative tool QGeNIe of the public domain GeNie BNN package (see probabilistic methods below) was used as a graphical interface. The Java tool reads a QGeNIe file, extracts instructions from annotations, calculates the effects and writes the results back into the file. Today a more user-friendly version is available (see www.quasta.nl). {Quasta}
3.4.2.3 Analysing on the basis of quantitative estimates More recently Kosko redefined his fuzzy cognitive mapping approach, we mentioned earlier, to a quantified model (Kosko, 1997). According to Ösmezi and Ösmezi (2004) this quantified version of fuzzy cognitive mapping is suited for: 1) cases where hard to quantify human behavior plays a significant role; 2) cases where scientific data are incomplete or entirely missing, but where local, indigenous and traditional knowledge is available; 3) For very complex questions where many different positions are included but where no simple or correct answers are available. In such cases finding compromises is often the only solution and; 4) Cases where public opinion is desired. In these cases fuzzy cognitive mapping also improves the flow of information between the participants. Fuzzy cognitive mapping software FC Mapper is an excel template that can be used to visualize and analyze fuzzy cognitive maps. The software calculates all relevant indices (OD, ID, CN, Hierarchy), counts nodes and connections, defines types of factors (Transmitter, Receiver, Ordinary). Moreover, it simulates the behaviour of the given system, simulates different management options and shows trends. Furthermore, it transforms your matrix coded FCM into a net-file format which can be displayed by software for social network analysis like Pajek or Ucinet and it provides different options for exporting the data. {FC Mapper} An example of the use of fuzzy cognitive mapping in the field of environment and health is the study of Diana Reckien and others of the Potsdam Institute for Climate research (see: http://www.fcmappers.net/). These researchers use fuzzy cognitive mapping to identify the impacts of climate change in Indian megacities. The main purpose of the study is the identification of true, ground-based, locally perceived (adverse) impacts of certain climate events on water (availability), transport, energy (security), food (security) and health. FCMs are used as they can identify the perception of people. Another advantage is the possibility to generate knowledge in environments where statistical data are rare, which is a big problem in India. However, the biggest disadvantage is that it isn’t possible to recognize impacts that were not experienced yet or which are not connected to certain weather events or climate change.
At the time of writing this report, the researchers are planning to undertake interviews with students, their families, with researchers and administrators from official bodies, e.g. the water board, the planning board etc. in Delhi and Hyderabad/India.

RIVM Letter report 630003001
Page 26 of 98
Another way of analyzing on the basis of quantitative estimates is to construct influence diagrams in popular software packages like DPL and Analytica. In this approach estimates are elicited for parameters in the model. These estimates have to be provided by the developer of the model or the experts/decision makers involved. Software that can support this process is widely available. Very often this software can used to perform a sensitivity analysis by means of a Monte Carlo simulation. Software for analysis of influence diagrams Standard influence diagrams assume that variables are scalar quantities. In some of the software packages, like DPL and Analytica, the variables may be a vector, or a multidimensional array - for example, related to the vulnerability of the population and the number of people that have an environment-related disease for each region, each disease, and each time period. Both the packages for decision trees as well as the packages for influence diagrams use Monte Carlo analysis to perform sensitivity analysis. Sometimes this Monte Carlo functionality can be found in the same package. For other packages, like Precision Tree, the Monte Carlo simulation is performed by another package in the suite (@Risk). Almost all software packages for decision trees can also be used to create an influence diagram, including Analytica, Precision Tree, Vanguard decision Tree suite, Goldsim, Treeage Pro Suite (Exel, Healthcare), Treeplan and DPL. {TreeAge Pro suite (Excel, Healthcare), Precision Tree, Analytica, DPL}
3.4.2.4 Probabilistic methods More complex quantitative methods have also been proposed for extending the power of inference in causal maps, using probabilistic information. For example, a causal map can be modeled as a Bayesian Belief Network (BNN) in which each node of the network is represented by a variable with set of possible states (each state with probabilities defined by experts/decision makers). Bayesian Belief networks (BNNs) were developed to deal with uncertain or incomplete knowledge and are being applied widely, especially for medical applications (Pearl, 1988) and ecological management (see e.g. (Borsuk, Stow & Reckhow, 2004; Cain, Batchelor & Waughray, 1999)). A good example of the use of Bayesian nets the field of environment and health is the project that is currently underway at the Center for the Environmental Implications of NanoTechnology at Duke University. Eric Money and others are attempting to construct a Bayesian Network model for the emissions, fate/transport, uptake, and environmental exposure to nanomaterials in the environment. Using a combination of expert judgments and experimental data they hope to construct a probabilistic based model that can be used for predictive and diagnostic scenario analysis to determine the probability of adverse effects from the potential release of nanomaterials into the environment. In another application these researchers do a collaborative effort with the North Carolina Division of Water Quality and Dept. of Health & Human Services to develop a Bayesian Network model to aid the fish-advisory program in North Carolina. A probabilistic model is being developed to relate various secondary and tertiary variables to bioaccumulation of mercury in fish tissue using a combination of expert judgment, mechanistic relationships, and existing data. A dynamic Bayesian Network model is proposed that can update the probability of

RIVM Letter report 630003001
Page 27 of 98
health effects as new monitoring data becomes available (see: http://ericsmoney.wordpress.com/research/). Software for analysing Bayesians Nets There is quite a lot of free and proprietary software available to support the analysis of BNNs.The packages for building Bayesians networks can find optimal decisions for sequential decision problems (i.e., later decisions are dependent on the results of earlier ones) and some of these packages can distract probabilistic relations from data. Thus, Bayesian Network estimations can be made about chances or probability distributions that represent relations in the network. Packages that can be used to construct Bayesians networks are NETICA, Uninet, GeNie, Hugin, SamIam, B-course and the Microsoft Baynesian network toolkit. A significant part of the software for Bayesian network analysis is freely available (Genie, Uninet, SamIam, B-course and the Microsoft Baynesian network toolkit). As filling out Conditional Probability Tables (CPT) is a necessary step in building Bayesians Networks, the software has to provide the possibilities to elicit proportions. The interface approaches can be partitioned into two categories: (i) table based, in which CPTs are entered in (basically) a spreadsheet and (ii) graphical, in which graphical methods, such as bar or pie charts are used to represent the CTP. According to Jiangyu Li et al.(Jiangyu Li , Dekhtyar & Goldsmith 2002) is it clear that elicitation of proportions/probabilities is not the largest concern of the developers of these packages. They state that special purpose elicitation software is preferable (see section 3.4.2.7). {NETICA, Hugin, GeNie, Uninet, SamIam, B-course, Microsoft Bayesian network toolkit}
3.4.2.5 Evaluation of alternatives and scenarios Another task on which experts can provide a meaningful contribution is on the evaluation of alternatives and scenario’s. Such comparisons are fairly common in integrated environmental health impact assessments, in which often a business as usual scenario is compared to one or more scenarios in which a policy is applied. An frequently used methodology for evaluating scenarios is by constructing a decision tree, as we introduced in section3.4.1, and quantify the different elements in it. Software that supports the analysis of decision trees and subsequent sensitivity analysis has been mentioned before. Almost all software packages for influence diagrams can also be used to create a decision tree. Software for analysing decision trees Decision trees let you visually map out complex, multi-layered decisions in a sequential, organized manner. This helps you identify all possible alternatives and choose the best option. {TreeAge Pro suite (Excel, Healthcare), Precision Tree, Analytica, DPL}
3.4.2.6 Multi Criteria Analysis Another way to analyse decision trees is by using Multi Criteria Analysis (MCA). MCA also uses a model with a tree structure and also tries to find the most optimal solution like the decision tree packages. An important difference is that in an MCA relevant environmental health aspects like burden of disease, concern about a heath risk and concerns about equity can all be included as important elements (criteria) for a decision. Consequently, a risk can be quantified in a single figure, which weighs the different criteria according to their importance

RIVM Letter report 630003001
Page 28 of 98
for the final decision. If this is done for different risks, these can be ranked and an impression is obtained of the risks that deserve attention in the policy process. Moreover, the method provides to possibility to look at the problem from different perspectives. What happens, for instance, if we consider the health impact to be the most important criterion when deciding about policy priorities; or what happens if concern by the general public is considered the most important, etc. In order to check the validity of the ranking, a sensitivity analysis can be performed by assigning an uncertainty range to the variables and execute a Monte Carlo analysis. Multi criteria analysis software MCA is a well established technique that finds its implementation in several software packages. The software packages that support Multi Criteria Analysis (MCA) can be classified in those that are developed at a university and are more or less in a ‘basic state’ and packages that have reached a commercial state, but often still have a link with the university at which the package has been (initially) developed. The commercial packages provide a solution for a wide range of problems and combine several techniques within a single package. Examples are Equity3, Hiview3, Logical decisions 6.1, Expert Choice, Definite, 1000minds, V.I.S.A. Part of the university packages test (a) newly developed algorithm(s) or a new approach to MCA. This holds for Web Hipre, Rich decisions, Win Pre, Decision Deck and Unibalance-Unisense-Unigraphics. All university software can be obtained for free. The commercial packages have to be bought. The prices of the packages start at approximately 1.500 euros. Special about Decision Deck is that this is an open source project in which several MCA-techniques are implemented as a plug-in on a universal software module. Some remarkable products are the free Analytic Hierarchical Process (AHP) excel templates. Although the templates are very useful, their user-friendliness is limited. An advantage of excel templates is that everybody can use them without the need of installing a software package. Of the free packages, NAIADE implements a fuzzy MCA-approach. Some of the commercial packages provide the possibility of consulting experts or other members of the project team at distance using the internet. This is a very useful feature for group elicitation, but this comes at a high price as relatively large annual subscription fees have to be paid. This holds for Expert Choice, 1000minds and V.I.S.A. Of the university packages Decision Deck can also be used as a multi-user package, but this package is not very user-friendly. In fact it is a MCA development platform. Logical decisions 6.1 has a special version for groups in which all locally participating experts can provide input by means of radio transmitters. {Equity3, Hiview3, Logical decisions 6.1, Expert Choice, Definite, 1000minds, V.I.S.A., Criterium Decision Plus, Unibalance-Unisense-Unigraphics, Web-Hipre, Rich decisions, Win pre, Prime Decisions, Decision Deck, AHP templates, NAIADE} The role of experts in this technique can be that: 1) they can indicate relevant criteria; 2) they can provide educated guesses about the values of criteria that have no solid empirical basis yet and/or; 3) they can indicate the relative importance of the several criteria for different risks. They can also state that all criteria are equally important. The combination of expert opinions and Multi Criteria Analysis makes it possible to assess relatively new risks, potential risks and/or new risk aspects in MCA risk rankings.

RIVM Letter report 630003001
Page 29 of 98
There are several approaches and algorithms possible in MCA. Examples are: weighted summation, Electre, Promethee, Evamix and McBeth. Janssen (2001) shows that in the Dutch practice of performing environmental assessments, the method of weighted summation is predominantly used. The reasons for that are that the approach is methodologically sound and that it is transparent for the stakeholders involved. Consequently, he concludes that the most important methodological challenge of a MCA is to define the problem properly and not the choice of a particular MCA methodology. An advantage of MCA software packages that have functionality of group sessions via the Internet is that participation is less time consuming for experts and it is possible to include experts that otherwise wouldn’t be able to participate e.g. as a consequence of their geographic location. However, there are alternatives for these packages. Practically all MCA packages can be used in a group elicitation, by showing the process on a projection screen. The packages can also be used to integrate data that have for instance been written down by experts as a result of discussion, but this does not take full advantage of the possibilities of the software. For discussion and collaboration the software for online collaboration like can be used. This is also a good approach for experts that cannot be at the same location at the same time. The output of the MCA (pictures, graphics, rankings) can be provided to them by means of this same package. Alternatively one could decide to use the online survey software for this purpose and provide feedback by e-mail. If one strives at a consensus amongst experts about the data a real time Delphi can be an option
3.4.2.7 Estimates of single parameters In this section we focus on the estimation of model parameters. Expert elicitation is then used to get an idea about the magnitude and uncertainty of a particular ‘unknown’ variable. This type of elicitation can benefit substantially from graphical support by software. Quantitative estimates are often expressed in probabilistic terms (min, max and most likely values; subjective probability density functions, etc). Such parameters can be elicited using specific software that helps experts to insert, visualize and check their estimates, or provides features to analyze or aggregate results. In textbox 1a few well-known methods for the elicitation of probabilities and probability distributions are discussed.

RIVM Letter report 630003001
Page 30 of 98
Elicitation of probabilities A common distinction in cognitive psychology is between direct (where the purpose is clear for the participant) and indirect methods. A similar distinction can be applied to the assessment of probabilities. Direct methods (a) Direct estimation. This simply involves asking the expert to state her
response. (b) Response scales. Response scales provide a visual representation of the
feasible range of responses. This may be a list of ordered categories where the chosen category is circled, ticked or underlined to indicate the expert’s response. Alternatively, a visual analogue scale (a line on which the expert indicates his or her response by a line or a cross) provides a continuous response scale. Such scales will typically be labelled at each end (e.g., ‘0’ and ‘1’ or ‘impossible’ and ‘certain’) and may or may not be labelled at intermediate points such as the mid-point. Values are obtained by measuring the distance from one end, and the measurements may be subject to transformation to convert them to probabilities. Values extracted from visual analogue scales are typically treated as having the properties of an interval scale. Not surprisingly, the labelling of response scales has been shown to have important effects upon judgment.
(c) Probability wheels. Probabilities may be presented (radially) around the circumference of a disk. The expert or facilitator then manipulates two radii to divide the disk into two segments (typically of two different colours) – one representing the probability of the event and the other, its complement. One has therefore three equivalent ways of representing probability: (1) via the scale on the circumference, (2) via the proportion of the circumference swept out by one segment and (3) by the proportion of the area of the circle shaded in one colour.
Indirect methods (a) Bets. Bets can be used to infer an expert’s subjective probabilities. For
example, ‘with the opportunity to win 10, would you rather bet on event A or throwing a ‘6’ on a fair die?’ Preference for betting on event A implies that it has a probability greater than 1/6. A sequence of bets can be used to specify subjective probabilities more precisely, by iterating until an indifference point is reached. On has to be cautious however, as people have an aversion to ambiguity. This means that that they have a preference for well-defined (precise) probabilities over ill-defined (ambiguous or uncertain) probabilities.
(b) Probability wheels. Probability wheels are quite commonly employed with the betting methodology. This may involve removing any numerical labels, and simply asking the expert to manipulate the wheel until they are indifferent between an bet that wins if the event occurs and a bet that wins if a ‘spinner’ stops in the indicated section of the wheel
Elicitation of probability distributions Eliciting a probability distribution in practice entails eliciting a (relatively
small) number of summaries from the expert and then fitting a suitable distribution that conforms to those elicited judgments. It is important to recognize that the fitted distribution implies many more statements that the expert did not make, and feedback may be used to check that these implications are acceptable to the expert.
The most widely used tasks in elicitation methods are the assessment of a

RIVM Letter report 630003001
Page 31 of 98
central measure (a mean, median or mode) and the assessment of quantiles. To elicit quantiles, the so-called variable interval method is most generally used. The most commonly elicited quantiles are the lower and upper quantiles, which can be assessed using the method of bisection (see (O' Hagan et al., 2006)).
In complex situations, structure must be imposed on the probability distribution used to represent the expert’s opinion for the elicitation problem to be manageable. Usually it is assumed that expert opinions can be modelled by some specified parametric distributions, when the elicitation problem is reduced to estimating the parameters of the distribution.
For multivariate problems, it is typically assumed that expert opinions can be modelled by a prior distribution. This assumption is also commonly made with univariate problems, especially if it is envisaged that sample data will become available.
Interactive computing is almost essential if an elicitation method requires a sequence of questions in which some questions are determined by an expert’s earlier answers. Benefits of interactive computing include the facility to provide feedback to the expert and to identify apparent inconsistencies in the judgments made. Interactive graphics have been used in various assessments and seem to be particularly useful in regression problems.
Textbox 1: Methods for estimating probabilities and probability distributions Software to estimate model parameters The software packages available support the process of eliciting parameters in various different ways. SHELF SHELF (Sheffield Elicitation Framework) is actually not a software package but a set of R-functions that has been developed specifically to support expert elicitation of parameters and their distribution. The functions come with a set of word templates that might be useful in the elicitation process. In order to make the package function, one has to install R and ‘source’ the functions. Subsequently the functions have to be addressed correctly. Visual, graphical feedback about the elicited distributions is provided. A positive aspect is that the academic basis of the package is solid and that several acknowledged methods for expert elicitation have been implemented. A drawback is the steep learning curve before one can successfully use the framework. Recently a website for eliciting model parameters based on the SHELF framework has been launched. See http://elicitator.uncertweb.org/. RAMAS constructor A second possibility is the use of RAMAS constructor. This software is intended to support the construction of probability distributions when only incomplete or uncertain information is available. RAMAS states that the software is not a specific expert elicitation tool, but it may nonetheless be useful in an elicitation process. The experts have to supply sample data, qualitative information about the shape of the distribution, theoretical or inferred constraints on moments, 'order statistics’ and 'probabilistic coverage statements'. The input can be graphical or numerical. It can be specified as precise numbers or interval ranges to represent epistemic (lack of knowledge) uncertainty. The software has been made by RAMAS for the epistemic uncertainty project by Sandia National Laboratories and the National Institutes of Health (USA; see: http://www.sandia.gov/epistemic/). The outputs of the software are probability

RIVM Letter report 630003001
Page 32 of 98
distributions and boxes, Demster-Shafer structures and random sets. Positive aspects are the high quality documentation and manual. Besides, RAMAS constructor is freely available (beta version). Elicitor A third approach to quantitative analyses in expert elicitation is that which is implemented in the Elicitor software package. Elicitor is a product of the Queensland University of Technology. The first version by Mary Kynn (2005) was used for estimations about the presence of a species in an ecosystem and was applied in five case studies. The software included a Bayesian logistic regression model needing priors (probability distributions). In an improved version of the software (2010) it is no longer limited to Bayesian logistic regression and can be applied to a range of regression models. When used in an expert elicitation, the characteristics (median, intervals, properties of continuous variables) of the distribution have to be provided by the experts. The software supplies graphical assistance. The output of the software are priors, that are subsequently used as input for a model. This model can be constructed in several formats, including winBUGS (James et al., 2010). The limited version of Mary Kynn is available for free. The software is provided in Component Pascal and has to be compiled and constructed first. This requires knowledge about Component Pascal. The Oberon Blackbox component Builder that is needed is offered for free at http://www.oberon.ch/blackbox.html. Mary Kynn recommends to use the software together with two other free software programs (Logit and Probability). This software is also part of the Component Pascal Collection (see link). The 2010 version of the software (James et al., 2010) will be delivered for free as part of a training in expert elicitation. In the field of environmental health risks the approach in the Elicitor software package can for example be used to model exposure effect relationships. Experts have to provide their estimates of exposure and meaningful covariates. The software subsequently uses this information in a regression model to calculate the health effects. Arc Gis customized Another promising approach is something we will call ‘Arc Gis customized’. This approach by Robert Denham and Kerrie Mengersen, also at the Queensland University of Technology, is used for the elicitation of probabilities that have a spatial dependency. It leans strongly on the experience with the Elicitor software. The distribution characteristics (medians, intervals) have to be provided by experts. The elicitation is supported by geographical information (maps). In order to accomplish this, ArcGIS is customized by scripting with Visual Basic for Applications (VBA), and by communicating with other applications. R is used for the statistical calculations. Denham and Mergers provide an example in which they estimate the prices of houses on the basis of geographic data. An environmental health application of this package might be the estimation of the prevalence of environmentally related diseases. Environmental health effects have a geographic dependency as the sources of exposures and covariates like age and socioeconomic status are different at different geographic locations. Estimations or forecasts of this type might be useful to identify populations at risk. A limitation of this approach is probably that as a result of the large computational capacity needed by Bayesians calculations the geographic scope is limited. A solution for this problem might be Bayesian computing with INLA (see http://www.r-inla.org/). With these so-called Integrated Nested Laplace

RIVM Letter report 630003001
Page 33 of 98
Approximations much lager geographic areas (like The Netherlands) can be covered. ELI A useful piece of software which may be a little difficult to install is ELI (Van Lenthe, 1993). As this is a DOS-application, it might be necessary to use a x86 DOS-emulator (see http://www.dosbox.com) when the package is used on a modern operating system. The software has been developed by I.E.C. ProGamma and Jelle van Lenthe. With ELI it is possible to estimate percentages, proportions and other quantities. Experts can do this by the manipulation of a curve by using the arrows on the keyboard. The result is an univariate subjective probability distribution. The software helps experts to draw a distribution. SL Gallery A more recent type of software, which is much less sophisticated than ELI, but can be used in more or less the same way is SL Gallery. This freeware package also visualizes distributions and assists experts in constructing them. It creates graphs and calculates distributions, including Cumulative Distribution Function (CDF), Probability Density Function (PDF), Survival Function and Hazard function. Experts have to indicate the type of distribution, the mean and the standard deviation. The output of the package are graphics and primary descriptive statistics, calculations of quantiles and function values. Probes We end this section with two packages that are used to elicit probabilities for Bayesian networks. One package that was especially designed for this purpose is Probes (Lau & Leong, 1999). Compared to the approaches in the Bayesians Network packages, the approach in Probes is more advanced. Probes is part of a larger framework called Dynamo and is used for the elicitation of dynamic, time dependent probabilities. The package uses different elicitation techniques. First, it uses a likelihood method (advanced questionnaire) to get an initial elicitation of the experts and to check for inconsistencies. Then, the experts can choose between the sample distribution method, the reference lottery or the betting method to elicit the other dynamic (time dependent) probabilities based on the initial elicitation. When the probabilities are elicited, the consistencies are checked and sensitivity analysis is executed. The experts can make corrections during the process. A tutor guides and teaches the experts to use the system. It is not currently known to us what the costs and availability of this package are. HYPO Another package for elicitation of probabilities for a Bayesian Network was developed by Jiangyi Li et al. (Jiangyu Li , Dekhtyar & Goldsmith 2002). Their package is called Help with Your Probabilities Online (HYPO). This tool combines four modes of elicitations (table; visual; verbal; default distributions) and allows the user to navigate amongst the cases, and to copy, paste, and modify existing distributions. HYPO is designed as a standalone tool, with the primary purpose of conveniently and quickly eliciting many diverse probabilities. It is online and available for any Bayesian network building project. The input is a Bayesian network structure encoded in XML and the output in XMLBIF (XML Bayesian Interchange Format) or as XML-encoded semistructured probabilistic objects. An offline version also exists. {SHELF, RAMAS constructor, ELI, Elicitor (v. 2010), Probes, Arc GIS customized, Probes, Hypo}

RIVM Letter report 630003001
Page 34 of 98
A sensitivity analysis on causal models can be performed by means of a Monte Carlo analysis. Some of the packages for causal models that require a quantitative estimate that we mentioned before (DPL, Analytica, Treeplan pro etc.) include this Monte Carlo functionality, but there are also special purpose Monte Carlo packages available. Although most software packages for Monte Carlo analysis are not specifically meant for expert elicitation, they often acknowledge that some of their input data can be based on information provided by experts. Consequently, the packages provide input modules. These packages partly overlap with the packages to estimate single parameters. Software for sensitivity analysis Software for sensitivity analysis comes in different flavours. Almost all packages are spreadsheet based: @Risk, Modelrisk 3.0, Crystall Ball and RAMAS Risk Calc. Software that is not spreadsheet based can be convenient if calculations have to be repeated often with different variables. A free non-spreadsheet based package for sensitivity analysis is Simlab. SimLab is developed by the Unit of Econometrics and Applied Statistics of the EU Joint Research Centre (see: http://simlab.jrc.ec.europa.eu/). Drawback of this package is that it actually is a development framework for uncertainty and sensitivity analysis and therefore is not (yet) very user-friendly. In the RAMAS Riskcalc package it is not necessary to provide details about statistical distributions and dependency relations if the empirical data are lacking, in contrast with @Risk and Crystall Ball. This is the result of the implementation of fuzzy sets in the RAMAS package. Out of all the packages mentioned above, Modelrisk and @Risk specifically guide the expert elicitation process. Vose Software, the developer of Modelrisk, claims that their package has the best support in the process of eliciting a distribution. The Modelrisk package provides a so-called expert window. In this window, experts can select/define a distribution from a number of statistical properties and there is a ‘shaper’ for drawing custom-made distributions. @Risk provides a distribution drawing tool, but no combining opinion tool. The Unicorn package, developed at the Delft Technical University, provides the possibility of eliciting dependency relations (transfer coefficients). This is a feature that is not present in the other packages. Kurowicka and Cooke (2006) have used this package in examples mentioned in their book ‘Uncertainty Analysis with High Dimensional Dependence Modelling’. They state that Unicorn is a package for sensitivity analysis like @Risk and Crystal Ball, but that those packages do not support features such as multiple copula, vine modelling, cobweb plots, iterated and conditional sampling and probabilistic inversion. The so-called light version of Unicorn is available for free. Monte Carlo analysis can also be performed by general purpose statistical packages like R and Mathematica. {@Risk, Modelrisk 3.0, Crystall Ball, Goldsim, Risksim, RAMAS Risk Calc., Unicorn} 3.5 Possible aggregation and reporting
This step in the elicitation process involves analysis of results, potential aggregation and reporting. According to O’Hagan et al. (2006) the simple average of (an equal-weighted linear opinion pool of) distributions from a number of experts provides a simple, robust, general method for aggregating

RIVM Letter report 630003001
Page 35 of 98
expert knowledge. Naturally, all kinds of statistical software packages can assist in this aggregation process. Similarly, a whole range of programs can be used to generate useful reports. Further discussion about these types of generic software packages, however, is beyond the scope of this report. O’Hagan et al. (2006) state that more complex mathematical aggregation has the potential to perform better than just taking the mean. One specific form of mathematical aggregation we will discuss here is weighted aggregation, using ‘seed variables’ (Goossens, Cooke & Kraan, 1998). Seed variables are used to test the judgment capacities of the experts. The actual (measured) values of these seed variables are unknown to the experts, but known to the analysts. The performance of the experts on assessing these variables can be used as a proxy for their performance on the variables of actual interest (the ‘query variables’). Subsequently, specific software can be applied to aggregate results based on the performance of the experts on estimating the seed variables: estimates from an expert that scored well on assessing the seed variables will have a larger weight in the aggregation of the judgments made about the query variables. This process is supported by the Excalibur package. Excalibur Excalibur (acronym for Expert CALIBRation, (Cooke & Solomatine, 1992)) is software that provides support in aggregating assessments of individual experts in one combined probability density function (PDF) for each of the query variables. Excalibur is a windows program that allows parametric and quantile input from experts for continuous uncertain quantities. The performance of experts as probability assessors is measured by the experts’ ability to correctly and precisely provide estimates for a set of seed variables. Subsequently, different weighting schemes are applied in order to obtain combined PDFs as a weighted linear combination of the expert's individual PDFs. Robustness analysis shows how sensitive the results are to the choice of experts and the choice of calibration variables. Discrepancy analysis shows how the assessment made by individual experts differ from a specific aggregated PDF. The output is compatible with modern text processors and spreadsheets. The light version of the Excalibur package is provided for free by the Risk and Environmental modelling group of the Delft Technical University. O’ Hagan et al (ibid.) argue that discussions about aggregation during a group elicitation probably has even greater potential than mathematical aggregation, since it can bring better synthesis and analysis of knowledge through the group interaction. Success depends on the abilities of the facilitator, who must encourage (a) the sharing of knowledge, (b) the recognition of expertise and (c) the study of feedback, but must avoid (d) the group being dominated by shared knowledge or over-strong opinions, (e) the kinds of biases found in individual assessments and particularly (f) the tendency of groups towards overconfidence.

RIVM Letter report 630003001
Page 36 of 98

RIVM Letter report 630003001
Page 37 of 98
4 Conclusions and recommendations for software development
In this report we provided an overview of existing software tools to support expert elicitation. The goal was to get an impression of software packages that could be applied in the several phases of an expert elicitation process and to make out whether further software tools could be necessary. The main conclusions are: In general the number and variety of software packages that can be used to
support expert elicitation is large. Most software needs in the different elicitation phases are satisfied in one way or the other.
Especially packages that assist in developing conceptual models, software to
analyse influence diagrams, packages that can be used to evaluate different scenarios on the basis of decision trees and packages that can be used for eliciting single parameters, such as probabilities and probability distributions, are widely available.
The software available to characterize uncertainties is limited. To our
knowledge only the Guidance for Uncertainty Assessment and Communication of the Netherlands Environmental Assessment Agency provides assistance.
A part of the packages that can be used is not specifically designed to
support expert elicitation, but can nonetheless be based upon input of elicited data. However, most of these packages do not pay much attention to the elicitation process, but focus on the algorithms and methodology implemented. Software developers behind these packages have put their trust in the skills of researchers to elicit data of a good quality, but usually do not provide much assistance in collecting it. Good exceptions to this rule are the HYPO and the Probes packages that assist in the collection of probabilities for Bayesians Networks. Furthermore, a part of the MCA packages provides assistance on this aspect. The fees asked for this service in MCA-packages are however rather high.
The main barrier to use software in expert elicitations may be unfamiliarity
with the possibilities and availability of existing software packages. With this report, we hope to increase this familiarity and thereby the use of relevant software in expert elicitations
Among the software we reviewed there is a lack of software that lowers the
costs of expert elicitations in terms of travel and organizing time and consequently money. Especially in the current era, in which the importance of internet grows every second, there is a need for more inexpensive software that enables a fast consultation of experts at different locations and at times that suit them. Software for online collaboration and discussion might have a role in that, but we think that special purpose, user-friendly

RIVM Letter report 630003001
Page 38 of 98
elicitation software that can be used online or sent by e-mail can provide a very fruitful additional contribution.

RIVM Letter report 630003001
Page 39 of 98
5 References
Borsuk, M.E., C.A. Stow & K.H. Reckhow. (2004). A Bayesian Network for eutrophication models for synthesis, prediction and uncertainty analysis. Ecological Modelling, 173, 219-239.
Buzan, T. & B. Buzan. (1992). Mind map book: radiant thinking - Major evolution in human thought London: BBC.
Cain, J., C. Batchelor & D. Waughray. (1999). Belief Networks: A framework for the participatory development of natural resource management strategies. Environment, Development and Sustainability, 1(2), 123-133.
Cooke, R.M. (1991). Experts in Uncertainty; Opinion and Subjective Probability in Science. New York & Oxford: Oxford University Press.
Cooke, R.M. & L.H. Goossens. (1999). Procedure guide for a structured Expert Elicitation. Nuclear Science and Technology, EUR 18820: TU Delft.
Cooke, R.M. & D. Solomatine. (1992). EXCALIBUR - Integrated System for Processing Expert Judgements. Delft, the Netherlands: Delft University of Technology and SoLogic Delft.
Falagas, M.E., E.I. Pitsouni, G.A. Malietzis & G. Pappas. (2008). Comparison of PubMed, Scopus, Web of Science, and Google Scholar: strengths and weaknesses. FASEB J., 22(2), 338-342.
Frey, H. (1998). Briefing paper part 1: Introduction to Uncertainty Analysis. Raleigh, NC: Dept of Civil Engineering. North Carolina State University.
Goossens, L.H., R.M. Cooke & B.C.P. Kraan. (1998). Evaluation of weighting schemes for expert judgement studies. In A. Mosley & R. Bari (Eds.), PSAM4 proceedings (pp. 1937-1942). New York: Springer.
Hoek, G., H. Boogaard, A. Knol, J. de Hartog, P. Slottje, J.G. Ayres, et al. (2010). Concentration Response Functions for Ultrafine Particles and All-Cause Mortality and Hospital Admissions: Results of a European Expert Panel Elicitation. Environ.Sci.Technol., 44(1), 476-482.
Hora, S.C. & R.L. Iman. (1989). Expert Opinion in Risk Analysis: The NUREG-1150 Methodology. Nuclear Science and Eng, 102, 323-331.
Janssen, P.H.M., A.C. Petersen, J.P. van der Sluijs, J.S. Risbey & J.R. Ravetz. (2005). A guidance for assessing and communicating uncertainties. Water Sci.Technol., 52(6), 125-131.
Janssen, R. (2001). On the use of multi-criteria analysis in environmental impact assessment in the Netherlands. Journal of Multi-Criteria Decision Analysis, 10, 101-109.
Jiangyu Li , A., A. Dekhtyar & J. Goldsmith (2002). Efficiently Eliciting Many Probabilities Online
Kahneman, D., P. Slovic & A. Tversky. (1982). Judgement under Uncertainty: Heuristics and Biases. Cambridge: Cambridge University Press.
Keeney, R.L. & D. Von Winterfeldt. (1991). Eliciting Probabilities from Experts in Complex Technical Problems. IEEE Trans Eng.Manage., 38 191-201.
Kloprogge, P., J.P. Van der Sluijs & A.C. Petersen. (2009). A method for the analysis of assumptions in model-based environmental assessments. Environmental Modelling & Software, doi:10.1016/j.envsoft.2009.06.009(in press).
Knüppel, S. (2010). DAG program. Knüppel, S. & A. Stang. (2010). DAG program: identifying minimal sufficient
adjustment sets. Epidemiology, 21(1), 159.

RIVM Letter report 630003001
Page 40 of 98
Knol, A.B., J.J. De Hartog, H. Boogaard, P. Slottje, J.P. van der Sluijs, E. Lebret, et al. (2009). Expert elicitation on ultrafine particles: likelihood of health effects and causal pathways. Part Fibre.Toxicol., 6(1), 19.
Knol, A.B., A.C. Petersen, J.P. van der Sluijs & E. Lebret. (2009). Dealing with uncertainties in environmental burden of disease assessment. Environ Health, 8, 21.
Knol, A.B., P. Slottje, J.P. van der Sluijs & E. Lebret. (2010). The use of expert elicitation in environmental health impact assessment: a seven step procedure. Environ.Health, 9(1), 19.
Kosko, B. (1986). Fuzzy cognitive maps. Int J Man-Machines Studies, 24, 65-75. Kosko, B. (1997). Fuzzy engineering. New Jersey: Prentice-Hall. Kotra, J.P., M.P. Lee, N.A. Eisenberg & A.R. DeWispelare. (1996). Branch
Technical Position on the Use of Expert Elicitation in the High-Level Radioactive Waste Program. San Antonio, Washington: Center for Nuclear Waste Regulatory Analyses; U.S. Nuclear Regulatory Commission.
Lau, A.H. & T.Y. Leong. (1999). PROBES: a framework for probability elicitation from experts. Proc.AMIA.Symp., 301-305.
Loveridge, D. (2002). Discussion Paper Series: Experts and Foresight: Review and experience: Policy Research in Engineering, Science & Technology (PREST).
Meyer, M.A. & J.M. Booker. (1991). Eliciting and Analyzing Expert Judgment: A Practical Guide. London: Academic Press.
Morgan, M.G. & M. Henrion. (1990). Uncertainty. A Guide to Dealing with Uncertainty in Quantitative Risk and Policy Analysis: Cambridge University Press.
National Research, C. (1994). Science and Judgment in Risk Assessment. Washington, D.C.: National Academy Press
O' Hagan, A., C.E. Buck, A. Daneshkhah, J.R. Eiser, P.H. Garthwaite, D.J. Jenkinson, et al. (2006). Uncertain judgements: eliciting experts' probabilities. Chichester: John Wiley & Sons Ltd.
Özesmi, U. & S.L. Özesmi. (2004). Ecological models based on people's knowledge: a multi-step fuzzy cognitive mapping approach. Ecological Modelling, 176(1-2), 43-64.
Pearl, J. (1988). Probabilistic reasoning in intelligent systems: Networks of plausible interference. Palo Alto: Morgen Kaufmann Publishers.
Petersen, A.C. (2006). Simulating nature: A philosophical study of computer-simulation uncertainties and their role in climate science and policy advice. Available at:http://hdl.handle.net/1871/11385 Het Spinhuis Publishers, Apeldoorn and Antwerp.
Plous, S. (1993). The Psychology of Judgment and Decision Making. New York McGraw-Hill.
Refsgaard, J.C., J.P. van der Sluijs, J. Hojberg & P.A. Vanrolleghem. (2007). Uncertainty in the environmental modeling process: a framework and guidance. Environmental Modeling& Software(22), 1543-1556.
Risbey, J.S. & M. Kandlikar. (2007). Expressions of likelihood and confidence in the IPCC uncertainty assessment process. Climatic Change, 85(1-2), 19-31.
Rsc. (2004). Expert Panels: Manual of Procedures & Guidelines: The Royal Society of Canada. The Canadian Academy of the Sciences and Humanities.
Slottje, P., J.P. van der Sluijs & A.B. Knol. (2008). Expert Elicitation: Methodological suggestions for its use in environmental health impact assessments: RIVM, Copernicus Institute for Sustainable Development and Innovation.

RIVM Letter report 630003001
Page 41 of 98
Spetzler, C.S. & C.A.S. Steal von Holstein. (1975). Probability encoding in decision analysis. Manage.Sci., 22(3), 340-358.
TNO, RIKZ, Hogeschool Zeeland & Copernicus Instituut. (2007). Duurzaam leven aan zee: De Nederlandse kust in 2080 (No. TNO-rapport 2007-D-R0433/A). Delft: TNO.
Van der Sluijs, J.P., M. Craye, S. Funtowicz, P. Kloprogge, J. Ravetz & J. Risbey. (2005). Combining quantitative and qualitative measures of uncertainty in model-based environmental assessment: the NUSAP system. Risk Anal., 25(2), 481-492.
Van der Sluijs, J.P., P.H.M. Janssen, A.C. Petersen, P. Kloprogge, J.S. Risbey, W. Tuinstra, et al. (2004). RIVM/MNP Guidance for Uncertainty Assessment and Communication: Tool Catalogue for Uncertainty Assessment. Utrecht/Bilthoven: Copernicus Institute & RIVM.
Van der Sluijs, J.P., A.C. Petersen, P.H.M. Janssen, J.S. Risbey & J.R. Ravetz. (2008). Exploring the quality of evidence for complex and contested policy decisions. Environmental Research Letters, 3(024008), 9pp.
Van Kouwen, F.A. (2007). The Quasta Approach. Utrecht University, Utrecht. Van Kouwen, F.A., S. Renooij & P.P. Schot. (2009). Inference in qualitative
probabilistic networks revisited. International Journal of Approximate Reasoning, 50, 708-720.
Van Kouwen, F.A., P.P. Schot & M.J. Wassen. (2008). A framework for linking advanced simulation models with interactive cognitive maps. Environmental Modelling & Software, 23(9), 1133-1144.
Van Lenthe, J. (1993). ELI. The use of proper scoring rules for eliciting subjective probability distributions. University of Groningen, Groningen.
Walker, W.E., P. Harremoes, J. Rotmans, J.P. van der Sluijs, M.B.A. van Asselt, P.H. Janssen, et al. (2003). Defining uncertainty. A conceptual basis for uncertainty management in model-based decision support. Integrated Assessment, 4, 5-17.
Wellman, M.P. (1990). Fundamental concepts of qualitative probabilistic networks. Artificial Intelligence, 44, 257-303.
Zadeh, L.A. (1965). Fuzzy sets. Information and control, 8, 338-353.

RIVM Letter report 630003001
Page 42 of 98

RIVM Letter report 630003001
Page 43 of 98
6 Appendix A
6.1 List of software packages
6.1.1 @Risk
Suitable for: Quantitative estimates
Short description functionality/ purpose
Input (by experts) Specification of model and distributions (priors). The software provides a distribution drawing tool for this purpose.
Output of the software Outcome distributions (posteriors) Platform PC Possibility of indicating uncertainty of the estimate
yes, this is characteristic of this method
Possibility of indicating the basis (motivation) of the estimate
No. Usually the basis for the estimations is explained in a document, maintained outside the package
Suited for a group elicitation (G), individual elicitation (I), or both (B)
B
Type of statistical analyses possible
Not really a statistical package. Gives descriptives of distributions
Feedback of results during the elicitation
Yes, the results of the procedure or parts of the procedure are showed on screen or can be showed on a projection screen in a group meeting
Flexibility/ possibility to fit to a specific situation
Yes
User-friendliness (score 1 – 5) 3 Anonymity in a group session No Costs/ availability £ 995 (prof) or £ 1450 (industry)
URL http://www.palisade.com Manufacturer/ Host organization Pallisade Positive aspects
Negative aspects
References Remarks Part of the decision Tools suite. The Decision
Tools Suite costs less than buying just two component products separately.
6.1.2 1000Minds
Suitable for: Qualitative estimations
Short description functionality/ purpose
Applies the patented 'PAPRIKA' (Potentially All Pairwise RanKings of all possible Alternatives) method for Multi-Criteria Decision-making and Conjoint Analysis
Input (by experts) Can help to get the scores (value of a criteria)

RIVM Letter report 630003001
Page 44 of 98
right. Can help to determine which criteria to consider and can help by assigning weights to the criteria that are considered relevant. PAPRIKA limits the number of comparisons
Output of the software In addition to the more regular out comes of MCA’s, surveys and voting is possible. Moreover de results of multiple decision makers can be aggregated
Platform Internet Possibility of indicating uncertainty of the estimate
yes, possible in 'other considerations'
Possibility of indicating the basis (motivation) of the estimate
Does not apply
Suited for a group elicitation (G), individual elicitation (I), or both (B)
B
Type of statistical analyses possible
Standardizes scores, calculates weighted summations and ranks the different alternatives
Feedback of results during the elicitation
Yes, but not for all participant; first the data have to be collected
Flexibility/ possibility to fit to a specific situation
yes, it is even possible to include your own surveys (e.g. by Google docs) by means of the so-called software development kit
User-friendliness (score 1 – 5) 4 Anonymity in a group session yes Costs/ availability 5000-20.000 USD for an annual license fee
URL http://www.1000minds.com/ Manufacturer/ Host organization Franz Ombler and Paul Hansen Positive aspects Experts can contribute over the Internet
Negative aspects Expensive
References P Hansen & F Ombler, “A new method for scoring multi-attribute value models using pairwise rankings of alternatives”, Journal of Multi-Criteria Decision Analysis 15, 87-107
Remarks Finalist or winner of seven awards since 2005
6.1.3 AHP templates
Suitable for: Qualitative estimates
Short description functionality/ purpose
Assists in the evaluation of alternatives and scenario’s by means of AHP type Multi Criteria Analysis.
Input (by experts) Can help to get the scores (value of a criteria) right. Can help to determine which criteria to consider and can help by assigning weights to the criteria that are considered relevant.
Output of the software Matrix with scores, matrix with weights, Graphics, rankings
Platform Excell Possibility of indicating uncertainty of the estimate
No

RIVM Letter report 630003001
Page 45 of 98
Possibility of indicating the basis (motivation) of the estimate
No
Suited for a group elicitation (G), individual elicitation (I), or both (B)
B
Type of statistical analyses possible
Not a statistical package. Calculates consistency of scores and weights
Feedback of results during the elicitation
Yes, the results of the procedure or parts of the procedure are showed on screen or can be showed on a projection screen in a group meeting
Flexibility/ possibility to fit to a specific situation
yes
User-friendliness (score 1 – 5) 2 Anonymity in a group session no Costs/ availability Free
URL http://people.revoledu.com/kardi/tutorial/AHP/AHP-Resources.htm or http://people.revoledu.com/kardi/tutorial/AHP/index.html
Manufacturer/ Host organization Template by Klaus Goepel or by Kardi Teknomo Positive aspects
Negative aspects
References
Remarks
6.1.4 Analytica
Suitable for: Quantitative estimations and causal web
Short description functionality/ purpose
Influence diagram based, visual environment for creating, analysing and communicating probabilistic models
Input (by experts) The user/experts have to define the model structure
Output of the software Its influence diagrams let you create a model the way you think, and communicate clearly about it. Its Intelligent Arrays™ let you create and manage multidimensional tables with an ease and reliability. Monte Carlo analyses to evaluate risk and uncertainty, and find out what variables really matter and why.
Platform PC Possibility of indicating uncertainty of the estimate
Yes, sensitivity analyses can be performed
Possibility of indicating the basis (motivation) of the estimate
no, not inside the package
Suited for a group elicitation (G), individual elicitation (I), or both (B)
B
Type of statistical analyses Not really a statistical package, see output

RIVM Letter report 630003001
Page 46 of 98
possible Feedback of results during the elicitation
Yes, (changes of) effects are shown on screen
Flexibility/ possibility to fit to a specific situation
User-friendliness (score 1 – 5) 3 Anonymity in a group session No Costs/ availability 1295 USD (individual license) of 3200 USD
(floating license) URL http://www.lumina.com/ Manufacturer/ Host organization Positive aspects Comes with a free player
Negative aspects
References
Remarks
6.1.5 Arc Gis customized
Suitable for: Quantitative estimations
Short description functionality/ purpose
Elicitation of probabilities that have a spatial dependency
Input (by experts) The Characteristics (medians, intervals) of distributions have to be provided following classic procedures. The elicitation is supported by geographical information
Output of the software ArcGIS is customized by scripting with Visual Basic for Applications (VBA), and by communicating with other applications. R is used for the statistical calculations
Platform GIS Possibility of indicating uncertainty of the estimate
yes
Possibility of indicating the basis (motivation) of the estimate
no
Suited for a group elicitation (G), individual elicitation (I), or both (B)
I
Type of statistical analyses possible
R is used as an assisting application
Feedback of results during the elicitation
yes
Flexibility/ possibility to fit to a specific situation
Geographic dependency is a prerequisite
User-friendliness (score 1 – 5) 3 Anonymity in a group session Not applicable Costs/ availability Not known. Contact Kerrie Mengersen.
[email protected] URL Manufacturer/ Host organization School of Mathematical Sciences, Queensland
University of Technology, Brisbane, Australia

RIVM Letter report 630003001
Page 47 of 98
Positive aspects
Negative aspects
References Robert Denham and Kerrie Mengersen (2007). Geographically assisted elicitation of expert opinion for regression models. Bayesian Analysis (2)1, pp. 99-136.
Remarks
6.1.6 B-course
Suitable for: Causal web
Short description functionality/ purpose
A web-based tool for Bayesian network modelling, developed by the Helsinki Institute for Information Technology. It supports most web-browsers, and may be used freely for research and educational purposes.
Input (by experts) B-Course provides a structural learning engine, and in fact cannot be used by building the model structure manually.
Output of the software See other Baynesian Network packages Platform PC Possibility of indicating uncertainty of the estimate
yes, by performing a sensitivity analysis
Possibility of indicating the basis (motivation) of the estimate
no, not inside the package
Suited for a group elicitation (G), individual elicitation (I), or both (B)
B
Type of statistical analyses possible
Not really a statistical package, see output
Feedback of results during the elicitation
Yes, (changes of) effects are shown on screen
Flexibility/ possibility to fit to a specific situation
Partly, the model cannot be specified manually
User-friendliness (score 1 – 5) 3 Anonymity in a group session No Costs/ availability Free web-based tool
URL http://b-course.cs.helsinki.fi/obc/ Manufacturer/ Host organization Helsinki Institute for Information Technology Positive aspects
Negative aspects
References P.Myllymäki, T.Silander, H.Tirri, P.Uronen, B-Course: A Web-Based Tool for Bayesian and Causal Data Analysis. International Journal on Artificial Intelligence Tools, Vol 11, No. 3 (2002) 369-387.
Remarks B-course can deal with missing data, and it automatically discretizes continuous data. The user cannot affect how the data are discretized, however, and often the better solution is to

RIVM Letter report 630003001
Page 48 of 98
discretize the data separately before submitting it. B-course has a tutorial-type interface, and it might serve as a good starting point for studying dependence modelling.
6.1.7 CoFFEE
Suitable for: Quantitative and qualitative estimates
Short description functionality/ purpose
A platform for Collaborative Discussion in classroom, i.e. face-2-face. CoFFEE (Collaborative Face2Face Educational Environment) offers several collaborative tools, and applications to design, guide and implement a session with students
Input (by experts) Ideas, knowledge Output of the software Provides customisable tools for group
collaboration, knowledge sharing and representation, such as a threaded discussion forum, a graphical concept mapping tool, dynamic voting and others. It has so far been translated into French, Spanish, Italian, Dutch and (experimental version) Hebrew and is being used in schools, colleges and universities in the UK, France, Italy and the Netherlands.
Platform Internet Possibility of indicating uncertainty of the estimate
yes
Possibility of indicating the basis (motivation) of the estimate
yes
Suited for a group elicitation (G), individual elicitation (I), or both (B)
G
Type of statistical analyses possible
Does not apply
Feedback of results during the elicitation
yes
Flexibility/ possibility to fit to a specific situation
yes
User-friendliness (score 1 – 5) 3 Anonymity in a group session Might be possible Costs/ availability Open source
URL http://www.coffee-soft.org/ Manufacturer/ Host organization Lead consortium Positive aspects
Negative aspects
References Remarks

RIVM Letter report 630003001
Page 49 of 98
6.1.8 Criterium Decision plus
Suitable for: Qualitative estimations
Short description functionality/ purpose
Ranks different sources of risk or ranks the different scenarios to mitigate the risk.
Input (by experts) Can help to get the scores (value of a criteria) right. Can help to determine which criteria to consider and can help by assigning weights to the criteria that are considered relevant. Elicits utility functions.
Output of the software Value Tree, matrix with scores, matrix with weights, Graphics, rankings, sensitivity analysis
Platform PC Possibility of indicating uncertainty of the estimate
Yes. In the sensitivity analysis the effect of uncertainty on scores and weights are studied
Possibility of indicating the basis (motivation) of the estimate
No. Usually the basis for the scores is explained in a document, maintained outside the package
Suited for a group elicitation (G), individual elicitation (I), or both (B)
B
Type of statistical analyses possible
Standardizes scores, calculates weighted summations and ranks the different alternatives
Feedback of results during the elicitation
Yes, the results of the procedure or parts of the procedure are showed on screen or can be showed on a projection screen in a group meeting
Flexibility/ possibility to fit to a specific situation
Yes
User-friendliness (score 1 – 5) 4, commercial software packages designed for a 'time is money' environment
Anonymity in a group session no Costs/ availability 895 USD
URL http://www.infoharvest.com Manufacturer/ Host organization Positive aspects
Negative aspects
References Remarks 6.1.9 Crystal Ball
Suitable for: Quantitative estimates
Short description functionality/ purpose
Crystal Ball performs risk analysis using Monte Carlo simulation to show you many possible outcomes in your Microsoft Excel spreadsheet—and tells you how likely they are to occur. This means you can judge which risks to take and which ones to avoid
Input (by experts) Specification of model and distributions (priors). Crystal Ball provides no specific instrument for

RIVM Letter report 630003001
Page 50 of 98
Expert Elicitation, although some distributions can be defined using alternative parameterization
Output of the software Outcome distributions (posteriors) Platform PC Possibility of indicating uncertainty of the estimate
yes, this is characteristic of this method
Possibility of indicating the basis (motivation) of the estimate
No. Usually the basis for the estimations is explained in a document, maintained outside the package
Suited for a group elicitation (G), individual elicitation (I), or both (B)
B
Type of statistical analyses possible
Not really a statistical package. Gives descriptives of distributions
Feedback of results during the elicitation
Yes, the results of the procedure or parts of the procedure are showed on screen or can be showed on a projection screen in a group meeting
Flexibility/ possibility to fit to a specific situation
yes
User-friendliness (score 1 – 5) 3 Anonymity in a group session no Costs/ availability € 957
URL http://www.oracle.com/ Manufacturer/ Host organization Oracle Positive aspects
Negative aspects
References Remarks
6.1.10 Decision Deck
Suitable for: Quantitative estimates
Short description functionality/ purpose
The Decision Deck project aims at collaboratively developing Open Source software tools implementing Multiple Criteria Decision Aid (MCDA). These software components implement the common functionalities of a large range of multiple criteria decision aid methods.
Input (by experts) Imprecise scores and weights Output of the software Platform Java client which locally implements the MCDA
methods (D2), and a distributed Web service (D3).
Possibility of indicating uncertainty of the estimate
Depends on the method chosen. Some of the methods explicitly acknowlede uncertainty, while others do not.
Possibility of indicating the basis (motivation) of the estimate
No. Usually the basis for the scores is explained in a document, maintained outside the package

RIVM Letter report 630003001
Page 51 of 98
Suited for a group elicitation (G), individual elicitation (I), or both (B)
B. One of the most valuable features of the Decision-Deck software is the effective consideration of specific roles such as decision maker, evaluator, coordinator or facilitator in a given decision analysis project. For instance, evaluators from a variety of distant locations may communicate their evaluations via their local D2 clients to the common decision analysis project under the supervision of the project coordinator, whereas the decision maker may input personal preferences via method-specific criteria tuning facilities offered in his/her local client (see Figure 1).
Type of statistical analyses possible
Not really a statistical package
Feedback of results during the elicitation
Yes
Flexibility/ possibility to fit to a specific situation
Yes
User-friendliness (score 1 – 5) 2. Development framework. Documentation is not very good. Language might be a problem as the scientific origin is French/Flemish/Luxembourg
Anonymity in a group session Not known Costs/ availability Open source
URL http://www.decision-deck.org/ Manufacturer/ Host organization [email protected] Positive aspects Open source java internet application. Many
differing methods implemented. Different roles distinguished.
Negative aspects Documentation for starters
References Bisdorff, R. and P. Meyer (2008). The decision-deck project. Developing a Multiple Criteria Decision Analysis Software Platform. ERCIM News (January 2008)
Remarks
6.1.11 Decision Explorer
Suitable for: Causal webs (qualitative)
Short description functionality/ purpose
Decision Explorer is an idea mapping tool based on cognitive mapping After brainstorming the concepts can be structured and restructured. The software keeps a database of relationships, causes and effects.
Input (by experts) Ideas, relationships, concepts Output of the software Knowledge, ideas about working mechanisms Platform Windows Possibility of indicating uncertainty of the estimate
No

RIVM Letter report 630003001
Page 52 of 98
Possibility of indicating the basis (motivation) of the estimate
No
Suited for a group elicitation (G), individual elicitation (I), or both (B)
B
Type of statistical analyses possible
Not a statistical package
Feedback of results during the elicitation
yes
Flexibility/ possibility to fit to a specific situation
yes
User-friendliness (score 1 – 5) 4 Anonymity in a group session no Costs/ availability £ 395,-
URL http://www.banxia.com Manufacturer/ Host organization Banxia Positive aspects
Negative aspects
References Eden, C. (1988). Cognitive Mapping. European Journal of Operational Research, 36, 1-13.
Remarks
6.1.12 Definite
Suitable for: Qualitative estimations
Short description functionality/ purpose
Ranks different sources of risk or ranks the different scenarios to mitigate the risk.
Input (by experts) Can help to get the scores (value of a criteria) right. Can help to determine which criteria to consider and can help by assigning weights to the criteria that are considered relevant. Elicits utility functions.
Output of the software Valuetree, matrix with scores, matrix with weights, Graphics, rankings, sensitivity analysis (includes a Monte Carlo implementation)
Platform PC Possibility of indicating uncertainty of the estimate
Yes. In the sensitivity analysis the effect of uncertainty on scores and weights are studied
Possibility of indicating the basis (motivation) of the estimate
No. Usually the basis for the scores is explained in a document, maintained outside the package
Suited for a group elicitation (G), individual elicitation (I), or both (B)
B
Type of statistical analyses possible
Standardizes scores, calculates weighted summations and ranks the different alternatives
Feedback of results during the elicitation
Yes, the results of the procedure or parts of the procedure are showed on screen or can be showed on a projection screen in a group meeting

RIVM Letter report 630003001
Page 53 of 98
Flexibility/ possibility to fit to a specific situation
yes
User-friendliness (score 1 – 5) 4, commercial software packages desiged for a 'time is money' environment
Anonymity in a group session no Costs/ availability € 1360,-
URL http://www.acaciawater.com/ Manufacturer/ Host organization VU Amsterdam Positive aspects Multi purpose package
Negative aspects
References
Remarks
6.1.13 Delphi Blue or a hosted version on realtimedelphi.com
Suitable for: Quantitative and qualitative estimates
Short description functionality/ purpose
Delphi Blue" is an open source, Java/JSP implementation of the Delphi process for group decision making. It supports creation and editing of decision matrices which reflect group consensus.Concerns a Real Time Delphi as was used by the UN Millenium Project
Input (by experts) Ideas, knowledge Output of the software In classical Delphi, the judgments collected in
one round are fed back to the participants in subsequent rounds. By contrast, Real Time Delphi is roundless and answers generated are fed back to participants in real time. As in classical Delphi, participants are anonymous to one another and may omit any questions they wish.
Platform Internet Possibility of indicating uncertainty of the estimate
yes
Possibility of indicating the basis (motivation) of the estimate
yes
Suited for a group elicitation (G), individual elicitation (I), or both (B)
G
Type of statistical analyses possible
Does not apply
Feedback of results during the elicitation
yes
Flexibility/ possibility to fit to a specific situation
yes
User-friendliness (score 1 – 5) 3 Anonymity in a group session yes Costs/ availability Open source or 5000 USD per study, or 35.000
USD for an annual license URL http://www.realtimedelphi.com/ en

RIVM Letter report 630003001
Page 54 of 98
http://sourceforge.net/projects/delphiblue/ Manufacturer/ Host organization Ted Gordon and Adam Pease Positive aspects Has already been employed in many global
studies. Clients have included UNESCO, South Africa, South Korea, and the World Bank
Negative aspects
References Remarks
6.1.14 DPL
Suitable for: Causal web
Short description functionality/ purpose
Package implements both decision trees and influence diagrams.
Input (by experts) Knowledge about relations Output of the software Decision Trees, Influence diagrams, Monte Carlo
Simulation, Five types of Tornado Diagrams (graphical sensitivity analysis), Multiple Attributes/Metrics, Export as CSV, XML or API
Platform PC; Has extensive links to Excel. Possibility of indicating uncertainty of the estimate
yes
Possibility of indicating the basis (motivation) of the estimate
Suited for a group elicitation (G), individual elicitation (I), or both (B)
B. DPL 7 enterprise and porfolio have the feature 'multiple expert aggregation'
Type of statistical analyses possible
Not really a statistical package, see output
Feedback of results during the elicitation
Yes, effect are shown on screen
Flexibility/ possibility to fit to a specific situation
yes
User-friendliness (score 1 – 5) 3 Anonymity in a group session no Costs/ availability 895 -1995 USD and price for the portfolio
version on demand URL http://www.syncopation.com/ Manufacturer/ Host organization Positive aspects
Negative aspects
References
Remarks Comes in different versions (standard, professional, enterprise and portfolio)

RIVM Letter report 630003001
Page 55 of 98
6.1.15 ELI
Suitable for: Quantitative estimations
Short description functionality/ purpose
Estimation of percentages, proportions and other quantities
Input (by experts) Manipulation of a curve by means of the arrows on the keyboard
Output of the software Univariate Subjective Probability distribution Platform DOS or windows DOS-shell Possibility of indicating uncertainty of the estimate
yes
Possibility of indicating the basis (motivation) of the estimate
no
Suited for a group elicitation (G), individual elicitation (I), or both (B)
I, but when the results are communicated by means of a projector an elicitation in a group might be possible
Type of statistical analyses possible
Does not apply
Feedback of results during the elicitation
Yes, continuous during the elicitation
Flexibility/ possibility to fit to a specific situation
User-friendliness (score 1 – 5) 3 Anonymity in a group session no Costs/ availability Old DOS-programme; Free
URL Manufacturer/ Host organization I.E.C. ProGamma and Jelle Van Lenthe Positive aspects
Negative aspects Made for DOS. Might be difficult to install on modern OS. A possibility might be the dosbox x86 emulator: http://www.dosbox.com
References Bijmolt, T.H.A en J. Van Lenthe. Eliciteren van subjectieve onzekere kennis met ELI binnen marktonderzoek. Furthermore: the dissertation by Van Lenthe.
Remarks Positive software review: Bijmolt, T.H.A. (1999). ELI: A program for the elicitation of uncertain knowledge. Journal of Behavioral Decision Making, 12, pp. 337-339.
6.1.16 Elicitor
Suitable for: Quantitative estimations
Short description functionality/ purpose
Is used for estimations about the presence of species in a ecosystem (ecology). The priors are meant as input for a logistic regression model.
Input (by experts) The characteristic (median, intervals, properties of continuous variables) of the distribution have to be provided. The software supplies graphical assistance.

RIVM Letter report 630003001
Page 56 of 98
Output of the software Priors, that are subsequently used as input for a model that has been constructed. This can be done in several formats. Important is that input for winBUGS is provided.
Platform Windows Possibility of indicating uncertainty of the estimate
yes
Possibility of indicating the basis (motivation) of the estimate
no
Suited for a group elicitation (G), individual elicitation (I), or both (B)
I, but when the results are communicated by means of a projector an elicitation in a group might be possible
Type of statistical analyses possible
Not applicable
Feedback of results during the elicitation
yes, the priors are interactively constructed
Flexibility/ possibility to fit to a specific situation
yes, in the thesis of Mary Kynn the software is used in five different cases (species)
User-friendliness (score 1 – 5) 3 Anonymity in a group session yes Costs/ availability Free
URL http://www.zinnamturm.eu/downloadsDH.htm#Elicitor
Manufacturer/ Host organization Mary Kynn, Queensland University of Technology, Brisbane, Australia
Positive aspects
Negative aspects
References Kynn, M. (2005). Eliciting expert knowledge for Bayesian logistic regression in species habitat modelling. Thesis: Queensland University of Technology, Australia.
Remarks Software is provided in Component Pascal and has to be compiled, constructed, first. This requires knowledge about Component Pascal. The Oberon Blackbox component Builder that is needed, is offered for free at http://www.oberon.ch/blackbox.html
6.1.17 Elicitor (v. 2010)
Suitable for: Quantitative estimations
Short description functionality/ purpose
No longer limited to logistic regression. This is probably the improved version of the software by Mary Kynn.
Input (by experts) The characteristic (median, intervals, properties of continuous variables) of the distribution have to be provided. The software supplies graphical assistance.
Output of the software Priors, that are subsequently used as input for a model that has been constructed. This can be done in several formats. Important is that input

RIVM Letter report 630003001
Page 57 of 98
for winBUGS is provided. Platform Windows Possibility of indicating uncertainty of the estimate
yes
Possibility of indicating the basis (motivation) of the estimate
no
Suited for a group elicitation (G), individual elicitation (I), or both (B)
I, but when the results are communicated by means of a projector an elicitation in a group might be possible
Type of statistical analyses possible
Does not apply
Feedback of results during the elicitation
yes, the priors are interactively constructed
Flexibility/ possibility to fit to a specific situation
yes
User-friendliness (score 1 – 5) yes Anonymity in a group session yes Costs/ availability Software will be delivered for free in case of a
training in expert elicitation URL Manufacturer/ Host organization Allan James
High Performance Computing & Research Support Queensland University of Technology (07) 3138 9264 [email protected] http://www.qut.edu.au/its/hpc
Positive aspects
Negative aspects Might have a too narrow focus on specific spots, locations?
References Allan James, Samantha Low Choy and Kerrie Mengersen (2010). Elicitator: An expert elicitation tool for regression in ecology. Environmental Modelling & Software, 25. pp. 129-145
Remarks The developers are interested in possibilities for a cooperation in which the software can be further developed or tuned to the needs of those who use it.
6.1.18 Equity 3
Suitable for: Qualitative estimations
Short description functionality/ purpose
Ranks different sources of risk or ranks the different scenarios to mitigate the risk.
Input (by experts) Can help to get the scores (value of a criteria) right. Can help to determine which criteria to consider and can help by assigning weights to the criteria that are considered relevant. Elicits utility functions.
Output of the software Valuetree, matrix with scores, matrix with weights, Graphics, rankings, sensitivity analysis

RIVM Letter report 630003001
Page 58 of 98
Platform PC Possibility of indicating uncertainty of the estimate
Yes. In the sensitivity analysis the effect of uncertainty on scores and weights are studied
Possibility of indicating the basis (motivation) of the estimate
No. Usually the basis for the scores is explained in a document, maintained outside the package
Suited for a group elicitation (G), individual elicitation (I), or both (B)
B
Type of statistical analyses possible
Standardizes scores, calculates weighted summations and ranks the different alternatives
Feedback of results during the elicitation
Yes, the results of the procedure or parts of the procedure are showed on screen or can be showed on a projection screen in a group meeting
Flexibility/ possibility to fit to a specific situation
Yes
User-friendliness (score 1 – 5) 4, commercial software packages designed for a 'time is money' environment
Anonymity in a group session no Costs/ availability £ 1850,-
URL http://www.catalyze.co.uk/ Manufacturer/ Host organization Catalyze Positive aspects
Negative aspects
References
Remarks
6.1.19 Excalibur
Suitable for: Quantitative estimates
Short description functionality/ purpose
EXCALIBUR (acronym for EXpert CALIBRation) is a Windows program that allows parametric and quantile input from experts for continuous uncertain quantities and combines these according to the methods described in R. M. Cooke "Experts in Uncertainty", Oxford University Press 1991. Provides means to aggregate individual elicitations.
Input (by experts) Parametric and quantile input for continuous uncertain quantities
Output of the software In particular user-weights, equal weights and performance based weights are supported. Robustness analysis shows how sensitive the results are to choice of expert and choice of calibration variables. Discrepancy analysis shows how the experts differ from a Decision Maker. Output is compatible with modern text processors and spreadsheets.
Platform PC (windows) Possibility of indicating Yes

RIVM Letter report 630003001
Page 59 of 98
uncertainty of the estimate
Possibility of indicating the basis (motivation) of the estimate
no, not inside the package
Suited for a group elicitation (G), individual elicitation (I), or both (B)
B
Type of statistical analyses possible
Not really a statistical package, see output
Feedback of results during the elicitation
Yes
Flexibility/ possibility to fit to a specific situation
Yes
User-friendliness (score 1 – 5) 2, applied mathematics. Anonymity in a group session Might be possible Costs/ availability Freeware
URL http://ssor.twi.tudelft.nl/~risk/index.php?option=com_content&view=category&id=3&Itemid=5
Manufacturer/ Host organization TU Delft, Risk and Environmental modelling group
Positive aspects
Negative aspects
References R. M. Cooke "Experts in Uncertainty", Oxford University Press 1991
Remarks
6.1.20 Expert Choice
Suitable for: Qualitative estimations
Short description functionality/ purpose
Ranks different sources of risk or ranks the different scenarios to mitigate the risk.
Input (by experts) Can help to get the scores (value of a criteria) right. Can help to determine which criteria to consider and can help by assigning weights to the criteria that are considered relevant. Elicits utility functions.
Output of the software Valuetree, matrix with scores, matrix with weights, Graphics, rankings, sensitivity analysis
Platform PC en Internet Possibility of indicating uncertainty of the estimate
Yes. In the sensitivity analysis the effect of uncertainty on scores and weights are studied
Possibility of indicating the basis (motivation) of the estimate
No. Usually the basis for the scores is explained in a document, maintained outside the package
Suited for a group elicitation (G), individual elicitation (I), or both (B)
B. Has a version in which experts can participate over the Internet
Type of statistical analyses possible
Standardizes scores, calculates weighted summations and ranks the different alternatives
Feedback of results during the elicitation
Yes, the results of the procedure or parts of the procedure are showed on screen or can be
RIVM Letter report 630003001
Page 60 of 98
showed on a projection screen in a group meeting
Flexibility/ possibility to fit to a specific situation
yes
User-friendliness (score 1 – 5) 4, commercial software packages designed for a 'time is money' environment
Anonymity in a group session yes Costs/ availability Not on the website
URL http://www.expertchoice.com/ Manufacturer/ Host organization Expertchoice Positive aspects Experts can contribute over the Internet
Negative aspects
References
Remarks
6.1.21 Facilitate Pro
Suitable for: Quantitative and qualitative estimates
Short description functionality/ purpose
Electronic meeting software, installed on own server or as a web application
Input (by experts) Ideas, knowledge Output of the software Provides tools for brainstorming, categorizing,
prioritizing, voting, surveys and action planning Platform Internet Possibility of indicating uncertainty of the estimate
yes
Possibility of indicating the basis (motivation) of the estimate
yes
Suited for a group elicitation (G), individual elicitation (I), or both (B)
G
Type of statistical analyses possible
Does not apply
Feedback of results during the elicitation
yes
Flexibility/ possibility to fit to a specific situation
yes
User-friendliness (score 1 – 5) 3 Anonymity in a group session Might be possible Costs/ availability 20.000 USD
URL http://www.facilitate.com Manufacturer/ Host organization Facilitate.com Positive aspects
Negative aspects
References Remarks

RIVM Letter report 630003001
Page 61 of 98
6.1.22 FC Mapper
Suitable for: Causal maps
Short description functionality/ purpose
Supports Fuzzy cognitive mapping, which is a procedure to involve stakeholders in research or management processes and a method to extract and analyze different kinds of knowledge about complex systems and their functioning (including relations between humans or institutions as in Social Network Analysis)
Input (by experts) Experience, observations Output of the software Mapping and analysis of different scenario’s Platform Excell Possibility of indicating uncertainty of the estimate
No
Possibility of indicating the basis (motivation) of the estimate
No
Suited for a group elicitation (G), individual elicitation (I), or both (B)
B
Type of statistical analyses possible
Not really a statistical package. Provides information about the relationships between concepts
Feedback of results during the elicitation
yes
Flexibility/ possibility to fit to a specific situation
yes
User-friendliness (score 1 – 5) 3 Anonymity in a group session No Costs/ availability Free
URL http://www.fcmappers.net Manufacturer/ Host organization Michael Bachhofer and Martin Wildenberg Positive aspects
Negative aspects
References
Remarks
6.1.23 Flash Q
Suitable for: Qualitative estimates
Short description functionality/ purpose
Software that supports Q-sorting over the Internet. Analysis by Pqmethod
Input (by experts) Attitudes, opinions, qualitative judgments Output of the software Collects the data, the sorts, by experts and
writes it to a file that can be used by Pqmethod or another statistical package
Platform Internet (Macromedia Flash)

RIVM Letter report 630003001
Page 62 of 98
Possibility of indicating uncertainty of the estimate
does not apply
Possibility of indicating the basis (motivation) of the estimate
Yes, if you include among others statements that quantify a judgment
Suited for a group elicitation (G), individual elicitation (I), or both (B)
I
Type of statistical analyses possible
Does not apply
Feedback of results during the elicitation
Does not apply
Flexibility/ possibility to fit to a specific situation
Yes, a deck of statements has to be sorted. Content, number of statements and distribution is flexible
User-friendliness (score 1 – 5) 4 Anonymity in a group session Yes Costs/ availability Freeware
URL http://www.hackert.biz/flashq/downloads/ Manufacturer/ Host organization Christian Hackert and Gernot Braehler Positive aspects Looks very fine. Very user friendly. Advanced
way of collecting data. Has an on- and an offline modus
Negative aspects Might be difficult tot set up. Needs a web server with php to which flash q must be uploaded
References Remarks
6.1.24 GeNIe
Suitable for: Causal web
Short description functionality/ purpose
GeNie is a decision modelling environment implementing influence diagrams and Bayesian networks, developed at the Decision Systems Laboratory, University of Pittsburgh.
Input (by experts) Experts have to construct the model themselves, as GeNie does not provide learning model structures or conditional probabilities from data
Output of the software It has an intuitive graphical interface that includes hierarchical sub models, Windows-style tree view, and a comprehensive HTML-based on-line help that includes beginners-oriented tutorials for Bayesian networks, influence diagrams, and basic decision analytic techniques. GeNie implements multi-attribute utility functions, Noisy-OR and Noisy-AND gates, value of information, and sensitivity analysis. GeNie supports reading and writing of Hugin, Netica, and Ergo files. GeNie comes with SMILE (Structural Modelling, Inference, and Learning Engine) an application programmer's interface (API).
Platform PC, active support: willingness to compile for

RIVM Letter report 630003001
Page 63 of 98
specific platforms Possibility of indicating uncertainty of the estimate
Possibility of indicating the basis (motivation) of the estimate
no, not inside the package
Suited for a group elicitation (G), individual elicitation (I), or both (B)
B
Type of statistical analyses possible
Not really a statistical package, see output
Feedback of results during the elicitation
Yes, (changes of) effects are shown on screen
Flexibility/ possibility to fit to a specific situation
Yes
User-friendliness (score 1 – 5) 3 Anonymity in a group session No Costs/ availability Freeware
URL http://genie.sis.pitt.edu/ and http://genie.sis.pitt.edu/wiki/GeNIe_Documentation
Manufacturer/ Host organization Marek Druzdzel, University of Pittsburg Positive aspects
Negative aspects
References
Remarks
6.1.25 GoldSim
Suitable for: Quantitative estimates en Causal webs
Short description functionality/ purpose
GoldSim provides a visual and hierarchical modeling environment, which allows users create graphical representations that resemble influence diagrams. Influence arrows are automatically drawn as elements are referenced by other elements. Moreover, GoldSim is a Monte Carlo simulator (no spreadsheet) , such that inputs can be defined as distributions and the entire system simulated a large number of times to provide probabilistic outputs.
Input (by experts) Specification of model and distributions (priors). Output of the software Outcomes and outcome distributions Platform PC Possibility of indicating uncertainty of the estimate
Yes, because of the Monte Carlo simulation
Possibility of indicating the basis (motivation) of the estimate
No. Usually the basis for the estimations is explained in a document, maintained outside the package

RIVM Letter report 630003001
Page 64 of 98
Suited for a group elicitation (G), individual elicitation (I), or both (B)
B
Type of statistical analyses possible
Not really a statistical package, see output
Feedback of results during the elicitation
Yes, the results of the procedure or parts of the procedure are showed on screen or can be showed on a projection screen in a group meeting
Flexibility/ possibility to fit to a specific situation
yes
User-friendliness (score 1 – 5) 3 Anonymity in a group session no Costs/ availability 950 USD (academic research version)
URL http://www.goldsim.com Manufacturer/ Host organization Goldsim Positive aspects Is claimed to be a more transparent approach
than spreadsheet modelling. Comes with a free player. Has a history in environmental modelling
Negative aspects
References Remarks
6.1.26 Google docs
Suitable for: Qualitative estimations
Short description functionality/ purpose
Forms in Google spreadsheets, can be used as a online survey instrument. Limits to size
Input (by experts) Meanings, motivations, qualitative estimates Output of the software Delivers questions in a format suited for
Internet. Several types are possible. Forms are send to e-mail addresses and data are collected automatically. Data acquired can be exported to text, CSV, PDF, SPSS, queXML en MS Excel format. The statistics and graphs of google spreadsheet are available
Platform Internet Possibility of indicating uncertainty of the estimate
yes
Possibility of indicating the basis (motivation) of the estimate
yes
Suited for a group elicitation (G), individual elicitation (I), or both (B)
I
Type of statistical analyses possible
Descriptive statistics
Feedback of results during the elicitation
Does not apply
Flexibility/ possibility to fit to a specific situation
yes
User-friendliness (score 1 – 5) 4

RIVM Letter report 630003001
Page 65 of 98
Anonymity in a group session Costs/ availability Free, but limits in size
URL http://google.com Manufacturer/ Host organization google Positive aspects Fast, simple and probably still available the
coming years Negative aspects Limited size, still soms bugs (eg form can be
filled out more than once by one person). If you know your experts/respondents this doesn't have to be a problem
References
Remarks
6.1.27 Hiview 3
Suitable for: Qualitative estimations
Short description functionality/ purpose
Ranks different sources of risk or ranks the different scenarios to mitigate the risk. Uses MAUT
Input (by experts) Can help to get the scores (value of a criteria) right. Can help to determine which criteria to consider and can help by assigning weights to the criteria that are considered relevant. Elicits utility functions.
Output of the software Value tree, matrix with scores, matrix with weights, Graphics, rankings, sensitivity analysis
Platform PC Possibility of indicating uncertainty of the estimate
Yes. In the sensitivity analysis the effect of uncertainty on scores and weights are studied
Possibility of indicating the basis (motivation) of the estimate
No. Usually the basis for the scores is explained in a document, maintained outside the package
Suited for a group elicitation (G), individual elicitation (I), or both (B)
B
Type of statistical analyses possible
Standardizes scores, calculates weighted summations and ranks the different alternatives
Feedback of results during the elicitation
Yes, the results of the procedure or parts of the procedure are showed on screen or can be showed on a projection screen in a group meeting
Flexibility/ possibility to fit to a specific situation
Yes
User-friendliness (score 1 – 5) 4, commercial software packages designed for a 'time is money' environment
Anonymity in a group session no Costs/ availability £ 950,-
URL http://www.catalyze.co.uk/ Manufacturer/ Host organization Catalyze

RIVM Letter report 630003001
Page 66 of 98
Positive aspects
Negative aspects
References
Remarks
6.1.28 Hugin
Suitable for: Causal web
Short description functionality/ purpose
Software system for building Bayesian networks
Input (by experts) Model structure can be defined manually, but can can also be learned from the data using PC or NPC algorithms. Moreover, supervised data-based learning is possible
Output of the software Compiles belief (Bayesian) networks into a junction tree of cliques for fast probabilistic reasoning. Utility-free sensitivity analysis. Can test the performance of a network using a file of cases. Will print out a confusion matrix, error rate, logarithmic and quadratic (Brier) scoring rule results, calibration table and surprise indexes for each node desired. Can find optimal decisions for sequential decision problems (i.e., later decisions are dependent on the results of earlier ones). Can solve influence diagrams efficiently by using clique trees. Can learn probabilistic relations from data.
Platform PC Possibility of indicating uncertainty of the estimate
yes, by performing a sensitivity analysis
Possibility of indicating the basis (motivation) of the estimate
no, not inside the package
Suited for a group elicitation (G), individual elicitation (I), or both (B)
B
Type of statistical analyses possible
Not really a statistical package, see output
Feedback of results during the elicitation
Yes, (changes of) effects are shown on screen
Flexibility/ possibility to fit to a specific situation
Yes
User-friendliness (score 1 – 5) 3 Anonymity in a group session No Costs/ availability 12999 DKR (= ~1746 eur)
URL http://www.hugin.com/ Manufacturer/ Host organization Positive aspects
Negative aspects

RIVM Letter report 630003001
Page 67 of 98
References Madsen, A.L., Jensen, F., Kjærulff, U.B., Lang, M., 2005. The Hugin tool for probabilistic graphical models. Int. J. Artif. Intell. Tools14 (3), 507-543.
Remarks All data given to Hugin must be previously discretized or discretized manually in the GUI dialogue, as Hugin is not capable of sorting continuous-type data into bins. Hugin can handle missing data, though data missing massively and systematically causes some problems
6.1.29 Limesurvey
Suitable for: Qualitative estimations
Short description functionality/ purpose
Online survey instrument. No limitations. Executables and source code available. Host yourself
Input (by experts) Meanings, motivations, qualitative estimates Output of the software Delivers questions in a format suited for
Internet. Several types are possible. Data acquired can be exported to text, CSV, PDF, SPSS, queXML en MS Excel format. Basic statistics and graphics can be made.
Platform Internet Possibility of indicating uncertainty of the estimate
yes
Possibility of indicating the basis (motivation) of the estimate
yes
Suited for a group elicitation (G), individual elicitation (I), or both (B)
I
Type of statistical analyses possible
Descriptive statistics
Feedback of results during the elicitation
Does not apply
Flexibility/ possibility to fit to a specific situation
Yes
User-friendliness (score 1 – 5) 3 Anonymity in a group session Yes Costs/ availability freeware
URL http://www.limesurvey.org/ Manufacturer/ Host organization http://www.limesurvey.org/ Positive aspects Quality, documentation, free, open source.
Executables and source code available. Negative aspects Host yourself (or Hosting has to be arranged)
References
Remarks

RIVM Letter report 630003001
Page 68 of 98
6.1.30 Logical Decisions 6.1
Suitable for: Qualitative estimations
Short description functionality/ purpose
Ranks different sources of risk or ranks the different scenarios to mitigate the risk.
Input (by experts) Can help to get the scores (value of a criteria) right. Can help to determine which criteria to consider and can help by assigning weights to the criteria that are considered relevant. Elicits utility functions.
Output of the software Valuetree, matrix with scores, matrix with weights, Graphics, rankings, sensitivity analysis (includes a Monte Carlo implementation)
Platform PC Possibility of indicating uncertainty of the estimate
Yes. In the sensitivity analysis the effect of uncertainty on scores and weights are studied
Possibility of indicating the basis (motivation) of the estimate
No. Usually the basis for the scores is explained in a document, maintained outside the package
Suited for a group elicitation (G), individual elicitation (I), or both (B)
B. Has a special version for groups in which all locally participating experts can provide input by means of radiotransmitters
Type of statistical analyses possible
Standardizes scores, calculates weighted summations and ranks the different alternatives
Feedback of results during the elicitation
Yes, the results of the procedure or parts of the procedure are showed on screen or can be showed on a projection screen in a group meeting
Flexibility/ possibility to fit to a specific situation
yes
User-friendliness (score 1 – 5) 4, commercial software packages designed for a 'time is money' environment
Anonymity in a group session yes Costs/ availability USD 796 or USD 3796 for the group version
URL http://www.logicaldecisions.com/ Manufacturer/ Host organization Logical Decisions Positive aspects group version
Negative aspects
References
Remarks
6.1.31 Microsoft Baynesian Network Toolkit
Suitable for: MSBNx is a component-based Windows
application for creating, assessing, and evaluating Bayesian Networks, created at Microsoft Research. The application's installation module includes complete help files and sample networks. Bayesian Networks are encoded in an

RIVM Letter report 630003001
Page 69 of 98
XML file format.
Short description functionality/ purpose
It does not support structural learning or learning the conditional probabilities from data, but model structures and conditional probabilities must be defined manually
Input (by experts) Bayesian network toolkit does not support influence diagrams, i.e. the inclusion of decision and utility variables. It does provide value-of-information analysis that helps define whether knowing a state of a certain variable would improve the expected value of a decision
Output of the software Runs on Windows OS Platform Possibility of indicating uncertainty of the estimate
no, not inside the package
Possibility of indicating the basis (motivation) of the estimate
B
Suited for a group elicitation (G), individual elicitation (I), or both (B)
Not really a statistical package, see output
Type of statistical analyses possible
Yes, (changes of) effects are shown on screen in graphs
Feedback of results during the elicitation
Yes
Flexibility/ possibility to fit to a specific situation
3
User-friendliness (score 1 – 5) No Anonymity in a group session It may be freely used for no-commercial
purposes Costs/ availability http://research.microsoft.com/en-
us/um/redmond/groups/adapt/msbnx/ URL Microsoft Manufacturer/ Host organization Positive aspects
Negative aspects
References
Remarks MSBNx is a component-based Windows application for creating, assessing, and evaluating Bayesian Networks, created at Microsoft Research. The application's installation module includes complete help files and sample networks. Bayesian Networks are encoded in an XML file format.
6.1.32 Modelrisk 3.0
Suitable for: Quantitative estimates
Short description functionality/ purpose
Modelrisk 3.0 performs risk analysis using Monte Carlo simulation to show you many possible

RIVM Letter report 630003001
Page 70 of 98
outcomes in your Microsoft Excel spreadsheet—and tells you how likely they are to occur. This means you can judge which risks to take and which ones to avoid
Input (by experts) Specification of model and distributions (priors). The software provides the possibility to define a distribution from number of statistical properties and provides a distribution drawing tool for this purpose. Moreover, a tool for forecast based on EE over a number of periods is provided
Output of the software Outcome distributions (posteriors) Platform PC Possibility of indicating uncertainty of the estimate
yes, this is characteristic of this method
Possibility of indicating the basis (motivation) of the estimate
No. Usually the basis for the estimations is explained in a document, maintained outside the package
Suited for a group elicitation (G), individual elicitation (I), or both (B)
B
Type of statistical analyses possible
Not really a statistical package. Gives descriptives of distributions
Feedback of results during the elicitation
Yes, the results of the procedure or parts of the procedure are showed on screen or can be showed on a projection screen in a group meeting
Flexibility/ possibility to fit to a specific situation
Yes
User-friendliness (score 1 – 5) 3 Anonymity in a group session No Costs/ availability £ 722 (standard), £ 989 (prof), or £ 1316 (prof
plus) URL http://www.vosesoftware.com/ Manufacturer/ Host organization Vose Software Positive aspects The makers are convinced that their product is
much better than @risk or Crystall Ball. They provide a product comparison sheet. See: http://www.vosesoftware.com/content/compare.pdf
Negative aspects
References Vose, D. (2008). Eliciting from expert opinion. In: Risk Analysis. A quantitative guide (pp.393-416). Wiley: Chichester
Remarks
6.1.33 NETICA
Suitable for: Causal web
Short description functionality/ purpose
Program implements both influence diagrams and Bayesian networks
Input (by experts) The user/experts have to define the model structure

RIVM Letter report 630003001
Page 71 of 98
Output of the software Compiles belief (Bayesian) networks into a junction tree of cliques for fast probabilistic reasoning. Utility-free sensitivity analysis (Windows version only). Can test the performance of a network using a file of cases. Netica will print out a confusion matrix, error rate, logarithmic and quadratic (Brier) scoring rule results, calibration table and surprise indexes for each node desired. Can find optimal decisions for sequential decision problems (i.e., later decisions are dependent on the results of earlier ones). Can solve influence diagrams efficiently by using clique trees. Can learn probabilistic relations from data.
Platform PC Possibility of indicating uncertainty of the estimate
Yes, a sensitivity analysis can be performed on one variable at a time
Possibility of indicating the basis (motivation) of the estimate
no, not inside the package
Suited for a group elicitation (G), individual elicitation (I), or both (B)
B
Type of statistical analyses possible
Not really a statistical package, see output
Feedback of results during the elicitation
Yes, (changes of) effects are shown on screen
Flexibility/ possibility to fit to a specific situation
Yes
User-friendliness (score 1 – 5) 3 Anonymity in a group session Does not apply Costs/ availability 285 USD (personal/educational) or 585
(commercial) URL Manufacturer/ Host organization Positive aspects
Negative aspects
References Marcot, B.G., Holthausen, R.S., Raphael, M.G., Rowland, and M. Wisdom, M., 2001. Using Bayesian Belief Networks to evaluate fish and wildlife population viability under land management alternatives from an environmental impact statement. Forest Ecol. Manage. 153, 29-42.
Remarks NETICA can allocate continuous type of data into correct bins once the bins are definedinthe network structure and does not require for the input data file to be discretized
6.1.34 Opinions-Online
Suitable for: Qualitative estimates

RIVM Letter report 630003001
Page 72 of 98
Short description functionality/ purpose
Online survey instrument. Limited options, but can provide a solution on a short term. Software and hosting controlled by provider. Preference elicitation and voting as a special feature
Input (by experts) Meanings, motivations, qualitative estimates Output of the software Results are shown in amounts, percentages and
bar charts. Results can be viewed per group and exported to excel
Platform Java-applet on Internet Possibility of indicating uncertainty of the estimate
does not apply
Possibility of indicating the basis (motivation) of the estimate
Yes
Suited for a group elicitation (G), individual elicitation (I), or both (B)
I
Type of statistical analyses possible
Does not apply
Feedback of results during the elicitation
No
Flexibility/ possibility to fit to a specific situation
Yes
User-friendliness (score 1 – 5) 3 Anonymity in a group session Does not apply Costs/ availability Free
URL http://www.decisionarium.tkk.fi/ Manufacturer/ Host organization Aalto University of Science and Technology Positive aspects
Negative aspects
References Remarks
6.1.35 Precision Tree
Suitable for: Causal web
Short description functionality/ purpose
An add-in for Microsoft Excel that allows you to build decision trees and influence diagrams directly in the spreadsheet
Input (by experts) Provide the tree or the model Output of the software The result is a tree structure with the
root on the left and various payoffs on the right. Probabilities of events occurring and payoffs for events and decisions are added to each node in the tree. In the analysis it identifies the best decision and compares it with alternative decisions. A variety of graphs and reports illustrate critical factors, probabilities of given outcomes, and more
Platform PC

RIVM Letter report 630003001
Page 73 of 98
Possibility of indicating uncertainty of the estimate
No, but the software cooperates with @risk
Possibility of indicating the basis (motivation) of the estimate
no, not inside the package
Suited for a group elicitation (G), individual elicitation (I), or both (B)
B
Type of statistical analyses possible
Not really a statistical package, see output
Feedback of results during the elicitation
Yes, (changes of) effects are shown on screen in graphs
Flexibility/ possibility to fit to a specific situation
Yes
User-friendliness (score 1 – 5) 3 Anonymity in a group session No Costs/ availability £ 645 (professional) or £ 945 (industrial).
Buying the Tools suite costs £ 1696 (professional) or £ 1995 (industrial)
URL http://www.palisade.com Manufacturer/ Host organization Palisade Software Positive aspects Part of a set decision tools (including @risk) that
cooperate with each other Negative aspects
References Remarks
6.1.36 Prime Decisions
Suitable for: Qualitative estimates
Short description functionality/ purpose
The PRIME (Preference Ratios in Multi attribute Evaluation) method admits imprecise preference statement in score elicitation and weight assessment. These statements set lineair constraints on the scores and by using lineair programming dominance structures and decision rules can be solved
Input (by experts) Imprecise scores and weights Output of the software Value tree, matrix with scores, matrix with
weights, Graphics, rankings, sensitivity analysis Platform PC Possibility of indicating uncertainty of the estimate
yes, this is characteristic of this MCDA method
Possibility of indicating the basis (motivation) of the estimate
No. Usually the basis for the scores is explained in a document, maintained outside the package
Suited for a group elicitation (G), individual elicitation (I), or both (B)
B.
Type of statistical analyses possible
Standardizes scores, calculates weighted summations and ranks the different alternatives
Feedback of results during the elicitation
Yes, the results of the procedure or parts of the procedure are showed on screen or can be

RIVM Letter report 630003001
Page 74 of 98
showed on a projection screen in a group meeting
Flexibility/ possibility to fit to a specific situation
Yes
User-friendliness (score 1 – 5) 2 Anonymity in a group session No Costs/ availability Free
URL http://www.decisionarium.tkk.fi/ Manufacturer/ Host organization Aalto University of Science and Technology Positive aspects
Negative aspects
References Salo, A. and Hämäläinen, R.P. (2001) Preference Ratios in Multi attribute Evaluation (PRIME) - Elicitation and decision procedures under incomplete information. IEEE transactions on systems, man and cybernetics, vol. 31, pp. 533-545.
Remarks
6.1.37 PROBES (part of DYNAMO)
Suitable for: Quantitative estimations
Short description functionality/ purpose
Elicitation of dynamic, time dependent, probabilities
Input (by experts) Probes uses different elicitation techniques. First it uses the likelihood method to get an initial elicitation of the experts and inconsistencies are checked. Then the expert can choose between the sample distribution method, the reference lottery or the betting method to elicit the other dynamic (time dependent) probabilities based on the initial elicitation
Output of the software A time dependent (Markov) model is translated in a PROBES model (probability distributions). Then probabilities are elicited, consistencies are checked, sensitivity analysis executed. A viewer shows the PROBES model; the probability distributions (graphs). A tutor guides and teaches the experts to use the system
Platform Internet or Windows (Java) Possibility of indicating uncertainty of the estimate
Yes
Possibility of indicating the basis (motivation) of the estimate
No
Suited for a group elicitation (G), individual elicitation (I), or both (B)
I, but when the results are communicated by means of a projector an elicitation in a group might be possible
Type of statistical analyses possible
Does not apply
RIVM Letter report 630003001
Page 75 of 98
Feedback of results during the elicitation
Yes, the priors are made in an interactive way, consistency checks and sensitivity analyses are performed
Flexibility/ possibility to fit to a specific situation
yes
User-friendliness (score 1 – 5) 3, tutor included Anonymity in a group session no Costs/ availability Not known. Contact Tze-Yun Leong
URL Manufacturer/ Host organization Tze-Yun Leong. National University of
Singapore. http://www.comp.nus.edu.sg/~leongty/Site/Research.html
Positive aspects Java
Negative aspects Not sure whether the software is still actively maintained, supported etc.
References Lau, A. H. and T. Y. Leong (1999). Probes: A framework for probabilities elicitation from experts. In Proceedings of the American Medical Informatics Association Annual Fall Symposium (AMIA): 301-305.
Remarks Designed for dynamic models
6.1.38 Pqmethod
Suitable for: Qualitative estimates
Short description functionality/ purpose
Software for the analysis of Q-sorts
Input (by experts) Attitudes, opinions, qualitative judgments Output of the software Principal component Analysis (PCA) and output
needed to distinguish groups with different opinions/attitudes
Platform PC (DOS or windows DOS-box) Possibility of indicating uncertainty of the estimate
does not apply
Possibility of indicating the basis (motivation) of the estimate
Yes, if you include among others statements that quantify a judgment
Suited for a group elicitation (G), individual elicitation (I), or both (B)
I
Type of statistical analyses possible
PCA, calculates seven centroids and performs the so-called q-analysis that calculates typical sorts for groups of experts
Feedback of results during the elicitation
Does not apply
Flexibility/ possibility to fit to a specific situation
Yes, a deck of statements has to be sorted. Content, number of statements and distribution is flexible
User-friendliness (score 1 – 5) 3 Anonymity in a group session Yes Costs/ availability Freeware

RIVM Letter report 630003001
Page 76 of 98
URL http://www.lrz.de/~schmolck/qmethod/downpqx.htm
Manufacturer/ Host organization Peter Schmolck Positive aspects
Negative aspects Still a DOS-application. Possible installation troubles are avoided by distributing a 'DOS-box' application
References Does not apply
Remarks
6.1.39 Quasta
Suitable for: Causal webs
Short description functionality/ purpose
Qualitative analysis of cognitive maps.
Input (by experts) Concepts and relationships between them. Output of the software Quasta has some unique characteristics The
most important is that it allows backward reasoning, without needing quantitative information. Apart from identifying effects of certain changes, it can also show how certain changes can be achieved, or why certain changes have occurred. It shows the consequences of those changes that could (have) contribute(d) to the observed or desired change. The regular forward reasoning and Quasta’s qualitative backward reasoning can be done simultaneously. There is the freedom to enter all types of desired, feared, expected or observed changes in the diagram.
Platform Windows Possibility of indicating uncertainty of the estimate
No
Possibility of indicating the basis (motivation) of the estimate
No
Suited for a group elicitation (G), individual elicitation (I), or both (B)
B
Type of statistical analyses possible
Not a statistical package
Feedback of results during the elicitation
yes
Flexibility/ possibility to fit to a specific situation
yes
User-friendliness (score 1 – 5) 3 Anonymity in a group session No Costs/ availability Quasta is used by Quasta, which is today a small
consulting company. The technique is described in the thesis by Frank van Kouwen.
URL http://www.quasta.nl/ Manufacturer/ Host organization See above

RIVM Letter report 630003001
Page 77 of 98
Positive aspects
Negative aspects
References Van Kouwen, F. (2007). The Quasta approach. Exploring new pathways to improve the use of knowledge in sustainability challenges. Utrecht: Copernicus Institute.
Remarks
6.1.40 RAMAS Constructor
Suitable for: Quantitative estimations
Short description functionality/ purpose
Supports the construction of probability distributions when only incomplete or uncertain information is available
Input (by experts) User supplied sample data, qualitative information about the shape of the distribution, theoretical of inferred constraints on moments, 'order statistics and 'probabilistic coverage statements'. The input can be graphical of numerical (precise numbers or interval ranges).
Output of the software Probability distributions and -boxes (boxes), Demster-Shafer structures, random sets.
Platform Windows
Possibility of indicating uncertainty of the estimate
Yes
Possibility of indicating the basis (motivation) of the estimate
No
Suited for a group elicitation (G), individual elicitation (I), or both (B)
I, but when the results are communicated by means of a projector, G might be possible
Type of statistical analyses possible
Does not apply
Feedback of results during the elicitation
Yes, the output on screen can be shown
Flexibility/ possibility to fit to a specific situation
yes
User-friendliness (score 1 – 5) 3 Anonymity in a group session No Costs/ availability Freely available (beta version) URL http://www.ramas.com/constructor.htm Manufacturer/ Host organization Made by RAMAS for the epistemic uncertainty
project by Sandia National Laboratories and the National Institutes of Health (USA). See: http://www.sandia.gov/epistemic/
Positive aspects High quality documentation and manual. Made by RAMAS, which seems to be a solid software company that has specialized on environmental and risk analysis software

RIVM Letter report 630003001
Page 78 of 98
Negative aspects References Ferson, S.J., J. Hajagos, D.S. Myers, and W.T.
Tuckker (2004). Constructor: Synthesizing Information about Uncertain Variables. Applied Biomathematics, Setauket, New York
Remarks If there is not sufficient information to determine an exact probability distribution, a complementing criterion can be used to facilitate the choice from a number of distributions. The software supplies six different criteria: maximum entropy, maximum spreading 'spanning' en several conservative criteria.
6.1.41 RAMAS Risk Calc
Suitable for: Quantitative estimations
Short description functionality/ purpose
This package can be compared with Monte Carlo like @Risk or Crystal Ball, but in Risk Calc it is not necessary to provide details about statistical distributions and dependency relations if the empirical data are lacking.
Input (by experts) Regular input of Monte Carlo analyses, but it is also possible to provide uncertainties in an alternative format such as intervals and a range with a best estimate, a range with in that the best estimate as a range, a probability distribution etc.
Output of the software Risk Calc implements the uncertainties automatically in the calculations. In this process it can use 'interval analysis', 'probabilistic arithmetic', 'fuzzy arithmetic' en 'probability bounds analysis'
Platform Windows
Possibility of indicating uncertainty of the estimate
Yes
Possibility of indicating the basis (motivation) of the estimate
No
Suited for a group elicitation (G), individual elicitation (I), or both (B)
I, but when the results are communicated by means of a projector an elicitation in a group might be possible
Type of statistical analyses possible
Comparable with regular Monte Carlo analysis
Feedback of results during the elicitation
Yes, the output on screen can be shown
Flexibility/ possibility to fit to a specific situation
yes
User-friendliness (score 1 – 5) 3 Anonymity in a group session Does not apply Costs/ availability 1200 USD
URL http://www.ramas.com

RIVM Letter report 630003001
Page 79 of 98
Manufacturer/ Host organization RAMAS Positive aspects See RAMAS constructor and very flexible
Negative aspects Uses techniques that are not well-known and accepted.
References Ferson, S. (2002). RAMAS Risk Calc 4.0 Software: Risk Assessment with Uncertain Numbers. Lewis Publishers, Boca Raton, Florida
6.1.42 Rich-Decisions
Suitable for: Qualitative estimates
Short description functionality/ purpose
The RICH-method (Rank Inclusion in Criteria Hierarchies) is designed to find the best alternative when only incomplete rank order of the attributes is available. E.g. 'speed is the most, or the second most important attribute' or 'speed and cost are the two least important attributes'.
Input (by experts) Can help to get the scores (value of a criteria) right. Can help to determine which criteria to consider and can help by assigning weights to the criteria that are considered relevant. Elicits utility functions.
Output of the software Valuetree, matrix with scores, matrix with weights, Graphics, rankings, sensitivity analysis
Platform Internet Possibility of indicating uncertainty of the estimate
Yes. In the sensitivity analysis the effect of uncertainty on scores and weights are studied.
Possibility of indicating the basis (motivation) of the estimate
No. Usually the basis for the scores is explained in a document, maintained outside the package
Suited for a group elicitation (G), individual elicitation (I), or both (B)
B.
Type of statistical analyses possible
Standardizes scores, calculates weighted summations and ranks the different alternatives
Feedback of results during the elicitation
Yes, the results of the procedure or parts of the procedure are showed on screen or can be showed on a projection screen in a group meeting
Flexibility/ possibility to fit to a specific situation
Yes
User-friendliness (score 1 – 5) 2 Anonymity in a group session No Costs/ availability Free
URL http://www.decisionarium.tkk.fi/ Manufacturer/ Host organization Aalto University of Science and Technology Positive aspects
Negative aspects Not suited for hierarchical value trees. Limited to eight attributes
References Remarks

RIVM Letter report 630003001
Page 80 of 98
6.1.43 RiskSim
Suitable for: Quantitative estimates
Short description functionality/ purpose
Risksim performs risk analysis using Monte Carlo simulation to show you many possible outcomes in your Microsoft Excel spreadsheet—and tells you how likely they are to occur. This means you can judge which risks to take and which ones to avoid
Input (by experts) Specification of model and distributions (priors). Output of the software Outcomes and outcome distributions Platform PC Possibility of indicating uncertainty of the estimate
yes, this is characteristic of this method
Possibility of indicating the basis (motivation) of the estimate
No. Usually the basis for the estimations is explained in a document, maintained outside the package
Suited for a group elicitation (G), individual elicitation (I), or both (B)
B
Type of statistical analyses possible
Not really a statistical package, see output
Feedback of results during the elicitation
Yes, the results of the procedure or parts of the procedure are showed on screen or can be showed on a projection screen in a group meeting
Flexibility/ possibility to fit to a specific situation
yes
User-friendliness (score 1 – 5) 3 Anonymity in a group session no Costs/ availability 59 USD or 159 USD for the three add-inns
together (decision toolkit) URL http://www.treeplan.com or
http://www.decisiontoolworks.com/ Manufacturer/ Host organization Decision Toolworks, Mike Middleton Positive aspects Part of a set decision tools that cooperate with
each other Negative aspects
References Remarks
6.1.44 SamIam (Sensitivity analysis, modelling Interference, and more)
Suitable for: Causal web
Short description functionality/ purpose
Software for building Baynesians networks
Input (by experts) User/experts have to define the model structure Output of the software SamIam reads and writes Hugin, Netica, Ergo,
GeNIe and Microsoft BN toolkit network file formats and Hugin-type data files. It provides

RIVM Letter report 630003001
Page 81 of 98
EM learning but no structural learning, so the user has to define the model structure. SamIam provides sensitivity analysis different to that one implemented in Netica. It allows the user to set constraints to certain parameters and identifies the minimal changes that are required in the network to satisfy these constraints. This kind of sensitivity analysis can be very useful in building systems that are intended to mimic experts' reasoning and help people in diagnosing and decision-making
Platform PC Possibility of indicating uncertainty of the estimate
yes, by performing a sensitivity analysis
Possibility of indicating the basis (motivation) of the estimate
no, not inside the package
Suited for a group elicitation (G), individual elicitation (I), or both (B)
B
Type of statistical analyses possible
Not really a statistical package, see output
Feedback of results during the elicitation
Yes, (changes of) effects are shown on screen
Flexibility/ possibility to fit to a specific situation
Yes
User-friendliness (score 1 – 5) 3 Anonymity in a group session No Costs/ availability Freeware
URL http://reasoning.cs.ucla.edu/samiam/ Manufacturer/ Host organization Automated reasoning group, University of
California LA Positive aspects Algorithms are well documented in the help files
Negative aspects
References Chan, H., Darwiche, A., 2002. When do numbers really matter? J.
Remarks
6.1.45 SensIt
Suitable for: Causal web
Short description functionality/ purpose
SensIt performs sensitivity analysis on your Excel worksheet model, creates simple plots, spider charts, and tornado charts.
Input (by experts) Does not apply Output of the software Identifies critical factors in your model Platform PC Possibility of indicating uncertainty of the estimate
Yes, but only limited. Uncertainty is elaborated in Risksim's Monte Carlo analysis

RIVM Letter report 630003001
Page 82 of 98
Possibility of indicating the basis (motivation) of the estimate
no, not inside the package
Suited for a group elicitation (G), individual elicitation (I), or both (B)
B
Type of statistical analyses possible
Not really a statistical package, see output
Feedback of results during the elicitation
Yes, (changes of) effects are shown on screen in graphs
Flexibility/ possibility to fit to a specific situation
Yes
User-friendliness (score 1 – 5) 3 Anonymity in a group session No Costs/ availability 60 USD or 159 USD for the three add-inns
together (decision toolkit) URL http://www.treeplan.com or
http://www.decisiontoolworks.com/ Manufacturer/ Host organization Decision Toolworks, Mike Middleton Positive aspects Part of a set decision tools that cooperate with
each other Negative aspects
References
Remarks
6.1.46 SHELF 2.0 (beta)
Suitable for: Quantitative estimations
Short description functionality/ purpose
Package of functions in R that is explicitly meant to be used in an expert elicitation.
Input (by experts) The function has to be addressed correctly and subsequently the characteristics of the distribution have to be provided. Graphical assistance (probability wheel etc. will be provided)
Output of the software Univariate probability distributions following the quartile (bisection) method, probability (fixed interval) method and the trial roulette method
Platform R and Internet Possibility of indicating uncertainty of the estimate
yes
Possibility of indicating the basis (motivation) of the estimate
no
Suited for a group elicitation (G), individual elicitation (I), or both (B)
B. Different functions for group sessions and single experts are provided.
Type of statistical analyses possible
The possibilities of the R package are available.
Feedback of results during the elicitation
Yes, plots of the results can be made
Flexibility/ possibility to fit to a specific situation
yes

RIVM Letter report 630003001
Page 83 of 98
User-friendliness (score 1 – 5) 2. The R-code has to be 'sourced'. Subsequently the functions have to be addressed and used (filled out) correctly. This prerequisites a thorough understanding of the subject
Anonymity in a group session no Costs/ availability Free and open source
URL http://tonyohagan.co.uk/shelf/ and http://elicitator.uncertweb.org/ for the webversion
Manufacturer/ Host organization Tony O'Hagan. University of Sheffield and Positive aspects Specifically meant for EE. Part of BEEP
http://www.shef.ac.uk/beep/ Negative aspects
References O' Hagan, A., Buck, C. E., Daneshkhah, A., Eiser, J. E., Garthwaite, P. H., Jenkinson, D. J., Oakley, J. E. and Rakow, T. (2006). Uncertain Judgements: Eliciting Expert Probabilities. John Wiley and Sons
Remarks Good academic basis
6.1.47 Simlab
Suitable for: Quantitative estimates
Short description functionality/ purpose
Simlab is a development framework for uncertainty and sensitivity analysis. Simlab has no Graphical User Interface and has to be used within Matlab or a Fortran or C/C++ compiler
Input (by experts) Specification of model and distributions (priors). T
Output of the software Outcome distributions (posteriors) Platform C/C++ or Fortran compilers. Matlab Possibility of indicating uncertainty of the estimate
yes, this is characteristic of this method
Possibility of indicating the basis (motivation) of the estimate
No. Usually the basis for the estimations is explained in a document, maintained outside the package
Suited for a group elicitation (G), individual elicitation (I), or both (B)
B
Type of statistical analyses possible
Lots, as it is integrated with Matlab
Feedback of results during the elicitation
Yes, the results of the procedure or parts of the procedure are showed on screen or can be showed on a projection screen in a group meeting
Flexibility/ possibility to fit to a specific situation
Yes
User-friendliness (score 1 – 5) 2, applied mathematics. Anonymity in a group session No Costs/ availability Free
URL http://simlab.jrc.ec.europa.eu/docs/html/index.html

RIVM Letter report 630003001
Page 84 of 98
Manufacturer/ Host organization Positive aspects
Negative aspects
References Sensitivity Analysis in practice - Saltelli Tarantola Campolongo Ratto - Wiley
Remarks
6.1.48 SL Gallery
Suitable for: Other
Short description functionality/ purpose
Creates graphs en calculates distributions: Cumulative Distribution Function (CDF), Probability Density Function (PDF), Survival Function, Hazard function
Input (by experts) The type of distribution, the mean and the standard deviation has to be provided.
Output of the software Graphics and primary descriptive statistics, calculations of quantiles and function values.
Platform Windows Possibility of indicating uncertainty of the estimate
no
Possibility of indicating the basis (motivation) of the estimate
no
Suited for a group elicitation (G), individual elicitation (I), or both (B)
I, but when the results are communicated by means of a projector an elicitation in a group might be possible
Type of statistical analyses possible
Feedback of results during the elicitation
Yes, the output created can be used in a group session
Flexibility/ possibility to fit to a specific situation
yes
User-friendliness (score 1 – 5) 4 Anonymity in a group session Costs/ availability Freeware
URL http://www.stochastic-lab.com/slgallery.html Manufacturer/ Host organization Stochastic Lab Positive aspects
Negative aspects
References
Remarks
6.1.49 Smart speed connect
Suitable for: Quantitative and qualitative estimates
Short description functionality/ purpose
Electronic meeting software, installed on own server or as a webapplication
Input (by experts) Ideas, knowledge
RIVM Letter report 630003001
Page 85 of 98
Output of the software Provides tools for brainstorming, categorizing, prioritizing, voting, surveys and action planning
Platform Internet Possibility of indicating uncertainty of the estimate
yes
Possibility of indicating the basis (motivation) of the estimate
yes
Suited for a group elicitation (G), individual elicitation (I), or both (B)
G
Type of statistical analyses possible
Does not apply
Feedback of results during the elicitation
yes
Flexibility/ possibility to fit to a specific situation
yes
User-friendliness (score 1 – 5) 3 Anonymity in a group session Might be possible Costs/ availability € 49.95 per month (flat fee) or 499,50 per year
(flat fee) URL www.smartspeed.com Manufacturer/ Host organization smartSpeed GmbH & Co. KG Positive aspects
Negative aspects
References Remarks
6.1.50 Survey Monkey
Suitable for: Qualitative estimations
Short description functionality/ purpose
Online survey instrument
Input (by experts) Meanings, motivations, qualitative estimates Output of the software Delivers questions in a format suited for
Internet. Several types are possible. Data acquired can be exported to text, CSV, PDF, SPSS, queXML en MS Excel format. Basic statistics and graphics can be made.
Platform Internet Possibility of indicating uncertainty of the estimate
yes
Possibility of indicating the basis (motivation) of the estimate
yes
Suited for a group elicitation (G), individual elicitation (I), or both (B)
I
Type of statistical analyses possible
Descriptive statistics
Feedback of results during the elicitation
Does not apply

RIVM Letter report 630003001
Page 86 of 98
Flexibility/ possibility to fit to a specific situation
yes
User-friendliness (score 1 – 5) 4 Anonymity in a group session Does not apply Costs/ availability Free, but limited features
URL http://nl.surveymonkey.com/ Manufacturer/ Host organization Surveymonkey Positive aspects Fast
Negative aspects Limited features
References
Remarks Software and hosting controlled by provider.
6.1.51 Thinktank 3.2
Suitable for: Quantitative and qualitative estimates
Short description functionality/ purpose
Electronic meeting software, installed on own server or as a webapplication (Thinkspace)
Input (by experts) Ideas, knowledge Output of the software Provides tools for brainstorming, categorizing,
prioritizing, voting, surveys and action planning Platform Internet Possibility of indicating uncertainty of the estimate
yes
Possibility of indicating the basis (motivation) of the estimate
yes
Suited for a group elicitation (G), individual elicitation (I), or both (B)
G
Type of statistical analyses possible
Does not apply
Feedback of results during the elicitation
yes
Flexibility/ possibility to fit to a specific situation
yes
User-friendliness (score 1 – 5) 3 Anonymity in a group session Might be possible Costs/ availability Not on the website (on demand)
URL http://www.groupsystems.com Manufacturer/ Host organization GroupSystems Positive aspects
Negative aspects
References Remarks
6.1.52 TreeAge Pro Suite (Excel, Healthcare)
Suitable for: Causal web

RIVM Letter report 630003001
Page 87 of 98
Short description functionality/ purpose
Creates decision trees, influence diagrams, Markov models (available in the TreeAge Pro Healthcare module) and multi-attribute models.
Input (by experts) Provide the tree or the model Output of the software Sensitivity analysis (1-, 2-, and 3-way analysis
as well as tornado diagrams), Monte Carlo simulation, Bayes' revision, threshold analysis, enhanced utility functions to measure risk aversion, expected monetary value, expected value of perfect information or certainty equivalent calculations, eighteen built-in sampling distributions and customizable distributions, complete decision tree rollback information, single and comparative probability distribution graphs, financial, arithmetic, statistical, conditional and logical functions, strategy graphs displayed in presentation-quality output
Platform PC Possibility of indicating uncertainty of the estimate
yes, by performing a sensitivity analysis
Possibility of indicating the basis (motivation) of the estimate
no, not inside the package
Suited for a group elicitation (G), individual elicitation (I), or both (B)
B
Type of statistical analyses possible
Not really a statistical package, see output
Feedback of results during the elicitation
Yes, (changes of) effects are shown on screen in graphs
Flexibility/ possibility to fit to a specific situation
Yes
User-friendliness (score 1 – 5) 3, The suite comes with Tree age Excel, which garantees a tight integration with this popular spreadsheet
Anonymity in a group session No Costs/ availability 1425 USD for the whole suite (non profit and
government perpetual license) URL http://www.treeage.com Manufacturer/ Host organization Treeage Software, Inc. Positive aspects The Healthcare module is designed to meet the
special needs of professionals and students in healthcare, health services research, and pharmacoeconomics.
Negative aspects
References
Remarks
6.1.53 Treeplan
Suitable for: Causal web

RIVM Letter report 630003001
Page 88 of 98
Short description functionality/ purpose
Helps you build a decision tree diagram in an Excel worksheet using dialog boxes.
Input (by experts) Provide the tree Output of the software The result is a tree structure with the root on
the left and various payoffs on the right. Probabilities of events occurring and payoffs for events and decisions are added to each node in the tree
Platform PC Possibility of indicating uncertainty of the estimate
No, but the software cooperates with SensIt (Sensitivity analysis) and Risksim (Monte Carlo analysis)
Possibility of indicating the basis (motivation) of the estimate
no, not inside the package
Suited for a group elicitation (G), individual elicitation (I), or both (B)
B
Type of statistical analyses possible
Not really a statistical package, see output
Feedback of results during the elicitation
Yes, (changes of) effects are shown on screen in graphs
Flexibility/ possibility to fit to a specific situation
Yes
User-friendliness (score 1 – 5) 3 Anonymity in a group session No Costs/ availability 59 USD or 159 USD for the three add-inns
together (decision toolkit) URL http://www.treeplan.com or
http://www.decisiontoolworks.com/ Manufacturer/ Host organization Decision Toolworks, Mike Middleton Positive aspects Part of a set decision tools that cooperate with
each other Negative aspects
References Remarks
6.1.54 Unibalance
Suitable for: Quantitative estimates
Short description functionality/ purpose
Unibalance is a program that models preferences / values / utilities of a group of experts or stakeholders. It takes paired comparison input from E experts / stakeholders and calculates scale values for the N objects compared according to three models: 1) Bradley Terry /Negative Exponential Life (NEL) model; 2) Thurstone models B and C; 3) Probabilistic Inversion Models based in Iterative Proportional Fitting (IPF) and PARFUM
Input (by experts) Preferences, paired comparisons Output of the software Scale values according to the three models

RIVM Letter report 630003001
Page 89 of 98
Platform Windows Possibility of indicating uncertainty of the estimate
Yes
Possibility of indicating the basis (motivation) of the estimate
no, not inside the package
Suited for a group elicitation (G), individual elicitation (I), or both (B)
Yes
Type of statistical analyses possible
Not really a statistical package, see output
Feedback of results during the elicitation
No
Flexibility/ possibility to fit to a specific situation
Yes
User-friendliness (score 1 – 5) 2, applied mathematics. Anonymity in a group session Might be possible Costs/ availability Freeware
URL http://ssor.twi.tudelft.nl/~risk/index.php?option=com_content&view=category&id=3&Itemid=5
Manufacturer/ Host organization TU Delft, Risk and Environmental modelling group
Positive aspects
Negative aspects
References Remarks
6.1.55 Unicorn (Uncertainty Analysis with Correlations)
Suitable for:
Short description functionality/ purpose
Package for uncertainty analysis, like @Risk and Crystal Ball. However, these packages do not support features such as multiple copula, vine modelling, cobweb plots, iterated and conditional sampling and probabilistic inversion.
Input (by experts) Uncertain estimates of the levels of a risk/hazard in different phases of a process.
Output of the software Calculates outcomes and transfer coefficients. Uses a procedure called ‘probabilistic inversion’ to do this job.
Platform Windows Possibility of indicating uncertainty of the estimate
Yes
Possibility of indicating the basis (motivation) of the estimate
no, not inside the package
Suited for a group elicitation (G), individual elicitation (I), or both (B)
B
Type of statistical analyses possible
Not really a statistical package, see output
Feedback of results during the elicitation
No

RIVM Letter report 630003001
Page 90 of 98
Flexibility/ possibility to fit to a specific situation
Yes
User-friendliness (score 1 – 5) 2, applied mathematics. Anonymity in a group session Does not apply Costs/ availability The so-called 'Light-version' can be used for free
URL http://dutiosc.twi.tudelft.nl/~risk/index.php?option=com_content&view=article&id=3:unicorn&catid=3:software-info&Itemid=5
Manufacturer/ Host organization TU Delft, Risk and Environmental modelling group
Positive aspects Possibility of inferring transfer coefficients; dependency elicitation
Negative aspects
References Kurowicka, D. and R.M. Cooke (2006). Uncertainty Analysis with High Dimensional Dependence Modelling. Wiley
Remarks
6.1.56 Unigraphics
Suitable for: Quantitative estimates
Short description functionality/ purpose
Satellite program for Unibalance, Uninet and Excalibur. Generates graphics
Input (by experts) see functionality Output of the software Generates Graphics. It includes standard
graphics features and more exotic features like cobweb plots, cobweb conditionalization/ optimization and rubber axes for scatter plots.
Platform Windows Possibility of indicating uncertainty of the estimate
Yes
Possibility of indicating the basis (motivation) of the estimate
no, not inside the package
Suited for a group elicitation (G), individual elicitation (I), or both (B)
Yes
Type of statistical analyses possible
Not really a statistical package, see output
Feedback of results during the elicitation
No
Flexibility/ possibility to fit to a specific situation
User-friendliness (score 1 – 5) 2, applied mathematics. Anonymity in a group session Does not apply Costs/ availability Freeware
URL http://ssor.twi.tudelft.nl/~risk/index.php?option=com_content&view=category&id=3&Itemid=5
Manufacturer/ Host organization
TU Delft, Risk and Environmental modelling group

RIVM Letter report 630003001
Page 91 of 98
Positive aspects
Negative aspects
References Remarks
6.1.57 Uninet
Suitable for: Quantitative estimates
Short description functionality/ purpose
UNINET is a stand alone program using Bayesian Belief Nets (BBNs) for stochastic modelling and for multivariate ordinal data mining
Input (by experts) Model structure Output of the software Platform Windows Possibility of indicating uncertainty of the estimate
Yes
Possibility of indicating the basis (motivation) of the estimate
no, not inside the package
Suited for a group elicitation (G), individual elicitation (I), or both (B)
Yes
Type of statistical analyses possible
Not really a statistical package, see output
Feedback of results during the elicitation
No
Flexibility/ possibility to fit to a specific situation
User-friendliness (score 1 – 5) 2, applied mathematics. Anonymity in a group session Might be possible Costs/ availability Freeware
URL http://ssor.twi.tudelft.nl/~risk/index.php?option=com_content&view=category&id=3&Itemid=5
Manufacturer/ Host organization TU Delft, Risk and Environmental modelling group
Positive aspects
Negative aspects
References Hanea, A.M., Kurowicka, D. and Cooke, R.M. " Hybrid Method for Quantifying and Analyzing Bayesian Belief Nets" (2006) Quality and Reliability Engineering International 22,709-729, 2006.
Remarks
6.1.58 Unisense
Suitable for: Quantitative estimates
Short description functionality/ purpose
Satellite program for Unibalance, Uninet and Excalibur.
Input (by experts) see functionality

RIVM Letter report 630003001
Page 92 of 98
Output of the software Performs sensitivity analyses Platform Windows Possibility of indicating uncertainty of the estimate
Yes
Possibility of indicating the basis (motivation) of the estimate
no, not inside the package
Suited for a group elicitation (G), individual elicitation (I), or both (B)
Yes
Type of statistical analyses possible
Not really a statistical package, see output
Feedback of results during the elicitation
No
Flexibility/ possibility to fit to a specific situation
User-friendliness (score 1 – 5) 2, applied mathematics. Anonymity in a group session Does not apply Costs/ availability Freeware
URL http://ssor.twi.tudelft.nl/~risk/index.php?option=com_content&view=category&id=3&Itemid=5
Manufacturer/ Host organization
TU Delft, Risk and Environmental modelling group
Positive aspects
Negative aspects
References Remarks
6.1.59 Vanguard System
Suitable for: Causal web
Short description functionality/ purpose
A software system that is designed to support collaborative modelling (over the web) in enterprises
Input (by experts) Data and model structures Output of the software Collaborative Modeling, Web-based Reporting,
Monte Carlo Simulation, Forecasting, Optimization, Sensitivity Analysis, Decision Trees, Web Services, Grid Computing, Spreadsheet Integration, Risk Management, Cost Modelling, Knowledge Capture, Portfolio Optimization, Enterprise Simulation
Platform Internet, Intranet Possibility of indicating uncertainty of the estimate
Yes, sensitivity analyses can be performed
Possibility of indicating the basis (motivation) of the estimate
yes, supports collaboration, argumentation, communication
Suited for a group elicitation (G), individual elicitation (I), or both (B)
G
Type of statistical analyses Not really a statistical package, see output

RIVM Letter report 630003001
Page 93 of 98
possible Feedback of results during the elicitation
Yes, (changes of) effects are shown on screen
Flexibility/ possibility to fit to a specific situation
Yes
User-friendliness (score 1 – 5) 3 Anonymity in a group session Might be possible Costs/ availability On demand
URL http://www.vanguardsw.com Manufacturer/ Host organization Vanguard Sofware Corporation Positive aspects
Negative aspects
References
Remarks
6.1.60 Vanguard Decision Tree Suite
Suitable for: Causal web
Short description functionality/ purpose
Part of the Vanguard System that provides decision tree analysis and Markov simulation
Input (by experts) Knowlegde about relations Output of the software Decision tree analysis and Markov simulation Platform PC Possibility of indicating uncertainty of the estimate
Yes, sensitivity analyses can be performed
Possibility of indicating the basis (motivation) of the estimate
no, not inside the package
Suited for a group elicitation (G), individual elicitation (I), or both (B)
B
Type of statistical analyses possible
Not really a statistical package, see output
Feedback of results during the elicitation
Yes, (changes of) effects are shown on screen
Flexibility/ possibility to fit to a specific situation
Yes
User-friendliness (score 1 – 5) 3 Anonymity in a group session No Costs/ availability 895 USD
URL http://www.vanguardsw.com Manufacturer/ Host organization Vanguard Sofware Corporation Positive aspects
Negative aspects
References
Remarks

RIVM Letter report 630003001
Page 94 of 98
6.1.61 V.I.S.A.
Suitable for: Qualitative estimations
Short description functionality/ purpose
Ranks different sources of risk or ranks the different scenarios to mitigate the risk.
Input (by experts) Can help to get the scores (value of a criteria) right. Can help to determine which criteria to consider and can help by assigning weights to the criteria that are considered relevant. Elicits utility functions.
Output of the software Valuetree, matrix with scores, matrix with weights, Graphics, rankings, sensitivity analysis
Platform PC en Internet Possibility of indicating uncertainty of the estimate
Yes. In the sensitivity analysis the effect of uncertainty on scores and weights are studied. Characteristic for VISA is that he effects are showed visually
Possibility of indicating the basis (motivation) of the estimate
No. Usually the basis for the scores is explained in a document, maintained outside the package
Suited for a group elicitation (G), individual elicitation (I), or both (B)
B. Has a version in which experts can participate over the Internet
Type of statistical analyses possible
Standardizes scores, calculates weighted summations and ranks the different alternatives
Feedback of results during the elicitation
Yes, the results of the procedure or parts of the procedure are showed on screen or can be showed on a projection screen in a group meeting
Flexibility/ possibility to fit to a specific situation
yes
User-friendliness (score 1 – 5) 4, commercial software packages designed for a 'time is money' environment
Anonymity in a group session yes Costs/ availability URL Manufacturer/ Host organization Positive aspects Negative aspects References
Remarks 6.1.62 Web-Hipre
Suitable for: Qualitative estimates
Short description functionality/ purpose
Web-HIPRE is a Java applet for multiple criteria decision analysis. Being located on the internet it can be accessed from everywhere in the world
Input (by experts) Can help to get the scores (value of a criteria)

RIVM Letter report 630003001
Page 95 of 98
right. Can help to determine which criteria to consider and can help by assigning weights to the criteria that are considered relevant. Elicits utility functions.
Output of the software Web-HIPRE provides a common platform for individual and group decision making. The models can be processed at the same or at different times and the results can be easily shared and combined. There is a possibility to define links to other internet addresses. These links can refer to any other kind of information such as graphics, sound or video describing the criteria or alternatives. This can improve the quality of decision support dramatically. The most common weighting methods including AHP, SMART, SWING, SMARTER and value functions are supported.
Platform Internet Possibility of indicating uncertainty of the estimate
yes, by performing a sensitivity analysis
Possibility of indicating the basis (motivation) of the estimate
no, not inside the package
Suited for a group elicitation (G), individual elicitation (I), or both (B)
B, Web-Hipre supports the construction of a group model
Type of statistical analyses possible
Not really a statistical package, see output
Feedback of results during the elicitation
Yes
Flexibility/ possibility to fit to a specific situation
Yes
User-friendliness (score 1 – 5) 3 Anonymity in a group session No Costs/ availability Free
URL http://www.decisionarium.tkk.fi/ Manufacturer/ Host organization Aalto University of Science and Technology Positive aspects
Negative aspects
References J. Mustajoki and R.P.Hämäläinen: Web-HIPRE: Global decision support by value tree and AHP analysis INFOR, Vol. 38, no. 3, Aug. 2000, pp. 208-220.
Remarks
6.1.63 Web Q
Suitable for: Qualitative estimates
Short description functionality/ purpose
Software that supports Q-sorting over the Internet. Analysis by Pqmethod
Input (by experts) Attitudes, opinions, qualitative judgments Output of the software Collects the data, the sorts, by experts and

RIVM Letter report 630003001
Page 96 of 98
writes it to a file that can be used by Pqmethod or another statistical package
Platform Internet (html) Possibility of indicating uncertainty of the estimate
does not apply
Possibility of indicating the basis (motivation) of the estimate
Yes, if you include among others statements that quantify a judgment
Suited for a group elicitation (G), individual elicitation (I), or both (B)
I
Type of statistical analyses possible
Does not apply
Feedback of results during the elicitation
Does not apply
Flexibility/ possibility to fit to a specific situation
Yes, a deck of statements has to be sorted. Content, number of statements and distribution is flexible
User-friendliness (score 1 – 5) 4 Anonymity in a group session Yes Costs/ availability Freeware
URL http://www.lrz.de/~schmolck/qmethod/webq/ Manufacturer/ Host organization Peter Schmolck Positive aspects
Negative aspects Is an 'Old School' Internet application
References
Remarks
6.1.64 Win Pre
Suitable for: Qualitative estimates
Short description functionality/ purpose
Supports the PAIRS (Preference Assessment by Imprecise Ratio Statements)-method that admits imprecise preference statements in weight assessment and the use of score intervals
Input (by experts) Imprecise scores and weights Output of the software Value tree, matrix with scores, matrix with
weights, Graphics, rankings, sensitivity analysis Platform PC Possibility of indicating uncertainty of the estimate
yes, this is characteristic of this mcda method
Possibility of indicating the basis (motivation) of the estimate
No. Usually the basis for the scores is explained in a document, maintained outside the package
Suited for a group elicitation (G), individual elicitation (I), or both (B)
B.
Type of statistical analyses possible
Standardizes scores, calculates weighted summmations and ranks the different alternatives
Feedback of results during the Yes, the results of the procedure or parts of the

RIVM Letter report 630003001
Page 97 of 98
elicitation procedure are showed on screen or can be showed on a projection screen in a group meeting
Flexibility/ possibility to fit to a specific situation
Yes
User-friendliness (score 1 – 5) 2 Anonymity in a group session No Costs/ availability Free
URL http://www.decisionarium.tkk.fi/ Manufacturer/ Host organization Aalto University of Science and Technology Positive aspects
Negative aspects
References Salo, A. and Hämäläinen, R.P. (1992). Preference assessment by imprecise ratio statements. Operations Research, vol 40, pp. 1053-1061
Remarks
6.1.65 Ynsyte WebIQ
Suitable for: Quantitative and qualitative estimates
Short description functionality/ purpose
Web meeting software, owned and maintained by the software company
Input (by experts) Ideas, knowledge Output of the software Provides tools for brainstorming, categorizing,
prioritizing, voting, surveys and action planning Platform Internet Possibility of indicating uncertainty of the estimate
yes
Possibility of indicating the basis (motivation) of the estimate
yes
Suited for a group elicitation (G), individual elicitation (I), or both (B)
G
Type of statistical analyses possible
Does not apply
Feedback of results during the elicitation
yes
Flexibility/ possibility to fit to a specific situation
yes
User-friendliness (score 1 – 5) 3 Anonymity in a group session Might be possible Costs/ availability Not on the website (on demand)
URL http://www.webiq.net Manufacturer/ Host organization ynSyte Positive aspects
Negative aspects
References Remarks

RIVM Letter report 630003001
Page 98 of 98

National Institute for Public Healthand the Environment P.O. Box 1 | 3720 BA Bilthovenwww.rivm.com
Software to support expert elicitationAn exploratory study of existing software packages
RIVM Letter Report 630003001/2011 J.L.A. Devilee | A.B. Knol