sohail j. malik - food consumption patterns and nutrition
Upload: international-food-policy-research-institute-development-strategy-and-governance-division
Post on 17-Jul-2015
57 views
TRANSCRIPT

Food Consumption Patterns and Nutrition
Sohail J. Malik
Hina Nazli
Asma Shahzad
Amina Mehmood
April 15, 2015

Plan of Presentation
• Food security and Consumption Patterns
• Food prices and cost of calories
• Nutritional status and hidden hunger • women
• children
• Determinants of malnutrition in Children
• Policy implications and Recommendation
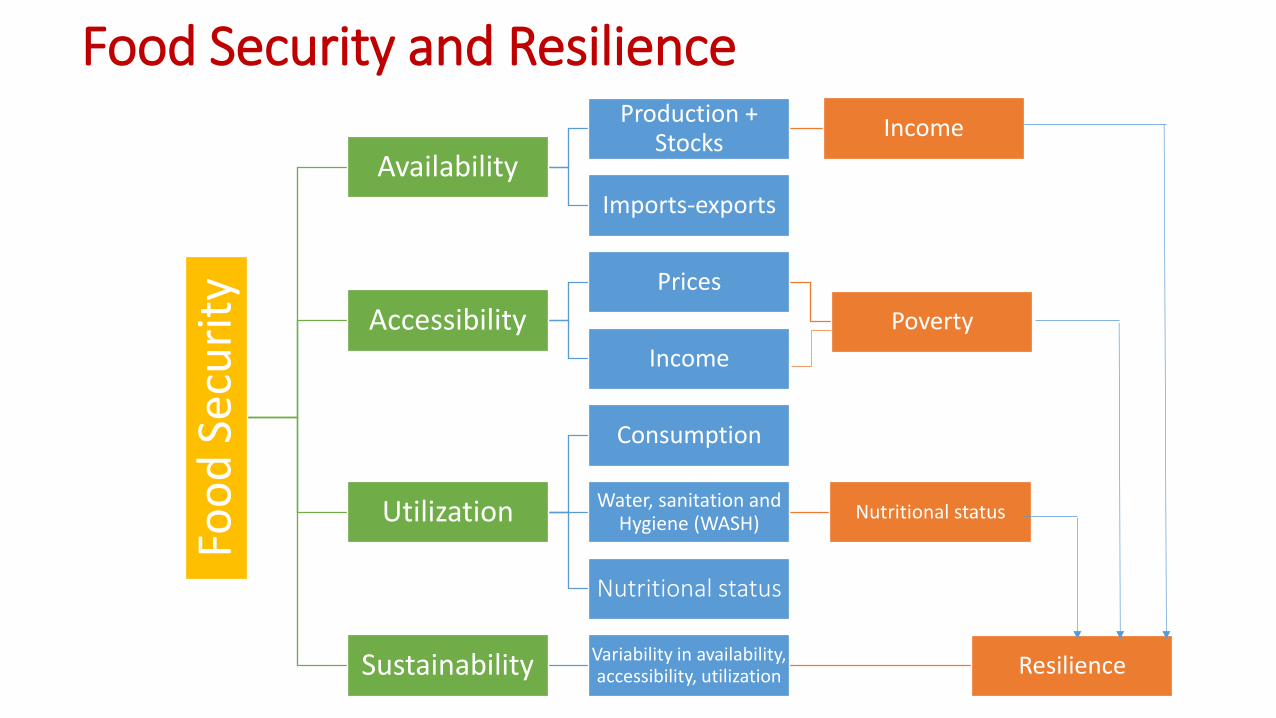
Food Security and Resilience
Foo
d S
ecu
rity
Availability
Production + Stocks
Income
Imports-exports
Accessibility Prices
Poverty
Income
Utilization
Consumption
Water, sanitation and Hygiene (WASH)
Nutritional status
Nutritional status
Sustainability Variability in availability, accessibility, utilization Resilience

Per capita availability (kg/annum) declining or stagnant
0
20
40
60
80
100
120
140
160
2004-05 2005-06 2006-07 2007-08 2008-09 2009-10 2010-11 2011-12
Per capita availability (kg/annum) of Wheat and Milk
Wheat Milk
0
5
10
15
20
25
2004-05 2005-06 2006-07 2007-08 2008-09 2009-10 2010-11 2011-12
Per capita availability (kg/annum) of Other Food Items
Rice Pulses Edible oil/ghee Meat
Source: GoP (2013). Agriculture Statistics of Pakistan 2011-12
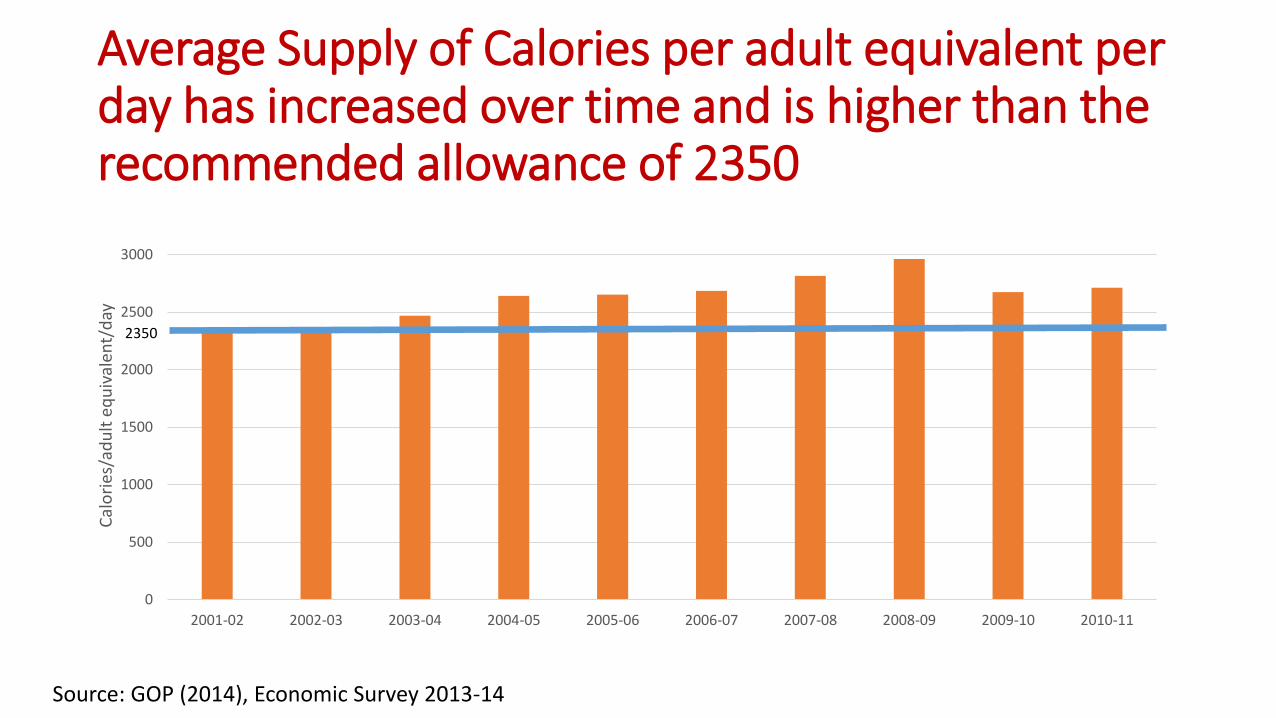
Average Supply of Calories per adult equivalent per day has increased over time and is higher than the recommended allowance of 2350
Source: GOP (2014), Economic Survey 2013-14
0
500
1000
1500
2000
2500
3000
2001-02 2002-03 2003-04 2004-05 2005-06 2006-07 2007-08 2008-09 2009-10 2010-11
Cal
ori
es/a
du
lt e
qu
ival
ent/
day
2350
Food Accessibility in Pakistan

Decreasing ability to access: Kilograms of Wheat Flour that one Day’s Wages can Buy declining
0
5
10
15
20
25
30
35
2006 2007 2008 2009 2010 2011 2012
Kilo
gram
s o
f Fl
ou
r p
er d
aily
wag
e (K
gs)
Skilled Isamabad
Skilled Karachi
Skilled Lahore
Unskilled Islamabad
Unskilled Karachi
Unskilled Lahore
Source: GOP (2014), Economic Survey 2013-14
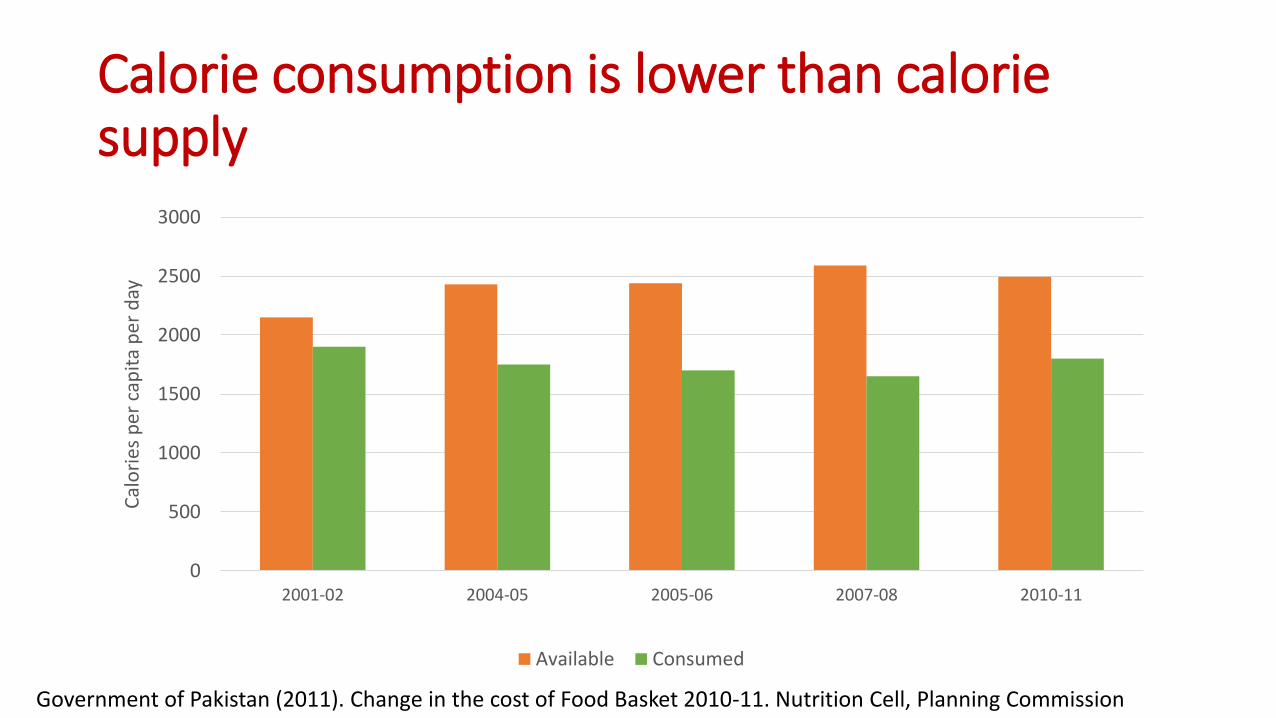
Calorie consumption is lower than calorie supply
0
500
1000
1500
2000
2500
3000
2001-02 2004-05 2005-06 2007-08 2010-11
Cal
ori
es p
er c
apit
a p
er d
ay
Available Consumed
Government of Pakistan (2011). Change in the cost of Food Basket 2010-11. Nutrition Cell, Planning Commission
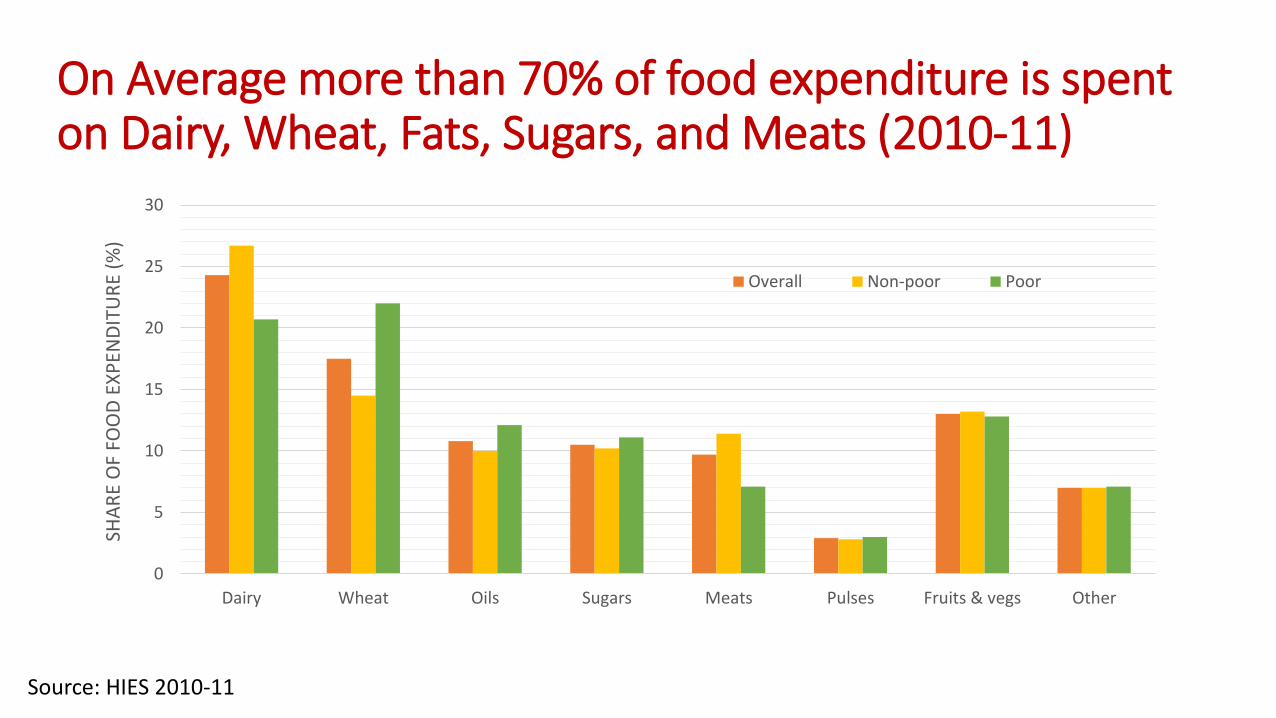
On Average more than 70% of food expenditure is spent on Dairy, Wheat, Fats, Sugars, and Meats (2010-11)
Source: HIES 2010-11
0
5
10
15
20
25
30
Dairy Wheat Oils Sugars Meats Pulses Fruits & vegs Other
SHA
RE
OF
FOO
D E
XP
END
ITU
RE
(%)
Overall Non-poor Poor

Differences in the Consumption Patterns of Agricultural and Non-agricultural households (Rural Pakistan 2010-11)
Source: HIES 2010-11
0
2
4
6
8
10
12
Milk Wheat Fruits &vegetables
Sugar Rice Fats Meat Pulses
kg/c
apit
a/m
on
th
Agricultural households Non-agricultural households

Share of Food expenditure of Poor Households is High and Food Expenditures are Rising
0
10
20
30
40
50
60
70
2001-02 2004-05 2005-06 2007-08 2010-11
% h
ou
seh
old
s
Botton quintile Highest quintile
Source: HIES (various issues)

Poor Spend more on wheat and non-poor on Dairy (2010-11)
0
5
10
15
20
25
30
Dairy Wheat Oils Sugars Meats
SHA
RE
OF
FOO
D E
XP
END
ITU
RE
(%)
Pakistan
Non-poor Poor
0
5
10
15
20
25
30
Dairy Wheat Oils Sugars Meats
SHA
RE
OF
FOO
D E
XP
END
ITU
RE
(%)
Urban areas
Non-poor Poor
0
5
10
15
20
25
30
Dairy Wheat Oils Sugars Meats
SHA
RE
OF
FOO
D E
XP
END
ITU
RE
(%)
Rural areas
Non-poor Poor
Source: HIES 2010-11

Limited Dietary Diversity in Rural Pakistan: (% households reporting type of food items consumed in last 24 hours – PSSP 2014)
Source: RHPS (2014)
0 1 2 3 4 5 6 7
Wheat flour
Spices, condiments
Ghee/butter/oil
Sugar
Dairy products
Tomato, onion, egg plant etc.
Roots and tubers (potatoes, turnip)
Pulses
Vitamin A-rich vegetables
Rice
Vitamin A-rich fruits
Eggs
Poultry
Dark green leafy vegetables
Fresh meat
Other fruits
Other cereals
% households

Wheat is the major source of energy
0
10
20
30
40
50
60
Wheat Oils Dairy Sugars Meats
% S
HA
RE
IN T
OTA
L C
ALO
RIE
S
Overall Non-Poor Poor
Source: HIES 2010-11

Trends in the Prices of Food Items
0
20
40
60
80
100
120
140
Wheat flour Basmati rice Moong Sugar Milk
Rs/
kg
2000-01 2004-05 2009-10 2013-14
Source: GOP (2014), Economic Survey 2013-14
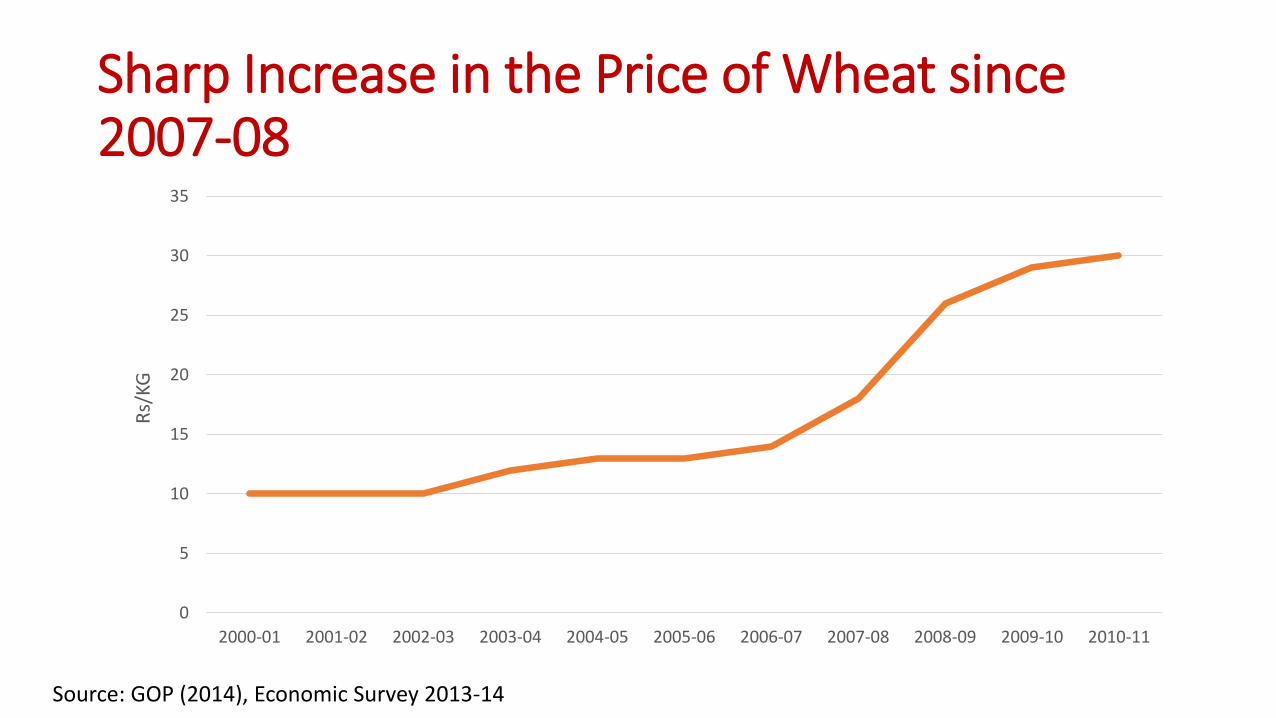
Sharp Increase in the Price of Wheat since 2007-08
0
5
10
15
20
25
30
35
2000-01 2001-02 2002-03 2003-04 2004-05 2005-06 2006-07 2007-08 2008-09 2009-10 2010-11
Rs/
KG
Source: GOP (2014), Economic Survey 2013-14

Calories consumed and the cost of calories (2010-11)
Source: HIES 2010-11
0.0
1.0
2.0
3.0
4.0
5.0
6.0
100 Calories cost Overall Food excluding wheat (Rs) 100 Calories cost Wheat (Rs)
Rs/
10
0 c
alo
ries
Rural Poor Rural Non-Poor Urban Poor Urban Non-Poor

Econometric Estimates indicate that Increase in Wheat Price has possible adverse implications for other essential Human Development Indicators
• An increase in the price of wheat may not result in substitution with other food items (low own and cross price elasticity)
substitution with non-food items is possible
• A substitution with health and education may worsen the already low human development indicators
adverse effect on already high levels of poverty in the country
• Serious implications especially for current nutritional status and productivity of future generation
• A further reduction in the purchasing power of the wage earners can aggravate this situation further
Source: Authors estimates using HIES 2010-11 data and applying LA-AIDS model

Dietary patterns impact on nutritional status
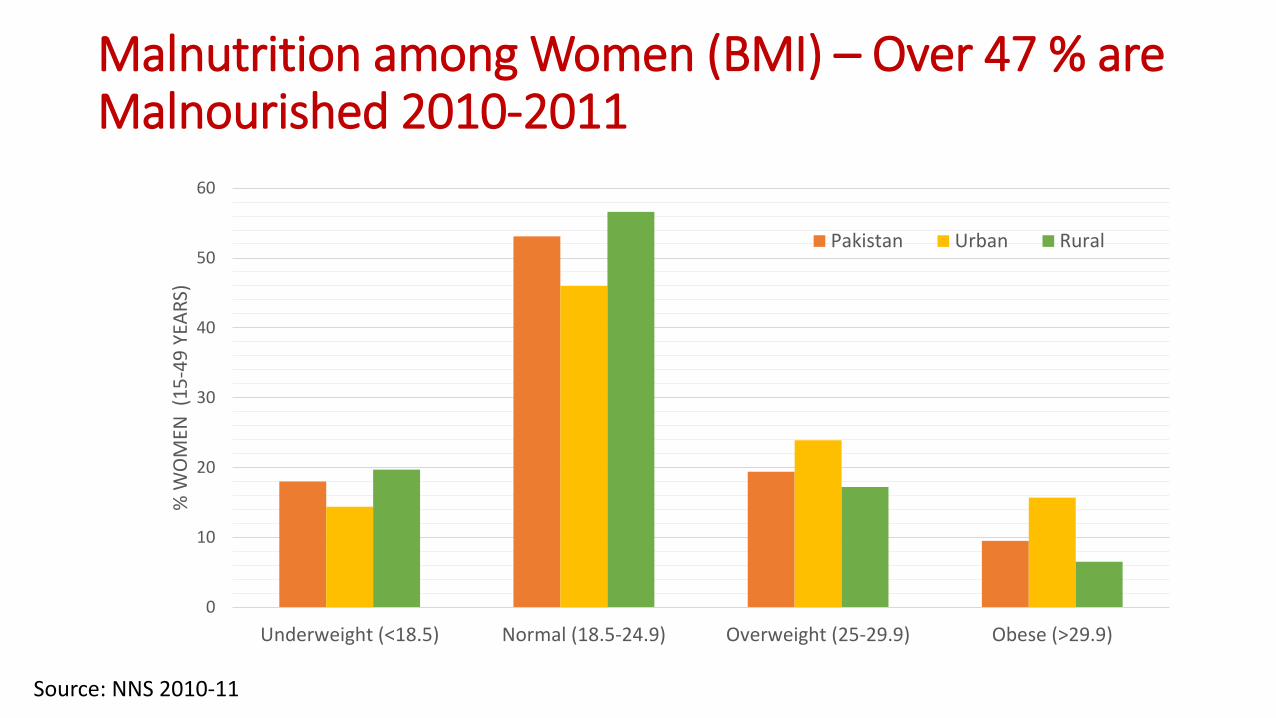
Malnutrition among Women (BMI) – Over 47 % are Malnourished 2010-2011
0
10
20
30
40
50
60
Underweight (<18.5) Normal (18.5-24.9) Overweight (25-29.9) Obese (>29.9)
% W
OM
EN (
15
-49
YEA
RS)
Pakistan Urban Rural
Source: NNS 2010-11

Hidden Hunger: Micronutrient Deficiency among Women (2001-2011)
0
10
20
30
40
50
60
Prevalence of Anemia Vitamin A Deficiency Zinc Deficiency%
WO
MEN
(1
5-4
9 Y
EAR
S)
Pakistan
2001 2011
0
10
20
30
40
50
60
Prevalence of Anemia Vitamin A Deficiency Zinc Deficiency
% W
OM
EN (
15
-49
YEA
RS)
Urban areas
2001 2011
0
10
20
30
40
50
60
Prevalence of Anemia Vitamin A Deficiency Zinc Deficiency%
WO
MEN
(1
5-4
9 Y
EAR
S)
Rural areas 2001 2011
Source: NNS (2001; 2010-11)
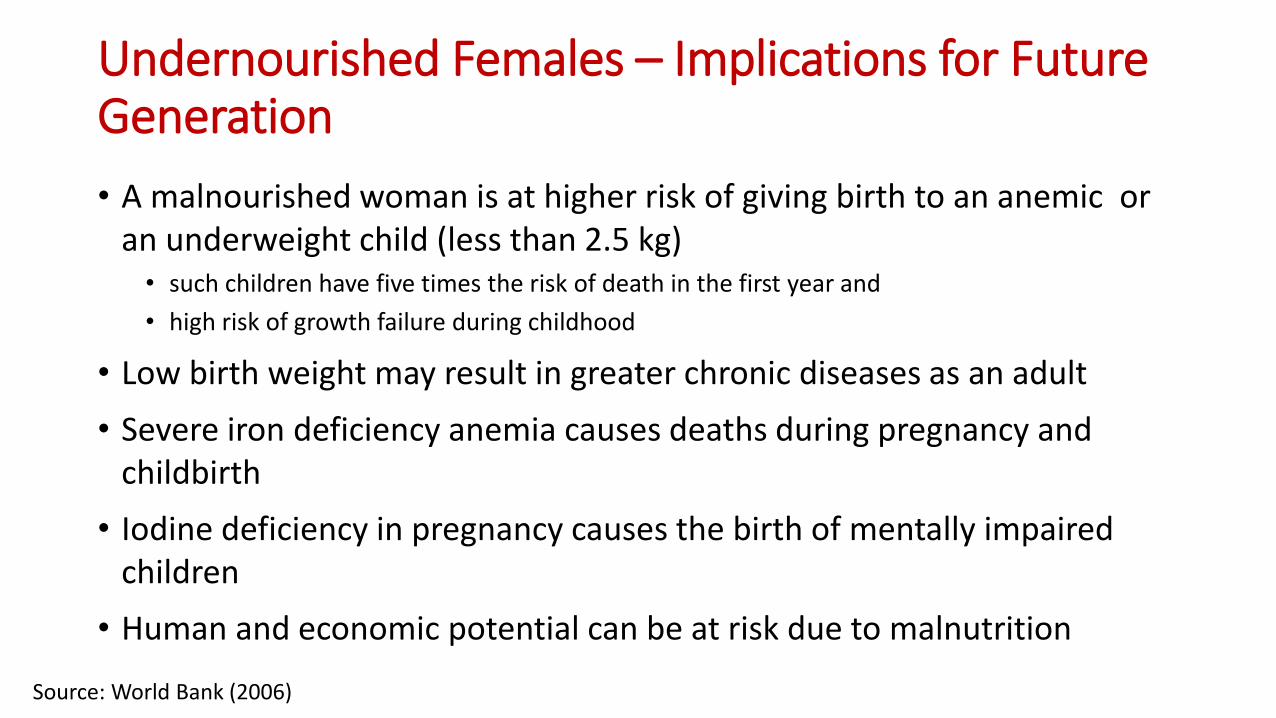
Undernourished Females – Implications for Future Generation
• A malnourished woman is at higher risk of giving birth to an anemic or an underweight child (less than 2.5 kg) • such children have five times the risk of death in the first year and
• high risk of growth failure during childhood
• Low birth weight may result in greater chronic diseases as an adult
• Severe iron deficiency anemia causes deaths during pregnancy and childbirth
• Iodine deficiency in pregnancy causes the birth of mentally impaired children
• Human and economic potential can be at risk due to malnutrition
Source: World Bank (2006)

Pakistan: Child malnutrition Results in • Child mortality
• Low birth-weight babies (31.6% of live births in 2007) rank 3rd highest in 183 countries
• Under five mortality rate (86 per 1000 live births, 2008-2012) ranks 26 out of 194 countries
• Infant mortality rate (74 per 1000 live births, 2008-2012) • Neonatal mortality rate (55 per 1000 live births, 2008-2012)
• Disability • About 2.65 % population was disabled in 2012 (based on the projections on 1998
Census), 2.54% was in 1998 • Of these, 43% are children (1-15 years) • Of total disabled, 8.2% are blind, 7.5% deaf, 14% mentally retarded, 8.3% have
multiple disabilities
• Probability of falling sick, loss in work days and income
Source: PDHS 2012-13 Source: UNICEF, State of the World's Children, Childinfo, and Demographic and Health Surveys by ICF International Source: Helping Hands for Relief and Development (2012). Persons with Disabilities (PWDs) Statistics in Pakistan 2012
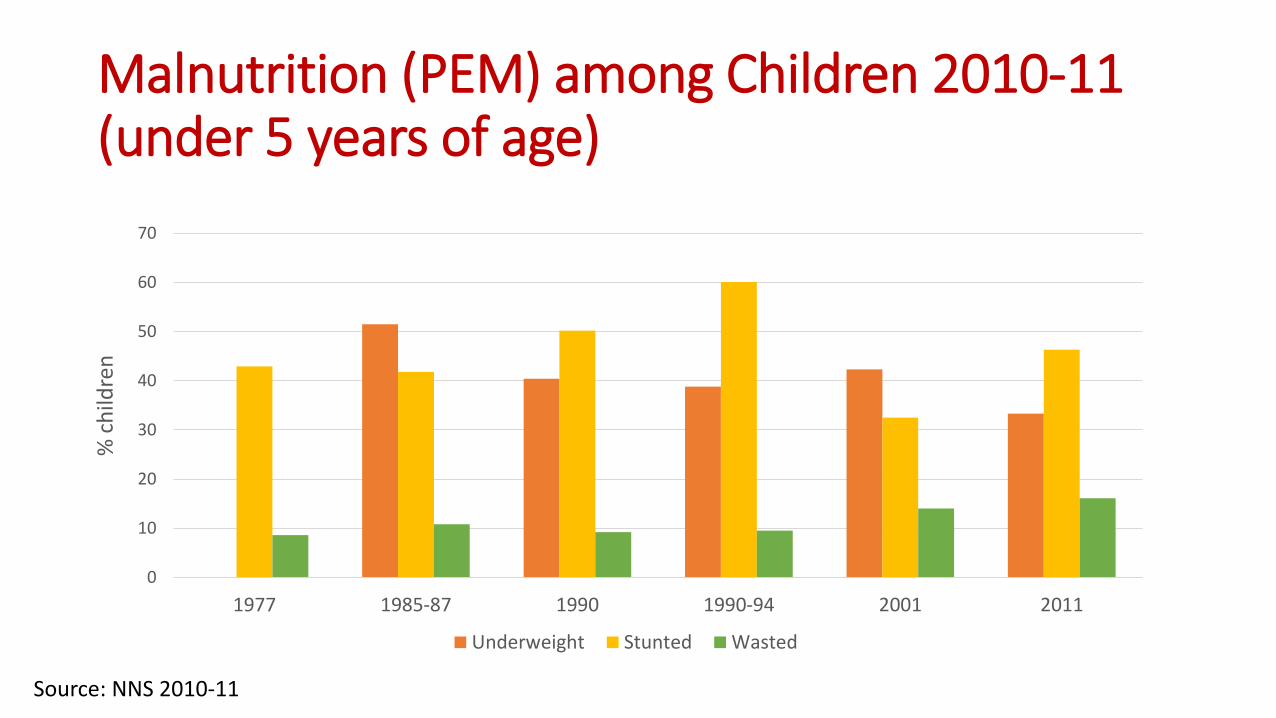
Malnutrition (PEM) among Children 2010-11 (under 5 years of age)
0
10
20
30
40
50
60
70
1977 1985-87 1990 1990-94 2001 2011
% c
hild
ren
Underweight Stunted Wasted
Source: NNS 2010-11

How reliable are the data? Variations in the estimated malnutrition indicators based on different national surveys for the same year 2001
0
10
20
30
40
50
60
70
Underweight Stunted Wasted
% c
hild
ren
National Nutrition Survey 2001 Pakistan Socio-Economic Survey 2001 Pakistan Rural Household Survey 2001
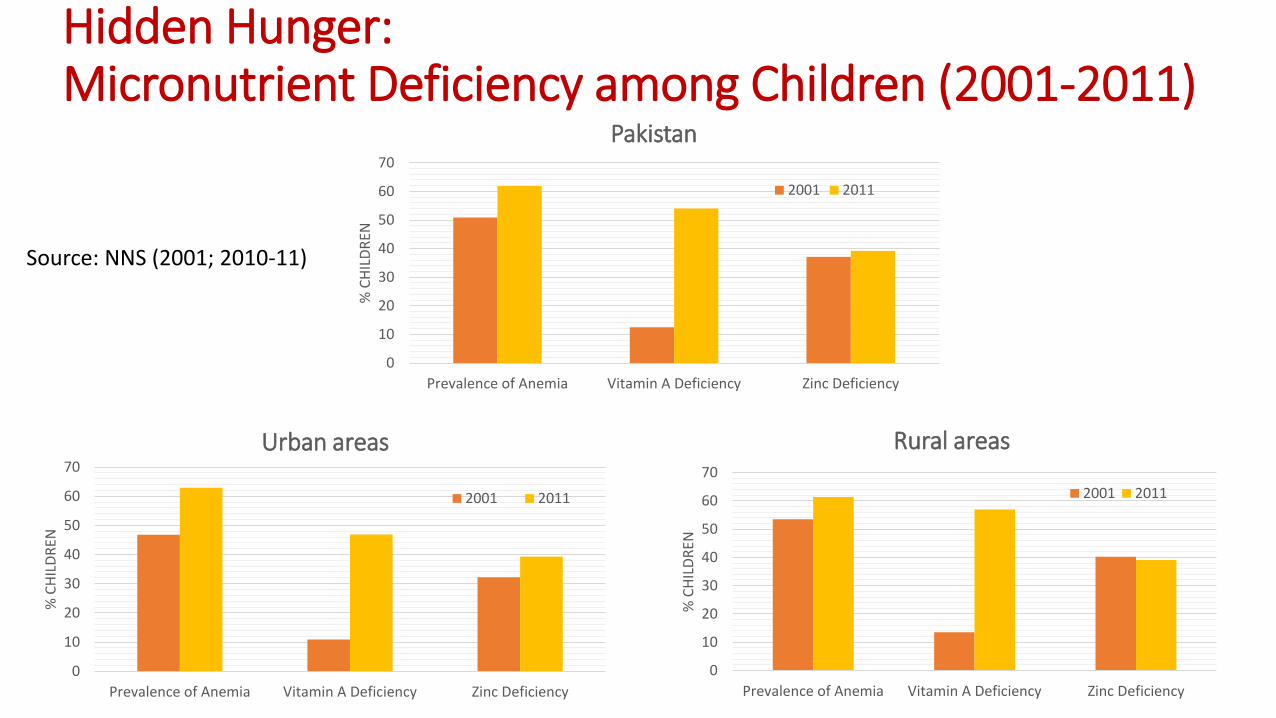
Hidden Hunger: Micronutrient Deficiency among Children (2001-2011)
0
10
20
30
40
50
60
70
Prevalence of Anemia Vitamin A Deficiency Zinc Deficiency%
CH
ILD
REN
Pakistan
2001 2011
0
10
20
30
40
50
60
70
Prevalence of Anemia Vitamin A Deficiency Zinc Deficiency
% C
HIL
DR
EN
Urban areas
2001 2011
0
10
20
30
40
50
60
70
Prevalence of Anemia Vitamin A Deficiency Zinc Deficiency%
CH
ILD
REN
Rural areas
2001 2011
Source: NNS (2001; 2010-11)

Low Levels of Mothers’ Knowledge about Child Nutrition
23.59 25.59
14.06
0
5
10
15
20
25
30
Iron deficiency Iodine Rich Food Drinking Water Treatment
Pe
rce
nta
ge
Source: RHPS (2012)
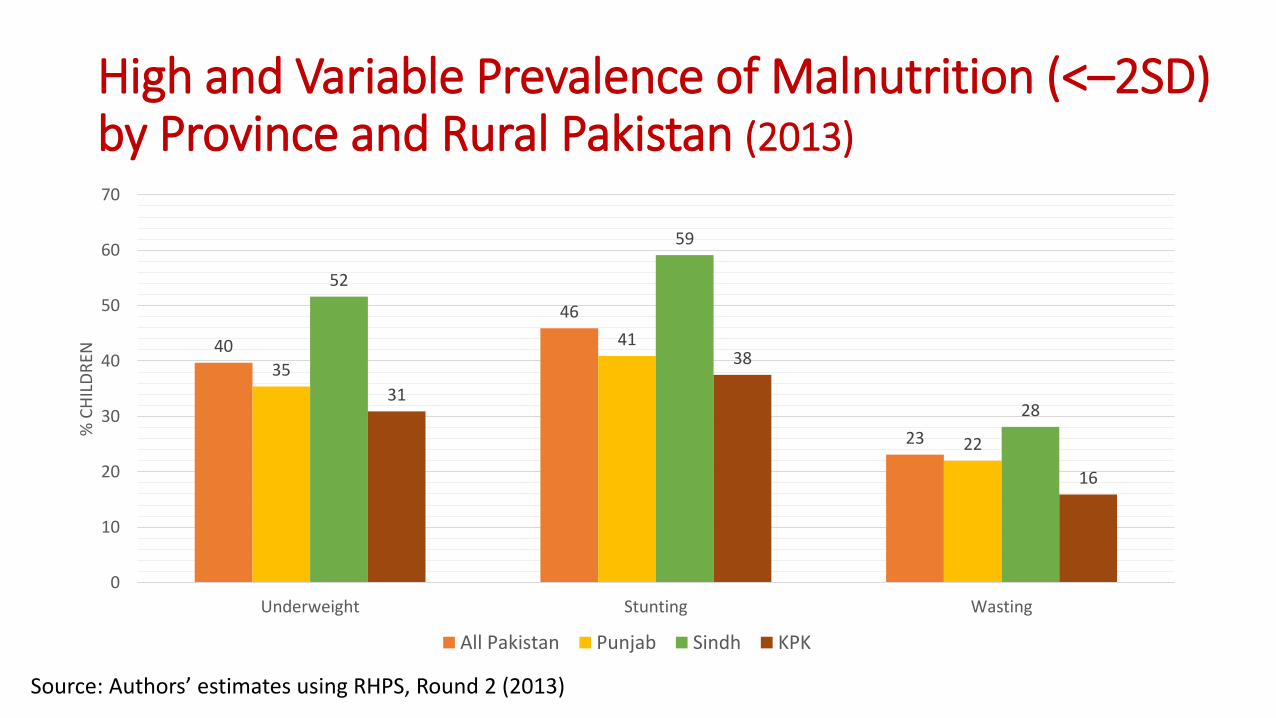
High and Variable Prevalence of Malnutrition (<–2SD) by Province and Rural Pakistan (2013)
40
46
23
35
41
22
52
59
28 31
38
16
0
10
20
30
40
50
60
70
Underweight Stunting Wasting
% C
HIL
DR
EN
All Pakistan Punjab Sindh KPK
Source: Authors’ estimates using RHPS, Round 2 (2013)

Determinants of Malnutrition: Results of Logistic Regression
• Mother’s education improves the general state of nutrition among children under five
• Improving hygienic conditions appear important to reduce long term malnutrition (toilet facility and safe drinking water)
• Access to health care services plays a significant role in reducing the short-term nutrition (LHW)
• Incidence of malnutrition among children under five is highest in Sindh
• The prevalence of malnutrition is high across all income groups
• Poverty and malnutrition are determined by the same variables
• Nutritional status is a more direct measure of household welfare
Source: Authors’ estimates using RHPS, Round 2 (2013)
Summing up
• High prevalence of malnutrition in the country: • Poverty - Lack of resources at the household level to maintain the minimum daily
allowance of essential nutrients;
• limited diversification because cost of non wheat calories significantly higher
• Lack of awareness about balanced diet and maintaining good health
• Focus of previous research on estimating numbers only
• Food Security not fully understood or integrated into policies • Little work on understanding the linkages between food security, consumption
behavior and nutritional outcomes and variations across socio-economic groups and regions
• Need re-prioritization and evaluation of any previous policies and programs

Summing up • The consumption of micronutrient rich foods is very low (vegetables and
fruits)
• Average calorie consumption is lower than the recommended level of
2350 and unbalanced in terms of micro-nutrients
• Wheat is the main source of calories, carbohydrate and fiber
• Food policy to date focused on availability of wheat tonnage through
production and import. Little diversification away from four major crops.
• Lesser focus on accessibility, sustainability and safety.
• Wheat consumption is price inelastic (implications for dietary diversity and
household expenditures on education, health care, etc.)
Results Indicate the Need for:
• Massive nutrition awareness campaigns and education
• Provision of safe drinking water
• Improvement in sanitation facilities
• Expansion in health care coverage (e.g., lady health workers)
• Promotion of kitchen gardens
• Food fortification and bio-fortification
• Special attention to the mother’s nutritional status through proper medical care, adequate food, and iron, folic acid, and multivitamin supplementation

Recent Global Initiatives to address Malnutrition
• Global Alliance for Improved Nutrition (GAIN) (2002)
• United Nation’s Millennium Development Goals • First goal “eradicate extreme poverty and hunger.” Undernourishment and malnutrition are
amongst the indicators for this goal
• United Nation’s Sustainable Development Goals (2012) • Replacement of MDGs
• United Nation’s zero hunger challenge (2012) • Elimination of stunting is the first goal
• United Nation’s Scaling up nutrition (SUN) movement (2009)
• The First 1000 Days Initiative
• The Copenhagen Consensus 2012

Recent Nutrition Initiatives in Pakistan
• National Zero Hunger Program, launched in 2012
• Pakistan’s draft Agriculture and Food Security Policy 2013 aims to address
the food and nutrition insecurities
• Pakistan Integrated Nutrition Strategy (PINS), launched in 2013, aims to
address the underlying causes of malnutrition (food diversification, WASH,
school feeding, etc.)
• Scaling Up Nutrition (SUN) program, launched in 2013, aims to identify the
hurdles in access to food and address the issue of malnutrition
Needed Steps
• Improve identification of malnourished population based on scientific method
• Sustained political commitment and government ownership
• Institutional and sectoral coordination and collaboration
• Sufficient resource allocation to strengthen implementation • Massive awareness campaigns • Enhancing zero hunger program, PINS, SUN • Ensuring synergies - no overlaps
• Monitoring and evaluation system to improve real-time program implementation and effectiveness

Thank you so much