soil carbon dioxide and methane fluxes from long-term tillage
TRANSCRIPT
Soil carbon dioxide and methane fluxes from long-term tillage
systems in continuous corn and corn–soybean rotations
Rex A. Omonode a, Tony J. Vyn a,*, Doug R. Smith b, Peter Hegymegi c, Anita Gal c
a Department of Agronomy, Purdue University, 915 W. State Street, West Lafayette, IN 47907, USAb National Soil Erosion Research Laboratory, USDA Agricultural Research Service, West Lafayette, IN 47907, USA
c Szent Istvan University, Godollo 2103, Pater K. u. 1., Hungary
Received 21 April 2006; received in revised form 18 October 2006; accepted 26 December 2006
www.elsevier.com/locate/still
Soil & Tillage Research 95 (2007) 182–195
Abstract
Although the Midwestern United States is one of the world’s major agricultural production areas, few studies have assessed the
effects of the region’s predominant tillage and rotation practices on greenhouse gas emissions from the soil surface. Our objectives
were to (a) assess short-term chisel (CP) and moldboard plow (MP) effects on soil CO2 and CH4 fluxes relative to no-till (NT) and,
(b) determine how tillage and rotation interactions affect seasonal gas emissions in continuous corn and corn–soybean rotations on a
poorly drained Chalmers silty clay loam (Typic Endoaquoll) in Indiana. The field experiment itself began in 1975. Short-term gas
emissions were measured immediately before, and at increasing hourly intervals following primary tillage in the fall of 2004, and
after secondary tillage in the spring of 2005, for up to 168 h. To quantify treatment effects on seasonal emissions, gas fluxes were
measured at weekly or biweekly intervals for up to 14 sampling dates in the growing season for corn. Both CO2 and CH4 emissions
were significantly affected by tillage but not by rotation in the short-term following tillage, and by rotation during the growing
season. Soil temperature and moisture conditions in the surface 10 cm were significantly related to CO2 emissions, although the
proportion of variation explained by temperature and moisture was generally very low (never exceeded 27%) and varied with the
tillage system being measured. In the short-term, CO2 emissions were significantly higher for CP than MP and NT. Similarly, mean
seasonal CO2 emissions during the 2-year period were higher for CP (6.2 Mg CO2-C ha�1 year�1) than for MP (5.9 Mg CO2-
C ha�1 year�1) and NT (5.7 Mg CO2-C ha�1 year�1). Both CP and MP resulted in low net CH4 uptake (7.6 and 2.4 kg CH4-
C ha�1 year�1, respectively) while NT resulted in net emissions of 7.7 kg CH4-C ha�1 year�1. Mean emissions of CO2 were 16%
higher from continuous corn than from rotation corn during the two growing seasons. After 3 decades of consistent tillage and crop
rotation management for corn and soybean producing grain yields well above average in the Midwest, continuous NT production in
the corn–soybean rotation was identified as the system with the least soil-derived C emissions to the atmosphere from among those
evaluated prior to and during corn production.
# 2007 Elsevier B.V. All rights reserved.
Keywords: Carbon dioxide emission; Continuous corn; Methane flux; Soil organic carbon; Rotation corn; Chisel plow; Moldboard plow; No-till
* Corresponding author. Tel.: +1 765 496 3757;
fax: +1 765 496 2926.
E-mail address: [email protected] (T.J. Vyn).
0167-1987/$ – see front matter # 2007 Elsevier B.V. All rights reserved.
doi:10.1016/j.still.2006.12.004
1. Introduction
Soil management practices are one of the major
factors that can influence the soil–atmosphere exchange
of greenhouse gases which contribute to global climate
change (IPCC, 1996). Measurements of soil gas fluxes
for different tillage treatments and cropping systems

R.A. Omonode et al. / Soil & Tillage Research 95 (2007) 182–195 183
are, therefore, important for identifying management
practices that can positively impact carbon (C) balance
(Post et al., 1990; Reicosky et al., 1997) and greenhouse
gas (GHG) emission. However, the magnitude and
accuracy of determination of gas emission vary spatially
(Rochette et al., 1991; Lessard et al., 1994) and gas
emission itself is affected by such factors as seasonal
climatic conditions (Mosier et al., 1996; Kessavalou
et al., 1998), air and soil temperature (Parkin and
Kasper, 2003), sampling frequency (Dugas, 1993;
Parkin and Kaspar, 2004), and cropping systems (Drury
et al., 2004). As a result of this extensive variability in C
sequestration and emissions associated with changes in
agricultural practices, the need to evaluate both short-
and long-term emissions that are eco-region or soil-
specific have been emphasized (Izaurralde et al., 2000;
West and Marland, 2002).
Short-term effects of tillage and cropping systems on
gas exchange between soil and atmosphere have been
documented, albeit with varying results. In short-term
experiments, Reicosky and Lindstrom (1993) and
Reicosky (1997) reported greater CO2 emissions for
MP relative to CP and NT treatments in Minnesota. In
Texas, Reicosky et al. (1997) found CO2 emissions were
greater for MP relative to CP and NT, and under
bermudagrass compared to continuous sorghum. In
more recent studies in Minnesota and Iowa, respec-
tively, Al-Kaisi and Yin (2005) and Reicosky et al.
(2005) found a relatively higher CO2 emission for soils
under MP than CP, strip- and deep-ripped, or NT
systems in continuous corn and corn–soybean rotation
systems. In contrast, La Scala et al. (2006) found that
CO2 emissions were about equal for CP and MP shortly
after tillage, but that CO2 emissions with CP declined,
relative to MP, from days 2 to 27 after tillage. Similarly,
in simulation studies Jacinthe et al. (2002a) found
higher CO2 emission for NT relative to CP and MP due
to greater quantity of mineralizable organic carbon in
no-till soils.
Relatively few studies have been conducted to
evaluate long-term effects of tillage and rotation
systems on greenhouse gas emissions. Curtin et al.
(2000) found that CO2 emission with NT was
significantly less than for moldboard tillage, although
tillage system differences were higher under continuous
wheat than in wheat–fallow systems. Similarly, Dao
(1998) reported a significantly lower CO2 flux for NT
than for MP, and that gas flux almost doubled within 60
days when crop residues were buried with MP. In a 3-
year study where emission was measured all year round,
Kessavalou et al. (1998) found higher CO2 emission in
native grasses (sod) relative to wheat–fallow rotation, as
well as higher annual emission for MP relative to NT.
Similarly, in a 2-year study involving measurements in
multiple weeks, Bauer et al. (2006) reported a lower
CO2 emission for NT relative to conventional tillage
(disc harrow followed by S-tined harrow smoothing).
Although methane (CH4) has about 21 times the
global warming potential of CO2, and agriculture is
believed to be responsible for about 27% of total CH4
emission in the USA (Jawson et al., 2005), very few
studies have involved field crop management impacts
on CH4. The majority of plant-based research efforts
regarding CH4 have been in forest soils (Castro et al.,
1994; Goldman et al., 1995), in grasslands and their
transition to cropland (Mosier et al., 1991), or in forests
relative to croplands (Jacinthe and Lal, 2004). Tillage
intensity can affect a range of biochemical properties
but there is considerable uncertainty with regard to the
impact of soil management practices on CH4 uptake in
agro-ecological systems (Jacinthe and Lal, 2005).
Results from several studies suggest that cultivation
may reduce CH4 oxidation capacity of soils (Mosier
et al., 1991; Bronson and Mosier, 1993; Lessard et al.,
1994). In the Great Plains, Bronson et al. (1992) and
Bronson and Mosier (1993) reported a 90% reduction in
CH4 oxidation capacity of tilled and irrigated soils
under wheat and corn relative to native grassland soils.
Kessavalou et al. (1998) found CH4 uptake was highest
in the spring, and for NT fallow relative to plowed
winter wheat–fallow rotation. Similarly, Ball et al.
(1999) indicated that CH4 oxidation rate was highest for
NT relative to MP treatments.
In the Midwestern USA where the corn–soybean
rotation is the dominant cropping system (followed by
continuous corn), NT accounts for more than 22% of
production from all cropland area, and conventional
tillage systems are used on more than 35% of cropland
area (CTIC, 2004). Historically, the majority of the
Midwestern fields not in NT or moldboard plowing
systems have been chisel plowed. About 20.8 � 106 ha
of poorly drained agricultural lands in the Midwest are
tile drained (USDA-NRCS, 1987); improved drainage
has benefited the adoption of conservation tillage.
While some studies have examined short-term CO2
emissions (Reicosky, 1997; Reicosky et al., 1997; Al
Kaisi and Yin, 2005), there are no reports available from
this important agricultural region on the effects of
tillage and rotation, and their interaction, on seasonal
CO2 emissions. Furthermore, since net CH4 emission or
uptake can be a delicate balance between oxidation and
reduction that is dependent on soil saturation, the
dynamics of CH4 fluxes in artificially drained soils are
largely unknown. Therefore, a broad objective in this

R.A. Omonode et al. / Soil & Tillage Research 95 (2007) 182–195184
study was to provide critically needed data for CO2 and
CH4 fluxes that could help to improve modeling and
prediction accuracy of soil gas emission for the
Midwestern USA. The specific objectives were to
assess (i) the short-term tillage intensity effects on CO2
and CH4 emissions, and (ii) the temporal variability in
CO2 and CH4 fluxes from the soil surface during a crop
growing season and how these emissions are related to
tillage, rotation and their interactions.
2. Materials and methods
2.1. Site description and agronomic practices
This research was conducted in long-term tillage
and crop rotation experimental plots located at the
Purdue University Agronomy Center for Research and
Education near West Lafayette, Indiana (408280N Lat.).
The experiments were established in 1975 with the
initial goals of analyzing long-term yield potential of
different tillage systems in various crop rotations, and
determining changes in soil characteristics and crop
growth that could be associated with yield differences.
Since time of establishment in 1975, moldboard plow,
chisel, ridge, and no-till systems were compared in
continuous corn, corn–soybean, soybean–corn, and
continuous soybean rotations. Tillage system depths
have been consistent since the trial began (20–25 cm
for the moldboard plow and 15–20 cm for the chisel
plow). The soil was developed under prairie vegetation,
has less than 2% slope, and is a poorly drained
Chalmers silty clay loam (fine, silty, mixed, super-
active, mesic Typic Endoaquoll) but is tile-drained at
20-m intervals.
Cultural practices have been relatively consistent
since the study began. No-till corn planting involved use
of a single coulter to cut through the residues and loosen
the soil ahead of standard planter units. Since 1997,
tined row cleaners have been used in place of no-till
coulters in front of the standard seed-disk openers. Lime
(2.0 Mg ha�1) was applied periodically to maintain soil
favorable pH, but was last applied two years before
these specific gas emission measurements were con-
ducted. Starter N fertilizer was routinely applied at the
rate of at 37 kg N ha�1 when corn was planted. Since
2001, nitrogen (N) was side-dress applied in June at the
rate of 222 kg N ha�1 using 28% urea ammonium
nitrate (UAN). Phosphorus and potassium fertilizers
were periodically broadcast applied (either alone or in
combination) before fall primary tillage operations to
maintain adequate to high soil-test levels for these
nutrients.
2.2. Experimental treatments
This study included no-till (NT), chisel (CP), and
moldboard (MP) plow treatments in continuous corn
(CC) and corn following soybean (rotation corn, RC).
The experimental layout was a randomized complete
block in a split-plot design with rotations as the main
treatments and tillage as the subunits (randomized in
rotations) with three replications. Each replicate con-
sisted of plots that were 9 m wide, 45 m long (0.04 ha).
Primary tillage treatments involving moldboard and
chisel plowing were applied in fall of 2004 (November
11) and secondary tillage operations were carried out in
spring of 2005 (April 18) just before planting. The
moldboard plow treatment was applied using a commer-
cially available International Harvester 5-furrow 46 cm
semi-mounted moldboard plow. Moldboard plowing
inverted the soil to a 22–25 cm soil depth, and without
extensive breaking of soil aggregates. Chisel plowing
was carried out using a DMI 7-shank coulter-chisel plow
equipped with 10-cm twisted-shovel points on 37-cm
centers and a Danish-tine sweep leveling bar. Secondary
tillage operations for the MP and CP plots involved one
pass of a tandem disk with spring-tooth harrows followed
by a Glencoe field cultivator with C-shank sweeps and
rear-mounted, double-rolling baskets; both operations
were to a depth of approximately 10 cm. Following
spring tillage operations, soil surface residue cover was
3% in MP and 31% in CP versus 93% in the undisturbed
NT system. On April 19, 2005, corn was planted in 76-cm
rows with a Case-IH model 955 row-planter. No-till CC
was planted 15 cm beside the old corn rows using the
unit-mounted row cleaners to clear the row area of
residue when NT planting into corn and soybean residue.
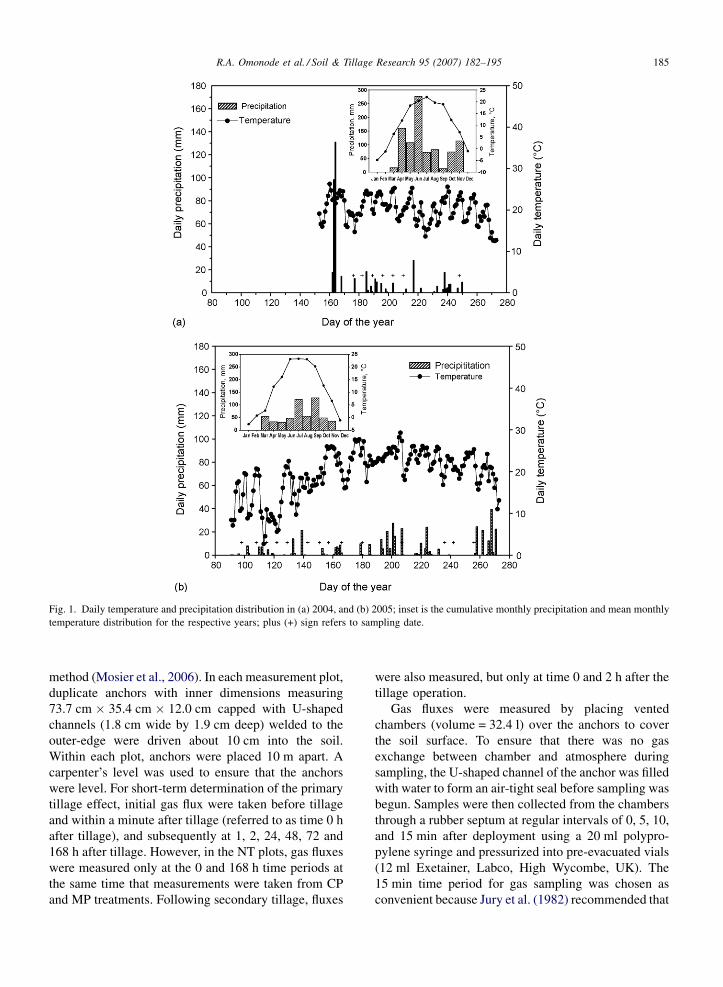
For the study periods, daily and annual temperature
and precipitation conditions are shown in Fig. 1. In
2004, highest cumulative monthly precipitations were
recorded between March and June with peak rainfall in
June. Mean annual temperature was 10.8 8C and total
precipitation was 918.6 mm. In contrast, in 2005, much
less than normal precipitation occurred from March to
June and relatively higher than normal precipitation was
observed from July to September. Although mean
annual temperature was higher in 2005 (12.6 8C) than
2004, total annual precipitation in 2005 was much lower
at just 560.7 mm.
2.3. Carbon dioxide and methane flux
measurements
Tillage-induced soil surface CO2 and CH4 were
simultaneously measured by the vented flux chamber
R.A. Omonode et al. / Soil & Tillage Research 95 (2007) 182–195 185
Fig. 1. Daily temperature and precipitation distribution in (a) 2004, and (b) 2005; inset is the cumulative monthly precipitation and mean monthly
temperature distribution for the respective years; plus (+) sign refers to sampling date.
method (Mosier et al., 2006). In each measurement plot,
duplicate anchors with inner dimensions measuring
73.7 cm � 35.4 cm � 12.0 cm capped with U-shaped
channels (1.8 cm wide by 1.9 cm deep) welded to the
outer-edge were driven about 10 cm into the soil.
Within each plot, anchors were placed 10 m apart. A
carpenter’s level was used to ensure that the anchors
were level. For short-term determination of the primary
tillage effect, initial gas flux were taken before tillage
and within a minute after tillage (referred to as time 0 h
after tillage), and subsequently at 1, 2, 24, 48, 72 and
168 h after tillage. However, in the NT plots, gas fluxes
were measured only at the 0 and 168 h time periods at
the same time that measurements were taken from CP
and MP treatments. Following secondary tillage, fluxes
were also measured, but only at time 0 and 2 h after the
tillage operation.
Gas fluxes were measured by placing vented
chambers (volume = 32.4 l) over the anchors to cover
the soil surface. To ensure that there was no gas
exchange between chamber and atmosphere during
sampling, the U-shaped channel of the anchor was filled
with water to form an air-tight seal before sampling was
begun. Samples were then collected from the chambers
through a rubber septum at regular intervals of 0, 5, 10,
and 15 min after deployment using a 20 ml polypro-
pylene syringe and pressurized into pre-evacuated vials
(12 ml Exetainer, Labco, High Wycombe, UK). The
15 min time period for gas sampling was chosen as
convenient because Jury et al. (1982) recommended that

R.A. Omonode et al. / Soil & Tillage Research 95 (2007) 182–195186
a time frame of <60 min be used to accurately estimate
gas fluxes under aerobic conditions.
For the seasonal tillage effects and temporal
variability assessment, gas samples were collected
weekly during the growing season. In the 2004 growing
season, gas sampling was carried out in seven
measurement periods beginning in June 23 (approxi-
mately 8 weeks after secondary tillage; 6 weeks after
planting) and ending September 4, 2004. During the
2005 growing season, sampling was carried out for 14
weeks beginning on April 8 (1 week before secondary
tillage) and continued through September 13. Because
of inclement weather conditions and resource con-
straints, sampling was not done in the month of July.
Kessavalou et al. (1998) reported a significantly
higher gas emission from crop rows relative to inter-
rows. Therefore, to reduce variability between mea-
sured and actual emissions in the growing season
sampling period, anchors were placed perpendicular to
rows from approximately the 1/4 inter-row to approxi-
mately the 3/4 inter-row positions on the opposite side
of the same row to insure that our gas sampling captured
both the row and inter-row areas. However, all plants
that were within the chamber were clipped at soil level
at all times during sampling. Anchors were kept in the
same positions through the course of the experiment and
all sampling were carried out between 10 a.m. and 12
noon of each sampling date. Soil moisture was
determined using a TRIME-TDR to a depth of
10 cm, and soil temperature recorded with a thermo-
meter to 7 cm soil depth at time of gas sampling for each
chamber position.
The concentrations of CO2 and CH4 in the samples
were determined using a gas chromatograph (Varian
3800 GC, Mississauga, Canada) equipped with an
automatic Combi-Pal injection system (Varian, Mis-
sissauga, Canada) that was described in detail by Drury
et al. (2004). Briefly, gas samples were automatically
injected into the chromatograph using the Combi-Pal
sampler. The sample was passed through a 1.83 m
Porapak N column in a 50 8C oven with grade A helium
as carrier gas, flowing at 30 ml min�1 and CO2 was
analyzed with a thermal conductivity detector set at
130 8C, and a flame ionization detector for CH4. Gas
fluxes were calculated from the rate of change in
chamber concentration, chamber volume, and soil
surface area using the formula of Hutchinson and
Mosier (1981). Chamber gas concentration was con-
verted from molar mixing ratio unit of parts per million
(ppm) determined by GC analysis to mass per volume
units assuming ideal gas relations (Venterea et al.,
2005).
2.4. Statistical analysis
Statistical analysis of the data was performed using
the General Linear Model using SAS (SAS Institute,
2002) with rotation as main plots and tillage as subplots.
Since the underlying objective of the study was to assess
the possibly interacting effects of tillage and rotation
practices on greenhouse gas emissions, statistical
analyses were done in stages for the gas emission data.
First the data was analyzed to determine effects of
rotation, tillage, and rotation � tillage effects, sepa-
rately for short-term and seasonal emissions. Prelimin-
ary analyses indicated that in the short-term, both CO2
and CH4 fluxes were significantly affected by tillage,
but rotation treatments and rotation � tillage interac-
tions affected only CH4 fluxes. However, for the
seasonal emission data, rotation had significant effects
on gas fluxes while neither tillage nor tillage � rotation
interactions had any significant effect on CO2 and CH4
fluxes. Given the complexity of the treatment effects,
the data was separated and analyzed separately as tillage
and rotation effects by averaging tillage effects over
rotation treatments, and rotation effects over tillage
treatments, where tillage or rotation was significant.
Because gas flux rates were measured repeatedly over
time from the same spot, analysis of variance for split-
plot experimental design over time and space was
computed using the general linear model where rotation
and tillage effects were considered random and time of
measurement was considered fixed. Treatment means
were separated using least significant difference (LSD)
and the effects of rotation and tillage on gas fluxes were
evaluated at the 5% level of probability (a = 0.05).
Furthermore, linear regression models were used to
evaluate the relationships between these trace gases and
soil moisture and temperature.
3. Results
3.1. Carbon dioxide fluxes
Carbon dioxide emissions were significantly affected
by primary tillage (CP and MP) but emissions from
these treatments were not different following secondary
tillage operations (Table 1). Similarly, CO2 emissions
were not significantly influenced by rotation or the
rotation � tillage interaction following both primary
and secondary tillage treatment application. In general,
CO2 emissions due to primary tillage varied widely with
treatment and time of measurement (Fig. 2a). Emissions
were greater immediately after tillage (at 0 h) but
declined sharply within hours after tillage operations

R.A. Omonode et al. / Soil & Tillage Research 95 (2007) 182–195 187
Table 1
Statistical significance of tillage, rotation and tillage � rotation inter-
action effects on short-term and growing season emission of soil
carbon dioxide and methane in 2004 and 2005 growing seasons
Source P > F
CO2 CH4
Primary tillage
Rotation 0.6760 0.0312
Tillage 0.0001 0.0115
Rotation � tillage 0.8753 0.0044
Secondary tillage
Rotation 0.2886 0.0678
Tillage 0.1969 0.1491
Rotation � tillage 0.5313 0.2588
2004 growing season
Rotation 0.0206 0.9112
Tillage 0.0898 0.5215
Rotation � tillage 0.3815 0.7960
2005 growing season
Rotation 0.0185 0.6905
Tillage 0.3066 0.1464
Rotation � tillage 0.4216 0.7734
Fig. 2. Short-term (hourly) carbon dioxide emissions due to (a) fall
chisel and moldboard plow primary tillage operations, (b) secondary
tillage of chisel and moldboard tilled plots and (c) emissions for chisel
and moldboard relative to no-till measured at 0 and 168 h. ‘BT’ refers
to before tillage; error bars are standard deviations of the means.
and, for both tillage systems, reached their lowest
intensity 72 h after tillage. Across treatments, CO2
emissions at 0, 1 and 2 h were significantly greater than
for the 24–168 h following tillage (Fig. 2) but were
similar to emissions before tillage. In general, post
primary tillage CO2 emissions were consistently greater
for CP (mean: 0.03 g CO2-C m�2 h�1) than for MP
(mean: 0.01 g CO2-C m�2 h�1). Similarly, secondary
tillage also increased CO2 fluxes relative to before
application. However, emissions from CP treated plots
decreased sharply, but increased linearly for MP 2 h
following secondary tillage (Fig. 2). Compared to NT,
CO2 emissions were about 74.5 and 53.4%, respec-
tively, higher from CP and MP treatments but only at 0 h
following primary tillage application (Fig. 2).
Seasonal CO2 fluxes measured during the 2004 and
2005 growing seasons were temporally variable (Figs. 3
and 4) and were significantly affected by rotation but
not by tillage or tillage � rotation interaction. Although
tillage treatment effects were not generally significant,
in 2004 significant difference of emissions was
observed for CP and MP relative to NT in mid July,
and in early May of 2005 (Fig. 3). Average seasonal
CO2 emissions for CP (0.09 g CO2-C m�2 h�1) was 3
and 11% higher than for NT and MP, respectively, in
2004 and was (0.06 g CO2-C m�2 h�1) 4 and 11%
higher than MP and NT, respectively, in 2005. Seasonal
CO2 emissions were significantly greater under CC than
for RC in both 2004 and 2005 growing seasons. In 2004,
CO2 emissions under CC ranged from 0.06 to
0.13 g CO2-C m�2 h�1 and from 0.05 to 0.10 g CO2-
C m�2 h�1 under RC. Similarly, emissions ranged from
0.02 to 0.11 g CO2-C m�2 h�1 for CC and from 0.01 to
0.09 g CO2-C m�2 h�1 under RC in the 2005 (Fig. 4). In
both years, emissions during the growing season were
highest during the month of June and this coincided
with the period when organic matter mineralization was

R.A. Omonode et al. / Soil & Tillage Research 95 (2007) 182–195188
Fig. 3. Long-term weekly soil carbon dioxide emissions as affected
by tillage treatments in (a) 2004, (b) 2005 growing seasons and (c)
average emissions during 2004 and 2005 growing seasons; DOY refers
to day of the year emissions were measured. Error bars are standard
deviations of the means.
Fig. 4. Long-term weekly soil carbon dioxide emissions as affected
by rotation in (a) 2004, (b) 2005 growing seasons and (c) average
emissions during 2004 and 2005 growing seasons; DOY refers to day
of the year emissions were measured. Error bars are standard devia-
tions of the means.
expected to peak (Fig. 4). Although estimated corn plant
biomass and biomass C returned to soil (Prince et al.,
2001) over the past 30 years was greater for RC than for
CC (when both treatments are in corn), and soil residue
cover was greater for CC than for RC after tillage
(Table 2), average seasonal emissions were about 16%
higher for CC than for RC in both 2004 and 2005
growing seasons.
3.2. Methane fluxes
Methane fluxes following primary tillage treatment
were generally low (i.e. averaged close to zero) but were
significantly affected by both tillage and rotation, and
their interaction. Although numerically small, tillage
operations resulted in negative CH4 fluxes on the
majority of sampling dates (Fig. 5.); negative fluxes

R.A. Omonode et al. / Soil & Tillage Research 95 (2007) 182–195 189
Table 2
Tillage effects on 30-year average corn grain yield (1975–2004), estimated plant biomass and biomass carbon, and soil residue cover after tillage
operations in continuous corn and rotation corn
Tillage Rotation Residue cover after planting
Continuous corn Rotation corn Continuous corn Rotation corn
Grain
yield
Biomassy
(Mg ha�1)
Biomass
Cz (Mg ha�1)
Grain yield
(Mg ha�1)
Biomass
(Mg ha�1)
Biomass C
(Mg ha�1)
2004
(%)
2005
(%)
2004 (%) 2005 (%)
Moldboard 10.6a 16.9 7.1 11.1a 17.8 7.5 4 3 2 2
Chisel 10.4b 16.5 6.9 11.2a 17.8 7.5 31 32 9 13
No-till 9.2c 14.7 6.2 10.9b 17.4 7.3 93 87 85 77
Figures in column followed by the same letter are not statistically significant from each other at P = 0.05.y Aboveground biomass estimated on a dry matter basis from grain yield at 15.5% moisture assuming 53% harvest index.z Biomass carbon calculated as 0.42% of plant biomass.
were indicative of a net CH4 uptake for these soils.
Following tillage treatments, CH4 emission from CP
increased rapidly from a negative flux value of �0.002
to a net emission value of nearly 0.001 mg CH4-
C m�2 h�1. The overall flux pattern from MP was
relatively unchanged during this brief measurement
period. In general, short-term CH4 emissions were
Fig. 5. Short-term hourly methane fluxes associated with (a) fall
chisel and moldboard tillage, and (b) rotation systems. ‘BT’ refers
to before tillage; error bars are standard deviations of the means.
reduced under CP and MP by more than 100% at 0 and
168 h after tillage relative to NT (data not shown).
Similarly, average CH4 emissions were significantly
greater for RC than for CC (Fig. 5).
Seasonal CH4 fluxes were not significantly affected
by tillage, rotation or their interaction although fluxes
varied widely with treatments and time (Fig. 6).
Fig. 6. Long-term weekly soil methane fluxes due to tillage treat-
ments in the growing seasons of (a) 2004, and (b) 2005; DOY refers to
day of the year emissions were measured. Error bars are standard
deviations of the means.

R.A. Omonode et al. / Soil & Tillage Research 95 (2007) 182–195190
Fig. 7. Seasonal average methane emissions for tillage and rotation
systems in the growing seasons of 2004 and 2005. Bars that are
followed by the same letters are not significantly different.
Emissions were numerically greater for NT and least for
CP. On average, MP and NT resulted in net emission
(0.007, and 0.004 mg CH4-C m�2 h�1, respectively)
while CP resulted in a net CH4 uptake (�0.002
mg CH4-C m�2 h�1) in 2004. In 2005, both CP and
MP treatments resulted in net CH4 uptake (CP = �0.012;
MP = �0.009 mg CH4-C m�2 h�1) and NT consistently
resulted in net emission (0.011 mg CH4-C m�2 h�1).
Similarly, CH4 fluxes were positive under CC and RC
rotations in 2004, but were negative for both rotations in
2005 (Fig. 7). In general, soil CH4 emission was in the
order CP < MP < NT and was greater under RC than
CC.
3.3. Soil temperature and moisture effects on gas
fluxes
Linear regression analyses relating fluxes to soil
temperature and moisture in each treatment are shown
in Table 3. Soil CO2 emissions were significantly
affected by soil temperature and moisture even though
CO2 emissions responded differently to temperature
and moisture depending on tillage treatments and time
of gas sampling (Table 3). However, CH4 fluxes were
not affected by either temperature or moisture (data not
shown). In the short-term emission studies, soil
temperature and moisture significantly influenced
CO2 emission from soils under MP (R2 = 0.17), but
not CP. Similarly, in the 2004 growing season the effects
of soil moisture on CO2 emissions were highly
significant (P = 0.003) and accounted for 21 and 16%
of variability in emissions for NT and MP, respectively.
In contrast, 2005 growing season emissions for all three
treatments were significantly related only to soil
temperature (R2: NT = 0.26; CP = 0.27; MP = 0.01).
However, the mean soil moisture concentrations at
sampling were much higher in 2005 than in 2004
(Table 3). The results further indicated that soil
moisture appeared to be the greater factor influencing
gas emissions in NT and MP plots while temperature
had greater influence on gas emissions from CP. Across
all tillage treatments, there was a significant but weak
relationship between CO2 emission and soil tempera-
ture (R2 = 0.18) and between emission and soil moisture
(R2 � 0.13).
4. Discussion
Our results clearly indicated that CO2 and CH4 fluxes
were significantly affected by tillage treatment in the
short-term following primary tillage operations, but
growing season CO2 emissions were influenced mainly
by rotation. Although, these management systems have
no effect on seasonal CH4 fluxes, tillage effects on CH4
fluxes were discussed further giving the unique soil
moisture conditions, and because previous there are no
data on long-term tillage effects on CH4 emissions for
croplands in the Midwest.
4.1. Soil hydro-thermal condition affecting CO2
fluxes
The generally low association of CO2 emission with
soil temperature and moisture reported in this study was
consistent with other reports from tillage experiments
from the Midwest and the Great Plains of the USA (Al-
Kaisi and Yin, 2005; Kessavalou et al., 1998). In this
study, low or non-significant effects of soil temperature
on emission were attributed to the prevalence of either
low temperatures (November 2004) or relatively small
ranges in soil temperatures during the measurement
period (June–August 2004). In contrast, the significant
relationship between emissions and temperature in
2005 were probably due to the earlier onset of gas
emission measurements in the growing season that year
and the relatively higher and wider range of soil

R.A. Omonode et al. / Soil & Tillage Research 95 (2007) 182–195 191
Table 3
Regression models of relationships between soil carbon dioxide emission and soil temperature and moisture in no-till, chisel and moldboard plow
treatments both in the short-term and during 2004 and 2005 growing seasons
Tillage treatment Mean soil temperature (8C) Mean soil moisture (mm) Regression model R2 P > F
Short-term
CP 10.3 1916.99 � 28.91Tsoil 0.02 ns
22.8 658.06 + 42.06Msoil 0.03 ns
MP 9.8 �744.88 + 42.06Tsoil 0.13 0.016
19.9 �530.14 + 66.8Msoil 0.17 0.004
Long-term (2004)
NT 23.5 4682.11 + 18.9Tsoil 0.003 ns
31.9 2008.8 + 99.02Msoil 0.21 0.003
CP 23.9 10604.07 � 223.6Tsoil 0.04 ns
30.7 440.95 + 32.64Msoil 0.02 ns
MP 24.1 4656.57 + 0.99Tsoil 0.006 ns
29.1 2609.93 + 73.74Msoil 0.16 0.009
Long-term (2005)
NT 21.1 �29.0 + 152.05Tsoil 0.26 0.001
39.3 4193.2 + 28.45Msoil 0.06 0.021
CP 22.1 �61.03 + 159Tsoil 0.27 0.001
41.4 3115.98 + 9.34Msoil 0.005 ns
MP 22.4 1886.97 + 66.16Tsoil 0.06 0.03
37.5 2773.07 + 15.13Msoil 0.02 ns
Tsoil: soil temperature; Msoil: soil moisture.
temperature when measurements spanned from spring
to summer periods. On the other hand, the lack of
relationship between soil moisture and emissions in
2005 was probably due to the timing of precipitation
events relative to gas emission measurements. We note
that monthly mean precipitation during the growing
season was lower in 2005 than in 2004 (Fig. 1), and yet
mean soil moistures at the time of sampling were higher
in 2005 than in 2004 (Table 3).
Although the importance of soil physical factors on
microbial activity, root activity and gas diffusivity is
generally acknowledged (Howard and Howard, 1993;
Kirschbaum, 1995; Follett, 1997; Smith et al., 2003),
the specific impacts of soil moisture and temperature on
gas emissions from the soil surface are still uncertain.
However, similar to our results, Kirschbaum (1995) and
Follett (1997) reported that soil temperature was the
primary factor governing CO2 emission in studies that
spanned an entire growing season or 12 months. In a
review of the interacting effects of soil physical factors
and biological processes on soil–atmosphere gas
exchange, Smith et al. (2003) concluded that CO2
release by aerobic respiration is primarily temperature
dependent, but becomes moisture-dependent as a soil
dries. Smith et al. (2003) also emphasized the
importance of depth and time (diurnal) of soil
temperature measurement on the relative temperature
association with CO2 emission from soil. Our present
results demonstrate that both soil temperature and
moisture were significantly related to emission (depend-
ing on the time of measurement), but the unique
observation in our study was that the relative
importance of temperature or moisture on gas emissions
varied with the tillage system being measured.
4.2. Soil management-induced CO2 fluxes
Tillage-induced CO2 emission values reported here
were consistent with those reported for short-duration
experiments in parts of the Midwest (Reicosky et al.,
1997, 2005; Al-Kaisi and Yin, 2005), and elsewhere
(Dao, 1998; Rochette and Angers, 1999; Frank et al.,
2006). Similarly, significantly greater CO2 emissions
immediately following tillage operations relative to
emissions before tillage was consistent with the reports
of Reicosky and Lindstrom (1993), Reicosky et al.
(1997), and Al-Kaisi and Yin (2005) and was attributed
to rapid physical release of CO2 trapped in the soil air
space due to soil physical disturbance (Reicosky and
Lindstrom, 1993; Jackson et al., 2003). However,
differences of emission between MP and CP tended to
persist longer than was previously reported (Reicosky

R.A. Omonode et al. / Soil & Tillage Research 95 (2007) 182–195192
et al., 1997; Al-Kaisi and Yin, 2005) for short-term
studies (i.e. for about 72 h after the initial tillage
operations). Similarly, greater tillage-induced CO2
emissions for CP relative to MP were in sharp contrast
to the results of Reicosky and Lindstrom (1993),
Reicosky (1997), and Reicosky et al. (2005) who
attributed higher emission in MP to greater soil volume
that was disturbed under MP relative to CP. One major
factor for the observed differences may be the timing of
MP and CP primary tillage operations. In this study,
moistures of this fine-textured, high organic matter soil
(Gal et al., submitted for publication) were relatively
high and air temperatures relatively low (range: 7–
13 8C) when MP disturbance was imposed; furrows
remained relatively intact in the inversion process and
little aggregate or clod dispersal was observed. In
contrast, Reicosky (1997), and Reicosky et al. (2005)
compared MP and CP close to the summer period
(August/September) when air temperature averaged
30 8C (Reicosky and Lindstrom, 1993), and under
relatively dry soil conditions when considerably more
soil aggregate breakup may have occurred. However,
Al-Kaisi and Yin (2005) reported no significant
difference in emission for MP, CP and NT shortly
after tillage disturbance operations in their RC system.
Similarly, La Scala et al. (2006) also found no
significant difference in CO2 emission for MP and
CP in a time period of 24 h after tillage; the authors in
that study in fact concluded that the impact of CP on
the immediate CO2 emission was as high as that caused
by MP.
Relatively few studies have been conducted to
directly compare the effects of MP, CP and NT on
growing season CO2 emissions from corn–soybean
rotations in the Midwest. However, in this study the
estimated cumulative seasonal emissions (CC: 6.4; RC:
5.5 Mg CO2-C ha�1 year�1) were similar to those
reported for Iowa (Parkin and Kaspar, 2004) but greater
than for fertilized and residue-amended soils in Ohio
(Jacinth et al., 2002b; Jacinthe and Lal, 2004; Jarecki
and Lal, 2006) and for the Great Plains (Kessavalou
et al., 1998). In contrast, much greater CO2 emissions
have been reported for irrigated corn (Amos et al., 2005)
and for continuous wheat (Frank et al., 2006), while
Mosier et al. (2006) reported lower seasonal CO2
emissions for no-till and conventionally-tilled corn–
bean rotations.
We acknowledge the possible influence of our
specific procedure and fixed duplicate anchor positions
on the cumulative estimates of gas emissions in our
research. Carbon dioxide fluxes from crop rows during
the growing season derived mainly from shoot and root
respiration of severely injured plants when plants are
retained under the gas-sampling chambers, while
emissions from the interrows (bare soil) reflected both
soil and root respiration during the growing season
(Kessavalou et al., 1998; Amos et al., 2005). Depending
on plant growth stage, soil surface CO2 emissions from
within row areas have ranged from 10 to 198% of those
from between row areas (Amos et al., 2005). In a recent
study, Werth et al. (2006) found that total CO2 efflux
from soil planted to corn was substantially due to root
respiration, and to a lesser extent due to microbial soil
organic matter decomposition and rhizomicrobial
(rhizosphere) respiration. In this study, growing season
CO2 fluxes were measured from a soil surface area that
included both inter- and intra-crop row areas from
which plant shoot material had been removed prior to
sampling; therefore, seasonal CO2 emission values
reported here were attributed to both residue decom-
position and root respiration but not to shoot respiration.
Different authors have arrived at different conclu-
sions regarding tillage and rotation effects on growing
season CO2 emissions. However, in this study greater
CO2 emissions for CC contrasted Drury et al. (1998,
2004) who observed greater CO2 emissions for RC
relative to CC due to differences in soil aggregates.
However, under corn rotation, Drury et al. (2006)
reported that growing season CO2 emissions were not
significantly different among CP, fall zone-tillage and
NT treatments on clay loam soils in Eastern Canada.
Similarly, Mosier et al. (2006) found no differences of
emissions from CC and corn–bean rotations under NT
and MP systems.
Our lack of statistical differences in seasonal CO2
emission among the tillage treatments was not
unexpected. Ball et al. (1999) reported a lack of
significant tillage systems effects on CO2 emissions 3–4
weeks into the growing season. In contrast, Franzlueb-
bers et al. (1995) found growing season CO2 emissions
to be greater under NT than conventional tillage in a
Texas silty clay loam soil. Similarly, lower CO2
emissions for NT relative to CP and MP was consistent
with results from other seasonal experiments (Kessa-
valou et al., 1998; Dao, 1998; Bauer et al., 2006;
Al-Kaisi and Yin, 2005) and this response has been
attributed to greater surface crop residues for NT.
Greater surface crop residues for NT probably served as
a barrier for CO2 emissions from soil to the atmosphere;
surface residues may also reduce crop residue decom-
position rate (due to reduced soil temperature and
minimum soil-residue contact). Both factors may
contribute to reduction of soil CO2 emissions under
NT (Reicosky et al., 1999). However, greater emissions

R.A. Omonode et al. / Soil & Tillage Research 95 (2007) 182–195 193
for CP compared to MP in our research contrasted with
results by Kessavalou et al. (1998), Bauer et al. (2006)
and Dao (1998), and suggested that microbial decom-
position of organic residues was higher for CP treatment
in these soils. Perhaps CP systems like the one we
employed re-distributed most surface residues rather
evenly throughout mainly the upper half of the shank
depth to which soil was disturbed. In contrast, our MP
operation completely inverted the surface soil and
residues down to the 22–25 cm depth where overall
microbial residue decomposition might be slower
because of the combination of higher soil moistures
but lower soil temperatures relative to on or near the
surface. In recent studies, significant SOC accumulation
beneath at the 20–50 cm depth interval have been
reported for long-term MP relative to NT and CP
treatments; suggestive of a slower residue decomposi-
tion at greater depth and therefore, lesser CO2 emission
rate for MP (Yang and Kay, 2000; Deen and Kataki,
2003; Omonode et al., 2006). In these very same plots
Gal et al. (submitted for publication) reported sig-
nificantly more organic C accumulation in NT versus
MP treatments close to the soil surface (27% higher
SOC on a soil-mass-equivalent basis in the 0–30 cm
interval), but substantially lower SOC in the NT than
MP treatments deeper in the profile (32% lower on a
soil-mass-equivalent basis in the 30–50 cm interval).
Based on the tillage and rotation system results with
CO2 flux of this study, we make three inferences. First,
we speculate that the reason for the increased CO2 flux
observed in the CP system in our results is simply
because of the closer proximity of crop residue in direct
contact with the near-surface soil that represents the
most dynamic zone responsible for residue decomposi-
tion. Second, perhaps CP treatment also provided
greater aeration at deeper depths for root respiration
particularly at the early stages of the growing season.
Third, we also speculate that possible reasons for CC
resulting in significantly greater CO2 emissions (even
though RC returned more biomass and biomass C
during the corn year itself) were that CC returned more
total biomass C over a 2-year period than the
combination of soybean plus corn and that nitrogen
fertilizers (and thus their stimulation of microbial
residue decomposition) were applied annually in the CC
sequence but bi-annually in the RC sequence.
4.3. Tillage practices and methane fluxes
Although CH4 fluxes were not significantly affected
by tillage and rotation treatments, the generally low
values and net uptake of CH4 reported in our study were
consistent with those reported for cultivated soils (Chan
and Parkin, 2001; Jacinthe and Lal, 2005; Venterea
et al., 2005). Similarly, greater CH4 uptake for CP
(conservation tillage) relative to MP (conventional), and
for CP and MP relative to NT treatment was consistent
with Ball et al. (1999), Jacinthe and Lal (2005) and
Venterea et al. (2005). In contrast, Kessavalou et al.
(1998) reported a decrease in CH4 uptake as soil
disturbance increased (i.e. uptake was subsequently
greatest for NT soils) in Nebraska. Higher CH4 uptake
for CP and MP relative to NTwas attributed to increased
soil disturbance and higher soil aeration resulting from
CP and MP. Consequently, higher CH4 uptake for CP re-
affirmed our earlier observation that CP resulted in
greater soil aeration and subsequent organic C and CH4
oxidation from the near-surface layers. Similarly,
consistent CH4 emissions for NT were probably due
to a combination of absence of soil disturbance, greater
soil moisture and greater soil cover from crop residues
(Jacinthe and Lal, 2005, 2004) which lead to more
frequent anaerobic conditions, especially in the
inherently poorly – but artificially drained – soils in
our experiment.
5. Summary and conclusion
There is insufficient experimental data to accurately
assess the effects of long-term tillage and rotation
systems on greenhouse gas fluxes in the Midwest Corn
Belt. This research was initiated to determine short- and
seasonal fluxes of CO2 and CH4 in soils that have been
uniformly managed using MP, CP and NT tillage
practices in CC and RC for the last 3 decades. Short-
term CO2 emission measured for 168 h after fall
primary tillage was higher for CP than for MP at all time
of measurement. On a seasonal basis, CO2 emission
during the growing season was significantly affected by
rotation (CC averaged 16% higher than RC), but not by
tillage systems. However, among tillage systems CO2
emission was numerically in the order: NT < MP < CP.
Tillage and rotation had significant effects on methane
fluxes in the short-term, but neither tillage nor rotation
had significant effects on methane fluxes during the
growing season. Although the soils were a net sink for
CH4, fluxes were generally very low and suggested that
even 30 years of continuous NT did not significantly
improve CH4 uptake in these soils. Soil temperature and
moisture effects on gas fluxes were significant, but
specific relationships of temperature and moisture with
gas emission were generally poor, and dependent on
both seasonal timing of gas measurement as well as the
tillage systems under consideration.
R.A. Omonode et al. / Soil & Tillage Research 95 (2007) 182–195194
Our results suggested that the effects of fall primary
tillage operations on gas fluxes are relatively short-
lived, and that rotation system seemed to be a more
important factor determining the dynamics of seasonal
gas fluxes from the soil surface. Similarly, from a short-
term perspective, since adoption of a NT management
system will minimize soil disturbance and increase crop
residue retention on the surface, NT is more effective in
reducing greenhouse gas emissions compared to MP
and CP. However, in the long term, CP may be more
detrimental than MP systems in net CO2 emissions
while both CP and MP appeared to have an equally
marginal effect on CH4 uptake or loss in these dark
prairie soils.
Acknowledgements
The authors thank Terry West for his meticulous
management of these long-term plots from 1979 to
2005, and Sergio Kimoto for his excellent field and
laboratory assistance. The research was financed by a
USDA grant to the Consortium for Agricultural Soil
Mitigation of Greenhouse Gases (CASMGS) project
coordinated via Kansas State University (principal
investigator Dr. C. Rice); Dr. R. Turco was the principal
investigator for the Purdue University sub-project
(Award S03060).
References
Al-Kaisi, M.M., Yin, X., 2005. Tillage and crop residue effects on soil
carbon and carbon dioxide emission in corn-soybean rotations. J.
Environ. Qual. 34, 437–445.
Amos, B., Arkenbauer, T.J., Doran, J.W., 2005. Soil surfaces fluxes of
greenhouse gases in an irrigated maize-based agroecosystem. Sci.
Soc. Am. J. 69, 387–395.
Ball, B.C., Scott, A., Parker, J.P., 1999. Field N2O, CO2 and CH4
fluxes in relation to tillage, compaction and soil quality in Scot-
land. Soil Till. Res. 53, 29–39.
Bauer, P.J., Federick, J.R., Novak, J.M., Hunt, P.G., 2006. Soil CO2
flux from a Norfolk loamy sand after 25 years of conventional and
conservative tillage. Soil Till. Res. 90, 205–211.
Bronson, K.F., Mosier, A.R., 1993. Nitrous oxide emissions and
methane consumption in wheat and corn-cropped systems. In:
Harper, et al. (Eds.), Agricultural Ecosystem Effects on Trace
Gases and Global Climate Change. ASA, CSSA, SSSA, Madison,
WI.
Bronson, K.F., Mosier, A.R., Bishnoi, S.R., 1992. Nitrous oxide
emissions in irrigated corn as affected by encapsulated calcium
carbide and nitrapyrin. Soil Sci. Soc. Am. J. 56, 161–165.
Castro, M.S., Peterjohn, W.T., Melillo, J.M., Steudler, P.A., Gholz,
H.L., Lewis, D., 1994. Effects of nitrogen fertilization on the
fluxes of N2O, CH4, and CO2 from soils in as Florida slash pine
plantation. Can. J. For. Res. 24, 9–13.
Chan, A.S.K., Parkin, T.B., 2001. Methane oxidation and production
activity in soils from natural and agricultural ecosystems. J.
Environ. Qual. 30, 1896–1903.
CTIC, 2004. National Crop Residue Management Survey: A Survey of
Tillage System Usage by Crops and Acres Planted. Conservation
Technology Information Center, West Lafayette, IN.
Curtin, D., Wang, H., Selles, F., McConkey, B.G., Campbell, C.A.,
2000. Tillage effects on carbon fluxes in continuous wheat and
fallow-wheat rotations. Soil Sci. Soc. Am. J. 64, 2080–2086.
Dao, T.H., 1998. Tillage and crop residue effects on carbon dioxide
evolution and carbon storage in a paleustoll. Soil Sci. Soc. Am. J.
62, 250–256.
Deen, W., Kataki, P.K., 2003. Carbon sequestration in a long-term
conventional versus conservation tillage experiment. Soil Till.
Res. 74, 143–150.
Drury, C.F., Oloya, T.O., McKenny, D.J., Gregorich, E.G., Tan, C.S.,
van Luyk, C.L., 1998. Long-term effects of fertilization and
rotation on denitrification and soil carbon. Soil Sci. Soc. Am. J.
62, 1572–1579.
Drury, C.F., Yang, X.M., Reynolds, W.D., Tan, C.S., 2004. Influence
of crop rotation and aggregate size on carbon dioxide production
and denitrification. Soil Till. Res. 79, 87–100.
Drury, C.F., Reynolds, W.D., Tan, C.S., Welacky, T.W., Calder, W.,
McLaughlin, N.B., 2006. Emissions of nitrous oxide and carbon
dioxide: influence of tillage type and nitrogen placement depth.
Soil Sci. Soc. Am. J. 70, 570–581.
Dugas, W.A., 1993. Micro meteorological and chamber measurements
of CO2 flux from bare soil. Agric. For. Meteorol. 67, 115–128.
Follett, R.F., 1997. CRP and microbial biomass dynamics in temperate
climates. In: Lal, R., et al. (Eds.), Management of Carbon Seques-
tration in Soil. CRP Press, Bacon Raton, FL, pp. 305–322.
Frank, A.B., Liebig, M.A., Tanaka, D.L., 2006. Management effects
on soil CO2 eflux in northern semiarid grassland and cropland. Soil
Till. Res. 89, 78–85.
Franzluebbers, A.J., Hons, F.M., Zuberer, D.A., 1995. Tillage and crop
effects on seasonal soil carbon and nitrogen dynamics. Soil Sci.
Soc. Am. J. 59, 1618–1624.
Gal, A., Vyn, T.J., Micheli, E., Kladivko, E.J., Mcfee, W.W. Soil
carbon and nitrogen accumulation with long-term no-till versus
moldboard plowing overestimated with tilled-zone sampling
depths. Soil Till. Res., submitted for publication.
Goldman, M.B., Groffman, P.M., Pouyat, R.V., McDonnel, M.J.,
Pickett, S.T.A., 1995. CH4 uptake and N availability in forest
soils along an urban to rural gradient. Soil Biol. Biochem. 27, 281–
286.
Howard, D.M., Howard, P.J.A., 1993. Relationships between CO2
evolution, moisture content and temperature for a range of soil
types. Soil Biol. Biochem. 25, 1537–1546.
Hutchinson, G.L., Mosier, A.R., 1981. Improved soil cover method for
field measurement of nitrous oxide fluxes. Soil Sci. Soc. Am. J. 45,
311–316.
IPCC, 1996. Intergovernmental panel on climate change (IPCC):
impacts, adaptations and mitigation of climate change: science-
technical analysis. In: Watson, R.T., et al. (Eds.), Climate Change:
The IPCC Scientific Assessment. Cambridge Univ. Press,
Cambridge, pp. 745–771.
Izaurralde, R.C., McGill, W.B., Rosenber, N.J., 2000. Carbon cost of
applying nitrogen fertilizer. Science 288, 811.
Jacinthe, P.A., Lal, R., 2005. Labile carbon and methane uptake as
affected by tillage intensity in a mollisol. Soil Till. Res. 80, 35–45.
Jacinthe, P.A., Lal, R., 2004. Effects of soil cover and land-use on the
relations flux-concentration of trace gases. Soil Sci. 169, 243–259.

R.A. Omonode et al. / Soil & Tillage Research 95 (2007) 182–195 195
Jacinthe, P.A., Lal, R., Kimble, J.M., 2002a. Carbon dioxide evolution
in runoff from simulated rainfall of long-term no-till and plowed
soils in southwestern Ohio. Soil Till. Res. 66, 23–33.
Jacinth, P.A., Lal, R., Kimble, J.M., 2002b. Carbon budget and
seasonal carbon dioxide emission from a central Ohio Luvisol
as influenced by wheat residue amendment. Soil Till. Res. 67,
147–157.
Jackson, L., Calderson, F.J., Scow, K.L., Steenwerth, K.M., Rolston,
D.E., 2003. Responses of soil microbial processes and community
structure to tillage events and implications for soil quality. Geo-
derma 114, 305–317.
Jarecki, M.K., Lal, R., 2006. Compost and mulch effects on gaseous
flux from an alfisol in Ohio. Soil Sci. 171, 249–260.
Jawson, M.D., Shafer, S.R., Franzluebbers, A.J., Parkin, T.B., Follett,
R.F., 2005. GRACEnet: greenhouse gas reduction through
agricultural carbon enhancement network. Soil Till. Res. 83,
167–172.
Jury, W.A., Letey, J., Collins, T., 1982. Analysis of chamber methods
used for measuring nitrous oxide production in the field. Soil Sci.
Soc. Am. J. 46, 250–256.
Kessavalou, A., Mosier, A.R., Doran, J.W., Drijber, R.A., Lyon, D.J.,
Heinemeyer, O., 1998. Fluxes of carbon dioxide, nitrous oxide,
and methane in grass sod and winter wheat-fallow tillage manage-
ment. J. Environ. Qual. 27, 1094–1104.
Kirschbaum, M.U.F., 1995. The temperature dependence of soil
organic matter decomposition and the effect of global warming
on soil organic matter storage. Soil Biol. Biochem. 27, 753–
760.
La Scala, N., Bolonhezi, D., Pereira, G.T., 2006. Short-term soil CO2
emission after conventional and reduced tillage of a no-till sugar-
cane area in southern Brazil. Soil Till. Res. 96, 244–248.
Lessard, R.P., Rochette, P., Topp, E., Pattey, E., Desjardins, R.L.,
Beaumont, G., 1994. Methane and carbon dioxide fluxes from
poorly drained adjacent cultivated and forest sites. Can. J. Soil Sci.
74, 139–146.
Mosier, A.R., Halvorson, A.D., Reule, C.A., Liu, X.J., 2006. Net
global warming potential and greenhouse gas intensity in irrigated
cropping systems in Northern Colorado. J. Environ. Qual. 35,
1584–1598.
Mosier, A.R., Valentine, D.W., Parton, W.J., Ojima, D.S., Schimel,
D.S., Bronson, K.F., Delgado, J.A., 1996. CH4 and N2O fluxes in
the Colorado shortgrass steppe: 1. Impact of landscape and
nitrogen addition. Global Biochem. Cycles 10, 387–399.
Mosier, A.R., Schimel, D.S., Valentine, D.W., Bronson, K.F., Parton,
W.J., 1991. Methane and nitrous oxide fluxes in native, fertilized,
and cultivated grasslands. Nature 350, 330–332.
Omonode, R.A., Gal, A., Stott, D.E., Abney, T.S., Vyn, T.J., 2006.
Short-term versus continuous chisel and no-till effects on soil
carbon and nitrogen. Soil Sci. Am. J. 70, 419–425.
Parkin, T.B., Kasper, T.C., 2003. Temperature controls on diurnal
carbon dioxide flux: implication for estimating soil carbon loss.
Soil Sci. Am. J. 67, 1763–1772.
Parkin, T.B., Kaspar, T.C., 2004. Temporal variability of soil carbon
dioxide flux: effect of sampling frequency on cumulative carbon
loss estimation. Soil Sci. Soc. Am. J. 68, 1234–1241.
Post, W.M., Peng, T.H., Emmanuel, W.R., King, A.W., Dale, V.H.,
Angelis, De D.L., 1990. The global carbon cycle. Am. Sci. 78,
310–326.
Prince, S.D., Haskett, J., Steininger, M., Strand, H., Wright, R., 2001.
Net primary production of U.S. Midwest croplands from agricul-
tural harvest yield data. Ecol. Appl. 11, 1194–1205.
Reicosky, D.C., Lindstrom, M.J., 1993. Fall tillage method: effect on
short-term carbon dioxide flux from soil. Agron. J. 85, 1237–1243.
Reicosky, D.C., 1997. Tillage-induced CO2 emission from soil.
Nutrient Cycling Agroecosyst. 49, 273–285.
Reicosky, D.C., Dugas, W.A., Torbert, H.A., 1997. Tillage-induced
soil carbon dioxide loss from different cropping systems. Soil Till.
Res. 41, 105–118.
Reicosky, D.C., Reeves, D.W., Prior, S.A., Runion, G.B., Rogers,
H.H., Raper, R.L., 1999. Effects of residue management and
controlled traffic on carbon dioxide and water loss. Soil Till.
Res. 52, 153–165.
Reicosky, D.C., Lindstrom, M.J., Schumacher, T.E., Lobb, D.E.,
Malo, D.D., 2005. Tillage-induced CO2 loss across and eroded
landscape. Soil Till. Res. 81, 183–194.
Rochette, P., Desjardins, R.L., Pattey, E., 1991. Spatial and temporal
variability of soil respiration in agricultural fields. Can. J. Soil Sci.
71, 189–196.
Rochette, P., Angers, D.A., 1999. Soil surface carbon dioxide fluxes
induced by spring, summer, and fall moldboard plowing in a sandy
loam. Soil Sci. Soc. Am. J. 63, 621–628.
SAS Institute, 2002. The SAS System for Microsoft Windows Release
8.2. SAS Inst., Cary, NC.
Smith, K.A., Ball, T., Conen, F., Dobbie, K.E., Massheder, J., Rey, A.,
2003. Exchange of greenhouse gases between soil and atmo-
sphere: interactions of soil physical factors and biological pro-
cesses. Eur. J. Soil Sci. 54, 779–791.
USDA-NRCS, 1987. Farm Drainage in the United States: History,
Status and Prospects. Misc. Publ. No. 1455. USDA-NRCS,
Washington, DC.
Venterea, R.T., Burger, M., Spokas, K.A., 2005. Nitrogen oxide and
methane emissions under varying tillage and fertilizer manage-
ment. J. Environ. Qual. 34, 1467–1477.
Werth, M., Subbotina, I., Kuzyakov, Y., 2006. Three-source partition-
ing of CO2 efflux from soil planted with maize by 13C natural
abundance fails due to inactive microbial biomass. Soil Biol.
Biochem. 38, 2772–2781.
West, T.O., Marland, G., 2002. A synthesis of carbon sequestration,
carbon emissions, and net carbon dioxide flux in agriculture:
comparing tillage practices in the United States. Agric. Ecosyst.
Environ. 91, 217–232.
Yang, X.M., Kay, B.D., 2000. Rotation and tillage effects on soil
organic carbon sequestration in a Typic Hapludalf in Southern
Ontario. Soil Till. Res. 59, 107–114.