soil conservation service united states … · intext educational publishers, san francisco. 22 pp....
TRANSCRIPT

,
DOCUMENT RESUME
ED 081 618 SE 016 656
TITLE The American Environment: A Home Study Course..INSTITUTION Soil Conservation Service (DOA), Washington, D.C.PUB DATE Apr 71NOTE .183p.; Revised January, 1973
EDRS PRICE MF-$0.65 HC-$6.58DESCRIPTORS Adult Education; *Course Content; Curriculum Guides;
Environment; *Environmental Education;" *IndependentStudy; Instructional Materials; Natural Resources;*Professional Continuing Education; *Units of Study(Subject Fields)
ABSTRPCTPrepared for employees of the Soil Conservation
Service, U..S. Department of Agriculture, to assist them inincreasing their knowledge and understanding of the environment, thissyllabus may also serve as a resource and reference guide forenvironmental studies or for purposes of curriculum development.. The16 unit course consists of reading assignments, activity assignments,subject information summaries, support materials, and responsesheets..Topics are: The "Original" American Situation; Changes inAmerica Since AD 1500; Basic Biological Concepts; Basic EcologicalConcepts; The Atmosphere; Soils; Freshwater and Its Pollution; Oceansand Estuaries; Natural Areas and Their Use; Wildlife; Population ofHuman Beings; Solid Waste Problems;. Persistent Chemicals in the -Environment; Radioactive Fallout; Living Space and Recreation; andThe taw and the Environment. (BL)

theamerican
LT-1 environment
U S DEPARTVENT OF +EALT4EDUCATION E. AELEALENATIONAL INSTITUTE CF
EDUCATION
A HOME STUDY COURSE
rn, r'") c
II I 1
C)ISOIL CONSERVATION SERVICE
'U. S. DEPARTMENT OF AGRICULTURE
FILMED FROM BEST AVAILABLE COPY;
THE AMERICAN ENVIRONMENT
A Home Study Course
SOIL CONSERVATION SERVICE
UNITED STATES DEPARTMENT OF AGRICULTURE
Prepared for employees of the SoilConservation Service to assist themin increasing their knowledge andunderstanding of the environment.
Issued April 1971Revised January, 1713
HOW TO USE AND DEVELOP
THIS BOOK
All the materials in this book have been punched for a three-ringbinder. In doing this, we had in mind the following ide!:
1. Materials and lessons can be taken out and put backin easily.
2. New material collect, can be punched and insertedeasily. If you keep on collecting notes, quotations,excerpts, booklets, pamphlets, book reviews, etc. --you will find that this book will grow -- as your
'knowledge grows. It will become your, environmental
reference.
3. From time to time new materials are being and willbe issued by the SCS. When you get your copy, thisbook is a mighty good place to file it, after study.
.0
The Soil Conservation Service occupies a major position in the
United States as an environmental agency. The work we do, in cooperation
with conservation districts and other agencies, has a tremendous effect
on the lands and waters of our country.
This being so, it is of key importance that alb` of our technical
people be as up-to-date as possible in the many environmental sciences.
It is urgent that we undertake our work on the most enlightened,
scientifically sound basis possible.
This home study course is designed to help technical people
increase their knowledge and improve their understanding of the environ-
ment. Anyone taking it will need to plan on more reading after finishing
it, or for that matter even during the course. The world does not stand
still. It is my hope thct among other things this course will act as a
stimulant to further study.

........
Before Starting the Course - - -
1. You pill be expected to read and study on your own time, workassigned problems, answer questions, and return this paperwork to your instructor for review. A student response sheetis provided at the end of each unit. This should be torn outand used as the transmittal sheet and first page for respondingto the assignment.
2. We estimate that it will take you approximately 160 hours tocomplete the course. This means that you will need to scheduleup to 10 hours of your own time each month for 16 months, ifyou are to complete the course at the suggested rate of at leastone unit per month. You may, of course, complete the lessonsmore rapidly than this if you are able to.
It is important that you be sure that your.work and travelcommitments, as well as social commitments, enable you toschedule 10 hours a month for this course. If you really don'thave the time, you will be well-advised not to start. A simple....
form' for completing a study plan is provided. Please completetwo copies of this form; sending one to your instructor andkeeping one for yodr own guidance. If for any reason you fallbehind, a new schedule should be prepared and concurred in bythe instructor.
iii
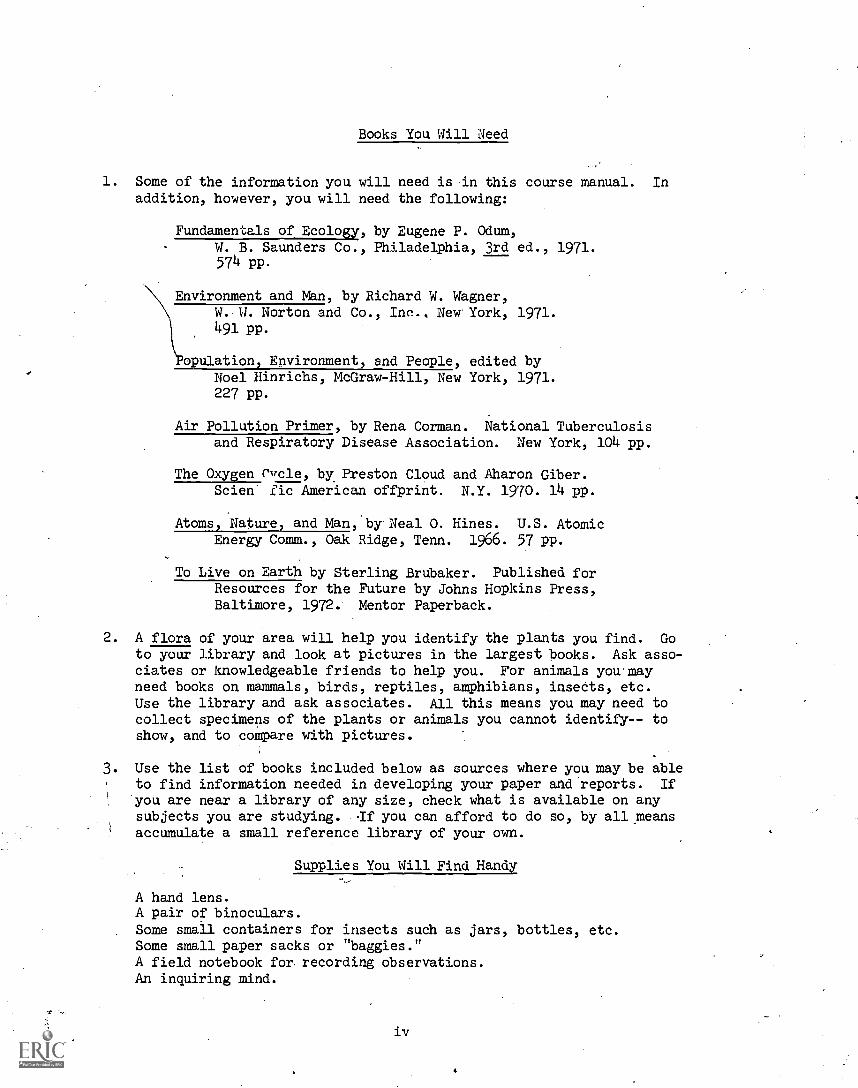
Books You Will Need
1. Some of the information you will need is in this course manual. In
addition, however, you will need the following:
Fundamentals of Ecology, by Eugene P. Odum,W. B. Saunders Co., Philadelphia, 3rd ed., 1971.574 PP.
Environment and Man, by Richard W. Wagner,W. W. Norton and Co., Inc.. New York, 1971.491 pp.
Population, Environment, and People, edited byNoel Hinrichs, McGraw-Hill, New York, 1971.227 pp.
Air Pollution Primer, by Rena Corman. National Tuberculosisand Respiratory Disease Association. New York, 104 pp.
The Oxygen Circle, by Preston Cloud and Aharon Giber.Scien fie American offprint. N.Y. 1970. 14 pp.
Atoms, Nature, and Man, by Neal O. Hines. U.S. AtomicEnergy Comm., Oak Ridge, Tenn. 1966. 57 pp.
To Live on Earth by Sterling Brubaker. Published forResources for the Future by Johns Hopkins Press,Baltimore, 1972. Mentor Paperback.
2. A flora of your area will help you identify the plants you find. Goto your library and look at pictures in the largest books. Ask asso-ciates or knowledgeable friends to help you. For animals you'mayneed books on mammals, birds, reptiles, amphibians, insects, etc.Use the library and ask associates. All this means you may need tocollect specimens of the plants or animals you cannot identify-- toshow, and to compare with pictures.
3. Use the list of books included below as sources where you may be ableto find information needed in developing your paper and reports. If
you are near a library of any size, check what is available on anysubjects you are studying. If you can afford to do so, by all meansaccumulate a small reference library of your own.
Supplies You Will Find Handy
A hand lens.A pair of binoculars.Some small containers for insects such as jars, bottles, etc.Some small paper sacks or "baggies."A field notebook for recording observations.An inquiring mind.
iv

Additional Recommended Reading
Books deserving special attention:
Bartelli, L. J., Klingebiel, A. A., Baird, J. V., and Heddleson, M. R., 1966.Soil Surveys and Land Use Planning. Soil Science Society of Americaand American Society of Agronomy, Madison, Wisconsin, 196 pp.
Boughey, Arthur S., 1971. Fundamental Ecology. Intext Educational Publishers,San Francisco. 22 pp. Paperback.
Boughey, Arthur S., 1971. Man and the Environment. An introduction to humanecology and evolution. MacMillan, New York. 472 pp. Paperback $6.95.
Carvell, Fred, and Max Tadlock, 1971. It's Not Too Late. Glencoe Press,Beverly Hills, Calif. 312 pp. Paperback.
Council on Environmental Quality, 1970. Environmental Quality. First annualreport of the Council, U.S. Gov. Printing Office, 326 pp. Second annualreport, same publisher, 360 pp. ($2.00) 1971; and following annual reports.
Dasmann, Raymond F., 1968. Environmental Conservation. John Wiley andSons, New York. 2nd ed. 375 pp. Paperback.
Eiseley, Loren, 1957. The Immense Journey. Vintage Books, New York,210 pp. Paperback $1.45. Pleasant, scientifically sound reading onman and his development and environment.
Handler, Philip, ed., 1970. Biology and the Future of Man. Oxford UniversityPress, New York. 936 pp. ($12.50) An exhaustive review by a large panelof scientists of our state of knowledge in the biological field. Paper-back $4.95.
Natthiessen, Peter, 1959. Wildlife in America. Viking, New York, 304 pp.Paperback $1.95.
Schwartz, William, ed., 1969. Voices for the Wilderness. Sierra Club-Ballantine, N.Y., 366 pp. Paperback $1.25. A series of selectedreadings on the subject.
Scientific American, 1970. Entire issue on the biosphere. Sept. 1970.266 pp. $1.00. A group of articles written by scientists, includingthe various cycles (oxygen, carbon, nitrogen, etc.).
Shepard, Paul, and Daniel McKinley, 1969 The Subversive Science.Subtitle: Essays Toward an Ecology of Man. Houghton Mifflin,Boston, Mass., 453 pp. Paperback $5.95. Highly competent essays;thought-provoking.
The Editors of Fortune, 1970. The Environment. Harper & Row, New Yorkand Evanston, 220 pp. Paperback $1.25. A summary preparedby theeditors of Fortune magazine. A useful introduction to the subject.

Instructions: I Fill out two of these forms by
using a carbon paper.
YtIni and your superviso
should both sign the plan.
Send one copy to
your instructor; keep the other and follow it
In the top row of'boxes place the dates when
you plan to complete each unit.
Place an 'X"
or check mark-opposite each unit under the
)ro er date.
Name:
Headquarters:
STUDY PLAN
TM
,,,
Unit
No.
Subject
Fill in
Dates _>
Remarks
"Ori:Inal" Situation
IIIIMI
..
2Changes in Americ?
shit,.
An1500
L
3Basic Biological
.,
4
,Conceptg
Basic Ecological
Concepts
14
The Atmosphere
6Soils
7fteshwater
8Oceans and Estualles
Natural Areas
and Their Use
_..
10
Wildlife
Employee s Signature
Supervisor's Signature
Study Plan continued
Unit
No.
ill in
l-
FuaPs
----),
Subject
Remarks
11
Population of
Human Beings
12
Solid Waste
Problems
-
13
Persistent Chemicals
in the EnvirGrment
14
Radioactive Fallout
15
Living Space
and Recreation
16
The Law and the
Environment
k

Instructions;
Fill out two of these forms by7
using a carbon paper.
You and your superviso
should both sign the plan.
Send one copy to
your instructor; keep the other and follow it
In the top row of boxes place the dates when
you plan to complete each unit.
Place an "X"
or check mark opposite each unit under the
proper date.
STUDY PLAN
Name:
Headquarters:
Unit
Fin in
No.
Subject
Dates...
Remarks
1"Ordinal" Situation
1
Changes in America
an 1500
Basic Biological
3Contents
Basic Ecological
4Conce is
115
The Atmosphere
6Soils
7Freshwater
8Oceans and Estuaries
1111
Natural Areas
9.
and Their Use
10
Wildlife
Employee's Signature
Supervisor's Signature,
Study Plan continued
Unit
FRIPP-3,
No.
Subject
.
Remarks
11
Population of
Human Beings
4
,
12
Solid Waste
Problems
13
Persistent Chemicals
in the Environment
14
Radioactive Fallout
1
.
15
Living Space
and Recreation
The Law and the
lb
Environment
I1
I
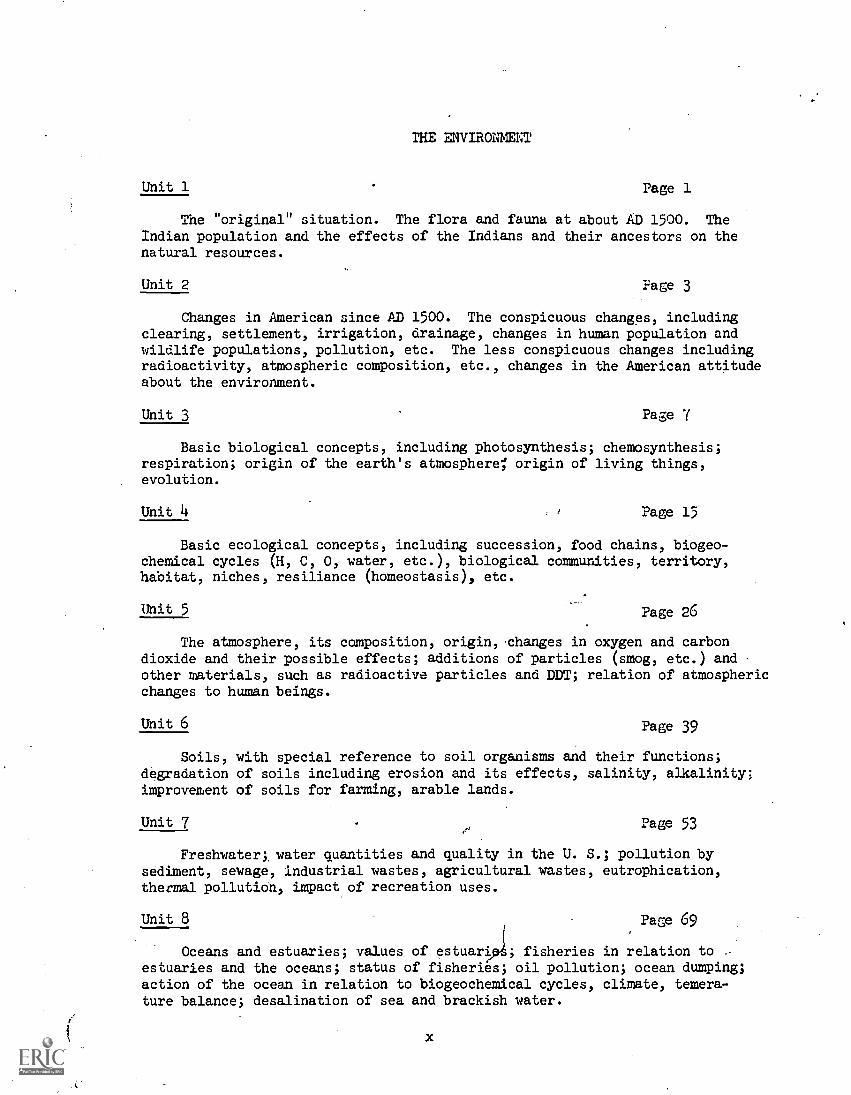
THE EIVIRONMEET
Unit 1 Page 1
The "original" situation. The flora and fauna at about AD 1500. TheIndian population and the effects of the Indians and their ancestors on thenatural resources.
Unit 2 Page 3
Changes in American since AD 1500. The conspicuous changes, includingclearing, settlement, irrigation, drainage, changes in human population andwildlife populations, pollution, etc. The less conspicuous changes includingradioactivity, atmospheric composition, etc., changes in the American attitudeabout the environment.
Unit 3 Page 7
Basic biological concepts, including photosynthesis; chemosynthesis;respiration; origin of the earth's atmosphere; origin of living things,evolution.
Unit 4 r Page 15
Basic ecological concepts, including succession, food chains, biogeo-chemical cycles (H, C, 0, water, etc.), biological communities, territory,habitat, niches, resiliance (homeostasis), etc.
Unit 5 Page 26
The atmosphere, its composition, origin, changes in oxygen and carbondioxide and their possible effects; additions of particles (smog, etc.) andother materials, such as radioactive particles and DDT; relation of atmosphericchanges to human beings.
Unit 6 Page 39
Soils, with special reference to soil organisms and their functions;degradation of soils including erosion and its effects, salinity, alkalinity;improvement of soils for farming, arable lands.
Unit 7 Page 53
Freshwater; water quantities and quality in the U. S.; pollution bysediment, sewage, industrial wastes, agricultural wastes, eutrophication,thermal pollution, impact of recreation uses.
Unit 8 Page 69
Oceans and estuaries; values of estuari ; fisheries in relation to -estuaries and the oceans; status of fisheries; oil pollution; ocean dumping;action of the ocean in relation to biogeochemical cycles, climate, temera-ture balance; desalination of sea and brackish water.
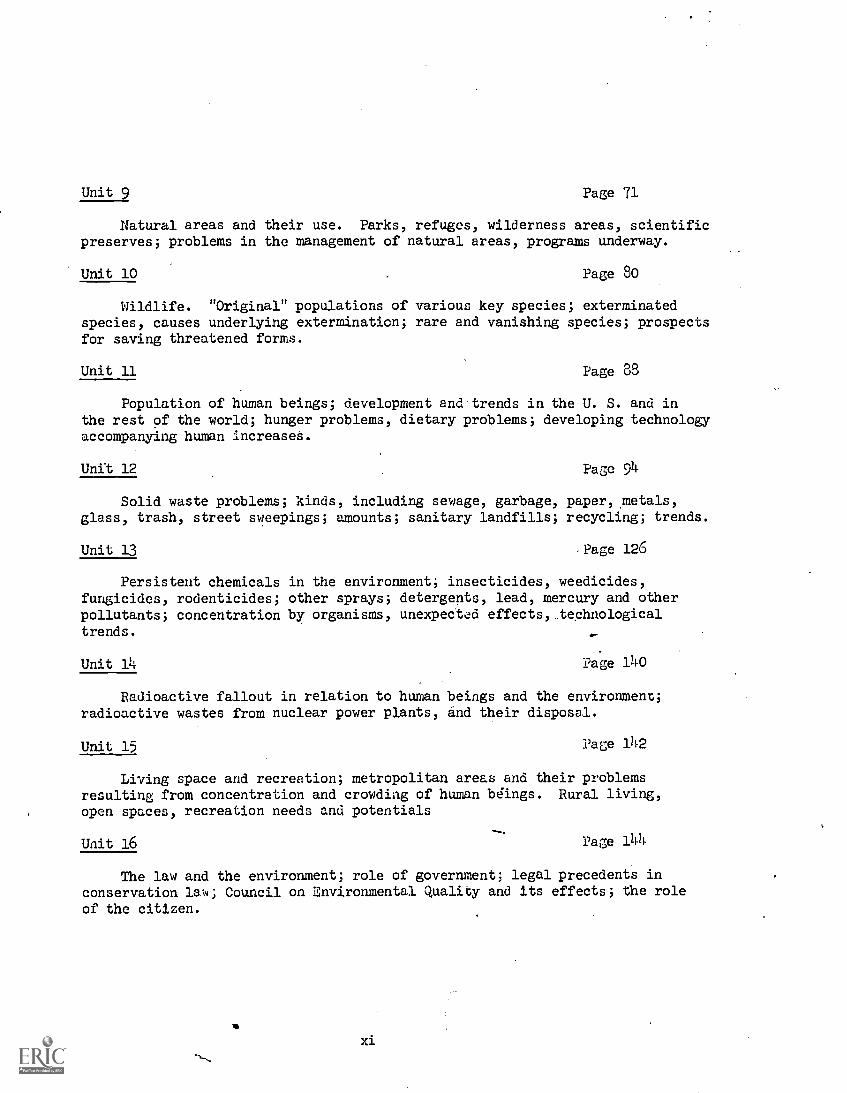
Unit 9 Page 71
Natural areas and their use. Parks, refuges, wilderness areas, scientificpreserves; problems in the management of natural areas, programs underway.
Unit 10 Page So
Wildlife. "Original" populations of various key species; exterminatedspecies, causes underlying exterminaticn; rare and vanishing species; prospectsfor saving threatened forms.
Unit 11 Page 88
Population of human beings; development and trends in the U. S. and inthe rest of the world; hunger problems, dietary problems; developing technologyaccompanying human increases.
Unit 12 Page 94
Solid waste problems; kinds, including sewage, garbage, paper, metals,glass, trash, street sweepings; amounts; sanitary landfills; recycling; trends.
Unit 13 Page 126
Persistent chemicals in the environment; insecticides, weedicides,fungicides, rodenticides; other sprays; detergents, lead, mercury and otherpollutants; concentration by organisms, unexpectod effects, technologicaltrends.
Unit 14 Page 140
Radioactive fallout in relation to human beings and the environment;radioactive wastes from nuclear power plants, and their disposal.
Unit 15 Page 142
Living space and recreation; metropolitan areas and their problemsresulting from concentration and crowding of human beings. Rural living,
open spaces, recreation needs and potentials
Unit 16 Page 144
The law and the environment; role of government; legal precedents inconservation law; Council on Environmental Quality and its effects; the role
of the citizen.
xi
Digest and Summaryof
Problems and Final Paper
Unit 1
Find out all you can about the "original" flora and fauna of the areawhere you live. What tribe or tribes of Indians were there? Prepare abrief report.
Unit 2
What changes have taken place in your area since about 1500 AD?Describe briefly, bringing the story up-to-date. Be sure to include allimportant changes in vegetation, fauna, and earlier populations of Indians.In your judgment, what is the future trend? Turn this in with Unit No. 3.
Unit 3
(Turn in report begun with Unit 2.)
Unit 4
Determine the ecological succession for your area. See detailed dis-cussion for Unit 4 attached. Turn this in with Unit 5.
Unit 5
(Turn in report begun with Unit 4.)
Unit 6
Check the macro-organisms in humus, See detailed discussion forUnit 6, attached. Report.
Unit 7
Find out about the domestic water supply system for you area, alsothe sewage disposal system. When were they set up and by whom? How effec-tive is each now? For the immediate future (5-10 years)? Turn this reportin with Unit 8.
Unit 3
(Turn in report begun with Unit 7.)
Unit
Locate and describe the nearest natural area in your vicinity. Why andhow was it set up, and by whom? How is it administered?
Turn in report with Unit 10.
xii

Unit 10
(Turn in report begun with Unit 9.)
Unit 11
Send in a subject on which you would like to prepare a paper, witha brief outline setting forth major points you might treat. (Avoidsubjects on which you are already well informed.)
Unit 12
Report on how solid waste (excluding human sewage) is disposed of inyour area.
Unit 13-16
Develop your "term paper" and hand in with Unit 16.

UNIT NO. 1
THE I' ORI AKE:.U: CA
Unit :do. 1
The "Original" America
7.!.P.a(1:11g assignment: Odum, pp. 378-403
At your local library,histories, local booksmammals, and the like.material you use (namenumber of pages).
check with the librarian to find countyon trees, grasses, wild flowers, birds,Be sure to obtain correct citations toof author, title, publisher, date,
Assignment:
Find out all you can about the "original" population of Indians,the flora, and the fauna of the area whereyou live.
1. ;,hat tribe or tribes of Indians were there? How manyIndians? What did they live on? Did they migrate or aidthey have settlements? that effects did they have on thevegetation or fauna? Were the effects great or minimal?How do you know this':
2. Depending on the kind of vegetation characteristic of yourarea, what were the dominant species of trees, shrubs, orgrasses? Determine, if you can, the approximate percentagecomposition of the dominants.
3. What mammals, birds, reptiles, amphibians, and fish werepresent? List at least the larger and more common ones.
4. Prepare a report and earn it in.
(Note: In preparing this report, have a look a'.; Unit 2, for which youMay wish to refer to the same local sources.)
- 1 -

HOME STUDY COURSE RESPONSE SHEET
The American Environment
Name: (Block below for instructor use)
Address:
Working Title:
Unit No. & Title:
Date Submitted:
Hours Spent on this lesson:
Date Received:
Date Returned:
Comments:
(Instructor's Signature
Begin lesson assignment below. Use additional sheets as needed.
(If lesson assignment is required, please transmit this response sheetto your instructor along with the assignment.)
- 2 -
al... %v. st
=IT 110. 2
CHANCES SINCE 1500 A D.

Unit No. 2
Changes since 1-.)00
Reading assignment: Odum, pp. 408-431, 432-450, Changes inthe United States.
Wagner: Chapters 2, 1;
Use also local histories, floras, and faunas as noted inUnit 1, together with books on pollution.
As
1. Determine and list the changes that have taken placein your area, beginning with the earl.jcst date youcan find of intrusion by white men. Consider explora-tion, trapping, hunting, clearing, cultivation, soilamendments, drai=ge, irrigation, grazing, any strip-mining, erosion, pollution of waters by varioussubstances, smog, urban development, increases ordecreases in Indian and white population, use ofpesticides, radioactivity. Also consider introducedplants and animalL and their effects (weeds, insects,birds, game animals, fish).
2. Under each kind of change indicate briefly theapproximate magnitude of the change.
3. In your judgment, what trends are indicated in yourarea, for the reasonably near future?
4. Turn in this report with your assignment for Unit 3.
- 3 -

Unit No. 2
Changes in the United States(from about 1:)00 to 1970)
The large-scale, obvious changes
A. Changes in the landscape from "primeval" or "original"conditions:
1. The clearing of land2. The plowing of land and planting of crops3. Pollution of streams, lakes, rivers by erosion sediment4. The draining of wet lands5. The irrigation of dry lands6. The grazing of rangelands by lirestock7. Strip-mining, mine tailings, slag heaps
Damming of streams and rivers9. Growth of metropolitan areas, with associated airports,
superhighways, and other facilities10. Covering of large areas by impervious materials such
as asphalt, concrete, and tar11. Development of smog.
B. Reduction of Indian populations, extermination of some tribes,and Placement of remnants on reservations.
C. Changes in populations of existing animals:
1. Reduction, and in some cases extermination, of dangerousanimals (bears, lions, snakes)
2. Reduction in numbers of certain big-game animals (buffalo,moose,_ antelope, elk)
3: Exterminatidn of 48 species of wildlife, and reduction ofpopulations of 78 others to the rare or endangered category
4. Increases in populations 'If certain birds (bobwhite, quail),and mammals (white- tailed deer)
5. Changes in invertebrate populations have been from slight tocataclysmic, but most forms not studied sufficiently to knowwhat has happened to them. (Includes a wide variety ofanimals, such as crabs, clams, oysters, crayfish, spiders,insects, snails, earthworms, etc.).
D. Introduction of plants and animals, including:
1. Common weeds, generally from Europe (dandelions, ragweed,several thistles, plantains, morning-glory, St. Johnswort,halogeton)
2. Insects (Japanese beetle, cotton boll weevil, bees)3. Virus, bacterial, and fungus diseases (Dutch elm disease,
chestnut blight)4. Trees and shrubs (tree-of-heaven, chinaberry, Scotch broom)
-
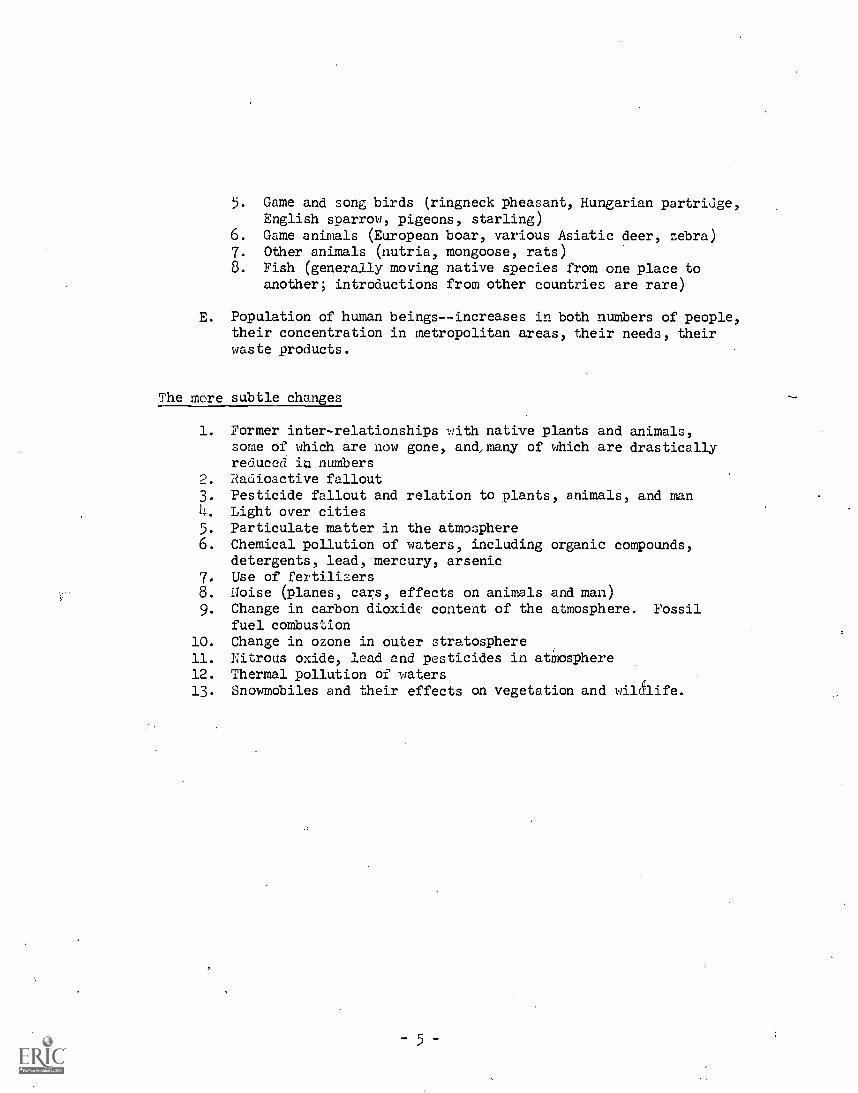
5. Game and song birds (ringneck pheasant, Hungarian partridge,English sparrow, pigeons, starling)
6. Game animals (European boar, various Asiatic deer, zebra)7. Other animals (nutria, mongoose, rats)8. Fish (generally moving native species from one place to
another; introductions from other countries are rare)
E. Population of human beings--increases in both numbers of people,their concentration in metropolitan areas, their needs, theirwaste products.
The more subtle changes
1. Former inter-relationships with native plants and animals,some of which are now gone, and,many of which are drasticallyreduced ire numbers
2. Radioactive fallout3. Pesticide fallout and relation to plants, animals, and man4. Light over cities5. Particulate matter in the atmosphere6. Chemical pollution of waters, including organic compounds,
detergents, lead, mercury, arsenic7. Use of fertilizers8. Noise (planes, cars, effects on animals and man)9. Change in carbon dioxide content of the atmosphere. Fossil
fuel combustion10. Change in ozone in outer stratosphere11. Nitrous oxide, lead and pesticides in atmosphere12. Thermal pollution of waters13. Snowmobiles and their effects on vegetation and wildlife.

HOME STUDY COURSE RESPONSE SHEET
The American Environment
Name. (Block below for instructor use)
Address:
Working Title:
Unit No. & Title:
Date Submitted:
Hours Spent on this lesson:
Date Received:
Date Returned:
Comments:
(Instructor's Signature
Begin lesson assignment below. Use additional sheets as needed.
(If lesson assignment is recuired, please transmit this response sheetto your instructor along with the assigment.)
- 6

UNIT ITO. 3
BASIC BIOLOGICAL CONCEPTS
Unit No. 3
Basic Biological Concepts
Reading Assignment
The Oxygen Cycle, by Cloud and Gibor.
Some Basic Biological Processes, prepared byR. Van Dercal.
Production and Decomposition in Nature, pp. 24-33of Odum's Ecology.
Assignment
1. Turn in report begun with Unit 2.
2. Begin (if you have not already done so) clippingnewspapers and magazine accounts of any sort dealingwith the environment. Organize these by subject-matter, in large envelopes, or pasted into sheets in3-ring binders.
Continue this clipping collection throughout thecourse.

Photosynthesis
Unit Jo. 3
Some Basic Biological Processes
All green plants and certain bacteria are able to manufacturesugar from water and carbon dioxide. Animals cannot do this; buteven so, animals must have sugar as a basic food in order to liveor survive. This is why we say that animal life and human beingsdepend on plants.
The process that goes on in green plants, everywhere, onland and in ponds, or streams, or the ocean, is called photosynthesis.It works like this:
producesWater + carbon dioxide sugar + oxygen.
This is the synthesis part of the word photo-synthesis.Synthesis means to build or put together. Water, added chemicallyto carbon dioxide produces sugar and oxygen. But this synthesis oradding together can only go on in the presence of sunlight, and onlyin plants containing green color, or chlorophyll. If we show theprocess correctly then,
sunlightWater + carbon dioxide 4 sugar + oxygen
chlorol5hyllThis appears pretty simple. But scientists are still not
entirely surehow plants can do this. We humans so fax have not. been able to do it ourselves. We know what the plant starts with;we know sunlight provides the energy; we know chlorophyll helps ithappen; we know some of the intermediate products; and we knowwhat the end products are. If we coUld'do it, we could manufactureour own sugar from water and carbon dioxide. As it is, however, wemust still depend on green plants to do it. We eat them for food,or ve eat animals that feed on plants.
Kotice one other thing. Oxygen is a product of photosynthesis.We have to have oxygen also, and green plants keep the atmospheresupply of oxygen replenished. There is no other source of oxygenof any importance. If anything happened to retard 3r erre t photo-synthesis, the world would soon be in trouble. Gra3v11y, shouldthis happen, the atmospheric oxygen would be used up by animal life.There would be no replenishment of oxygen, and animal life would cometo an end when the oxygen supply got low enough.
Thus, photosynthesis is important to us in two ways. It providesus with sugar--L.he basis for our proteins and protoplasm. Andl-it keepsreplenishing the oxygen in our atmosphere. We must have this oxygen tosurvive.
(s shown here, irld in many texts, the first product of photosynthesisis said to be simple sugar. Actually the specific carbohydrate in-

volved cannot h4 6csign:,ted on the basis of &vailable information.Thul a more correct chemical equation would be:
+ 6H2o ) (cH2o)n + .602
The presence of sunlight is re,luireC for the first part of theprocess, but photosynthesis is not a single photochemical reaction.A thermochemical reaction, not affected by light, and apparentlyrequlring 6arknecs, follows the photochemical one.)
9

Chemosynthesis
Once a simple sugar has been made by a green plant (and oxygengiven off in the process), the plant goes on to build a series ofother compounds known as carbohydrates. These carbohydrates consistof many kinds of sugars--such as glucose, the first product of photo-synthesis; sucrose or table sugar, starch, and cellulose (of whichmost paper is made).
Carbohydrates are chemical compounds that contain carbon, hydrogen,and oxygen. The hydrogen and oxygen are present in the same proportionas they are in water (thus, hydrates). Most people know that water isn20, which means that a single molecule of water contains two atoms ofn,..c.rogen for each atom of oxygen.
Green plants don't have to have sunlight to build these latercarbohydrates; they can do it in the dark. And, they don't needchlorophyll either, excep'; for the first carbohydrate, basic to allthe rest. Even a fungus such as a mushroom entirely lacking chlorophyll,can build carbohydrates if it can get the simple sugar to start withby decomposing dead plants or animals.
Animals can build carbohydrates also, as long as they can getglucose or a similar carbohydrate as a starter. They form sugars andstarches that are only slightly different from those formed by plants.Animals can also manufacture fats; plants can likewise build oils, fats,and waxes.
Some animals proceed to develop chitin--a hard, horny material thatmakes up the hard shell-like parts of insects. Plants develop lignin- -the hard material of mood. Both chitin and lignin are carbohydrates- -with the same ratio of 1 part of hydrogen to 2 parts of oxygen.
. By adding nitrogen, phosphorus, calcium, magnesium, sulfur, andsome other chemicals to the carbohydrate materials, plants as wellas animals can manufacture proteins. This process is chemicallyhighly complex. It results in giant molecules that inturnare builtinto protoplasm, the living substance of the plant or animal. We donot know how this is done either, although we know a great deal aboutthe building blocks, many of the intermediate steps, and the endproducts .
Proteins, (and thus protoplasm) always contain nitrogen whateverother elements they may have. They occur only inside the living cell,and under natural conditions they are never found outside it unlesssecreted or given off by the living cells themselves.
Most plants cannot take nitrogen from the air, although there isplenty of it in the atmosphere. They must get it from the soil in theform of nitrates. Nitrates are made available to the roots of higherplants by the activities of the micro-organisms that live in the soil.Some of these microbes produce nitrates when they decompose deadanimals and plants. If they did not do this, higher plants could notget nitrogen for protein and protoplasm building. Thus, decay is avery important process indeed.
Given the elements we have noted so far, plus a few others forsome special products of both plants and animals, living organismsdevelop all the hdst of chemical materials necessary for life andgrowth.
- 10 -
Respiration
Everyone learns in school that we humans must have oxygen tobreathe. Our lives depend. upon it. It is also true that almost allanimals and plants depend upon oxygen for their existence.
This comes about because plants and animals, including humayls,get their energy from a chemical process known as respiration. Youwill remember that plants can manufacture sugars from carbon dioxideand water. In doing this, they use the energy (the.light) of the sun.The sun's energyis locked into the sugar that is built up by photo-synthesis.
The energy in a sugar, for example, can be released in a processthat is essentially the reverse of photosynthesis, thus:
Sugar 1- oxygen _____) carbon dioxide, plus water, plus energy.
The energy released is heat, instead of light. This is the processof respiration. Actually, the process is a great deal more complicatedthan we have shown it here. We note simply that respiration freesenergy needed for life end growth. You'and I, and the higher animalsinhale oxygen and exhale carbon dioxide. The actual process ofrespiration takes place in our lungs.
You will note in the littlec chemical equation above that oxygenis added to the sugar. This adding of oxygen to sugar - -or any othersubstance--is called oxidation. Incidentally, oxidation is one chemical_process you can actually see. Burning, say of paper, is the oxidationof the carbohydrate of which paper is made. Oxidation of iron producesrust, and rust is iron oxide.
So far we have talked about photosynthesis andstarting from carbon dioxide and water, and leaCingcontaining,additional key elements for their manufac
To understand our environment, we need to note
Summary
chemosynthesis;up to proteinstune.
several things:
1. Green plants alone (with-a few rare exceptions) are able tosynthesize simple sugars which are basic to later chemo-synthesis. They get carbon dioxide from the air to do this.They get water from the soil. Plants growing in the wateruse carbon dioxide dissolved in the water, and of course,absorb water directly.
2. One of the products of photosynthesis is oxygen.
3. Both plants and animals, given the simple sugar resultingfrom photosynthesis, can build many other chemical compoundsincluding carbohydrates, fats, oils, waxes and other materials.
Both plants and animals can build proteins, and ultimatelyprotoplasm, the living substance, from carbohydrates andother elements including nitrigen, phosphorus, calcium,
magnesium, and sulfur.

This whole buildineprocesssynthosisties up the elements inplant and animal bodies. Unless there were some way to break down theplant and animal products, all these elements would ultimately be tiedup in the dead bodies of plants and animals.
Thanks to the living organisms of the soil, and of the fresh andsalt waters of the.earth, the complex chemicals of plants and animalsthat die are br6ken down again into simpler compounds. Among these arecarbon dioxide, nitrogen in the form of nitrates or ammonia, and variousforms of sulfur, magnesium, calcium, and phosphorus.
-12-

Cycles
There is another way to look at the whole process of photosynthesis,chemosynthesis, and decay. We could follow various elements as they moveinto plants and back to the earth or into the atmosphere.
Carbon, for example, moves from the atmosphere into simple sugars,'N thence into proteins, theade to protoplasm and finally to carbon dioxide
again as plants are decomposed. We refer to this es the carbon cycle.There are others. Hydrogen goes from :eater into carbohydrates, then
Proteins and protoplaam, thence bock to water again. There is a. nitrogencycle, an oxygen cycle, and so on.
If any of these cycles rere to be seriously interrupted, life mightnot continue on the earth. Suppose, for example, that the decay organismsin the soil were Poisoned wholesale by some compound or other that mankind.ict loose. The result wouldbe an interruption of the carbon cycle, andlivinr, things would come to an end.. Cr, suppose we. managed to poison theoceans where floating plants recycle aboutte, :aircl of the carbon in ourworld. Again, we 1iou3d expect a serious yhterruption or breakdown of thecarbon cycle on which we--es all other living organisms, are dependent.
Or, suppose the particular soil organisms responsiblefor nitrateproduction--and there are not top many of these spedies--eere destroyedby a chemical or by a radio-active substance: that humans let loose. Hereeould be an interruption of the nitrogen`` cycle that could cause life onthis planet to. cease.
low note: No interruption .Suggested here has taken place. Nor doee believe that it is lik.ely_to, just as long as ,tae humans.know what we aredoing and avoid action that may act against us. What this means is thatee need to continue and improve our scientific research so_ that we can pre-dict with certainty what may happen as we change or manipulate ourenvironment.
We should note that human beings are really not critically necessaryor important in the general biological cycle. We exist only because plantsprovide us the oxygen to breathe and the sugar basic to our living chemistry
Actually, We can say the same thing about all animal life. Animals,either individually or collectively, depend on plants, both for basicsugar and oxygen. It is true that many animals, especially insects, pol-linate the flowers of the angiosperms. Birds and rodents disseminate theseeds of many plants. There is avast complex of these and other inter-relationships. Basically however, plant life does not depend on animallife. Although the composition of vegetation would be greatly changedif all animal life were to disappear, nevertheless the planet would con-tinue to be clothed with vegetation.. On the other hand, if all Plant lifewere to disappear, animal life would disappear also.
If there is a lesson to be drawn from. such considerations, howeverspeculative, it is that we need. to be sure we are living in especiallygood harmony with the plant life on which we depend.
-13-
Name:
HOME STUDY COURSE RESPONSE SHEET
The American Environment
Address:
Working Title:
Unit No. & Title:
Date Submitted:
Hours Spent on this lesson:
(Block below for instructor use)
Date Received:
Date Returned:
Comments:
(Instructor's Signature
Begin lesson assignment below. Use additional sheets as needed.
(If lesson assignment is required, please transmit this response sheetto your instructor along with the assignment.)
- 14 -

UNIT NO. it-
'RA3IC ECOTO3ICAL CONCEPTS

Unit :o. 4
Dr.'sic Ecological Concepts
leading Assignment:
Read the attached material entitled Ecology first, it willhelp you unCerstand the more difficult material that follows.
Food chains and-webs: Odum, item 4, p. 63 and p. 225Territory: Odum items 15, p. 209Habitat, niche: .Cdum item 1, p. 234Homeostasis: CduE, item 4, p. 33Cycles: Cdum, item 1, p. 86, item 2, p. 93Communities: Odum, item 1, p. 140Succession and climax: Odum pp. 251-269Ecological balance: Brubaker, p. 83-86:loteiadditional reading at the end of the problem.
Assignment:
Determine ecological plant succession in your area. See
problem for Unit L attached. Turn this in with Unit 5.
- 15 -

Problem: (for plant succession) Unit 4
Identify the stages in plant succession from the initial invasion ofa bare area to the climax vegetation.
The "bare" area can be either bare rock, a sandy place, a cultivatedfield, or a pond (preferably a natural one). Choose one, then follow:
Generel procedure:
Bare rock: Examine the rock or rocks carefully, noting any indicationof plant or animal life--such as lichens, mosses, anygrasses or forbs. Which takes ap residence first? Next?At the base of or in the cracks or crevices of the rocks,note vegetation present. Any way to tell how long beforethis vegetation will cover the rocks? What plants will
follow? What kind of vegetation will be there, ultimately?
Cultivated field: Check fields in your area that were once cultivated(get the dates of last cultivation). Check a 1-or-2 yearold field. What: plants come in to start a succession?After these pioneers, what comes next--and about when?And next, and next--get these later stages by checkingfields cultivated 5, 10, 20, 30 years ago, or earlier ifyou can find one. What kind of vegetation will be hereultimately? Grassland? Forest? Chaparral? And what willits dominant plant's be?
Pond: Study the vegetation in the pond. Fish out some of the waterplants. Ho many kinds? Abundance? (Note that algae arepresent, usually, in the summertime. These are the realpioneers in a pond, but it takes a microscope to see them,unless you find floating or submerged massesof green "slime" in the ?ond. These contain millions ofindividual miscroseopie plants.) Next, note the vegetationaround the edges of the pond. How deep is the water wherethey grow? Can you identify rushes, sedges, cattails?Any shrubs coming in behind these emergent plants. Then
what? And next? What kind of vegetation will ultimatelygrow on the pond site, once it is filled up? And whatcauses it to fill up'! Have you any basis for estimatinghow long before the ?ond will fill up?
Sand: (Or gravel-rock fragments) A bit of desert, or spoil from astrie-mine, or a beach along the seashore or a lake edgewill do. Check the plants that seem to be invading orpioneering. `:hat comes next--and next, and next. Whatkind of vegetat'n7 will ultimately inhabit' this area? Howdo. you know 4.s: How long will it take? And on what basiscan you estimate this'I:eriod of time?
For hatever plant succession you have chosen, try also to note theanimal life present at each stage. Include insects, moms, spiders, and
-16-

other invertebrates. You may need a hand lens for this. Do as muchideatificatj'n as you can, but don't worry about species. Use namessuch as web-arlider, hunting spider (no web), earthworm, insect (but-terfly, beetle, ant, etc., if you can). Did any plants or animalsformerly live here that are now gone? What happened to them?
For each stage in succession that you can identify, list thekinds of plants and animals present and mark the commonest or dominantones.
Note: If you live in an area where they occur, you may want tostudy the succession on an abandoned ant hill, or on a kangaroo ratmound or even a prairie dog mound. Approach any one of these the sameJay as above, noting pioneers, then successive stages to climax vege-tation.
Read the appropriate chapters in Odum's Fundamentals of Ecology(Chapters 11, 12, 13, 14, whichever fits your selected problem, plusin all cases, chapter 9.)

Ecology
LIcLenidsts have binn studying the relationships bateeu mr,n and hisenvironment for many years. The more such matters have been studied,the more complex and difficult some of there inter-relationships haveproven to be. What .;e thouEht were quite simple and direct relationshave turned out to have a bewildering variety of indirect side effects.The scientists qno study such things--the ecologistsare frequentlyunable to provide clear and certain answers for our environmental problems.
Even so, ecology, or the ecological way of thinking, has a great dealto offer. :lb ecologist would claim to be expert in all the many sciencesthai., must often be brought to bear on an environmental problem. Butecologists know how to attack these problems, and they are fully awareof the need for combining forces, so to speak, in attempting to arrive atsolutions. They know how to ask the right questions.
Ecologists have a disciplined: habit of looking ahead at v'riouspossibilities. For example, if we undertake to kill mosquitoes, whatother living creatures may be affected? What of the birds or otherinsects that feed on mosquitoes? What will they feed on once there areno mosquitoes left? How such changes affect man? Ecologists go onasking questions like these, oftentimes embarrassing questions that maytake a great deal of scientific research to answer. We tend to getimpatient with people who think this way, especially if there is money tobe made in what we want to do. And so, generally, we have not listenedto our ecologists. In fact, we have often not wanted to. Frequently,if we did listen, we might take a quite different course, or possibly wemight take no action at all.
Many years ago, Charles Darwin, the great naturalist, used to tell astory about ecological relationships. He said that wherever there wereold maids, there was likely to be more clover aced. Old maids keep cats.Cats eat mice. lice eat bumblebees. Bumblebees Pollinate clover so thatit sets seed. The more old maids there are, the more cats there are.The more cats there are, the more mice they 4i11 catch. The less micethere are, the more bumblebee there can be. The more bumblebees, themore clover they will pollinate- -and the more clover seed will be Produced.
This may sound like a far-fetched story. But actually it is a lotmore simple than some of the relationships that have bee a fairly wellworked out.
At first sight the relation between men and his environment appearsrelatively simple. If you got a disease, you took a medicine that wouldstop it. If you foulac: an insect peat eating your crop plant, you developeda spray that would it. If mosquitoes bothered US, why, we sprayedoil or insect killers on all nearby water areas, and then our summerbarbecues could proceed without the pests. We had an idea that for almostany ill that beset us, all we had to do was develop a remedy for it. Asort of one - two operation.
But, as it has turned out things are more complex than that. Thefact is that some, indeed most living relationships are not one - twomatters at all. Many of our medicines have produced side effects worsethan the illness they were intended to cure. Many insect pests were ableto survive the poisonous sprays we used; the survivors bred and developednew generations of insects resistant to the sprays. The complex andintricate relationships among living organisms have,almost always been
- 18 -
eatremely difficult to unravel. It has frequently taken many years ofpatient, expensive study to learn about even the simpler ones. Forexample, from the time malaria was first reported by Hippocrates in the5th century B.C., it took humaakind 24 centuries to find out what causedthis disease and how a man could get it. This disease was possibly themost widespread of all diseases that affect humans. Just at the tarn ofthis century three Italian investigators reported that malaria was probablycarried by a certain type of mosquito. Most people know--or think theydothat a certain mosquito carries malaria. But, we know now that thereare a'uout 35 different species of mosquito that can carry the disease.They are all anopheline uosquitoes and they are found nearly throughoutthe world. They are commonest in the tropics, but they are found in thefar North as well.
These mosquitoes live and reproduce for the most part in wet places- -in streams, ponds, small bits of water. The males live on plant juices.The females live on blood ot animals, including man. If they cannot getblood, they cannot produce fertile eggs. They carry four differentkinds of parasiteseach of which will produce a particular kind ofmalaria in man. A man can have more than one kind of malarial disease.
This is not too complex perhaps. But there are other kinds of malariathat affect apes, monkeys, birds, and reptiles. And other kinds ofmosquitoes transmit these diseases. One may cross-transfer from man tochimpanzee, but this cross-transfer is rare. Even so, we learned muchabout human mvlaria by studying malaria in birds, rats and mice.
We attack the parasitewhich is a living organism--in man, with drugs.Quinine was and still is widely used. But other, better and newer drugsare now known.
However, we have also undertaken to control the spread of malariaby attacking the mosquitoes. We screen our houses, put screens overour beds--and better yet, we try to destroy the mosquito populationswhere they breed. We used DDT, dieldrin, chlordane, to kill the juvenileor larval forms of the mosquitoes in the water. This worked pretty well.However, such chemicals also destroy a lot of other animal life. DDTdoesn't go away right away. It accumulates in fish, in birds. We eatfish and birds and pretty soon, we have DDT in our systems as well. Wedidn't intend for this to happen. Many birds may die from eating toomany little fish with DDT in them. Ducks die and the sportsmen don'tlike that. Fish die, and the aporLsmen don't like that, either. Andpretty soon a government ai;ency condemns fish reared in ponds, for sale.And the fish producers don't like that.
All sorts of bizarre and unexpected things result from our verydirect--and "limple"--efforts to control mosquitoes. Legislators becomealarmed and pass laws about using chemicals. Various government depart-ments make regulations--and so, on and on, as the inter-lacing networkof effects takes place.
There are many other examples we could describe that show how complexthe relation of man is to his environment. One of these-ha to do -withPeter Rabbit, who almost became a world-wide problem, and who might yet.
Our domesticated rabbit came originally from Europe. The wild .eormlooks very much like the cottontail of oir country, but re is a vastdifference between them. The European rabbits dig holes and they livetogether in large communities. The areas where they live, in an inter-lacing network of underground burrows are called rabbit warrens. Americanrabbits do live in holes or old logs, but they do not dig holes or burrows
- 19 -

of their e,:n. Sirapie, ze
In Europe the rabbit aas dolaaaticated centuries ago, and there areno-, many different breeds. It 4:ad as a food, inaeed it as andis considered in many places as a great delicacy. rabbit skins havebeen used in uhe fur -crude _or a long time, arc the fur has ciao been ofconsiderable importance for ;he making of felt- -for hats and otherarticles. The animals have been common household pets. ;al told Peteraabbip is widely knowa in the aorld, :'or onc revisor: or another.
But despite its value as a pet, or fur, or food animal, the Europeanrabbit is a very oerious pest of agriculture. Rabbit warrens may beof almost any size, but ::hen they cover hun,:reds of acres in a badlyinfested area, the rabbias leave essentially no forage for co, . or sheepor other livestock. Any treed present are trimmed up to two feet abovethe ground, and their bar'; is gnawed. In such eituations agrimlture isfor all practical purposes impossible. The animals increase rapidlyunder favorable conditions. They breeG tot times a year and produce3-8 young in each litter. They begin breediag at about o moraah of age.
European rabbis have been introduced into raay parts of the world,partly for sport, Paraly for food an, fur, a_ id for other reasonr. kttempLa
introduce them hava sometimes4ailci and sometimes succeeded. Theyspread over Taomania about 1330 (*id widely over Australia beginningabout 18-;s9. Some two-thirds of the Australian continent became infestedwith them. Some 70 alllioa rabbit skins were shipped; from Australiaannually for a number of years. From Australia the rabbit was taken toJew Zealand. There, the early introdaa'aons were not successfal, but by a-bout 1864 it got going, and within 1_ ears it has increased enormously.Early in the present century it waQ arried to Chile in South America whereit soon became a serious pest. I. the island of Tierra del Fuego off thesouthern tip of Cnile, it reache plague numbers by 1947.
Finally, and ominously, this rabbit is flourishing on the San Juanislands off the coast of the State of Washington. IA 1924 a countshowed 30 rabbits to the acre. These rabbits have been offered to sports-man clubs and others to "restock" areas where our native cottontails aretoo few for good hunting. They were called "San Juan rabbits." Thousandswere released in various places, but fortunately for American agriculturethe introduction did not succeed.
Wherever the rabbit flourished and became a pest, all sorts of effortswere made to reduce the ova:whelming numbers. In Australia great barrierfences many hundreds of miaes long were erected to stop the spread ofthe pest. Poisons were used, and these resulted in wholesale
destruction of other forms of wildlife. Trapping and shooting were tried andthe use of poison gas.
In New Zealand rabbit-proof fences were also erected, and thousandsof stoats, ferrets, and weasels were brought in to help control the pest.Local Rabbit Control Boards were set up and a central Rabbit DestructionCouncil was developed to coordinte the work of the local boards.
By and large rll the efforts produced little effect on the rabbitPopulation.
In the meantime in South America a disease wired out nearly all therabbits that were being used in experimental ;:ork in a laboratory inNontevideo, Uruguay in 1:1;5. Later on the Teed se flared up amohg Cfcmesterabbits in ;,rgentinc., Bcii, ant' scchern Californa. The death rote wasbetter than 99.3 percent, :.hat is, only one rabbit in n.") :,arvived; Thisis fax more deadly than cholera ?lazue. ?he disease was caused by airous, was foanC, to be spren:: byrle:s o3,1uitoes. :t -a: also found to hav-: no e2fot ol America.:

rabbits or on other domestic animals, or man. .Quite naturally, oncetliese facts were known, attempts were made to introduce myxomatosis intoEurope an; Austrslia, but without, success.
An6 then, in 19".), the Aust14,lian glvernmeni; deeiden to try once more.I.IfecteC rabbit.: ere let L:o in s.ven loca'yions. ik)thing happened in sixof these, but the disease flared up in one area and begat to spreadrapidly. Within a half-doa:en months, the disease had covered more thana million square miles and by 19% most of the enormous population ofrabbits in Australia had been wiped out.
The Australians were elated. They figured that the increase insheep production wan worth 50 million pounds a yearbecause the rabbitswere gone that formerly ate no much of .the forage on which the sheepcould otherwise feed.
In New Zealant: the myxoma virus didn't work, apparently becausethere are no carriers. And thus, at great expense to the government,airplanes fly up and down the ravines, scattering poisoned carrots.They are followed by hunters with dogs, flame-throwers, and guns to wipecut any remnants. Forage improvement is noticeable almost at once.
In 1952 a retired physician in France inoculated two rabbits withmyxoma virus and let them loose on his estate near Paris. By 1956about nine-tenths of the wild rabbits in France, were gone. The diseasespread widely in Eurooe. It reached England in 1953 and by the endof 1954 was distributed throughout England and Scotland and Wales withsome areas unaffected. By 1956, about 99 percent of all rabbits inBritain were gone.
The disease was introduced in Tierra del Fuego in 1953 and withintwo years the population was substantially reduced.
For awhile, it looked as though myxomatosis had solved the problemof excessive rabbit population except in New Zealand. Farmers couldbreathe easier. The pest was apparently dead and gone.
But the kill was not 100 percent. It was 99.5 percent. A tinyfraction of the population of rabbits survived. Ope rabbit in 200did riot die--and there :ere millions of rabbits. And gradually, sincethe great epidemic in Australia, the disease-resistant rabbits have comeback, slowly, locally. The scientists believe that the population hasreached about 10 percent of what it was, and that it has stabilizedat this level. Perhaps it has. Perhaps it has "stabilized" becauserabbit control boards of one kind or another continue with poison,shooting, trapping, fencing, and other measures. Or perhaps all thesemeasures are not needed. In the meantime, scientists are working toproduce-more virulent strains of the myxoma disease. Almost certainly,we have not seen the last of the Peter Rabbit in Australia, certainlynot in Nem Zealand, and just possibly not in the United States. Someirresponsible person may yet succeed in getting the European rabbitto live and breed successfully in some part or another of America. Andaway we go!

Food Chains
One series of relationships that we will need to keep in mind isknown es a food chain. We can illustrate a food chain by a simpleexample.
1. Simole, floating, microscopic plant8 (plankton) in a pondare eaten by microscopic animals.
2. The microscopic animals (nekton) are fed upon by small, water-living insects and other tiny animals, such as crustaceans.
3. The water insects and crustaceans are eaten by small fish.
4. The small fish are eaten by larger ones.
5. The larger fish are caught and eaten by fish-eating birds,or perhaps by human beings.
6. The fish-eating birds are killed and eaten by foxes or by hawks.
7. The foxes are killed and eaten by bears or lions.
8. The lions or bears or hawks die and are fed upon by soilorganisms that release chemical materials. These materialsmay get into streams and thence into ponds where they areused by plankton.
There are hundreds of such food chains known, and probably manythousands that have not been studied.
Human beings enter such a food chain at various points. We maycatch and eat the larger fish. Or, we may shoot the birds that feedon the fish. Or we may shoot the bears or lions that feed, in partperhaps, on the fish-eating birds.
-22-
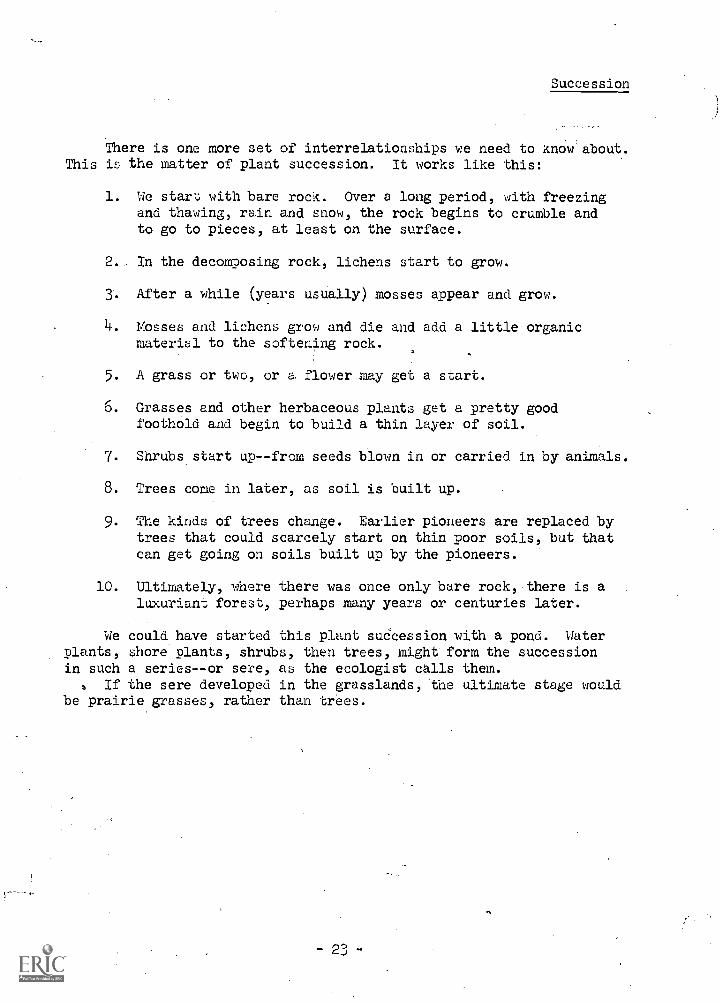
Succession
There is one more set of interrelationships we need to know about.This is the matter of plant succession. It works like this:
1. We start with bare rock. Over a long period, with freezingand thawing, rain and snow, the rock begins to crumble andto go to pieces, at least on the surface.
2.. In the decomposing rock, lichens start to grow.
3'. After a while (years usually) mosses appear and grow.
4. Mosses and lichens grow and die and add a little organicmaterial to the softening rock.
5. A grass or two, or a flower may get, a start.
6. Grasses and other herbaceous plants get a pretty goodfoothold and begin to build a thin layer of soil.
7. Shrubs start up--from seeds blown in or carried in by animals.
8. Trees come in later, as soil is built up.
9. The kinds of trees change. Earlier pioneers are replaced bytrees that could scarcely start on thin poor soils, but thatcan get going on soils built up by the pioneers.
10. Ultimately, where there was once only bare rock, there is aluxuriant forest, perhaps many years or centuries later.
We could have started this plant succession with a pond. Waterplants, shore plants, shrubs, then trees, might form the successionin such a series--or sere, as the ecologist calls them.
If the sere developed in the grasslands, the ultimate stage wouldbe prairie grasses, rather than trees.
- 23 -

Secondary Succession
Once a succession or sere is interrupted--for example by thecultivation of land for crops--the plant succession comes to a halt.It stays that way until the interruption stops-for example, a farmerstops cultivating a field. Then what is called a secondary successiontakes place--for example:
1. Cultivated field
2. Annual weeds and grasses of many kinds
3. Perennial, longer-lasting weeds
4. Shrubs (such as blackberries)
5. Trees of a. pioneer sort (such as hawthorns or red cedars)
6. Forest of trees and shrubs
7. Climax forest
We have used a new term here--climax. This is the association ofplants that will keep on reproducing itself as long as the climatedoesn't change. In this case, it might be a sugar maple--beech foresttypical of many parts of New England. Or it might be a douglas firwestern cedar forest., Depends on the climate and geographical area-(See Odum, p. 264)
You can see secondary successions starting on road cuts, pathsthrough fields, banks, even piles of dirt excavated from a building.First come annual (1 year) weeds, then perennials (dandelions, plan-tains) then shrubs (blackberries) then trees--providing the disturbedareas are left alone long enough. (See Odurn p. 261)
-24-

HOME STUDY COURSE RESPONSE SHEET
The American Environmenl;
Name: (Block below for instructor use)
Address.:
Working Title:
Unit No. & Title:
Date Submitted:
Hours Spent on this lesson:
Date Received:
Date Returned:
Comments:
Instructor's Signature
Begin lesson assignment below. Use additional sheets as needed.
or
(If lesson assignment is required, please transmit this response sheetto your instructor along with the assignment.)

UNIT NO. 5
THE ATEOSPHERE

Reading Assignment:
Assignment:
Unit ro. 5
The Atmosphere
The Atmosphere and Life by Van Dersal
Odum, p. 86-99, 4114-4)A5
Air Pollution Primer by Carmen
Wagner, Chapter 10
Brubaker, pp. 87 -96, 149-156
Turn in report begun with Unit 4.
26

The Atmosphere and Life
Our earth, es a pl.bnet, is believed to have originated about 4.5 billionyears ego. At the time this took place, the crust of the new, pleneb wascomposed elmost entirely of solid rock; it hac3 no atmospheresurroUndingit, as it does today. Bat by about 3 billion years ago, or possibly alittle befoee that, an atmosphere of sorts had developed. This was quitedifferent from the atmosphere we know now. 'There was no free oxygen init: rather it seems to have been-made up mostly of methane, ammonia, ni-trogen, carbon monoxide, hydrogen, and meter vapor. Other gases, poisonousto life, were present also, such as chlorine and hydrogen sulfide. Therewere, of course, no-living things present at all.
How can we possibly know these things billions of years later may seem veryremarkable. Such facts as we have, have been worked out by hdndreds ofchemists, biologists, physicists, geologists, astronomers, and others.Through their painstakiiig studies we have learned a good deal about thecomposition of the sun end of our planet. The rocks laid down millions orbillions of years ago have been examined for any evidence of living things.We were looking for any 'fossils, even microscopic ones, or for any evidenceof the chemicals that are characteristic, of living things' The scientistsmaking such studies Tthe first to admit that there are simply enormousgaps in our knowledge: But gradually the facts have added up and our under-standing has increased. What we have-saidrTn the first paragraph above, asWell as what follows next, is based on very careful work and very cautiousconclusions about-what has been dibcoVered
To return to the planet's first atmosphere, at the time it was developing,as from the very beginning, ultra-violet radiation from the sun was reachingthe surface of the earth. The first atmosphere would not screen these harsh'rays, which would have killed any living thing exposed to them. However,the ultra-violet light, or perhaps electrical discharges, or both, had a very,remarkable effect on the gases of the early atmosphere. They caused suchchemicals to combine in various ways and to form complex substances includingamino acids. These same combinations have been successfully made in thelaboratory. They have also been found to take place in meteorites from else-where in our solar system or even from outside it
The amino acids formed in such a way are of great importance. They are complexchemicals themselves, 'out even so; they
and animals.to form protoplasm, the living substance of the human body as well as of plantsof as the "building blocks" of proteins. And, it is the proteins that combineform proteins, which are-still more complex. The amino acids are often spoken
the right conditions to
The studies made so far lead to the belief thit' some very simple' livingorganisms developed', probably in the lower levels of pools or bays. There,they would be safe from the deadly ultra-violet. They are thought to havelived by a process of fermentation on the organic _materials sinking down tothem. These materials were the amino acids and other substances developedfrom the ultra-violet irradiation of the atmospheric gases ebove.
-
, These oldest organi-sMs of the fermenting type were something like the minute,-spherical bacteria of the present day. They were microscopic, very simple,very primitive, one-celled, sexless, and unable to manufacture their ownfood. We are not sure that the oldest fossils discovered in the geological
- 27 -
record are these first organisms. The very oldest such fossil existedabout 3.2 million years ago. Whether it is indeed one of the oldestforms, or a form that developed a little later is not certain.
Incidentally, such dates as the one just mentioned have been worked outby some very ingenious methods. Various radioactive substances thatcontinue radiating for hundreds of millions or billions of years can beused to determine the age of a given rock in which a fossil is found.The rate at which the element's radioactivity decays is known, and thiscan be used as a measure of length of time it has been in:the rocks inwhich it occurs.
The very oldest organisms probably developed longer ago than 3.2 billionyears. We are not sure. But by that date a new kind of life had developed,and we have found fossil forms of it. It was still one-celled and sexless,but it was able to do two new things. It could form simple sugars by photo-synthesis, and it could use nitrogen directly to help form its own aminoacids. These still microscopic forms, that is to say, could manufacturetheir own food and were no longer dependent on the amino acids created inthe atmosphere.
Plow in photosynthesis, as we have already noted, oxygen is given off asa by-product. Thus for the first time, a little better than 3 billionyears ago, oxygen began to be added to the environment.
Very gradually this life form with the new posers began to change. One-celled to start with, it began to develop chains or plates or clusters ofcells held together. These many-celled organisms have been identified inmany of the older geological formations. A number of different kinds werepresent about 2 billion years ago, and hence believed to have developedwell before that time. They resemble very closely.: the plants we know toayas blue-green algae. They may, in fact, have been the ancestors of the .2microscopic blue-greens.
During the next billion years, that is, between 2 and 1 billion years ago,still a third kind of life developed. This third form was still microscopic.and it could manufacture sugar (and oxygen) by photosynthesis. But, it hada nucleus, which was a new Lind very important development. It resembledpresent-day plants known as green algae.
Almost all plant and animal cells have a central body, rich in special pro-teins, known as a nucleus. A. nucleus makes sexual reproduction possible,and hence much greater diversity among living forms. All living organismswhether single-celled or many celled, possess this nucleus, all, that is,except the bacteria. and the.blue-greens This is one reason why these twogroups of organisms are considered the most primitive of all. The otherreason, as we have seen, is that bacteria and blue-greens appear first inthe geological record.
As the blue-green and green algae developed (or their ancestors did), theycontinued todd oxygen to the environment, by photosynthesis. About onebillion years ago, or a little less, the oxygen given off by these organisms
- 23 -
reached about one percent of the amount in the atmosphere now. Thiswas a most significant point, since at this concentration of oxygenenough ozone is developed (through the action of sunlj:7ht on freeoxygen) to screen -:out most of the ultra-violet :ys that would other-wise have killed living organisms.
Thus, in about two billion years of evolution, the oxygen-producingorganisms replaced the Pr.I.Lative fermenting types as the dominant life
forms of the earth. Oxygen van in fact, a major pollutant of the earlieratmosphere. The eht,:ie to oxygen-producing forms i:, considered by manyscientists as one of Lhe greatest biological revolutions in the historyof our planet.
The green algae continued to increase and to add oxygen to the earth'satrxsPhere. To start with they were single-celled organisms. But abouto00 million years ago, in what the geologists call the Cambrian period,multi-celled green organisms began to appear. This, too, was a tremendous
evolutionary step.
About ..00 million years ago plants and animals, many- celled by that time,begin to come out of the primordial waters and to invade the land. Insects
appeared about this tLme also.
flout 100 million years ago flowering plants began to appear. MammalsPreceded tiv,A'by Possibly ,O mil1ion years. T,;:enty trillion years ago
narornals began to diversify, and what are kno.iu as hominids appeared;
these were the precursors of man. At abou the same time the level ofo;:ygen in the atmosphere reached the amount present now.
Human beings, as ue :ulow them now, appeared about two million years ago.
In summary we can say:
1. The planet earth originally had no atmosphere.
2. Its first atmosphere contained no oxygen.
The first organisms lived, probably, by fermentation.
The first organisms were replaced by later organisms thatproduced oxygen as a by-product of photosynthesis.
5. Oxygen was a Pollutant of the earliest atmosphere, and theoxygen-producing organisms became the dominant life formsearly in the his',:ory of our planet.
6. When enough oxygen had been produced, the ultra-violetradiation of the sun vas effectively screened off.
7. Once the ultr-violet could no longer reach the earth:,-living forms became more complex and diverse.
8. Ultimately, multi-celled forms invaaeu the land.
-29-

). Plants and t:nimals differentiated and populated the landmasses, and the waters of the earth.
1.7). Kan himself c,eveloped at the evolutionary end of L: long lineof miamfaal:2, then hominics, in an atmosphere containing oxygenessentiEl to :lira, ore &t by olant life zt.; one of the proalcts
of photo.iyncheJis.
From all thiA we may concluat that:
Man is completely depensent on the pleats in his environment,both in the oceans and on the land, for the atmo:lphere thatsustains him, no less than for the food the plaits manufacture.
2. Man is a product of the natural environment in which he lives.
- 30 -

The Composition of the Atmosphere
The atmosphere of the present day--the air we breathe--is a mixtureof gases. It is not a chemical compound. It penetrates the soil, andit forms an envelope several hundred miles high around the earth. Butsome 95 percent of this is in a layer about 10 miles thick. Thislayer of air--called the troposphere is thickest at the equator (10 to12 miles) and less thick toward the poles (5 to 8 miles). The weightof this mass of air is about 15 pounds per square inch, or better thana ton per square foot at the earth's surface.
The air of the troposphere contains a number of different gases.Most abundant is nitrogen which makes up 78.09 percent of the air byvolume. Oxygen is next in volume with 20.94 percent. Adding thesetwo together gives us 99.03 percent.
The gas, argon, is present to the extent of .93 percent. Carbondioxide is next with .03 percent. Twelve other gases make up therest, that is, the remaining .01 percent. The table shows all these,in terms of percentage and also in parts per million (ppm).
Besides these gases, the air contains anywhere from 1 to 3 percentof water vapor. And then, floating in the air are small particlesof many substances. These are usually called particulates, and aswe shall see later, they play an important part in some of the pro-cesses going on in the atmosphere.
31

Carbon dioxide
As we have noted, carbon dioxide composes a rather small ;art, ofthe atmosphere, that is, about .03 percent, or 320 parts pr millionat the present time. Ordinarily we do not think of this gas as apollutant. It is used by plants in the photosynthesis of sugars,though, and is most important in the living cycle. As a very roughestimate, ..bout 3 percent of the :,orld's supply of c.irbon dioxide isused annually by the pleats of the world. About the same amount isreturned to the atmosphere by the processes of decay.
But we humans have been adding carbon dioxide to the atmosphere inenormous amountz in recent years. We have been releasing carbon fromthe burning, or oxidLing of coal, oil ;Ind gnsoline. These substanceswere formed many millions of years ago Juring the Carboniferous period.Carbon dioxide my have been more abundant in the atmosphere then, thannow. At the time enormous quantities of pLants flourished, died, on::the were compressed and converted into peat, coal, and petroleum bygeologic action. This process tied up immense quantities of carbonthat have been out of circulation for million of years. Our use ofcoal and petroleum productsthe so-called fossil fuels--is what hasbeen adding oxidized carbon, that is, carbon dioxide, to the air.
Within the past century the amount of carbon dioxide in the atmospherehas increased from 290 parts per million, to 320 ppm today. This is afairly substantial increase. Many scientists think this increase islargely responsible for an increase in the temperature of the earth'ssurface, up to about 1940.
The increasecin carbon dioxide are enough to affect our climate, notice-ably. This gas lets the short wave-length ultra-violet radiation from thesun pass through. But the long wave-length, infra-red radiation (actuallyheat-energy) emitted by the earth is radiated back to earth by carbon dioxide.The total effect is to cause the earth's temperature to rise. If the carbondioxide content increases by 10 percent, the effect would be to raise theearth temperature by a half a degree Centigrade.
Betlieen 1880 and 1940 the average temperature of our earth rose about 0.40centigrade. Very possibly this was caused by an increase in carbon dioxide.However, there were other factors at work. The temperature of the earthbegan to fall after 1940, and by 1967 it had dropped by 0.2° centigrade.Increasing dust and aerosols in the atmosphere may explain this drop intemperature, but scientists are by no means certain of this. It appearsat the present time that we do not really know about either point--carbondioxide and a rise in earth temperature, or dust and aerosols and a declinein earth temperature. Scientists point out that until we have more accuratemeasurements over a longer period of time, we cannot reach clear conclusionsabout the climatic changes.

Particulates
Particulates is a term use:: to describeairborne particles. Usuallypeople think of these simply us Just, but there is more to it thn that.Some particles are large enough to be seen, and these arc what we call"aust" in the air. But many particles are too ;;mall to be seen. acmeare eNtremely minute, conJis:dz.g of only a molecule or two of a sub-stance. The tinie.A bits of material are calle;4 aerosols since theyremain floating in the air anti move about in the wind just as gases do.
In orCer to get m idea of the size of a_-borne particles, we need tobecome familiar with the micron-- unit of ilwsurcment user: for verysm::.11 things. Cie micron is 1/1,000 (one one-thousandth) of a millimeteror 1/25,000 of an inch. Many bacteria; are 1 to several microns inand. of course, you cannot see these. The human eye can see particlesonly when they are 10 microns or more is
Things in the air that we can see are raindrops and most fog droplets.Rain(:rops are 400 t. 5,000 microns in st,e. Fog droplets measure from5 to 63 microns. Smoke consists of both so id aria liquid particles lessthan 1 micron in size. You caa see s cloud of smoke, but not theindividual particles. Duat particles are generally more than a micronin Mist consists of liquid particles up to 100 microns.in diameter.Aerosols, as we note) already, are very tiny, ranging from a ten-thou-sandth to a tenth of a micron in diameter (0.0001 to 0.1 micron).Obviously, smoke will contain aerosols as well as larger particles.
Despite the small size of porticulate matter, the concentration in theair of particulates may be tremendous. Over heavily polluted cUies,50 to 100 tons or more of particulates may fall out of the air on eachsquare mile of surfsce. The larger the city, generally, the greater isthe concentration of particulate matter. Concentrations of a hundredbillion particles per cubic yard may occur.
The aerobols act as nuclei on which water vapor condenses very easily.They are thus very important in the formation of mists, fog, and rain.About half the particles in the air over cities are less than 2 or 3microns in size. When we inhale these particles, they can reach thatpart of our lungs that unprotected by mucus. If they are carrying harm-ful chemicals--such as sulfur dimide for example--we may begin to havedifficulties with our breathing.
Particulates enter our atmosphere at the rate of some 12 million tonsper year. About half come froM industry, about a fourth from power plants.About a million tons apiece come from automotive vehicles, refuse disposal,and heating plants.
Air pollutant effects
It is clear that we are pouring vast aualitities of pollutantr into theatmosphere. We are much less certain about the effects they may have,both on our environment and on us. Some of the chemical compounds cancause cancer. Some can kill human beings but only if they are concen-trated enough. Some can kill vegetation. Some cause irritation,coughing, choking, headache, and fatigue. Some deteriorate fabrics,rubber, even building stones. Some are poisonous riot only.to man butto other organisms. Many of these may be washed down by rain into thesoil, the rivers, and the ocean, there to poison fish, birds, manuals,or microscopic organisms of many kinds. Because these pollutants areincreasing, we need to study their effects and take steps to cut backon the ones that are most dangerous either directly to us or to ourenvironment and thus indirectly to us.
We u._ed to mean by "smog" a simple mix of smoke and fog. But we nowmean something else--namely some products that are producea. ay ',Le actionof sunlight on some of the chemicals in the air. This photochemicalsmog is most complex. Hundreds of chemical reactions take place, involvingo:ugen, hydrocarbons, nitrogen dioxide, o:one, and other substances. Theresulting witches' brew produces a whole series of chemicals we eid notrelease as such, but that arc formed nevertheless under the radiant energyof the sun. This Photochemical reaction is reminiscent of the action ofultra-violet on the world's first atmosphere.
The relation to human beings of these released and developed chemicals toour health, for the most part is unknown. It is fairly clear that theirconcentration is important, that is, in the air over cities the concentra-:dons may be high--and troublesome or even disastrous. In areas far awayfrom cities, the concentrations are low enough so that no serious effectsmay take place--as far as know at present.
There have been several notorious air pollution disasters. The first ofthese took place in 1930 in the Meuse Valley of .3elgium. This heavilyindustrialized, 15-mile long valley was blanketed by a thick cold fog inDecember. Thousands of people became sick; about Go people died. Mostof those who died were older people and those who were already ill fromheart or lung diseases.
Then, in 1948 in Donora, Pennsylvania, some 6,000 people fell ill; twentypeople died. And in 1952 London experienced a smog that killed about4,000mostly elderly people or those with preexisting heart or lung con-ditions.
Less yell-known are the disasters in New York City in 1953, 1962, 1963,and 1966. Hundreds of people died at these times as a direct result ofheavy air pollution.-
We Lhould note here that soil blowing is involved in the air pollutionproblem. We do not experience: soil blowing the year round, of course,
311. -

but primarily in the spring months after bare 3011 has dried out andis in a condition to blow. High winds do the rest. Very large ton-nages of soil particles are added to the atmosphere .during theseseasons. The matter has not been too well studied, hence the fateof the finer particles is not certbinly known. Larger particles comeclown soonest, sometimes forming dunes. accords indicate that soilcusp may be blown several thoasum7. miles before settling cut, buthow long the finest particles remain in the air is not known.
Soil blowing is most common in the Great Plains if no soil conservingmeasures have been applied. But' the phenomenon is not confined tothat are Blowing of soil, or wind erosion, may occur anywhere ifsoil is bare and dry, and winds are strong. :otable are such areasill Michigan, Long Island, California, and other states.
1-
-35-
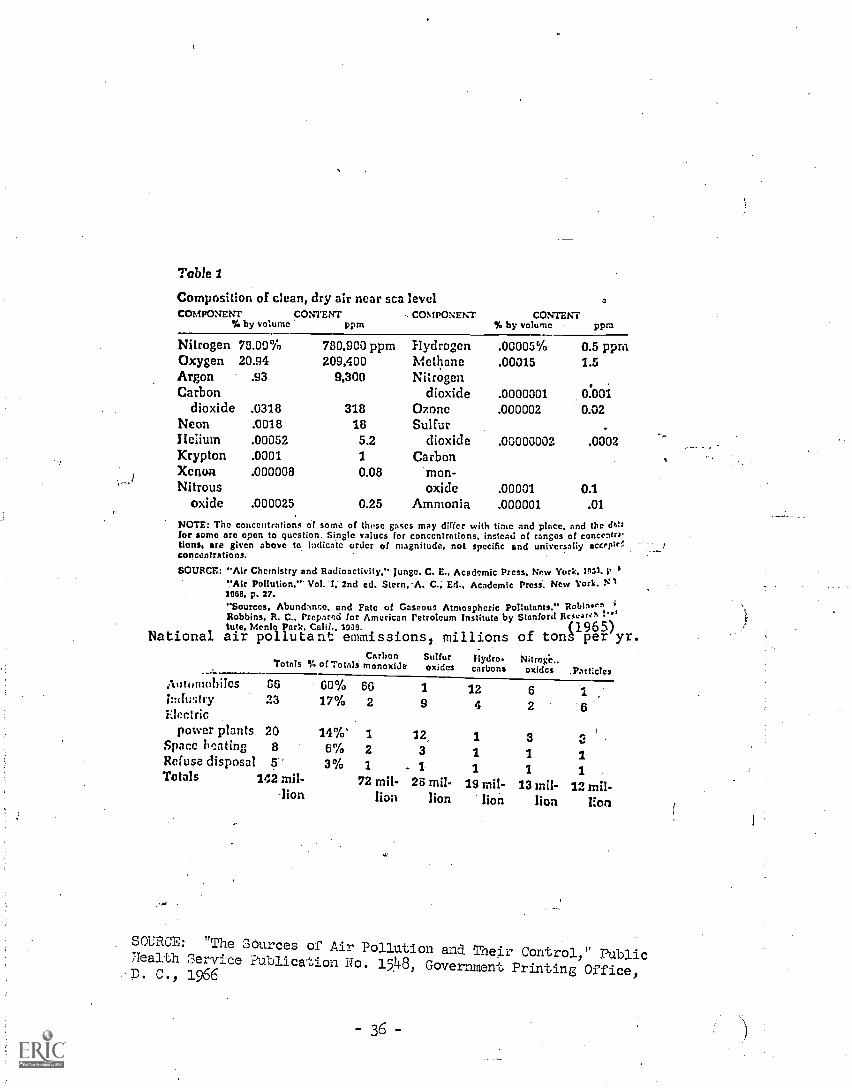
Table 1
Composition of clean, dry air near sca levelCOMPONENT CONTENT COMPONENT
-% by volume ppmCONTENT
% by volume PPra
Nitrogen 78.00% 780,900 ppm Hydrogen .00005% 0.5 ppmOxygen 20.94 209,400 Methane .00015 1.5Argon .93 9,300 NitrogenCarbon dioxide .0000001 .0:001
dioxide .0318 318 Ozone .000002 0.02Neon .0018 18 SulfurHelium .00052 5.2 dioxide .03000002 .0002Krypton .0001 1 CarbonXenon .000008 0.08 'mon-Nitrous oxide .00001 0.1
oxide .000025 0.25 Ammonia .000001 .01
NOTE: The concentrations of some of these gases may differ with time and place. and the daisfor some are open to question. Single values for concentrations, instead of ranges of concentr.etions, are given above to indicate order of magnitude, not specific and universally accrp:rconcentrations.
SOURCE: "Air Chemistry and Radioactivity." lunge. C. E., Academic Press, New York, 1933. I. $
"Air Pollution,"" Vol. 1, 2nd cd. Stern,A. C., Ed., Academic Press, New York. NI1068, p. 27."Sources. Abundance. and Fate of Gaseous Atmospheric Pollutants." Roblnier,Robbins, R. C.. Prepared for American Petroleum Institute by Stanford FIC%eirih :" 1
National air polluEant emmissionst millions of ton s(1p96er5)yr.lute, Menlo Park, Calii.. 1958.
Carbon Sulfur Hydro. Nitrog*c..Totals % of Totals monoxiJe oxides carbons oxides .ParticlesAttNatt(thiiCS 66 60% 66 1 12 6 1i:Nliary 23 17% 2 9 4 2 6Electric
power plants 20 14%' 1 32 !
Space II cating 8 6% 21 3
3 1 1 1Refuse disposal 5' 3% 1 - 1 1 1 1Totals 142 mil- 72 mil- 25 mil- 19 mil- 13 mil- 12 mil--lion lion Hon Hon lion Hon r1
.
SOURCE: "The .sources of Air Pollution and Their Control," PublicTlealth 3ervice Publication No. 15.48, Government Printing Office,D. C., 1966
- 36 -
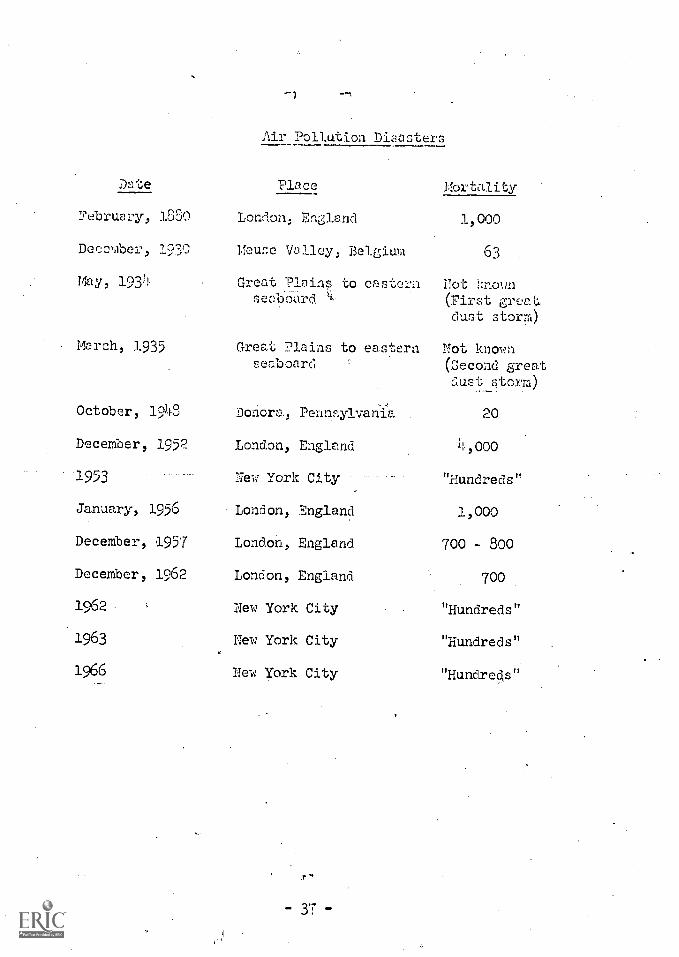
--1
Air Pollution Dinsters
Dote Place Mortality
2ebruary, 1880 Lon:1,on, En3land 1,000
December, 1930 Meuse Valley, Belgium ODe.,
May, 1934 Great Plains to onsten Pot 1:nounsecbcard '1- (First great,
dust storm)
. March, 1.935 Great Plains to eastern Not knownseaboard (second great
dust storm)
October, 1948 ]Jonora, Pennsylvania 20
December, 1952 London, England 1!,000
-1953 New-York City "Hundreds"
January, 1956 London, England 1,000
December, 1957 London, England 700 - 800
December, 1962 London, England 700
1962 New York City "Hundreds"
1963 New York City "Hundreds"
1966 New York City "Hundreds"
- 37 -

HOME STUDY COURSE RESPONSE SHEET
The American Environment
Name: (Block below for instructor use)
Address:
Working Title:
Unit No. & Title:
Date Submitted:
Hours Spent on this lesson:
Date Received:
Date Returned:
Comments:
(Instructor's Signature
Begin lesson assignment below. Use additional sheets as needed.
(If lesson assignment is required,:please transmit this response Sheetto your instructor along with the assignment.)
38

UNIT NO. 6
SOILS

Unit :To, 6
Soils
Reading Assignment:
Life in the Soil, by Van DersalOdum, p. 128 - 131'(See also his listings in the index
under bacteria, fund)p. 368 - 374
Potentially Arable Soils of the World andCritical Measures for Their Use, byr-Kellogg andprvedal.
Brubaker, pp. 119-133
Assignment:
Check the macro - organisms in humus. See problem forUait 6, attached.
39

Soil
Ever since our remote ancestors discovered that seeds planted in theearth would sprout and ;row to produce food. we have been nterestedin the soil. We now understand the basic importance of soil, producereither directly or indirectly of most of. the food we eat.
_
Paper -thin in relation to the land-mass itself, soil is a layer ofmaterial containing within itself complexities.we are i long way fromunderstanding. It supports an almost fantastic array of living organisms,most of them visible only under a microscope. It is although there existeda veritable jungle of plants and animals under our feet.
Soil is composed of mineral matter, organic matter, water, air and theorganisms that inhabit it. The mineral matter is present as particlesof gravel, sand, silt, cr clay. The largest particles are gravel andCoarse sands. Fine sands, silt, and. clay, in that order, are smallerand smaller. Clay particles, for instance are less than two thousandthsof a millimeter in diameter. The,spaeesHor pores between these particlesare filled with water or air depending en whether the soil is wet or dry.Even when the soil is a-oparently dry, each soli particle may have a thinfilm of water around it.
Mixed with the minerals are Particles of organic matter remnants ofthe d: , bodies of plants or animols. It is the organic matter thatcauses sJils to be brvgn 02 black in color, and this dead material isof greet importance, E:2 e shall see. Living within the pores 'betweenthe mineral and organic particles are the literally countless creatures',mostly microscopic, that bring about chemical, Phy:2ical, an.,, biologicalchanges in the soil jungle.
Fromsuch examples csthese--and there are a great many more that scientistshave produced--it is clear that the macrofa-una of the soil have a great dealto do with soil condition. -These are the ahimals that macerate and digestthe dead plant and animal Materials reaching'the soil. As they burrow anddig, they, mix the digested material with the soil. As they do this, micro -organisms work on the digesting material and on the excrenenti or casts,of the larger forms. Between them the macrofauna and the micro-organismsconduct the decay process to the end of the decay ass - :;.poly line.
- 4V -
Life in the Soil-- The micro-organisms
There are two general groups of organisms in the soil: One group consistsof bacteria, plaits, and animals that cannot be seen except under a micro-scope. These are the micro-organisms. Sometimes they are called microbes.
(The second group consists entirely of animals, and,most of them can beseen with the naked eye. This is the macroiauna, treated later on.)
--The o- organisms
:EGA of these live in the water-films surrounding the soil particles. Afew inhabit the air-spaces in between. These organisms are too small tohave any mechanical effect on the soil particles or the spaces or poresin between them. They cannot, that is, actually move the particles orenlarge the pores.
Included in this group are the bacteria, the microscopic algae and fungi,and the microscopic animals such as protozoa, rotifers, and nematodes.Besides these there are actinomycetes, slime-molds, and some other forms.Most of these names may be unfamiliar, but they are explained in succeedingpages.
Some of the organisms a5.-e faund as individuals; some occur in clusters orcolonies. Some move about; some do not. Some kinds may take several formsand perhaps resemble other 'species. There is tremendous variety among them.They are difficult to observe and study even under a microscope. After all,the soil itself is opaque and most of the organisms in it are transparentor translucent. Many have been studied by getting them to grow in thelaboratory on gelatin-like material containing various food substances.
Because these micro-organisms are so small, enormous numbers of them can bepresent in a small pinch of roil. Usually their numbers are expressed as somany per gram of soil material. Even this is pretty unsatisfactory though,because the numbers or populations vary so much. A few billion may be pre -sent in a gram of soil, but a nearby gram may contain 10 billion or more.These numbers vary with the amount of water present, the amount of food, thetemperature, and many other'factors.
Despite their small size, the micro-organisms have a tremendous effect onthe soil as well as a vital effect on the total environment of the earth.It has taken many years to work out what we know about the importance ofthe micro- organisms. You cannot see the chemical reactions taking place,and finding out whatis-actually going on has run up against a myriad oftechnical difficulties. Very gradually, these problems are being solved.Life in the soil, especially the microscopic life, is problably less under-stood than any other life on earth.

Actinomycetes
Intermediate between the bacteria and fungi in the soil is a group oforganisms known as Aetinonweetes. Soil biologists have had a bad timetrying to classify these things. They are now believed to be the mostclosely related to bacteria, but they produce long thread-like filaments,or hyphac, very much like many fungi. They occur commonly in coloniesGhat develop a mass of branching hyphae known as a myceluim.
These curious plants cre widely distributed in the soil. They are morecommon in dry, warm areas, and thus their numbers increase fro:a northto south. Their riunbers dramatically -- up to 10 billion per gram-- in the high temper:.tures of rotting manure, compost piles, and thelike. Also, the greater the humus content of the soil, the more acti-nomycetes mny be present.
These organisms decompose dead plant and animal material, much asbacteria do. They are especially good et decomposing the more resistantparts of plants (such as cellulose) or of animals (such a chitin).Possibly they are most important in the later stages of decay, afterbacteria and fungi have decomposed plant and animal parts not as resist-ant as cellulose or chitin. Some feed on bacteria and some feed on fungi.
Many of the actinomycetes produce antibiotics -- chemical substancesthat are capable of destroying bacteria. These antibiotics, incidentally,are very important to us. Streptomycin is one, aureornycin, and tetracy-cline are others that may be familiar to you as one of the so-called"wonder drugs." These and a number of other antibiotics are produced bythese organisms as well as many vitamins, all of them used commercially.
Bacteria.
By far the commonest living organisms in the soil are the bacteria. Theyare also the smallest forms, seldom longer than 1. cr 5 microns. In a sin-gle gram of soil there may be 1 to 3 billion of the microscopic cells.Some measurements show less, some show up to 10 billion. A good figureto use is 2 billion per gram. Not all of these are active; some are restingor dormant.
In an acre of soil 6 inches deep, 2 billion bacteria per gram will weighabout 4,000 pounds or 2 tons. This figure could go as high as 10 tons forshort periods in very rich soils.
In ordinary soils, most bacteria are found in the'upper 6 inches. The'deeper the soil, the fewer the bacteria. This is because there is morehumus, or organic material, in the upper layers. The more humus thereis, the more bacteria there will be. Bacteria are also present in'greater
numbers in the neighborhood of plant roots.
- 42 -

Bacteria are everywhere, so to speak. They increase by simply dividingin two. They are present in hot, dry, desert soils as ell as in froaenareas or the Artie. Wherever they are, most of them are either micro-scopically small rods or spheres. A very few are spiral-shaped.
But how big bacteria are (or really, ho`-: small) or how much they weighper acre, or even where they are founc, doesn't tell us much about them.That is most important what they a) in the soil.
By far the most bacteria live .on organic material, that is, the deadparts of plants or animals. All'organic material contains the elementcarbon, which is as essential part of all proteins as well as the livid;,substance, protoplasm itself. The bacteria that live on organic materialscause decay--meaning these organisms are using organic substances as food.
In the business of decomposing organic materiels, the varicus kinds ofbacteria are "fiercely competitive" as one scientist has put it. Onemicro-organism may feed upon one kind of. chemical. Another may feed ona different one, but frequently several types may feed on the same sub-stance--and the resulting competition may result in one victor among theantagonists.
In any event, the breakdran of dead tissues o± leaves or animal bodiesinvolves a highly complex series of chemical reactions- -not yet verywell understood. Here we may note simply that as organic material isasLimilated carbon dioxide is released:,
It takes only a few weeks for a leaf to decompose in the tropics, perhapsa year for a leaf to decompose in the temperate area, or as much as 9years in aconifer forest.
Sugars and ,tarchus and pectia go first. Lignin, waxes, cellulose, andchitin go later. The dark material that results is called humus. :'rot
only bacteria are ;involved; fungi, actinomycetes, and many other organismsplay a part in decomposition.
Step by step the breakdown or decomposition proceeds. One organism afteranother may play its part in a sort of assembly line of decay. As the decayproceeds, mealy by-products are produced, such as carbon dio:tide, methane,variotu acids, and other chemical substances known collectively as :tasteproduct&. Very large quantities of carbon dioxide are released to the airas '.:e have airea noted.
But riot all bacteria live on organic materiel. Some can get the carbonthey need directly. from carbOn dioxide in the air. Jiact a., all green plantscan use carbon dioalde to malaa more complea compauaCc, co sari certain bac-terL. In both cases, the ,alaate and these oacLeria can manuf.aci,urefrom eater v!n,a dioaide in the ilaesence of :Au:Light.
- 1 1.3 -

besi6es these, ;:herc a):e some bacteria that can use carbon L.ioxide%ithout any sunlight at all. They get tne eaargy to t o this by usis6r-mnonia or nitrites or sulfur compounac, or or hy:rogea,or c:.irbon mono:de. They Lre able to onidi:..e such material :., in
t'ne process get the necesscry energy to .3y:,thcsi:;e or builj carboncomPounr7;s, such ss proteins or livi,g 1ro'zoP1::.=. -Tot all o thesebactel-iv eon all of these things. One f-Jrk.3 on f.immonia, pro-
ducing nitrites %,hich are wor:;.ed on by utheL: to produce nitrates.latrates can .00 u3e gr.:en shrub, tree.;-- aaa itis from nitmtes that .1110 fomiliar plants :rou.:1C.. us get their nitro6eafor buildin g. proteins and protoPl:ism. This :clay seem somehat mysterious,but it really is not. ';then you oxidie sulfur you add oxygen to it anJia the Process energy is released. :then you ammonia, you aC,.doygon to it and get nitrate:;, and in the process energy is released.Only a few kinds of bacteria can do this sort of thing, but they arebelieved to be of great imPortance in the world.
Fit-Y.:ntes
Yitrotes are chemical :m.b:3taaces that contain two.marts of oxygen foronc part of nitrogea. They may be combineti chemically with many otherelements--for example, sodium nitrate, galci.Q nitrate, ammonium nitrate ,
and many others. The point about nitrates is that they are all directlyuseable by higher plants for the formation of Proteins. Furthermore,the nitrates dissolve in water. °This means .at the roots of higher pleatscan absorb them from the soil where they occur in watery solution.
This is the principal way that the higher plants get their nitrogen. Thehigher plants cannot use nitrogen itself, even though the atmosphere con-tains so much of it. The,; cannot use it in the form of ammonia - -whichcontains nitrogen combined with three parts of hydrogen. The only waythe higher plants can use nitrogen- -which they must have to manufactureprotein and protopla4mis as nitrates.
With this in mind, we can see why the decay processes that prluce nitratesare so important. The microbial action that produces-them plays a key orcritical role in keeping living thingsthe n:.gher plants, animals, and
- mansupplied with the essential element nitrogen.
As it happens, there is one other way that nitrates are formed. Some ofthe microscopic organisms in the soil can develop nitrates by using thenitrogen of the 'air, directly. This is called nitrogen-fixation. Themost important nitrogen-fixing organisms are certain bacteria, as far aswc know now. But there are others. Some yeasts can do this, some blue-green algae can, and a few of the filamentous fungi. 'We are not sum?exactly what this means except in some special circumstances. The decayprocesses seem to be by far the most important in producing nitrates andcarbon dioxide. Nitrogen - fixers apparently perform a secondary and pos-sibly local role.
The fungi
Scientists flo aot ::now as y: t, how many different kinds of 2ungi livein the soil, although they obably number in the many thousands.Because o2 the way these plants grow, it is not practical to try toestimate how many there are per unit of soil. In a general way,fungi make up the largest part of the total mass of living materialin the soil.
Fungus filaments, or hyphc.e, eaaaot be seen ty the naked eye, only bymeans of a microscope. But these threads penetrate .the soil in everydirection, branching and iaterlacing to form a mass ()I mat know. as amycelium, and this you can see. The fungi feed on organic material,and the more of this there is, the more fungus growth there will be.The fuygi must also have o;:ygen ia order to ..?.::i!;;;, which is oae reason
why fungi are generally concentrated in the surface feu inches. It isalso in the surface layer that most dead leaves, dead insects, and otherdead organisms are to be found.
Fungi or molds are plan,;s, but Shay are not green, that is, they containno chlorophyll, the pigment that all greea pi ants have. The fungi dependfor their food, just as do, on the materials such as sugars an starches
already manufactured by green plants. They depend as me co, on nroteinmaterials already manufactured by green plants or by animals. From thesugars and starches and similar substances the fungi get their carbon.From the proteins they get their nitrogen. All living protoplasm, plantor animal, requires both calbon and nitrogen in its chemical structure.
A few species of fungi are nredators--that is, they feed on other livingorganiams. Some species feed on protozoans. One species is known thatsets traps for microscopic worms, or nematodes by developing a littlering of its filament, comfortably large enough for the worms to swimthrough. Once a nematode is within the ring, the ring suddenly tightens,in about a tenth of a second, catching the loom. Then a fungus hyphapenetrates the luckless creature and digests the interior. If the nema-tode struggles hard enough to break the ring off the hypha, no matter, thering sends a hypha into the organism and digest it, later sprouting a fur-ther thread or filament.
A very few fungi are true parasites, that is, they live within other livingorganisms. Even these though, if their host dies, can persist in the soilor elsewhere. These arc the fungus diseases. Incidentally, fungi are suitecapable of parasitizing one another.
Some fungi-form an association with plant roots, known as a mycorrhiza orfungus root. The hynhae either form a sort of mantle around the ends ofthe roots or it may nenetrate the roots at the tip and live inside. The
tree supplies the fungus with carbohydrates (sugars, starches, etc.) andpossibly other substances. It is riot quite clear what the tree or shrubgets in return, but some trees won't grow unless they have the fungus ontheir roots.

al of the fungi reproduce by means of spores. Some of the fruitingbodies are small and simple--others are large and complex. All our mush-rooms und toadstools are developed as fruiting bodies from a vast mycclialncwork--ucually in moist warm seasons - -as spring or fall. Each of thesemushrooms inaicate a relatively immense network or mass of hyphae in thehumus.
One other association of importance is one involving a fungus and an alga(one of the green, microscopic plants). These two plants live together.They form greenish crusts on ro=, moss-like cushions on soil, and in manyw%ys appear to be separate and distinct plants. These are the lichens.They are very important in colonizing bare rock.
Soil Algae
Algae are microscopic plantssingle-celled or in threads or plates orclumps--that contain chlorophyll. Most of them must have light in orderto manufacture food, which chlorophyll enables them to do. There are afew, though, that can make their food from carbon that is present indead organisms--just as fungi do.
Algae are to be found in the top few inches of soil most commonly. Theirneed for sunlight might seem to explain this. But scientists keep find-ing some several feet down--where there is certainly no light.
Three types of algae are numerous in soil. They are called greens, blue-greens, and diatoms. Th- blue-greens are thought to be most closelyrelated to fungi or to bacteria.
It is the algae which along with certain bacteria are able to use carbondioxide and water to form sugars. This is photosynthesis--one of themost important processes in the living world.
Besides this, some of the blue-greens can use nitrogen from the air toproduce various nitrogen compounds that can be used by them and by otherorganisms to form protein and ultimately, protoplasm, the living substanceitself.
Exactly what role algae play in the soil and how important they are issimply not known. They produce at least some of the free oxygen-requiredfor the growth of fungi. Some of them -- notably the blue-greens--fix atmos-pheric nitrogen. Blue-greens make it possible to grow rice in rice paddysof the tropics without adding nitrogen fertilizer. This is an importantmatter indeed in the tropics. Many other microbes feed on algae and thusalgae play a part in soil biology. It is known that blue-green algae play
very important part in colonizing bare or eroded soil.
The c'iatoms and most blue-greens are mobile -- that is they can move, evenif very slowly. Most of the greens do not move.
We know lest; about these plants than about any other group of soil organisms.
- 46 -
Proto:o::
PProto2on cre primitive, single-celled :al of them arc mobile,'ay.t th,4 c: n mot :aout. 6cmo .-",o it fc, long whips or1c!gellae, . ;o.ic by ro.z o: lkdr.; or th:t pu6dle the organicm
like oars in vh,21 conic: move by mc:%ns of pveadopodL:.
lst type Cu. locomotion me a :3 tivit the o.rga:lim exten,:la itself,
then flos into the e74tc:17:ioa. :one (2!3a mo:c ey.eeot in ,,rater, thu3 th,ly
u.ove only it t112 film of water :3urrounjing the zoil a::.rtieleG, or in
porous are fille
fee6 on bneteriv, or on nei..terials tAcsolved or in particle form
iu soil wrter. Sic form also feed on 616ec. Most of them repro:luee
by divi:,In6 in azze myy conjui--;;hf_t ic, :lo of thtwiljoil:3 there is cn intermia6liaL; of protoplsm to rie;:
eventually omer6e. If foor3 get., short or the soil out, the proto-plasm forms a Cyst--yhich simuly the animal in:;ide,E tough outerprotective Theza cy:;ts can withstruad difficult co:i6itions anc7, may
persist in the soil throu6h lonG peris:5s of droul:;ht. Once conditions :arebetter, the animal comes out again and resuineF: normal living.
Generally some 10 to 1)0 thoucand are found in a gram of soil.Counts nacre of bacteria are usually several times greater. Volume forvolume, protozoa weigh more than the bacteric, even so. lore flagellates:22:c present than the others. Ciliated forms arc the most uncommon.Adequate moisture must be present if proto ;cans are to thrive.
're really not sure of the function of the protozoans. Mostly scientiststhink they regulate the populations of bacteria, but this is still not cer-tain. The fact that we do not know the part they play in the soil populationdoes not mean they ore unimportant. It means we are ignorant.
Nematodes
Of 'all the animal life in the soil, the nematodes or eclworms seem to haveno particularly beneficial effect on anything. There are between one andtwo thousand species or perhaps more of these thread-like organisms in thesoil. They are just at the limit, of visibility, and transparent. Theymove by crawling or swimming with eel-like movements in the film of watersurrounding the soil particles. They may number from 1 to 20 million persquare yard, weighing up to 180 pounds per acre.
These eelmorms seem to fall into two general groups. Either they are para-
sites or they aie predators. The parasites work on other animals, on thehigher plants, and on man himself. Trichinosis and hookworm are caused in
humans by nematodes. :ot all these parasites live in the soil, but thosethat do cost us millions of dollars in damage to all sorts of crop plants.These.creaturt!s, the parasitic ones that is, attack the roots of potatoes,tomatoes, and a host of trees, shrubs, and other plants. They caAse whatare called root-knots,--swellings in the roots of the plants that areparasitized--that take food from the plant and thus reduce its growth.
The predators are of a different breed. They prey on algae in the soil,on fungi, bacteria, actinomycetes, protozoa, on other nematodes, and on
- 47 -
other animals. As far as we know, they do not contribute anything tothe processes of aecay. Kor do they affect the physical properties ofsoils. They simply eat whatever living plants or animals they run across.
They are abundant in the soil and are found everywhere. They requirewater to be active. When the soil dries, the nematodes form cysts--theliving organism.or egg inside a tough skin. These cysts resist dryness,`sigh and low temperatures (as low as - 2710 centigrade) and even radiationa thousand times greater than that required to kill human beings.
Although the parasitic forms that cause root-knots have been studied agreat deal, for obvious reasons, we really know next to nothing aboutthese tiny storms. They most certainly play a part in the jungle of lifein the soil, but what that part is we have still to discover.
The Macrofuuna
All the living organisms iii the soil that we don't have to have a microscopeto see, have been classed es the macrofauna, i.e., the bigger animals. Allthese organisms are animals, and all of them affect the soil mechanically.,SOE2 do this by burrvJing or digging their way through the soil. Others,the smaller ones, enlarge the soil pores as they move through. Others movethe soil particles to one side as they burrow. Still others move the soilwith their digging, and some build mounds or heaps of soil in which they live.
These larger soil animals affect the soil in a number of ways. Their burrowingsand diggings loosen the soil and this helps in the drainage of excess water.The same actions help to aerate or introduce air into the soil. They grindup the plant and animal material they eat and release it as droppings or a-manure she micro-organisms can readily attack. And, they mix this materialwith the soil in which they are digging;this is equivalent to cultivation.Agriculturists know that all these effects are valuable in the soil ia thatthey enable the roots of higher plants to penetrate and use the nutrientsmore readily.
There are many kinds of animals in the macroflauna. Some of them are familiarenough to most people. These include such animals as foxes, rabbits, groundhogs and armadilloes, moles, prairie dogs, gophers and other burrowing rodents,earthworms, slugs and snails, spiders, mites, centipedes, millipedes, ants,termites and crayfish. But there are many others that may be only names tomost of us. Among these are springtails, woodlice or pillbugs, enchytraeidworms (smaller reltives of the earthworm), and the immature or larval formsof hundreds or thousands of insects. Merely names perhaps, but importantcreatures nonetheless in one way or another in soils.

Work of the Macrofauua
In :.any studies, counts of the macrofauna (excluding the bigger animals)have ranged from 3 million to 760 million per ccre in the surface sixinches. Although the numbers are quite large, the work of most of thedifferent kinds of animals has not been measured separately. Earthwormshave possibly received most attention. From 1 to 3 million of thesecreatures per acre have been-found where they occur, weighing in totalbetween 1,500 and 2,000 pounds.
Where earthworms are common, they move great quantities of soil. CharlesDarwin was first to call attention to this. He estimated earthworms onpastures near his home to be bringing up about 20 tons of soil per acreper year. In 30 years this would amount to a new layer of soil 7 inches.deep. These figures are for worms that make little mounds or casts atthe cUrface of the soil. Some rough estimates suggest that upwards of 36tons per year may be passed through the worms.
Ants have been shown to transfer about 30 tons of soil per acre per year.The termites of the tropics are important in the decay of plant materialsin the tropics. They build mounds up to 25 feet high and 40 to 60 feetin diameter. More than 5,000 tons of soil per acre may be moved in build-ing these huge structures over a period of years.
Some of the larger animals have considerable effects on the soil also.For example, in Yosemite'one study showed that pocket gophers brought up3.6 tons of earth per square mile. These animals are thought to be the"chief natural cultivators" of the soil in some of our dry western country.He:ee
'they take the place of moles and earthworms characteristic of the
eastern states.
Decay and'its Value
The chemical processes going on in the soil are almost unbelievably complex.The variety of chemical compounds involved is staggering. Many, -- probablymost -- of the processes are not understood at all. What each of the thou-sands of species of micro - organisms is doing in the soil it inhabits is forthe most part uncertain.
Certain gross processes are known to take place, and one of the most importan-of these is decay.
When plants or animals-die, their bodies are returned to the soil where theydecay. If this did not take place, the world would soon be filled with tledead bodies of plants and animals. These dead bodies would eventually lockup all the chemicals needed by living organisms. Without decay, in otherwords,rlife in the world would finally come to a halt -- for a lack of thechemical materials needed for life and growth of new organisms.
Proto.:;or...
Protozoa l'rimitlwe, single-celled animal:;. All of them arc mobile,that is, they .cr.n move about. Some do it with a few long whiosflagellae, some by rows a: -short hairs. or tht!t paddle the organismlike oars Li a. racing ::hell, and somemove bymcans of pseL-lopodia.
last type of locomotion means thot the Organism extends itself,then flat s into the extenion. :Tone can NOle except in water, thus theymore only in the film of water surrounding the soil particles; or inporous areas filled with water.
Pro mac: feed on bncteria:or on mnterials'dissolved or in particle formin soil wr,ter. Some forms also feed on algae. Most of them_eproJuceby.simply dividing in two. Some may conjuutehat is, two of themjoil there is an intermingling of protoplasm and two new indiviOualseventually emerge. If fo od. get:., short 'Or the soil r.lrys.out, the Proto-
plasm forms a cystwhiCh simply the animal inside....a tough outer
Protective case. These cysts can withstand difficult conditions and. maypersist in the soil through long periods of drought. Once conditions arebetter, the animal comes out again and resumes normal living.
Generally some10 to 100 thousand protooz:ns are found in a gram of soil.Counts. made of bacteria, are usually several times greater. Volume-for-
volume, protozoa Weigh more than the bacteria,'even so. More flagellatesare present than the others. Ciliated forms are the most uncommon.Adequate maiStureMustbe present. if protooans areto thrive.
We're really'not sure of the function of the protozoans. Mostly scientiststhink they regulate tie populations..of bacteria, but this is still not cer-
tain. 'The fact that we do. not knoW.the"part they play in'the soil populationdoes not mean they are unimportant. It means we are ignorant..
Nematodes
Of 'all the animal life in the soil, the nematodes or eelworms seem to haveno particularly beneficial effect on anything. There are between one andtwo thousand species or perhaps more of these thread-like organisms in thesoil. They are just at the limit,of visibility, and transparent. They
move by crawling or swimming with eel-like movements in' the film of watersurrounding the soil particles. They nay number froml to 20 million persquare yard, weighing up to 180 pounds per acre.
These eelworms seem to fall into two general groups. Either they are para-
sites or they allFpredators. The parasites work on other animals, G11 the
higher,plants, and on man himself. Trichinosis and hookworm are caused in
humm; by r_ematodes. :let all these parasites liVe in the soil, but-thosethat no cost us millions of dollars in damage to all sorts of crop plants.These.creatuxl,s, the parasitic ones that is; attack the,roots of potatoes,
tomatoes, and a host of trees, shrubs, and other plants. They calt,se what
are called root-knots --swellings in the roots of the plants that areparasitizedthat take food from the plant and thus reduce its growth.
The predators are Of:a different breed.' TheypreY"On algae im.the sell'.onfungi bacteria, actinomyeetes, protozoa, on other nematodeSi.-...and en:
47:-
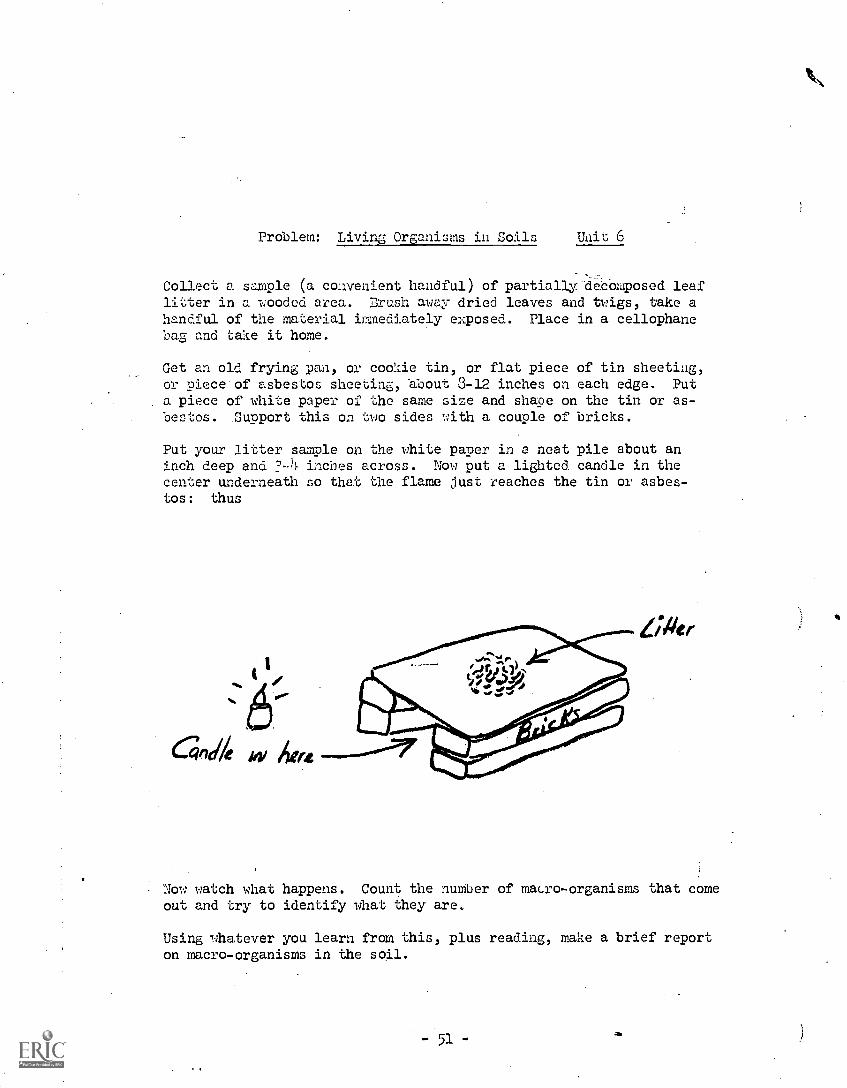
Problem: Living Organisms in Soils Uiiit 6
Collect a sample (a convenient handful) of partially decomposed leaflitter in a looded area. Brush away dried leaves and twigs, take ahandful of the material immediately exposed. Place in a cellophanebag and Lase it home.
Get an old frying pan, or cookie tin, or flat piece of tin sheeting,or Piece of asbestos sheeting, about 3-12 inches on each edge. Puta piece of white paper of the same size and shape on the tin or as-bestos. Support this on two sides with a couple of bricks.
Put your litter sample on the white paper in a neat pile about aninch deep and %.4 inches across. Now put a lighted candle in thecenter underneath so that the flame just reaches the tin or asbes-tos: thus
Now watch what happens. Count the number of macro- organisms that comeout and try to identify what they are.
Using whatever you learn from this, plus reading, make a brief reporton macro-organisms in the soil.
HOME STUDY COURSE RESPONSE SHEET
The American Environment
Name (Block below for instructor use)
Address:
Working Title:
Unit No. & Title:
Date Submitted:
Hours Spent on this lesson:
Date Received:
Date Returned:
Comments:
(Instructor's Signature
Begin lesson assignment below. Use additional sheets as needed:
(If_lesson assignment is required, *please transmit this response sheetto your instructor Along with the assignment.)

UDIT PO. 7
WATER AND ITS POLLUTION
41,

Unit No. 7
Water and Its Pollution
Reading Assignment:
Odum, Chapter 11 (p. 295 - 323)(p. 432 - 44o)
Sediment Yield of Major Rivers of the World by HolemanWagner, Chapters 6, 7, and 8.Brubaker, pp. 138-148
Assignment:
Find out and report on the domestic water supply system ofyour area. Do the same for the sewage disposal system.
When was each set up and by whom?What capacity do they have?What problems are being encountered?How effective is each now? For the immediate future (5-10 years)?
53 -

VOL. 4, NO. 4 WATER RESOURCES RESEARCH AUGUST 1968
The Sediment Yield of Major Ricers of the World
JOHN N. HOLEMAN
Engineering Division, Soil Conservation ServiceU. S. Department of Agriculture, Hyattsville, Maryland 20782
Abstract. The amount of suspended sediment transported by rivers to the seas each yearis tabulated. The major rivers are ranked in order of tons of sediment transported per yearand drainage area and water discharge data are included. The rivers are listed by continentsin subsequent tables with data on drainage area. annual sediment yields in tons, sedimentproduction rates in tons per square mile . per year, the years of sediment measure-ment, and the sources of data. This sample represents more than one-third of the land con-tributing water-borne sediment to the seas and, if representative, indicates an annual worldsediment yield of 20 billion (20 x 109) tons. The. data suggest that Africa. Europe, a 1.1Australia have very low sediment yields (<120 tons per square mile per year), South America'srate is low, North America's is moderate; and Asia's is high to the degrde of yielding up ro80% of the sediment reaching the oceans annually. (Key words: Data; erosion; runoff;sediment; world)
INTRODUCTION
Knowledge of the amount of sediment trans-ported by the various rivers of the world isimportant for many reasons. For example, reser-voirs should be designed with enough space tostore, the sediment expected to accumulate inthem and yet retain full effectiveness duringtheir design life, and sediment yield is an in-dication of the rate of erosion in the drainagebasin. A summation of sediment yields by basinsmay indicate a regional, continental, and evenan approximate world rate.
The amount of sediment transported by waterto ocean level has been estimated by a numberof people. These estimates have covered a ratherwide range. For example, Fournier [1960] cal-culated more than ,64 X 109 (64 .billion) tonsa year. The estimate of Lopatin [19521 wasabout 14 X 10° short tons annually. The data.compiled here represent more than a .third ofthe land contributing to the sea. Direct extrapo-lation of these data by continents gives a worldtotal sediment yield to the marine environmentof 20.2 X 10⁹ tons per year.
The validity of some of the data is ques-tionable because of short records anti variabilityof sediment sampling methods. In addition. :,omeof the data may include estimates di sedimenttransported as bedload. ni,ereas most only in-clude suspended loads. Tlus compi:ation is not
a complete ,listing of all of the major riversdischarging to the sea 'whose sediment load Lasbeen measured; however, it does include themajor river's (excepting some in the UnitedStates) with published data that the writercould locate at this time.
The data were reported in many differentforms, such as cubic meters per year, metrictons per square kilometer per year, and kilo-grams per second, and some large area denuda-tion rates were given in feet per thousand yearsand millimeters per year. The various weightswere converted into short tons (2000 Ibs) andareas into square miles. For the conversion ofvolume of rock eroded into weight, the averagespecific gravity of the rock was assumed to be2.65.
GENERAL
The Earth's surface is nearly 200 millionsquare miles (actually 196.9). Of this, 71% iswater. Land makes up the remaining area of57.5 million anis square miles. Of this, about5 million are in Antarctica, f. d about 13.2million square miles are closed basins anddeserts contributing no runoff. According toLi'.'ingstone [19631, this leaves 39.2 millionsquare miles contributing runoff and water-borne sediment to the seas.
Strahier [1963, p. 264] presents a world map

JOHN N. HOLENIAN
of average annual precipitation, and Putnam[1964] estimated the average annual' rainfallon land to be 24,000 cubic miles a year (be-tween 26 and 27 inches). Langbein and Schumm[1958] found that the maximum sediment yieldin the United States occurs when annual effec-tive precipitation is between 10 and 14 inches.The sediment yield dropped sharply as annualrainfall decreased from 10 inches because of thedeficiency of runoff. On the other hand, sedi-ment yield decreased generally with rainfallabove 14 inches, because the increased rainfallproduced a greater density of vegetative coverand therefore less erosion.
This generalization may or may not apply toother environments of the world, but the rela-tion between rainfall and vegetative cover seemsuniversal. A world map showing the distribu-tion of types of vegetation is in the 1941 Year-book of Agriculture, Climate and Man [U. S.Dept. Agr., 1941] . The vegetation reflects ratherclosely the annuri rainfall patterns. The ratesof runoff are also closely tied in with precipita-tion. In 1960, Durum and others estimated theannual worldwide runoff to be 40 million cfs,cr approximately 1 cubic foot per second persquare mile (csm). Recently, with additional
data, the figure has been refined downward to0.82 csm (W. H. Durum, personal communica-tion, 196S). This is 11.1 inches of worldwiderunoff.
A r.mmary of sediment yields on a worldwidebasis was not available, and this, in large part,is what prompted preparing this compilation. Ofthe 16 rivers having drainage areas greater than400,000 square miles, no sediment data werelocated for the Lena and Amur in northeasternAsia, the Mackenzie and Nelson in Canada, andthe Zambezi in southeast Africa. The NelsonRiver flows from Lake Winnipeg to the HudsonBay. Sediment data are included for the twoprincipal tributaries of Lake Winnineg, the Redand Saskatchewan rivers. The Murray River inAustralia has about the. same drainage area asthe Nelson, and sediment yield is estimated forit (see page 741). Table 1 lists 16 rivers thattransport more than 100 million tons of sedi-ment to the sea annually. To facilitate com-parisons of the sediment production rates ofthe world's river basins, the following arbitrarybut convenient limits were used: those exceed-ing 500 tons/sq mi/yr as high ; those between200 and 500 as moderate; and those under200 as low.
. TABLE 1. Selected Rivers of the World Ranked by Sediment Yield (>103 tons/yr)
Name Location
TotalDrainageArea,
103 sq mi
Average Annual Suspended LoadAverage
Dischargeat Mouth,
103 cfs(thousand tons) (tons/sq mi)
1. Yellow China 260 2,080,000 7,540 532. Ganges India 369$ 1,600,000 4,000. 4153. Bramaputra. East Pakistan 257$ 800,000 3,700 4304. Yangtze China 750 550,000 1,400 7705. Indus West Pakistan 374$ 480,000 1,300 1966. Ching (Yellow trib.) China 22t 450,000 20,500 27. Amazon Brazil 2,230 400,000 170 6,4008. Mississippi USA 1,244 .344,000 280 6309. Irrawaddy Burma 166 330,000 2,340 479
10. Missouri (Miss. trib.) USA, Missouri 529 240,000 450 6911. Lo (Yellow trib.) China lot 210,000 20,20012. Kosi (Ganges trib India 24$ 190,000 7,980 64$13. Mekong Thailand 307/ 187,000 1,240 39014. Colorado USA 246§ 149,000 1,080 5.5§15. Red North Viet Nam 46: 143,000 3,090 138:16. Nile .EN pt 1,150 122,000 100 100
Incomplete, as data for many rivers are lacking. For sources consult Tables 2,3,4, and 5. -Data in these two columns are from AGI Data Sheet No. 32 (rev. 1964), unless otherwise noted.
t U. N. 1953.$ U. N. 1965.§ Durum et al., 1960.
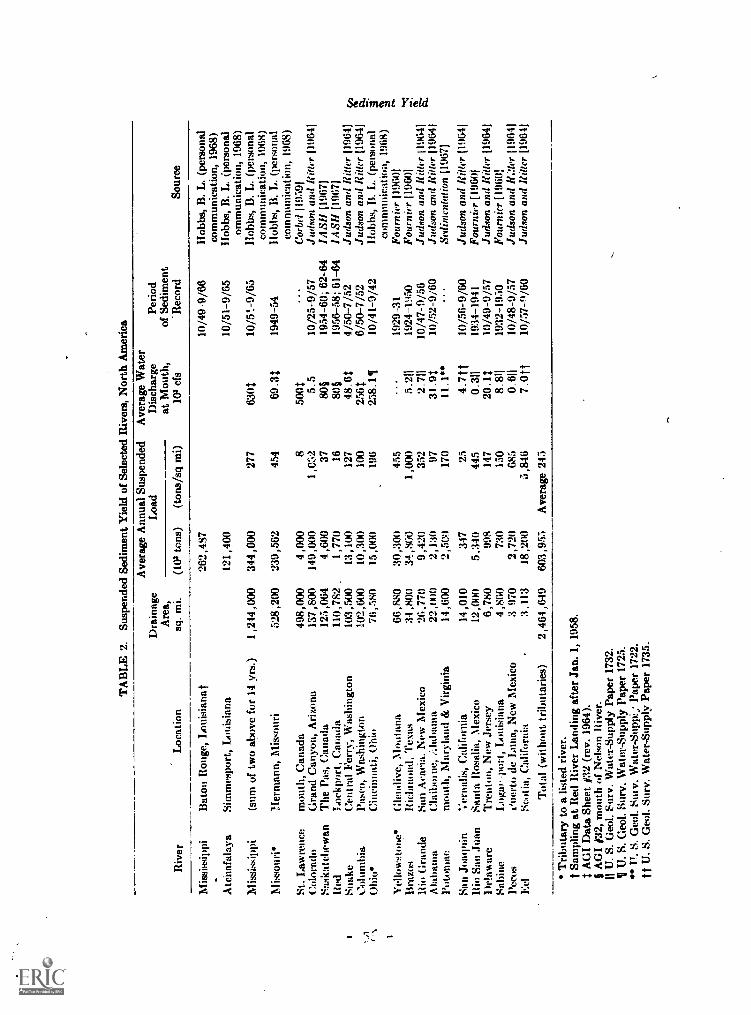
TA
BL
E 2
.Su
spen
ded
Sedi
men
t Yie
ld o
f Se
lect
ed R
iver
s, N
orth
Am
eric
a
Riv
erL
ocat
ion
Dra
inag
eA
rea,
sq. m
i.
Ave
rage
Ann
ual S
uspe
nded
Loa
dA
vera
ge W
ater
Dis
char
geat
Mou
th,
103
cfs
Peri
odof
Sed
imen
tR
ecor
dSo
urce
(103
tons
)(t
ons/
sq m
i)
Mis
siss
ippi
Bat
on R
ouge
, Lot
tisia
naf
262,
487
10/4
99/6
6H
obbs
, B. L
. (pe
rson
alco
mm
unic
atio
n, 1
968)
Atc
hafa
laya
Sim
mes
port
, Lou
isia
na12
1,40
010
/51-
9/65
Hob
bs, B
. L. (
pers
onal
.om
mun
icat
ion,
196
8)M
issi
ssip
pi(s
um o
f tw
o ab
ove
for
14 y
rs.)
1,24
4,00
034
4,00
027
763
0t10
/5'.-
9/65
Hob
bs, B
. L. (
pers
onal
com
mun
icat
ion,
196
8)M
isso
uri
Her
man
n, M
isso
uri
528;
200
239,
562
454
69.3
119
49-5
4H
obbs
, B. L
. (pe
rson
alco
mm
unic
atio
n, 1
968)
St. L
awre
nce
mou
th, C
anad
a49
8,00
04,
000
850
0fC
orbe
l 1 1
9591
Col
orad
oG
rand
Can
yon,
Ari
zona
137,
800
149,
000
1,05
25.
510
/25-
9/57
Juds
on a
nd k
ilter
[19
641
Sask
atch
ewan
The
Pas
, Can
ada
125,
064
4,60
037
80§
1954
-60;
62-
64L
ASH
[19
671
Red
Loc
kpor
t, C
anad
a11
0,78
21,
770
1680
§19
56-5
8; 6
1-64
/ASH
119
671
Snak
eC
entr
al F
erry
, Was
hing
ton
103,
500
13,1
0012
748
.6f
4/50
-7/5
2Ju
dson
and
kilt
er 1
1964
1C
olum
bia
Pase
o, W
ashi
ngto
n10
2,60
010
,300
100
2561
6/50
-7/5
2Ju
dson
and
kill
er [
1964
1O
hio
Cin
cinn
ati,
Ohi
o76
,580
15,0
0019
625
8.11
10/4
1-9/
42H
obbs
, B. L
. (pe
rson
alco
mm
unic
atio
n, 1
)68)
Yel
low
ston
eG
lem
live,
Min
d an
a66
,880
30,3
0045
519
29-3
1Fo
urni
er 1
1960
1B
razo
sIt
iehm
ond,
Tex
as34
,800
34,8
001,
000
5.21
119
24-1
950
Four
nier
119
601
Rio
Gra
nde
San
Ara
ria.
New
Mex
ico
26,7
709,
420
352
2.71
110
/47-
9/56
Juds
on a
nd k
iller
119
641
Ala
bam
aC
htila
nne,
i:la
bam
a22
,110
02,
130
9731
.91
10/5
2-9/
60Ju
dson
and
kill
er 1
1964
1Po
totu
aem
onth
, Mar
ylan
d &
Vir
gini
a14
,600
2,50
)17
011
.1Se
dim
enta
tion
1196
71
San
Ji M
EI
, tin
Ver
nalis
, Cal
ifor
nia
14,0
1034
725
4.7tt
10/5
6-9/
60Ju
dson
and
kilt
er [
1964
1R
io S
an J
uan
Sant
a R
osal
ia, M
exic
o12
,000
5,34
044
50.
311
1934
-194
1Fo
urni
er [
1960
1I
hdaw
are
Tre
nton
, New
Jer
sey
6,78
099
814
720
.11
10/4
9-9/
57Ju
dson
and
kill
er [
1964
1Sa
bine
Lug
ar p
ort,
Lou
isia
na4,
860
730
150
8.81
119
32-1
950
Four
nier
[19
601
Peco
si'n
erto
de
Lun
a, N
ew M
exic
o3
970
2,72
068
50.611
10/4
8-9/
57Ju
dson
and
!?;
:ler
[196
41E
elSc
otia
, Cal
ifor
nia
3,11
318
,200
5,84
67.0tt
10/5
7-9/
60Ju
dson
and
kill
er [
1961
1
Tot
al (
with
out t
ribu
tari
es)
2,46
4,64
960
3,95
5A
vera
ge 2
45
Tri
buta
ry to
a li
sted
riv
er.
t Sam
plin
g at
Red
Riv
er L
andi
ng a
fter
Jan
. 1, 1
958.
AG
I D
ata
Shee
t #32
(re
v. 1
964)
.§
AG
I /3
2, m
outh
of
Nel
son
Riv
er.
11 U
. S. G
eol.
Fury
. Wat
er-S
uppl
y Pa
per
1732
.¶
U. S
. Geo
l. Su
rv. W
ater
-Sup
ply
Pape
r 17
25.
U. S
. Geo
l. Si
n v.
Wat
er-S
uppi
; Pap
er 1
722.
tt U
. S. G
eol.
Surv
. Wat
er-S
uppl
y Pa
per
1735
.

JOHN N. HOLEMAN
NORTH AMERICA
North America is the continent with the mostdata collected on sediment transported by water.Most of the data are from the United Statesand are derived from secondary sources asindicated (Table 2). The orienal data used bythese sources were collected mostly by theU. S. Geological Survey and the U. S. Corps ofEngineers.
The rivers are listed in descending order ofdrainage are:. The Mississippi since 1949 hastransported an average of 262 million tons ayear past Red River Landing and Baton Rouge,Louisiana. This average is based on the U. S.Corps of Engineers measurements for 1949-1966. Before 1952, an annual load of 500 mil-lion tons at this location was not unusual; sincethen, no more than 325 million tons have beenmeasured in any one water year. Soil conserva-tion practices, ztreambank stabilization meas-ures, and new reservoirs have been the majorfactors in this reduced sediment transport.
Brown [1950] reported that the MissouriRiver at Yankton, South Dakota, carried anaverage of 134 million tons a year. This figurewas based on nine years of record. In 1953storage began at Ft. Randall and GarrisonDams, 82 and 615 river miles upstream fromYankton, respectively. In June 1955, GaVinsPoint Dam, only a few miles upstream fromYankton, was closed. The effect of these threedams upstreani can be noted in the sharp de-cline of the suspended load to an annual aver-age (1955-1963) of 2,363,000 tons per year(D. C. Bondurant, Corps of Engineers, per-sonal communication, 196S).
The St. Lawrence has a large drainage area,but much of it consists of the Great Lakesand, as one might expect, the St. Lawrencecarries a very small amount of sediment. TheColorado discharges a large load, formerly muchmore than it does now. The 1.19 million tons(Table 2) is a 32-year average.
Additional rivers with decreasing drainageareas and sediment yields are listed. There isonly one river in Mexico listed, and for Canada,besides the St Lawrence, only the Saskatchewanand the Red are listed. Sediment in these tworivers in south central Canada was measuredupstream from their debouchment at LakeWinnipeg. The average annual sediment loadwas measured at 37 and 16 tons per square
mile, respectively. The average sediment loadfor the rivers listed in Table 2 is 2S3 tons persquare mile per year; after deleting the riversthat are tributaries, the average for NorthAmerica becomes 245 tons per square mile peryear.
SOUTH AMERICA
The continental divide in South America, orcrest of the Andes mountains, is near the :PacificOcean. The rain falling on the eastern slopes ofthe Andes has to travel down the Araazon about3000 miles to the Atlantic Ocean. The Amazonhas the largest drainage area of any river in theworld and by far the largest water discharge.Because of the heavy rainfall on the largebasin, the Amazon is believed to discharge any-where from 11% [Oltman, 1964] to 18%[Davis, 1964] of the world's total annual volumeof water discharged into the oceans. On theother hand, it transports only about 2% ofthe sediment reaching the oceans annually. Ac-cording to Gibbs [1967], 82% of the suspendedsediment reaching the mouth of the Amazoncomes from the Andes mountains and highlands.only 12% of the drainage area; and about 6%of the total sediment discharge is bedload.
There are other very large rivers in SouthAnierica. The Orinoco discharges the thirdlargest volume of water in the world, exceededonly by the Amazon and Congo, but its sedi-ment yield is moderate (Table 3). The Parana'to the south ranks eighth in the world in bothdrainage area and water discharge, but sedimentyield is low: only 100 tons per square mile.An estimate of the sediment yield for SouthAmerica.is 160tons per square mile (Table 3).
On the basis of this sample of five rivers,Africa has less than one-half the sedimentproduction rate of South America: about 70tons per square mile. The rate of the Mesljerdahin Tunisia is high, the Cheliff in Algeria ismoderate, the Nile is low, and the Niger andCongo are remarkably low (see Table 3).
Africa has four main rivers, each dischargingto one of the four points of the compass: theNi.e to the north, the Niger to the south, theZambezi to the east, and the Congo to the west.The table indicates low sediment yields in cen-tral Africa. Although evideme of excessive ero-
- 57 -

TA
BL
E 3
.Su
spen
ded
Sedi
men
t Yie
lds
of S
elec
ted
Riv
era
sout
h A
mer
ica-
Afr
ica-
Aus
tral
ia
Riv
erL
ocat
ion
Sout
h A
mer
ica
1 A
maz
on
2 Pa
rana
3 O
rino
co4
Uru
guay
5 N
egro
s6
Car
oni
7 C
ohra
do
Afr
ica
1 (W
.go
2 N
ile
3 N
iger
4 C
helil
T5
Med
jerd
a:-.
Aus
tral
ia, e
t al.
30 s
trea
ms
Mur
ray-
Dar
ling
Wai
pana
mou
th, B
razi
l
mou
th, A
rgen
tina
mou
th, V
enez
uela
Con
cord
ia, A
rgen
tina
Prin
ter
a A
nip
tstu
ra, A
rgen
tina
at O
rino
co, v
enez
uela
Pich
i Mah
isid
a, A
rgen
tina
Tot
al (
less
trib
utar
y)
mou
th, C
ongo
delta
, Egy
pt
Bar
n, N
iger
iam
outh
, Allm
i,!m
outh
, Tun
isia
Tot
al
Eas
tern
Aus
tral
iam
outh
, Aus
tral
iaK
anak
anai
a, N
ew Z
eala
nd
Tot
al
Dra
inag
eA
rea,
sq. m
i.
Ave
rage
Ann
ual S
uspe
nded
Loa
dA
vera
ge W
ater
Dis
char
geat
Mou
th,t
cfs
Peri
odof
Sed
imen
tR
ecor
d(1
0' to
ns)
(ton
s/sq
mi)
2,36
8,00
040
0,00
017
06,
400
Am
es, F
. C. (
pers
onal
com
mun
icat
ion,
196
7)±
890,
000
90,0
0010
052
6C
orbe
l 119
591
366,
700
95,3
4026
080
0V
an A
ndel
[19
671
150,
000
15,0
0010
014
0B
abb
(189
3136
,070
1,48
740
536
1935
-196
5IA
SI!
[196
71±
35,0
0052
,500
1,50
0K
oelz
er, V
. A. (
pers
onal
com
mun
icat
ion,
196
7)9,
000
7,60
088
019
38-1
964
IASH
119
671
3,82
0,37
060
9,42
7A
vera
ge 1
60
1,55
0,00
071
,300
461,
400
Cor
bel 1
1959
11,
1Z.0
,000
121,
854
100
100
1958
-196
4Si
mon
s, li
. B. (
pers
onal
com
mun
icat
ion,
196
7)43
0,00
04,
960
1221
5D
ekke
r11
9611
8,60
03,
400
395
16 y
ears
Tix
eron
i(1
960)
8,08
014
,750
1,82
55
year
six
eron
t11
9601
3,14
6,68
021
6,26
4A
vera
ge 7
0 852
year
sD
ougl
as [
1067
141
4,0C
a35
,190
610
12,1
6019
,93(
113
1960
-196
4T
ASK
[19
671
414,
610
47,3
50A
vera
ge 1
15
Tri
buta
ry to
list
ed r
iver
.t A
Cil
Dat
a Sh
eet N
o. 3
2 (r
ev. 1
964)
.E
stha
ate
.sed
on
the
85 to
ns/s
q. m
i men
tione
d in
text
.
JORN N. 110LEMAN
sion in South Africa exists, no quantitative datawere located.
AUSTRALIA
Sediment yield data for Australia area verylimited. According to Fournier [1960], e temAustralia appears to average about 850 onsper square mile. Douglas [1967] disputed israte. He has ob3erved the sediment load inrivers in eastern Australia (New South Walesand Queensland) and beeves that Fournier'sfigure is too high by a whole order of magnitude.Therefore, a figure of 85 tons per square milemay be more in order, although it is only anestimate. The vast central part of this islandcontinent is a desert.
EUROPE
Europe has none of the 16 major rivers ofthe world no matter whether they are rankedby drainage, water discharge, or sediment yield(Table 1). In terms of drainage area, the Volga,which empties into the Caspian Sea, ranksseventeenth. It carries a low suspended sedi-ment load. The second largest is the Danube,flowing from southwestern Germany eastwardinto the Black Sea. Its sediment load is. alsokw (Table 4).
The Rhine carries a heavy load of sedimentas it entcrs Lake Constance in Switzerland, butby the time it reaches the flatlands of Hollandit carries little sediment. The Po, the Tiber,and the Arno in Italy carry relatively highmounts of sediment, but generally erosion is
r,r a big problem in Europe. This is becauserainfall is distributed well throughout the year,and low-intensity, gentle rains are typical. Theaverage sediment production rate is about 90tons per square mile based on these data.
ASIA
The largest continent, Asia, also produces byfar the most sediment reaching the sea (Table5). According to : United Nations publicationof 1953, The Sediment Problem [United Na-tions, 1953], the Yellow River of China carriesmore than 2 x 10² short tons of sediment tothe Yellow Sea each year on the average. Theprincipal source is the yellow loess of northcentral China, giving the river and sea. itscolor and name. The Yangtze River to thesouth of the Yellow River also flows from west
to east. Although the Yangtze drains a muchlarger area than the Yellow River, it transportsapproximately a fourth of the amount of sedi-ment. The Lo and Ching rivers are tributariesto the Yellow and carry nearly three times asmuch sediment per square mile as any of theother rivers of the world with equal or largerdrainage areas listed here (20 thousand tonsper square mile). At times, flows in the Yellow
*River have been reported to be 40% sedimentby weight; that is, 400,000 ppm [Todd andEliassen, 1938]. The Yellow River carries thelargest amount of sediment of any river in theworld.
The Ganges River in -nclia is the secondlargest carrier of sedimen., discharging morethan 11 /2 X 10° tons of sediment into the Bayof Bengal each year. The Ganges arises alongthe southwest side of the Himalaya Mountainsand flows south of them roughly parallel totheir crest. The runoff from most of the southside of this highest mountain range in the
orld flows into the Ganges. This area is sub-ject to intense erosion because of the highrelief and the monsoon climate. Some of themaximum annual rainfalls and most intensestorms of the world have occurred in 'the foot-hills of the Himalayas. As an example, at Cher-rapunji, India, in the Khasi Hills, 241 inchesof rain fell in the month of August 1841, 40Sinches of which fell in one day. The averageannual rainfall at Cherrapunji is 426 inches[U. S. Dept. Apr., 1941, p. 664]. The Kosi,tributary to the Ganges, alone transports onthe average 190 million tons of sediment a year.
The Bramaputra River orip,inates on the northside of the Hiinalayas in Tibet. L. flows east-ward and also roughly parallels the trend of themountains. On the eastern flank of the Hima-layas the. Bramaputra breaks through to thesouth, then reverses directions and flows westalong the southeastern side of the mountains.It empties into the Bay of Bengal, forming ajoint delta with the Ganges. These two riversare thought to rank as number 2 and 3 amongthe world's rivers in the amount of sedimentdischarged. The Indus River in West Pakistantransports almost as much sediment as theBramaputra.
Eleven of the 16 rivers in Table 1 with sedi-ment yields >1C, tons are in southern Asia.Undoubtedly, as the store of data increases,

TA
BLE
4.
Sus
pend
ed S
edim
ent Y
ield
s of
Sel
ecte
d R
iver
s.E
urop
e
Live
rLo
catio
n
Dra
inag
eA
rea,
sq. m
i.
Ave
rage
Ann
ual S
uspe
nded
Load
Ave
rage
Wat
erD
isch
arge
at M
outh
,10
3 cf
s
Per
iod
of S
edim
ent
Rec
ord
Sou
rce
(103
tons
)(t
ons
/sq
mi)
Vol
gaD
ubov
ka, U
SS
R52
1,49
020
,770
4028
3119
34,3
5,38
-40
Lopa
tin,.
1952
Dan
ube
mou
th, U
SS
R.
315,
000
21,n
068
2182
Bab
b,18
03;
Cor
bel,
1959
Dne
prV
erkh
nedn
cpro
vsk,
US
SR
167,
520
1,21
07
1941
1938
-39
Lop
atin
,19
5'2
Don
(V
olga
trib
.)R
azdo
rska
ya, U
SS
R14
6,02
05,
360
3719
32-4
0,46
,47
Lop
atin
,19
52U
ral
Top
olin
ski,
US
SR
74,7
901,
760
2419
36-4
1,47
Lop
atin
,19
52V
istu
laT
ezew
, Pol
and
74,5
601,
690
2338
/19
46--
53Ja
rock
i,19
63 (
p. 8
0)T
it:za
*at
Dan
ube
Riv
er, H
unga
ry60
,310
11,0
4018
0no
t cite
dFo
urni
er,
1060
Rhi
nem
onth
, lio
n:m
il56
,000
504
978
1no
t cite
dC
orbe
l,19
59R
hine
'La
ke C
onst
ance
, Sw
itzer
land
4,60
09,
6321
2,09
0no
t cite
dC
orbe
l,19
59Lo
ireN
ante
s, F
ranc
e46
,740
467
1030
§no
t cite
dC
orbe
l,19
59()
der
Goz
dow
ice,
Pol
and
42,2
3014
74
1961
-64
!ASH
,19
67P
oP
onte
lagu
seur
o, It
aly
20,9
6016
,770
800
511
193(
4-62
/A S
U, 1
967
Sei
neP
aris
, Fra
llec
17,1
401,
2201
711
pre
Cor
bel,
1959
Tib
erR
ome,
Ital
y6,
390
6,42
01,
005
1933
-46,
49-6
3/A
SH
, 196
71)
rinC
an D
eje,
Alb
ania
4,77
016
,220
3,40
019
60-6
3/A
SH
, 196
7(ia
ronn
eT
oulo
use,
Fra
nce
3,86
02,
760
715
24 §
1839
-46
Four
nier
,19
60In
nsR
ei.s
ach,
Wes
t Ger
man
y3,
767
3,51
593
319
53-1
960
/AS
H, 1
967
Arn
oS
an G
iova
nni A
la V
ena,
Ital
y3,
160
2,43
077
019
36-4
2; 5
4-64
I AS
H, 1
967
Sem
ani
goci
t, A
lban
ia2,
040
24,1
9011
,844
1961
--63
/AS
H, 1
967
Sim
ento
Gia
rret
ta,Sicily
707
3,96
05,
605
1936
-.42
; 57-
631A
SH
, 196
7;G
ezzo
loan
d B
assi
,14
;50
Tot
al (
less
trib
utar
ies)
1,35
7 .;5
712
1,93
8A
vera
ge 9
0
Trib
utar
y to
a li
sted
riv
er.
Incl
udes
bed
load
.A
GI D
ata
She
et N
o. 3
2 (r
ev. 1
964)
,§
Min
im, W
. H. (
pers
onal
com
mun
icat
ion,
196
8).

TA
BL
E 5
.Su
spen
ded
Sedi
men
t Yie
lds
of S
elec
ted
Riv
ers
Asi
a
Riv
erL
ocat
ion
Ave
rage
Ann
ual S
uspe
nded
Dra
inag
eL
oad
Are
a,
Ave
rage
Wat
erD
isch
arge
at M
outh
,10
3 cf
s
Peri
odof
Sed
imen
tR
ecor
dSo
urce
sq. m
i.(l
0 to
ns)
(ton
s/sq
mi)
I. Y
eltin
elIg
arka
, USS
R95
4,20
011
,600
1261
4t19
42,4
3L
opat
in [
1952
12.
Ob
Sale
khar
d, U
SSR
945,
300
15,7
0017
4414
1938
-44
Lop
atin
(19
521
3. G
ange
sde
lta, E
ast P
akis
tan
409,
200
1,60
0,00
04,
000
4981
:18
74-1
879
Four
nier
119
501
4. Y
angt
zeC
hiki
ang,
Chi
na39
5,65
055
2,00
01,
400
707
U. N
. (19
:13
5. I
ndus
Kot
ri, W
est P
akis
tan
370,
000
481,
000
1,30
023
9t19
02-2
5Fo
urni
er 1
1960
)6.
Kal
abag
h, W
est.
Paki
stan
117,
700
751,
000
6,37
0U
. N. [
1963
7. Y
ello
wSl
tenl
isie
n, C
hina
276,
000
2,08
3,00
07,
545
534
1934
-42
U. N
. (19
538.
Bra
nuip
utra
delta
, Eas
t Pak
ista
n21
6,00
080
0,00
03,
700
706
U. N
. [19
659.
Ale
kim
gM
uktli
tham
, Tha
iland
151,
000
187,
000
1,24
053
0U
. N. 1
1965
10. I
rraw
addy
Prom
e., M
inna
141,
700
331,
000
2,34
047
94U
. N. 1
1933
11. P
earl
-Wes
tW
ucho
w, C
hina
120,
800
309'
0025
027
7U
. N. (
1953
12. M
ahan
adi
Nar
aj, I
ndia
51,0
0067
,800
1,33
0'1
01U
. N. 1
1953
13. E
uphr
ates
Tat
um, S
yria
46,5
704,
750
100
51§
1962
-04
IA 8
11 [
1967
114
. Red
Ilan
ni, N
orth
Vie
t Nam
46,3
0014
3.00
03,
080
138
U. N
. [19
6315
. Cha
o Ph
yaN
akor
nsaw
an, T
haila
nd41
,100
12,4
90'
301)
IASI
! (1
9671
16. 1
:abi
l1*
Now
Ahe
m, W
est P
akis
tan
34,8
8026
,000
745
241
1961
,196
2K
oetz
er 1
1967
117
. Tig
ris
Bag
dad,
fraq
30,8
0057
,600
1,87
051
419
18,1
919
Four
nier
(19
601
18. K
osP
Cha
tra,
Ind
ia23
,800
190,
000
7,98
064
U. N
. 119
651
19. C
hing
`C
hang
chia
shan
, Chi
na22
,000
450,
000
20,5
002
1932
-45
U. N
. 119
531
20. (
nsta
l)*
Ale
xand
ria
Bri
dge,
W. P
akis
tan
12,5
6055
,000
4,38
019
61,1
962
Koc
her
1196
7)21
. Lo"
Chn
anto
tt, C
hina
210,
000
20,2
0019
34-4
5U
. N. 1
933]
22. D
amod
arIt
hund
ia, I
ndia
.10,
400
7,68
031
,300
4,05
011
U. N
. ]1U
,:23
. Ish
ikar
iE
best
ii, J
apan
4,90
01,
926
393
1960
IA51
1 (1
9671
24. T
one
Mas
ud°,
Jap
an4,
630
3,16
077
819
51!
IA51
1 [1
967]
Tot
al (
less
trib
utar
ies)
4,21
2,83
06,
414,
576
Ave
rage
1,5
30
* T
ribu
tary
to a
list
ed r
iver
.t A
U!
Dat
a Sh
eet N
o. 3
2 (r
ev. 1
964)
.t U
. N. 1
965.
5 T
igri
s, E
uphr
ates
, and
Kar
im R
iver
s, G
eotim
es, M
arch
196
2.

Sediment Yield
there will be changes in this list. Southern Asia,however, will remain the principal contributorof sediment to the oceans.
Northern Asia, consisting of Siberia andMongolia, has little sediment data available.Yet four of the world's largest rivers, in termsof drainage area, are in northern Asia. Fromwest to east they are the Ob, the Yenisei, andthe Lena, which flow north into the ArcticOcean, and the Amur, which flows east to thePacific. The best indication of sediment yield inthis area is thrteport of Lopatin [1952] thatthe average annual denudation for the USSR is0.027 mm. This is equivalent to 1.06 inches per1000 years, or about 200 tons per square mileper year. The estimated annual rate of sedi-ment reaching the oceans from Asia is 1530tons per square mile (closed basins and deserts'excluded).
SUM MART
The measured and estimated sediment yield
are summarized by continents in Table 6:Africa, Europe, and Australia appear very low,averaging 70, 90, and 115 tons per square mileeach year, respectively; South America is lowwith 160 tons per square mile; North Americais a moderate sediment producer with 245; andthe high producer of sediment is Asia, with1530 tons per square mile.
Table 6b shows the total sediment yield tothe oceans as extrapolated directly from theaboxe_dataUsing- the-total-areas- draining-tothe oceans and multiplying by the averagerates ascertained, the total is 20.2 x 10⁹ tons.Of this, 80% comes from Asia, which makesup one-quarter of the land area draining tothe oceans. Table 7 compares this figure withsome other world estimates.
To visualize better the 202 billion tons ofsediment, considir it by volume rather thanby weight. From reservoir sedimentation sur-veys of the United States, the volume-weightof submerged sediment deposits may be assumed
TABLE 6a. Summary of Measured Annual Sediment Yields of Rivers to Oceans(tributaries deleted)
Annual Suspended Sediment Discharge
ContinentMeasured Drainage
Area, Mil(Tons)
(1000 tons) (Tons/Mil)
North America. 2,464,649 603,955 245South America 3,820,370 609,427 160Africa '3,146,680 216,264 70Australia 414,610 47,350 115Europe 1,357,357 121,9'38 9G
Asia 4,212,830 6,414,576 1,530
Total 15,416,496 8,013,510 Average 520 tons/mil
TABLE 6b. Total Sediment Yield to Oceans Extrapolated from Above Data
ContinentTotal Area Draining
to Oceans, Mi2 (Tons/Mi2)
Annual Suspended Sediment Discharge
(109 Tons)
North America 8;000,000 245 1.96South America 7,500,000 160 1.20Africa , 7,700,000 70 0.54Australia 2,000,000 115 0.23Europe 3,600,000 90 0.32Asia 10,400,000 1,530 15.91
Total1.-
39,200,000 J'20.16Total suspended sediment discharge to oceans is about 20 billion tons a year.
Livingstone, 1963.
- 62 -

JOHN N. HOLEMAN
TABLE 7. Comparison of Estimates of Sediment Reaching the Oceans Annually
ReferenceDenudation or Sediment Yield Equivalent,various units 109 short tons tons/sq mi
Fournier 1960 51.1 X 10' metric tons = 54 1630Kuenen 1950 32.5 X 10¹² kilograms = 55.8 915Gilluly 1955 12.0 km3 of roekt = 35.0 895Pechinov 1959 0.09 mm/yr = 26.7 680Schumm 1963 0.25 ft/1000 yrt = 22.6 575
Ho leman-1968 20 .16 _ X_10.!_tops = 20 2 520LopatinT 1952 12.695 X 10⁹ tons (metric) = 14.0 ._ ', 355
Adjusted to 39.2 milllion square miles contributing sediment to the oceans.t A refinement of Kuenen's estimate.t Based on drainage areas <1500 sq mi and effective precipitation of less than 40 inches per year.
From Jarocki [1963, p. 8].
to average about 60 pounds per cubic foot, orabout 1300 tons per acre-foot. On this basisthe sediment reaching the sea each year isenough to cover France, Belgium, the Nether-lands, Luxembourg, Switzerland, and Portugalwith an inch of mud.
As a last observation about these sedimentyield data, it is important to remember thatthese figures are a small per cent of the soilmaterial that is moved each year. The PotomacRiver will serve as an illustration of this. ThePotomac River Basin has been studied in greaterdetail than most of the areas included here.The Sedimentation and Erosion Sub-Task Forceof the Federal Interdepartmental Task Force[Sedimentation, 1967] has estimated Lag about2.5 million tons of sediment ere discharged intothe Potomac estuary annually. This group pointsout that gross erosion within the bssin is over50 million tons a year. In other words, onlyabout 5% of the products of erosion in thiswatershed reach tidewater.
REFERENCES
Babb, C. C., The sediment of the Potomac River,Science. 21, 342-343. 1893.
Brown, C. B., Sediment transportation, in Engi-neering Hydraulics, edited by H. Rouse, 769-857,John Wiley, & Sons, Inc., 1950.
Corbel, J.. Vitesse de l'erosion, Z. Geomorphologie,3, 1-28. 1959.
Davis, L. C., The Amazon's rate of flow, Nat.History, 73(6), 549, 1064.
Dekker, 'G.. Sediment transport measurements andcomputations on the Niger, Inter-African Cont.Hyd-AoL, Publ. 66, London. Comm. Tech. Co-operation in Africa So. of Sahara, 256-265,. 1961.
Douglas, I., Man, vegetation, and the sedimentyields of rivers, Nature, 215, 925 -928, August26, 1967.
Durum, W. H, S. G. Heide!, and L. J. Tison,World-wide runoff of dissolved solids, Intern.Assn. Sci. Hydrol., Publ. 51, 618-628, 1960.
Fournier, F., Climat et erosion, Presses Universi-taires de France, Paris, 1960:
Gazzolo, T., and G. Bassi, Contribution a l'etudedes degre d'erosioa des sals constituent lesbassins versants des cours d'eau italiens, Intern.Assn. Sci. Hydrol., Gen. Assembly, Helsinki,112 -134, 1960.
Gibbs, R. J., The geochemistry of the AmazonRiver systeth: Part 1, Geol. Soc. Am. Bull. 78,1203-1232, 1967.
Gilluly, J., Geologic contrasts between continentsand ocean basins, Geol. Soc. Am. Spec. Paper 62,7-18, 1955.
International Association of Scientific Hydrology.Transport total des sediments aux oceans, IASHBull. 12(3), 100-110, Sept. 1967.
Jarocki, W., A study of sediment (Badanie rumo-wiska) OTS 60-21273, English Transl., Warsaw,Poland, 254, 1963.
Judson, S., and D. F. Ritter, Rates of regionaldenudation in the U. S., J. Geophys. Res., 69(16), 3395-3401, 1964.
Kuenen, P. H., Marine Geology, John Wiley &Sons, New York, 568, 1950.
Langbein, W. B., and S. A. Schumm, Yield ofsediment in relation to mean annual precipita-tion, Trans. Am. Geophys. Union, 39(6), 1076-1084, 1958.
Livingstone, D. A., Chemical composition ofrivers and lakes, in Data of Geochemistry, sixthed., U. S. Geol. Suru. Profess. Paper 440-G, 64,1963.
Oltman, R. E., V. 0. Sternberg, F. C. Ames, andL. C. Davis, Amazon River Investigations, m-connaissance measurements of July 1963, U. S.Geol. Suru. Circ. 436, 15, 1964.
Lopatin, G. V.. Sediment deposits in .the rivenof the USSR, lzd. Geograficheskoi Literatury,Moscow, 1952.
..."' 0,2;
Sediment Yield
Peehinov, D., Water erosion and solids discharge(Vodna eroziya i to"rd ott,ok), Priroda (Sofia,Bulgaria), 3(1), 49-52, 1959.
Putnam, W. C., Geology, Oxford University Press,New York, 480, 1964.
Schtunm, S. A., The disparity between presentrates of denudation and orogeny, U. SfiGeol.Sun,. Profess. Paper 454-11, Washington, D. C.,1963.
Sedimentation and Erosion Sub-Task Forp ofthe Federal Interdepartmental Task Force, Re-port on the Potomac, Soil Conservation Service,U. S. Department of Agriculture, Hyattsville,Maryland, - 31,_1967. -._-_. -- ----- - - --
Strahler, A N., The Earth Sciences, Harper &Row, New York, 681, 1963.
11xeront, J., Debit solide des cours d'eau enAlgerie et en Tunisie, Intern. Assn. Sci. Hydrol.,Gen. Assembly Helsinki, 26-41, 1960.
- 64 -
Todd, 0. J., and S. Eliassen, The Yellow Riverproblem, Proc. Am. Soc. Civil Engrs., 64, 1921-1991, 1938.
United Nations, compendium of internationalrivers in the ECAFE region, Proc. Sixth Reg.Conf. Water Res. Deed. in Asia, ECAFE, NewYork, 1965.
United Nations, Soil erosion in various countriesof the region, The Sediment Problem, ECAFE,Bangkok, 11-16, 1953.
United States Department of Agriculture, Clim-ate and Man, 1941 Yearbook of Agriculture,U. S. Government Printing Office, Washington,
- D. C4--1248; 1941: fVan Andel, TJ. H., The Orinoco delta, J. Sedimen.
Petrol., 37(2), June 1967.
(Manuscript received April 19, 1968;revised May 8, 1968.)

UNITED STATES DEPARTMENT OF AGRICULTURESOIL CONSERVATION SERVICEWashington, D. C. 20250
April 28, 1971
Advisory INF - 44
From: William R. Van Dersal:2--Deputy Administrator for Management
Re: "The Sediment Yield of MajorjRivers of the -World
There is transmitted herewith a copy of John N. Holeman's paper on thesediment yield of major rivers or the world. This is a paper whichbrings together for the first time comparable data on the averageannual suspended sediment loads of the major rivers of the United Sta,esas well as the rest of the world.
In view of the considerable importance of sediment and because thereis a need for data of the sort included in Mr. Holeman's paper indiscussions with the various groups, we thought you ought to have thispublication for your files. Additional copies are not available afterthis widespread distribution.
Attachment
AO
-65,-
Sediment
ediment, the product of erosion, is our ma,,or pollutant. lt dOes seriousdamage to land and water and to the constructions of man. At least fourbillion tons of it are washed into the tributary streams of the UnitedStates each year. About half of this reaches our lakes and rivers and"one-fourth of this goes on to tidewater. It middies our waters, it fills ourreser-oirs.._It scars tho_land_and_raduces the productive capability ofthe soil w'lence it carte. The average annual economic cost of sedimentdamage to the American people was roughly estimated by the Teicter ResourceCouncil in 1963 to be in excess of 500 million dollars. Undoubtedly theloss of soil resources in creating this sediment far exceeds this amount.
In a few situations some benefits can be attributed to sediment. Forexample, induced deposition of sediment may create buffer zones to protectlevees or other river bank structures. Alluvial soils result from sortingand deposition of some of the materials eroded upstream.
In addition to economic, damage, the social costs of sediment are very'high. it reduces the quality of our waters as habitat for fish and otheraquatic life. It renders them unfit for water sports. It renders themunattractive. It carries phosphorous into our waters where its releasemay contribute to eutrophication. It carries into our waters pesticidechemical residues and other pollutants Nif!ere they may be absorbed by fishend other aquatic organisms.
Sediment is a problem to varying degree in every area of the United States.About half the sediment originates on farm and forest land. The otherhalf comes from roads and roadsie,es, stream banks, surface mines, andurbanization and other construction sites. In addition geological erosionon lands relatively undisturbed by man is a source of large amounts ofsediment in certain areas of the country. The current USDA ConservationNeeds Inventory provides the key to accelerated sediment damages bygeographic areas. Nearly half the Nation's sediment originates in those15 States west of the Mississippi and east of the Rockies. 4
Congress, the Executive Branch, state and local governments need torecognize and clearly state that sediment moving on to other lands andinto streams, lakes and reservoirs is in fact a serious pollutant; andthat at the national, state and local levels official action is neededto reduce the movement of soil as sediment.
Erosion and sediment control are needed on both rural and urban landsalike. Each year more than a million acres of land is converted fromagricultural use to new houses, highways and roads, shopping centers,schools, airports, and the like. These changing acres are the sourceof much of the sediment that pollutes streams and rivers and fillslakes and reservoirs.
-66-
to-
Studies show that erosioikon land going into use for houses, shoppingcenters and highways is about 10 times greater than on cultivated farmland, 200 times greater than on grassland and 2,000 times greater thanon land in timber. A cycle of 6 years from plan initiation to completeimplementation is suggested. Congressional authorization would berequired for much of the work.
There are more than 3,000 soil and water conservation districts covering95 percent of the private lands in the 48 Continental contiguous states.On the private lands of this nation the soil and water conservationdistrict's major work is the control of erosion and sediment throughproper land and water management. These conservation districts arelegal subdivisions of state government, governed by lc,:al.residents whoknow local conditions. The natural resource and related departmentsof the several states could effectively carry out the treatment ofprivate lands in cooperation with USDA.
Working through soil and water conservation districts 2 million landusers have conservation plans developed or underway to control erosionand sediment on their lands. Soil and water conservation districts needadditional technical and financial assistance from public sources toaccelerate th erosion and sediment control work on all lands withintheir boundarAes. Acceleration of erosion and sediment control work ofthis nature would be ofh.vast public benefit.
The Departments of Transportation, Defense, Housing and Urban Develop-ment and Interior have, or can develop, effective working relationshipsdirectly with landowners and managers or with developers and contractorsto carry out effective erosion and sediment control methods.
- 67 -

HOME STUDY COURSE RESPONSE SHEET
The American Environment
Name: (Block below for instructor use)
Address:
Working Title:
Unit No. & Title:
Date Submitted:
Hours Spent on this lesson:
ate Received:
ate Returned:
Comments:
(Instructor's Signature
Begin lesson assignment below. Use additional sheets as needed.
.(If lesson assignment is required, please transmit this response sheetto your instructor along with'the assignment.)
- 68 -

vg.
UNIT NO 3
OCE A.IIS AITD TUA ES

Unit No. 8
Oceans and Estuaries
Reading Assignment:
Odum p. 324 - 362
Wagner, Chapter 9
7inrichs, Population, Environment, and People, papers'byHedgepeth (p. 47)
Brubaker, p. 114
Turn in completed report from Unit 7.
- 69 -

HOME STUDY COURSE RESPONSE SHEET
The American Environment
Name. (Block below for instructor use)
Address:
Working Title:
Unit No. & Title:
Date Submitted:
Hours Spent on this lesson:
Date Receiled:
Date Returned:
Comments:
(Instructor's Signature
Begin lesson assignment below. Use additional sheets as needed.
(If lesson assignment is required, please 7,ransmit this response sheetto your instructor along with the assignment.)
S
70 -
9
1,1P.I.T2U L AREAS
Reading:
Unit No. 9
Natural Areas
Attached material
Wagner, Chapter 4
Assignmcnt
Locate the nearest natural area in your vicinity. (You may already know
where this is. .If you do not, check with appropriate people in theForest Service, or Park Service, or the biology department of a nearbyuniversity or the state university.)
Prepare a report on this area, which you should visit, including:
1. A descr'ltion of the area, its vegetation, wildlife, topography,and any other features of interest.
2. A brief history of the area. Is it really undisturbed(by manor his livestock or other human influences)? When was it setup? How is it protected?
.3. What kind of plant and animal succession is going on in this area?If fully protected, will it remain as it is now, or will it change?On what facts, is your answer based?
4. What good is it?
7-1
Wilderness
Such extraordinary changes have taken place in America since it was firstexplored and settled by Europeans that few Americans have any very clearidea of what it was like IA. the "beginning." Some of the most wonderfulforests in the world have been almost entirely replaced by farms, cities,towns, and highways. The original windswept prairies have given way tocorn and soybean fields squarely bound by fences. The vast grasslandsof the Vest have been subtly but enormously changed by the trampling andchewing of many millions of sheep and cattle and horses. The greatAmerican wilderness, with its fascinating array of trees and grassesand flowers, its buffalo and lions, elk and antelope, wolves and bears,and its magnificent variety of birds, is now about gone.
We still have left some good-sized tracts of wild country in our highwestern mountains, remote and hard to reach, and hence, fairly wellpreserved so far. In the central and eastern portions of America ,
there are still remnants, most of them small, a few of which are pre-served, but most of which may ultimately disappear unless they arethoughtfully protected and carefully managed. There are, it must beadmitted, extensive areas of our country where there is no wildernessleft at all. But we still have just barely enough left to provide uswith fair samples, however, small, ofmost parts of our original America.
These remaining natural areas are a wonderful heritage. They help uspiece together a fascinating picture of the magnificent primeval landsour ancestors entered so many centuries ago. They are of immensescientific value. They show us what the land can do under naturalconditions, and they serve as guides in our efforts to manage land formany purposes -- for the conservation of soil and water, forests, grass-land and wildlife. In themselves these remnants are natural works of art,as inspiring as the greatest symphonies ever written by men.
It would be well indeed if our children and grandchildren could knowfirst-hand what their country was like when our forefathers first camehere. In preserving and protecting these natural areas we are practicingconservation possibly in its finest sense.
It might, perhaps, be fairly suggested that one of the measures ofcivilization of a country is its attitude toward preserving samples ofits natural environment in an undisturbed condition, just as its attitudetoward preservation of its artistic and literary treasures is such ameasure. At least there seems to be a strong correlation between thesethings and the impression of civilization. (Report of the AAAS CouncilStudy Committee on Natural Areas as Research Facilities. Nov. 1963 p. 6)
The impressive biological evidence, long misunderstood or disregarded,is to the effect that we humans are a product of our environment. AsRend Dul3os has pointed out -- "The evolutionary steps through which manreached the level of Homo sapiens, explain, for example, why the struc-ture of his backbone can be traced to the early fishes, or why thesalinity of his blood still reflects the composition of sea water fromwhich terrestrial life originally emerged."
-72-
We disregard such evidence at our peril. We are what our environmenthas made us. To understand ourselves, we must'understand the environ-ment -- the natural conditions -- that have shaped us. These are thenatural conditions, for the most part not developed, and still lessunderstood, by men.
It is clear that the American environment in general has changed sub-stantially from what it was five centuries ago. It is also quite likelythat this environment had already been changed by human beings thatinhabited this country for 10 to 30 thousand years before our ancestorscot here. Thus, we might ask ourselves, what is a natural environment?Have we, indeed, ever actually seen one?
We cannot really gay that the environment is unchanging. Very obviouslyit is constantly changing. All the organisms in it -- plants and animals --change it. So does climate. And so does man. The difference is thatman has brought about chances faster and more drastically than any otherform of life on our planet. We may think of human changes as "artificial,"but man is just as "natural" as any other living organism. He is just asmuch a part of the environment as any other. l!e can only say that heseems to have a greater effect on the plants and animals and soil andatmosphere than the other organisms have.
An idea that may help us to understand the situation is the idea ofbalance or equilibrium among the organisms and the area they live upon.Where all the incredibly complex inter-relationships have come into abalance that persists, then perhaps we can say: here is a naturalenvironment. This is a biological community that will tend to stay inbalance -- same general proportion of all the various organisms in itin relation to the soil and atmosphere they inhabit. Automatically, suchan environment would be relatively stable. It could accommodate physicaland biological changes, but would tend always to returnio a balancedcondition.
All of this may seem to be theoretical or philosophical -- and so it is.What we need to consider though, is a stable, balanced environment,rather than a primitive or "original" or primeval environment. Thechanging, stabilizing, balanced environment our ancestors invaded is onein which we are greatly interested. What was this environment like?Do we still have some parts or portions of it that we can study and fromwhich we can learn? Where are they and what are they like? Can theytell us anything we can use -- in our attempts to adjust our own actionsso as to fit into and become a part of an environment that will be ofgreatest value to us?
These questions are difficult, but we do have answers for most of them,answers that make scientific sense. Our answers may not be as sound,ecologically, as they should be, but they are good answers, as far aswe know at the present time.,
For many years now, we have been trying to save and hold "inviolate,"various biological communities. The areas, we select are samples ofbalanced environments, or better, natural areas that have been the leastchanged or affected by man. From a purely theoretical point of view a
redwood forest that has been cut down would be one of these balanced areas,since the redwood will recover, and within several thousand years, ournatural area will be in good shape again. Obviously, this,is unsatis-factory if not ridiculous. ''ho wants to wait that long to see the balancerestored? What we do, of course, is to pick areas that are the leastchanged, that are, in other words, very close to being a stable communityand as close as possible to a balanced situation.
Ecologists have identified some 160 types of biological communities in theUnited States. T!e aughtto be able to set aside at least a few samplesof each type. Such areas are what we come now to discuss.
From That we have talked about so far, it is easy to see that we canscarcely expect to preserve areas of really "original" America. Theyhave already been changed -- some only a little, some radically. Butwe can preserve areas-that are as close as possible to the "original"condition. A bird or two, a plant, may have gone, but otherwise thingsappear much like they once were.
Now, of course, changes go on under natural conditions all the time.Nothing in nature remains static. Trees grow up and die or burn downfrom lightning or blow down in a hurricane. Various animals succumb todisease and disappear, or their habitats are destroyed by drougic, fire,or other natural disasters. These changes are not necessarily relatedto man at all. All the "protection" we can offer wilt not preventnature changes -- minor or major -- from taking place, just as theyhave a always will.
What we do really, when we "protect" a natural area, is to try to preventany man made changes -- but we let the natural ones go on. At least, that
alis the way we intend to do it. But we protect it from fire, which is anatur agent of change. .We can't afford to have the big predators --bears, lions -- in the area, unless it is very large indeed. So we keeptheir numbers down. And we do such things to keep the area as unchangedas we can. This is influence, human influence.
But when we try to protect an area of fine, original pine trees, we'renot about to let a lightning-caused fire destroy the area, natural or not.
-74
Conserving Natural Areas
When we talk abou's; the preservation or conservation of our remaining"original" natural areas, there is one thing we must keep in mind.Evers- bit of the natural area has been changed.. We have no wild areasanywhere that are precisely the sane as they were even when the earliestexplorers from Europe first came here. Sometimes the changes have beenever so slight. Sometimes they have been very great. But everywherethere has been change brought about for the most part by us Americans.
There is no natural area left anywhere along the eastern side ofcountry that is the snme as it was when the Vikings landed nearly athousand years ago. A number of animals that once lived there are nowexterminated, and so are some trees and other plants. Passenger pigeonsare gone, as everyone knows, and so are the Carolina parakeets, thegreat auks, the heath hens, the wood buffaloes, the eastern elk, theFlorida wolves, the eastern cougar or mountain lion. These animals,and a number of others, are extinct. There is a considerable numbermore that appear to be headed in the same direction.
Several plants are gone completel;y-, the names of which would be only alatin phrase to most people. The "oeautiful FranRlinia, found long agoin one small spot in Georgia, has never been found wild since. We haveit only in gardens. The eastern chestnut, majestic tree of our easternmountains is now nearly eliminated from our remaining forests -- andfor the most part these have been cut over many times. In 1962 scientistsannounced that the Florida nutmeg -- a unique and, famous tree known tooccur at the boundary of Georgia and Florida -- has been all but wiped out.A few specimens survive in gardens, but the wild trees are all dead, exceptan occasional one with a few sickly sprouts at the bade of the skeletontrunks. A fungus disease is suspected.
All these plants and animals were here when Columbus reached the Indies,and most of them were still here when George Washington was our firstPresident. Some have been exterminated during the lifetime of manypeople now living. More will probably disappear during your lifetime.
Now. the point about this is that when a bird or a mammal or a plant --or any other living thing -- becomes extinct, the place where it livedis changed by its disappearance. The change may be small, it may bevery obvious, it may appear major in character, but when a livingorganism disappears from the earth, the change can never be reversed.

Managing Natural Areas
Managing a natural area, to keep it natural, takes a great deal of knowledgeand skill. Many people believe that all you have to do is leave the areaalone. ,But this is almost never possible. Livestock cannot be permittedin such an area, so it usually has to be fenced. If a fire were to startin it, we would need to extinguish the flames as soon as possible, other-wise the area might be destroyed -- as a balanced environment. We mustwatch it carefully not only to prevent fires, but also to prevent care-less people from damaging it. People dump tin cans, bottles and otherrubbish "out in the woods," and some may try to cut Christmas trees orbreak off branches of dogwood, pick the spring flowers, shoot the squirrels,build a campfire -- and so on and on. Obviously the area has to be guardedagainst this sort of thing.
But there are other problems. If the area harbors, say, prairie dogs,then if too much grass is permitted to grow, the prairie dogs will not beable to remain. Or, if the-area has a grassy meadow fed on by wild geese,if the grassed area is let grow up into brush, the geese will leave, forlack of preferred food.
These examples -- most of them much simpler than many of the problems --illustrate the fact that to keep an area the way you want it requiresmanagement. Under natuyal conditions, the plant life and the animallife of an area are always in a constant state of change. You may notnotice this from one year to the next, but in ten, twenty, or more years,the changes may be considerable.
If an area is set aside as a natural preserve for a specific mammal orbird, then the animals' habitat has to remain suitable to it. If thehabitat changes, the animal will not remain. Similarly, if the area isset aside for a flower or an unusual tree, then the conditions underwhich the plant thrives will have to remain unchanged. Otherwise theplant will disappear, sooner or later.
On the other hand, natural areas may not require too much management.What we do to keep the area the way we want it must be a balance betweenthings that must be done and things we cannot afford to do. We can --and we have done so -- make things so attractive for deer that theyincrease so rapidly they literally eat themselves out of house and home.Over-doing management efforts can be as had as no management at all.
-76-

It is not an easy .matter to say with certainty how ruck land we have inthe United States that is preserved and protected in a natural,relatively undisturbed condition. There are many reasons for this.
Tor one thing, there is no formal system includinrr all natural scientificareas In existence in this country. In ',/..eat Britain, there is such a
s: -stem, administered by the Nature Conservancy -- a government agencyquite different from our own Nature Conservancy which is a privateorganization. Thus, an inventory of such areas means the cooperation ofa great many agencies -- federal,state and local governments -- privateorganizations, and universities and colleges. In these hundreds oforganizations, very few have an office or a person "in charge" of naturalareas. per se.
A great many natural areas are located in preserves set up for some otherprimary purpose. For example, there are many natural areas well protectedin nationaaparks and monuments. Some are to be found in wilderness areas,espedially in national forqpts. There are others, but how many acres theymay i2nvolve is often not clear. Nor is there necessarilc-complete agreementamong agencies as to That constitutes a natural area and what kind of.pro-tection or management it should receive, e'3 rally as different from thataccorded the area for other purposes.
In 1963 a special committee of the American Association for the Advance-ment of Science made a report on this. They were studying areas that hadbeen essentially undisturbed, and that could be used for scientificresearch. This group estimated that some 40 million acres in our countryare thus preserved. The total number of such areas was estimated to beabout Soo.
Fourteen states had less than 10,000 acres each and of these, two had lessthan 100 acres. Four had between 10 and 20 thousand. Nine had 20 to 100thousand. Seven had between 100 and 500 thousand. Four had between ahalf million and a million. Ten had more than a million acres and threeof this ten had 5 to 7 million.
This gives us a sort of rough'idea of size, but. it tells us nothing aboutquality. A great many kinds of plant and animal communities are simply notrepresented, even in the 40 million acres. We are lacking good samples ofvarious kinds of desert lands, of grasslands of the central United States,and we could do with a lot more examples of various types of natural areasin the eastern part of our country.
Besides this, in 1963, the Nature Conservancy published a listing ofnatural areas set up and administered by colleges and universities. Intotal, some 90 areas involving nearly 53,000 acres, were listed. Theyvaried in size from a few acres to better than 1,000 with one specialone 23,000 acres in area. These are areas used for scientific researchby the universities.
Then, in 1968, a report was. issued on the "Research Natural Areas" thathave been established on the federal lands of the United States. Aspointed out in the report, the federal government holds title to slightlymore than a third of the country, with the largest part in Alaska and the
-77-

West. The report was developed by the Federal Committee on ResearchNatural Areas, a standing committee including representatives of allthe federal agencies administering most of the federal lands. A total
of 336 such areas were designated. These totals duplicate figures
listed above.
The work that has been done on natural areas is relatively informal innature. A great many scientists, keenly aware of the need to preservewhat we can while we can, have joined forces in committees and taskforces. But, so far, we lack an agency or authority clearly responsiblein America for the preservation and management of all natural biological
areas of scientific value. We are dependent on the good will andcooperative spirit of_hundreds.

The American Environment
Name: (Block below for instructor use)
Address:
Working Title:
Unit No. & Title:
Date Submitted:
Hours Spent on this lesson:
Date Received:
Date Returned:
Comments:
(Instructor's Signature
Begin lesson assignment below. Use additional sheets as needed.
(If lesson assignment is required, please transmit this response streetto your instructor along with the assignment.)
- 79

UNIT NO. 10
ITILDLIFE
Reading:
Unit No. 10
Wildlife
Wiped Out and Unsung by Solem
. A Bright Outlook for Fildlife by Borell
Excerpts from Tennessee Valley Wildlife by Enerson
Wagner, Chapter 16
Assignnent:
Turn in the report prepared for Unit No. 9.

A Bright Outlook For WildlifeBy A. E. BORELL
E have more kinds and greater numbers ofgame birds, game mammals, furbearers,
and game fish in the United States today thanwere present when white men first set foot onAmerican soil. And our soil- and water-con-servation programs should continue to maintain,and even to expand, our fish and wildlife popu-lations and the hunting, fishing, and other rec-reation that goes with them.
Some people question such optimism. Wefrequently hear that Man and his activitieshave seriously depleted our game and fish. Wealso hear that "Hunting and fishing ain't whatthey used to be ; I have hung up my rod and gun."Even some wildlife administrators tell us thatdrainage, cultivation, livestock grazing, watercontrol, weed sprays, timber cutting, and mod-ern farming methods are wiping out our gameand fish. They would lead us to believe thatwildlife is gcing downhill rapidly and soon willbe a thing of the past.
This picture of gloom is not new.. Back in1883, Frances Francis an English writer, said,"They always tell you things used to be betterthan they are now, and that something or otheris ruining them." Francis was speaking aboutfishermen. How much basis is there for thiskind of anguish and propaganda?
Certainly there have been changes in speciesand shifts in populations. The passenger pigeon,heath hen, and bison are gonein their steadwe have pheasants, chuckars, Hungarian par-tridge, and a tremendous population of deer.While many streams and natural lakes havedeteriorated and some species of fish have de-dined, let us not forget that we now havethousands of acres of manmade ponds, lakes,and reservoirs that provide fishing. Many ofNotetThe author is biologist, Soil Conservation Service. Denver,Colo. This article is based on talk given at the annual conventionof the beak Walton League. Golden, Colo., June 1967.
All Photographs used with this article were furnished by the Flaband Wildlife Service.
these are in areas where little or no fishingexisted 100, 50, or even 10 years ago.
Recently, I attended a meeting presided overby one of our top, game administrators. At thatmeeting there were indications that Utah, Colo-rado, Montana, and Wyoming are competing intheir efforts to attract out-of-state hunters tohelp harvest their overpopulations of deer, andin some cases, elk and antelope. We hear reportsof overpopulations of deer in Pennsylvania,Wisconsin, Michigan, Texas, West Virginia,California, Arizona, and a few other States. Byoverpopulation, I mean not merely more deerthan the range will carry, but actually moredeer than the hunters want to harvest.
Last year, Colorado had the most liberal deerhunting season in the history of the State. Thisyear the license fee will be lower and the baglimit will be even larger. For $12.50, the Colo-rado resident this year will be able to take 4deer in large sections of the State. Few huntersor families want more than 1 or 2 deer, butthey can have 4 if they want them.
In 1955, I attended a technical session of theWestern Association of Game and Fish com-
- 81 -
Pintail ducks at Roach's Run, Va.

missioners dealing with upland game birds. Inthat session, several game technicians discussedthe subject of "How to Get Adequate Harvestof Pheasants, Sharptail, and Blue Grouse"inother words, "how can we get the hunters tocheck overpopulation?"
Last year (1956), the legal hunting seasonon sharptail grouse in North Dakota was moreliberal than in many years. Colorado and NewMexico had larger quail populations and longerhunting seasons than for many years.
In the publication, New Mexico Wildlife foiJune 195'7, Levon Lee, chief of game manage-ment for the New Mexico department wrote,"New Mexico's . . . antelope, elk, mountainsheep, javelina, turkey, and . .. deer continue toincrease."
In the June 1957, issue of Field and Stream,Conservation Editor, Harold Titus reportedthat "WestAfirginia game officials are complain-.--ing that their Sleepy Creek State Forest, al-though it is only 80 miles from Washington,D. C., doesn't attract enough hunters to keepthe deerherd within bounds or to make a dentin the population of turkey, grouse, and squir-rels. The State is even offering to show huntersthe way around the area.. ."
In the June 8, 1957, Newsletter of the Colo-rado Game and Fish Dept., Dean Coleman, furmanager, is quoted as saying, "Colorado's popu-lation of furbearing animals is holding up well
#1.11111
with some species, such as raccoons ;ind foxes,increasing a bit too rapidly."
Note that these statement report conditionsin 1957, not 1857.
Another indication of the abundance of hunt-ing is the fact that in many States we paybounties or hire hunters to kill piimas, wolves,coyotes, foxes, and badgers. If we were reallyshort of hunting, we would have these animalson our game list instead of on the vermin list.All of them offer excellent sport for the hunterand his dogs.
spread of native game species to newranges, espeCially raccoon, foxes, tree squirrels,and deer on the Plains is notable. Today thereare sizable populations of these animals on thePlains in areas where 50 years ago there werefew or none. In many cases, this spread is duealmost solely to the planting of windbreaks andshelterbelts in areas where no trees previouslyexisted.
Even waterfowlthat wildlife resourcewhich, according to some "prophets of doom,"is being destroyed by drainagehas been onthe upgrade for several years.
These conditions don't indicate that lumber-ing, farming, and grazing are wiping out ourbig game, upland game birds, furbearers, orwaterfowl.
In regard to warm-water fish, almost everypublication we pick up tells us that our WEerM
,t It 1 8,,X 14. PITOft I, I. , .7- .fr itdWP.'","4 la
,'ZisikiV° -tt4 4 "et--sit .1... Vitiv&42
its
t ..,-.1.ttir.e.a..Wild tom turkeys strutting on a wildlife refuge in Oklahoma.
-82-

1,-
''^;:19
frti;
1 1 M. mb.
Deer in the Black Hills region of South Dakota.
water fish populations are being underharvested.This is often true even of trout in water morethan a mile from a road. Nevertheless, newreservoir construction, as well as developmentsin the control of rough fishes and the rehabili-tation of lakes and reservoirs, will furtherincrease our warm-water fish and trout produc-ing opportunities.
Furthermore, largely through assistancefrom the Department of Agriculture, hundredsof thousands of farm and ranch ponds havebeen constructed during the past 20 years.Many of these ponds are now providing fish forwarm-water species and for t..out. These smallponds can be fertilized and managed for highproduction. More research on stocking and man-aging of farm fishponds, and more technicalassistance to farmers on fishpond constructionand management problems can increase thisfishing .resource by perhaps tenfoldmaybemore.
Why are most species of fish and wildlifeholding their own or increasing in the face ofdrainage, grazing, lumbering, water control,and intensive farming activities? Among themany reasons are:
1. The cutting of dense stands of timberpermitted the growth of grasses, forbs,and shrubs. This increased the carry-ing capacity for deer, elk, grouse, fur-bearers, and many others.
2. Heavy grazing of some rangelands bydomestic stock favored forbs and
shrubs over the grasses. As a result,the carrying capacity for deer, elk,antelope, quail, and rabbits, has goneup.
3. The construction by farmers andranchers of thousands of reservoirs,lakes, ponds, ditches, and windmillshas put water on millions of acreswhere previously water was the limit-ing factor for wildlife. Bureau of SportFisheries and Wildlife surveys showthat in Montana there are about111.000 ponds, and in South Dakota,roughly 107,000 manmade ponds. InColorado, over 14,000 ponds haN e beenconstructed in the past 20 years. In theUnited States, over 800,000 ponds havebeen constructed in soil conservationdistricts since 1937. These manmadeponds provide water for big game, fur-bearers, upland game birds, and, inaddition to providing drinking waterand resting places for migrating water-fowl, many of them produce one ormore broods of ducks each year.
4. Soil conservation districts and th De-partment of Agriculture have n-sored conservation practices sue asstriperopping, contour cultiva n,proper irrigation, crop rotations,stubble mulching, grassed waterways,improved pastures, range mnagement,farm and ranch ponds, windbreaks, andother erosion-control measures. Thesepractices have slowed erosion, increased
- 83 -
Canada geese on a pond near Horicon, Wis.
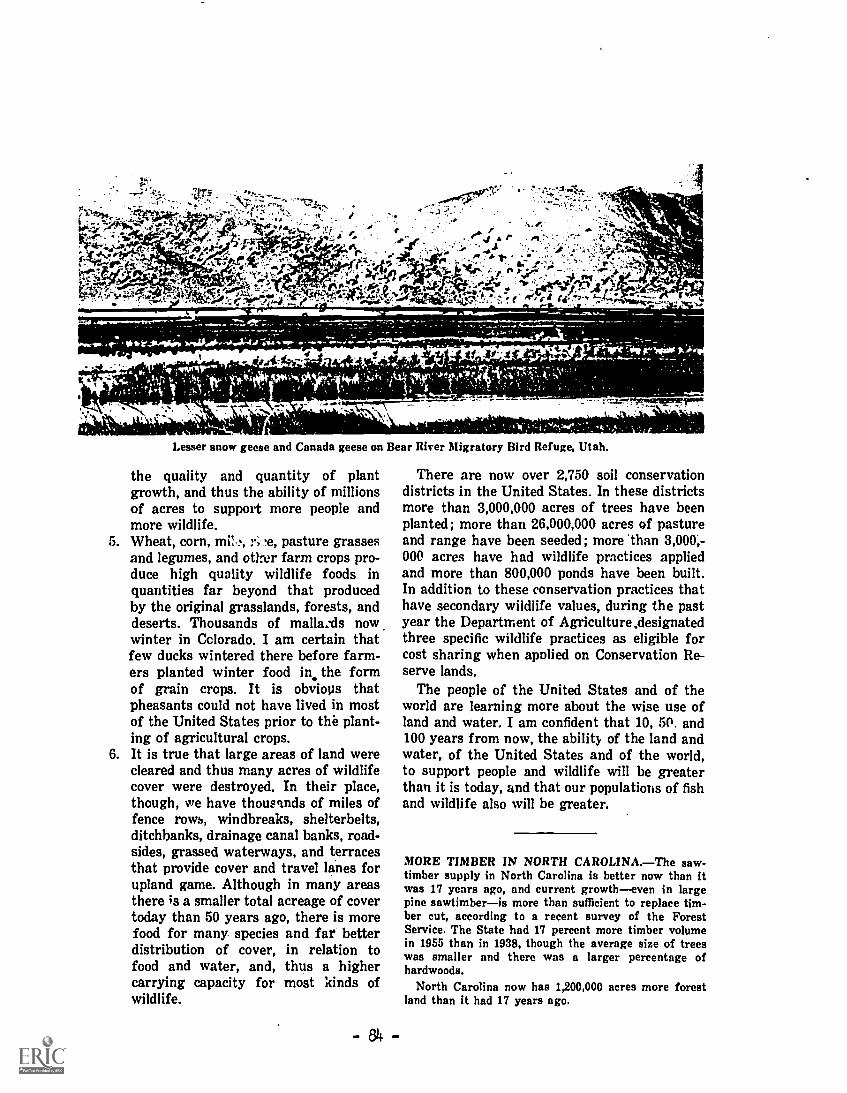
Lesser snow geese and Canada geese on Bear River Migratory Bird Refuge, Utah.
the quality and quantity of plantgrowth, and thus the ability of millionsof acres to support more people andmore wildlife.
5. Wheat, corn, r..e, pasture grassesand legumes, and otlrer farm crops pro-duce high quality wildlife foods inquantities far beyond that producedby the original grasslands, forests, anddeserts. Thousands of malla:ds nowwinter in Colorado. I am certain thatfew ducks wintered there before farm-ers planted winter food in the formof grain crops. It is obvious thatpheasants could not have lived in mostof the United States prior to the plant-ing of agricultural crops.
6. It is true that large areas of land werecleared and thus many acres of wildlifecover were destroyed. In their place,though, we have thousands of miles offence rows, windbreaks, shelterbelts,ditchbanks, drainage canal banks, road-sides, grassed waterways, and terracesthat provide cover and travel lanes forupland game. Although in many areasthere is a smaller total acreage of covertoday than 50 years ago, there is morefood for many species and far betterdistribution of cover, in relation tofood and water, and, thus a highercarrying capacity for most kinds ofwildlife.
84 OM
There are now over 2,750 soil conservationdistricts in the United States. In these districtsmore than 3,000,000 acres of trees have beenplanted; more than 26,000,000 acres of pastureand range have been seeded; more 'than 3,000,-000 acres have had wildlife practices appliedand more than 800,000 ponds have been built.In addition to these conservation practices thathave secondary wildlife values, during the pastyear the Department of Agriculture ,designatedthree specific wildlife practices as eligible forcost sharing when applied on Conservation Re-serve lands.
The people of the United States and of theworld are learning more about the wise use ofland and water. I am confident that 10, 50. and100 years from now, the ability of the land andwater, of the United States and of the world,to support people and wildlife will be greaterthan it is today, and that our populations of fishand wildlife also will be greater.
MORE TIMBER IN NORTH CAROLINA.The saw-timber supply in North Carolina is better now than itwas 17 years ago, and current growtheven in largepine sawtimberis more than sufficient to replace tim-ber cut, according to a recent survey of the ForestService. The State had 17 percent more timber volumein 1955 than in 1938, though the average size of treeswas smaller and there was a larger percentage ofhardwoods.
North Carolina now has 1,200,000 acres more forestland than it had 17 years ago.
WIPED OUT& UNSUNGALAN SOLEMDrawings Courtesy of the Field Museum
Perhaps the saddest aspect of being the curator of a biologicalcollection today is the glum knowledge that each year moreof your special world vanishes forever. Its passing causes nota ripple.
Sure. sonic things are saved. Heroic publicity measures anddedicated fund raising saved for the "Prairie State." Illinois.one scrap of virgin prairie. Goose Lake in Grundy County. Onestand of white oaks. Beall Woods, stands near the WabashRiver rather than Nino as charred barrels in Scotland agingwhisky.
I like Scotch whisky. but I also like forests. Our world needsboth. The passenger pigeon is gone and books are writtenabout it. The whooping crane barely survives. Life magazine(January 9. 1970. p. 84) includes under "trivial trends thatpoint the way" the fact that whooping cranes increased from33 in 1960 to 55 in 1970.
Yet, when I say that man has wiped out 10.000 species ofinsects and snail in the last 200 years. at most there areraised eyebrows. "So what?" is the usual comment. Even thosemost devoted to the preservation of natural areas and the sav-ing of rare and endangered species are unaware of this fact.Under my Christmas tree this winter was a copy of the beau-tifully produced Wildlife in Dangerby James Fischer. NoelSimon. and Jack Vincent. This book surveys the current sta-tus of endangered species as determined by the InternationalUnion for Conservation of Nature and Natural Resources, Ithas 149 pages on mammals, 152 on birds. 14 on reptiles. 3 onamphibians. and 13 on fishes. There is no mention of lowerorganisms.
It is unrealistic to expect otherwise. Western man long hasoperated with the view that the world is here for human ex-ploitation. This is epitomized by Pope's "The Proper Studyof Mankind is Man," We are more than uncaring. We are al-most totally anthropocentric [man-centered]. More like man,more interest: less like man. less interest. This shows in ourlanguage. our actions, and even the staffing of Field Museum
(see table). Yet cracks appear in our egocentric armor. TheNaked Ape and The Territorial Imperative became best sellersby calling attention to the animal aspects of human behavior.Pollution is past the point of being ignored. It is a basic factthat no organism can live on its own excrement. Look at ourrivers. Breathe our city ai . We have been trying very hard.The tidal waves of debris from our sewers, smokestacks, auto-mobile exhausts. garbage cans, and factory waste outletsthreaten disasters. Lip service to a clean environment replacesflag and motherhood in political speeches.
We are learning a lesson known to primitive tribes for manycenturies. Man shares this world with other organisms. Weneed them, and they need us. The oxygen we breathe is a wasteproduct of plants. The carbon dioxide plants use is a wasteproduct from animal bodies. Energy from the sun is used byalgae and land plants to make organic chemicals. Animals gettheir organic chemicals either by eating plants or by eatinganimals that have eaten plants. Decay organisms. mainlybacteria and fungi, reduce the dead bodies of animals andplants to simple chemicals. These are then used again in thecycle of life. All life on earth is linked in a vast interde-pondent ecosystem.
If we break this chain of inert to living to inert, life onearth will cease. Warnings by ecologists of dangers frompesticides. thermal pollution. and habitat destruction appearin mass circulation magazines. By 1972 the words "ecology"and "ecosystem" may be as familiar as "astronaut" and "space-ship." We must have plants. and animals. and birds, and evensnails and insects. Yet exploding human populations eon-
The anthropocentric staffing of Field Museum
Group of species
ManMammalsBirdsReptiles & AmphibiansFishesLower InvertebratesLand Arthropods
No. of No. ofspecies curators
1
4.190 2
8,590 38,500 2
40,000 1
175,000 1
910,000 2
If Field Museum decided to have as intensive a study of landarthropods as we do of mammals. we would need 436 curatorsfor land arthropods. Actually, only about 50 percent of the in-sect, mite, and spider species are known, while nearly allmammals have been described. A more realistic need wouldbe for 872 curators for land arthropods.
85
tinue to encroach on the environmenta fancy way of sayingwipe it out.
It occurs in big ways. And in small ways. The next 30 yearwill see all forests in Central America cut down and goneforever. Incredible and pessimistic? Not to a biologist whohas been there. Urban areas grow. Suburbs build up to 'un-interrupted vistas of manicured grass. concrete. and asphalt.at most sprinkled with trash. Many biologists of my genera-tion were weaned on vacant lots, redolent with dusty weeds onhot August days. singing with myriad insects and birds.Between digging forts and playing hide and seek ;ri the longgran- our eyes were caught by the red and black of a milk-weed beetle, the grace of a fluttering butterfly. or even theshimmering back of a resting slug beneath an abandoned card-board box. Curiosity. interest. avocation. profession followedin tidal sequence. Now these lots have houses. or at best areneatly asphalted play lots, routinely sprayed against mos-quitoes.
Bit by hit the environment changes. variety lessens, andspecie!! disappear. It may he robins from a city, buffalo fromthe Great Plains. or snails and insects from "some enchantedislands" rising dotlike from the vast Pacific. For here alone,our 10.000 species vanished. mostly within the span of livingcentenarians. Item: In the 1870's an American missionary, An-drew Garrett. collected 13 species of endodontid land snails onRarotonga in the Cook Islands: in 1963 there were only two.remaining. Item: Living endodontid land snails were found onMangareva. Gambier Islands in the 1840's; in 1934 only thedead remains of 25 species were found. Item: Of perhaps 125species of Hawaiian endodontid land snails still living before1850, probably less than a dozen exist today. Item: In 1948 aHawaiian entomologist. Elwood Zimmerman, could state con.cerning the native insects "that to say a third -or more of thespecies are now extinct would he no exaggeration." Inas-much as there are perhaps 6.000 species of Hawaiian insectsknown from collections in this century. this means a mere3.000 species were gone by 1948. More have vanishedsince. Add another 2.000 for the Marquesas. denuded offorest to 3.000 feet by the mid-1920's. plus the loss of 2.000species from the. Society IslandsTahiti. Moorea, Bora Bora.There are still the Austral Islands. Cook Islands. Samoa. Fiji--their vanished species unreckoned. The leeward dry regionsof the Hawaiian Islands contained 60 percent of the native treespecies. These have been stripped to nearly 5.000 feet. Howmany species gone? We don't know. But plants. and snails. andinsects combined? Ten thousand is a modest estimate.
Why did they go? It was not only by deliberate hunting. Itwas not all the fault of Western man. When the Maorisreached NeW Zealand about 950 A.D.. there was a bird faunaof perhaps 150 species. The large and edible moan were hunted
and killed, out this covers only about L.0 species. Another 30species disappeared by 1900 because of habitat disturbance.
Ilabf..at disturbance brings visions of bulldozers and factories.On islands it is much simpler. Cattle trample through nativeforest. An ornamental garden (ern goes wild and chokes outthousands of acres a year in Hawaii. A potted garden plantfrom overseas had a few unnoticed ants; within a decadePheidole megneephala. a voracious species of ant. occupiedlowland Oahu. destroying insects and snails alike. For severalyears I've been studying endodontid land snr..1s. On Pacific Is-lands there is a neat and simile equation: l:itroduced anteno ground dwelling endodontids. Even more s for many insects.
So I'm writing about the species that were. or occasionally(still) the species that barely are. On Upolu, Western Samoa.a beautiful little land snail called Thaumatodon hystrieelloideswas common in the woods behind the port of Apia in 1865.In 1965 it was restricted to high mountain peaks. the onlyareas from which introduced ants were still absent. The ques-tion is not will it become extinct, but when. Islands weretreasure troves of evolution, but the carelessness of man's in-troductions threatens to turn them into wastelands. Eighty-five of 94 bird species thought to have become extinct since1900 lived on islands.
But extinction strikes closer to home. A new subdivision inCalifornia results in bulldozing the only known habitat of aland snail into oblivion. Colorful Florida tree snails become ex-tinct over thousands of acres in the Miami-Homestead area asthe tangles of trees and vines are replaced, by houses. Resortsand retirement houses fill the Florida Keys, and more snailsare nearly lost. They are gone from their original home, butsurvivors have been transplanted into the Everglades NationalPark by a few dedicated naturalists. So some were saved.
Even land snails have a few partisans. And I plead guiltyto a somewhat malacocentric outlook. But many, many landsnail species are on the verge of extinction. There are only ahandful of malacologists. Should the few of us collect andpreserve samples from populati, ns of the vanishing species?If we do this, there will be a bottled remnant in museum jarsfor our successors to study. But if we scramble to snatch thesesamples of vanishing forms, there is not enough time for studyof what we get, nor for attempts to save and preserve. If westudy some, then many will be lost without a trace. If we tryto save a few, then neither collection nor study is possible.
No choice is easy. The island snails that I now study arevanishing rapidly. Saving them is not possible. Introductionsof domestic animals. plants, and insects have set in -motionhabitat changes that doom the snails to extinction. Unlimitedmoney, help. and cooperation would not be sufficient to reversethe trends. So I collect and I study. When I can, I help effortsto save natural arcas and preserve endangered species. Thisstill is little compared with the need.
"Can man survhe?" is the question now raised. Environ-mental catastrophes are predicted and occur. Crash programson ecology will be called fOr and organised. The call of "rele-vance" in teaching and social work is being extended to scienceand research. The need for practical results to aid man's sur-vival reduces the funds for hasic research in the middle of in-flation. Our awareness of deFendence on other life formsironically is breeding a new round of anthropocentrism. Willthere be room on earth for insects and snails? Will there beroom for students of them?
Alan Solem is Curator of Lower Invertebrates atField Museum of Natural History in Chicago.This article is reprinted from the April 1970issue of the museum's monthly Bulletin.
8,6
HOME STUDY COURSE RESPONSE SHEET
The American Environment
Name- (Block below for instructor use)
AddreFs:
Working Title:
Unit No. & Title:
Date Submitted:
Hours Spent on this lesson:
Date Received:
Date Returned:
Comments:
(Instructor's Signature
Begin lesson assignment below. Use additional sheets as needed.
(If lesson assignment is required, please transmit this response sheetto your instructor Along with the assignment.)
-87-
UNIT NO. 11
TIE Hum: POPULATION
Reading:
Unit No. 11
The Human Population
Population by Van Dersal (attached material). See alsoKellogg and Orvedal paper in Unit 6.
Wagner, Chapters 22, 23
Odum, p. 53-56, Chapter 21
Hinricks, entire book, noting especially papers by Hauser (p. 17),Casmann (p. 35), Hardin (p. 59), Shinn (p. 76), and ',!ald (p. 214)
Brubaker, pp. 32-73, 198-217
Assignment:
Turn in a brief discussion of a subject on which you will preparea paper. Set forth the major points you plan to cover. (Avoidsubjects on which you feel you are already seasonably well informed.)
-88-

POPULATION
Most of us know that the number of people in the world has been increasingvery rapidly. The rate of increase has been so fast that there is muchtalk about a "population explosion." Some scientists believe that theenormous and increasing numbers of humans are a grave threat to the futureof mankind. They claim that we are very close to entering on a new darkage. There are other scientists who do not think the problem is quite sothreatening. But almost everyone who has studied the matter agrees thatit is very serious.
The population of the world reached about one billion by the year 1850.In 1930, eighty years later, the population reached two billion, that is,it doubled in 80 years. Thirty years later, in 1960, there were threebillion people in the world. This population is growing at the rate of about2 percent each year. That this means is that unless something happens tochange things, the number of people in the world is doubling every 35 to40 years.
In the United States we took our first census in 1790. At that time therewere less than 4 million Americans. In 1960 we had increased to 180million. In 1970 we went past the 200 million mark. Between 1790and1950 our population doubled five times. Our average doubling time is about70 years.
Elsewhere in the world the doubling time is about 88 years for Europe,35 years for Asia, 28 years for Africa, and 24 years for Latin America.The rate for the Soviet Union is about the same as ours, that is, 70 years.
It is important to note two things about these figures. The first is thatthey are only approximately correct for Asia, Africa, and many LatinAmerican countries, although quite accurate for the United States, Europe,and the Soviet Union. The second is that we cannot necessarily predictwhat thepopulation of the world or any part of it will be by the year2,000. Many experts have predicted the world population at 7.5 billionby that time. But there are far too many uncertainties involved in makingsuch a prediction. Population experts themselves will tell you that theirpredictions are only likely to come true if things don't change. And, ofcourse, changes in the world are taking place every day.
Even so, it remains true that theropulation of the world is increasingand that the number of people is very large and getting larger.
If all the people were evenly spread over the lands of the earth, perhapsthe problem of excess numbers would be easier to solve. But the factsare not that way. The population is very unevenly distributed. More andmore people are living in cities. About 2 percent of the people in theworld were living in cities (with 20,000 or more people) in the year 1800.By 1950 about 20 percent, or one person in five, lived in cities. In theUnited States, at the time of our first census in 1790, 95 percent of uslived on farms or in places of aess-than-2,-500 people. In 1920, 51 percent

were living in urban areas -- central cities of 50,000 people or more thanthe counties in which they'were located. It seems clear, according to theexperts, that most -- perhaps 70 to 80 percent -- of our new Americans willprobably go or be born into urban places.
The sheer number of people in the world now, the fact that the number israpidly increasing, and the concentration of people in cities -- all theselead to a series of difficult problems for mankind.
To start with, the obvious question is, how many people can the earthsupport? So far there is no convincing, factual answer to this question.The truth is, we do not know. But to answer it, we need to think aboutsome other questions.
What about food for the world's billions? Can enough of it be producedto feed 3 billion, 7 billion, 10 billion people? At the present time,about two-thirds of the world's people get too little food of the rightkind. Two billion people are undernourished, that is, they are notgetting enough food to eat. The food they do get is lacking in proteinsor other substances necessary 'or health. People in this conditioneasily get diseases, are apathetic and listless, cannot work wall, anddie sooner than they should. Various estimates put the figure of deathsfrom outright starvation at some 10,000 humans per day. The answer to ourquestion then is that even now only about a third of the people have enoughof the right kind of food to eat.
We could produce a great deal more food than we are producing now. We arecultivating about 3.4 billion acres of arable land. There are another4.4 billion acres that could be used for the production of crops. We are,in other words, using less than half the arable lands of the world. Wecould more than double our capacity for producing food without any improve-ments in our methods.
These facts, and more that follow, have not been given much publicity. Theycome from studies of the World Soil Geography Unit of the U. S. Soil Con-servation Service. Scientists of this unit have been studying the problemfor the past 20 years. They have worked with soil scientists in everycountry. The soils of the world have been mapped and their characteristicshave been carefully studied.
It is incorrect to say that we are running out of land. Our soil resources,world-wide, are adequate for the production of enormously greater amounts of-food than we are producing now.
Even in the United States some 200 million acres of potentially arable landare not now cultivated. Counting these acres, there is a total of 660million acres still possible to cultivate in North and Central America.In Africa there are a billion and a half acres yet to be so used. In SouthAmerica there are about-1.4 billion such acres. In Asia there are about207 million acres that could be cultivated, and in the Soviet Union thereare 270 million acres more. Even Europe has a potential of 50 millionacres more than are presently being used for the production of cultivatedcrops.
-90-

Increasing the area we use to produce cultivated crops is clearly one waywe can produce more than twice as much food as we are producing now. The
trouble is that the people of the world are not distributed in the same may
as the soils. But there are two other ways to increase food production.
We can increase the yields from the cultivated soils. Actually, we
already know how to double production in some areas. We can increase pro-duction to 5 or 10 times what it is in many regions. And in some places,we could do even better than that. As we make these statements, let usnote that we are talking about modern management and technology that canbe applied, right now. That is, we are already able to do this, withvery little special research. Besides this, where we cannot transfer ourtechnology, lock, stock, and barrel, we can transfer our research methods.Vast areas of the tropics fall in this category. As Dr. Charles Kellogg,foremost soil scientist of the United States, has remarked, "The soils ofthe tropics are not at fault; we have only tot learn how to use them."
The third way we can use to increase the food supply is to put in useimproved methods of processing and storing the foods we produce. This
means cutting down losses from insects, fungi, bacteria, and rodents.It also means handling perishable foods by freezing or canning. In otherwords, if we can harvest, store, and distribute food with little or nowaste, we can materially increase the amount of food that reaches thepeople who need it.
Getting food to every person in the world is obviously a very complicatedmatter. There are many important factors involved -- land, technology,
processing, and numerous others. The point though, is, we have the landand the know-how. What we need are systems that will get the job done.
-91-

A prime conclusion of ecology is that species whose populations exceedor approach too closely the carrying capacity of resources in the spaceoccupied undergo reduction. Such reductions are often severe and maylead to extinction because of disease, pestilence, predation, or agres-sive competitors. Although it is true that man has repeatedly succeededin increasing both the space he occupies and its carrying capacity, andthat he will continue to do so, it is also clear that both the occupiablespace and its carrying capacity have finite limits which he can approachonly at great peril.
Only two thinna seem certain: there are going to be more people in thefuture Ind they will live in denser aggregates. The number of people tobe accommodated oy the end of the century, moreover, adds a new dimensionto current crises. To accommodate these populations, the developed worldwill require, by the year 2000, additional urban facilities equivalent toall of those already in existence, and correspondingly more for the under-developed world. This calls for an entirely different view of our citiesand their resource requirements than if we think only of amelioratingspecific crises step by step as they arise. Complete urban renovation,the creation of new and better living clusters throughout the country,and better and more diversified use of suburban and rural space are a bigorder; but it is an order that is practicable, necessary, and urgent.There is no simple "best solution." A variety of solutions must be tried,and for al:_ of them the resource component (including clean air and water)will be central.
Nutrition is the first essential; yet problems of distribution, of localfailure to exploit potentialities, and with social customs that dictatewhat food is acceptable are more immediately urgent than the problem ofquantity of food available or producible on a global scale. If presentworld food production could be evenly rationed, there would be enoughto satisfy both energy (calories) and protein requirements for everyone --although with drastic reductions for the new affluent. All-out effort,including the provision of ample fertilizer, and genetic, ecological,and chemical research, could probably quadruple production from the landsand double production from the waters by the end of the century. Ifsuch increased production were evenly distributed, it could keep up withpopulation growth expected during the same time and even permit someimprovement of diet. But will such all-out effort be started andsustained?
Resources and Man, P. 2. 1966National Acad. Sci. and Nat'l Res. Council
- 92 -

HOME STUDY COURSE RESPONSE SHEET
The American Environment
Name: (Block below for instructor use)
Address:
Working Title:
Unit No. & Title:
Date Submitted:
. Hours Spent on this lesson:
Date Received:
Date Returned:
Comments:
(Instructor's Signature
Begin lesson assignment below. Use additional sheets as needed.
(If lesson assignment is required, please transmit this response sheetto your instructor along with the assignment.)
- 93

Reading:
Unit No. 12
Solid Waste
Excerpts from Soil Waste Survey, attached.
Wagner, Chapter 21
Odum, pertinents parts of Chapter 16.
Assignment:
Report on how solid waste is disposed of in your area.Do not include human sewage. Include garbage, paper,metals, glass, trash, street sweepings, etc.
The National Solid Wastes Survey
An Interim Report
U. S. Department of Health, Education, and WelfareWashington, D. C.October 24, 1968
-95-

Sample Representativeness and Community Data
by Anton J. Mahich*1966
Although 38 sLates are in receipt of planning grants, only 30states and .che District of Columbia hoe contributed data to oursurvey before July 1. 1963. However, an aefitional 3 states, Iowa,Indiana, and Kansas, ere PartiElly surveyed by nersonnel of ourProgram in cooperation with the state agencies and that data isincluded in our analysis (Figure 1).
The data we will be presenting this morning is from 6,259 com-munities, representing an estimated 92.5 million persons orapproximately 6 percent of the population of the United States.Statistically specking, our sample is quite large.
Our sample, on a population basis, is approximately 75 percenturban, the remainder being rural. This is to be compared with anestimated 73-percent-urban population of the nation in 1966.
For administrative purposes, the Department of Health, Education,and Welfare divides theUnited States into nine regionsThe Bureau of the Census has also divided the country into. nine areasusing a socioeconomic criteria. These census divisions, although notmatching exactly, are not dissimilar to the HEW regions. We felt,therefore, that if our current sample represented each HEW region, itwould represent the nation.
*Chief, Systems and Operations Planning, Solid Wastes Program
-96-

";Uhryu0IlPiiu
It
Jill;,
4
4
A101101116,.114111111
SSSSSSSSS
wo****,
4
10
diSSSS*.*
4.**
8*.4:1611111.
46,@Rr_:!anOam..,
.;%,!!11serssee,.474::.^.oledOSOBEF""..0sommomP'
4fg,
The Role of Facilities and Land Disposal Sites
by Albert J. Klee*
(1968)
The general purpose of the land disposal investigation aspectof the Survey is to determine the disposal capabilities, the costsand method of operation of all land disposal sites within a state.The current status of the sample stands at a little over 6,000 siteswhere for purposes of the Survey, a land disposal site includes anylocation, whether publicly or privately owned or operated, on whichthere is dumping of solid mastes by public or private collectors.Included are any privately owned locations where householders orother persons dump their refuse with the permission of public au-thorities and the private owner. Other dumping sites of suchmagnitude as to require public attention by state or local author-ities also are covered. However, so-called "promiscuous," orunauthorized dumps at the roadside or in public or private areason which dumping occurs on an irregular or infrequent basis, arenot considered land disposal sites for these reporting purposes.
Private sites owned and operated by industrial, commercial, orinstitutional establishments, and used solely for disposal of theirown solid wastes, are not the specific object of the Survey. How-ever, if these sites were surveyed, the information was processedalong with the others, in order that such data not be lost for pos-terity.
*Chief, Operational Analysis, Systems and Operations Planning,Solid Wastes Program
a. 98
The survey for land disposal sites encompasses four general areas ofinformation. These areas are as follows: a community description,a description and evaluation of the site, quantitative data such astons delivered to the site, and fiscal data such as operating costs.The relationship of the characteristics of the community to theseother areas requires a somewhat sophisticated analysis, and suchresults are not available at this time. However, it is possible tocompare the involvement of the public with the private sector, dthregard to operation and ownership of land disposal sites.
Considering all 6,000 sites, we find public operation of 79 percentof them, the remainder being operated privately. Because manymunicipally- operated sites are leased, however, the fraction publicly-owned is somewhat lower, about 63 percent. The public involvement is,nonetheless, considerable.
The Survey form provides for an answer, by the investigator, to thefollowing question: "Is this a sanitary landfill?" The answer isbased upon the interviewer's interpretation of the term, no guide -.lines being provided by the Survey instructions. Fourteen percentof the 6,000 sites were judged by the interviewers to be sanitarylandfills. However, the Survey form itself permits a fair evaluationof the site under consideration. Accordingly, special calculationswere made based upon the following criteria for a site to be termed"sanitary": (1) the site must have daily cover; (2) the site must notpractice open burning; and (3) the site must not have water pollutionproblems. Utilizing these somewhat modest criteria, the 14 percentof the fills termed "sanitary" were evaluated and, in the end, almosttwo-thirds were rejected as being unacceptable. In reality, then,only 6 percent of this sample of 6,000 can be reasonably characterizedas "sanitary landfills." This would suggest that perhaps there isstill some confusion about this term, and that some retraining is inorder.
What is wrong witlirOur-sites? Only 14 percent of the sample indicatedthat daily cover was used; 41 percent indicated no cover at all. Onlya bit over one-quarter of the sites have an acceptable appearance, andthere is some form of open burning on three-quarters of all the sitesinvestigated.
Sanitary landfilling, of course, costs more than inadequate landfilling.The sanitary 6 percent of the 6,000 sites investigated (which handled,on the average, about 27,000 tons per year at each site indicated anaverage total operating-plus-amortized capital cost of 1.05 per ton;for a sample of inadequate sites of about equal size this was 700.perton. However, the average inadequate site-accepted 11,000 tons ofwastes per year at a cost of 960 per ton. For sanitary landfillsof this. size, the average cost was $1.27 per ton. To upgrade allcurrent operations, not just those represented by the sample, it isestimated that some $244 million of capital funds would have to beinvested over a period of ten years for equipment alone. An additional$81 million-per year would be needed in operating funds. These figuresdo not include the costs which would be involved in supplying the coverneeded to eradicate the prior insults to our environment, nor do they
- 99 -
1?)
reflect the fact that sanitary landfilling consumes land at a rate71 percent greater than does inadequate landfilling. With regard tothe latter, however, it must be remembered that new technology maygreatly modify this present land utilization picture.
An investigation of solid waste facilities is also part of the Survey.This is intended to provide information about the operating char-acteristics and capabilities of all solid waste reduction or disposalfacilities within a state, other than land disposal sites. Suchfacilities include incinerators, grinders, crushers, transfer stations,compost plants, conical burners and hog feeding lots. Not included,however, are on-site disposal or reduction facilities such asapartmenthouse incinerators and household garbage grinders. Private facilitiesowned and operated by industrial, commercial, or institutionalestablishments and used solely for reduction or disposal of their ownsolid waste are not the primary object of the survey, but such are notexcluded if they are surveyed.
Public ownership and operation is involved in 96 percent of the 142incinerators, 76 percent of the 43 transfer stations, and 59 percentof the 23 conical burners included in the sample. Such facilities aregenerally located in areas zoned for industry, although one-quarter ofall incinerators are located in residentially zoned areas. Theseincinerator facilities, however, are more sightly than the otherfacilities noted. Only two-thirds of the transfer station and one-thirdof the conical burner operations had a satisfactory appearance. In generalthe 262 hogrfeeding lots studied had a more sightly appearance, relevant totheir location, of course, than had most conical burners!
The average incinerator processed 188 tons per day, but this low figure ispartly due to the small input of those incinerators constructed prior to1950. The average daily input to incinerators built after 1950 isbetween 230 and 400 tons. Input to the transfer stations studied 4erages375 tons per day and to the conical burners, 41 tons per day. Theaverage hog-feeding lot consumed about 4 tons per day of garbage. It isestimated, from the survey data, that approximately 8 percent of thesolid wastes collected in.the United' States is burned in incineratorsrand that almost 4 percent of the garbage collected is consumed by hogs.
The operating costs, per ton, of incinerators, transfer stations andconical burners are approximately $4.50,_$1.10 and $1.60 respectively.For capital costs, the analogous figures are $7,100, $1,100, and $1,700.
As disposal in conical burners is merely a controlled form of open burning,our primary interest is drawn to bona fide incinerators. It is possibleto classify survey incinerators into three types. Class 1 incinerators aredefined as those satisfying the following criteria: (1) they were construc-ted in or after 1950; (2) they have two or more furnaces; (3) reduction isa minimum of 75 percent by either weight or volume; (4) the facility hasoperating air pollution equipment. Class 2 is identical except for theair pollution criterion. Class 3 encompasses all other incinerators. Asit turns out, however, all of the criteria for these classifications canbe related to the age of the incinerator. The newer incinerators, for ex-ample, are the ones tending to-have operating air pollution equipment.Thus, the three classes can be adequately characterized by their averageages.
-100-

It is possible to compare the reduction capabilities of incinerators inage classes selected on the basis of the previously-stated criteria.By weight these figures are 79, 70, and 65 percent respectively; byvolume the corresponding figures are 85, 82, and 76.percent.
This now permits a comparison of incinerator operating costs not onlyon a tons-in basis, but on a tons-reduced basis as well. On a tons-inbasis, the operating costs of the first two incinerator groups are$3.27 and $4.05 per ton respectively. The last category has anoperating cost of $5.37 per ton processed.. When placed on the basisof tons-reduced, however, these costs are $4.06, $5.79, and $8.26 perton, respectively.
This, then, is a sample of the information currently being gleanedfrom the survey results. With time, of course, more ambitious andsophisticated analyses will be made to determine the complete roleof facilities and land disposal sites in the overall solid wastespicture.
-101-
The Challenge That The National Survey Presents
by H. Lanier Hickman, Jr.*
(1968)
The data presented by Dr. Muhich and Mr. Klee indicate indefinitive terms the magnitude of the problem that this countryfaces in solid waste management. The data provided serve also asindicators of what action must take place now and what planning isnecessary for the future to assure protection of the environment.
It is significant that at present approximately 12 percent ofthe residential population receives no formalized collection service,and that another 11 percent receives only partial service. As we in-
crease our efforts to improve solid waste management practices thisdeficiency must be reduced. This will require a more positive attitudeon the part of government and industry to assure that these servicesare provided. Additionally, 14 percent of the population is served bysystems that require separation of wastes at the source, yet their dis-posal operations have been combined. There is a need for review andupdating of these collection systems to reflect contemporary technology.This review and updating will require initiative by personnel in thepublic works field to stimulate the political sector to support suchefforts.
*Chief, Technical Services, Solid Wastes Program.
-102-

A.
It is inconceivable that this nation, which is making great stridesin the control of water and air pollution from industrial sources, can ig-nore an industrial solid waste volume of such magnitude as that being dis-
charged by municipal sources. It is significant that the National Surveycan provide little information about industrial solid wastes.. This lack
of information indicates local government's reluctance to regulate or as-sist in the management of these wastes--a responsibility that is rightfullytheirs. Too long has industry been left to fend for itself in solid wastemanagement. The absence of uniform regulations and control has left in -.dustry with no option but to seek the easiest and cheapest method of man-agement to remain competitive; this should not be. Uniform regulationsand.local government interest mould require standard methods of managementby all industry and allow the integration of municipal and industrial solidwaste streams for better management.
This country has over 12,000 land disposal sites being utilized bycollection services, control of which 94 percent are unacceptable and repre-sent disease potential, threat of pollution, 'and land blight. By no stretch
of the imagination do these sites resemble a sanitary landfill. The wastemanagement field must face the challenge of studying and evaluating thesesites to determine their ability for conversion to sanitary landfills. We
must develop the necessary plans,, finances, and action programs to convertthose sites that can function as a sanitary landfill. In many instancesit will be necessary to close and abandon many of these sites. Local gov-
ernment then must locate and develop new sites now for immediate use andto provide necessary capacities for the increase of the future.
There are approximately 300 incinerators in this country, 70 percentof which are without adequate air pollution control devices. Many produceresidues and quench waters that are released into the environment withoutadequate treatment and control. These incinerators must be.studied, eval-uated, and upgraded to meet the more stringent pollution control regulationsnow being promulgated in this country. In many instances, complete aban-donment of these facilities will be necessary because of their antiquateddesigns and capabilities. Because many communities are without adequatespace for sanitary landfill, new incinerator plans will be needed. Thecurrent level of the solid waste load being treated by incineration (8%)may have to be increased to help do the, job.
All of these needed and necessary improvements and increased effortsare going to require large increases in manpower, capital investmentsand operating expenses. Tooperate existing disposal sites as sanitarylandfills may require well over 10,000 new sanitary landfill operators.Further, efforts must be made on an intensive capital development basisto provide the maximum amount of automation and control for incineratorsand the minimum amount of manpower. The current concept of the manpowerrequired in incineration operation must be completely changed. We can nolonger afford to overstaff our incinerators in an effort to operate anti-
- 103 -

quated and poorly designed' facilities beyond their capabilities. Toattract and retain the manpower with the qualifications needed, salariesand benefits for solid waste personnel must be increased severalfold.The solid waste management field, both public and private, must makeefforts to train personnel and provide the opportunity of a feeling ofpride in their work.
Finally, those working in solid waste management must decide whatis going to be required to upgrade, improve and enlarge their systemsto the levels necessary to protect the environment and provide adequateservices at a reasonable price. We must begin today to develop the time-frame necessary for financing the program development that will allow fora reasonable and rational management program at all levels of government.This timeframe must be developed so that government and the generalpublic can begin to understand the benefits and costs of adequate solidwaste management. We must begin now.
Mr. Vaughan will now summarize the Solid Wastes Program presentationand draw conclusions for the National Survey.
-

;rational Surve
Report .Summary and Interpretation
by Richard. D. Vaughan*
What do these preliminary results imply about the solid wasteproblem in the United States? Up to now, when anyone asked how much-solid waste is collected in this country, the usual response was either3.5 or 4 or 4.5 lbs per person per day, dependiag upon who was answeringthe question. Our Survey results show that the average amount of solidwaste actually collected in this country is over 5.3 lbs per person perday, or more than 190 million tons per year. What does this mean interms of future collection of solid waste materials? During the past5 years the per capita expenditure furconsumption of durable and nondurr_able goods, rose by about 4 to 6 percent. Since production and eventualdiscard of these goods are responsible for the waste materials, it wouldbe logical to suppose that the per capita waste production will increaseat a similar rate. Assuming the conservative 4 percent annual increasein per capita generation, the amount of material to be collected throughmunicipal and private agencies will rise to 8 lbs per person per day by1930. Assuming a national rppulation of 235 million by 1980, this meansthat over 340 million tons of solid waste will be collected.
*Chief, Solid Wastes Program.
-1U5-
mit

But these figures reflect only the amount of material that is collected.It must be recalled that 10 to 15 percent of household and commercialwastes are collected or transported by the individual generating thewaste. Approximately 30 to 40 percent of the industrial wastes are alsoself-collected and transported. Additionally, local regulations -- orlack of them -- permit over 50 percent of our population to burn sometype of household' waste in their backyards. About 45 percent ofcommercial and other establishments are also allowed to practice con-trolled open burning of some type. Thus, although the amount of wastematerial that has to be collected is staggering in itself, the amountof waste material that has to be collected is staggering in itself,the amount of material that is actually generated and could pose potentialcollection problems is even more impressive. Conservative estimatesindicate that 7 lbs. of household, commercial, and municipal wastes arepresently generated per person per day; this totals over 250 million tonsper year. To this must be added our estimate of over 3 lbs. per personper day for industrial wastes, amounting to an additional 110 million .
tons per year. Thus, estimates for 1967 indicate that over 10 lbs. ofhousehold, commercial, and industrial wastes are being generated in thiscountry for every man, woman, and child, totalling over 360 million tonsper year.
To these figures we must add over 550 million tons per7year of agriculturalwaste and crop residues, approximately 1.5 billion tons per year of animalwastes, and over 1.1 billion tons of mineral wastes. Altogether, over3.5 billion tons of solid wastes are generated in this nation every year.
In the Survey it was seen that, on the average, almost $5.40 per personwas budgeted by communities for collection activities. An additional$1.40 vas budgeted by communities for disposal activities, giving a totalper capita expenditure of $6.80 for both c9Nosetion and disposal. Thusthe total amount budgeted by municipalities is approximately $1.6 billionper year. But this figure does not include expenditures related to solidwaste management which are of a nonbudgeted nature. This means, forexample, that any monies expended for capital improvements and construc-tion that are supported by bond issues and retired.out of the generalmunicipal budget are not included. It has been estimated that expendituresof this type would add about $100 to $120 million to the expenditure formunicipal solid waste management, giving a grant total of over $1.7bi1]ion per year.
We have seen, however, that the'investment in both manpower and equipment'by the private sector is greater than that of the municipal sector sofar as collection activities are concerned. Since collection expenditures,amount to approximately 80 per cent of the budgeted municipal expenditures,we estimate that the yearly expenditure by the private waste managementindustry is approximately $1.8 billion.
These figures, of course, do not take into consideration the invest-ment by individuals or private industrial organizations, that, becauseof necessity or preference, handle and dispose of their own waste materials.Considering the' per capita investment in refUse containers, garbage grinders,on-site and backyard incinerators, and the money invested by industry
-106-

for transporting and disposing of their own material, we estimate thatthe expenditure in the individual sector is about $1.0 billion' annually.Thus, our current estimates of the annual expenditure to handle and dis-pose of the household, commercial, municipal, and industrial solid wastematerial in this country is $4.5 billion per year.
But, even with this impressive total expenditure, it must be con-cluded that present collection and disposal systems in this country arenot really adequate. I believe the fact that 94 percent of existingland disposal operations and 75 percent of incinerator facilities areinadequate is a national disgrace which must be corrected if our en-vironment is to be properly protected. In order to provide ulmpletecollection of household, commercial, and industrial waste materials,and, moreover, to upgrade the frequency of collection of these materials,it is estimated that an additional 12 percent of our total expenditures,or $540 million a year, must be allocated for operating expenses; thiscould entail an additional $20 million a year in capital expendituresfor trucks and other equipment. Similarly, to upgrade our land disposaloperations, an additional million per year is needed in operatingfunds;-while a total of *240 million, or almost $50 million a year forthe next five years, is required for capital expenditures. Thus, anadditional $130 million per year is required to upgrade our current landdisposal operations.
But we must also rectify our past mistakes. If the cost of convertingand covering existing open dumps is only 65 cents a ton, and if these dumpsare converted at a rate equal to current production, over $100 million peryear for five years 'would be required to complete this task.
It is estimated that'approximately $150 million is required to con-struct new incinerators for replacement of existing inadequate incineratorsand conical burners. An additional $75 million is required for air pollu-tion control equipment to upgrade or replace existing inadequate incinera-tors.
In summary then, it is seen that approximately $560 million per yearis required to upgrade our current collection systems. Approximately*230 million per year is reouired to eliminate the open dumps now in useand improve the level of our sanitary landfill operations. An additional*'E5 million per year for five years will be required to provide adequateincinerator capacity. This represents a total of *835 million per yearfor five years required to upgrade existing collection and disposal prac-tices in this country to a satisfactory level. This total is in additionto the estimated $4.5 billion spent annually for solid waste management.To these figures must also be added each year 4 to 6 percent of theprevious year's total expenditure to allow for costs due to populationLA-01:th ane increased per capita generation of solid waste. This additionalexPenditure represents an increase of approximately 18.; percent over thepresent fun ding level, which is not doing the job.
- 107 -

I should point out that the coot estimotzz are based upon thecurrent ratio of land disposal practice to incineration. If thismtion changes in the future, the coct figures must be adjusted ac-cordingly. The cost cotimateo are also based upon use of currenttechnology, current environmental control requirements, and constantdollarn.
Thus me have presented a status of current solid waste managementin this country/and the costs required to upgrade this practice to alevefthat we as a nation can consider satisfactory and which I believecitizens will increasingly come to expect. The National Survey whichis actually a Federal-State cooperative venture represents the best cur-rent estimate of solid waste management practice and problems in theUnited States today. I say estimate because most of the states foundthat very few records on the type, characteristics, sources, amounts,and disposition of solid. wastes are actually kept. We all recognizethe necessity to have good data for solid waste planning and problemsolving, not only for the long term but on a daily basis as well.Additional effort mill be made to stimulate record keeping at the locallevel so that even more meaningful information can be collected andevaluated.
The Solid Wastes Program, through sponsorship of research, andthrough various forms of financial assistance for planning and demonstra-tions, is furthering the technology of solid wastes management. But theapplication of this technology rests primarily with you--city and countypublic works officials, and those in the private sector engaged in solidwaste management. The time to begin improving solid wastes practices isnow. Fortunately, immediate improvement in solid waste management doesn'thave to await some new technological breakthrough. If we will'only apply,on a nationwide scale, the best existing technology, we will have gonea long way toward ending the environmental blight and hazard which canno longer be accepted.
The theme of this year's annual meeting of the American PublicWorks Association is "Changes in Nan and his Environment." I believewe have pointed out some very significant changes that man must makein his environment if we are to assure that the environment of thefuture adequately protects the public health, natural resources andscenic beauty of this nation. Let us work positively together for abetter tomorrow.
- 108 -

Excerpts from
Solid Waste Management
Prepared by an Ad Hoc Group
for
the Office of Science and Technology
Executive Office of the President
Washington, D. C.
May 1969
109 -

TABLE 2. COMPOSITION OF SOLID WASTES FROM URBAN SOURCES
Urban Sources Waste Composition
Domestic, household Garbage
Rubbish, trash
Ashes
Bulky wastes
Wastes from preparation, cookingand serving of food; market wastesfrom handling, storage, and saleo( food.Paper, cartons, boxes, barrels,wood, excelsior, tree branches,yard trimmings, metals, tin cans,dirt, glass, crockery, minerals.
Residue from fuel and combustionof solid wastes.
Wood furniture, bedding, dunnage,metal furniture, refrigerators,ranges, rubber tires.
Commercial, institu-tional, hospital,hotel, restaurant,stores, offices,markets
Garbage
Rubbish, trash
Ashes
Demolition wastes,urban renewal,expres sways
Constructionwastes,remodelingSpecial wastes
Same as domestic.
Same as domestic.
Same as domestic.
Lumber, pipes, brick masonry,asphaltic material and other con-struction materials from razedbuildings and structures.
Scrap lumber, pipe, concrete,other construction materials.
Hazardous solids and semiliquids,explosives; pathologic wastes,radioactive wastes
Municipal, streets, Street refusesidewalks, alleys,vacant lots, incin- Dead animalserators, power plants,sewage treatment plants,lagoons, septic tanks Abandoned vehicles
Fly ash, incineratorresidue, boiler slag
Sewage treatmentresidue
Sweepings, dirt, leaves, catch basindirt, contents of litter receptacles, etc.Cats, dogs, horses, cows, marineanimals, etc.Unwanted cars and trucks left on publicproperty.Boiler house cinders, metal scraps,shavings, minerals, organic materials,charcoal, plastic residuesSolids from coarse screening and gritchambers, and sludge from settling tanks
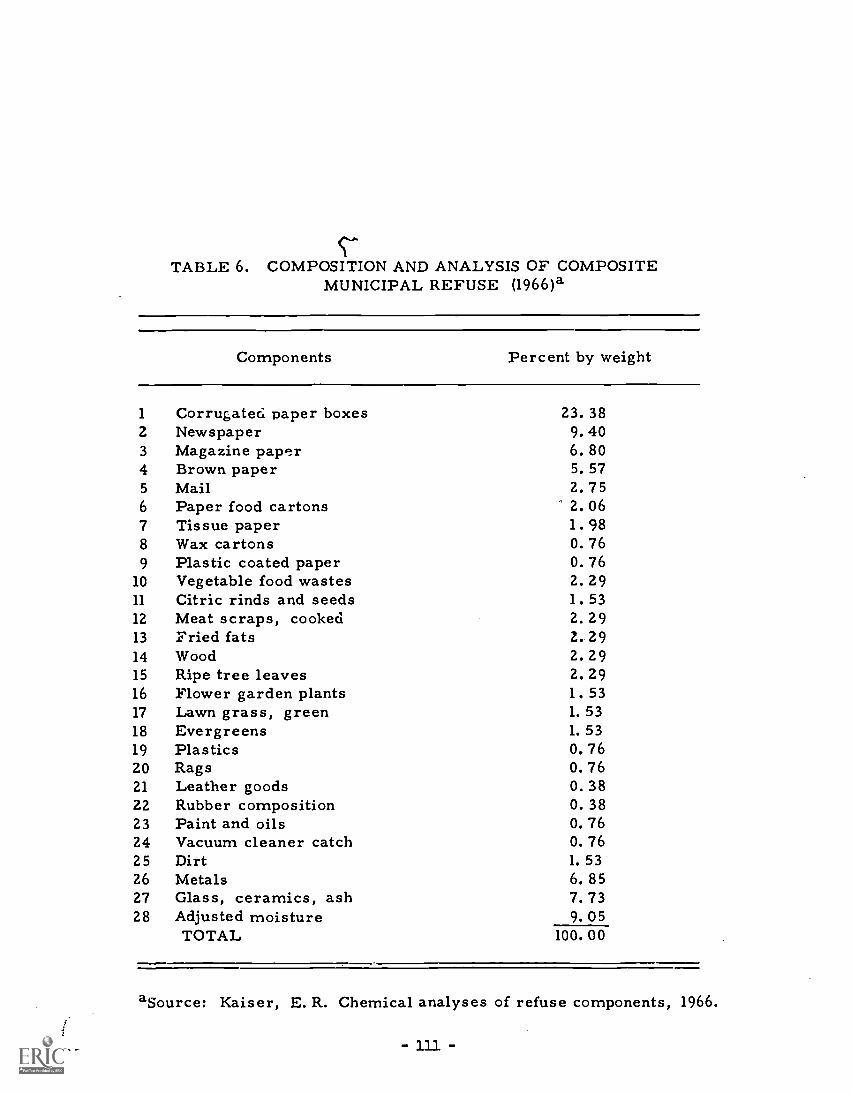
TABLE 6. COMPOSITION AND ANALYSIS OF COMPOSITEMUNICIPAL REFUSE (1966)a
Components Percent by weight
1
2Corrugated paper boxesNewspaper
23. 389.40
3 Magazine paper 6. 804 Brown paper 5. 575 Mail 2. 756 Paper food cartons 2. 067 Tissue paper 1. 988 Wax cartons 0. 769 Plastic coated paper 0. 76
10 Vegetable food wastes 2. 2911 Citric rinds and seeds 1. 5312 Meat scraps, cooked 2. 2913 Fried fats Z. 2914 Wood 2.2915 Ripe tree leaves 2. 2916 Flower garden plants 1. 5317 Lawn grass, green 1. 5318 Evergreens 1. 5319 Plastics 0. 7620 Rags 0.7621 Leather goods 0. 3822 Rubber composition 0. 3823 Paint and oils 0. 7624 Vacuum cleaner catch 0. 7625 Dirt 1. 5326 Metals 6. 8527 Glass, ceramics, ash 7.7328 Adjusted moisture 9. 05
TOTAL 100.00
aSource: Kaiser, E. R. Chemical analyses of refuse components, 1966.

TA
BL
E 8
. SO
UR
CE
S A
ND
TY
PES
OF
IND
UST
RIA
L W
AST
ESa
Cod
eS.
I. C
. Gro
up C
lass
ific
atio
nW
aste
gen
erat
ing
proc
esse
sE
xpec
ted
spec
ific
was
tes
17Pl
umbi
ng, h
eatin
g, a
irco
nditi
onin
gSp
ecia
l Tra
de C
ontr
acto
rs
19O
rdna
nce
and
acce
ssor
ies
20Fo
od a
nd k
indr
ed p
rodu
cts
H
22T
extil
e m
ill p
rodu
cts
23A
ppar
el a
nd o
ther
fin
ishe
dpr
oduc
ts
24L
umbe
r an
d w
ood
prod
ucts
25Fu
rnitu
re, w
ood
Man
ufac
turi
ng a
nd in
stal
latio
nin
hom
es, b
uild
ings
, and
fact
orie
s
Man
ufac
turi
ng a
nd a
ssem
blin
g
Proc
essi
ng, p
acka
ging
, and
ship
ping
Wea
ving
, pro
cess
ing,
dye
ing,
and
ship
ping
Cut
ting,
sew
ing,
siz
ing,
and
pres
sing
Saw
mill
s, m
ill w
ork
plan
ts,
woo
den
cont
aine
r, m
isc.
woo
dpr
oduc
ts, m
anuf
actu
ring
Man
ufac
ture
of
hous
ehol
d an
dof
fice
fur
nitu
re, p
artit
ions
,of
fice
and
sto
re f
ixtu
res,
and
mat
tres
es
Scra
p m
etal
fro
m p
ipin
g an
d du
ct w
ork;
rubb
er, p
aper
, and
insu
latin
gm
ater
ials
, mis
c. c
onst
ruct
ion
and
dem
oliti
on d
ebri
s
Met
als,
pla
stic
, rub
ber,
pap
er, w
ood,
clot
h, a
nd c
hem
ical
res
idue
s
Mea
ts, f
ats,
oils
, bon
es, o
ffal
veg
e-ta
bles
, fru
its, n
uts
and
shel
ls, a
ndce
real
s
Clo
th a
nd f
iber
res
idue
s
Clo
th a
nd f
iber
s, m
etal
s, p
last
ics,
and
rubb
er
Scra
p w
ood,
sha
ving
s, s
awdu
st; i
n so
me
inst
ance
s m
etal
s, p
last
ics,
fib
ers,
glue
s, s
eale
rs, p
aint
s, a
nd s
olve
nts
Tho
se li
sted
und
er C
ode
24, a
nd in
addi
tion
clot
h an
d pa
ddin
g re
sidu
es
aSo
urce
: Sta
ndar
d in
dust
rial
cla
ssif
icat
ion
man
ual,
1967

TA
BL
E 8
. SO
UR
CE
S A
ND
TY
PES
OF
IND
US
TR
IAL
WA
S T
ES
( c
ont '
d)
Cod
eS.
I. C
. Gro
up C
lass
ific
atio
nW
aste
gen
erat
ing
proc
esse
sE
xpec
ted
spec
ific
was
tes
25Fu
rnitu
re, m
etal
26Pa
per
and
allie
d pr
oduc
ts
27Pr
intin
g an
d pu
blis
hing
28C
hem
ical
s an
d re
late
dpr
oduc
ts
29'
Petr
oleu
m r
efin
ing
and
rela
ted
indu
stri
es
30R
ubbe
r an
d m
isce
llane
ous
plas
tic p
rodu
cts
31L
eath
er a
nd le
athe
rpr
oduc
ts
Man
ufac
ture
of
hous
ehol
d an
dof
fice
fur
nitu
re, l
ocke
rs,
beds
prin
gs, a
nd f
ram
es
Pape
r m
anuf
actu
re, c
onve
r-si
on-o
f pa
per
and
pape
rboa
rd,
man
ufac
ture
of
pape
rboa
rdbo
xes
and
cont
aine
rs
New
spap
er p
ublis
hing
, pri
nt-
ing,
lith
ogra
phy,
eng
ravi
ng,
and
book
bind
ing
Man
ufac
ture
and
pre
para
tion
of in
orga
nic
chem
ical
s (r
ange
sfr
om d
rugs
and
sou
ps to
pai
nts
and
varn
ishe
s, a
nd e
xplo
sive
s)
Man
ufac
ture
of
pavi
ng a
ndro
ofin
g m
ater
ials
Man
ufac
ture
of
fabr
icat
edru
bber
and
pla
stic
' pro
duct
s
_Lea
ther
tann
ing
and
fini
shin
g;M
anuf
actu
re o
f le
athe
r be
lting
and
pack
ing
Met
als,
pla
stic
s, r
esin
s, g
lass
, woo
d,ru
bber
, adh
esiv
es, c
loth
, and
pap
er
Pape
r an
d fi
ber
resi
dues
, che
mic
als,
pape
r c,
.atin
gs a
nd f
iller
s, in
ks, g
lues
,an
d fa
sten
ers
Pape
r, n
ewsp
rint
, car
dboa
rd, m
etal
s,ch
emic
als,
clo
th, i
nks,
and
glu
es
Org
anic
and
inor
gani
c ch
emic
als,
met
als,
plas
tics,
rub
ber,
gla
ss, o
ils, p
aint
s,so
lven
ts a
nd p
igm
ents
Asp
halt
and
tars
, fel
ts, a
sbes
tos,
pape
r, c
loth
, and
fib
er
Scra
p ru
bber
and
pla
stic
s, la
mpb
lack
,cu
ring
com
poun
ds, a
nd d
yes
Scra
p le
athe
r, th
read
, dye
s, o
ils,
proc
essi
ng a
nd c
urin
g co
mpo
unds

TA
BL
E 8
. SO
UR
CE
S A
ND
TY
PES
OF
IND
UST
RIA
LW
AST
ES
(con
t'd)
Cod
eS.
I. C
. Gro
up C
lass
ific
atio
nW
aste
gen
erat
ing
proc
esse
sE
xpec
ted
spec
ific
was
tes
32St
one,
cla
y, a
nd g
lass
prod
ucts
33Pr
imar
y m
etal
. ind
ustr
ies
34Fa
bric
ated
met
al p
rodu
cts
35M
achi
nery
(ex
cept
ele
c-tr
ical
)
Man
ufac
ture
of
flat
gla
ss,
Gla
ss, c
emen
t, cl
ay, c
eram
ics,
gyp
sum
,fa
bric
atio
n or
for
min
giof
gla
ss; a
sbes
tos,
man
ufac
ture
of
conc
rete
,gy
psum
, and
pla
ster
pro
duct
s;fo
rmin
g an
d pr
oces
sing
of
ston
ean
d st
one
prod
ucts
, abr
asiv
es,
asbe
stos
, and
mis
c. n
onrn
iner
alpr
oduc
ts
Mel
ting,
cas
ting,
for
ging
,dr
awin
g, r
ollin
g, f
orm
ing,
and
extr
udin
g op
erat
ions
Man
ufac
ture
of
met
al c
ans,
hand
tool
s, g
ener
al h
ardw
are,
none
lect
ric
heat
ing
appa
ratu
s,pl
umbi
ng f
ixtu
res,
fab
rica
ted
stru
ctur
al p
rodu
cts,
wir
e,fa
rm m
achi
nery
and
equ
ipm
ent,
coat
ing
and
engr
avin
g of
met
al
ston
e, p
aper
, and
abr
asiv
es
Ferr
ous
and
nonf
erro
us m
etal
s sc
rap,
slag
, san
d, c
ores
, pat
tern
s, b
ondi
ngag
ents
Met
als,
cer
amic
s, s
and,
sla
g, s
cale
,co
atin
gs, s
olve
nts,
lubr
ican
ts, p
ickl
ing
liquo
rs
Man
ufac
ture
of
equi
pmen
t for
Slag
,co
nstr
uctio
n, m
inin
g, e
leva
tors
,m
ovin
g st
airw
ays,
con
veyo
rs,
indu
stri
al tr
ucks
, tra
ilers
,st
acke
rs, m
achi
ne to
ols,
etc
.
sand
, cor
es, m
etal
scr
ap, w
ood,
plas
tics,
res
ins,
rub
ber,
clo
th, p
aint
s,so
lven
ts, p
etro
leum
pro
duct
s
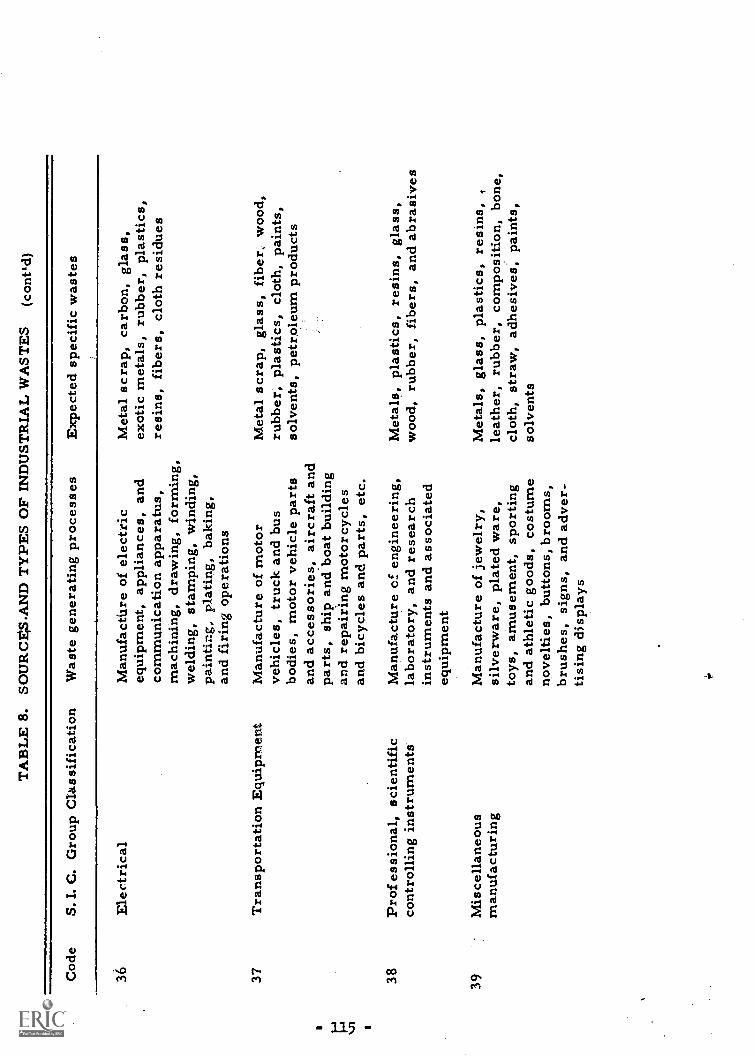
TA
BL
E 8
. SO
UR
CE
S.A
ND
TY
PES
OF
IND
UST
RIA
L W
AST
ES
(con
t'd)
Cod
eS.
I. C
. Gro
up C
lass
ific
atio
nW
aste
gen
erat
ing
proc
esse
sE
xpec
ted
spec
ific
was
tes
36E
lect
rica
l
37T
rans
port
atio
n E
quip
men
t
38Pr
of e
ssio
nal,
scie
ntif
icco
ntro
lling
inst
rum
ents
39M
isce
llane
ous
man
ufac
turi
ng
Man
ufac
tUre
of
elec
tric
equi
pmen
t, ap
plia
nces
, and
com
mun
icat
ion
appa
ratu
s,m
achi
ning
, dra
win
g, f
orm
ing,
wel
ding
, sta
mpi
ng, w
indi
ng,
pain
ting,
pla
ting,
bak
ing,
and
firi
ng o
pera
tions
Man
ufac
ture
of
mot
orve
hicl
es, t
ruck
and
bus
bodi
es, m
otor
veh
icle
par
tsan
d ac
cess
orie
s, a
ircr
aft a
ndpa
rts,
shi
p an
d bo
at b
uild
ing
and
repa
irin
g m
otor
cycl
esan
d bi
cycl
es a
nd p
arts
, etc
.
Man
ufac
ture
of
engi
neer
ing,
labo
rato
ry, a
nd r
esea
rch
inst
rum
ents
and
ass
ocia
ted
equi
pmen
t
Man
ufac
ture
of
jew
elry
,si
lver
war
e, p
late
d w
are,
toys
, am
usem
ent,
spor
ting
and
athl
etic
goo
ds, c
ostu
me
nove
lties
, but
tons
, bro
oms,
brus
hes,
sig
ns, a
nd a
dver
-tis
ing
disp
lays
Met
al s
crap
, car
bon,
gla
ss,
exot
ic m
etal
s, r
ubbe
r, p
last
ics,
resi
ns, f
iber
s, c
loth
res
idue
s
Met
al s
crap
, gla
ss, f
iber
, woo
d,ru
bber
, pla
stic
s, c
loth
, pai
nts,
solv
ents
, pet
role
um p
rodu
cts
Met
als,
pla
stic
s, r
esin
s, g
lass
,w
ood,
rub
ber,
fib
ers,
and
abr
asiv
es
Met
als,
gla
ss, p
last
ics,
res
ins,
rubb
er, c
ompo
sitio
n, b
one,
clot
h, s
traw
, adh
esiv
es, p
aint
s,so
lven
ts
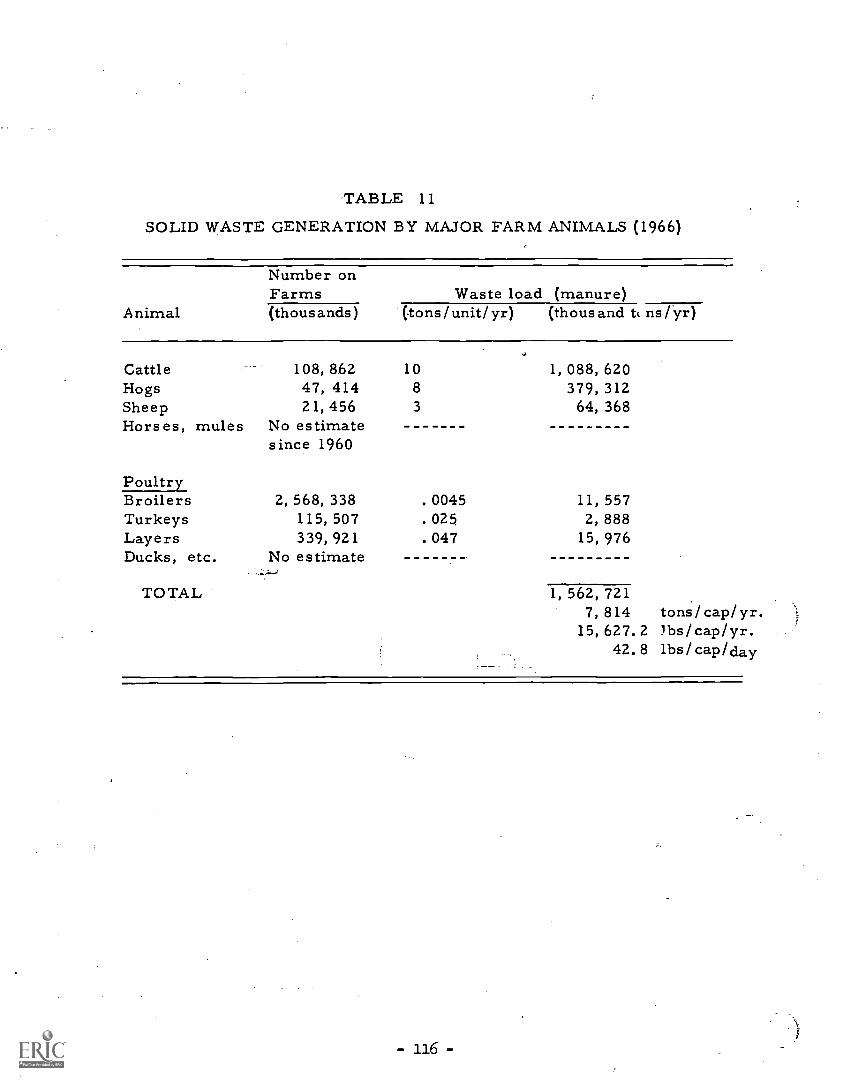
TABLE 11
SOLID WASTE GENERATION BY MAJOR FARM ANIMALS (1966)
Animal
Number onFarms Waste load (manure)(thous ands) (tons /unit/ yr) (thous and tt ns fyr)
Cattle 108, 862 10 1, 088, 620Hogs 47, 414 8 379, 312SheepHorses, mules
21, 456No estimatesince 1960
3 64, 368
PoultryBroilers 2, 568, 338 . 0045 11, 557Turkeys 115, 507 . 025 2, 888LayersDucks, etc.
339, 921No estimate
. 047 15, 976
TOTAL 1, 562, 7217, 814 tons/cap/yr.
15, 627.2 lbs/cap/yr.42.8 lbs/cap/day

TA
BL
E 1
2.G
EN
ER
AT
ION
BY
TY
PE O
F SO
LID
. WA
STE
S FR
OM
TH
E M
INE
RA
L A
ND
FO
SSIL
FUE
L I
ND
UST
RIE
S (1
965)
Indu
stry
Min
e w
aste
Mill
taili
ngs
Was
hing
pla
ntSl
agPr
oces
sing
Tot
alre
ject
sPl
ant w
aste
s(t
hous
ands
of
tons
)
Cop
per
286,
600
170,
500
5, 2
0046
6,7.
00
Iron
and
Ste
el11
7, 5
9910
0, 5
8914
, 689
1, 0
0023
3, 8
77
Bitu
min
ous
coal
12, 8
00--
86, 8
0099
, 600
Phos
phat
e ro
ck72
54, 8
234,
030
9, 3
8368
, 308
1 H H 1L
ead-
zinc
2, 5
0017
, 811
970
20, 3
11
Alu
min
um.
5, 3
505,
350
Ant
hrac
ite c
oal
2, 0
002,
000
Coa
l ash
-24
, 500
24, 5
00
Oth
era
--22
9, 2
84
Tot
als
419,
571
288,
900
144,
593
23, 9
1940
, 233
1,14
6, 5
00
a Est
imat
ed w
aste
gen
erat
ed b
yre
mai
ning
min
eral
min
ing
and
proc
essi
ng in
dust
ries
.
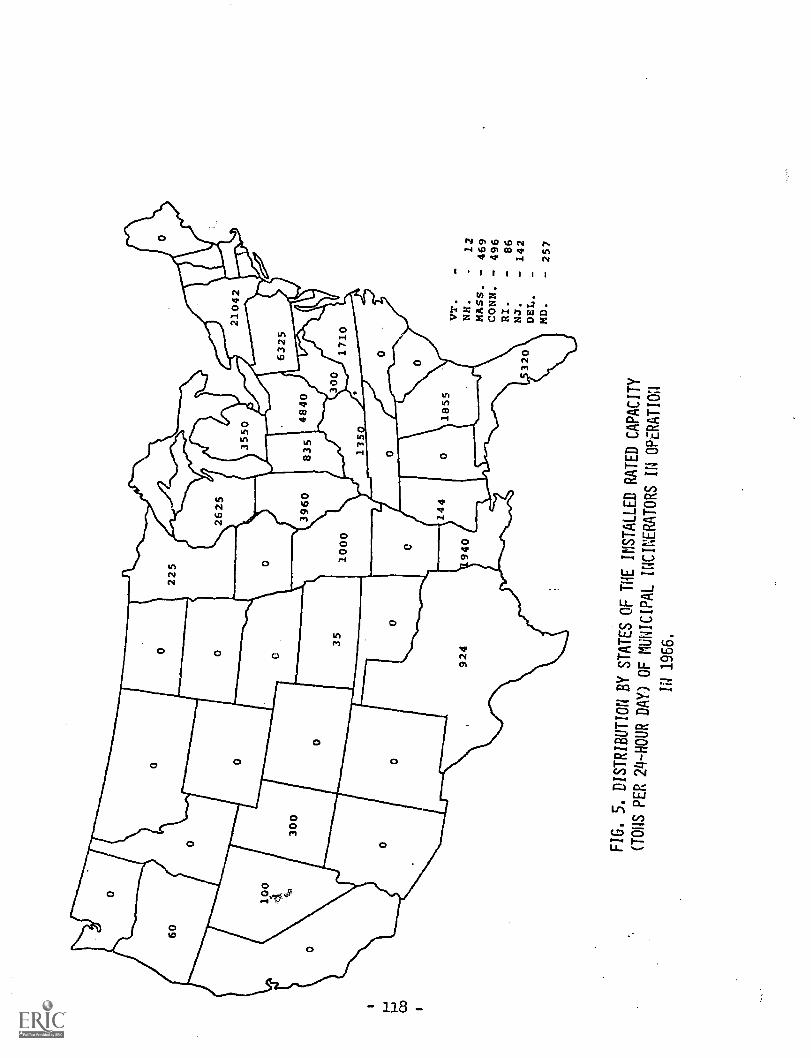
VT.
-
NH.
12
MASS.
469
CONN.
496
RI.
86
NJ.
- 142
FIG. 5. DISTRIBUTION
BY STATES OF THE
INSTALLED RATED CAPACITY
(TONS PER 24 -HOURDAY) OF MUNICIPAL
INCINERATORS IN
OPERATION
IN 1966.

Recently some rail carriers have established a new classifica-tion for compost materials. The classification, "waste products,"carries a 30 per cent lower freight rate than fertilizer products.There still remains room for improvement since earth or stone canbe moved by rail 60 per cent cheaper than fertilizer products. Ifstill lower rates could be provided by rail carriers to compostproducers, distribution of compost to a much larger area mightbecome feasible.
Despite municipal interest in the process, technical developmentof it, considerable investment, and much hope, only 1 of the 15 corn-posting plants built in the United States during the last 17 years hasoperated_for-aperiod long enough to indicate success; 8 have beenshut down in failure. Most of the plants that have closed were operatedby private businessmen who expected to realize a profit, balancingthe cost of processing refuse into compost against a fee charged to thecity plus proceeds from the sale of the compost.
The main difficulty in most start-up operations is the unsuit-ability of many items found in city refuse for hammermill and grindingoperations. Another factor is location. Despite claims to the contrary,there is an odor from compost and from compost plants, especially inwarm, humid weather. When earlier compost plant operators wentinto production and began to face the task of marketing compost, theirfirst efforts were directed towards the farmer. The only success inthis market that can be reported is in Florida where the compost wassold to citrus and vegetable farmers.
Utilization and Salvage
Diversion of fractions of the overall waste material from awaste stream to the basic and natural resources of the nation is oneexample of the method called "direct recycling, " com.nonly called1/salvage. " --The term' has been used rather loosely in practice toinclude both residues, such as metal scrap which was recycled withinan industry for utilization and hence never really a part of thecommunity waste stream, and materials and objects which are segre-gated from mixed refuse and sold. In this latter category are suchitems as rags, bottles, paper, nonferrous metals, and metal cans,which are destined for the landfill unless sorted out and reclaimed.This distinction between "reduction at source" and "direct recycling, "is useful for both technological and economic reasons.
- 119 -
In the broader sense, including both reclaiming and recycling,salvage forms the basis of an enterprise estimated to range from $5to $7 billion annually in the United States. It is, in fact, an essentialpart of the economy in that were it not for the utilization of scrapmaterials there would be insufficient raw materials at acceptableprices to meet the need of basic industries. Nevertheless, fie manage-ment of solid wastes is assuming critical proportions. Ther.-fore,it can only be said that without reclaiming and recycling the problemwould be worse.
The ideal system of solid waste management will be one whichresults in the maximum reduction in wastes for disposal by way ofreuse or recycling, and the disposition of the irreducible residuewithout insult and perhaps even enhancement to the environment.Direct recycling is most readily carried out in situations in which thewaste is relatively homogeneous and high in value. These conditionsprevail most frequently in commercial and industrial operations.On th:.- other hand, when reusable material is mixed with garbage andother refuse, its reclamation is difficult because economics effectiiielycontrols salvage and reclamation practices. As a result, salvage inmunicipal operations is relatively limited and sporadic. This difficultfraction cannot be ignored, however, because it represents a sizableportion of the nation's wastes (or resources).
Junk Automobiles.
In 1966 it was estimated that about 6 million scrap cars wereprocessed and sold to the steel and other metalworking industriesfor reuse, nearly equalling the number of cars being junked. Thiswas the first time that the utilization d automobile hulks equalled thescrapping rate. Large, high capital-cost auto shredding plants con-structed in the large urban centers have only in recent years pro-cessed more automobile hulks from the accumulated backlog of carsin the urban centers than were currently being junked in those areas.At the same time, however, more scrapped automobiles were beingadded to the accumulation of junked cars, estimated at 10 to 20 millionscattered in wrecking yards throughout the United States, particularlyin areas where operation of the high-cost shredding plants is economi-cally impractical. This pattern of scrap automobile accumulationthreatens to continue. Furthermore, the quality standards for ferroucscrap are changing, so that it is likely that difficulties will developin the marketing of shredded metal in excess of the rate of accumulation.Specifications for steel have grown more stringent. Residualelementsnot removed from iron or steel during normal refining processes,
- 120 -
particularly copper, nickel, aluminum, chromium, and vanadium,have slowly been accumulating in steel to a point where little or nocasual scrap can be tolerated in many uses that formerly consumedsubstantial quantities of scrap iron.
(A number of scrap preparation plant has recentlobeen construc-ted in which auto body scrap is reduced to a relatively dense, looseproduct. The processes involve feeding prepared car bodies to largehammermills which break the frames and bodies into small piecesand densify them. A major disadvantage to the shredding plants isthat they require a capital investment of several million dollars andonly operate economically in densely populated areas where anabundant supply of junked cars is available.
Ash.
Power plant bottom ash finds utilization in cinder block manu-facture, as road ballast, and in uses on highways during icy weather.Fly ash sometimes can be used as a soil conditioner and as an additiveto concrete and asphalt mixes. These uses, however, consume lessthan 10 percent of the fly ash generated. Thus, most of this extremelyfine-sized material is dumped in spoil areas adjacent to or near thepower plants at a cost ranging from 40 cents to $2. 00 per ton. Becausemany power generating plants are located in large urban centers,satisfactory disposal areas for the ash are becoming scarce, and evenunder the most favorable conditions of disposal, the spoil piles causeair and water pollution from dusting and silting, and deface the land-scape as well. The ideal method of disposing of fly ash would be torecycle all of it to industry for reuse as a raw material. The factorsthat limit or discourage any widespread utilization of the fly ash are:(1) the extreme variability in its chemical and physical properties;(2) cost of transporting the raw fly ash or products manufactured from
fly ash to major consumer markets; (3) competition of other rawmaterials which are, readily available to industry.
Rubber.
The reclaimed rubber industry appears to have existed approx-imately 100 years. The waste rubber industry has two main segments;the scrap dealers, who buy, segregate and resell rubber; and therubber reclaimers who reprocess scrap rubber so it can be used again.At the reclamation plant, the collected scrap rubber is graded into oneof the following categories: (1) whole, modified whole, and nonstainingtires; (2) "peeling" reclaims; (3) synthetic reclaims and butyl tube
-1.21-
neoprene; (4) specialties; (5) natural rubber reclaims (red and black).The reclaimed rubber which can be revulcanized is ground, subjectedto chemical treatment, and is then processed into rubber sheets foruse in the manufacture of new rubber articles.
The economics of rubber salvage, especially of tires, variesaccording to locale. The Midwest Rubber Company's St. Louisfacility pays $14 per ton (f. o. b. processor's yard) for waste rubber.An area having a radius of 600 miles is combed for raw materials tomeet the Company's commitments. The price paid in Akron is $12per ton and in Los Angeles the price is $7. 50 per ton. The freightcharge for shipping used tires from San Francisco to Los Angelesis $9. 50 per ton. Some tire companies are actually paying the $4.00(split between- the freight and the broker's commission) just to get ridof their waste tires. Reclaimed rubber brings $200 to $240 per ton,compared to about $500 per ton for synthetic butyl Grade-1 rubber.
Other Industries.
Some industries achieve very high utilization of scrap-and-waste,these being cotton at 59 percent, mostly by return to the land as soilamendment; wooden boxes at 50 percent,- mostly through sale of chips;saw mills at 66 percent by sale of chips and use of bark, slabs andsawdust for fuels; auto and aircraft at 50 percent; stockyards at 60percent by utilization for fertilizer; supermarkets at 40 percent,mostly by entering the commercial salvage stream;.millwork at47 percent; and printing and publishing (greater than 250 employees)68 peicent. At might be expected, fabricated metal products andmachinery, except electrical, show a high fraction utilized, 81 percentfor metal cans and 51 percent for the remainder of these two sectorsbecause most of their waste is metal scrap which readily finds utiliza-tion in the commercial salvage market. The meat packing industryhas found it possible through the years to utilize more and more of theanimal as "by-product" and is now listed at 44 percent, but this 44 per-cent did not actually enter the waste-for-disposal category as definedin this report.
Disposal
Disposal is the ultimate step in a solid waste management system.All solid wastes, whether raw refuse, sewage sludge, incinerator flyash and residue, and compost, must be utilized in some way or givenfinaldisposal. The major categories of disposal are open dumping,open burning, ocean disposal, mulching, land spreading, animalfeeding, and sanitary landfilling.
-122 -
Open dumping has been and is the simplest and most widelyused means of disposal of solid wastes. The last decade has seenextensive changes in the method of urban waste disposal. By andlarge, the most advanced method of ultimate disposal for urbanareas is the sanitary landfill. Sanitary landfilling is a method ofdisposing of refuse on land without creating nuisance or hazardto public health or safety by utilizing the principles of engineeringto confine the refuse to the smallest practical area, to reduce itto the smallest practical volume, and to cover it with a layer ofearth at the conclusion of each day's operation or at such morefrequent intervals as may be necessary.
Urban Waste Disposal.
The National Survey results illustrate the wide variety of com-munity approaches to the disposal of solid wastes and also giveemphasis to the gap between the actual and desirable methodology.
Land disposal sites provide by far the predominant disposalmethod in use by American communities. The 6300 communitiesmade use of about 8900 land disposal sites and about 1000 other disposalor waste reduction facilities.' (Table 14)
In a separate investigation of sites and facilities, in connectionwith the survey, a total of over 6000 land disposal sites have beenvisited and surveyed thus far. Some 79% of these landfills werec)perated by public agencies. Nevertheless only 14% of the sites wereadjudged by the interviewers to be sanitary landfills. Moreover thesurvey form itself permits further evaluation of site standards, andon the basis of a review of the forms it appears likely that less than6% of them can truly be characterized as "sanitary landfills. "Although the sanitary landfill has been recommended by engineers formany years, its acceptance by the public is still far from universal.
While making use of about 10,000 sites and facilities the presenceof which was known and accounted fore and for which some form ofcontrol could be exercised, the communities acknowledged, at the
1 These figures undoubtedly include some double counting due to thelikelihood that two or more communities use the same site.
same time, the presence within community bounds of almost an equalnumber (9300) of unauthorized or promiscuous dumps over whichthere was no control whatever and little knowledge as to the offenders.The absence of controls and probably also in great measure the absence
of adequate community provision for solid wastes are responsiblefor such a state of affairs. The failure to exercise modern controlscan be seen in community response to questions concerning openburning of wastes within the community. Almost 68% of communitiesreplying to the question indicate burning of demolition-constructionwastes and land clearance wastes takes place within the community.Ov;-r 69% gave the same response on the burning of commercialwastes on site. In the case of backyard burning of household refusethe figure was over 82%. Even 66% of urban communities, as distinctfrom rural, countenance backyard burning.
The recent trend among larger communities is away from sanitarylandfill and toward incineration. Reasons for this include: lack ofavailable landfill sites, long distances required for hauling, and theneed to preserve as long as possible the remaining landfill locations.Incineration is not a complete disposal method and considerablesanitary landfilling is needed to dispose of incinerator residue andnoncombustible materials.
Disposal of hospital wastes products is generally accomplishedby the following three methods: (1) incineration followed by burial ortrucking to final disposal site; (2) trucking away to final disposal site;(3) grinding and discharge to sanitary sewer systems. The introduc-tion of many new single-service items and the increasing use ofdisposable materials has greatly altered the types and quantities ofhospital solid wastes. This change is usually noticed by its effecton incinerator loadings and operations. The problems inherentin the safe handling of such items as plastic syringes, rubber gloves,catheters, emesis basins, and plastic. petri dishes by such meansas outdoor storage and municipal collection, involve special consider-ations for the safety of hospital staff, waste collectors, and the publicat large.
Industrial Waste Disposal.
Burning and dumping ad the most widely used methods of disposalfor industrial solid wastes. These methods are increasingly unacceptablein the face of more stringent air and water pollution regulations and the
-124+-

HOME STUDY COURSE RICPC-SE STET
The American Environment
Name: (Block below for instructor use)
Address:
Working Title:
Unit No. & Title:
Date Submitted:
Hours Spent on this lesson:
Date Received:
Date Returned:
Comments:
(Instructor's Signature
Begin lesson assignment below. Use additional sheets as needed.
(If lesson assignment is required, please transmit this response sheetto your instructor along with the assignment.)
-125-

UNIT ITO. la
PERSISTENT C,11 7.:Iva CALS
Reading:
Unit No. 13
Persistent Chemicals
Wagner, Chapters 12, 13, 14, 17
Odum, pp. 445 - 448
Brubaker, pp. 108-111
Ecological Effects of Pesticides on Non-Target Species
Air Evaluation and Summary by David Pimentel of CornellUniversity, published by the Office of Science andTechnology.
Assignment:
Continue work on your term paper, which will be due withUnit No. 16.
- 126 -

Pollution by Pesticides
Various estimates indicate that as many as 500 thousand different chemicalsubstances may have been released into our environment. We simply do notknow what the effects may be for all but a very few of them. The problemis complicated by the fact that some of the substances change, after theyare released. Some may become harmless, some may become changed into moreharmful chemicals.
A number of chemicals -- including DDT, which has been studied possibly toa greater extent than any other -- a number of these chemicals persist inthe soil, or in the air, or in water, for as long as 10 or 15 years. Some
are concentrated by various organisms in the food chains that occurnaturally. For example, floating micro - organisms may concentrate achemical that is harmless in low concentrations. In turn, largerorganisns -- water insects, and various arthropods -- eat the microscopicplants or animals and concentrate the chemical further. Small fish, thenlarger fish, then fish-eating birds may, at each link of the food chain,store or concentrate still larger amounts. At the top of the chain, theconcentration may be hundreds or even thousands of times greater than itwas originally.
The harmful effects must, of course, be balanced against the beneficialeffects. DDT for example, has saved millions of lives by destruction ofdisease carriers, has benefitted perhaps two billion people more especiallyin saving food supplies, and it has resulted in damage to wildlife, moreparticularly birds such as the bald eagle, and several falcons, as well asfish and other water-living organisms.
Persistent Chemicals
Our problems with the environment are made all themore difficult by theway we have been putting persistent chemicals into it. If the chemicalsdisappeared in a short time, the problems with them might not be great.But many of the chemicals we use and that escape into the environmentor that we simply dump into it, last a long, long time. They are oftenvery complex substances, and many are not always broken down into simplercompounds by bacteria or fungi, at least, not very soon. Thus, manywaste products and other substances we use for a variety of purposes,linger for months or years in the soil or water.
To understand what this means, we may classify the chemicals we have beenputting into our environment in this way:
1. Pesticides
These are chemicals we use to destroy insect pests (insecticides),or weeds (herbicides)por fungi (fungicides), or rats and miceand other rodents (rodenticides). In total we call these pesti-cides, meaning something that kills pests. Most of these areagricultural chemicals, although not all of them.are.
- 127 -

2. Radioactive materials
These are chemicals that are radioactive. This means that theyare giving off destructive rays, -- beta rays and gamma rays.Almost all of these come from the testing of atomic bombs.Radioactive strontium, iodine, and other substances, fall outof the atmosphere and contaminate the soil or water. Theycontinue radiating for months, or for many years, dependingon the substance.
3. Chemical Waste products
Here we classify a wide variety of chemicals that are simplydumped into our rivers or oceans, or that escape into theatmosphere and eventually are washed down into the soil andrivers by rain. There are upwards of several hundred thousandkinds of such material. We, know very little about most of them,in relation to the environment. .A few, such as PCB's (shortfor polychlorinated biphenyls), mercury compounds, and a fewothers, last a long time -- decades perhaps -- before they arebroken down into simpler, harmless substances, or renderedharmless in some other way. Some of them -- such as mercury --never can be eliminated.
Effects of Chemicals
All three types of compounds -- pesticides, radioactive materials, andchemical waste products -- are new products. They are new to the environ-ment, new to the decay organisms, with unexpected or unknown effects.Most of them were put into soil or water or the atmosphere in the more orless indifferent belief that it would make no particular difference.
We were intent on something else. The pesticides were aimed at insectsor fungus diseases of crop plants, or rodents. The waste products weresomething simply to dispose of by washing down the drain. Radioactivefallout was a by-product of nuclear tests. We learned later on'thatsome of them could and did do a lot of damage in the environment. We hadnot expected this. Apparently, it simply did not occur to most of usthat such chemicals might have effects in air environment that we did notintend.
Some very strange things happened to many of these products. Some ofthem spread into the environment in exceedingly minute quantities. Butpresent in parts per billion, or parts per million, they were taken upby bacteria or other organisms that happened to be immune to theirdirect effects, and concentrated. Various organisms absorbed them -- andaccumulated them in their bodies. When these organisms were eaten by largerorganisms in the food chain, the larger organisms accumulated more of thechemical -- and so on, up the food chain.
At the top of the food chain, the amounts present were amounts far beyondthe original concentrations in the water, or soil, or air. Thus, wehumans, at the top or near the top of the food chain, were getting hundredsor thousands of times as much of the chemicals as were present in theenvironment. These amounts could very possibly cause us some damage. Theworst of it was that this concentration of chemicals was something we didnot realize was happening. In fact, we didn't expect it to. Nobody did.
The things that can happen can be illustrated by a brief account of DDT.This substance has been more studied than most other pesticides. It is aspray most people have heard about. It is used to kill many kinds ofinsect pests on crop plants, on buildings, in swamps, and on body liceon people. Some experts think it is one of the best insecticides we haveever had. It is perfectly safe to handle, humans are not poisoned by itas far as we know. It is highly effective against many pests. And itlasts a long time and thus keeps on killing pests long after it is applied.These things we knew early in its history.
And so, in 1946, this excellent insecticide was introduced into commercialuse. After a time we began to learn more about it. What we learned wouldhave been pretty difficult to find out ahead of time. Factors thatappeared later were these:
1. DDT would persist in the soil for as much as 15 years or more.

2. It was discovered in oceanic birds, and in the seals andpenguins of the antarctic, great distances away from anyplace it was being used. At first, no one knew how itreached them.
3. We found out that it volatilized, that is, it got into theair as a vapor, from soil or water. This meant that itcould be carried about in the atmosphere by winds, allaround the world.
4. It was concentrated in natural food chains. It might bepresent in extremely minute quantities in the air or water,but organisms stored it up, one after another up the foodchain. Sometimes it was concentrated as much as 100,000times, meaning that animals at the top of a food chain mightcontain 100,000 times as much of it in their bodies as therewas in the soil or water or air.
5. DDT is now present in animal life and human beings almosteverywhere. We have it in our body fats, the Eskimos have it.We began to be uneasy, then alarmed, about this. What effectswould it have on us, and on other organisms?
S far at least, it hasn't hurt human beings. The AmericanMak_ ai Association stated in 1970 that it certainly doesnot cause cancer. Other effects on people? None areknown so far.
7. It has seriously hurt some types of wildlife. With somebirds including eagles, ducks, certain quails, hawks, pelicans,--it causes the eggshells to be very thin. They are so thinthey break before the young birds inside are ready. Thisprevents the birds from raising young, and gradually thenumber of birds decreases.
8. Birds such as robins and sparrows died after feeding, onearthworms that had concentrated DDT or one of its breakdownproducts known as DDE. Many other kinds of birds were affected
--in one way or another. The effects were slight with some birds.With others, the population declined, either from eggshellthinning, interference with breeding, or death.
9. Many kinds of fish died after DDT got in the water, but otherspecies were not affected. This depended on the concentrationof DDT, and on other factors. Some kinds of frogs died; otherkinds didn't. Many kinds of insects were not affected. But agreat many kinds died, some of them the very ones that preyedon the pest insect.
10. In very minule concentrations, such as 1 part per billion,populaAons of phytoplankton -- the microscopic floating plantsin fresh or salt water -- were reduced by half or more. In
-130-
some studies, photosynethesis was found to be reduced sub-stantially in certain algae of the oceans. The presentconcentration in the oceans is said to be in the parts pertrillion range.
11. DDT works itself out of a job, so to speak. When it is usedto kill flies, for example, it kills almost the whole popula-tion of flies where it is used -- all but a very few. Thesefew flies are somehow resistant to it. They breed up a, wholenew population of flies resistant to DDT. On this new breed,we have to use some other chemical.
12. All these effects are now affected by another one discoveredonly recently. It turns out that many of the identificationsof DDT by highly sensitive and accurate instruments have beenidentifying as DDT has really been something else. Somechemicals known as PCB's or polychlorinated biphenyls giveclosely similar readings on our instruments. These chemicalsare used in the manufacture of paints and plastics. They lasta long time in the environment too, and furthermore theydamage wildlife in much the same way that DDT does.
13. Where DDT has been banned from use, poisonings increase amongpeople who use other and frequently far more dangerouschemicals. In one country in Central America, upwards of athousand people died this way within about a year after DDTwas banned. Having used "safe" DDT, they were careless inhandling chemicals very poisonous to human beings.
14. Extreme difficulty in raising some crops -- such as cotton --is expected if DDT cannot be used because we do not havesatisfactory alternatives at the present time. Several millionpeople depend on cotton for a living in this country. Some ofthe chemicals used instead of DDT on cotton, kill honeybeesthat pollinate the plants. Very large losses to the beekeepers,and to the people raising crops dependent on bees for pollina-tion are on reccrd where these substitutes have been used.
15. Other methods of insect control are being developed that mayultimately enable us to get along wit'-.out DDT, at least in thepresent form. We underscore ultimately, however, because thescientists say we are still quite a long way away from beingable to depend entirely on these new methods.
For many of the chemical substances we have released, the amounts gettinginto the environment were relatively small and local. They appear not tohave had significant ecological effects on the world as a whole. Eventhese statements must be accepted with reservation however; we are simplynot sure.
But with chemicals used to spray hundreds of thousands of acres of soil orwater, the story is different. Nearly a billion pounds of registeredinsecticides were applied in the United States during 1970. This is anenormous quantity, and not all of it was persistent in the environment.
- 131 -

In the decade 1960 - 1969, more than 2.5 billion pounds of the mostpersistent chemicals used as pesticides were produced in the UnitedStates. DDT accounted for nearly 11 billion pounds. The rest wasmade up of the group listed below.
The persistence for a number of the pesticides is now known. It isexpressed as the half-life. This means that a pesticide with a half-life of, say, 8 years, will be half gone in 8 years. Half of theremaining half disappears in the next eight years, and half of theremainder takes another 8 years to disappear. Thus, in 24 years,half is gone in 8 years, a quarter more is gone in 16 years, and aneighth more is gone in 24. This still leaves 1/8 of the original still
von hand. The half-life of some of the more persistent, organic pesti-cides is:
aldrin 9 years heptachlor 2-4 yearschlordane 6 years lindane 2 yearsDDTdieldrinendrin
15 years7 years
14 years
toxophene 11 years
With this variety of factors, (and there may be more yet to come).it is not a matter for surprise that the scientists have had a quite atime dealing with this problem. The vast complex of inter-relationshipsbetween this particular chemical, and the thousands of kinds of soilorganisms, the cycles pursued by carbon, nitrogen, oxygen, hydrogen,water, and other substances or elements, the chemical reactions in theatmosphere, the photosynthetic activities of green plants, the millionsof interactions among plants and animals -- all these involve an almostfantastic maze of relationships not only beyond the scientists, butbeyond any computer or combination of computers so far devised.
We need to keep in mind that DDT is just one chemical among thousands,that the persistent chemicals as a group is only one of a large numberof environmental problems, that all these problems must be solved inrelationship to each other, and that upon the solution to these prob-lems a great deal may depend insofar as our sojourn on this planet isconcerned.

Ecological Effects of Pesticides
On Non-Target Species
by David Pimentel
Executive Office of the President
Office of Science and Technology
June 1971
PART VI
An Evaluation and Summary
Of the nearly 1 billion pounds of pesticides ap-plied in the United States during 1970, about 51
percent was for farm use, ani the remaining 49percent for public and govt L.nmental use. Thisamounts to about 5 lbs of pesticide applied perperson for pest control. The bulk of the pesticidesNNUS aimed at about 2,000 pest species; these spe-cies make up only about 1 percent of the total 200,-000 species of plants and animals in the UnitedStates. As expected, many of the non-target specieswere directly or indirectly affected by the pesti-cides used.
In the encyclopedic review of the ecological ef-fects of pesticides on non-target species, there iswide variation in the amount of information avail-
--I:11bl° concerning the effects of a particular pesti-cide. DDT, for example, when compared withother pesticides, has been well investigated, as havesome others in the chlorinated insecticide group.Even so, the available data on the impact of thesepesticides involve fewer than 1,000 species of theestimated total of 200,000 species. The abundanceor scarcity of information on a particular pesti-cide should not be interpreted as an indication ofeither a hazard or the absence of one. In general, aquick scan of the data reveals that the greatestamount of information is available on insecticidesand the least amount on fungicides and their ef-fects on non-target species. Information concern-ing effects of herbicides is intermediate, yet nearlyas much herbicide material is applied asinsecticides.
Modes '4 Action of Pesticides
Little is known concerning the mode of action ofmost pesticides for either pest or non-target spe-cies. The available evidence documents the factthat the mode of action of each pesticide .variessignificantly with individual specieb. Fo example,DDE (a metabolite of DDT) is practically non-toxic to insects, but predaceous bird species like theAmerican sparrow hawk are highly sensitive to it :.
This chemical affects the predaceous birds' repro-ductive physiology and causes the birds to produceeggs with eggshells from 10 to 30 percent thinnerthan normal. Interestingly enough, seed-eatingbirds like quail and pheasants are relatively re-sistant to the effects of DDE.
Reducing Species Numbers
The direct application of pesticides to croplands, forests, and other habitats may reduce andsometimes temporarily exterminate not only thepest, but also non-target species in the treated area.This, of course, is not surprising because a pesti-cide is an active poison applied specifically to de-stroy animals and plants designated as pests.
While the direct effects of pesticides are rela-tively easily observed, the indirect effects are farmore complicated to detect. For example, it is dif-ficult to discern whether the numbers of a speciesare declining and if they are, whether the declineis because of a pesticide or because of the numerousother environmental factors which impinge upon
natural populations. in investigating the indirecteffects of pesticides it may be difficult to determinehow the pesticide was transported in the environ-ment, how the non-target species were exposed, andwhat dosage of pesticide they received.
An example of the problems involved in de-termining the impact of pesticides on non-targetspecies was the investigation of why some preda-ceous bird species declined in habitats where chlo-rinated insecticide residues were abundant. Somewildlife biologists suspected DDT residues werehaving an adverse effect, but the influence of ur-banization was recognized as an additional fac-tor contributing to bird mortality. When studyingnatural populations, it is nearly impossible tosingle out each factor and gauge just how it con-tributes to the total mortality.
Proof that DDT was responsible for the ob-served decline of some predaceous birds requiredthe exposure of some of these birds to knownamounts of pesticides under controlled conditions.To do this the investigators first had to rear birdsof prey (in this case the American sparrow hawk)in the laboratory and then feed them measuredamounts of DDT and dieldrin at dosages similarto those occurring naturally. Feeding a combina-tion of DDT and dieldrin in the diet of the spar-row hawk caused the birds to produce eggs withsignificantly thinner eggshells, and the loss of eggswas significantly increased above untreatedcontrols.
Another example of measuring the impact ofa pesticide indirectly on a non-target species in-volved the decline of lake trout in Lake Georgeand other nearby lakes. For several years previousto the observed decline in the lake trout popula-tion, about 10,000 pounds of DDT had been ap-plied yearly for pest control in the watershedsurrounding Lake George. Some DDT found itsway into the lake, but ;,he amount was believedto be small. Although DDT residues were foundin both adult lake trout (8 to 835 ppm of DDTin fat) and their eggs (3 to 355 ppm of DDT),the mature lake trout appeared unaffected, andtheir eggs hatched normally. The reason for thedecline remained a mystery until it was discoveredthat the young fry were highly sensitive to certainlevels of the DDT in the eggs. Thus fry were killedat the time of final absorption of the yolk and justwhen the young were ready to feed. With 3 ppmof DDT in the eggs a few fry survived, but at5 ppm or higher mortality was 100 percent. The
reason the lake trout population was declining inthe lakes was then obvious.
Predaceous and parasitic insect populationshave been reduced and even eliminated in someregions after insecticide usage, and this sometimesresulted in outbreaks of particular insect and mitespecies which had been previously lre.pt undercontrol by these species. For example, when pre-daceous coccinellid beetle populations were inad-vertently eliminated in areas treated with DDT,chlordane, and other chemicals, outbreaks of mites,aphids, and scale insects occurred. At times thedensities of these plant pests. increased 20-foldabove their "natural control" level.
Habitat Alteration and Species Reductions
Man using plow and bulldozer has significantlyaltered many natural habitats and caused signifi-cant reductions in some species of plants andanimals, but pesticides have been equally effectivein altering habitats. Dimethoate applied to a redclover field, for example, reduced the number ofinsects _on which mice were feeding, and this re-duced the numbers of mice present. DDT andother insecticides which find their way intostreams significantly reduce invertebrate popula-tions. Subsequently, salmon and other fish popu-lations which depend upon these invertebrates mayalso be reduced.
Herbicide destruction of plants on which ani-mals depend for food may also cause significantreductions in their numbers For example, 2,4-Dapplied to a gopher habitat reduced the forbs by83 percent, and eventually this resulted in an87-percent reduction in the dependent gopherpopulation.
Changes in vegetation are usually detrimentalto dependent species, but the change may also befavorable for other species. For instance, whenthe tops of mature forest trees were killed withherbicides, the trees sprouted from their bases,thus improving the browse for white-tailed deer.
L'd avio ral Changes
Pesticides have been found to alter the normalbehavior of several animal species. For example,sublethal dosages of dieldrin fed tosheep increasedthe number of trials required by the animals torelearn a visual discrimination test. Also, sublethal

doses of DDT caused trout to lose most of theirlearned avoidance response.
Salmon, when exposed to sublethal doses ofDDT, were found to prefer water of higher tem-peratures than usual. If this type of exposureoccurred in nature, the salmon might place theireggs in regions where their fry could not survive.Mosquito fish exposed to low concentrations ofDDT (0.1 to 20 ppb) tended to prefer waterswith a higher level of salinity than normal forthe species.
The herbicide 2,4-D caused predaceous coccinel-lid beetles to be sluggish, and this change wouldalter their predatory activities and effectivenessas a biological control agent.
Growth of Animals and Plants
The biological activity of pesticides suppressedgrowth in some species and stimulated growth inothers. Female white-tailed deer, for example,when fed 5 ppm and 25 ppm of dieldrin daily intheir diet for 3 years grew much more slowly thanuntreated females.
2,4-D was reported to increase the time forgrowth and development of predaceous coccinellidbeetle larvae by nearly 60 percent. This could sig-nificantly reduce the effectiveness of these animalsin biological control of aphids and other pest in.sects. On the other hand, 2,4-D stimulated thegrowth of the rice stemborer pest. Caterpillars ofthe borer grew 45 percent larger on the treatedplants than on the untreated rice plants.
Plant growth may also be affected, as when cornand beans were grown in soil treated with DDTat 10 ppm and 100 ppm. At the end of 4 weeks thecorn weighed nearly 40 percent more than corn inthe untreated soil. Beans, however, weighed signif-icantly less (30 percent) after 8 weeks when ex-posed to DDT concentration of 10 ppm than beansgrown in untreated soil.
Reproduction
Pesticides caused measurable changes in the re-production of various non-target animals. White-tailed deer females fed 25 ppm of dieldrin in theirfood, for example, had lower fawn survival thanuntreated does.
Pesticides appear to have a deleterious effecton the reproduction of some predaceous birds such
as the American sparrow hawk, already men-tioned. In some natural habitats the brown pelicanhas been exposed to DDT and DDE, and it isreported that egg breakage has resulted recentlyin a complete reproductive failure. Generally,aquatic fish-eating birds have been more severelyaffected than terrestrial -bird predators becausethey obtain more DDT, DDE, and other pesticideresidues in their food.
Unfortunately, the effects of pesticides on re-production in birds are more varied than justeggshell thinning. For exam' le, ovulation time infinches reportedly doubled when the birds werefed DDT in their diet, thus increasing the timerequired for a generation. Also, embryo mortalityduring egg incubation ranged from 30 to 50 per-cent when mallard ducks had been fed 40 ppmof DDE in their diet. Total duckling productionwas reduced by as much as 75 percent when theducks received this level of DDE.
DDT, DDE, and dieldrin were not the onlychemicals to affect reproduction in birds. Both2,4-D and 2,4,5-T at relatively high dosages de-pressed reproduction in chickens, as did 2,4-Dand silvex in mallard ducks and toxaphene in bob-white quail and pheasants, and hiram-exposedchickens produced abnormally-shaped and soft-shelled eggs.
Female mosquito fish reproduction was affectedbecause they aborted their young after survivingexposure to sublethal dosages of DDT, TDE,methoxychlor, aldrin, endrin, toxaphene, hepta-chlor, and lindane.
Pesticides may also increase the rate of re-production. For example, the exposure of beanplants to 2,4-D increased aphid progeny produc-tion during a 10-day period from 139 to-764 peraphid mother.
Food Quality Changes
The chemical makeup of plants may be alteredby pesticides, and this in turn affects the depend-ent animals. The changes which do occur appearto be quite specific for both plants and pesticides.Several chlorinated insecticides both increasedsome elements and decreased others in corn andbeans. For example, heptachlor in soil at dosagesof 1, 10, and 100 ppm caused significant changesin the macro and micro elements (N, ". K, Ca,Mg, Mn, Fe, Cu, B, Al, Sr, and Zn) measuredin the aboveground portions of corn and bean
- 135 -

plants. Zinc was significantly irer (89 ppm, dryweight) in bean plants treat d with 100 ppm 9fheptachlor than in untreat controls (55 ppm) ;however, nitrogen levels were significantly lower(4.99 percent) in the treated plants than in theuntreated controls (7.25 percent). Investigatorsreported an increased protein content in wheatexposed to 2,4-D in contrast with beans grown on2,4-D-treated soil, which reduced protein contentin the beans.
The potassium nitrate content of sugar beetplants exposed to a sublethal dosage of 2,4-D in-creased from a normal of 0.22 percent to 4.5 per-cent (dry weight), a nitrate level highly toxicto cattle. 2,4-D and other herbicides have alsobeen reported as increasing the nitrate content ofvarious other plants.
Another change in the chemical content ofplants after exposure to pesticides is an increasein sugars. Ragwort, a weed naturally toxic tomany animals including cattle, when exposed tosublethal doses of 2,4-D, has a high level of sugar.The increased sugar content in the weed makes itattractive to cable and sheep, with disastrous re-sults because the toxic level of the plant remainshigh as the sugar content increases. In Sudan grass2,4,5-T increased the hydrocyanic acid content by69 percent, a level in some cases toxin to animals.
Pesticide Resistance' in Animals and Plants
The evolutionary impact of pesticides onanimals and plants is evidenced by the numberof species which have evolved high levels of toler-ance to various pesticides. For example, a housemouse population selected for resistance to DDTincreased its tolerance to DDT 2-fold in just 10generations. A pine-mouse population studied inthe field was reported to have a 12-fold level oftolerance to endrin above usual
Mosquito fish populations inhabiting streamsin the cotton belt evolved significant levels of re-sistance to DDT, strobane, toxaphene, chlordane,aldrin, heptachlor, dieldrin, endrin, and dursban.Extremely high increases in level of tolerancewere reported for strobane (300-fold), endrin(120-fold), toxaphene (40-fold), dieldrin (20-fold), and chlordane (204010.
Two frog populations from a cotton-growingregion possessed a significant level of resistance toDDT.
As might be expected, insect and mite popula-tions with high levels of resistance to pesticideshave been found in many parts of the world. Ofnearly 2,000 pest insect and mite species, a totalof 225 species has been reported resistant to pes-ticides. Of these species, 121 species were croppests, 97 man and animal pests, 6 stored-productp.2sts, and 1 forest pest. In at least one instancethe level of resistance had increased 25,000-fold.
Although the evidence is not conclusive, thereis strong suggestion of the presence of resistanceto 2,4-D in some plants.
Disease Susceptibility
Pesticides caused animals to be more susceptibleto certain diseases. For instance, the exposure ofmallard ducklings to Arochlor (PCB) increasedthe susceptibility of the ducklings to duck hepa-titus virus. Also, evidence suggests that the ex-posure of fish to carbaryl and 2,4-D reduced theirnatural resistance to a microsporidian parasite.
Biological Concentration
The ability of animals and plants to concentratemany types of pesticides in their body tissues ap-pears to be a common physiological phenomenon.The chlorinated insecticides have the greatestaffinity for this type of process. The tremendouscapacity for concentrating pesticides is best illus-trated with oysters and waterfleas. Oysters wereable to take DDT at 1 ppb in seawater and con-centrate it 70,000 times in their bodies. Waterfleaswere even more efficient; they were able to takeDDT at 0.5 ppb in water and concentrate it 100,-000 times in their bodies.
Normally, the capacity for biological concentra-tion is not as great as this, but when the event isrepeated through several links in the food chain,extremely high concentrations of pesticide resi-dues can occur in the species at the top of thefood chain.
This happened with the food chain involvingsoil, earthworms, and robins. Starting with aDDT level in the soil of 9.9 ppm, it reached 141ppm in the earthworms and 444 ppm in robins.This high concentration in the robins was toxic tosome birds.
Persistence
Persistent pesticides have the advantage of re-maining in the environment for long periods andthereby being effective in pest control over longperiods of time with fewer applications needed.
The obvious disadvantage is that the longer thechemical poisons persist, the greater are thechances that they will move out of the treated areavia either soil, water, air, or organisms and causeharm to non-target organisms.
Of the insecticides, arsenic at reported use dos-ages remained in the environment for an estimated40 years. The chlorinated insecticides also persistfor long periods ranging from 6 months to 30years, depending on the chemical, its dosage, andcharacteristics of the environment. DDT, for ex-ample, at only 1 lb/A persisted in a forest environ-ment for 9 years with little decline in the residueIsvel. Based on the rate of disappearance, the esti-nation was that DDT even at this low dosagecould endure for 30 years. Yet for other economicpoisons like malathion, residues may persist foronly a few days.
It should be pointed out that even with per-sistent chlorinated insecticides certain limitedamounts ,..sn be released into the environmentwithout important ecological effects. This levelof release, if known, would help develdp rationaluse programs for pesticides.
Pesticide Movement and Residuesin the Environment
The presence of pesticides is generally wide-spread in the environment, and movementthroughout the environment is related in largemeasure to their persistence. Obviously, the longera chemical remains in the environment, the greateris the opportunity that it will spread or be trans-ported to another location in the environment.
Antarctic seals and penguins far distant,from the application of any pesticides are con-taminated with DDT. Also, in the Arctic regionseals, caribou, and polar bears contain DDT. Agreat variety of non-target mammals, birds, fishes,and insects are known to contain residues of nu-merous kinds of pesticides including the highlytoxic mercury compounds. Accumulations of pesti-cide residues in sonic resistant non-target specieshave become sufficiently high to be lethal to some
individuals of the species itself and to some pred-ators which feed on them.
Residues of pesticides in soil have been inves-tigated extensively, and persistence in soil wasdiscussed above.
Various pesticide residues are found at. lowlevels in water throughout the United States; how-ever, in the southeast and far west, pesticide resi-dues were present at fairly high levels.
A surprising finding was that pesticides alsowere detected at fairly high levels in the atmos-phere. Insecticide levels in areas far distant fromany treated area ranged from below detectablelevels to 23 ng/m" of DDT, for example. Evi-dently, movement through the atmosphere pro-vides an excellent means for transport. of sonicpesticides to widely dispersed habitats.
The amount of pesticide released into the at-mosphere above the crop, but. which does not reachthe treated crop, is well illustrated with aircraft.spraying. For example, in treating corn by air-craft only about. 26 percent of the DDT sprayedfrom aircraft reached the corn when measured attassel height.
Pesticides accumulated in living organisms mayalso travel long distances; the impact of thismeans of pesticides !moving out through the en-vironment probably has been underestimated.
Herbicides are generally less persistent than in-secticides, but there are materials like picloramand monuron which will persist for 2 to 3 yearsin the soil. Fungicides also break down ratherrapidly, but sonic like mercury compounds mayleave various stable forms free to move in thebiosphere for many years.
Wildlife Management
Although, as documented, pesticides can harmwildlife, with careful use they may also benefitwildlife and therefore be employed in sonic phasesof wildlife management.
Insecticides, for example, are sometimes appliedto prevent a serious insect. pest from denuding aforest of its leaves and making it an unsuitablehabitat for some wildlife species. Herbicides havebeen employed to alter directly the vegetationaltypes growing in a habitat to improve the habitatfor food and shelter for deer, grouse, turkey, andquail.
- 137 -
Herbicides have also been used to control waterhyacinth and other aquatic weeds, thereby im-proving the freshwater habitat for sport fish. Thequantity of herbicide used for this purpose alonetotals several tons per year.
Conclusions
Available evidence suggests that current meth-ods of pesticide use are a serious nazard to somespecies which make up our environmental lifesystem. Pesticides, especially the chlorinated in-secticides (DDT, dieldrin, toxaphene, chlordane,TDE, aldrin, and heptachlor) already have causedmeasurable damage to non-target bird, fish, andbeneficial insect populations. The prime reason forthese chemicals being particularly hazardous istheir persistence, movement through the ecosys-tem, and characteristics for biological concentra-tiOn in the food chain.
Data on the detrimental effects of other pesti-cides is spotty, but there is sufficient evidence forconcern. More information on the impact theseeconomic poisons are having on non-target speciesis needed before additional plant and animalspecies are affected.
Based on available information, some generali-zations can be made about the effects of insecti-
tides, herbicides, and fungicides on populationsand communities of natural species:
1. Pesticides tend to reduce significantly thenumbers of individuals of some species inbiotic communities, which has the similarecological effect of reducing the number ofspecies.
2. An important reduction in the number ofspecies in a community may lead to instabilitywithin that community and subsequently topopulation outbreaks because of alteration inthe normal check-balance structure of thecommunity.
3. After pesticide applications the species pop-ulations most likely to increase in numbersare those in the lower part of the food chain,that is, the plant feeders. This is, in part,because the parasitic and predaceous enemieswhich naturally help control numbers ofplant feeders often are more susceptible topesticide pollution effects.
4. In addition, any effective loss of species orintense fluctuations in number of species lowin the food chain may adversely affect thedependent predator and parasitic species atthe top of the food chain. This in turn fur-ther disrupts the structure and ultimately thestability of the natural community.
- r38 -
HOME STUDY COURSE RESPONSE SHEET
The American Environment
Name: (Block below for instructor use)
Address:
Working Title:.--
Unit No. & Title:
Date Submitted:
Hours Spent on this lesson:
Date Received:
Date Returned:
Comments:
(Instructor's Signature
Begin lesson assignment below. Use additional sheets as needed.
(If lesson assignment is required, please transmit this response sheetto your instructor Along with the assignment.)
- 139 -

C\
7...IIALLOVOICv1:1

Reading:
Unit No. 14
Radioactivity
A.E.C. leaflets: Atoms, Nature, and Man
Nuclear Power and the Environment
Wagner, Chapter 11
Odum, Chapter 17
Brubaker, pp. 96-105
Assignment:
Continue work on your term paper.
HOME STUDY COURSE RESPONSE SHEET
The American Environment
Name. (Block below for instructor use)
Address:
Working Title:
Unit No. & Title:
Date Submitted:
Hours Spent on this lesson:
Date Received:
Date Returned:
Comments:
(Instructor's Signature
Begin lesson assignment below. Use additional sheets as needed.
(If' lesson assignment is required, please transmit this response sheetto your instructor along with the assignment.)

wT NO. 15
LIVING SPACE AND aECREATION

Reading:
Unit No. 15
Living Space and Recreation
Wagner, Chapters 19, 20
Brubaker, pp. 188-192
Not required, but additional reading might well includePlanned Urban Environments by Ann Louise Strong, JohnsHopkins Press, Baltimore, 1971. 406 pp. Get it at yourlibrary or from the USDA Library, Washington, D. C.
Assignment:
1. Continue your term paper which should now be nearingcompletion.
2. Review your clipping collection. You will be expectedto turn in a selected sample of these clippings withthe next, and last Unit No. 16. The sample will beyour, selection and should be the best you have beenable to collect on any subject you chose.

IMNE STUDY COURSE RESPONSE SHEET
The American Environment
Bane: (Block below for instructor use)
Address:
4,1
Working Title:
Unit No. & Title:
Date Subnitted:
Hours Spent on this lesson:
Date Received:
°Date Returned:
Comments:
(Instructor's Signature
Begin lesson assignment below. Use additional sheets as needed.
(If lesson assignment is required, please transmit this response sheet---to your instructor along with the Assignment.)
-111-3

IMIT O. 16
LAW AND TIE ENVIIZOITHEIIT.

Reading:
Unit No. 16
Law and the Environment
Recent Progress (attached)
National Environmental Policy Act of 1969
Brubaker, pp. 162-196, 222-233
Assignment: .
1. Turn in your finished term paper.
2. Turn in a selected sample of your clippings,together with a statement on the volume andkind of clippings not sent in.

Recent Progress
In our capital, we have a new agency -- The Council on EnvironmentalQuality. This was set up in accordance with the National EnvironmentalPolicy Act, signed into law by the President of the United States onJanuary 1, 1970. The President called this Council "The keeper of ourenvironmental consc'ence" and noted that "it will have the responsibilityfor ensuring that all our programs and actions are undertaken for theneeds of environmental quality " I only wish there weretime here to read .the whole National Environmental Policy Act aloud; itis a heart-warming, simply-written, very broad, and beautifully-formulatedpiece of legislation, -and it is only a few pages long. Many state govern-ments are already following suit, setting up similar councils for stateactivities.
A series of executive orders and directives have spelled out the variousmeans we will use to make the national policy effective in every activityof government. This applies not only to specific projects -- such aswatershed protection projects, for example -- but also it applies to allnew legislation and to all appropriation items. For each, there must beplaced on file and made public, a statement explaining its impact on theenvironment, setting forth both good and bad effects, any irreversibleeffects, and any alternatives to the proposal. Well over a thousand suchstatements had been filed by late 1971, involving familiar projects, suchas the Alaska pipeline, the Water Bank Act, nuclear power plants, oceandumping of chemicals, nuclear tests, the Florida jet port, some beacherosion projects, a number of Army Engineer flood control projects, theOklawaha canal, a series of highway proposals (including state as well asfederal, since both are using federal funds), large number of small water-shed projects, and so on.
This most environmentalists agree, is an excellent first step in the rightdirection. There is no approval or disapproval by the Council, although ithas commented on a few -- and agencies have paid close attention. Pre-dictions are that we may need some kind of evaluation that has force behindit. After all, there are some projects proposed that perhaps should notbe carried out at all.
The Council is to do another very important job. It is to prepare an annualEnvironmental Quality Report to be sent to Congress each July 1. The firstsuch report was issued in August of 1970. These reports are to set forth theconditions of our environment, major trends, problems, actions underway, andopportunities for the future.
Perhaps, as we observe such important developments as these, involving asthey do very basic reforms in the process of government no less than thedevelopment of completely new national policies, perhaps we can now seehow we may be able to deal more decisively and effectively with a greatmany ecological problems.
Whether or not the considerable public excitement over the very seriouscondition of our environment is maintained or not, the effect has beensufficiently profolnd to cause a major redirection of our Government.The new policies and new procedures are rapidly permeating every level.We have much of the knowledge we need and now we have the beginnings ofa mechanism to get that knowledge into action. The big problem, ofcourse, is to get enough people involved to get the programs going.
By this tame it will no doubt have occurred to you that all of us maybe in need of some further education sot hat we can understand both theproblems and the scientific approach to them.
At this point we could look about us for someone to blame. couldblame industry for its polluting effects, or farmers for their misuseof land, or the manufacturers for exhaust emissions from cars. Or,
we could blame the scientists for not keeping us better informed throughclear, simple writings about ecology. Or, we could blame our schools,primary and secondary, and especially the universities for not giving allof us an adequate grounding in science.
But lo matter how hard we seek to assess blame, in the end the fault isreally yours and mine.
We live in a world which we cannot understand fully without understandingat least the basic concepts in biology, chemistry,"and physics. We do nothave to be expert in many scientiAc fields, nor indeed expert in anyparticular one. But we do need to be able to follow what the scientiststell us, to be able t evaluate intelligently the findings they are comingup with, and to develop objective judgments about environmental problems.
Unless we -- all of us -- have this understanding, we can scarcely expectto play a proper part in our government, to vote on environmental issues,or to be intelligently active in community, state, national, or inter-national affairs.
What this means, of a)urse, is that all of us need to learn about ourenvironment very early in our education. In grammar school and highschool we need to develop an increasingly better understanding of theworld in which we live. By the time we complete college, we ought tobe well enough equipped with the necessary knowledge -- the factualknowledge -- so that we can deal in a really enlightener? Aid intelligentway with the environmental issues that may confront us.
And, if the educational system should fail is, we have other means. Tfe
can undertake our own education! There are as we have already notedsome very good TV programs that may help us in our self-education. Thereare books by the score' -- many of them inexpensive paperbacks -- that wecan read and study. There are conferences and sessionswhere we can listen and discuss. As we,do this, let us remember that weneed to develop a scientific attitude about our readings, about TV pro-grams, and indeed, aboutour courses in school or college.
The scientific attitude is simply this: question everything and everybody,look for the truth, discard all but the truth.
The opportunities confront us in unlimited number. As we go forward totake advantage of them, let us do so with enthusiasm but at the same tkelet us remain coolly aware o' what the ecologists are tr:ing to tell us,namely: progress in improving our environment in the long run leads toa better life, but progress at the expense of the environment in the longrun leads to catastrophe.
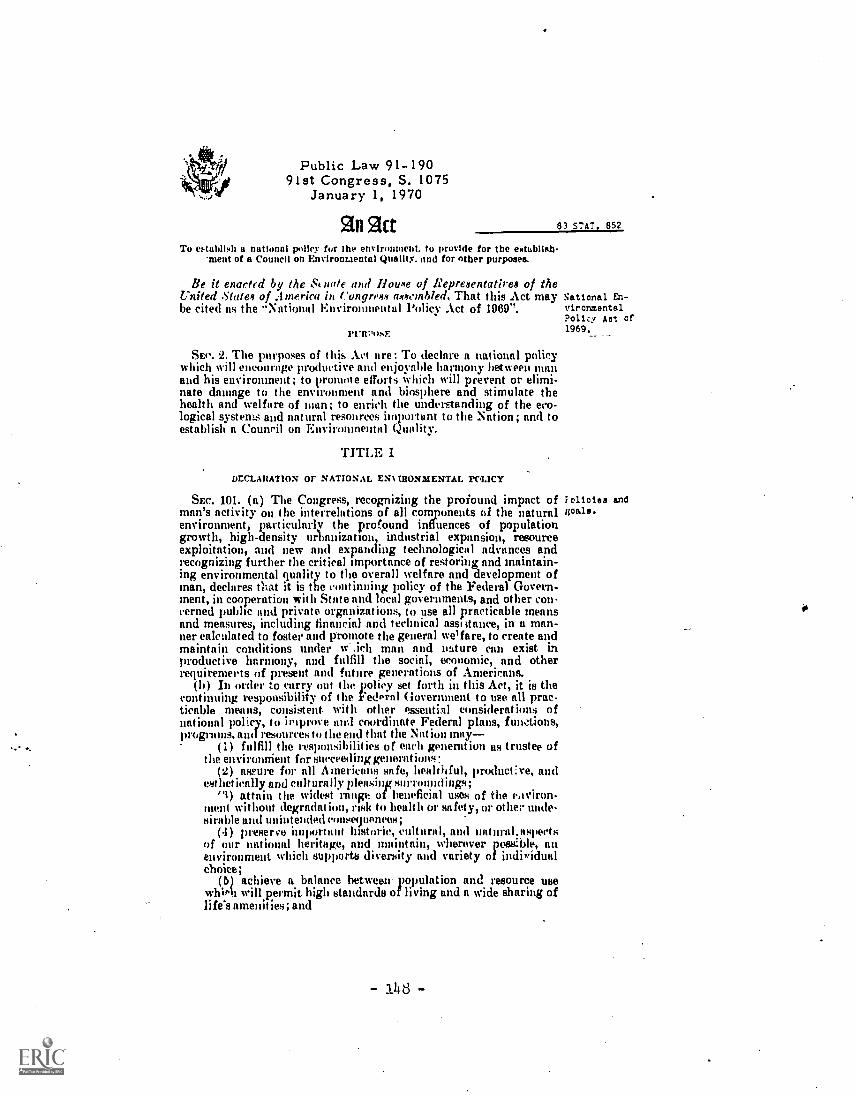
Public Law 91- 19091st Congress, S. 1075
January 1, 1970
2in act 83 STAT. 852
To weld's!) a national policy for ihe environment. to provide for the eetublieb-nent of a Council on Environmental Quality. and for caber purposes.
Be it enacted by the Semite and llotoe of Bepresentatires of theUnited State* of America Congrex.v aRxembled, That this Act maybe cited us the "National Environmental Policy Act of 1069".
SEP. 2. The purposes of this Act lire: To declare a national policywhich will encourage productive and enjoyable harmony between manand his environment; to promote efforts which will prevent or elimi-nate damage to the environment and biosphere and stimulate thehealth and welfare of man; to enrich the understanding of the eco-logical systems and natural resonrces importunt to the Nation; and toestablish a Council on Environmental Quality.
TITLE I
DECLARATION or NATIONAL EN% IRONMENTAL POLICY
National En-vironmentalPolicy pot of1969.
SEC. 101. (a) The Congress, recognizing the profound impact of f °noise andman's activity on the interrelations of all components of the natural Boaleenvironment, particularly the profound influences of populationgrowth, high-density urlanization, industrial expansion, resourceexploitation, and new and expanding technological advances andrecognizing further the critical importance of restoring and maintain-ing environmental quality to the overall welfare and development ofman, declares that it is the continuing policy of the Federal Govern-ment, in cooperation with State and local governments, and other con-cerned public and private organizations, to use all practicable meansand measures, including financial and technical assistance, in a man-ner calculated to foster and promote the general welfare, to create andmaintain conditions under w man and outure can exist inproductive htirmony, and fulfill the social, economic, and otherrequirements of present and future generations of Americans.
(b) In order to carry out the policy set forth in this Act, it is thecontinuing responsibility of the FedPrill Government to use all prac-ticable means, consistent with other essential considerations ofnational policy, to icipmve and coordinate Federal plans, fundions,programs, and resources to the end that the Nat ion may
(1) fulfill the responsibilities of reel' generntion us trustee ofthe environnient for succeeding generations:
(.2) assure for all Americans safe, healthful, productive, andesthetically and culturally pleasing surroundings;
"9 attain the widest range of beneficial uses of the eaviron-ment without degradation, rusk to heult It or safety, or other unde-sirable and unintended Cotisetitiences;
(4) preserve important hunoric, cultural, and natnal.aspetsof our national heritage, and mountain, wherever poss:ble, anenvironment which supports diversity and variety of individualchoice;
(5) achieve a balance between population and resource usewhiPh will permit high standards of living and n wide sharing oflife's amenities; and
- 148 -

3 STAT. OrPub. Law 41-190 ,lautiAry 1910
(6) enhance the quality of renewable resiourccs and approachthe maximum attainable recycling of deplistahle resources.
(c) The Congress recognizes that each Iierswnt should enjoy n health-ful environment and that each person lois a responsibility 101.011161Junito the preservation and enhanceine.nt of the elivinalment.
itentintJtration. SEC. 102. The Congress authorizes And directs t lint, to the fullestextent possible: (1) the policies, regulations, and public laws of theUnited States shall be interpreted and administered in accordancewith the policies set forth in this Act, ar.d (2) all agencies of the Fed-eral Government shall
(A) utilize a systematic. interdisciplinary approach which willinsure the integrated use of the natural and social sciences andthe environmental design arts in planning and in decisionniakingwhich may have an impact on man's environment ;
(B) identify and develop methods and procedures, in con-sultation with the Council on Environmental Quality establishedby title II of this Act, which will insure that presently unquanti-fied environmental amenities and values may be given appropriateconsideration in decisionmaking along with economic and tech-nical considerations;
(C) include in every recommendation or report on proposalsfor legislation and other major Federal actions sign ilionitly af-fecting tl:e quality of the human environment, a detailed state-ment y.the responsible official on
(I) the environmental impact of the proposed action,(ii) any adverse environmental effects which cannot be
avoided should the proposal be implemented,(iii) alternatives to the proposed action,(iv) the relationship between local short -term uses of
roan's environment and the maintenance and enhancement oflong-term productivity, and
(v) any Irreversible and irretrievable commitments of re-sources which would be involved in the proposed actionshould it be implemented.
Prior to making any detailed statement, the responsible Federalofficial shall consult with and obtain the comments of any Fed-eral agency which has jurisdiction by law or special expertise with
Copies of state- respect to any environmental impact involved. Copies of suchmenu, eta.; avail- statement and the comments and views of the appropriate Federal,ability. State, and local agencies, which are authorized to develop and en-
force environmental standards, shall be made available to thePreeident, the Council on Environmental Quality and to the pub-
81 Stat. 54. 11c as provided by section 552 of title 5. United States Code, andshall accompany .t he proposal through the existing agency reviewprocesses;
(1)) study, develop, and describe appropriate alternatives toreconunended mums of action in any proposal which involvesunresolved conflicts concerning alternative 'uses of available M-t $0111reeti
(E) recognize the worldwide and long-range character of en-`virotimental problems and, where consistent with the foreignpolicy of the I nited States, lend appropriate suptert to initiatives,resolutions, and programs designed to maximize internationalcooperation in ant icipating and preventing a decline in the qualityof mankind's world environment;
(F) make available to States, comities, municipilities, institu-tions, and individuals, advice and information useful in restoring,maintaining, and enhancing the quality of the environment ;
January 1, 1970 Pub. Law 91- 190
(0) initiate and utilize ecological intimation in the planningand development of resource-oriented projects; and
(II) assist the Council on Environmental Quality establishedby title 11 of this Act.
SEC. 103. All agencies of the Federal tiovernment shall review Firmipi.their present statutory atitherity, administrative regnlai ions, and cur-rent policies 511 <1 pocetinres for the porpose of determining windierthere are any deficieneies 0:* 11.4.1111SMINICI4M herein which prohibitfull compliance with the Imrposes and provisions of this Act and shallpropose to the Presiilent nut later than July I, 11171, such measures asmay be necessary to bring their authority and policies into con fot mity with the intent, purposes, and procedures set forth in this Act.
SzO. 104. Nothing in Section 102 or 103 shall in any way affect thespecific statutory obligations of any Federal agency (1) to cLunplywith criteria or standards of environmental quality, (2) to coordinateor consult with any other Federal or State agency, or (3) to act, orrefrain from acting contingent upon the recommendations or certifi-cation of any other Federal or State agency.
SEc. 105. The policies and goals set forth in this Act are supplemen-tary to those set forth in existing authorizations of Federal agencies.
TITLE II
COUNCIL ON ENVIRONMENTAL QUALITY
SEC. 201. The President shall transmit to the Congress annually Report tobeginning July 1, 1970, an Environmental Quality Report (herein- Congress.after referred to as the "report") which shall set forth (1) the statusand condition of the major natural, manmade, or altered environ-mental classes of the Nation, including, but not limited to, the air,the aquatic, including marine; estuarine, and fresh water, and theterrestrial environment, including, but not limited to, the forest, dry-land, wetland, range, urban, suburban, and rural environments (2)current and foreseeable trends in the quality, nuragement and utiliza-tion of such environments and the effects of those trends on the social,economic, and other requirements of the Nation; (3) the adequacy ofavailable natural resources for fulfilling human and economic require-ments of the Nation in the light of expected population pressures; (4)a review of the programs and activities (including regulatory ac-tivities) of the Federal Governments the State and local governments,and nongovernmental entities or individuals, with particular reference
'to their effect on the environment and on the conservation, develop-ment and utilization of natural resources; and (5) a program forremedying the deficieneies of existing programs and activities, to-gether with recommendations for legislat nt.
Sac. 202. There is created in the Executive Office of the President, Council ona Council on Environmental Quality (hereinafter referred to as the environmental,"Council"). The Council shall lie composed of three members who shall Qualitybe appointgd by the President to serve at his pleasure, by and withthe advice and consent of the Senate. The President shall designateone of the members of the Council to serve as Chairman. Each mem-ber shall be a person who, as a result of his tilt jning, experience, andattainments, is exceptionally well qualified to analyze and interpretenv irminient al t rends and in fornmt me of all kinds; to itiq ?raise pro-grams and activities of the Federal floverninent in the light of thepolicy set forth in title I of this Act; to be conscious of and responsiveto the scientific, economic, social, esthetic, and cultural needs and in-terests of the Nation; and to formulate and recommend nationalpolicies to promote the improvement of the quality of the environment.
150

kPub. Law 9 1 - 190 January 1, 1970
93 STAY. BSS
80 Stat. 416.Duties andfunctions.
34 F. R. 8693.
Sac 203. The Council may employ such officeis and employees asmay be necessary to carry out its functions under this Act. In addition,the Council may eniploy and Ex the compensation of such experts andconsultants as may be necessary for the carrying out of its functionsunder tnis Act, in accordance with section 3109 of title 5, United StatesCode (but without regard to the last sentence thereof).
Sac. 204. It shall be the duty and function of the Council(1) to assist and advise the President in the preparation of the
Environmental Quality Report required by section 201;(2) to gather timely and authoritative information concerning
the conditions and trends in the quality of the environment bothcurrent and prospective, to analyze and interpret such informa-tion for the purpose of actennining whether such conditions andtrends are interfering, or are likely to interfere, with the achieve-ment of the policy set forth in itle I of this Act, and to compileand submit to the President studies relating to such conditionsand trends;
(8) to review and appraise the various Programs and activitiesof the Federal Government in the light of the policy set forth intitle I of this Act for the purpose of determining the extent towhich such programs and activities are contributing to theachievement of such policy, and to make recommendations to thePresident with respect thereto;
(4) to develop and recommend to the President national poli-cies to foster and promote the improvement of environmentalquality to ra.P.et the conservation, social, economic, health, andother requirements and goals of the Nation;
(5) to conduct investigations, studies, surveys, research, andanalyses relating to ecological systems and environmental quality;
(6) to document and define changes in the natural environment,including the plant and animal systems, and to accumulate neces-sary data and other information lor a continuing analysis of thesechanges or trends and an interpretation of their underlyingcauses;
(".' to report at least once each year to the President on thestate and condition of the environment; and
(8) to make and furnish such studies, reports thereon, andrecommendations with respect to matters of policy and legisla-tion as the President may request.
Sze. 205. In exercising its powers, functions,. and duties under thisAet, the Council shall "0.
(1) consult. with the Citizens' Advisory Committee on Environ-mental Quality established byExoeutive Order numbered 11472.dated 5fay 29, WM), and with such representatives of science,industry, agriculture, labor, conservation organizations, Stateand local governments and other groups, as it deems advisable;=id
(2) Wilize. to the fullest extent possible, the services, facilities,and information (including statistical information) of public andprivate agencies and organizations, and individuals, in order thatduplication of effort and expense may be avoided, thus assuringthat the Council's activities will not unnecessarily overlap or con-flict with similar activities authorized by law and performed byestablished agencies.
151
January 1, 1970 Pub. Law 91- 19083 :TAT, 556
Sao. 206. Members of the Council shall serve full time and theChairman of the Council shall be compensated at the rate providedfor Level II of the Executive Schedule Pay Rates (5 U.S.(. 5313).The other members of the Council shall be compensated at the rateprocline for Level IV or the Executive Schedule Pay Rates (5U.S.C. 5815).
Sao. 207. There are authorized to be appropriated to carry out theprovisions of this Act not to exceed $3010,000 for fiscal year 1970,$700,000 for fiscal year 1971, and $1,000,000 for each fiscal yearthereafter.
Approved January 1, 1970.
LEGISLATIVE HISTORY:
HOUSE REPORTS: No. 91-378, 91-378, pt. 2,a000mpanying H. R. 12549Comm. on Merchant Marine & Fisheries) and 91-765
Comm. of Conference).SENATE REPORT No. 91-296 (Comm. on Interior & Insular A.:airs).CONGRESSIONAL RECORD Vol. 115 (1969),
July 101 Considered and passed Senate.Sept.23o Considered and passed House, amended, in lieu of
H. R. 12549.Oot. Si Senate disagreed to House amendments; agreed to
conference.Deo. 208 Senate agreed to tfonferenoto report.Deo. 22t House agreed to oonferenoe report.
GPO 37t39
152
Tenure Andoomoensallon.NU Stot. 4('',
461.
81 Stmt. 38.
Appropriations.

HOME STUDY COURSE RESPONSE SHEET
The American Environment
Name: (Block below for instructor use)
Address:
Working Title:
Unit No. & Title:
Date Submitted:
Hours Spent on this lesson:
Date Received:
Date Returned:
Comments:
(Instructor's Signature
Begin lesson assignment below. Use additional sheets as needed.
(If lesson assignment is required, please transmit this response sheetto your instructor along with the assignment.)
-153S. 1'10:1:/tN".111..NT 1.1tINIINh 1973-1 1-.71/1247,