soil health assessment and agronomy-driven improvement · 2018-10-02 · soil health assessment and...
TRANSCRIPT

Soil Health Assessment and Agronomy-Driven
ImprovementDennis Chessman
USDA – Natural Resources Conservation Service,
Soil Health Division
June 27, 2018

The diverse underground world
Drawing Credit: SESL, Australia

Healthy soils have diversity and abundance of life
Medicinal Breakthroughs
Fights disease and pests


In general, soils converted to crop production demonstrate:
• decreased water infiltration & storage
• less biological activity• lower biological diversity• less efficient nutrient
cycling• less C sequestered• higher summer
temperatures• less contribution to plant
vigor• lower stress resistance
and resilience
The productivity of agricultural systems is maintained or increased with technology, diesel, nutrients, pesticides, water, …
Photo: Lynn Betts, NRCS

Benefits we would like to derive from soils• Produce food, feed, fiber, biofuel feedstocks, and
medicinal products• Capture, filter, and store water• Cycle and recycle nutrients• Resistance and resilience to drought, temperature
extremes, fire & floods• Protect plants from pathogens and stress• Detoxify pollutants• Store C and moderate release of gases (e.g., CO2, CH4,
N20)• Stable – resist the erosive forces of wind and water

Soil biology is foundational to productive, sustainable cropping systems• Biology drives production and ecosystem service
benefits
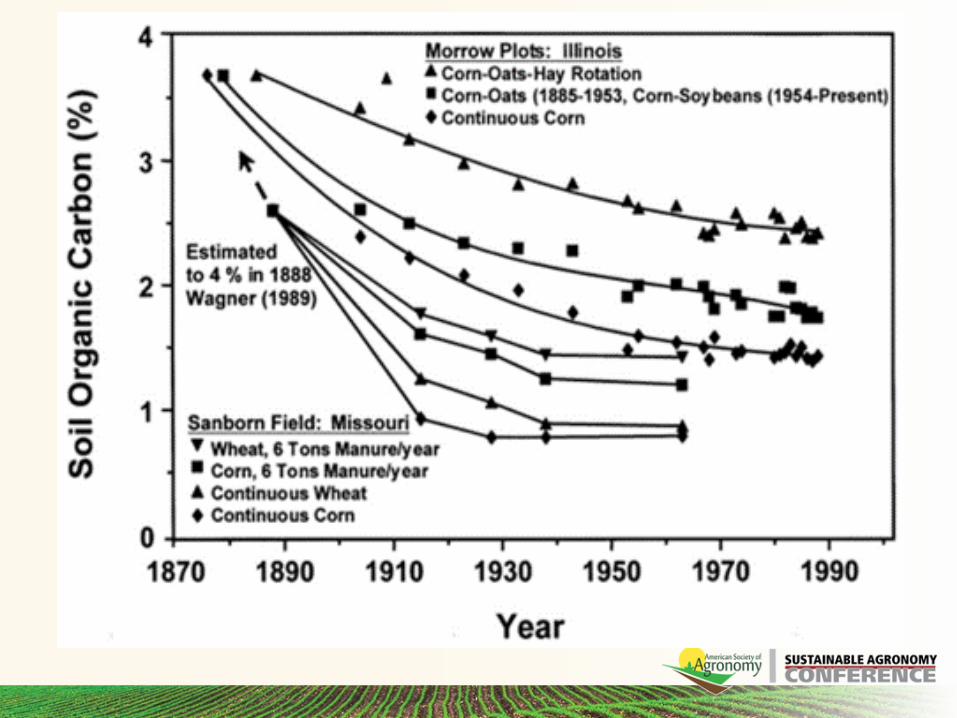
• Soil organic carbon supports biology (both food and habitat)
• Crop, management and location determine SOC levels

CO2
Plants Organic C inputs
Active (days – years)
Slow(decades)
Passive (100s – 1000s years)
Carbon and soil organic matter
Of the organic carbon entering the soil:• 2-5% active• 3-10% slow• 10-30% passive• The rest becomes
CO2
Outline
• Text

Summary
Weil & Brady, The Nature and Properties of Soils, 15th edition

What is an in-field soil health assessment?• An evaluation (typically qualitative) of selected soil
and/or plant characteristics (indicators) whereby relative soil function is inferred

Approaches to in-field SH assessment

Considerations for in-field soil health assessments• Useful – provides valuable, accurate, meaningful information
• Usable – easily employed and interpreted by advisors and farmers
• Works for your system(s)
• Minimizes subjective effects
• Quick
• No meters, chemicals, paper strips, etc. (essentially physical and biological)
• Human sensory-driven
• Representative but reasonable sampling
• Encourages a conversation between the advisor and the grower
• Provides invaluable information for implementing soil test recommendations

Helpful steps in soil health assessment
• Soil maps• Info on inherent soil
properties • Potential productivity• Some soil health
information
• Producer conversation• Current concerns• Field & management
history and observations
• Field visit• In-field soil health
assessment
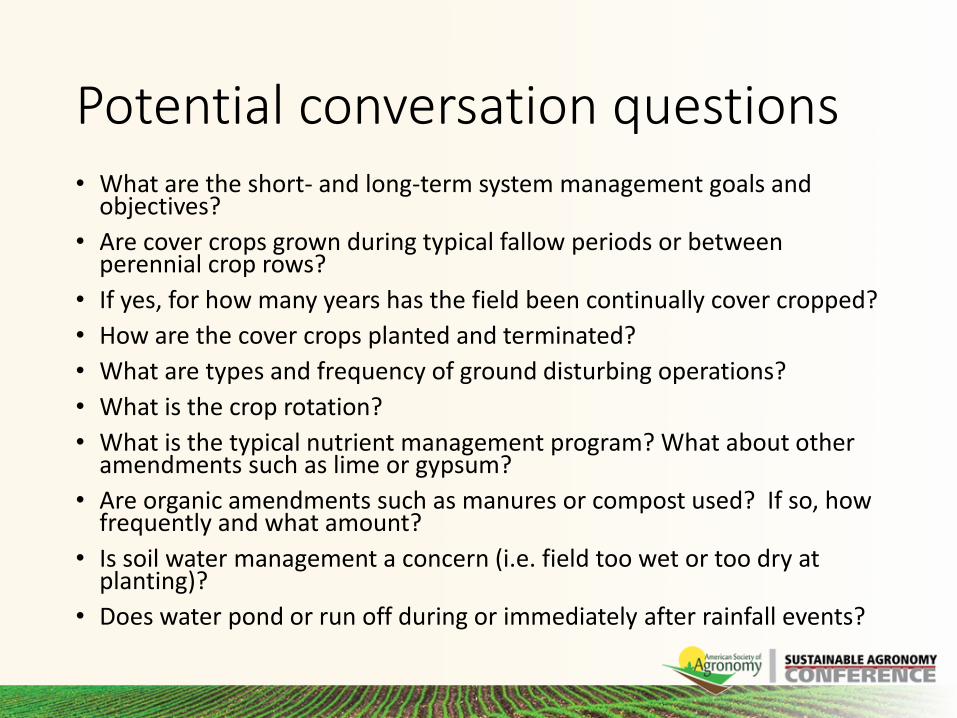
Potential conversation questions • What are the short- and long-term system management goals and
objectives?
• Are cover crops grown during typical fallow periods or between perennial crop rows?
• If yes, for how many years has the field been continually cover cropped?
• How are the cover crops planted and terminated?
• What are types and frequency of ground disturbing operations?
• What is the crop rotation?
• What is the typical nutrient management program? What about other amendments such as lime or gypsum?
• Are organic amendments such as manures or compost used? If so, how frequently and what amount?
• Is soil water management a concern (i.e. field too wet or too dry at planting)?
• Does water pond or run off during or immediately after rainfall events?

In-field indicators to assess soil function
Soil Cover Compaction
Surface Crusting Biological Activity
Residue Breakdown Aggregate Stability
SURFACE SUB-SURFACE

Other indicators that may be useful• Water infiltration rate
• Respiration
• Roots & pores
• pH
• EC
• Soil smell
• Soil color
• Soil temperature
• Salt accumulation

Soil health field assessment –signs at the surface
Residue BreakdownSoil Cover
Biological shredding, fragmenting, cycling or incorporating of previous crop residue.
Rating Criteria
Acceptable Unacceptable
Residue pieces are small, mixed in
surface or minimal crop residue
remaining from >1 cropping seasons
Large residue pieces after planting; can
be handled without crumbling; or
residue from 2 or more cropping
seasons

An example of an assessment field sheet

Managing agricultural lands to improve soil health – copying a page from natural systems
• Minimize disturbance
• Keep the soil covered
• Increase system biodiversity
• Maintain roots in the soil

Challenges to changing management
• Costs associated with changing the system –equipment, seed, time, etc.
• Peer pressure
• The unknown
• Pest population changes
• Covers use water
• Management and operations become more complicated – learning curve
• Rented land
• Markets and buyer expectations
• Transition time to new “normal”

What is the cost of status quo?
Front page, USA TodayMay 22, 2018

Benefits from changing management: a farmer example
Rulon Enterprises, 6300 acres, corn and soybean, Arcadia, IN
• Can increase SOM 0.1%/yr, thereby increasing corn yield goal by 2.7 bu/ac
• Using 20 lbs less P2O5, 30 lbs less K2O, 35 lbs less N than conventional practices
• In 2017, planted 5200 acres to covers at a total cost of $22.70/ac, net return of $57.76/ac, 254% ROI
• Short-term benefits of almost $42/acre
• Drought of 2012-13, county average corn ↓ 60 bu/ac, Rulons ↓ 10 bu (long-term benefit)
• Essentially eliminated soil erosion (long-term benefit)
The Furrow, Summer 2018, Cash in on covers

THANK YOU!
Direct comments and questions to: [email protected]
This information is provided as a public service and constitutes no endorsement by the United States Department of Agriculture or the Natural Resources Conservation Service of any service, supply, or equipment listed.

Cover Crops and Nitrogen Management Impact on
Water Quality
Shalamar Armstrong
Soil Conservation and Management
Assistant Professor of Agronomy
Purdue University Department of Agronomy

National News: The Gulf of Mexico's Dead Zone Is The Biggest Ever Seen
• Text
This week, NOAA announced that this year's dead zone is the biggest one ever measured. It covers 8,776 square miles — an area the size of New Jersey. And it's adding fuel to a debate over whether state and federal governments are doing enough to cut pollution that comes from farms.
Farmers use those nutrients on fields as fertilizer. Rain washes them into nearby streams and rivers. And when they reach the Gulf of Mexico, those nutrients unleash blooms of algae, which then die and decompose. That is what uses up the oxygen in a thick layer of water at the bottom of the Gulf, in a band that follows the coastline.
Scavia, however, recently published a blog post calling these voluntary measures inadequate.
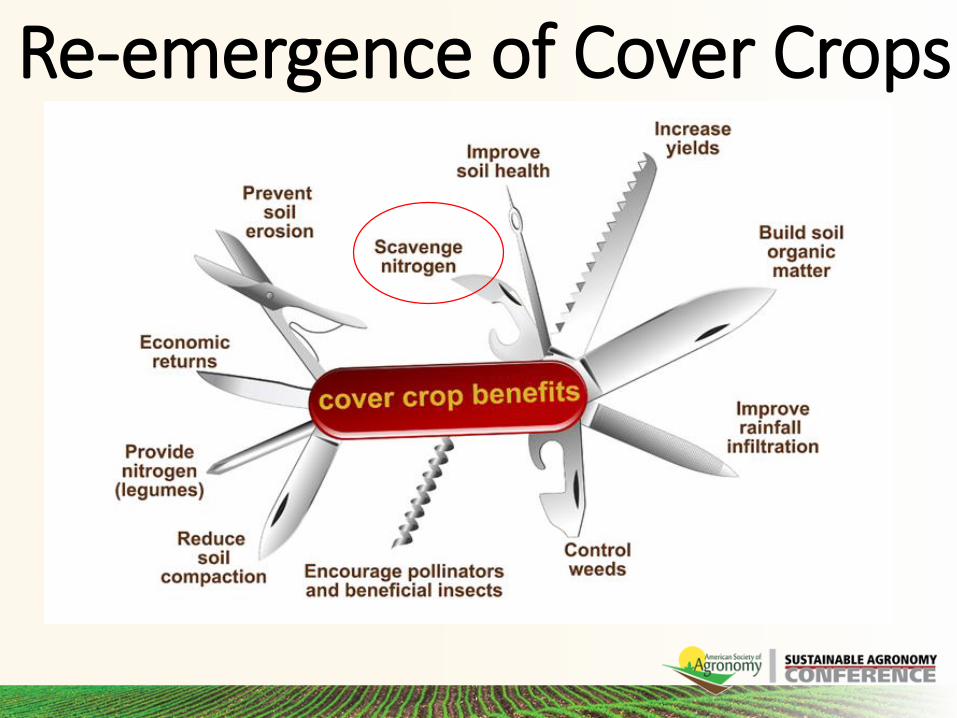
Re-emergence of Cover Crops

Cover crops influence on N availability and fate within common corn N management
systems
N Conservation
• Soil inorganic N from OM
• Residual N
• Applied N, if a portion of N is applied in the Fall (DAP or Manure)
N Release
• Physiology
• Species: Legume, grass, cereal
• C:N ratio
Inorganic N sources that cover crops interact with:
Cover crop residue N release depends on:
N Uptake
Corn and Soybean N and Yield

Effect of Cover Crops and Nitrogen Application Timing on Nitrogen Loading Through Subsurface Drainage
Shalamar Armstrong1, Catherine O’Reilly2, Richard Roth3, Mike Ruffatti3,Travis Deppe3and Corey Lacey4
1 Assistant Professor, Purdue University Department of Agronomy, 2Associate Profess of Hydrogeology Department of Geography-Geology, Illinois State University
3M.S. Candidate In Agriculture Sciences , Illinois State University Department of Agriculture, 4Graduate Research Assistant, Purdue University Department of Agronomy
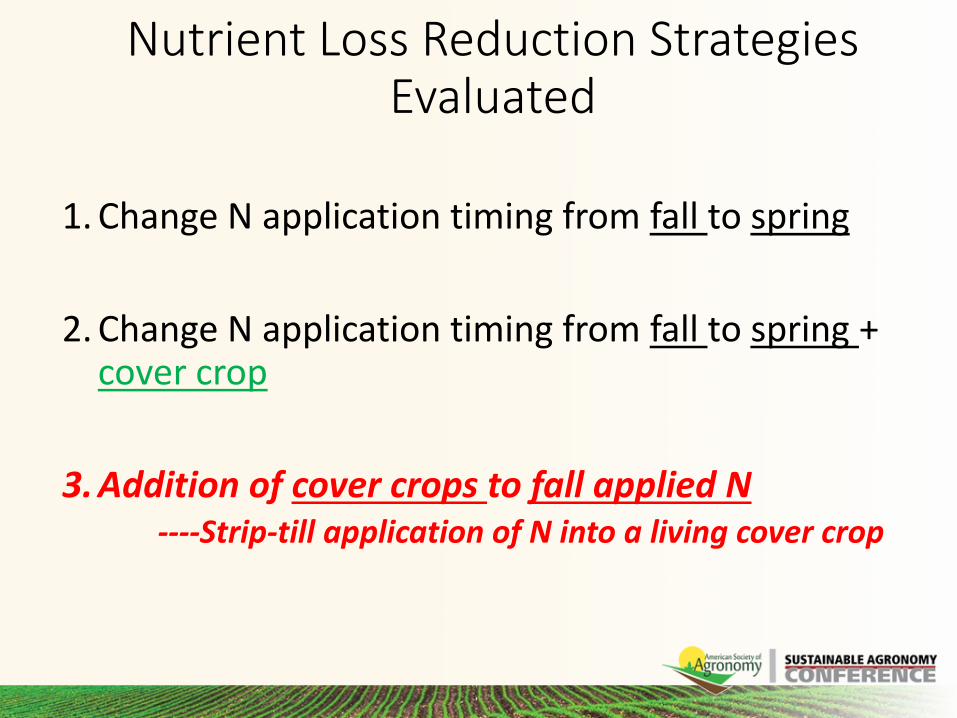
1. Change N application timing from fall to spring
2. Change N application timing from fall to spring + cover crop
3. Addition of cover crops to fall applied N----Strip-till application of N into a living cover crop
Nutrient Loss Reduction Strategies Evaluated

Treatments
*Fall Anhydrous Ammonia was strip tilled into a living stand of Cereal Rye and Radish Mix
Total N rate for all plots: 224 kg ha-1
1. Control-No Fertilizer and No Cover crop
2. Spring Split Application of Nitrogen (20% Fall -DAP and 80% Anhydrous Ammonium)
3. Spring Split Application of Nitrogen (20% Fall-DAP and 80% Anhydrous Ammonium) + Cover Crops
4. Fall Split Application of Nitrogen (70% Fall-DAP and Anhydrous Ammonium and 30% sidedress- Anhydrous Ammonium)
5. Fall Split Application of Nitrogen (70% Fall-DAP and Anhydrous Ammonium and 30% sidedress- Anhydrous Ammonium) + Cover Crops

Research Design
ARep. 1 Rep. 2 Rep. 3
Field History
• 10 years Strip-till before Corn and No-till before Soybeans
• Current Nitrogen Management : 60 % Fall N and 40% Spring N
15 Individually Tiled Fields: 1.6 Acres 72 rows
Tile Monitoring Station

Methodology – Cover Crop Planting
Cover Crop Mixture Daikon Radish (8%) Cereal Rye (92%)
Seeding Rate: 84 kg ha-1 (74 lb/ A)
Planting Date: Early to mid- Sept.

Cover Crop N Uptake
Fertilizer application timing did not significantly effect cover crop N uptake.
Average shoot N uptake was 66 kg ha-1
(59 lb/A)
On average the cover crop interacted with 30% of the N fertilizer applied.
*
*

Can Cover Crops Reduce N Loading in all N Management Systems?
Reduction in N loading
Cover Crops + Corn

Change N application from fall to spring

Change N application timing from fall to spring + CC

Fall N vs. Spring N + CC

Leave N application in the fall + CC

Fall N +CC vs. Spring N + CC

Cover Crop Impact on Water Quality
PrecipitationTotal = 63 inchesAnnual Average = 25 inchers
N Loading Treatment ComparisonFall N 52 kg ha-1 year-1 (46 lb/A)Fall N + CC 30 kg ha-1 year-1 (27 lb/A) 42%Spring N 60 kg ha-1 year-1 (53 lb/A)Spring N + CC 30 kg ha-1 year-1 (27 lb/A) 50%
N Loading TreandsFall N vs. Spring N = EqualFall N vs. Spring N + CC = 42% Spring N vs. Fall N + CC = 50% Spring N + CC vs. Fall N + CC = Equal

2:1 ratio between cover crop
biomass N and N prevented from leaving the tile.
Potential Cover Crop N Cycling(2:1 Ratio)
Cover Crops interacts with inorganic N within the soil solution that is less susceptible to loss via tile drainage.
Cover Crops interacts with inorganic N within the lower portions of the soil profile that is more susceptible to loss via tile drainage.

Environmental Economic Implications of the Study
Erosion Rdeuction…
Nitrogen Load Reduction
31%Cover Crop Biomass
Mineralizationand N Cycling
60%
Conservation Scenario Range of Cover Crop Adoption Cost
Recovery from Environmental BenefitsCash crop yield differences considered 26-86%
Assuming cash crop yield is equal 66-102%
Roth et. al., 2018 A cost analysis approach to valuing cover crop environmental
and nitrogen cycling benefits: A central Illinois on farm case study, Agricultural Systems.

Cover Crop Performance on a Watershed Scale: Potential Impacts on Water Quality
Shalamar Armstrong1 , Catherine O’Reilly2 , Ben Bruening2, Corey Lacey4, Richard Roth4, Michael Ruffatti5, and Min Xu4
,
1Assistant Professor Agronomy, Agronomy Department, Purdue University,
2Associate Profess of Hydrogeology Department of Geography-Geology, Illinois State University,, 4Graduate Student,
Agronomy Department, Purdue University, and 5Support Agronomist, Department of Agriculture, Illinois State University

Plot scale analysis of Cover Crops• Controlled
experiment• Limited to no
farmer influence
Watershed scale analysis of Cover Crops• Reduced experimental
control• Heavy farmer influence

Objective
Determine the impact of watershed scale mass cover crop adoption on water N loading.

Study Site:
• Lake Bloomington Watershed, Towanda, IL
• Land use: 93% row crop agriculture, >90% tile drained
• Dominant soils: poorly drained silty clay loam and somewhat poorly drained silt loam that lies within a 0-2% slope
• Number of farmers involved Treatment = 6 farmers
Control = 4 farmers
Tile Water Sampling Locations
ControlNo-Cover Crop
262 ha
TreatmentCover Crop
465 ha
Lake Bloomington Watershed Towanda, IL

Cropping Systems and N Management Uncontrolled
33%
67%Soybean (311 ha)
Corn ( 154 ha)
47%53%
Fall N (165 ha)
Spring N (144 ha)
36%
64%
Corn ( 93 ha)
Soybean (169 ha)
100%Fall N (169 ha)
Treatment Watershed(Even Year Soybean Dominant)
Control Watershed(Even Year Soybean Dominant)
35% of watershed land area
65% of watershed land area

Cover Crop Selection Uncontrolled
Note: Farmers used their knowledge of cover crops to drive their cover crop selection.
Cereal Rye/Radish before soybean
Radish/Oats or Annual Rye/Radish before corn

Cover Crop Biomass and N Uptake(Fall 2015 and Spring 2016)
Above ground biomass was collected on 8 ha grids across the watershed and analyzed for %N.
26 lb/A
44 lb/A

Cover Crop Biomass and N Uptake(Fall 2016 and Spring 2017)
26 lb/A
22 lb/A
47 lb/A

Cereal Rye N uptake and Spring Soil IN Concentrations
P<0.0001
Spring 2016

Cover Crop Impacts on Water Quality
cover crop cover crop

SummaryPlot Scale
• On average, cover crops interacted with 30% of the N fertilizer applied.
• 2:1 ratio between cover crop shoot biomass N and N prevented from leaving the tile.
• Cover crops reduced N loading via tile drainage by 42-50%, despite N application timing
• Cover crop benefits of N cycling and N scavenging has the potential to off-set a large percentage of the cover crop adoption cost.
Watershed Scale
• Mass cover crop adoption on a watershed scale is possible.
• There was a signal of cover crop impacts on water quality.

Thank You!