soil health mapping and direct benefit transfer of ...oar.icrisat.org/9747/1/2016-088 res rep idc 6...
TRANSCRIPT

Research Report IDC-6ICRISAT Development Center
Soil Health Mapping and Direct BenefitTransfer of Fertilizer Subsidy
ICRISAT-India (Headquarters)Patancheru, Telangana, [email protected]
ICRISAT-India Liaison OfficeNew Delhi, India
ICRISAT-NigeriaKano, [email protected]
ICRISAT-MalawiLilongwe, [email protected], [email protected]
ICRISAT-NigerNiamey, [email protected]
ICRISAT-EthiopiaAddis Ababa, [email protected]
ICRISAT works in agricultural research for development across the drylands of Africa and Asia, making farming profitable for smallholder farmers while reducing malnutrition and environmental degradation.
We work across the entire value chain from developing new varieties to agri-business and linking farmers to markets.
ICRISAT appreciates the support of CGIAR investors to help overcome poverty, malnutrition and environmental degradation in the harshest dryland regions of the world. See http://www.icrisat.org/icrisat-donors.htm for full list of donors.
About ICRISAT: www.icrisat.org ICRISAT’s scientific information: EXPLOREit.icrisat.org
We believe all people have a right to nutritious food and a better livelihood.
ICRISAT-Mali (Regional hub WCA)Bamako, [email protected]
ICRISAT-ZimbabweBulawayo, [email protected]
ICRISAT-Kenya (Regional hub ESA)Nairobi, [email protected]
/ICRISAT /ICRISAT /ICRISATco/company/ ICRISAT
/PHOTOS/ ICRISATIMAGES /ICRISATSMCO
88-2016
PMO Strategy Document Series
DC ICRISAT DEVELOPMENT CENTER

Citation: Wani SP, Chander G, Bhattacharyya T and Patil M. 2016. Soil Health Mapping and Direct Benefit Transfer of Fertilizer Subsidy. Research Report IDC-6. Patancheru 502 324. Telangana, India: International Crops Research Institute for the Semi-Arid Tropics. 52 pp.
AcknowledgmentWe are extremely thankful to the Prime Minister’s Office for asking us to help prepare the strategy report on Soil Health Mapping and Direct Benefit Transfer of Fertilizer Subsidy. We also sincerely acknowledge the support of the Task force members for their contributions towards the report and the case studies. We also thank all the officials of the Department of Agriculture, Secretaries, Additional Secretaries, Joint Secretaries, partners and donors who have enabled us to play a role and put together the progress in the projects enclosed in the report.
ICRISAT holds the copyright to its publications, but these can be shared and duplicated for non-commercial purposes. Permission to make digital or hard copies of part(s) or all of any publication for non-commercial use is hereby granted as long as ICRISAT is properly cited. For any clarification, please contact the Director of Strategic Marketing and Communication at [email protected]. Department of Agriculture, Government of India and ICRISAT’s name and logo are registered trademarks and may not be used without permission. You may not alter or remove any trademark, copyright or other notice
© International Crops Research Institute for the Semi-Arid Tropics (ICRISAT), 2016. All rights reserved.
Cover page photos: ICRISAT
This report is part of a series of Strategy Papers drafted on the request of the Prime Minister’s Office, India. The other reports in this series include:
• Mission India for Transforming Agriculture (MITrA)
• Transforming Agricultural Marketing in India: Linking Farmers to a National Gateway and E-Markets, Current Scenario and a Way Forward;
• Pradhan Mantri Krishi Sinchai Yojana: Enhancing the Impact through Demand Driven Innovations;
• Transforming Weather Index-Based Crop Insurance in India: Protecting Small Farmers from Distress, Status and a Way Forward;
• Digital Agriculture; and
• Self-sufficiency in Pulse Production.

Soil Health Mapping and Direct Benefit Transfer of Fertilizer Subsidy
Suhas P Wani, Girish Chander, Tapas Bhattacharyya and Mukund Patil

About the authorsLead authorsSuhas P Wani Director, Research Program – Asia, ICRISAT, Hyderabad, TelanganaGirish Chander Senior Scientist, Soil Science, ICRISAT, Hyderabad, TelanganaTapas Bhattacharyya Vice Chancellor, Dr. Balasaheb Sawant Konkan Krishi Vidyapeeth, Dapoli, MaharashtraMukund Patil Senior Scientist, Soil Physics, ICRISAT, Hyderabad, Telangana
Contributing authors
Alok K Sikka IWMI Representative – India, International Water Management Institute (IWMI), New DelhiAshok Dalwai Additional Secretary, Government of India, New DelhiAshok Kumar Patra Director, Indian Institute of Soil Science, Bhopal, Madhya PradeshBhabani S Das Professor, Indian Institutes of Technology, (IIT), Kharagpur, West BengalDatta SC Principal Scientist, Indian Agricultural Research Institute (IARI), New DelhiDiwarkar PG Deputy Director - Remote Sensing Applications Area (RSAA), National Remote Sensing Center
(NRSC), Hyderabad, TelanganaDatta M Joint Director, ICAR Research Complex for North Eastern Hill (NEH) Region, TripuraJagadish Ladha Principal Scientist, International Rice Research Institute (IRRI), New DelhiJagdish Prasad Principal Scientist, National Bureau of Soil Survey and Land Use Planning (NBSS&LUP), ICAR,
Nagpur, MaharashtraJoshi PK Director, South Asia, International Food Policy Research Institute (IFPRI), New DelhiKatyal JC Vice-Chancellor, Chaudhary Charan Singh Haryana Agricultural University, Hisar, HaryanaKiran P Raverkar Professor, GB Pant University of Agriculture and Technology, Pantnagar, UttarakhandMadhu Nair K Principal Scientist, National Bureau of Soil Survey and Land Use Planning (NBSS&LUP), ICAR,
Bengaluru, KarnatakaMandal B Professor, Bidhan Chandra Krishi Viswavidyalaya (BCKV), West BengalMandal C Principal Scientist, National Bureau of Soil Survey and Land Use Planning (NBSS&LUP), ICAR,
Nagpur, MaharashtraNayak DC Principal Scientist, National Bureau of Soil Survey and Land Use Planning (NBSS&LUP), ICAR,
Kolkata, West BengalPadmaraju A Vice-Chancellor, Acharya N.G. Ranga Agricultural University (ANGRAU), Hyderabad, TelanganaRaj Paroda Chairman, Haryan Farmers' Commission, HisarRamana KV Scientist/Engineer-SG, National Remote Sensing Center (NRCS), Hyderabad, TelanganaRani Kumudini Joint Secretary, Department of Agriculture, Cooperation & Farmer Welfare, Government of
India, New DelhiSheetal Sharma Soil Scientist/ Nutrient Management Specialist-South Asia, International Rice Research Institute
(IRRI), New DelhiSingh SK Director, National Bureau of Soil Survey and Land Use Planning (NBSS&LUP), ICAR, Nagpur,
MaharashtraSreedevi TK Collector and District Magistrate - Mahaboobnagar district, Government of TelanganaSrinivasa Rao Ch Director, Central Research Institute for Dryland Agriculture (CRIDA), Hyderabad, TelanganaSrivastava R Principal Scientist, National Bureau of Soil Survey and Land Use Planning (NBSS&LUP), ICAR,
Nagpur, MaharashtraSubrata Das Director, Maharashtra Remote Sensing Application Center, Nagpur, MaharashtraSudhanshu Singh Scientist, International Rice Research Institute (IRRI), New DelhiVilas Kharche Associate Dean, College of Agriculture, Nagpur, Maharashtra
Content1. Executive Summary ............................................................................................................................................1
2. Issues Constraining Improved Productivity ........................................................................................................22.1 Poor soil health and soil degradation......................................................................................................22.2 Imbalanced use of fertilizers ...................................................................................................................22.3 Declining efficiency of fertilizer use ........................................................................................................3
3. Experiences and Learning ...................................................................................................................................33.1 Fragmented soil health mapping is of little value ...................................................................................33.2 Taluk level fertilizer recommendations are effective ..............................................................................33.3 Farmers participation builds ownership ..................................................................................................33.4 Consortium approach helps scale-up faster ............................................................................................43.5 Knowledge dissemination multiplies the impacts of soil health mapping ..............................................43.6 ICT is effective for knowledge dissemination ..........................................................................................4
4. Recommendations ..............................................................................................................................................44.1 Short term recommendations (1-3 years) ...............................................................................................54.2 Medium term recommendations (3-5 years) ..........................................................................................64.3 Long term recommendations (5-7 years) ................................................................................................84.4 Proposed institutional arrangements .....................................................................................................84.5 Time frame form implementation of recommendations ......................................................................10
5. Potential Outputs and Outcomes .....................................................................................................................105.1 Economic benefits of balanced nutrition in crop production ...............................................................10
6. Conclusions.......................................................................................................................................................13
7. References ........................................................................................................................................................14
Appendixes ..........................................................................................................................................................16

1
1. Executive Summary• Sustainable soil health management is a critical challenge for India and studies have shown that soils
in many parts of the country suffer from widespread multiple nutritional deficiencies (ranging from 18 to 100%). This is a major constraint in improving crop yields and realizing the full potential of agriculture.
• The situation is further compounded by the lack of adequate infrastructure and institutional arrangements for analyzing soil health of more than 137 million landholdings in the country.
• The Government of India has embarked on a bold initiative to undertake nationwide soil health mapping by adopting the stratified soil sampling model. To ensure the success of this initiative, the following strategies are recommended:
Short term (1-3 years)• Form a consortium of leading institutions to develop a national strategy for soil health
mapping, including sampling protocols, density, analytical methods, standards, quality maintenance processes, coordination for implementation and monitoring.
• Regional and state consortia of research and academic institutions like the state agricultural universities should be formed, to assist the Department of Agriculture, Krishi Vigyan Kendras (KVKs), Department of Horticulture and NGOs, with guidance from the national consortium to collect soil samples by adopting a uniform method.
• State-of-the-art laboratories in each district to be identified and accredited.• Establish “sites of learning” for the farmers.
Medium term (3-5 years)• Develop new low-cost formulations to supply the essential plant nutrients with biological/
organic and inorganic formulations.• Direct cash transfer of fertilizer subsidy will help plug leakage of subsidies.• Devise appropriate incentives for encouraging the increased use of organic manure (aerobic
composting, vermicomposting and green manuring through bund plantations) etc., and use of bio-fertilizers.
• Use information and communication technology (ICT), mobile phones, remote sensing based mapping, and geographic information system (GIS) based data display and analysis, to build awareness and disseminate best agricultural practices.
Long term (5-7 years)• Based on the soil health mapping, nutrient management recommendations and fertilizer
recommendation to be drawn up at taluk level, taking into account the seasonal nature of crops.
• An ex-ante assessment of the benefits of soil health mapping and adopting soil test-based taluk level fertilizer recommendation showed benefits of ₹ 4.33 lakh crores in 10 years with an investment of ₹ 0.254 lakh crores with a B:C ratio of 17:1.
• In Karnataka, under the Bhoochetana project, soil health mapping and soil test-based nutrient inputs, gave a return on investment of ₹ 3-14 per rupee invested on-farm and the state as a whole recorded a net income of about ₹ 1,300 crore due to improved management on 4.4 million ha of farmland during the period 2009-2012. In addition to the productivity and profitability benefits, the on-farm results have shown that improved soil and nutrient management tends to increase the nutritional quality of both grain and fodder. Research across the districts in Karnataka have shown that the science-led interventions improved not only the resilience of the production systems but also that the management strategies adopted by the farmers resulted in relatively higher yields even during low rainfall years (Uppal et al. 2015, Amare et al. 2012).

2
2. Issues Constraining Improved ProductivityIndia’s population is expected to reach 1.4 billion by 2025. This will lead to an increase in the demand for food grains (to about 300 million tons), vegetables, fruits, and animal products. This increase in demand has to be met from the limited arable land available (141 million ha), out of which 120 million ha is estimated to be suffering from different forms of land degradation. A large part of the total population (54.6%) of our country depends on agriculture for their livelihood and currently the share of agriculture in the national gross domestic product (GDP) is only 14%.
The existing large yield gaps (two- to four-folds) between the current and the potentially achievable crop yields particularly in the rainfed areas provide a huge opportunity to increase the country’s food production substantially. Long-term studies at ICRISAT show that it is possible to achieve grain productivity of 5.2 tons ha-1 from rainfed agriculture, compared to 1.1 tons ha-1 currently being achieved (Wani et al. 2003). Some of the constraints to achieving potential yield are:
2.1 Poor soil health and soil degradationStudies show that multi-nutrient deficiencies are constraining farmers from achieving potential yields. Soil analysis results from farmers’ fields in different states like Andhra Pradesh, Gujarat, Karnataka, Kerala, Madhya Pradesh, Rajasthan, Tamil Nadu, Gujarat and Jharkhand showed widespread deficiencies (18% to 100%) of multiple nutrients including secondary nutrients like sulfur (S) and micronutrients like zinc (Zn), boron (B), and iron (Fe) which have emerged as main constraints for sustaining agricultural productivity (Singh 2008; AICRP 2015; Bhattacharyya et al. 2013; Wani et al. 2015, 2013, 2012, 2011; Sahrawat et al. 2010, 2007; Chander et al. 2014b, 2013, 2012). The traditional practice of applying farm yard manure (FYM) has also declined, with increase in use of chemical fertilizers like urea, due to low fertilizer costs and non-existence of animal based farming. Organic manure is used only for high-value crops. Soil organic carbon and nitrogen are primary indicators of soil health. Most of the arable lands across the country show low levels of organic carbon with deficiencies ranging from 11% to 76% (Wani et al. 2015). Similarly, soils suffer from deficiencies of other macro and micronutrients such as phosphorus (P) 21-74%; potassium (K) 1-24%; sulfur (S) 46-96%; boron (B) 56-100%; and zinc (Zn) 18-85%. The general practice is to add fertilizers containing only macronutrients [nitrogen-phosphorus-potassium (NPK)] as farmers are not aware of secondary and micronutrient deficiencies.
2.2 Imbalanced use of fertilizersImbalanced use of fertilizers arises from the following causes: (1) Fertilizer subsidy of the government skews the fertilizer consumption pattern in the country. This has resulted in more application of N and P containing fertilizers, which is currently in the NPK ratio of 8:2.7:1 instead of 4:2:1; (2) Inadequate availability of the required fertilizers at the stipulated time in rural areas; (3) Lack of knowledge among farmers as to what nutrients are required by the crops and what is missing in their land. For inputs such as improved cultivars, seeds, pesticides, etc., private companies and their dealer networks provide information to the farmers. However, limited or in some cases, no such practice exist for fertilizers. The public infrastructure for soil analysis is poorly developed and farmers rarely get information in time. Also, laboratories often provide information on NPK fertilizers in a format that farmers fail to understand.
Another fallout of the fertilizer subsidy is that chemical fertilizers are cheaper than organic fertilizer. Thus, farmers have moved away from using organic manure, which is very critical for preserving good soil health, as organic carbon is the key fuel for keeping the soil microbial activities in a good state. Good soil health is required to ensure the quality of food, and for food and nutritional security. To address malnutrition in India, it is more economical and efficient to address food quality issues through soil health and diet diversification rather than through bio-fortification and nutritional amendments externally.
Imbalance in fertilizer use also leads to depletion of particular nutrients in the soils as well as causing environmental degradation. It also substantially increases the cost of cultivation and also lowers its efficiency.

3
2.3 Declining efficiency of fertilizer useSubsidies and increased awareness about fertilizers have led to an increase in fertilizer consumption from 11 kg ha-1 in 1970 to 89 kg ha-1 in 2004, and to 128.3 kg ha-1 in 2010-11 (Appendix B). More importantly, while fertilizer consumption continues to rise substantially, the elasticity of output with respect to fertilizer use has dropped sharply. The average crop response was 25 kg of grain per kg of fertilizer during the 1960s, which fell to only 8 kg of grain per kg of fertilizer by the late 1990s (Kapur, 2011). During the previous decade, while fertilizer consumption grew by 50%, the increase in food grains production was only 11%. The increase in fertilizer use has come at significant cost. The fiscal burden of fertilizer subsidy was ₹ 60 crore in the years 1976-77, which shot up to over ₹ 70,000 crore in 2012-13. There are other important costs in the form of long-term soil degradation, degradation of water resources (in both quantity and quality), and general stagnation of yields due to application of sub-optimal nutrient ratios. Besides, there are build up in nutrients in pockets which is of concern today (unlocking of these nutrients).
Thus disproportionate NPK fertilizer application, multi-nutrient deficiencies and lack of organic manure application has led to reduction in soil carbon content and contributed to stagnating agricultural productivity.
This report deals with the current status of soil health mapping and puts forth some recommendations for the Government of India.
3. Experiences and LearningICRISAT has substantive experience in soil health mapping for the states of Andhra Pradesh (undivided) and Karnataka. Some of the key learnings are below:
3.1 Fragmented soil health mapping is of little valueA fragmented approach to soil analysis has restricted analysis to only macronutrients. Moreover, individual nutrient deficiencies are scattered differently across regions and multiple nutrient deficiencies have been observed. However, keeping cost and other practical considerations in mind, the stratified soil sampling method (Sahrawat et al. 2008) facilitates the selection of representative samples. It is also proven to cover the field to field as well as inter-regional and intra-regional variabilities well. The states of Gujarat and Karnataka, where targeted initiatives for soil mapping have been undertaken, have shown good results. Farmers in these states have benefitted from increased production and profits, leading to an increase in the state’s agricultural GDP.
3.2 Taluk level fertilizer recommendations are effectiveIn the states of Andhra Pradesh and Karnataka, the ICRISAT-led consortium along with the state agricultural universities and the Department of Agriculture, had adopted a taluk level fertilizer recommendation and observed significant benefits not only for the farmers in terms of increased yield and profit but also for minimizing the unnecessary use of nutrients in order to protect the environment (Wani et al. 2012).
3.3 Farmers participation builds ownershipInvolving farmers in collecting samples builds ownership of the farmers and creates an interest in them to know the results of the soil analysis and adopt the fertilizer recommendations. In many programs, soil health mapping is used as an entry point to build rapport with the farmers and this has proven successful as compared to any other cash-based entry point activities (Wani et al. 2009; Dixit et al. 2007). This knowledge-based entry point activity benefits all villagers and helps achieve better rapport with the community. Classifying soil samples as critically deficient, deficient and sufficient is also very beneficial in developing recommendations for farmers (Rego et al. 2007 and Sahrawat et al. 2007).

4
3.4 Consortium approach helps scale-up fasterTo scale-up the soil test-based fertilizer application method, new ways to enhance awareness among the farmers at a larger scale needs to be identified.
The ICRISAT-led Bhoochetana initiative in Karnataka involved different line departments of the Government of Karnataka along with the academic institutions like University of Agricultural Sciences (UAS) located in Bengaluru, Dharwad, and Raichur. ICRISAT facilitated the orientation and training of master trainers from different universities and the Department of Agriculture. A simple and unified strategy was developed to orient and train staff down the line. A cadre of farm facilitators along with lead farmers were instrumental in sharing the technology and disseminating the knowledge with other farmers. Farmers were provided hand-holding support to collect soil samples. Traditional and innovative extension tools like wall writings, posters, village meetings, tablets, and pico projectors ensured the efficient transfer of information and knowledge to farmers.
3.5 Knowledge dissemination multiplies the impacts of soil health mappingA common complaint from farmers is that the results of soil health mapping are not made available to them on time and in an easily understandable format. It has been proven that wide sharing of this data and displaying the results in public domain will empower not only farmers but also policy makers, fertilizer dealers, and extension workers to make proper use of this knowledge in their planning as well as strategizing interventions in the given region. (See Appendix C for further details)
3.6 ICT is effective for knowledge disseminationInformation and communications technology (ICT) has an important role in scaling-up site-specific fertilizer recommendations. As part of Bhoochetana, an App ‘KrishiGyan Sagar’ was developed to provide up-to-date knowledge to the extension and para-extension workers in both local language and in English, using tablets, smartphones, and the web. This app had modules for plant protection and site specific fertilizer recommendations. This app was quite effective in scaling-up the site-specific fertilizer recommendations.
Another ICT tool that was quite effective was the farmer to farmer knowledge sharing videos. In Bhoochetana, ICRISAT in partnership with Digital Green, adopted a farmer to farmer video strategy for effective knowledge dissemination. This is now being replicated in the Rythu Kosam program in Andhra Pradesh. The advantage of this system is that farmers trust fellow farmers more than the extension workers when it comes to adopting improved management practices. Farmers share their experiences on camera about the various agricultural practices they adopted in their fields in the local language. These short videos are screened at small gatherings of 20-30 farmers in villages, using battery operated pico projectors.
With a strong mobile phone network of nearly 25 million phones and with internet spreading rapidly in the rural India, these ICT-based tools will play a pivotal role in future, for easy dissemination of knowledge to farmers. Initiatives like Digital India and Soil Health Card schemes open up a big opportunity for the use of ICT tools in agriculture. The findings from Karnataka show a way forward for scaling-up soil health mapping across other regions in the country.
4. RecommendationsIt is essential to adopt sustainable land and nutrient management practices to maintain soil fertility which is an important pillar of sustainable agriculture. Soil health mapping is the key to unlocking sustainable practices. The sheer number of farm holdings (137 million) in the country, pose a challenge for undertaking soil health mapping. Given the enormity and complexity of the challenge the following recommendations are proposed:
5
4.1 Short term recommendations (1-3 years)
Planning, coordination and monitoring through a consortium approachThe taluk level fertilizer recommendations and Integrated Nutrient Management (INM) can succeed only if soil health mapping is scaled-up. To scale-up soil health mapping, an overall strategy of centralized planning and decentralized execution with accountability must be adopted. A consortium of leading institutions in the country should be formed to develop a national strategy for soil health mapping, including sampling protocols, density, analytical methods, standards, quality control processes, and implementation coordination and monitoring.
Soil sampling protocols• Conduct a national workshop for leading institutions, state level institutions, fertilizer manufacturers
and policy makers. Facilitate the convergence of Department of Agriculture and Department of Fertilizer and Chemicals for harnessing their respective strengths for soil mapping at the national level.
• Sampling protocols including number of samples processing and storage of samples, etc. should be finalized at the national level before the initiative is launched. There should be a balance between what is desirable and what is achievable.
• Involve farmers in collecting soil samples. Though it is time-consuming, this will generate ownership and make it easier to scale up the soil test-based recommendations.
Standardized protocols for analysis and quality assurance• Develop protocols and processes for accreditation of laboratories.
• Develop quality assurance standards as well as mechanisms to ensure quality analysis by the accredited labs by empowering leading institutions in different regions.
• At state level, identified institutions should be entrusted to manage, archive and analyze all soil analysis data in the state. It would be then passed on for archiving and further analysis at the national level. Pyramiding of soil data would ensure proper policy development at the state and national level through decentralized operations and implementation, but with centralized strategic planning.
Public-Private Partnerships (PPP)• Identify possible business models for devolving the responsibilities of sample collection and soil
analysis including public-private partnerships (PPPs) while ensuring quality standards as well as economic feasibility.
• Explore public-private partnerships involving fertilizer manufacturers, private service providers, state agricultural universities and selected KVKs.
Knowledge dissemination strategyAll knowledge generated under this initiative should be distributed in a format and manner convenient to the respective stakeholders. Suggested below are some channels of dissemination:
• Soil health cards for farmers in a standard format.
• Use of wall-writings, awareness campaigns, traditional folk media, etc.
• Use of ICT tools like mobile and internet-based soil health maps; farmer-to-farmer videos; pico projectors and other tools.
• Cadre of farm facilitators who can reach out to farmers.
• Mechanisms for providing soil health cards and other means to share information should be adopted uniformly in the country.
• Learning sites where farmers see how recommended fertilizer regimes work under field conditions.

6
Skill developmentThe recommendations outlined above involve many stakeholders working in concert to achieve the intended outcomes. Given the varying skill levels among the stakeholders, a robust skill development component is critical to ensure the success of this initiative.
• Identify lead institutions with suitable human resources to impart training in different states.
• Bring together a core group of leading institutions and develop a training schedule as well as training manual for the master trainers.
• Train the master trainers who in turn can undertake training of department officials, farm facilitators and farmers at lower levels.
• Provide facilitation and hand-holding for the master trainers to conduct quality training.
• Build a strong cadre of farm facilitators through capacity building, the help of line development staffs.
4.2 Medium term recommendations (3-5 years)
Recommendations for direct benefit transfer of fertilizer subsidyThe Government of India constituted a committee in February 2011 to suggest ways to improve efficiency, cut costs and ensure better delivery of fertilizer subsidy. The committee suggested a phased introduction of direct benefit transfer (DBT) for fertilizer subsidy (Government of India, 2011). DBT for fertilizer subsidy was proposed to be implemented in three phases. In Phase I a comprehensive digital map of the fertilizer supply chain is to be produced. In Phase 2 the subsidy would be put to effect through a cash transfer to the retailers. In Phase 3 the subsidy benefit would go to the farmers as a cash transfer against the purchase of fertilizers. The subsidy transfer to farmers in the final phase hinges on the widespread coverage of Adhaar cards. For the third phase the committee delves into concerns like targeting the subsidy based on the size of holding, the nature of crops (subsistence versus commercial crops) and the ceiling on the amount of subsidy and/or fertilizers per beneficiary.
Government of India has launched the Jan Dhan scheme to provide a bank account to all rural households. The DBT scheme can leverage this channel to transfer the cash subsidy to the farmer’s account. Other modes of benefit transfer such as cash vouchers may also be explored. For example, instead of subsidy, discount coupons for purchasing organic manure and other hiring instruments from the custom hiring centers, etc. can also be implemented.
Building upon the recommendations of the committee, ICRISAT additionally recommends the following:
Identification and eligibility of beneficiaries• Inclusion and exclusion errors (not including eligible beneficiaries and excluding eligible beneficiaries)
are an inherent problem in any subsidy transfer scheme. Creating a national database with information on land holdings and type of crop(s) cultivated can overcome inclusion/exclusion errors.
• All farmers including share croppers (tenants) should be eligible for the subsidy. However, volume of the subsidized fertilizer should be restricted to the soil test-based nutrient recommendations for the area cultivated by the concerned beneficiary.
• Farmers are required to use fertilizers multiple times in a season or re-apply the fertilizer in case of losses due to heavy rains or any other natural calamity. Thus, it is difficult to fix any limit for fertilizer consumption. However, verifications should be done for large volume purchase.
• The DBT subsidy should be formulated in a manner that they do not distort incentives for growing some crops or hinder the adoption of low fertilizer-intensity technology (e.g., organic farming, use of vermicompost, etc.).

7
Tethering the DBT to soil test based fertilizer recommendationsIn the DBT framework, it is recommended that a farmer should be entitled to get subsidy on the quantity of fertilizer required in his/her field, as per the soil test-based recommendations. Soil health maps provide the status of location specific nutrient deficiencies. Based on these deficiencies, the national agricultural research system (NARS) will provide crop specific and site specific nutrient recommendations, which should be used for fixing the subsidy amount. Fertilizer manufacturers should prepare location and crop specific nutrient grades as per the recommended nutrient quantity. Farmers purchase fertilizer by paying the full price at the point of sale. Based on Adhaar identification, the details of the transaction are entered in the online system. Upon verification of the transaction, subsidy amount is transferred to the farmer’s bank account.
Integrated Nutrient Management with emphasis on organic fertilizerOver the years, farmers have increased their reliance on chemical fertilizers and have abandoned or reduced the use of organic manure drastically. As mentioned earlier, fertilizer subsidy policy is partly responsible for this. Long-term experiments conducted by Indian Council of Agricultural Research (ICAR) in different agroecological regions have clearly demonstrated increased sustainability of systems with INM strategies harnessing the biological sources using legumes in crop rotation; using organic manure; and soil test-based inorganic fertilizers for different crops (AICRP, 2015).
Low levels of soil organic matter along with multi-nutrient deficiencies are the major stumbling blocks for bridging yield gap in Indian agriculture. The role of soil organic matter in improving and sustaining the soil health is well documented. Therefore, large quantities of carbon and other nutrients contained in agricultural and domestic wastes (∼700 million tons generated annually in India) can be recycled to cut the rising costs of chemical fertilizers. Moreover, micro-irrigation systems across the country can be effectively used for the regulated supply of essential plant nutrients through fertigation and addition of micronutrients and secondary nutrients based on soil tests.
Incentives are required to promote the use of organic manure/fertilizers as well as biological sources like bio-fertilizer in order to encourage farmers to adopt INM approach. These recommendations need to be tethered to the soil test results. This presents a major challenge as the nutrient content of organic manures and fertilizers are highly variable. There is an urgent need to look at policies and innovative institutional arrangements for ensuring quality supply of bio-fertilizers and organic manure to the farmers
Figure 1. Process of direct benefit transfer based on nutrient based subsidy.
Fertilizer purchase and DBT
Nutrient recommendation
Fertilizer supply chain
• Fertilizer purchased at full payment at POS• Purchase information shared with DBT system• Verification of large volume purchase• Transfer of benefits through DBT gateway
• Site specific fertilizer production and positioning
• Buy and sell outlets for organic products
• Site specific fertilizer recommendations based on nutrient deficiency
• Site specific subsidy amount to promote balance nutrient mamagement
by recycling organic wastes generated, both in urban and rural areas. Mechanisms should be developed for recycling the organic wastes through mesophilic compost, aerobic compost, and vermicomposting so that the farmers can use the recycled organic matter for crop production. Currently, organic manure and bio-fertilizers are covered under the Fertilizer Control Order, 1985. Hence there is national standard for quality assurance of such fertilizers, however proper implementation is urgently needed to ensure quality of bio and organic fertilizers.
Options should be provided to the farmers to either avail DBT through cash transfer to their bank account or cash vouchers to buy organic manure from these recognized outlets. Such outlets should also have a credible system of organic certification. Backed with consumer awareness, such outlets would result in premium prices for organic produce, thereby, encouraging farmers to increase use of organic fertilizers.

8
Similarly, nitrogen-fixing trees like Cassia, Leucaena, Gliricidia, and other local species can be grown on farm bunds for generating organic matter to be added to the soil. Such in-situ production would ensure not only the protection of the bunds by reducing erosion but also make efficient use of unseasonal rains during the year, which can be used to produce biomass for building soil health with increased carbon content and nutrient status. Chhattisgarh is leading State in planting the plants on bunds.
4.3 Long term recommendations (5-7 years)
Soil test-based fertilizer recommendations at taluk levelDespite the need for and obvious advantages of precision agriculture, the normal practice is to develop fertilizer recommendations at state level using the agroecological region as the basis. Soil test-based fertilizer recommendations should be developed at taluk level. ICRISAT’s experience from Andhra Pradesh and Karnataka (see section 3.2) demonstrate the benefits of this approach. Subsequently, we can move towards village and farmer-based recommendations as awareness develops among the farmers and the government is geared to handle knowledge dissemination for villagers and individuals.
Strengthening the fertilizer supply chainIf cash transfers in Phase III (as recommended by the committee) reach farmers in time and are properly indexed, then there would be a significant effect on the fertilizer demand. However, if the supply falls short of demand it could create spikes in the fertilizer prices. Dealers can also create artificial scarcities at the local level. Strategies, such as maintaining adequate stocks at the selling point through timely deliveries can help avoid such outcomes.
Since a tracking system for the entire supply chain will be operational in Phase I (as recommended by the committee), it should be possible to spot such artificial scarcities. If dispatches are bar-coded, or Radio Frequency Identification (RFID) tagged, the supply chain could be more closely monitored. RFID tags could be embedded with a unique code specifying details like the manufacturer’s name, date of production, nutrient content of the fertilizer and the subsidy payable. The technique, proposed by the Indian Farmers’ Fertilizer Corporation (IFFCO), will be able to track about 60 million tons of fertilizers dispatched in approximately 120 crores bags of 50 kg each.
4.4 Proposed institutional arrangementsA cohesive institutional framework is required to achieve the expected benefits and ensure that the DBT for fertilizer subsidy is functional. This framework will help proper planning, effective implementation, and regular monitoring and evaluation. Since a new paradigm is being proposed, a multi-level consortium approach at national, state and district levels are recommended.
• National level committee – consisting of national and international research institutes, Ministry of Agriculture & Farmer Welfare, SAUs and private companies should provide overall strategies on planning, coordination, and monitoring. The committee has to meet one-two times in a year to conduct workshops with the leading scientists/institutions along with policy makers to finalize the broad strategy, time to time refinements and settlement of emerging issues.
• Regional level committee – consisting of national and international research institutes in the region, state agricultural universities and private companies – to act as a link between the national committee and the state committee for implementation. The committee should meet once every three months.
• State level committee – consisting of Department of Agriculture, state agriculture university, and private companies. The department in the state will act as the nodal agency. The committee should meet at least once every month.

9
The national level committee plays a supervisory and guidance role while the regional and state level committees will ensure implementation. The national committee will set the standards for sampling protocols, soil lab accreditation norms and standards, quality assurance standards for the labs and work on policy inputs for promoting organic fertilizers. The state level committees will oversee the working of the soil labs and carry out random checks to ensure quality control. The regional committees will oversee the states and ensure smooth inter-state coordination. The institutional setup is depicted below:
Proposed Institutional Mechanism fro Soil Health Mapping
10
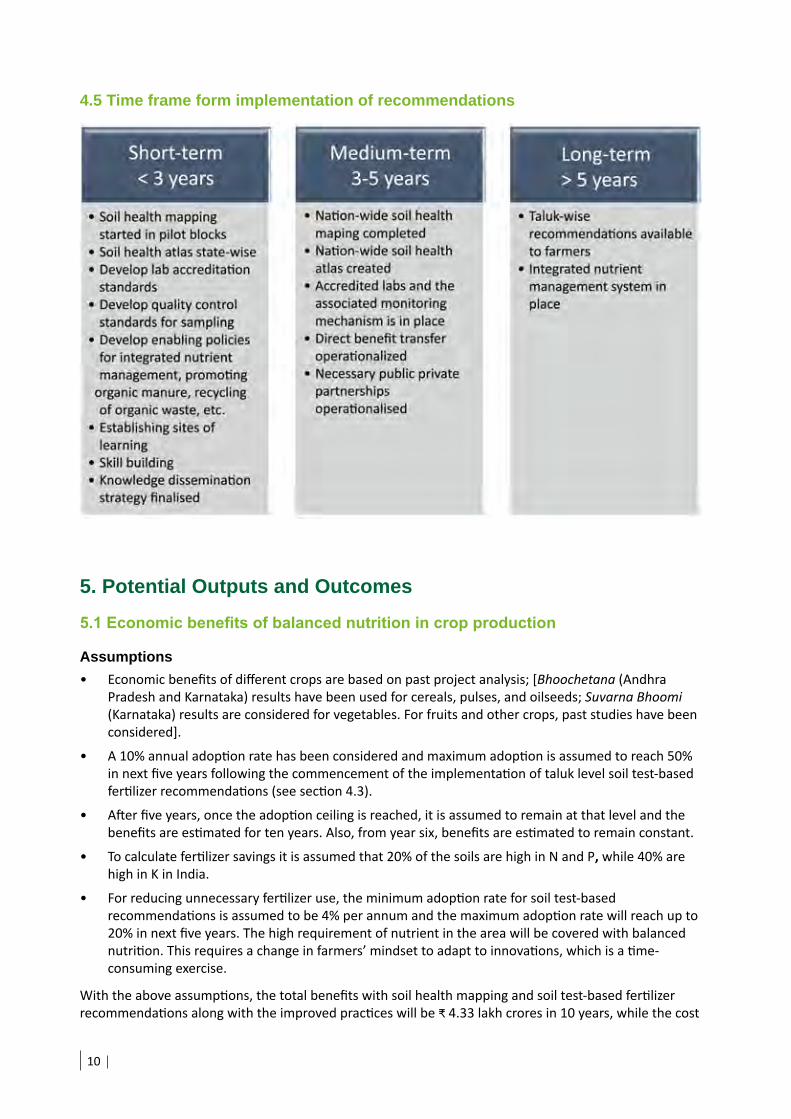
4.5 Time frame form implementation of recommendations
5. Potential Outputs and Outcomes5.1 Economic benefits of balanced nutrition in crop production
Assumptions• Economic benefits of different crops are based on past project analysis; [Bhoochetana (Andhra
Pradesh and Karnataka) results have been used for cereals, pulses, and oilseeds; Suvarna Bhoomi (Karnataka) results are considered for vegetables. For fruits and other crops, past studies have been considered].
• A 10% annual adoption rate has been considered and maximum adoption is assumed to reach 50% in next five years following the commencement of the implementation of taluk level soil test-based fertilizer recommendations (see section 4.3).
• After five years, once the adoption ceiling is reached, it is assumed to remain at that level and the benefits are estimated for ten years. Also, from year six, benefits are estimated to remain constant.
• To calculate fertilizer savings it is assumed that 20% of the soils are high in N and P, while 40% are high in K in India.
• For reducing unnecessary fertilizer use, the minimum adoption rate for soil test-based recommendations is assumed to be 4% per annum and the maximum adoption rate will reach up to 20% in next five years. The high requirement of nutrient in the area will be covered with balanced nutrition. This requires a change in farmers’ mindset to adapt to innovations, which is a time-consuming exercise.
With the above assumptions, the total benefits with soil health mapping and soil test-based fertilizer recommendations along with the improved practices will be ₹ 4.33 lakh crores in 10 years, while the cost

11
of soil health mapping and incentives is estimated at ₹ 0.254 lakh crores (Table 1, 2; also see Appendix A, B for details). The benefit-cost (B:C) ratio for this novel initiative would be 17:1. Such huge benefits in economic terms would attract farmers to adopt new fertilizer recommendation regimes, thereby increasing the benefits. In addition, such increased production of agricultural products would be a trigger for value chain improvements and would generate additional income for the government through tax collection.
In addition to economic benefits, a number of environmental benefits would be observed over a period, such as reduction in groundwater pollution due to nitrates, phosphates, and potash. Also pollution and contamination of surface water bodies will be reduced and eutrophication of lakes will be minimized. Importantly, the balanced nutrition will enhance the soil health and crop yields which would enhance farmers’ income, and most importantly, sustainability. Food and nutritional security for the growing population will also be achieved.
Table 1. Benefit-cost of soil health mapping in India.
ItemsNo. of sample
Unit cost (`/unit)
Total cost (` crore)
Soil health mapping 30,000,000 1,000 3,000
Soil sample collection and other 30,000,000 666 2,000
Sub total 5,000
Incentives @ 50% subsidy on Micronutrients
Area coverage (million ha)
Unit cost (`/ha)
Total incentives (` crores)
Year 1 14 1,000 1,400
Year 2 28 1,000 2,800
Year 3 42 1,000 4,200
Year 4 50 1,000 5,000
Year 5 70 1,000 7,000
Sub total 20,400
Total cost 25,400
Additional benefits from improved practices
Year-wise adoption
Area coverage (million ha)
Total additional value (` in crores)
Year 1 14.1 10,828
Year 2 28.2 21,657
Year 3 42.3 32,485
Year 4 56.4 43,313
Year 5 70.5 54,141
Year 6 70.5 54,141
Year 7 70.5 54,141
Year 8 70.5 54,141
Year 9 70.5 54,141
Year 10 70.5 54,141
Total 564 433,131

12
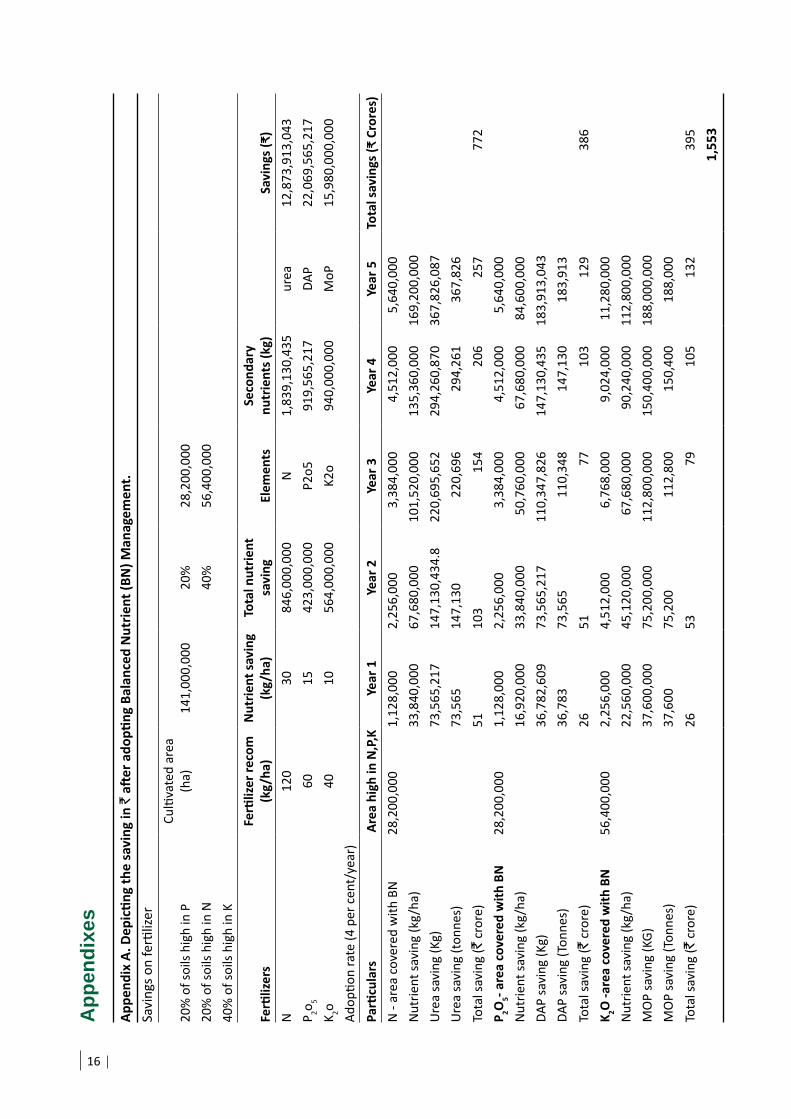
Table 2. Tentative savings in cost and quantity of fertilizers due to optimizing excessive applications of macro-nutrients based on soil test results.
ParticularsArea high in
N,P,K Year 1 Year 2 Year 3 Year 4 Year 5
Total savings
(` Crores)
N - area covered with BN 28,200,000 1,128,000 2,256,000 3,384,000 4,512,000 5,640,000
Nutrient saving (kg/ha) 33,840,000 67,680,000 101,520,000 135,360,000 169,200,000
Urea saving (Kg) 73,565,217 147,130,434.8 220,695,652 294,260,870 367,826,087
Urea saving (tons) 73,565 147,130 220,696 294,261 367,826
Total saving (` crore) 51 103 154 206 257 772
P2O5- area covered with BN 28,200,000 112,8000 2,256,000 3,384,000 4,512,000 5,640,000
Nutrient saving (kg/ha) 16,920,000 33,840,000 50,760,000 67,680,000 84,600,000
DAP saving (Kg) 36,782,609 73,565,217 110,347,826 147,130,435 183,913,043
DAP saving (Tons) 36,783 73,565 110,348 147,130 183,913
Total saving (` crore) 26 51 77 103 129 386
K2O-area covered with BN 56,400,000 2,256,000 4,512,000 6,768,000 9,024,000 11,280,000
Nutrient saving (kg/ha) 22,560,000 45,120,000 67,680,000 90,240,000 112,800,000
MOP saving (kg) 37,600,000 75,200,000 112,800,000 150,400,000 188,000,000
MOP saving (Tons) 37,600 75,200 112,800 150,400 188,000
Total saving (` crore) 26 53 79 105 132 395
Total saving (` crores) 1553
Soil health mapsThe most important output of this initiative is to develop a well-planned and coordinated national strategy for soil health mapping in the country. It also ensures the quality standards and mechanisms that are implemented for analyzes. The soil health maps generated will facilitate delineation of soils as per the fertility levels and will also provide a basis for the need-based nutrient management strategies. These will also facilitate the timely availability of nutrient/fertilizer and mobilization related decisions that are also required for policy reorientation.
13
Improved productivity and incomeSoil test-based balancing of deficient and excessive amounts of nutrients is expected to increase the crop productivity from 20 to 60%, thereby increasing the income of the farmers.
Ecosystem servicesNeed-based fertilizer managements will avoid excessive use of fertilizers like urea, which would render ecosystem service by avoiding pollution of water bodies due to leaching of nitrates (NO3) as well as reduced N2O emissions from soils.
SustainabilitySoil test-based nutrient management is expected to correct the nutrient imbalances that have been developed due to the indiscriminate use of NPK fertilizers and total negligence to the secondary and primary micronutrients. Thus improved soil health will surely ensure sustainability.
Resource use efficiencyWithout knowing soil fertility status, the application of fertilizers has drastically affected resourceful and the efficient use of nutrients, water, and other inputs. The efficiency would increase with judicious use of the resources, which in turn would minimize energy use, human resources and economic investments needed for agricultural productions/sector.
Evidence-based policiesThe generated extensive soil health mapping data will facilitate the policy makers to re-orient the policies in order to address the actual issues.
Investment opportunitiesThorough soil health mapping will highlight the region-wise needed inputs, thereby facilitating investment and livelihood opportunities.
6. ConclusionsFor the growing population of India, food and nutrition self-sufficiency can be achieved by increasing the sustainability of agriculture through the adoption of science-led developments and by taking soil science to the doorsteps of farmers in the country. The huge potential of small farm holdings can be harnessed by bridging the yield gaps and adopting soil health mapping as well as soil test-based fertilizer recommendations at the taluk level. Widespread deficiencies of multiple nutrients in the soils of India can be rectified and the sustainability of small farm holdings for livelihoods in the country can be enhanced. However, the success of such novel and bold initiatives depends on adopting innovative approaches and changing mindsets of all – from policy makers to farmers. Economically, this initiative is very remunerative with B: C ratio of 17:1 and the additional net value of gross products in 10 years would be ` 4.33 lakh crores, with an investment of merely ` 0.254 lakh crores. In addition to the economic benefits, several environmental benefits, employment generation opportunities and enhancing sustainability of the Indian agriculture will be the additional benefits of adopting such an innovative approach.

14
7. ReferencesAmare Haileslassie, Blummel M, Wani SP, Sahrawat KL, Pardhasaradhi G and Anandan Samireddypalle. 2012. Extractable soil nutrient effects on feed quality traits of crop residues in the semiarid rainfed mixed crop–livestock farming systems of Southern India. Springer. Pages 1-19
AICRP. 2015. All India Coordinated Research Project of Micro- and Secondary Nutrients and Pollutant Elements in Soils and Plants. Available from: http://www.iiss.nic.in/downloads/pcm_materisl.pdfCDA (Chilika Development Authority). 2012. Annual Report 2010-11, Chilika Development Authority, Bhubaneswar.
Bhattacharyya T, Pal DK, Mandal C, Chandran P, Ray SK, Sarkar Dipak, Velmourougane K, Srivastava A, Sidhu GS, Singh RS, Sahoo AK, Dutta D, Nair KM, Srivastava R, Tiwary P, Nagar AP and Nimkhedkar SS. 2013 Soils of India: Historical perspective, classification and recent advances in knowledge; A review. Current Science, 104 (10):1308-1323.
CAG. 2015. Report no.-16 of 2015-Union Government (Ministry of Chemicals and Fertilizers) - Report of the Comptroller and Auditor General of India on Nutrient Based Subsidy Policy for Decontrolled Phosphatic & Potassic Fertilizers. Government of India.
Chander G, Wani SP, Sahrawat KL and Rajesh C. 2014a. Enhanced nutrient and rainwater use efficiency in maize and soybean with secondary and micro nutrient amendments in the rainfed semi-arid tropics. Archives of Agronomy and Soil Science DOI: 10.1080/03650340.2014.928928
Chander G, Wani SP, Sahrawat KL, Dixit S, Venkateswarlu B, Rajesh C, Rao P N and Pardhasaradhi G. 2014b. Soil test-based nutrient balancing improved crop productivity and rural livelihoods: Case study from rainfed semi-arid tropics in Andhra Pradesh, India. Archives of Agronomy and Soil Science 60(8): 1051–1066.
Chander G, Wani SP, Sahrawat KL and Jangawad LS. 2012. Balanced plant nutrition enhances rainfed crop yields and water productivity in Jharkhand and Madhya Pradesh states in India. Journal of Tropical Agriculture 50 (1-2), 24-29.
Chander G, Wani SP, Sahrawat KL, Kamdi PJ, Pal CK, Pal DK and Mathur TP. 2013. Balanced and integrated nutrient management for enhanced and economic food production: case study from rainfed semi-arid tropics in India. Archives of Agronomy and Soil Science 59(12), 1643-1658.
Chennamaneni SR, Wani SP, Chander G and Sahrawat KL 2014. Balanced nutrient management for crop intensification and livelihood improvement: A case study from watershed in Andhra Pradesh, India. Communications in Soil Science and Plant Analysis 45: 2515-2528.
Dixit S, Wani SP, Rego TJ, and Pardhasaradhi, G. 2007. Entry point and innovative up-scaling strategy for watershed development projects. Indian Journal of Dryland Agriculture and Development. Vol. 22 (1):22-31.
Government of India. 2011. Interim report of the task force on direct transfer of subsidy on kerosene, LPG, and fertilizers. GoI.
Haileslassie A, Blummel M, Wani SP, Sahrawat KL, Pardhasaradhi G and Samireddypalle A. 2013. Extractable soil nutrient effects on feed quality traits of crop residues in the semiarid rainfed mixed crop–livestock farming systems of Southern India. Environment and Sustainable Development. 15:723–741
Helmke PA and Sparks DL. 1996. Lithium, sodium, potassium, rubidium, and cesium. Pages 551-574 in Methods of soil analysis, Part 3: Chemical methods (Soil Science Society of America Book series No. 5, Sparks DL, ed.). Madison, Wisc.: SSSA and ASA.
ICRISAT. 2015. Bhoochetana: Mission to enhance productivity of rainfed crops in Karnataka. Available at: http://www.icrisat.org/what-we-do/agro-ecosystems/Bhoo-Chetana/report.htm.
Kapur D. 2011. The shift to cash transfer: Running better but on the wrong road? Economic & Political Weekly, 46(21), 80-85.
Keren R. 1996. Boron. Pages 603-626 in Methods of soil analysis, Part 3: Chemical methods (Soil Science Society of America Book series No. 5, Sparks DL, ed.). Madison, Wisc.: SSSA and ASA.
Lindsay WL and Norvell WA. 1978. Development of a DTPA test for zinc, iron, manganese and copper. Soil Science Society of America Journal 42: 421-428.
NBSS&LUP. 2002. Soils of India, NBSS Publ. No. 94, National Bureau of Soil Survey & Land Use Planning, Nagpur, 130 pp + 11 sheet maps.

15
Nelson DW and Sommers LE. 1996. Total carbon, organic carbon and organic matter. Pages 961-1010 in Methods of soil analysis, Part 3: Chemical methods (Soil Science Society of America Book series No. 5, Sparks DL, ed.). Madison, Wisc.: SSSA and ASA.
Olsen SR and Sommers LE. 1982. Phosphorus. Pages 403-430 in Methods of soil analysis, part 2, 2nd ed .(Agronomy Monograph 9). (Page AL editors). Madison, Wisc.: ASA and SSSA.
Raju KV, Wani SP, WA and Anantha KH. 2013. Bhoochetana: Innovative Institutional Partnerships to boost productivity of rainfed agriculture in Karnataka, India. Resilient Dryland systems report no 59, Patancheru, Andhra Pradesh, India: International Crops Research Institute for the Semi-Arid Tropics (ICRISAT).
Rego TJ, Wani SP, Sahrawat KL and Pardhasaradhi G. 2005. Macro-benefits from boron, zinc and sulfur application in Indian SAT: A step for Grey to Green Revolution in agriculture. Global Theme on Agroecosystems Report no. 16. Patancheru, Andhra Pradesh, India: International Crops Research Institute for the Semi-Arid Tropics (ICRISAT).
Sahrawat KL, Rego TJ, Wani SP and Pardhasaradhi G. 2008.Stretching soil sampling to watershed: Evaluation of soil-test parameters in a semi-arid tropical watershed. Communications in Soil Science and Plant Analysis 39, 2950-2960.
Sahrawat KL, Wani SP, Parthasaradhi G and Murthy KVS. 2010. Diagnosis of secondary and micronutrient deficiencies and their management in rainfed agroecosystems: Case study from Indian Semi-arid Tropics. Communication in Soil Science and Plant Analysis, 346-360.
Sahrawat KL, Wani SP, Rego TJ, Pardhasaradhi G. and Murthy KVS. 2007. Widespread deficiencies of sulphur, boron and zinc in dryland soils of the Indian semi-arid tropics. Current Science. 93: 1428-1432.
Singh MV. 2008. Micronutrient fertility mapping for Indian soils. Available from: http://www.iiss.nic.in/downloads/MicronutrientMaps.pdf
Tabatabai MA. 1996. Sulphur. Pages 921-960 in Methods of soil analysis, Part 3: Chemical methods (Soil Science Society of America Book series No. 5, Sparks DL, ed.). Madison, Wisc: SSSA and ASA.
Uppal RK, Wani SP, Garg KK and Alagarswamy G. 2015. Balanced nutrition increases yield of pearl millet under drought. Pages. 86-97 in Field Crops Research.
Wani SP, Chander G and Sahrawat KL. 2012. Soil health awareness: soil science at doorsteps of the farmers. Pages 1-9 in Proceedings of national seminar on “Soil Security for Sustainable Agriculture”, 27-28 February, 2010, (Sarode SV, Deshmukh JP, Kharche VK and Sable YR, eds.). Akola, Maharashtra, India: Dr Panjabrao Deshmukh Krishi Vidyapeeth.
Wani SP, Chander G, Sahrawat KL and Pardhasaradhi G. 2015. Soil test-based balanced nutrient management for sustainable intensification and food security: case from Indian semi-arid tropics. Communications in Soil Science and Plant Analysis 46 (S1): 20-33.
Wani SP, Hander G, Sahrawat KL, Dixit S and Venkateswarlu B. 2013.Improved crop productivity and rural livelihoods through balanced nutrition in the rain-fed semi-arid tropics. Resilient Dryland Systems Report No. 58. Patancheru, Andhra Pradesh, India: International Crops Research Institute for the Semi-Arid Tropics (ICRISAT). 36 pp.
Wani SP, Sahrawat KL, Sarvesh KV, Baburao Mudbi and Krishnappa K. 2011. Soil Fertility Atlas for Karnataka, India. International Crops Research Institute for the Semi-Arid Tropics (ICRISAT), Patancheru, Andhra Pradesh, India.
Wani SP, Pathak P, Jangawad LS, Eswaran H and Singh P. 2003. Improved management of Vertisols in the semi-arid tropics for increased productivity and soil carbon sequestration. Soil Use and Management 19: 217-222.
Wani SP, Sahrawat KL, Sreedevi TK, Pardhasaradhi G and Dixit S. 2009. Knowledge-based Entry Point for Enhancing Community Participation in Integrated Watershed Management. In Best-bet Options for Integrated Watershed Management. Proceedings of the Comprehensive Assessment of Watershed Programs in India, 25-27 July 2007, ICRISAT Patancheru, Andhra Pradesh, India.
Wani SP, Sarvesh KV, Sahrawat KL, Krishnappa K, Dharmarajan BK, Raju KV, Kaushik Mukherjee and Dar WD. 2013. Bhoochetana: Building Resilience and Livelihoods through Integrated Watershed Management. Resilient Dryland Systems Report No. 62. International Crops Research Institute for the Semi-Arid Tropics (ICRISAT) Patancheru 502 324, Andhra Pradesh, India.44 pp.
16
Appe
ndix
A. D
epic
ting
the
savi
ng in
` a
fter a
dopti
ng B
alan
ced
Nut
rient
(BN
) Man
agem
ent.
Savi
ngs o
n fe
rtiliz
er
20%
of s
oils
high
in P
Culti
vate
d ar
ea
(ha)
141,
000,
000
20%
28,2
00,0
00
20%
of s
oils
high
in N
40%
56,4
00,0
00
40%
of s
oils
high
in K
Ferti
lizer
sFe
rtiliz
er re
com
(k
g/ha
)N
utrie
nt sa
ving
(k
g/ha
)To
tal n
utrie
nt
savi
ngEl
emen
tsSe
cond
ary
nutr
ient
s (kg
)Sa
ving
s (₹)
N12
030
846,
000,
000
N1,
839,
130,
435
urea
12,8
73,9
13,0
43P 2o 5
6015
423,
000,
000
P2o5
919,
565,
217
DAP
22,0
69,5
65,2
17K 2o
4010
564,
000,
000
K2o
940,
000,
000
MoP
15,9
80,0
00,0
00Ad
optio
n ra
te (4
per
cen
t/ye
ar)
Pa
rticu
lars
Area
hig
h in
N,P
,KYe
ar 1
Year
2Ye
ar 3
Year
4Ye
ar 5
Tota
l sav
ings
(₹ C
rore
s)N
- ar
ea c
over
ed w
ith B
N28
,200
,000
1,12
8,00
02,
256,
000
3,38
4,00
04,
512,
000
5,64
0,00
0
Nut
rient
savi
ng (k
g/ha
)
33,8
40,0
0067
,680
,000
101,
520,
000
135,
360,
000
169,
200,
000
U
rea
savi
ng (K
g)
73,5
65,2
1714
7,13
0,43
4.8
220,
695,
652
294,
260,
870
367,
826,
087
U
rea
savi
ng (t
onne
s)
73,5
6514
7,13
022
0,69
629
4,26
136
7,82
6
Tota
l sav
ing
(` c
rore
)
5110
315
420
625
777
2P 2O
5- are
a co
vere
d w
ith B
N28
,200
,000
1,12
8,00
02,
256,
000
3,38
4,00
04,
512,
000
5,64
0,00
0
Nut
rient
savi
ng (k
g/ha
)
16,9
20,0
0033
,840
,000
50,7
60,0
0067
,680
,000
84,6
00,0
00
DAP
savi
ng (K
g)
36,7
82,6
0973
,565
,217
110,
347,
826
147,
130,
435
183,
913,
043
DA
P sa
ving
(Ton
nes)
36
,783
73,5
6511
0,34
814
7,13
018
3,91
3
Tota
l sav
ing
(` c
rore
)
2651
7710
312
938
6K 2O
-are
a co
vere
d w
ith B
N56
,400
,000
2,25
6,00
04,
512,
000
6,76
8,00
09,
024,
000
11,2
80,0
00
Nut
rient
savi
ng (k
g/ha
)
22,5
60,0
0045
,120
,000
67,6
80,0
0090
,240
,000
112,
800,
000
M
OP
savi
ng (K
G)
37,6
00,0
0075
,200
,000
112,
800,
000
150,
400,
000
188,
000,
000
M
OP
savi
ng (T
onne
s)
37,6
0075
,200
112,
800
150,
400
188,
000
To
tal s
avin
g (`
cro
re)
26
5379
105
132
395
1,5
53
App
endi
xes

17
Cont
inue
d
Appe
ndix
B. E
x-an
te b
enefi
ts o
f Bal
ance
d N
utriti
on M
anag
emen
t in
diffe
rent
cro
ps in
Indi
a.
Year
1Cr
opCe
real
sPu
lses
Oils
eeds
Vege
tabl
esFr
uits
Oth
ers
Tota
l
Ar
ea c
over
age
(M h
a)5.
71.
01.
80.
90.
74.
0
E c
onom
ic b
enefi
t (`/
ha)
4,00
07,
000
8,00
015
,000
15,0
0010
,000
To
tal v
alue
( ` C
rore
s)2,
279
675
1,44
51,
362
1,03
24,
036
10,8
28
Year
2Cr
op
Cere
als
Puls
esO
ilsee
dsVe
geta
bles
Frui
tsO
ther
sTo
tal
Ar
ea c
over
age
(M h
a)11
.41.
93.
61.
81.
48.
1
E c
onom
ic b
enefi
t (`/
ha)
4,00
07,
000
8,00
015
,000
15,0
0010
,000
To
tal v
alue
( ` C
rore
s)4,
559
1,35
02,
889
2,72
42,
063
8,07
121
,657
Year
3Cr
op
Cere
als
Puls
esO
ilsee
dsVe
geta
bles
Frui
tsO
ther
sTo
tal
Ar
ea c
over
age
(M h
a)17
.12.
95.
42.
72.
112
.1
Ec
onom
ic b
enefi
t (`/
ha)
4,00
07,
000
8,00
015
,000
15,0
0010
,000
To
tal v
alue
( ` C
rore
s)6,
838
2,02
54,
334
4,08
63,
095
12,1
0732
,485
Year
4Cr
op
Cere
als
Puls
esO
ilsee
dsVe
geta
bles
Frui
tsO
ther
sTo
tal
Ar
ea c
over
age
(M h
a)22
.83.
97.
23.
62.
816
.1
Ec
onom
ic b
enefi
t (`/
ha)
4,00
07,
000
8,00
015
,000
15,0
0010
,000
To
tal v
alue
( ` C
rore
s)9,
118
2,69
95,
779
5,44
94,
126
16,1
4243
,313
Year
5Cr
op
Cere
als
Puls
esO
ilsee
dsVe
geta
bles
Frui
tsO
ther
sTo
tal
Ar
ea c
over
age
(M h
a)28
.54.
89.
04.
53.
420
.2
Ec
onom
ic b
enefi
t (`/
ha)
4,00
07,
000
8,00
015
,000
15,0
0010
,000
To
tal v
alue
( ` C
rore
s)11
,397
3,37
47,
224
6,81
15,
158
20,1
7854
,141
Year
6Cr
op
Cere
als
Puls
esO
ilsee
dsVe
geta
bles
Frui
tsO
ther
sTo
tal
Ar
ea c
over
age
(M h
a)28
.54.
89.
04.
53.
420
.2
Ec
onom
ic b
enefi
t (`/
ha)
4,00
07,
000
8,00
015
,000
15,0
0010
,000
To
tal v
alue
( ` C
rore
s)11
,397
3,37
47,
224
6,81
15,
158
20,1
7854
,141

18
Appe
ndix
B. E
x-an
te b
enefi
ts o
f Bal
ance
d N
utriti
on M
anag
emen
t in
diffe
rent
cro
ps in
Indi
a co
ntinu
ed.
Year
7Cr
op
Cere
als
Puls
esO
ilsee
dsVe
geta
bles
Frui
tsO
ther
sTo
tal
Ar
ea c
over
age
(M h
a)28
.54.
89.
04.
53.
420
.2
E c
onom
ic b
enefi
t (`/
ha)
4,00
07,
000
8,00
015
,000
15,0
0010
,000
To
tal v
alue
( ` C
rore
s)11
,397
3,37
47,
224
6,81
15,
158
20,1
7854
,141
Year
8Cr
op
Cere
als
Puls
esO
ilsee
dsVe
geta
bles
Frui
tsO
ther
sTo
tal
Ar
ea c
over
age
(M h
a)28
.54.
89.
04.
53.
420
.2
E c
onom
ic b
enefi
t (`/
ha)
4,00
07,
000
8,00
015
,000
15,0
0010
,000
To
tal v
alue
( ` C
rore
s)11
,397
3,37
47,
224
6,81
15,
158
20,1
7854
,141
Year
9Cr
op
Cere
als
Puls
esO
ilsee
dsVe
geta
bles
Frui
tsO
ther
sTo
tal
Ar
ea c
over
age
(M h
a)28
.54.
89.
04.
53.
420
.2
Ec
onom
ic b
enefi
t (`/
ha)
4,00
07,
000
8,00
015
,000
15,0
0010
,000
To
tal v
alue
( ` C
rore
s)11
,397
3,37
47,
224
6,81
15,
158
20,1
7854
,141
Year
10
Crop
Ce
real
sPu
lses
Oils
eeds
Vege
tabl
esFr
uits
Oth
ers
Tota
l
Ar
ea c
over
age
(M h
a)28
.54.
89.
04.
53.
420
.2
Ec
onom
ic b
enefi
t (`/
ha)
4,00
07,
000
8,00
015
,000
15,0
0010
,000
To
tal v
alue
( ` C
rore
s)11
,397
3,37
47,
224
6,81
15,
158
20,1
7854
,141
zinc
(Zn)
, bor
on (B
), an
d su
lfur (
S); n
itrog
en (N
) and
pho
spho
rus (
P); p
otas
sium
(K)
19
Appe
ndix
C. L
ist o
f Tas
kfor
ce M
embe
rs.
S. N
o.N
ame
Desig
natio
nO
rgan
izatio
n N
ame
Plac
e of
the
Org
aniza
tion
1Dr
SP
Wan
i (Ch
air)
Dire
ctor
IDC,
ICRI
SAT
Hyde
raba
d2
Dr B
Man
dal
Prof
esso
rBC
KVW
est B
enga
l3
Dr JC
Kat
yal
Ex-D
DG, I
CAR
and
Vice
Cha
ncel
lor
HAU
Hisa
r4
Dr A
Pad
mar
aju
Vice
Cha
ncel
lor
ANGR
AU
Hyde
raba
d 5
Dr V
ilas K
harc
heAs
soci
ate
Dean
Colle
ge o
f Agr
icul
ture
Nag
pur
6Dr
Ash
ok D
alw
ai
Addl
. Sec
.Go
IN
ew D
elhi
7
Mad
am R
ani K
umud
ini
Join
t Sec
reta
ryDe
part
men
t of A
gric
ultu
re &
Coo
pera
tion
Govt
of I
ndia
, New
Del
hi
8Dr
SC
Datta
Prin
cipa
l Sci
entis
tIA
RIN
ew D
elhi
9Dr
She
etal
Sha
rma
Scie
ntist
IRRI
New
Del
hi10
Dr B
haba
ni S
Das
Agric
ultu
ral a
nd F
ood
Engi
neer
ing
Dept
Indi
an In
stitu
te o
f Tec
hnol
ogy
Khar
agpu
r11
Dr. M
rinm
oy D
atta
Join
t Dire
ctor
ICAR
Res
earc
h Co
mpl
ex fo
r NEH
Reg
ion
Trip
ura
12Dr
C M
anda
lPr
inci
pal S
cien
tist
NBS
S&LU
PN
agpu
r13
Dr Ja
gadi
sh L
adha
Pr
inci
pal S
cien
tist
IRRI
New
Del
hi14
Dr S
udha
nshu
Sin
ghSc
ienti
stIR
RIN
ew D
elhi
15Dr
Raj
S P
arod
a Ch
airm
anHa
ryan
Far
mer
s’ C
omm
issio
nHi
sar
16Dr
Ch
Srin
ivas
a Ra
o Di
rect
or
CRID
A Hy
dera
bad
17Dr
PK
Josh
i Di
rect
or, S
outh
Asia
IFPR
IN
ew D
elhi
18Dr
Kira
n P
Rave
rkar
Prof
esso
rGB
Pan
t Uni
vers
ity o
f Agr
icul
ture
and
Tech
Utta
rakh
and
19Dr
Sub
rata
Das
Di
rect
or
Mah
aras
htra
Rem
ote
Sens
ing
Appl
icati
on C
ente
r N
agpu
r 20
Dr G
irish
Cha
nder
Sr. S
cien
tist
IDC,
ICRI
SAT
Hyde
raba
d21
Dr M
ukun
d Pa
til
Sr. S
cien
tist
IDC,
ICRI
SAT
Hyde
raba
d22
Dr T
apas
Bha
ttach
aryy
a*Vi
siting
Sci
entis
t ID
C, IC
RISA
T Hy
dera
bad
23Dr
SK
Sing
hDi
rect
orN
BSS&
LUP
Nag
pur
24Dr
KV
Ram
ana
Scie
ntist
/Eng
inee
r-SG
Nati
onal
Rem
ote
Sens
ing
Cent
er (N
RCS)
Hyde
raba
d 25
Dr A
shok
Kum
ar P
atra
Di
rect
orIn
dian
Insti
tute
of S
oil S
cien
ceBh
opal
, MP
26Dr
PG
Diw
akar
De
puty
Dire
ctor
- RS
AA
Nati
onal
Rem
ote
Sens
ing
Cent
erHy
dera
bad
27Dr
K M
adhu
Nai
rPr
inci
pal S
cien
tist
NBS
S&LU
PBe
ngal
uru
28Dr
DC
Nay
akPr
inci
pal S
cien
tist
NBS
S&LU
PKo
lkat
a29
Dr R
Sriv
asta
vaPr
inci
pal S
cien
tist
NBS
S&LU
PN
agpu
r30
Dr Ja
gdish
Pra
sad
Prin
cipa
l Sci
entis
tN
BSS&
LUP
Nag
pur
31Dr
TK
Sree
devi
Co
llect
or a
nd D
istric
t Mag
istra
teGo
vt. o
f Tel
anga
naM
ahab
oobn
agar
Dist
r.32
Dr A
lok
K Si
kka
**De
puty
Dire
ctor
Gen
eral
ICAR
New
Del
hi*
Curr
ently
serv
ing
as th
e Vi
ce-C
hanc
ello
r for
Dr B
alas
aheb
Saw
ant K
onka
n K
rishi
Vid
yape
eth
in M
ahar
asht
ra *
* Cu
rren
tly R
epre
sent
ativ
e - I
ndia
, IW
MI N
ew D
elhi

20
Appendix D. Consumption of fertilizers (state-wise, nutrient-wise) during 2012-13.
Sl. No. State/UTPer ha fertilizer consumption in kg*
N P2O5 K2O Total1. Andhra Pradesh 122.72 49.20 17.38 189.302. Karnataka 68.27 29.83 19.13 117.233. Kerala 46.52 23.79 34.40 104.714. Tamil Nadu 99.88 38.77 25.93 164.585. Puducherry 365.81 90.97 52.58 509.356. A& N Islands 22.63 16.84 13.16 52.63
SZ Total 93.88 38.66 20.66 153.197. Gujarat 82.28 21.05 6.24 109.588. Madhya Pradesh 49.11 32.46 3.22 84.799. Chhattisgarh 66.16 31.74 8.20 106.1010. Maharashtra 56.85 29.74 16.14 102.7311. Rajasthan 37.17 13.70 0.83 51.7012 Goa 17.38 10.19 6.06 33.6313. Daman &Diu 46.67 6.67 3.33 56.6714. D & N Haveli 26.36 17.27 0.00 43.64
WZ total 53.25 24.69 6.71 84.6415. Haryana 157.26 47.74 2.56 207.5616. Punjab 188.47 58.67 3.05 250.1917. Uttar Pradesh 132.05 45.95 5.23 183.2318. Uttarakhand 103.67 20.32 6.36 130.3519 Himachal Pradesh 35.53 7.19 7.51 50.2320. J & K 66.52 21.14 8.55 96.2121. Delhi 25.68 1.59 0.00 27.27
NZ Total 141.43 46.30 4.59 192.3222. Bihar 154.46 45.26 12.51 212.2323 Jharkhand 89.54 60.91 7.77 158.2224. Odisha 58.03 22.88 9.39 90.2925. West Bengal 86.17 47.44 29.56 163.17
EZ Total 100.79 41.80 18.50 161.0826. Assam 36.31 11.80 18.15 66.2627. Tripura 39.09 20.66 12.94 72.6928. Manipur 26.09 3.68 1.38 31.1529. Meghalaya 9.94 3.40 1.01 14.3530. Nagaland 2.43 1.53 0.84 4.8031 Arunachal Pradesh 1.62 0.11 0.32 2.0532. Mizoram 12.33 0.68 0.23 13.23
NE Total 29.04 9.59 13.10 51.73All India 84.54 33.44 10.36 128.34
*Gross cropped area 2010-11 Source: Department of Agriculture & Cooperation

21
Appendix E
Knowledge dissemination on soil health using GIS and thematic maps
Soil health mapping has been done on pilot basis by many agencies across India. However, there is no systematic and thorough exercise performed so far. There is a need to develop detailed and precise maps based on the extensive soil sampling and analysis at the block or village-level. The soil resource mapping programme (SRM) of the entire country, between 1986 and 1996, generated an extensive database on soils, their area and characteristics to enable their grouping followed by the soil taxonomy (NBSS&LUP, 2002). The relative proportion of major soils and other details are shown in Figures E.1, E.2 and Table E.1. On the basis of the cartographic generalization, the state’s soil maps were brought to the country map level at a 1:1 million scale with 1649 soil mapping units at the soil subgroup association level.
Figure E.1. Various soil orders and their extent in India. (Source: Bhattacharyya et al. 2013).
Figure E.2. Soil map developed under AICRP on micronutrients (Source: Singh et al. 2008).
Data source: AICRP - Micro and Secondary Nutrient and Pollutant Elements in Soils & Plants, IISS, (ICAR), Bhopal AICRP Macronutrient Unit, Deptt. of Soil Science & Agril. Chemistry, JNKV, Jabalpur, Madhya Pradesh and all the micronutrient researchers in the country and for mapping cooperation by National Bureau of Soil Survey and Land Use Planning, (ICAR), Nagpur (MS)

22
Under the All India Coordinated Research Project (AICRP) on micronutrients, Indian Institute of Soil Science (IISS) in collaboration with National Bureau of Soil Survey and Land Use Planning (NBSSLUP), Nagpur prepared GIS-based soil fertility maps at taluka, district, state, national level, and agro-ecological zone-wise using the gridded soil sampling method (AICRP 2015; Singh et al. 2008). On a pilot basis the soil fertility mapping and nutrient management plan for rice soils of Palakkad district in Kerala state, under the Rashtriya Sam Vikas Yojana of the Government of India, is one of the systematic mapping done for parameters like pH, EC, organic nutrients like C, P, K, micronutrients like Zn, Cu, Fe, Mn, B, and secondary nutrient like S. GIS mapping based soil fertility information and recommendations are shared with farmers through soil fertility cards.
Once the soil analysis is undertaken, the results of the soil health mapping are shared with different stakeholders using different communication methods such as community meetings, wall writings in the villages, posters, soil health cards, soil health Atlas, and also by displaying the GIS maps in public domain via the internet (Wani et al. 2011). Wide sharing of this data and displaying the results in public domain
Table E.1. The extent and distribution of the different soil classes of India as represented in the soil maps on 1: 250,000 scale along with their equivalents, according to the United States Department of Agriculture, USA nomenclature system.
Major soils (traditional name)
ExtentDistribution in states
Soil orders of the US soil taxonomy‘000 ha Percentage
Alluvial 100,006 30.4 J&K, HP, Punjab, Haryana, Delhi, UP, Gujarat, Goa, MP, MS, AP, Karnataka, TN, Kerala, Puducherry, Bihar, Odisha, WB, ArP, Assam, Nagaland, Manipur, Mizoram, Tripura, Meghalaya, A&N
Inceptisols, Entisols, Alfisols, Aridisols
Coastal alluvial 10,049 3.1 AP, Karnataka, TN, Kerala, WB, Gujarat, Odisha, Puducherry, Lakshadweep, A&N
Aridisols, Inceptisols, Entisols
Red 87,989 26.8 AP, Karnataka, Kerala, TN, Puducherry, Rajasthan, MP, MS, Gujarat, Goa, ArP, Assam, Manipur, Meghalaya, Nagaland, Mizoram, Tripura, Delhi, UP, HP, A&N
Alfisols, Ultisols, Entisols, Inceptisols, Mollisols, Aridisols
Laterites 18,094 5.5 AP, Karnataka, Kerala, TN, Puducherry, MS, Odisha, WB
Alfisols, Ultisols, Inceptisols
Brown forest 540 0.2 Karnataka, Maharashtra Mollisols, Inceptisols
Hill 2,262 0.7 Manipur, Odisha, WB, Tripura, Nagaland Inceptisols, EntisolsTerai 326 0.1 UP, Sikkim MollisolsMountain meadow 60 - J&K MollisolsSub-montane 104 - J&K AlfisolsBlack 54,682 16.6 MP, MS, Rajasthan, Puducherry, TN,
UP, Bihar, Odisha, AP, GujaratVertisols, Mollisols, Inceptisols, Entisols, Aridisols
Desert 26,283 8.0 Rajasthan, Gujarat, Haryana, Punjab Aridisols, Inceptisols, Entisols
Others* 28,305 8.6 -Total 328,700 100 -*Includes glaciers (0.4%), sand dunes (0.01%), mangrove swamps (0.04%), salt waste (0.01%), water bodies (0.1%), rock land (0.25%), and rock outcrops (7.8%). (MP) Madhya Pradesh; (MS) Maharashtra; (UP) Uttar Pradesh; (J&K) Jammu and Kashmir; (TN) Tamil Nadu; (AP) Andhra Pradesh; (ArP) Arunachal Pradesh; (WB) West Bengal; (HP) Himachal Pradesh; (A&N) Andaman and Nicobar Islands. (Source: Bhattacharyya et al. 2013).

23
will empower not only the farmers but also the policy makers, fertilizer dealers, and extension workers to make proper use of this knowledge in their planning as well as strategizing interventions in the given region.
Bhoochetana initiative in Karnataka provided an opportunity for extensive soil health mapping of the state, and the results were compiled for soil pH, EC, organic C, and other available macro and micro nutrients (Wani et al. 2011). The GIS-based maps (Figure E. 3) have delineated the sufficient and deficient regions at block levels, which are serving as a guide for fertilizer movement among the farmers, vendors, and extension agents. Using the mapping data, soil health cards were developed to transfer knowledge to the farmers regarding the soil fertility status and the fertilizer recommendations for important crops of the region (Figure E.4). The soil health Atlas for all the 30 districts is prepared, and the information on village-wise soil fertility status is available for use by the stakeholders (Figure E.5). The soil health cards system proved to be a very effective tool for scaling-out the soil test-based fertilizer management. The Bhoochetana initiative implemented by the state government of Karnataka with technical backstopping from ICRISAT-led consortium has undertaken complete soil health mapping of the whole state. A total of 92,000 soil samples were collected and analyzed.
Figure E.3. Soil map depicting sulphur status in different districts of Karnataka, India.

24
Figure E.4. Soil health card in Kannada language.
Figure E.5. Soil Fertility Atlas for plant nutrients for entire Karnataka.

25
Appendix F
Case Studies
Appendix F.1. - Exemplar scaling out of soil need-based fertilizer management with millions of smallholders in Karnataka
Name of the project: BhoochetanaKey partners: Govt. of Karnataka, ICRISAT, SAUs and farmersProject duration: 2009-2012 (First Phase), 2013- Present (Second Phase)Key problems: The importance of agriculture in Karnataka can be understood from the fact that it provides employment to about more than 60% people and directly contributes to GDP (by 18%). However, the current yield levels of rainfed agriculture are quite low compared to their potential levels. The stagnant to declining growth rate in agriculture during the years 2000 to 2008 necessitated actions to revive agriculture in the state. Due to the urgency of implementing such actions, the flagship initiative ‘Bhoochetana’ was implemented to increase crop productivity and strengthen agriculture-based livelihoods in the state.
Adoption of innovative solutions
Land degradation had become a rampant problem throughout the state as it threatened the livelihoods of small farmholders and the food security for the millions of poor. Thus, extensive soil mapping was initiated to reverse soil degradation. Soil mapping was adopted as an entry point activity to involve farmers in the process of rapport building and implementing the science-led development of agriculture for sustained and progressive benefits. The farmers were trained in soil sampling process, including the collection of soil samples with handholding support from experts. Soil sampling is the weakest link as even a small amount of soil can represent millions of tons of soil in the fields. An incorrect sampling can lead to inappropriate approaches toward the restoration of soil fertility. Thus a stratified soil sampling methodology was adopted in which about 25% representative (using GIS) villages were sampled. A target village was chosen and divided into three topo-sequences – upper, middle and lower. At each topo-sequence location, the samples were taken proportionately from small, medium and large farm-holding sizes to represent all the possible soil fertility variations as judged through soil color, texture, cropping system, and agronomic management. At the ultimate sampling unit in a farmer’s field, 8 to 10 cores of surface (0–0.15 m) soil samples were collected and mixed together to make a composite sample. With this methodology, 20–30 samples were collected that effectively represented a watershed of about 500 ha.
Impact
More than 100 thousand samples collected from the farmers’ fields in Karnataka were analyzed in the state-of-the-art laboratories. The results revealed that the mining of nutrients from the cultivated soils over the years has resulted in multiple nutrient deficiencies. Some of the micro and secondary nutrients had depleted below the critical limit’ (Figure F. 1.1) thus adversely affecting the nutrient and water use efficiency. Specific examples from the farmers’ fields revealed widespread deficiencies of micro and secondary nutrients like Zn, B, and S along with N and P whereas no deficiency of K was observed.
The soil mapping results indicated individual nutrient deficiencies that were scattered differently and provided a basis to develop soil need-based taluk (cluster of village/block) level new fertilizer recommendations compared to the state level ones. The new recommendations included the deficient nutrients such as S, B, and Zn, as well as N, P, and K. The recommendations indicated that the full dose of a particular nutrient should be applied if its deficiency was found in >50% of the fields in a block. Moreover, half dose of a nutrient should be applied if its deficiency was found in <50% of the fields. This approach was adapted to target optimum yields while considering the existing risks and infrastructure available in rainfed agriculture in the state.

26
The distribution of soil health cards indicating field status and recommendations enhanced awareness among the farmers and showed them the way forward. The mechanism of hiring and training led the farmers to disseminate their knowledge to fellow farmers, which proved to be effective in scaling out soil health rejuvenation. The arrangement of logistics for timely availability of inputs in the villages also helped the farmers.
With simple institutional arrangements, the improved fertility management practices were scaled out with >5 million farming families in the state covering >7 million ha during five years (2009-2013). The economic benefits were estimated to increase the net profit for the farmers by US$230 million (₹ 1,267 crores) by the end of 2012 (Table F 1.1.). Increased resilience during abnormal rainfall years was also recorded with soil test-based nutrient management.
Figure F. 1.1. Extensive micro- and secondary nutrient deficiencies in Karnataka.
Table F.1.1. Net benefits accrued due to Bhoochetana in Karnataka during 2009 to 2012.Year 2009 2010 2011 2012 TotalNet income (` in Crores) 11.49 204.81 599.45 451.80 1,267.60Net income (Million US$) 2.52 45.72 112.48 82.44 243.16Compiled by: Suhas P Wani, KL Sahrawat, K Krishnappa, Girish Chander, KH Anantha and G Pardhasaradhi
Inclusiveness
Bhoochetana is an exemplar model of inclusiveness in a consortium of knowledge generating and dissemination institutions for impact on ground. Knowledge generating institutions, such as SAUs, ICRISAT, and other agricultural research institutes, provided technical know-how while the state agricultural department acted as nodal agencies to implement the improved technologies. The policy reorientation to disseminate knowledge about soil test-based technology and ensuring timely and incentivized inputs for smallholders proved exemplar.
Lesson learnt
This success has resulted in a sound base and helped to start the growth process of agriculture in the state. It has won the confidence of farmers and has initiated a collective action of farmers with policy makers. It has also helped the knowledge-generating and knowledge-transforming institutions to up-scale their technologies not only for intensification but also diversification and development of allied enterprises across the value chain.

27
Way forward
Good soil heath is a basic requirement for strengthening agri-based enterprises. Therefore, this success story of soil mapping-based intervention is worth emulating in other parts of the semi-arid tropics (SAT).
ReferencesBhoochetana: Mission to enhance productivity of rainfed crops in Karnataka. Available at: http://10.3.1.36:8080/what-we-do/agro-ecosystems/Bhoo-Chetana/report.htm.
Soil Fertility Atlas for Karnataka, India. International Crops Research Institute for the Semi-Arid Tropics (ICRISAT), Patancheru, India, 2011.
Bhoochetana: Building Resilience and Livelihoods through Integrated Watershed Management. ICRISAT Research Program Resilient Dryland Systems Report No. 62, International Crops Research Institute for the Semi-Arid Tropics (ICRISAT), Patancheru, India.
Bhoochetana: Process Documentation - A program that helped farmers come out of low productivity and poor economic status. ICRISAT Research Program Resilient Dryland Systems Report No. 60, International Crops Research Institute for the Semi-Arid Tropics (ICRISAT), Patancheru, India.
Bhoochetana: Innovative Institutional Partnerships to Boost Productivity of Rainfed Agriculture in Karnataka, India. ICRISAT Research Program Resilient Dryland Systems Report No. 59, International Crops Research Institute for the Semi-Arid Tropics (ICRISAT), Patancheru, India.
Soil test-based balanced nutrient management for sustainable intensification and food security: case from Indian semi-arid tropics. Communications in Soil Science and Plant Analysis 46 (S1): 20-33.
Managing soil fertility constraints in market-led shift to high value agriculture for benefiting smallholders in the semi-arid tropics. Journal of SAT Agricultural Research 11: 1-11.
Compiled by: Suhas P Wani, KL Sahrawat, K Krishnappa, Girish Chander, KH Anantha and G Pardhasaradhi
Appendix F.2 - Soil test based nutrient balancing improved crop productivity and rural livelihoods: Case study from rainfed semi-arid tropics in Andhra Pradesh and Telangana, India
Name of the project: NAIP
Key partners: Central Research Institute for the Dryland Agriculture (CRIDA), Hyderabad, Indian Council of Agricultural Research (ICAR), Adilabad KVK, ANGRAU, WASSSAN, MARI, BIRD-BAIF, SAIRD, CWS, and AAKRUTI.
Project duration: 4 Years (2009-2012)
Key problems: Rural areas in Andhra Pradesh (India) represent a typical gloomy scenario of the rainfed semi-arid tropics. In Andhra Pradesh, agriculture contributes to about 20% of the GDP but provides employment and livelihood to more than 70% of the rural population. Agricultural development is feasible in these rainfed regions by upgrading agriculture with scientific knowledge to increase crop productivity and farmer income. An analysis of major rainfed crops in semi-arid regions in Andhra Pradesh revealed large yield gaps between farmers’ current yields and the achievable potential yields. The farmers’ current yields are 2–4 times lower than their potential yields. The historic trends show a growing yield gap between farmers’ practices (FPs) and farming systems with improved management. In the rainfed production systems, soil infertility is a major constraint for crop production and productivity enhancement and is a stumbling block for the utilization of the available scarce water. In general, little attention has been paid to the determination of the fertility status of farmers’ fields and the diagnosis of nutrient problems in the rainfed production systems. The information on the soil fertility status can help not only in enhancing crop productivity through balanced nutrient management but also promote judicious use of external inputs of nutrients. Various studies have found widespread deficiency of macro, micro, and secondary nutrients in the rainfed areas. On-farm trials in some regions of the Indian SAT have shown that non-

28
application of deficient secondary and micronutrients leads to significant yield losses, and such nutrient deficiencies apparently inhibit the realization of productivity potential in the SAT.
Adoption of innovative solutionsThe study sites include farmers’ fields in clusters (blocks) of 3 to 9 villages in 8 rainfed districts of Andhra Pradesh, India – Seethagondi cluster in Adilabad district, Pampanur in Ananthapur, B. Yerragudi in Kadapa, Tummalachervu in Khammam, Jamistapur in Mahabubnagar, Dupahad in Nalgonda, Ibrahimpur in Rangareddy, and Jaffergudem in Warangal district. The soil samples were collected from 826 farmers’ fields in the targeted clusters by following the farmer participatory stratified soil sampling technique and analysed for assessing the soil health. Based on the results of sample analysis and the variable soil fertility across the region, fertilizer recommendations were developed at the level of cluster of villages called block, a lower administrative unit in a district. Soil test-based recommendations were developed for all limiting nutrients, i.e., N, P, K, S, B, and Zn. Based on the soil test results, on-farm participatory trials were conducted using all prominent crops in the targeted clusters (blocks) to evaluate the effects of balanced nutrition in different rainy (June to September) and post rainy (October to January) season crops during the period of 2008-09 to 2011-12. For each test crop in the targeted cluster/district during a season, the trials were replicated in 3 to 15 farmers’ fields. Two treatment procedures were followed: (1) Farmers’ practice (FP, application of N, P, and K); and (2) balanced nutrition (BN, application of N, P, K plus S, B, and Zn). At maturity, the crop yield was recorded under both the practices.
ImpactSignificantly higher yields were recorded with soil test-based plant nutrition as compared with FP. In Adilabad, Khammam, and Warangal districts, the application of BN significantly increased cotton yield by 14 to 62%. In Ananthapur, Kadapa and Nalgonda districts, the application of BN increased groundnut yield by 11 to 102%. Similarly, the application of BN increased yields of castor (8 to 20%) in Mahabubnagar, sorghum (22%) in Adilabad, and cowpea (16%) in Rangareddy districts. Similarly, in post rainy season crops, the application of BN increased groundnut (post-rainy) yields over FP by 11 to 86%. Increase in productivity was also recorded in other crops such as chickpea (38 to 97%) in Adilabad, sunflower (27 to 61%) in Kadapa, green gram (50%) in Khammam, and maize (20 to 57%) in Warangal.
Pooled data for four seasons indicated low rainwater productivity with FP and varied in different districts: 1.2 to 2.4 kg mm-1 ha-1 for groundnut, 1.51 to 2.57 kg mm-1 ha-1 for cotton, 1.85 kg mm-1 ha-1 for sorghum, 1.76 kg mm-1 ha-1 for castor, and 2.84 kg mm-1 ha-1 for cowpea. Under BN, the RWUE in the targeted districts also increased: 1.71 to 3.19 kg mm-1 ha-1 for groundnut, 1.85 to 3.69 kg mm-1 ha-1 for cotton, 2.26 kg mm-1 ha-1 for sorghum, 2.11 kg mm-1 ha-1 for castor and 3.30 kg mm-1 ha-1 for cowpea.
An economic analysis showed viability of the BN technology for scaling-up at the farm level. The adoption of soil test-based BN in farms in the target districts brought additional cost of ₹ 1,400 to 2,150 ha-1. However, the additional benefits were far higher than the additional costs – ₹ 7,500 to 57,750 ha-1 in cotton, ₹ 3,360 to 18,375 ha-1 in groundnut (rainy), ₹ 7,500 ha-1 in sorghum, ₹ 5,460 ha-1 in castor, ₹ 4,000 ha-1 in cowpea, ₹ 3,640 to 32,760 ha-1 in groundnut (post-rainy), ₹ 12,980 to 18,040 ha-1 in chickpea, ₹ 500 to 10,750 ha-1 in sunflower, ₹ 5,000 ha-1 in green gram, and ₹ 7,400 to 17,800 ha-1 in maize. In simple terms, per rupee invested on balanced nutrition brought additional returns to the tune of ₹ 3.70 to 28.50 in cotton, ₹ 1.60 to 8.20 in groundnut (rainy), ₹ 3.50 in sorghum, ₹ 3.90 in castor, ₹ 1.90 in cowpea, ₹ 2.50 to 15.20 in groundnut (post-rainy), ₹ 6 to 8.40 in chickpea, ₹ 2.60 to 5 in sunflower, ₹ 3.60 in green gram, and ₹ 3.70 to 8.80 in maize.

29
An evaluation of soil health status after the 2010 rainy season crop (groundnut) harvest in Nalgonda district showed higher contents of soil organic C and available nutrients like P, S, B, and Zn in plots with BN as compared with FP. Improved soil fertility apparently accounted for additional residual benefits of 15 to 24% during postrainy season 2011-12, rainy season 2011, and rainy season 2010 with cotton crop in Warangal district.
InclusivenessThis initiative under NAIP is one the successful ventures for demonstrating the inclusiveness of on-farm impact-related initiatives. The research institutes like ICRISAT along with CRIDA and ICAR facilitated technical backstopping while NGOs like Adilabad KVK, ANGRAU, WASSSAN, MARI, BIRD-BAIF, SAIRD, CWS, and AAKRUTI facilitated linkages with farmers. The farmers willing to evaluate the technology on cost sharing basis were ensured of the seriousness of the business and sustainability of science-led interventions.
Lesson learntSoil fertility depletion due to low levels of S, B, Zn, P, and soil organic C has been recognized as the major biophysical cause of low crop productivity in smallholder farmers’ fields in SAT of Andhra Pradesh, India. A large number of on-farm trials have proved that the soil test-based balanced fertilizer management is an effective strategy for significant and economic crop productivity improvement to address the issues of food security and smallholders’ livelihood. Therefore, any program aimed at reversing the trend in declining agricultural productivity and improving farm livelihoods must begin with addressing soil fertility-related risks.
Way forwardA majority of the farmers and stakeholders are unaware of the widespread deficiencies of secondary and micronutrients like S, B, and Zn and do not include these nutrients in their fertilizer management practices. In absence of BN, farmers apparently lose 8% to 102% of current yield levels in season one and 15 to 24% in each of the succeeding three to four seasons. The smallholders in the rainfed SAT in India or elsewhere face difficulty in implementing the science-led strategy. Therefore, there is a strong need for desired policy orientation by the respective governments to promote soil test-based BN strategies through appropriate economic and technological support for poor smallholders. For large-scale impact on farmers’ fields, the building of awareness and convergence of different stakeholders like knowledge institutions, extension agencies, and input companies are other important issues that need to be addressed. The establishment of centralized district level state-of-the-art laboratories equipped to precisely diagnose the soil fertility constraints and design appropriate BN management strategies should also receive desired attention in all the SAT regions.
ReferencesSoil test based nutrient balancing improved crop productivity and rural livelihoods: Case study from rainfed semi-arid tropics in Andhra Pradesh, India. Archives of Agronomy and Soil Science 60(8): 1051-1066.
Improved crop productivity and rural livelihoods through balanced nutrition in the rain-fed semi-arid tropics. Resilient Dryland Systems Report No. 58, International Crops Research Institute for the Semi-Arid Tropics (ICRISAT), Patancheru, India.
Compiled by: Suhas P. Wani, Girish Chander, KL Sahrawat, SN Dixit and B Venkateshwarlu

30
Appendix F.3 - Balanced and Integrated nutrient management(INM) for enhanced and economic food production
Name of the project: SDTT
Key partners: Sir Dorabji Tata Trust, Mumbai; BAIF; DEEP; BYPASS and CARD.
Project duration: 5 Years (2007-2012)
Key problems: In SAT regions there are large yield gaps between the actual farmer’s practice yield and attainable yield. Soil degradation along with water scarcity is the main cause for low crop yields and inefficient utilization of existing water resources, resulting in low water use efficiency. Rainfed soils are multi-nutrient deficient and need proper nutrient management strategies to bridge the existing yield gaps. In view of observed deficiencies, the applications of major nutrients, such as N, P and K, as currently practiced is important for the SAT soils, but very little attention has been paid to the diagnosis and implementation of corrective measures for deficiencies of secondary and micronutrients in various crop production systems. Low soil organic C in SAT soils is another factor that contributes to poor crop productivity. Although tropical soils are often deficient in C and essential plant nutrients, a large quantity of carbon and nutrients contained in domestic wastes and agricultural byproducts are wasted. Such large quantities of organic waste can be converted into valuable manure, vermicompost (VC), through simple vermicomposting technique. VC can be used along with chemical fertilizers to cut cost and the use of chemical fertilizers.
Innovative solutions adoptedThe target eco-regions for this study include the dryland areas of Madhya Pradesh and eastern Rajasthan states in India. Agriculture is the predominant occupation and source of livelihood for rural people in these regions, and therefore, natural resource base is the lifeline of millions of rural poor. To diagnose soil fertility-related constraints, soil samples (9 districts of Madhya Pradesh and 4 districts of Rajasthan) were collected from farmers’ fields in target eco-regions by adopting participatory stratified soil sampling method. Based on soil analysis results and variable soil fertility across the region, the fertilizer recommendations were developed at the block level. Similarly, for emerged deficiencies of S, B and Zn, the per ha general recommendations of 30 kg S (through gypsum), 5 kg Zn and 0.5 kg B to be added once in two years evaluated and standardized earlier were also recommended at block level. It was recommended that the full dose of a particular nutrient should be applied if more than 50% deficient fields and half dose if less than 50% deficient fields in the particular nutrient. Participatory trials were conducted on farmers’ fields in the rainfed target districts of Rajasthan and Madhya Pradesh states of India during 2010 and 2011 rainy (June to September) seasons. The fields were selected based on the willingness of farmers to engage in participatory research to evaluate the scientific-based strategy and investigate those who had on-farm produced VC promoted as part of this study. Three treatment approaches were used and evaluated on new farms both during rainy season 2010 and 2011: (1) FP of application of N, P and K only, (2) BN comprising of FP inputs plus S + B + Zn, and (3) Integrated nutrient management (INM) i.e., 50% BN inputs + VC. The VC was prepared from on-farm organic wastes and cow dung. Rock phosphate, being a cheap source of P, was added at 3% of composting biomass to improve the P content in the compost. At maturity, the crop yields were recorded to evaluate the benefits. The responses to balanced nutrition along with improved varieties were also assessed in eastern Rajasthan compared to those under local cultivars.
ImpactIn Madhya Pradesh, soil test-based BN management significantly increased soybean productivity over FP, during 2010 (12 to 25%) and 2011 (14 to 16%). However, substitution of 50% of chemical fertilizers with VC in INM option, in general, increased yields further over the BN with nutrients applied solely through chemical fertilizers. Under INM, the soybean productivity increased by 18 to 50% during the year 2010 and by 17 to 24% during 2011 as compared with the FP. In contrast, the additional cost of INM (₹ 850 ha-1 to ₹ 1,150 ha-1) is less as compared with the BN (₹ 1,250 ha-1 to ₹ 2,200 ha-1). However, the net returns under INM (₹ 2,760 ha-1 to ₹ 8,540 ha-1) are far better than that under BN (₹ 690 ha-1 to ₹ 2,560 ha-1).
31
Similarly in Rajasthan, the BN brought a significant yield advantage over the FP by 15 to 40% in maize, 10 to 20% in pearl millet, 14 to 17% in groundnut, and 6 to 22% in soybean during 2010 and 2011. The INM recorded yields were either at par with or more than that under BN. An economic analysis showed the benefit to cost ratio of BN in the range of 1.59 to 4.28 for maize, 0.81 to 1.43 for pearl millet, 1.78 to 2.42 for groundnut, and 0.85 to 3.32 for soybean. While the benefit to cost ratio of INM was far better than BN viz. 4.59 to 8.24 for maize, 2.26 to 3.66 for pearl millet, 5.84 to 7.79 for groundnut, and 3.96 to 8.42 for soybean. The INM brought an additional net return over the FP by ₹ 5,083 ha-1 to ₹ 10,193 ha-1 in maize, ₹ 1,353 ha-1 to ₹ 3,858 ha-1 in pearl millet, ₹ 5,570 ha-1 to ₹ 7,810 ha-1 in groundnut, and ₹ 4,068 ha-1 to ₹ 10,188 ha-1 in soybean.
In Madhya Pradesh, plots with applied S, B, Zn, and VC in BN and INM during the rainy season 2010 also showed significant residual benefits during the succeeding post-rainy season 2010-11, rainy season 2011, and post-rainy season 2011-12. However, the benefits were more under INM. During post-rainy season 2010-11, wheat yields were higher by 12 to 26% and chickpea by 14 to 39% in the plots that received INM as compared to FP. Similarly, in the rainy season 2011, the soybean yields were higher by 9 to 33% under the INM managed plots as compared to FP plots. In the third consecutive season during the post-rainy season of 2011-12, INM-treated plots recorded higher yields by 5 to 10% in wheat and 7 to 19% in chickpea as compared to FP plots. In economic terms, INM strategy produced more food, worth ₹ 2,760 ha-1 to ₹ 14,040 ha-1 in wheat, ₹ 1,980 ha-1 to ₹ 10,340 ha-1 in chickpea, and ₹ 1,870 ha-1 to ₹ 6,120 ha-1 in soybean during each of three succeeding seasons. Similarly, in Rajasthan, the residual benefits of applied S, B, Zn, and VC as BN and INM in rainy season, 2010, were studied in succeeding post-rainy season wheat and chickpea crops. Wheat yield increased to 3,990 kg ha-1 under the BN and 3,850 kg ha-1 under the INM as compared with the 3,600 kg ha-1 under the FP. Similarly, chickpea yield increased to 1,720 kg ha-1 under the BN and 1,610 kg ha-1 under the INM as compared with the 1,500 kg ha-1 under the FP. The yield advantage under BN or INM was at par with each other. As such, the yield increases of 11 to 15% were recorded under the BN applied plots and 7% under the INM applied plots. The residual benefits were worth ₹ 4,680 ha-1 to ₹ 4,840 ha-1 under BN and ₹ 2,420 ha-1 to ₹ 3,000 ha-1 under the INM management strategy.
The results from eastern Rajasthan indicated that an integrated strategy of balanced nutrient management along with improved varieties can increase crop yields by 92 to 204% in maize, 115 to 167% in pearl millet, and 150% in groundnut.
InclusivenessThis initiative under SDTT is one the successful ventures to demonstrate inclusiveness in on-farm impact-related initiatives. The research institutes like ICRISAT facilitated technical backstopping while NGOs like BAIF, DEEP, BYPASS, and CARD facilitated linkages with farmers. The farmers willing to evaluate the technology on cost sharing basis were ensured of the seriousness of the business and sustainability of science-led interventions.
Lesson learntWidespread deficiencies of S, B, and Zn were diagnosed in the semi-arid regions in Madhya Pradesh and Rajasthan states in India. This should be considered by the farmers so as to include these deficient secondary and micronutrients in their fertilizer management strategies every alternate year. The apparent yield losses in the absence of soil test-based BN or INM practices are between 6 to 62% of current crop yield levels in the season-1 and between 3 to 39% in each of the next 3 succeeding seasons. The INM practice proved superior over the BN solely through chemical fertilizers in realizing either at par or higher yield levels while cutting use and cost of 50% of chemical fertilizers through effective recycling of on-farm wastes.
Way forwardThe on-farm evaluation results of this study suggest that there is a need to promote the use of deficient secondary and micro nutrients and VC in food production for higher productivity and net returns. The
32
use of VC for food production may be economical and practical only if it is produced on-farm from the available wastes. The smallholders in the rainfed SAT in India are unaware of soil health issues and available technologies and are not in a position to implement the science - led strategy of their own. Thus, there is a strong need for desired policy orientation by the respective governments to promote capacity strengthening and soil test-based INM and BN strategies through appropriate incentives for poor smallholders in the SAT regions in India.
ReferencesChander G, Wani SP, Sahrawat KL, Kamdi PJ, Pal CK, Pal DK and Mathur TP. 2013. Balanced and integrated nutrient management for enhanced and economic food production: Case study from rainfed semi-arid tropics in India. Archives of Agronomy and Soil Science 59(12): 1643-1658.
Girish Chander, Suhas P. Wani, Kanwar L. Sahrawat, Pal CK and Mathur TP. 2013. Integrated plant genetic and balanced nutrient management enhances crop and water productivity of rainfed production systems in Rajasthan, India. Communications in Soil Science and Plant Analysis 44: 3456-3464.
Chander G, Wani SP, Sahrawat KL and Jangawad LS. 2012. Balanced plant nutrition enhances rainfed crop yields and water productivity in Jharkhand and Madhya Pradesh states in India. Journal of Tropical Agriculture 50(1-2): 24-29.
Compiled by: Suhas P. Wani, Girish Chander, KL Sahrawat, DK Pal and TP Mathur
Appendix F.4 - Science-led interventions in integrated watersheds to improve smallholders’ livelihoods
Name of the project: APRLP & DFID; SABMiller India
Key partners: Central Research Institute for Dryland Agriculture (CRIDA), Acharya N G Ranga Agricultural University (ANGRAU), National Remote Sensing Agency (NRSA), Drought Prone Area Programme (DPAP) [now District Water Management Agency (DWMA], Department of Agriculture (DOA), PIAs, APRLP Programme Support Unit (PSU) and ICRISAT
Project duration: 3 Years (2002-2004) for APRLP and DFID; (2009-2012) for SABMiller
Key problem: In India, rainfed agriculture constitutes 67% of the net cultivated area and is the hot spot of poverty and malnutrition as it was bypassed during the green revolution era in 1960s. Researchers and policy makers have now realized the importance of rainfed agriculture to meet the increasing demand for food, which would continue to rise with the growing population that is expected to reach 1.6 billion by 2050 and also to uplift socioeconomic conditions of the farmers. Integrated watershed management is recognized as a potential engine for agricultural growth and development in fragile and marginal rain-fed areas in India. Currently, rainfed agriculture suffers from a number of biophysical and socioeconomic constraints, which limit the productivity of crops. There is an urgent need to understand and break the unholy nexus of drought, land degradation, and poverty for improving livelihoods and food security through sustainable intensification of natural resources using science-led, holistic watershed scale development approach. Increasing mining of nutrients leading to land degradation was identified as a major problem in the watersheds.
Innovative solutions adopted
The present study was conducted in selected watersheds in Andhra Pradesh (AP), India implemented by ICRISAT-led consortia in the areas of soil, water, crop, and nutrient management. The nucleus watershed served as the learning site, where farmers conducted experiments with technical backstopping from consortium partners. Under APRLP and DFID, the nucleus watersheds in AP were surrounded by 40 satellite watersheds. While under SABMiller India initiative, the watershed villages namely Fasalvadi, Sanga Reddy mandal and Venkatakishtapur, Shivampet, and Chakriyal in Pulkalmandal were considered as study sites.

33
In addition to water shortage, soils in rainfed agriculture are also degraded, and leading to inefficient utilization of existing water and realization of productivity potential. Therefore, to diagnose soil related constraints, the soil samples were collected from the farmers’ fields by participatory stratified soil sampling method and analyzed at ICRISAT. The effects of individual applications of deficient S, B or Zn as well as the conjoint application of S, B and Zn along with farmers’ practice (of adding sub-optimal N and P) were evaluated in the watersheds. As farmers in target watersheds add sub-optimal amounts of N and P fertilizers, therefore, another treatment comprised of deficient S, B, Zn, N, and P.
Impact
The farmer participatory trials with maize, groundnut, mungbean, and sorghum in watersheds in Andhra Pradesh showed that the application of S over the farmers’ practices increased crop productivity by 12 to 33%, the application of B increased it by 20 to 33% while the application of Zn increased by 27 to 47%. The conjoint application of S, B and Zn along with farmers’ practice increased the productivity by 48 to 62%. However, the application of S, B and Zn along with the recommended levels of N and P recorded the highest productivity improvement (70 to 119%) over the farmers’ practice of sub optimal N and P.
In economic terms, the application of S alone through gypsum brought additional per ha net returns of ₹ 3,700 to ₹ 13,640. Similarly, individual applications of B through borax or Zn through zinc sulphate recorded per ha additional net returns of ₹ 3,900 to ₹ 11,040 and ₹ 6,450 to ₹ 18,480, respectively, depending on the crop. The conjoint application of S, B, and Zn over the farmers’ practice resulted additional net returns of ₹ 8,400 to ₹ 21,560. Farmers used to apply sub-optimal amounts of N and P in the watersheds, and thus. another practice of application of S, B. and Zn along with the recommended levels of N and P resulted the highest increase in net returns over the farmers practice by ₹ 16,050 to ₹ 28,160.
Similarly, participatory on-farm trials on soil test-based application of deficient Zn, B, and S along with N and P in SABMiller watershed during 2009 to 2012 significantly increased crop yields over farmers’ practice (FP)—by 31 to 45% in chickpea, 15 to 16% in cotton, 12 to 15% in paddy, and 8 to 9% in sugarcane. Also, the total soluble sugars in sugarcane under BN increased by 13%. Residual benefits of S, B, and Zn were observed in succeeding chilly crop (12% higher yield). Benefit to cost (B:C) ratios of BN ranged between 2.8 to 8.5 in chickpea, 2.6 to 4.4 in cotton, 2.3 to 2.9 in paddy, and 7.1 to 11.4 in sugarcane, indicating economic feasibility for scaling-up.
Inclusiveness
These initiatives under APRLP and SABMiller are one the successful ventures for demonstrating inclusiveness of on-farm impact-related initiatives. The research institutes like ICRISAT facilitated technical backstopping while NGOs like READ facilitated linkages with farmers. The farmers were willing to evaluate the technology on cost sharing basis when they were ensured of the seriousness of the business and sustainability of science-led interventions.
Lesson learnt
In context of ensuring food security for burgeoning population, and irrigated regions in India having reached productivity plateau, rainfed regions with large yield gaps between farmers’ yields and potential yields have come in the centre stage. In such regions, the management at watershed scale is one of the most trusted approaches to manage rainwater and other natural resources. In addition to water, deficiencies of multiple nutrients like S, B and Zn along with N and P are holding back the realization of achievable yields. Farmer participatory trials in watersheds showed huge benefits in crop productivity by 70 to 119% through adopting soil test-based fertilizer management. In watersheds in Chitradurga district in Karnataka, the results showed a significant increase in sunflower yield with improved cultivar (KBSH 44) as compared with farmers’ local cultivar. However, the improved cultivar alone was not sufficient to harness achievable yields in the depleted soils. Improved management also improved productivity over farmers’ practice by 32%, but it is also not enough to bridge yield gaps with low responsive crops. The best bet comprising improved cultivar, landform, and soil test-based balanced nutrition recorded highest yield (182%) improvement and thus, is the way forward to bridge the yield gaps in the watersheds.

34
Post-harvest soil analysis in paddy, chickpea, and sugarcane crops showed better soil health under the balanced nutrient management treatment as compared with the FP. These results clearly demonstrated that for sustained increase in productivity, produce quality and better soil health, not only major nutrients such as N and P, but also nutrients such as S, B, and Zn should be applied to the SAT regions.
Way forwardScience-led interventions in watersheds showed a way to abridge yield gaps by 12 to 100%. Improvements in straw yield also boosted animal-based activities leading to improved milk production and incomes. Improved productivity and incomes also brought social stability as evident from the alleviation of migration in the watershed regions. Thus, there is a requirement of the desired policy orientation to support poor farmers to implement science-led watershed interventions so as to upgrade rainfed agriculture.
ReferencesScience-led interventions in integrated watersheds to improve smallholders’ livelihoods. NJAS- Wageningen Journal of Life Sciences (Available online at): http://authors.elsevier.com/sd/article/S1573521414000396.
Chennamaneni SR, Wani SP, Chander G and Sahrawat KL 2014. Balanced nutrient management for crop intensification and livelihood improvement: A case study from watershed in Andhra Pradesh, India. Communications in Soil Science and Plant Analysis 45: 2515-2528.
Compiled by: Suhas P. Wani, Girish Chander and KL Sahrawat
Appendix F.5 - GPS and GIS based model soil fertility maps for selected districts for precise fertilizer recommendations to the farmers of West Bengal, India
Key partners: DAC, IISS and BCKV
Project duration: 2011-2013
Key problems: Agriculture plays an important role in livelihood security of about 65% population of West Bengal and thereby, contributes significantly in the State’s GDP. However, the productivity of many crops is stagnant or declined due to various problems including widespread deficiency of nutrients in soils leading to deterioration of soil health/quality. This needs serious attention. Thus, DAC initiated the project through AICRP-STCRC, IISS, Bhopal at Bidhan Chandra Krishi Vishwa Vidyalaya (BCKV), Kalyani, West Bengal to increase crop productivity and strengthen agriculture-based livelihoods in the state of West Bengal.
Innovative solutions adopted The deterioration in soil health is a serious issue throughout the state that threatens the livelihoods of the small farmholders as well as food security for millions of poor. Therefore, extensive soil mapping was initiated to reverse the soil degradation. Soil mapping was adopted as an entry point activity to involve farmers in the rapport building process and implement the science-led development of agriculture for sustained and progressive benefits. The most important part of soil mapping is the soil sampling. A stratified soil sampling methodology was adopted to take care of the issue. The state of West Bengal is one of the most important agriculturally developed states in the country. It covers an area of 8.87 million ha, representing 2.7% of the total geographical area of the country. The GPS-based random soil sampling was done from the block level of nine districts of West Bengal. Under this methodology, about 25% representative (using GIS) villages were sampled. Six soil samples from each village were collected from field of two large-holder farmers (>3ha), two medium-holder farmers (1-3 ha) and two smallholder farmers (<3 ha). In each farmer’s field, the composite soil samples were collected by mixing 8 to 10 cores of surface (0 to 0.15 m) soil samples. Soil fertility status was monitored, and NIV was categorized following the range (<1.5 - >2.5) for soil nutrients.

35
The impactMore than 5000 soil samples were collected from farmers’ fields in 934 villages (120 blocks) across 6 districts (North 24 Parganas, Hugli, Bankura, South Dinajpur, Murshidabad and Bardhaman) of West Bengal. These samples were analyzed in state-of-the-art laboratories of Bidhan Chandra Krishi Viswa vidyalaya. The results available for Bankura district showed that most blocks were low in soil organic C, available N, available S; and medium in available P but deficient in B. No deficiency in K and micronutrient cations (Fe, Mn, Zn and Cu) was observed.
Soil mapping indicated that the individual nutrient deficiencies were scattered differently and provided a basis to develop soil need-based block (cluster of village/block) level fertilizer recommendations compared to blanket recommendations. The analysis results provided basis to include deficient S and B along with NPK and cut costs of K fertilizers in fertilizer management practices.
The distribution of soil health cards that indicated field status and recommendations enhanced awareness and showed way forward to farmers. Hiring and training led the farmers to disseminate knowledge to fellow farmers; this was effective in scaling up the process of soil health rejuvenation. The logistic arrangement for inputs in the villages proved to be a key in the timely and easy accessibility to inputs by farmers.
Integrated/inclusivenessThis project is a perfect example of inclusiveness in a consortium of knowledge generating and dissemination institutions for impact on ground. Knowledge generating institutions like DAC, ICAR, SAUs and other agricultural research institutes provided technical know-how while state agricultural departments acted as a nodal agency to implement the improved technologies. The policy reorientation to disseminate knowledge about soil test-based technology and ensuring timely and incentivized inputs for smallholders proved exemplar.
Lessons learnt from this approachThe soil fertility maps not only helped the farmers to save their valuable input resources such as fertilizers but also helped to keep the soil healthy, which increased the productivity of the crops to feed the ever-growing population of the state. This success has put a sound base and increased the growth in crop/land productivity in the state by winning confidence and initiating collective actions of farmers with policy makers, knowledge-generating and knowledge transforming institutions so as to up-scale technologies not only for the intensification but also diversification and development of allied enterprises across the value chain.
The way forwardAs good soil heath is the foundation of increasing productivity of crops, such success story of soil map-based intervention bring farmers on board is worth emulating in other parts of the state/country for making farming a profitable and sustainable enterprise.
Contributed by: B Mandal from BCKV

36
Appendix F.6 -Soil health mapping in different districts of Vidarbha using GPS and GIS
Key partners: Dr. PDKV, Akola, MS, ICAR-IISS, Bhopal.
Project duration: 2010-2013
Key problems The Vidarbha region in Maharashtra is characterized by agriculture involving capital intensive cultivation of crops like cotton coupled with diverse crops and cropping systems. The present research work has been carried out with an emphasis on assessing the geo-referenced current soil fertility status. Soil testing is an efficient tool for monitoring soil health and achieving balanced fertilization to the crops by making soil test-based sound fertilizer recommendations. The increased productivity makes a heavy demand on plant nutrients in the soil and results in the rapid mining of nutrient resources of the soil unless regularly replenished. Therefore, the logical replenishment of the soil fertility should be based on soil test data. As much as 95% area in Vidarbha is rainfed and the current yield levels of rainfed crops are quite low compared to the potential levels. Stagnant to declining growth rate in agriculture has necessitated the need to take actions to revive agriculture in the region.
Nutritional stress in plants results from nutrient imbalances in the soil that can emanate from inadequacy of one or more nutrients. Nutrient imbalance may also arise from the presence of an excessive amount of a nutrient element that hinders another nutrient in performing its normal metabolic functions. Therefore, a balanced supply of each nutrient in relation to plant growth is essential for obtaining normal yield and quality of produce.
Innovative solutions adoptedThe consequences of soil health decline are very alarming and have been observed to cause serious decline in crop productivity. This has also resulted in an acute deficiency of secondary and micronutrients in the Vidarbha region. The geo-referenced soil fertility status has been assessed in various districts by using GPS. The soil samples were collected using stratified random sampling from each targeted villages. From each village, six farmers were selected based on the land holding, and the soil samples were collected from small, medium and large groups of land holdings. The ultimate sampling unit was farmers’ field; 8 to 10 cores of surface (0–0.20 m) soil samples were collected and mixed together to make a composite sample. The collected soil samples from each district were processed and analysed in the laboratories in the Department of Soil Science.
ImpactThe initiative generated useful information as under;
• Most of the soils in Bhandara district under prevailing high rainfall areas are acidic (37%) to neutral (36%) with very low electrical conductivity.
• The problems of calcareousness and iron deficiency is less intense in Bhandara district.• Soils of Akola district showed acute deficiency of phosphorus while the problem is less intense in
Buldhana and Yavatmal district.• More than fifty percent (52.7%) soils in Amravati district are highly calcareous.• The soils in Amravati district are alkaline with more than 77% samples in alkaline range.• The problem of zinc (43.3%) and iron (47.8%) deficiency is more acute in soils of Amravati district.• Soils in Chandrapur district are acidic to neutral with less problem of calcareousness (4%).• The extent of zinc deficiency is quite variable in various districts of Vidarbha. Most widespread
deficiency of zinc was observed in Akola (70%), Yavatmal, (68%), and Buldhana (64%), followed by Washim (43%) and Amravati (43%) districts.
• The extent of sulphur deficiency is quite variable in various districts of Vidarbha. It is relatively higher in Amravati (48%), Chandrapur (42%), Akola (32%), and Washim (31%).
• The boron deficiency was observed in soils of Wardha (22%), Bhandara (16%), Akola (15%), and Washim (17%).

37
• About 80% soils in Akola district are marginal to low in sulphur status, indicating the emerging deficiency of sulphur.
• The most severe deficiency of iron was observed in Amravati district (47%) followed by Washim, Akola, and Wardha districts.
• Decline in organic carbon content of the soils in Akola district was observed, and more than 80% soils have low (35%) to moderate (49%) organic carbon.
• Nearly half the soils (49%) were found highly calcareous in Yavatmal district.• The organic carbon status is relatively good in Washim district as compared to Akola, Yavatmal, and
Buldhana districts.• Nearly 90% soils of Amravati district had low to moderate organic carbon status.• The soils of Western Vidarbha particularly in Akola (73%), Amravati (25%), Yavatmal (49%), Buldhana
(48%), and Washim (45%) are highly calcareous as compared in Bhandara and Chandrapur districts.• Almost all the soils in different districts of Vidarbha have acute deficiency of nitrogen to the extent of
more than 90%, which warrants urgent attention for its replenishment.
Integrated/inclusivenessThe knowledge generated under this project pertaining to soil health sustenance and nutrient management strategies for sustainable agriculture in Vidarbha by inclusiveness in a consortium and dissemination institutions for impact on ground. Knowledge generating institution like Dr. PDKV, Akola IISS, Bhopal, and ICAR provided technical know-how. The policies were reoriented to disseminate knowledge about soil test-based technology while ensuring timeliness. The knowledge that emerged from this study has been communicated to state Department of Agriculture for the development of policies in the state. The knowledge gained has also been disseminated to the farming community through KVK’s and state extension personnel. This knowledge has also been disseminated through mass media through mass media, newspapers, radio, and TV programmes.
Lessons learnt from this approach An assessment of current fertility status based on georeferenced survey of soils in different districts of Vidarbha, revealed a severe deficiency of nitrogen (more than 90%), phosphorus (34 to 90%), followed by sulphur (5 to 56%). This indicated multi-nutrient deficiency in the soils. This is further aggravated by the emerging deficiencies of potassium, iron, and boron. Thus, there is a need to refine the limits and categorization of potassium on the basis of its availability in the soils.
The way forward Good soil heath is the basic requirement for strengthening agriculture. The success story of soil fertility mapping-based intervention is worth emulating in similar areas of the state. The Maharashtra state government has implemented the scheme for farmers in the state to supply zinc and iron fertilizers on 50% subsidy based on the soil test. The nutrient management strategies for primary, secondary and micronutrients need to be executed on a priority basis to sustain the soil
health by regular inclusion of FYM, crop residue management, composting, green manuring, vermin-composting, etc. Comprehensive training programmes for advanced technologies of soil and nutrient management, production of organic inputs, remote sensing, precision nutrient management are also needed to be organized for extension personnel. The KVK’s and NGO’s also need to be trained for soil testing and providing soil health cards to the farmers. Awareness programmes for farmers through field days, exhibitions, radio/ TV programs, and front line demonstrations need to be executed properly. The strengthening of soil testing laboratories by appointing trained scientific and technical staff is also needed. There is also a requirement of subject matter specialist in all soil testing laboratories who can guide the farmers on soil health and nutrient management strategies. Need-based fertilizer grades for particular crops and region is also required to be manufactured.
Contributed by: VK Kharche, RN Katkar, DB Tamgadge and P Dey
38
Appendix F.7 – Soil health cards development for convergence into Kuppam agricultural action plan
Name of the Project: Soil Health Cards Development For Convergence In To Kuppam Agricultural Action PlanKey partners: ANGRAU, Regional Agricultural Research Station, Tirupati, Department of Agriculture and farmersProject duration: 2014-2015Key Problems: The state of Andhra Pradesh is contemplating to develop a comprehensive agricultural action plan that duly incorporates various aspects of soils, water, climate, and agricultural inputs like fertilizers, pesticides, as well as socio-economic strata of farming communities, so as to enable the overall development of each and every segment of the state. The model envisaged is to take consideration of the various initiatives taken up by the Gujarat Government in the recent past wherein tools like remote sensing and GIS are extensively used as decision support systems for planning and execution of agricultural activities in the state. For this purpose, Kuppam area has been chosen as an example of how to develop this kind of action plan by developing various layers of information mentioned above and to implement the same as pilot project. The preliminary survey information indicates that the soil health status report available for the area of study is limited. However, for comprehensive agricultural action plan, it is essential to generate the soil health/nutrient availability status of as many samples as possible to reflect the actual soil conditions so as to recommend fertilizers for various crops in the area of study. This detailed information is needed to be synergized into a complete agricultural action plan in the GIS environment that will be prepared and implemented.
Innovative solutions adopted:The entire quality of soil testing results and fertilizer recommendation depends upon soil sampling. Each sample collected must be a true representative of the area being sampled. The accuracy and utility of the results obtained from the laboratory analysis depends on the sampling precision. For achieving this, the following scientific norms are followed.
The Kuppam assembly constituency consists of four mandals viz., Kuppam, Ramakuppam, Gudipalli, and Shantipuram. A total of 32 agricultural polytechnic diploma holders were engaged for collecting the soil samples. These people were categorized into four groups of eight members each. Each group was lead by a post graduate in collecting soil samples under the supervision of a Soil Scientist who supervised the soil sampling process of each mandal. The total cultivable area in the constituency is 49,732 ha with 55,451 land holdings. A total of 3,906 soil samples were collected at the rate of one sample for 10 ha. This sample collection depended on the variation in the soil and cropping patterns so as to include all soil and farming situations. The latitudes and longitudes of sample sites were recorded using GARMIN etrex 10 GPS.
The samples were transferred to soil testing laboratories and analyzed for color, texture, pH, and EC. All the major and micronutrients were also examined following standard procedures under the supervision of the soil scientists of Research Station of ANGRAU. Soil health cards were prepared that included all data of the soil sample and recommendations of crops to be grown, fertilizers and quantity to be applied, amendments for problem in such soils based on soil test results. Adhaar card number of farmers, their mobile numbers and GPS coordinates were also given in the soil health card for future reference. All the 3,906 health cards were distributed to the respective farmers by conducting Farmer–Scientists interaction meetings at Kuppam Assembly constituency and explaining them the importance of and usage of Soil Health Card. Analytical data was transferred on to the GIS environment, and soil nutrient thematic maps were prepared.
A team of 20 scientific expert committees involving Agriculture and Horticulture University conducted a detailed survey and prepared agriculture action plan for the assembly constituency. This action plan was very informative and will be useful for policy makers for decision making.

39
Impact:The detailed analysis of 3,906 soil samples of Kuppam Assembly Constituency indicated that 98.7% of samples are low in available N, 65% of soil samples are high in available P, 41% are low in available K, 28% are deficient in Zn, and 46% are deficient Fe (Figure F.7.1). Based on the soil test values, the fertilizer recommendations were given for 16 major crops of the constituency in the health card. The results were thoroughly interpreted by considering the fertilizer usage in the Kuppam Constituency from Department of Agriculture, Chittoor District. The following recommendations were given to the Government of Andhra Pradesh.
There is a scope,
• To add 25.87% nitrogen nutrient to improve productivity by 15%.
• To save P fertilizers worth ₹ 57.32 lakh only on P nutrient without a reduction in productivity.
• To add 56.33% more K nutrient to crops of Kuppam assembly constituency; this will improve productivity and quality of crops by 12%.
• To improve productivity by 10% through correction of Zn and Fe deficiencies.
Inclusiveness:This pilot project involved experts from ANGRAU, YSRHU, APSRAC, Department of Agriculture, and the farmers. The Department of Soil Science, Regional Agriculture Research Station, Tirupati was completely responsible for implementing the prestigious pilot project. The Department of Agriculture, assisted in soil survey, sampling, and distribution of health cards to the farmers. The data was transferred to GIS who prepared soil nutrient thematic maps with the expertise of APSAC, Hyderabad.
Lesson learnt:It is expected that this information would be converged in the comprehensive action plan for the development of agriculture in a given area; for example, Kuppam in this context. The same needs to be upscaled for the entire state of Andhra Pradesh.
Contributed by: TG Krishna and A Padmaraju
Figure F.7.1. Soil available nitrogen status of Kuppam assembly constituency.

40
Appendix F.8 – Computer and mobile phone decision support tools for increasing net income of farmers in cereal systems in South Asia under Cereal System Initiative for South Asia (CSISA)
Key partners: IRRI, CIMMYT, OUAT, NRRI, farmers
Project duration: Jan 2012 in CSISA-Phase II
Key problems: In Odisha and across South Asia, fertilizer recommendations are made based on blanket recommendations and do not reflect the differences in indigenous soil fertility, prevailing crop management practices, yield responses, or attainable yield potential across sites or years. The existing approaches for improving this scenario through soil testing or STCR approach have proven to be too costly or difficult to extend to a large numbers of farmers. Crop management over the past four decades in Asia was driven by the increasing use of external inputs and blanket recommendations for fertilizer use over wide areas. However, the future gains in productivity and input-use efficiency will require soil and crop management technologies that are more knowledge-intensive and tailored to the specific characteristics of individual farms and fields (Dobermann and White 1999).
Innovative solutions adopted The original concept for site-specific nutrient management (SSNM) was developed in 1996 (Dobermann et al. 1996, Dobermann and White 1999) and have been tested on 205 irrigated rice farms in China, India, Indonesia, the Philippines, Thailand, and Vietnam since 1997. In the approach described here, SSNM was a general concept for optimizing the supply and demand of nutrients according to their variation in time and space. An important part of field-testing was to continuously collect data that could be used to improve the approach. By making use of the availability of this expanding database, SSNM was refined in recent years by integrating different approaches for determining P and K requirements. For fields without certain yield gain, fertilizer K and P needs can be determined by a partial maintenance approach (i.e., fertilizer input<output in nutrient balance). This approach considered nutrient supply mediated through soil processes and balanced trade-offs between financial loss with full maintenance rates and risk of excessive nutrient depletion without nutrient application. When yield gains to an added nutrient are certain, partial maintenance plus yield gain can be used to determine fertilizer requirements. The SSNM-based approach and algorithms enable rapid development of field-specific K and P management recommendations (Buresh et al. 2010). The concept and framework for Rice Crop Manager was developed by IRRI. The nutrient management guideline provided by Rice Crop Manager is based on the principles of SSNM, as developed for rice through partnerships of IRRI with national agricultural research organizations in Asia. The Nutrient Manager for Rice developed by IRRI in 2008-2010 provides the SSNM-based, nutrient management component in Rice Crop Manager. The Rice Crop Manager developed by IRRI in 2013 for the Philippines and Bangladesh provides the framework for the crop management decision-making logic used in the Rice Crop Manager for Odisha (http://webapps.irri.org/in/od/rcm/). Experts from OUAT, NRRI, and DOA contributed towards further modification and refinement of the RCM.
The tool includes both web-based and mobile Android application with a simple, user-friendly interface providing personalized fertilizer guidance for small-scale farmers and extension workers. The farmer has to provide information about their fields by responding to a set of 12-15 brief questions about field location, planting method, seed variety, typical yields, choice of fertilizer, method of harvesting and other factors. With mobile phone and internet penetrating fast in rural India. India has 110 million mobile internet users of which 25 million are in rural India – these ICT-based tools, especially in future, will serve as a useful platform to impart knowledge to the farmers easily and at the time when they need it. Initiatives like Digital India and Soil Health Scheme lay a big opportunity for these tools.
The impactRice Crop Manager was adapted, evaluated, and verified for rice cultivation in Odisha through collaboration of IRRI with the Odisha University of Agriculture and Technology (OUAT) and the National Rice Research Institute (NRRI) during 2012 to 2015. Till date a number of nutrient omission plot technique

41
(NOPT) trials and RCM evaluation trials have been conducted in eleven districts of Odisha (Puri, Bhadrak, Mayurbhanj, Dhenkanal, Koraput, Sundergarh, Sambalpur, Kendrapara, Keonjhar, Jajpur and Balasore (Figure F. 8.1)). Initial results have shown comparative advantage of using Rice Crop Manager as a tool for providing site-specific nutrient and crop management advisory to the farmers. The development of Rice Crop Manager was made possible through support from the Cereal Systems Initiative for South Asia (CSISA), funded by the Bill & Melinda Gates Foundation and the US. Agency for International Development
In Odisha, the national partners have been effectively mainstreamed into the development and evaluation of Rice Crop Manager through CSISA efforts. On-farm evaluation of the Rice Crop Manager has been completed in collaboration with OUAT and CRRI. Till date, a number of NOPT trials have been completed (Figure F.8.2). The results from NOPT trials has been compiled and analyzed for developing updated CM for wider deployment. The data compiled by OUAT on soil mapping was used to identify the variation in soil nutrient status across sites, and the information was used to strategically locate and conduct the NOPT trials. The data indicated yield gain with additional P and K application in some districts of Odisha.
The pilot testing of dissemination pathway for RCM through the national system was initiated through a pilot program with KVK, Bhadrak in partnership with Department of Agriculture, Bhadrak and Reliance foundation. A series of workshops were conducted to sensitize the new partners and to share the results of evaluation trials with the existing partners. Initial results indicate benefit of using RCM either due to increase in yield, or decrease in fertilizer use or a combination of both (Figure F.8.3-a, b and c). The Odia version of RCM has been developed and uploaded. The dissemination program has expanded in Kharif 2015 to 10 more districts of Odisha (Balasore, Bhadrak, Cuttack, Dhenkanal, Jagatsinghpur, Kendrapara, Khordha, Mayurbhanj, Puri, and Sambalpur). The Department of Agriculture has taken an initiative to disseminate RCM recommendations in the BGREI districts. The dissemination will take place in three steps: creating awareness, giving recommendations, and evaluation of the tool for farmers’ responsiveness.
Integrated/inclusivenessThe program is highly inclusive with respect to the development of the tool and dissemination. Experts from national institutes like OUAT and NRRI and CGIAR institute like CIMMYT provided technical support for developing the content and logic of the decision tool conformant to Odisha conditions. In addition,
Figure F. 8.1. Districts covered for Rice Crop Manager evaluation.

42
the state agriculture department along with ICAR KVKs acted as nodal agencies to disseminate the recommendations generated through RCM to the farmers.
Lessons learnt from this approachThe positive results received during the pilot initiatives paves a way for future success of the web and mobile-based decision tools on precise nutrient and crop management for improving the livelihoods of Odisha farmers. With increase in mobile services and extension of internet services to rural areas, there lies a big scope for success of such tools for knowledge dissemination to the right people at the right time.
The way forwardIt is an exemplar idea on how the data generated on soil health mapping can be effectively used to provide farmers with field specific fertilizer and crop management at the right time using recent advances in ICT. The tool has a flexibility of incorporating various advances in knowledge and to bring in a paradigm shift in how knowledge is disseminated. GOI schemes like Soil health program give an opportunity for making the best use of the data generated from soil tests and for the development of a web-based tool as an alternative method of providing field specific nutrient and crop management. While recent initiative of GOI on Digital India paves the way for the tool to reach a large number of farmers in the future with fertilizer and crop management information at the time needed by the farmer.
Figure F.8.2. NOPT trials in farmer’s field.
Figure F.8.3. Results of field evaluation of RCM evaluation w.r.t grain yield (a), total fertilizer used (b) and added net benefit through RCM (c) under various treatments.
Contributed by: Sheetal Sharma
43
Appendix F.9-Increasing the water productivity in rice-wheat/ vegetable-pea system in hills through integrated nutrient management practices
Name of the project: FPARP
Key partners: GBPUA&T, Pantnagar and farmers
Project duration: 2007-2010
Key problems: The state of Uttarakhand has undulating terrains, and the absence of pragmatic methodology of water harvesting and water management leads to excessive soil erosion, resulting in acute shortage of water for irrigation and loss of nutrients. The erosion turns the soil less fertile and low in soil organic matter, resulting in poor water holding capacity vis-à-vis reduced water and nutrient use efficiency. Due to these constraints, the soil health has deteriorated and thus, farmers are not in a position to harvest its potential. Most of the farmers are small landholders; hence, due to the timely unavailability and poor purchase power of the farmers, fertilizers are rarely used. Similarly, another input i.e., FYM, a major source of nutrient, is not managed properly by the farmers, resulting in its poor quality. This causes the deficit of nutrient supply for potential yields.
The soils of Bhabharand hills are mainly alluvial soil mixed with boulders and are thus unable to hold sufficient moisture for supporting crop productivity and biomass synthesis. Due to the high infiltration rate, particularly in Bhabhar, the soluble nutrients (N, S) and other soluble components contributing to productivity get leached from the root zone and contribute to the deterioration of surface and ground water quality.
Uttarakhand, being an organic state by virtue of meager use of green revolution technologies (nutrients, pesticides etc.,) has ample scope for use of various technologies viz., vermicomposting, scientific management of FYM, bio-agents etc as the components of integrated nutrient management for balanced nutrition. These techniques have a great potential in hill agriculture for improving the soil health and sustaining the crop productivity.
Another constraint accompanied with balanced nutrient supply holding the productivity in Uttarakhand is the low availability of good quality seed. The farmers generally do not buy/change the seeds, and the use of the old seeds from the previous harvest is a common practice in a majority of the districts of the Uttarakhand.
Innovative solutions adoptedIn the light of above issues, a total of 21 villages in two districts (Nainital and Pauri) of Uttarakhand were selected for fine tuning, demonstrations, and capacity building in the area of IPNMS, organic nutrient management etc. for enhancing crop and water productivity. Agriculture is the mainstay and source of livelihood for rural people in Uttarakhand, and therefore, quality soil and natural resource, is pivotal of their sustenance. To diagnose soil fertility-related constraints, soil samples were collected from farmers’ fields in the target area by adopting participatory soil sampling method. Based on the soil analysis results, surveys, and interactions with farmers, the following agro technologies were fine-tuned for the area and demonstrated for two years with the technical backstopping of the team consisting of multidisciplinary scientists of the university.
• Scientific management of FYM. • Vermi-compost technology.• Concept of seed bank at village level.• Integrated Nutrient Management (INM) Practices.• Nutrient supply through organic sources.• Biofertilizer and bioagent technology.

44
ImpactThe farmers were made aware of the importance of management of FYM and preparation of vermicompost through capacity building training. They came forward to prepare the FYM and/ or vermicompost on their own. Similarly, they got convinced through demonstrations and capacity building programmes about the role of quality seeds in productivity. The breeders’ seed provided was maintained by the farmers and also a few farmers kept the seed collectively for future use. In rice, the INM package comprising the full dose of N (hills)/ 50% N (Bhabhar), 50% P and K, 1, vermicompost @ 2.5 tons ha-1, FYM @ 10 tons ha-1, Zn @ 10 kg ha-1, B @ 1 kg ha-1, BGA @ 10 kg ha-1, Pheromone traps: 10 Nos. ha-1 produced higher yields by 23% and 10% over FP in hills and Bhabhar, respectively. Similarly the wheat productivity was enhanced by 35% over FP due to INM package (full dose of N (hills)/ 50% everywhere in N (Bhabhar), 50% P and K, 1, VC* @ 2.5 tons ha-1, Zn @ 10 kg ha-1, B @ 1 kg ha-1, Azotobacter, FYM @ 10 ton ha-1).
Farmers in the area were also motivated to start cultivation of vegetable pea as it posses several advantages viz., improves soil health, off-season production, low production cost, and higher monetary returns. Intervened INM practice resulted in 30% higher green pod yield (166 q ha-1) over the conventional practices that were being followed in the surrounding area.
Organic nutrient management practices in wheat comprising vermicompost @ 5 tons ha-1, FYM @ 15 tons ha-1, Trichoderma, Azotobacter, Azospirillum, PSB, Pheromone traps: 10 Nos. ha-1 yielded 17% more over the conventional practices. Organic nutrient management practice comprising seed treatment with Rhizobium, PSB and Trichoderma; and an application of VC*@ 5 tons ha-1, FYM @ 15 tons ha-1 resulted in 13% higher pod yield (136 q ha-1) over the conventional practice.
The low-cost technology, for resource-poor farmers, comprising various biofertilizers and bioagents, ie, seed treatment with Azotobacter, Azospirillum, PSB and Trichoderma improved the grain yield by 15% (40.14 q ha-1) over the FP (34.88 q ha-1).
Besides the yield advantages, the intervened technologies also contributed to the water resource developments. Under tested technologies with same amount of irrigation water in case of farmers’ practice intervened technologies resulted in higher yield over farmers’ practice, thus improved the water productivity, i.e., yield produced per unit of water use/ applied. In rice, wheat and vegetable pea, the intervened technologies improved the water use efficiency (WUE). The WUE in wheat due to INM practice was 1.57 q ha-1-cm that was 35% higher than FP. Due to INM and organic nutrient management practices in vegetable pea, it was 16.6 and 13.6 q ha-1-cm, respectively, compared to only 12 q ha-1-cm in conventional practice.
InclusivenessThe initiative under FPARP is one the successful ventures to demonstrate inclusiveness in on-farm impact related initiatives. The different units (Research and Extension) of G.B. Pant University of Agriculture and Technology facilitated technical backstopping. The farmers who were willing to take the demonstrated technologies and continue its use in the future and their telephonic queries for technical backstopping ensured their faith and seriousness for adoption of the science-driven technologies.
Lesson learntThe practice of unscientific management of FYM, unawareness for quality vermicompost preparation observed in the area should be considered by farmers as a valuable resource for nutrient supply and improving the health of soil. Beside, the nutrient management as per the varying soil conditions in the hills, Bhabhar, and plains of Uttarakhand, and the quality seeds shall be pursued by various research and state functionaries for enhancement of the soil quality vis-à-vis productivity of the area. The observed benefits due to intervened technologies proved to be superior, either at par or higher yield levels while cutting use and cost of 50% of chemical fertilizers through effective utilization of the on-farm resources. The INM practices in wheat, rice, and vegetable pea benefitted the farmers monetarily with B:C ratio of 1.66, 3.87 and 6.00, respectively.

45
The way forwardThe integrated study involving more than 600 farmers who benefitted through the project by employing various intervened technologies on their farms suggests the need to take up such programmes intensively on the Integrated Watershed Management basis. The protection, production, and management of the organic sources of nutrients such as FYM, Vermicompost, biofertilizers, bioagents etc., will play an intensive role in managing the soil quality for sustained production as well as safe environment.
The on-farm evaluation of various intervened technologies depicts the need to reach the marginal farmers in the state to create an awareness regarding the soil health, management of organic recourses, use of quality seeds, and integrated nutrient management based on soil tests. This could be achieved by employing the integrated approach among various stakeholders. To harness the benefits of science-led technologies, particularly for the benefits of farmers and the society in general, effective efforts are required at every step along with the orientation of the policies.
Contributed by: Kiran P Raverkar
Figure F.9.1. Response of rice to INM practice at farmers’ field.
Research Report IDC-6ICRISAT Development Center
Soil Health Mapping and Direct BenefitTransfer of Fertilizer Subsidy
ICRISAT-India (Headquarters)Patancheru, Telangana, [email protected]
ICRISAT-India Liaison OfficeNew Delhi, India
ICRISAT-NigeriaKano, [email protected]
ICRISAT-MalawiLilongwe, [email protected], [email protected]
ICRISAT-NigerNiamey, [email protected]
ICRISAT-EthiopiaAddis Ababa, [email protected]
ICRISAT works in agricultural research for development across the drylands of Africa and Asia, making farming profitable for smallholder farmers while reducing malnutrition and environmental degradation.
We work across the entire value chain from developing new varieties to agri-business and linking farmers to markets.
ICRISAT appreciates the support of CGIAR investors to help overcome poverty, malnutrition and environmental degradation in the harshest dryland regions of the world. See http://www.icrisat.org/icrisat-donors.htm for full list of donors.
About ICRISAT: www.icrisat.org ICRISAT’s scientific information: EXPLOREit.icrisat.org
We believe all people have a right to nutritious food and a better livelihood.
ICRISAT-Mali (Regional hub WCA)Bamako, [email protected]
ICRISAT-ZimbabweBulawayo, [email protected]
ICRISAT-Kenya (Regional hub ESA)Nairobi, [email protected]
/ICRISAT /ICRISAT /ICRISATco/company/ ICRISAT
/PHOTOS/ ICRISATIMAGES /ICRISATSMCO
88-2016
PMO Strategy Document Series
DC ICRISATDEVELOPMENT CENTER